kinetics and thermodynamics of nitrate adsorption by biochar
TRANSCRIPT
EQA - International Journal of Environmental QualityISSN 2281-4485 - Vol. 41 (2021): 17-32Journal homepage: https://eqa.unibo.it/
The journal is hosted and mantained by ABIS-AlmaDL. Works are licensed under CC BY 4.0
published by
Kinetics and thermodynamics of nitrate adsorption by biochar
Nafiu Abdu1, Ado Adamu Yusuf1, Bello Mukhtar2, Rejoice Ibrahim Solomon3*
1 Department of Soil Science, Faculty of Agriculture, Ahmadu Bello University Zaria, Nigeria2 Department of Chemical Engineering, Faculty of Engineering, Ahmadu Bello University Zaria, Nigeria3 Department of Soil Science, School of Agriculture and Agricultural Technology Modibbo Adama University of Technology, Yola, Nigeria
Corresponding author e-mail: [email protected]
Article info
Received 5/2/2020; received in revised form 27/7/2020; accepted 24/8/2020.DOI: 10.6092/issn.2281-4485/10481© 2020 The Authors.
AbstractHigh concentration of nitrate in surface and ground water is a universal water pollution challenge for several years. Four biochar samples were produced and subjected to batch sorption experiment. Data obtained were fitted into the linear forms of four adsorption isotherm and kinetics models. Least square regression analysis was used to test the best fitting isotherm and kinetic model using the coefficient of determination (R2). Results revealed that only maize cob biochar (MCB) and poultry litter biochar (PLB) had the ability to adsorb nitrate with maximum quantities of adsorbed nitrate (73.915 and 133.887 mgg-1). Similarly, adsorption kinetics indicated better fitting of the adsorption data onto the linear form of the pseudo second order kinetics (PSOK) model. Lower R2 values recorded by the intra particle diffusion and Elovich adsorption kinetic models suggest that the adsorption process was physical and intra- particle diffusion was not the rate controlling step. Similarly, 99% change in nitrate adsorption was accounted by the combined influence of biochar electrical conductivity (EC), zero point of charge (ZPC) and pH. Hence, modification of biochar EC, ZPC and pH are necessary for using biochar to successfully remove nitrate from polluted environments.
Keywords adsorption isotherms, kinetics, biochar, nitrate, thermodynamics
Introduction
Excessive concentration of nutrients particularly phosphate and nitrate in aquatic environment can cause oxygen depletion in a process called eutrophication. Apart from this eutrophication hazards, Hartz and Bottoms (2009); Lehmann et al. (2003) reported high concentrations of nitrate to be an important source of soil acidity. It has also been a universal water pollution challenge for several decades and due to high stability and solubility of nitrate, it removal from water has been a serious problem (Tong et al., 2017). Though, several methods have been employed for the removal of contaminants from waste water which
include; chemical precipitation, ion exchange, solvent extraction, reverse osmosis, and adsorption (Adegoke et al., 2013). There are advantages and disadvantages of using these methods, for example, reverse osmosis as effective as it may be, seems expensive as membranes get easily spoiled and therefore needs frequent replacement while chemical precipitation is not very sensitive especially where the contaminants are in small amount. Solvent extraction or electrolytic processes can be economical only when working with more concentrated solutions. Ion exchange is expensive and requires skilled manpower for its operation. Therefore,

18
N. Abdu, A. A. Yusuf, B. Mukhtar, R.I. Solomon
DOI: 10.6092/issn.2281-4485/10481
EQA 41 (2021): 17-32
adsorption is a more preferred method for the removal of contaminants from waste water and soils because it is cheap, very effective with any concentration and simple (Tran et al., 1999). Other advantages of adsorption include; it’s effectiveness at very low concentrations, suitability for using batch and continuous processes, ease of operation, little sludge generation, as well as the possibility of regeneration and re-use (Mohanty et al., 2006). Qiu et al. (2009) suggested that when adsorption is concerned, thermodynamic and kinetic features should be considered to have more information about its performance and mechanisms. Apart from adsorption capacity, the kinetic performance of a given adsorbent is of profound importance for any preliminary application. Many materials have been used to trap contaminant of environmental concerns from soil and water, however, Kowanga et al. (2016) emphasized on the importance of using biochar for remediation exercise which is a biological, efficient and low cost adsorbents. Several researchers have reported the effectiveness of biochar in limiting the infiltration of harmful quantities of nutrients and pesticides into groundwater, soil erosion and runoff into surface waters thereby reducing nutrients pollution into water bodies (Borchard et al., 2019; Li et al., 2018; Kumar et al., 2016; Troy et al., 2014; Knowles et al., 2011). Some of the properties that contribute to its ability as a good adsorbent material are; its high specific surface area, condensed aromatic rings, micro-scale crystalline structure, macro-scale amorphous structure as well as its recalcitrant nature among others. Since adsorption kinetics has a controlling influence on anion mobility, transport and bioavailability, thus, evaluating the adsorption kinetics and thermodynamics of nitrate sorption of biochar is a prerequisite for limiting nitrate pollution of aquatic environments and remediation of contaminated water. Also is the need to determine the biochar properties that influence nitrate removal from contaminated media. This study was carried out to determine the adsorption kinetics and thermodynamics of nitrate adsorption of biochar samples produced from four different feed-stocks as well as the biochar properties that enhance the adsorption process.
Materials and Methods
Biochar used for this study were produced from four different wastes; two plant wastes (Maize cob and rice husk obtained from Institute for Agricultural Research (IAR, Zaria) Farms) and two animal wastes (cow dung
and poultry litter obtained from Poultry and livestock unit of Animal Science Department, Faculty of Agriculture, Ahmadu Bello University, Zaria). In each case, the materials were placed in an air tight stainless steel container before putting it into an oven. This process lasted for about two hours. The oven was heated to 600 °C (to obtain high surface area) at heating rate of 20°C per minute and kept at that temperature for 45 min. After each run, the oven was turned off and the biochar was left inside to cool to ambient temperature. This process was carried out in a 60 litre capacity oven at Industrial Development centre (IDC), Zaria. The biochar mass was ground and mixed thoroughly to obtain a powder consistency that would mix uniformly with the soil.Following the protocol described by Jindo et al. (2014), the biochars were characterized for pH, total ash content, total organic C, Nitrate, specific surface area, volatile matter, biochar yield, and morphology. The pH of the char was measured in 1: 10 char/water suspensions with a compound glass electrode. Total ash content was determined at 720 ℃ dry combustions in a muffle furnace for 3 hours and the mineral element content determined as described by Jindo et al. (2014). Similarly, the specific surface area was determined using the methylene blue method and the Langmuir surface area calculated as described by Itodo et al. (2010). While total carbon was determined by dry combustion method, the volatile matter was determined by measuring the weight loss that follows the combustion of about 1g of char in a crucible at 950 ℃. Similarly, the biochar yield was calculated as the proportion of the weight of the pyrolysis product to original materials. To determine the structure of the different biochar, their morphologies were studied through scanning electron microscopy (SEM) Pheno Prox model manufactured by Phenoworld Eindhoven, the Netherlands at the Chemical Engineering Department, ABU, Zaria.
Sorption and kinetic studiesThe different biochar samples were tested in a laboratory batch sorption experiment to determine their ability to adsorb nitrates. One 1g of biochar samples were equilibrated with three different concentrations; 10, 20 and 40 mgl-1 of NO3
-, in a 1:50 biochar to solution ratio using ammonium salts of nitrate. The flasks were shaken at a constant rate to allow the suspension to equilibrate. At various time intervals samples were filtered, after 5 minutes, 10 minutes, 30 minutes, 60 minutes, 120 minutes, 300 minutes and then after 24
19
N. Abdu, A. A. Yusuf, B. Mukhtar, R.I. Solomon
DOI: 10.6092/issn.2281-4485/10481
EQA 41 (2021): 17-32
hours, Filterate and nitrate in solution were determined using spectrophotometry by nitration of salicylic acid as described by Cataldo et al. (1975). The nitrate adsorbed by biochar was calculated based on the following relationship as proposed by Mulu (2013).
Q = Vi (Ci - Ce) [1]M
where Q = Quantity of adsorbed oxyanion, Vi = Volume of solution, Ci = Initial ion concentration, Ce = Equilibrium ion concentration; M = Mass of adsorbent (Biochar). The results obtained in the batch adsorption experiment were also fitted into the linear forms of the Langmuir, Freundlich, Temkin and Dubinin-Radushkevich (D-R) adsorption isotherms using least square fit method to determine which isotherm suites the adsorption process.
Thermodynamics studies
The sorption equilibrium was investigated through sorption isotherms produced at different temperatures, which will enable a thermodynamic analysis of nitrate sorption. These experiments were conducted by mixing (One) 1g of biochar samples with three different concentrations; 15, 30, 60 ppm NO3
-, in a 1:25 biochar to solution ratio using ammonium salts of nitrate The flasks were shaken for an hour at a constant rate to allow the suspension to equilibrate at pH 7.0. The solution pH was maintained at the desired value with NaOH and HCl solutions. The temperature was varied from 25 ℃ to 45 ℃ at 10 ℃ intervals using a water bath for 5 hours. The solution was filtered and kept for nitrate determination. The experimental data was then fitted into the Van’t Hoff equation to calculate the values of ΔH and ΔS. where,
ΔG° = -2.303 RT log Kd [2]where
Kd =Ce solid [3]Ce
where ΔG° = standard free energy, R = Universal gas constant, T = Absolute temperature in kelvin, Kd = equilibrium constant
where log Kd is given by:
log Kd =ΔS - ΔH [4]2.303 R 2.302 RT
and, ΔHo = standard enthalpy change, ΔSo = standard entropy change of adsorption. Plotting a graph of log Kd
against 1/τ produced a straight line with a slope of ΔHo/R and an intercept of ΔSo/R from where ΔHo and ΔSo can be calculated under the assumption that ΔHo and ΔSo are constant over a temperature range of the study (Gogoi et al., 2010).
Data AnalysisTo test which adsorption isotherm best fit the nitrate adsorption on the different biochar, data obtained were fitted into the linear forms of the adsorption isotherms and the coefficient of determination (r2) was used to test the goodness of fit of the models. Similarly, data were fitted into the linear forms of the kinetic equations to test the adsorption mechanisms while least square regression analysis was used to test the goodness of fit using the coefficient of determination (r2) and sum squares error (SSE) as described by Abdu (2006). Also, stepwise multiple regression analysis was carried out to determine the relationship between nitrate adsorption and some biochar properties.
Results and Discussion
Biochar propertiesResults of some biochar properties are presented in Table 1. High pH and EC recorded in MCB may be associated with the high ash and EC contents of the biochar. Yue et al. (2017) obtained a similar result and opined that ash content in biochar has a direct effect on its pH and EC values and attributed it to the increased pyrolysis temperature. Similarly, Mukherjee et al. (2011) opined that with increasing production temperature, EC and pH increased and linked it to the production of more ash content. Furthermore, they linked the high pH values to a progressive loss of acidic surface functional groups, mainly aliphatic carboxylic acids.Results revealed that Poultry litter biochar (PLB) recorded the highest bulk density value with 0.58 Mgm-3 while the lowest bulk density of 0.35 Mgm-3 was recorded in CDB (Table 1). This may be due to a few macro and micropores observed in the PLB biochar. This is in agreement with findings of Mary et al. (2016) who recorded different bulk density of biochar for different feedstocks and associated it to the intra and inter-particle voids of the biochar. Highest and lowest biochar yield of 33.8 % and 23.6 % were recorded in CDB and MCB biochar respectively (Table 1) may not be unconnected to the nature

20
N. Abdu, A. A. Yusuf, B. Mukhtar, R.I. Solomon
DOI: 10.6092/issn.2281-4485/10481
EQA 41 (2021): 17-32
of the feedstocks. Also, relatively low biochar yield was recorded across the biochar samples and may be attributed to the high pyrolysis temperature. Similar results were reported by Fang et al. (2014); Jindo et al. (2014); Lawrinenko and Laird (2015). They opined that biochar yield tends to decrease with increasing pyrolysis temperature and the type of feedstock and linked it to loss of labile elements from the biochar. Mean pHZPC obtained using the two electrolytes are presented (Table 1). Data obtained reveals that highest pHZPC of 8.0 was recorded in both NaCl and KCl by MCB while lowest pHZPC of 6.8 and 6.7 in KCl and NaCl respectively were recorded in CDB. However,
results revealed that all the biochars used for this study have their pHZPC lower than their pH in both water and CaCl2 solutions (Table 1). This Highest ZPC of 8.0 recorded in both NaCl and KCl by MCB may be linked to the alkaline nature of the original feedstock. Similarly, lower ZPC than the biochar solution pH was recorded in all the samples which suggest that the biochars have net negative charges on their surfaces. Fiol and Villaescusa (2009) reported that at solution pH higher than pHZPC, there is an excess of negatively charged ions while at pH lower than pH ZPC, solid surfaces have net positive charges.
Table 1. Biochar characterization
Parameters Maize cob MCB
Rice husk (RHB)
Cow dung (CDB)
Poultry litter (PLB)
pH (1:10 Biochar: H2O) 10.3 7.90 7.60 7.80pH (1:10 Biochar:0.01M CaCl2) 9.50 7.20 7.10 7.50EC (dS m-1) 3.50 2.70 2.60 3.10Bulk density (Mg m-3) 0.41 0.41 0.35 0.58Moisture content (%) 1.90 1.32 1.67 1.66Biochar yield (%) 23.6 30.1 33.8 31.4pHZPC (NaCl) 8.00 6.90 6.70 6.90pHZPC (KCl) 8.00 6.90 6.80 6.90Total ash (g kg-1) 690 490 589 480Total C (g kg-1) 292 395 300 400Volatile matter (%) 0.66 0.65 1.45 1.36Nitrate (mg kg-1) 16.55 7.98 8.21 6.19specific surface area (cm2 g-1)(Langmuir) 2.74 x 10³ 3.11 x 10³ 2.96 x 10³ 2.90 x 10³
The highest total ash content of 690 g kg-1 was recorded in MCB followed by CDB with 589 g kg-1. Lowest total ash content of 480 g kg-1 was recorded in PLB biochar. This may be associated with the nutrient content in the original feedstock. Crombie and Masek (2014) reported great differences in ash content of biochar produced from different feed-stocks and linked it to the nature of the original feedstock. However, highest total carbon content of 400 g kg-1 was recorded in PLB followed closely by RHB biochar with 395 g kg-1. While the lowest total carbon content of 292 g kg-1 was recorded in MCB biochar and may be due to the low volatile matter observed in the biochar samples. This contradicts the findings of Domingues et al. (2017) who reported that biochars produced from plant biomass gave maximum C contents and
linked it to greater polymerization, which results in an increased condensation of carbon structure of the biochar. However, the result of this study may be due to a significant amount of wood shavings in the poultry litter used for this study. Similar total carbon content for RHB biochar was reported by Jindo et al. (2014). They observed varying carbon content in biochar of different feedstock and linked the wide variations to a composition of the original materials. However, Ma et al. (2016) observed a significant negative correlation between total carbon contents of some biochars with the volatile matter.Highest percentage volatile matter of 1.45% was recorded in CDB while the lowest volatile matter of 0.645% was recorded in RHB (Table 1). Generally, low percentage volatile matter was recorded in all the

21
N. Abdu, A. A. Yusuf, B. Mukhtar, R.I. Solomon
DOI: 10.6092/issn.2281-4485/10481
EQA 41 (2021): 17-32
biochar samples and may be attributed to the high pyrolysis temperature during biochar production. Jindo et al. (2014) reported decreasing percentage volatile matter with increasing pyrolysis temperature and linked it to escape of labile elements during production at high temperature.Results of the nitrate content of the biochar are presented in Table 1. Data obtained revealed that highest nitrate content of 16.55 mg kg-1 was recorded in MCB while lowest nitrate content of 6.19 mg kg-1 was recorded in PLB. This may be associated with the high ash content of the biochar. It may also be linked to the low volatile matter of the biochar sample. Gunamantha and Widana (2018) linked the high N content in CBD to its low volatile matter. Similarly, Domingues et al. (2017) linked the high ash contents in biochar to large quantity of inorganic compounds. Also, Enders et al. (2012) reported varying amounts of N in biochar and linked to the elemental content of the materials. However, highest phosphate value of 23.80 mg kg-1 was recorded in PLB followed by 18.83 mg kg-1 by CDB while the lowest phosphates value of 6.26 mg kg-1 was recorded in RHB. Rice husk biochar recorded the highest sulphate concentration of 20.22 mg kg-1
while the lowest sulphate of 4.14 mg kg-1 was recorded in MCB. This may not be unconnected to the higher sulphate concentration recorded in the biochar sample.Result of the Langmuir surface area revealed that RHB recorded the largest surface area with 3.11 x 103 cm2g-1 followed by CDB with 2.96 x 103 cm2g-1, while lowest surface area of 2.74 x 103 cm2g-1 was recorded in MCB (Table 1). This may be attributed to the higher ash content recorded in the biochar at such high temperature. This agrees with the findings of Jindo et al. (2014) who observed reduced surface area of some biochar with increasing ash content in the biochar and opined that the high ash content occupied and obstructed the access to micropores, causing the surface area to reduce. The high surface area recorded in RHB is in line with the findings of Jindo et al. (2014) who reported consistently high surface area in rice husk biochar with increasing pyrolysis temperature of up to 800 °C. Similarly, Lei and Zhang (2013); Liu and Zhang (2009) reported increased porosity and surface area when rice husk biochar was applied to soils and attributed it to the large surface area of the added biochar.The scanning electron microscopic image (SEM) of MCB, CDB, RHB, and PLB are presented in Figure 1.
The image revealed that MCB has many medium-sized pores and rough surface with irregularly distributed gaps. Similarly, CDB appeared to be stacked and arranged on each other with few macropores present. With respect to
(a) (b)
(c) (d)
Figure 1. SEM Image for: (a) Cow dung (CDB), (b) Maize cob (MCB), (c) Poultry litter (PLB), (d) Rice husk (RHB) Biochar
RHB, SEM image revealed very large pores while a more compact image with no visible large pores was observed in PLB (Figure 1). The large pores observed in RHB biochar may be due to its high surface area and is an

22
N. Abdu, A. A. Yusuf, B. Mukhtar, R.I. Solomon
DOI: 10.6092/issn.2281-4485/10481
EQA 41 (2021): 17-32
indication of high porosity. This has been evident by the lower bulk density recorded in the biochar compared to the rest. Jindo et al. (2014) obtained similar results and demonstrated that RHB is highly porous and has a large surface area which increases with pyrolysis temperature. However, the absence of visible large pore observed in PLB biochar may be due to degeneration of the pore spaces at high pyrolysis temperature as a result of the nature of the material. This is a plausible explanation for the high bulk density of the biochar. The numerous cracks observed in MCB, CDB and RHB biochars may be linked to the nature of their original materials as well as their resistance to degeneration at the production temperature. Ma et al. (2016); Zheng et al. (2013) correlated cracks generated on the SEM image of some biochars to increased surface area as a result of high temperature.
Adsorption isotherms for describing NO3- adsorption
on to RHB, MCB, CDB, and PLB The Langmuir adsorption isotherm constants for nitrate adsorption on to RHB, MCB, CDB and PLB are presented on Table 2. Data obtained for adsorption of nitrate on to these biochars revealed highest adsorption rate (KL) of 69.15 Lmg-1 recorded in RHB while least KL value of -23338.1 Lmg-1 was recorded in PLB. Coefficient of determination (R2) of 0.823 and 0.997 were recorded for RHB and PLB respectively. Similarly, minimum and maximum quantity of nitrate adsorbed (qm) of -17.298 mgg-1 and 133.889 mgg-1 were recorded by RHB and PLB respectively. The Langmuir equilibrium parameter (RL) for all the three initial concentrations of nitrate in all the biochar samples were very close to zero while that of PLB is equal to zero (Table 2). Generally, high Langmuir isotherm R2 values were recorded in all biochar samples for adsorption of NO3
- onto RHB, MCB, CDB, and PLB. However, the highest R2 value was recorded in PLB. This implies that adsorption occurred on a homogenous surface by monolayer and may be associated with anion exchange. Dada et al. (2012); Kumar et al. (2010) opined that Langmuir adsorption isotherm describes monolayer adsorption onto a surface containing a limited number of equal sites. It assumes constant energy of adsorption onto the surface and no drifting of adsorbate in the adsorption plane. Similarly, Zhao et al. (2017) reported the applicability of Langmuir isotherm for the adsorption of sulfonic acid onto corn straw and poplar leaf biochar and linked it to anion exchange rather than the surface area of the biochar samples. The value of the separation
factor RL revealed that there was favourable adsorption of NO3
- onto RHB, MCB, and CDB. However, RL of 0 recorded in PLB biochar suggests irreversible adsorption probably an inner sphere complexation. Kowanga et al. (2016); Mehdi et al. (2013) reported that RL provides key indicators about the nature of adsorption. They opined that if RL is between 0 and 1, then favourable adsorption, RL>1 represents un-favourable adsorption, RL = 0, means irreversible and RL = 1, linear adsorption. High adsorption rate (KL) recorded in RHB revealed weak adsorption energy while negative KL recorded in PLB biochar is an indication of strong adsorption energy. With respect to adsorption of phosphate on to RHB, MCB, CDB, and PLB, R2 values of 0.647 and 0.999 were recorded for MCB and PLB respectively. Lowest qm of -2.496 mg g-1 was recorded in RHB while the highest qm of 4.87 mg g-1 was recorded in MCB with KL values of 110.99 and -150.15 Lmg-1 for RHB and MCB respectively.Results of Freundlich adsorption isotherm constants for NO3
- adsorption on to RHB, MCB, CDB, and PLB are presented in Table 2. Based on nitrate adsorption on to RHB, MCB, CDB, and PLB, R2 value ranged from 0.348 for RHB to 0.999 recorded in MCB. Similarly, highest Freundlich adsorption capacity (Kf) of 545.25 was recorded in MCB while lowest Kf of 3.66 X 10⁻⁷
was recorded in CDB. Highest and lowest adsorption intensity (n) values of 0.704 and 0.155 were recorded in RHB and CDB respectively. While MCB recorded an n value of 0.562. Highest R2 value was recorded in MCB biochar implying that the adsorption of NO3
-
on to MCB biochar is on heterogeneous surface with multilayer adsorption and may be attributed irregular pore spaces and high ZPC of MCB biochar as the adsorption was carried out at a solution pH (pH 7.0 ± 0.2) lower than the ZPC. Adegoke et al. (2013) reported that positive or negative surface sites are developed on the surface of solids in aqueous suspensions and ZPC determines the chemical ion that will be an attraction on to the surface of the sorbate. Also, Do (1998) report that the Freundlich isotherm is commonly used to describe adsorption of organics from aqueous streams onto activated carbon. He opined that it is an equation which is used to describe adsorption of metallic ions on the heterogeneous surface with the multilayer adsorption and assumes that the quantity of dissolved solvent increases substantially with increasing concentration. Thajeel (2013) observed multilayer adsorption for the adsorption of Fe3+, Cu2+, and Pb2+ ions onto rice husk activated carbon. Adsorption intensity (n) value of less
23
N. Abdu, A. A. Yusuf, B. Mukhtar, R.I. Solomon
DOI: 10.6092/issn.2281-4485/10481
EQA 41 (2021): 17-32
than unity suggests favourable adsorption which further explains the high adsorption capacity (Kf) recorded in MCB. Kumar et al. ( 2010) ; Mulu (2013) reported that the nature of adsorption depends on n. they opined that if n value =1; the adsorption is linear, n < 1; adsorption is a chemical process, n > 1 adsorption is a physical process.Results of Temkin adsorption isotherm constants for NO3
- on to RHB, MCB, CDB, and PLB are presented in Table 2. With respect nitrate adsorption, Temkin constant values relating to the heat of sorption (BT) of -93.18 and 468.14 J mol-1 were recorded for RHB
and CDB respectively. Highest Temkin adsorption potentials ( ) of 0.56 Lg-1 was recorded in RHB while lowest value of 8.31 X 10⁻⁵ Lg-1 was recorded in PLB. Coefficient of determination (R2) values of 0.79 and 0.99 were recorded for CDB and MCB respectively. High R2 values of the Temkin isotherm recorded on NO3
- adsorption onto all biochar samples except by CDB biochar where < 0.80 R2 was recorded revealed the applicability of the model for nitrate adsorption. This indicates decreased heat of adsorption with increasing surface coverage and the adsorption energies are uniform.
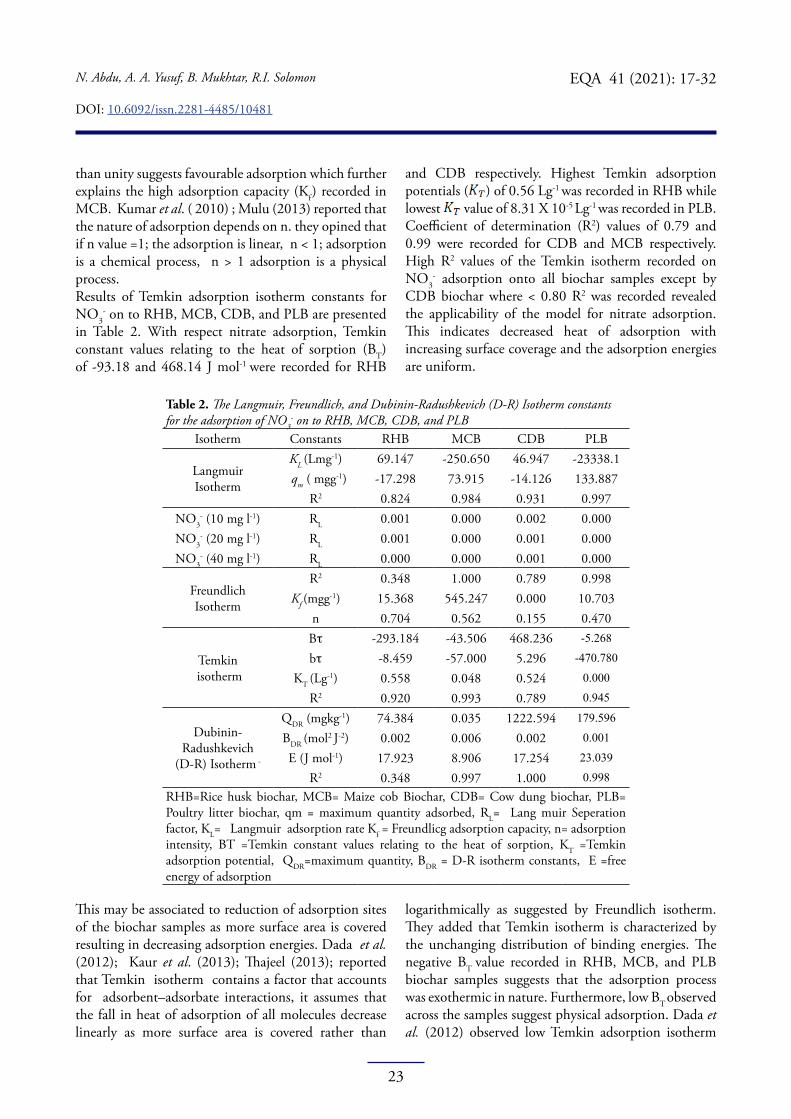
Table 2. The Langmuir, Freundlich, and Dubinin-Radushkevich (D-R) Isotherm constants for the adsorption of NO3
- on to RHB, MCB, CDB, and PLBIsotherm Constants RHB MCB CDB PLB
Langmuir Isotherm
KL (Lmg-1) 69.147 -250.650 46.947 -23338.1 qm ( mgg-1) -17.298 73.915 -14.126 133.887
R2 0.824 0.984 0.931 0.997NO3
- (10 mg l-1) RL 0.001 0.000 0.002 0.000NO3
- (20 mg l-1) RL 0.001 0.000 0.001 0.000NO3
- (40 mg l-1) RL 0.000 0.000 0.001 0.000
Freundlich Isotherm
R2 0.348 1.000 0.789 0.998Kf (mgg-1) 15.368 545.247 0.000 10.703
n 0.704 0.562 0.155 0.470
Temkin isotherm
Bτ -293.184 -43.506 468.236 -5.268
bτ -8.459 -57.000 5.296 -470.780
KT (Lg-1) 0.558 0.048 0.524 0.000
R2 0.920 0.993 0.789 0.945
Dubinin-Radushkevich
(D-R) Isotherm -
QDR (mgkg-1) 74.384 0.035 1222.594 179.596
BDR (mol2 J-2) 0.002 0.006 0.002 0.001
E (J mol-1) 17.923 8.906 17.254 23.039
R2 0.348 0.997 1.000 0.998RHB=Rice husk biochar, MCB= Maize cob Biochar, CDB= Cow dung biochar, PLB= Poultry litter biochar, qm = maximum quantity adsorbed, RL= Lang muir Seperation factor, KL= Langmuir adsorption rate Kf = Freundlicg adsorption capacity, n= adsorption intensity, BT =Temkin constant values relating to the heat of sorption, KT =Temkin adsorption potential, QDR=maximum quantity, BDR = D-R isotherm constants, E =free energy of adsorption
This may be associated to reduction of adsorption sites of the biochar samples as more surface area is covered resulting in decreasing adsorption energies. Dada et al. (2012); Kaur et al. (2013); Thajeel (2013); reported that Temkin isotherm contains a factor that accounts for adsorbent–adsorbate interactions, it assumes that the fall in heat of adsorption of all molecules decrease linearly as more surface area is covered rather than
logarithmically as suggested by Freundlich isotherm. They added that Temkin isotherm is characterized by the unchanging distribution of binding energies. The negative BT value recorded in RHB, MCB, and PLB biochar samples suggests that the adsorption process was exothermic in nature. Furthermore, low BT observed across the samples suggest physical adsorption. Dada et al. (2012) observed low Temkin adsorption isotherm
24
N. Abdu, A. A. Yusuf, B. Mukhtar, R.I. Solomon
DOI: 10.6092/issn.2281-4485/10481
EQA 41 (2021): 17-32
constant (BT) and linked it to physical adsorption.The Dubinin-Radushkevich (D-R) isotherm constants for the adsorption of NO3
- on to RHB, MCB, CDB, and PLB are presented in Table 2. Data on nitrate adsorption on to RHB, MCB, CDB, and PLB revealed that, maximum quantity (QDR) of NO3
- was adsorbed by CDB with 122.2.59 mgkg-1 while the lowest QDR of 0.034 mg kg-1 was recorded in MCB. Generally, low D-R isotherm constants (BDR) were recorded for all the biochar samples (Table 2). However, lowest free energy of adsorption (E) of 8.91 J mol-1 was recorded for MCB while 23.03 J mol-1 was recorded in PLB. Similarly, high R2 values of greater than 0.99 were observed in all biochar samples except RHB which recorded an R2 value of 0.348. High R2 with respect to nitrate adsorption onto MCB, CDB and PLB indicates the applicability of the isotherm in describing the adsorption data. The applicability of this model may be as a result of many micropores observed on the SEM image of the biochar samples. Dubinin (1969) reported that D-R adsorption model is related to the porous structure of the sorbent. Similarly, Ayawei et al. (2017); Dada et al. (2012) reported that The D-R adsorption isotherm assumes a multilayer behaviour relating to Van Der Waal’s forces which is related to physical adsorption and it effectively explains the adsorption of gases and vapours on microporous materials. However, it can be applied to distinguish between physical and chemical adsorption of ions (Ayawei et al., 2017). Israel and Eduok (2012) ; Vijayaraghavan et al. (2006) opined that D-R adsorption isotherm is a semi-empirical model where adsorption follows a pore filling process. Mean free energy of adsorption (E) of less than 8 kJ mol-1 obtained suggests physical adsorption to be the dominant mechanism. Helfferich (1962) reported free energy of adsorption of (E) 0-8 kJ mol-1 for physical adsorption, 8-16 kJmol-1 for ion exchange and >16 kJ mol-1 for chemical adsorption.Comparing the R2 values of all the four isotherms used for NO3
- adsorption onto the RHB, Temkin isotherm was observed to give the best fit. However, highest R2
value recorded in the Freundlich isotherm revealed that it is the best fitting model for NO3
- adsorption onto MCB. This indicates that adsorption of nitrate onto MCB is dominated by multilayer adsorption and may be due to the net positive charge of the MCB biochar at the solution pH (7.0 ± 0.2) for which adsorption was carried out. The D-R model recorded the Highest R2 for
the adsorption of NO3- onto CDB biochar. This implies
that it is the model that best describes NO3- adsorption
onto CDB and may be as a result of many micropores observed on the SEM image of CDB r as well as the adsorption being carried out at ZPC (6.8) of CDB. Similarly, Freundlich and Dubunin-Radushkevich models provide the best fit for NO3
- adsorption onto PLB. This may be due to the fact that the adsorption solution pH was the same as the biochar ZPC (6.9) at which the adsorption was carried out as well as the large surface area of the material. Hence, making NO3
- to be attached on to the pores of the biochar.
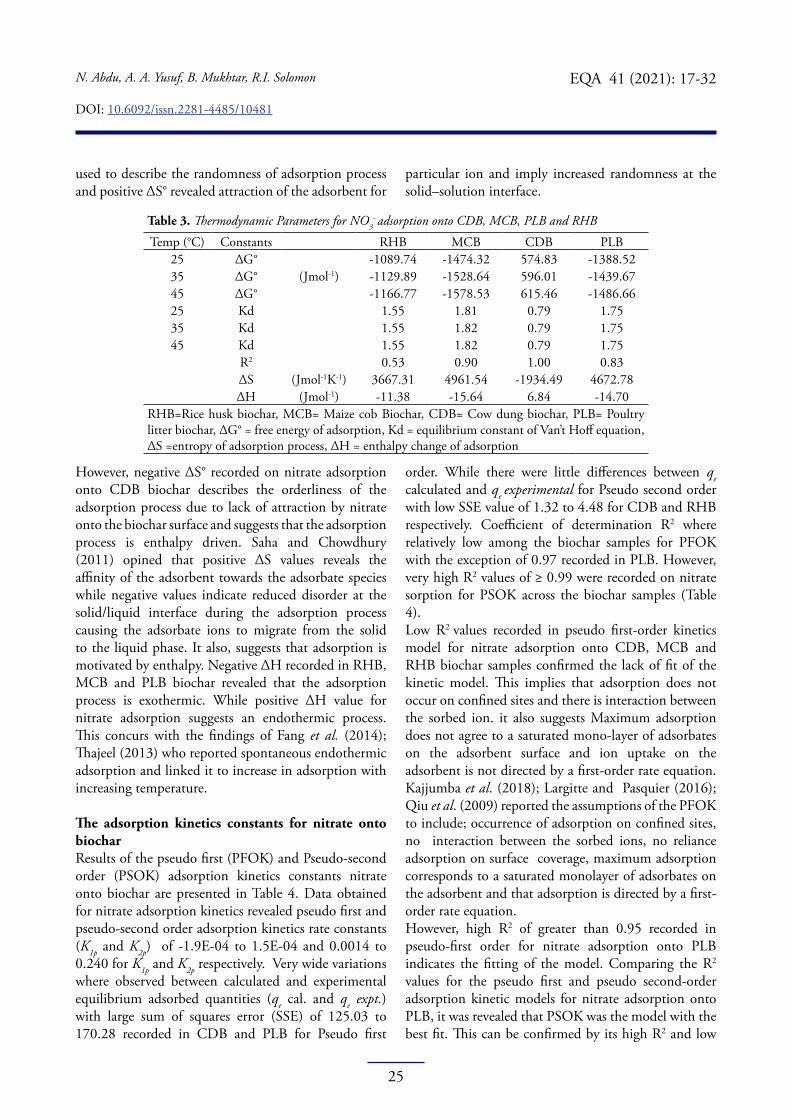
Thermodynamic parameters for NO3- adsorption on
to CDB, MCB, PLB and RHB Results of some thermodynamic parameters of NO3
- on to CDB, MCB, PLB and RHB are presented in Table 3. Results of thermodynamic parameters on NO3
- adsorption revealed high negative free energy (ΔG°) of adsorption across all the biochar samples with the exception CDB which recorded positive values across all the adsorption temperatures (Table 3). Highest and lowest equilibrium constant (Kd) of Van’t Hoff equation of 1.8 and 0.79 were recorded in MCB and CDB respectively across all the temperatures (Table 3).While the R2 values of 0.53 and 0.998 were recorded in RHB and CDB respectively. With respect to entropy (ΔS) of adsorption process, high positive values were observed across the biochar samples with the exception CDB which recorded a value of -1934.9 Jmol-1K-1. Reverse was the case with respect to enthalpy change (ΔH) of adsorption (Table 3). Negative ΔH values of -11.382, -14.599 and -15.644 Jmol-1 were recorded in RHB, PLB and MCB respectively while 6.84 Jmol-1
was recorded in CDB suggesting that nitrate adsorption onto this biochar was enthalpy driven. The high negative Δ G° values for nitrate adsorption onto RHB, MCB and PLB biochar samples across all temperatures under the study confirms the spontaneity and feasibility of nitrate adsorption onto the biochar samples. However, positive ΔG° recorded in CDB at all temperature suggests a non-spontaneous process. Also, a decrease in ΔG° value with increasing temperature implies that the feasibility of adsorption improves at higher temperature. Inyinbor et al. (2016) obtained a negative ΔG° value for rhodamine B dye adsorption and linked it to the spontaneity of the process. Similarly, Kaya et al. (2017) reported decrease in ΔG° with increasing temperature and linked it to improved feasibility of adsorption as temperature increases. Kaur et al. (2013) ; Thajeel (2013) reported that ΔS° is
25
N. Abdu, A. A. Yusuf, B. Mukhtar, R.I. Solomon
DOI: 10.6092/issn.2281-4485/10481
EQA 41 (2021): 17-32
used to describe the randomness of adsorption process and positive ΔS° revealed attraction of the adsorbent for
However, negative ΔS° recorded on nitrate adsorption onto CDB biochar describes the orderliness of the adsorption process due to lack of attraction by nitrate onto the biochar surface and suggests that the adsorption process is enthalpy driven. Saha and Chowdhury (2011) opined that positive ΔS values reveals the affinity of the adsorbent towards the adsorbate species while negative values indicate reduced disorder at the solid/liquid interface during the adsorption process causing the adsorbate ions to migrate from the solid to the liquid phase. It also, suggests that adsorption is motivated by enthalpy. Negative ΔH recorded in RHB, MCB and PLB biochar revealed that the adsorption process is exothermic. While positive ΔH value for nitrate adsorption suggests an endothermic process. This concurs with the findings of Fang et al. (2014); Thajeel (2013) who reported spontaneous endothermic adsorption and linked it to increase in adsorption with increasing temperature.
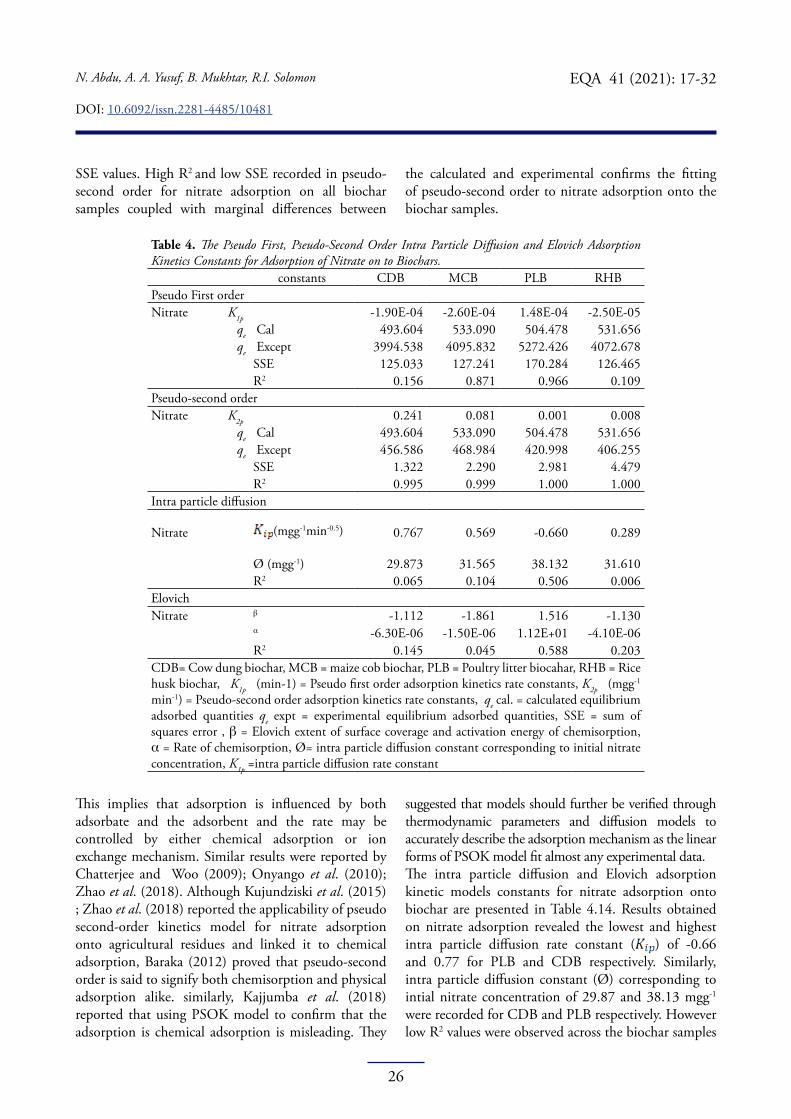
The adsorption kinetics constants for nitrate onto biocharResults of the pseudo first (PFOK) and Pseudo-second order (PSOK) adsorption kinetics constants nitrate onto biochar are presented in Table 4. Data obtained for nitrate adsorption kinetics revealed pseudo first and pseudo-second order adsorption kinetics rate constants (K1p and K2p) of -1.9E-04 to 1.5E-04 and 0.0014 to 0.240 for K1p and K2p respectively. Very wide variations where observed between calculated and experimental equilibrium adsorbed quantities (qe cal. and qe expt.) with large sum of squares error (SSE) of 125.03 to 170.28 recorded in CDB and PLB for Pseudo first
order. While there were little differences between qe calculated and qe experimental for Pseudo second order with low SSE value of 1.32 to 4.48 for CDB and RHB respectively. Coefficient of determination R2 where relatively low among the biochar samples for PFOK with the exception of 0.97 recorded in PLB. However, very high R2 values of ≥ 0.99 were recorded on nitrate sorption for PSOK across the biochar samples (Table 4). Low R2 values recorded in pseudo first-order kinetics model for nitrate adsorption onto CDB, MCB and RHB biochar samples confirmed the lack of fit of the kinetic model. This implies that adsorption does not occur on confined sites and there is interaction between the sorbed ion. it also suggests Maximum adsorption does not agree to a saturated mono-layer of adsorbates on the adsorbent surface and ion uptake on the adsorbent is not directed by a first-order rate equation. Kajjumba et al. (2018); Largitte and Pasquier (2016); Qiu et al. (2009) reported the assumptions of the PFOK to include; occurrence of adsorption on confined sites, no interaction between the sorbed ions, no reliance adsorption on surface coverage, maximum adsorption corresponds to a saturated monolayer of adsorbates on the adsorbent and that adsorption is directed by a first-order rate equation.However, high R2 of greater than 0.95 recorded in pseudo-first order for nitrate adsorption onto PLB indicates the fitting of the model. Comparing the R2 values for the pseudo first and pseudo second-order adsorption kinetic models for nitrate adsorption onto PLB, it was revealed that PSOK was the model with the best fit. This can be confirmed by its high R2 and low
particular ion and imply increased randomness at the solid–solution interface.
Table 3. Thermodynamic Parameters for NO3- adsorption onto CDB, MCB, PLB and RHB
Temp (°C) Constants RHB MCB CDB PLB25 ΔG°
(Jmol-1)-1089.74 -1474.32 574.83 -1388.52
35 ΔG° -1129.89 -1528.64 596.01 -1439.6745 ΔG° -1166.77 -1578.53 615.46 -1486.6625 Kd 1.55 1.81 0.79 1.7535 Kd 1.55 1.82 0.79 1.7545 Kd 1.55 1.82 0.79 1.75
R2 0.53 0.90 1.00 0.83ΔS (Jmol-1K-1) 3667.31 4961.54 -1934.49 4672.78ΔH (Jmol-1) -11.38 -15.64 6.84 -14.70
RHB=Rice husk biochar, MCB= Maize cob Biochar, CDB= Cow dung biochar, PLB= Poultry litter biochar, ΔG° = free energy of adsorption, Kd = equilibrium constant of Van’t Hoff equation, ΔS =entropy of adsorption process, ΔH = enthalpy change of adsorption
26
N. Abdu, A. A. Yusuf, B. Mukhtar, R.I. Solomon
DOI: 10.6092/issn.2281-4485/10481
EQA 41 (2021): 17-32
SSE values. High R2 and low SSE recorded in pseudo-second order for nitrate adsorption on all biochar samples coupled with marginal differences between
This implies that adsorption is influenced by both adsorbate and the adsorbent and the rate may be controlled by either chemical adsorption or ion exchange mechanism. Similar results were reported by Chatterjee and Woo (2009); Onyango et al. (2010); Zhao et al. (2018). Although Kujundziski et al. (2015) ; Zhao et al. (2018) reported the applicability of pseudo second-order kinetics model for nitrate adsorption onto agricultural residues and linked it to chemical adsorption, Baraka (2012) proved that pseudo-second order is said to signify both chemisorption and physical adsorption alike. similarly, Kajjumba et al. (2018) reported that using PSOK model to confirm that the adsorption is chemical adsorption is misleading. They
suggested that models should further be verified through thermodynamic parameters and diffusion models to accurately describe the adsorption mechanism as the linear forms of PSOK model fit almost any experimental data. The intra particle diffusion and Elovich adsorption kinetic models constants for nitrate adsorption onto biochar are presented in Table 4.14. Results obtained on nitrate adsorption revealed the lowest and highest intra particle diffusion rate constant ( ) of -0.66 and 0.77 for PLB and CDB respectively. Similarly, intra particle diffusion constant (Ø) corresponding to intial nitrate concentration of 29.87 and 38.13 mgg-1
were recorded for CDB and PLB respectively. However low R2 values were observed across the biochar samples
the calculated and experimental confirms the fitting of pseudo-second order to nitrate adsorption onto the biochar samples.
Table 4. The Pseudo First, Pseudo-Second Order Intra Particle Diffusion and Elovich Adsorption Kinetics Constants for Adsorption of Nitrate on to Biochars.
constants CDB MCB PLB RHBPseudo First orderNitrate K1p -1.90E-04 -2.60E-04 1.48E-04 -2.50E-05
qe Cal 493.604 533.090 504.478 531.656qe Except 3994.538 4095.832 5272.426 4072.678
SSE 125.033 127.241 170.284 126.465R2 0.156 0.871 0.966 0.109
Pseudo-second orderNitrate K2p 0.241 0.081 0.001 0.008
qe Cal 493.604 533.090 504.478 531.656qe Except 456.586 468.984 420.998 406.255
SSE 1.322 2.290 2.981 4.479R2 0.995 0.999 1.000 1.000
Intra particle diffusion
Nitrate (mgg-1min-0.5) 0.767 0.569 -0.660 0.289
Ø (mgg-1) 29.873 31.565 38.132 31.610R2 0.065 0.104 0.506 0.006
Elovich Nitrate β -1.112 -1.861 1.516 -1.130
α -6.30E-06 -1.50E-06 1.12E+01 -4.10E-06R2 0.145 0.045 0.588 0.203
CDB= Cow dung biochar, MCB = maize cob biochar, PLB = Poultry litter biocahar, RHB = Rice husk biochar, K1p (min-1) = Pseudo first order adsorption kinetics rate constants, K2p (mgg-1 min-1) = Pseudo-second order adsorption kinetics rate constants, qe cal. = calculated equilibrium adsorbed quantities qe expt = experimental equilibrium adsorbed quantities, SSE = sum of squares error , β = Elovich extent of surface coverage and activation energy of chemisorption, α = Rate of chemisorption, Ø= intra particle diffusion constant corresponding to initial nitrate concentration, K1p =intra particle diffusion rate constant
27
N. Abdu, A. A. Yusuf, B. Mukhtar, R.I. Solomon
DOI: 10.6092/issn.2281-4485/10481
EQA 41 (2021): 17-32
except for PLB where 0.51 was observed and revealed a lack of fit of the model for describing nitrate adsorption onto biochar.Table 4 also shows the Elovich adsorption kinetics models constants for nitrate onto biochar. Data obtained on nitrate adsorption revealed lowest and highest Elovich extent of surface coverage and the activation energy of chemisorption (β) of -1.86 and 1.52 for MCB and PLB respectively. Rate of chemisorption (α) revealed very low negative values across the biochar with the exception PLB which recorded 11.18 with an R2 value of 0.59 suggesting the absence of chemical bonding in the adsorption process. Generally, low R2
values is an indication of poor fitting of the model for nitrate adsorption onto biochar. Similarly, results on phosphate adsorption revealed highest and lowest β values of 0.73 and -1.42 for RHB and PLB respectively. Similarly, low negative α value across the biochar with the exception RHB which recorded 52.80. Highest and lowest R2 values of 0.68 and 0.15 were recorded in PLB and CDB respectively. Also, negative β and α were observed across biochar samples on sulphate adsorption. However, RHB recorded 4.84 and 0.23 as β and α respectively. Relatively high R2 values were observed across the biochar samples with the highest and lowest R2 value of 0.75 and 0.47 recorded in CDB and PLB respectively. Although relatively high R2 values were observed for sulphate adsorption, very high R2 values coupled with the close agreement between the calculated and experimental qe as well as the low SSE value of the PSOK revealed that it is the best fitting model for Nitrate, phosphate and sulphate adsorption onto all the biochar samples. This indicates chemisorption or mass diffusion to be the dominant adsorption mechanism. A similar result was reported by Adegoke et al. ( 2017). Comparing the four kinetics models under this study, higher R2 values coupled with the close agreement between the calculated and experimental qe as well as the low SSE value of the PSOK revealed that it is the best fitting model for nitrate, adsorption onto all the biochar samples. This indicates that the rate of adsorption of solute is proportional to the unoccupied sites on the adsorbent and ion uptake on the sorbent is directed by a second-order rate equation. Although, Adegoke et al. ( 2017); Aderinlewo et al. (2019); Chatterjee and Woo (2009); Huo et al. (2012); Onyango et al. (2010); Zhang et al. (2015); Zhao et al. (2018) linked the applicability of the PSOK to chemisorption mechanism supporting the presence of multiple adsorption sites. However, Baraka (2012) ascertain that fitting pseudo-second order
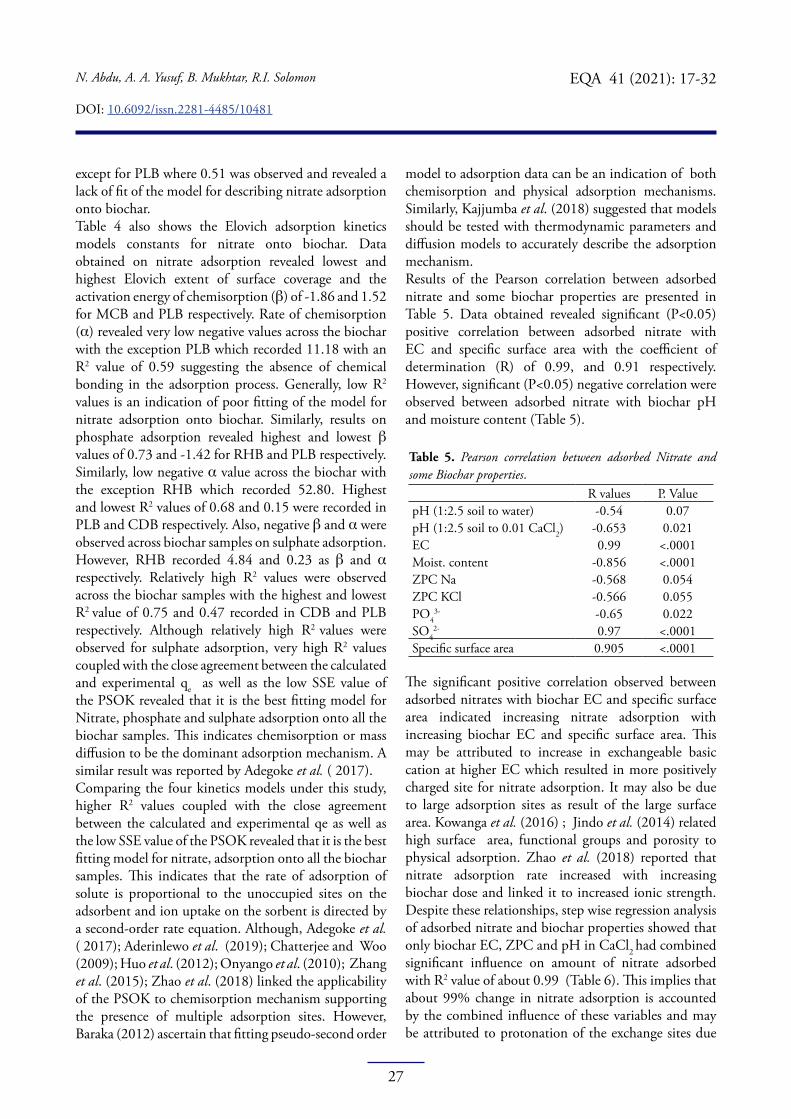
model to adsorption data can be an indication of both chemisorption and physical adsorption mechanisms. Similarly, Kajjumba et al. (2018) suggested that models should be tested with thermodynamic parameters and diffusion models to accurately describe the adsorption mechanism.Results of the Pearson correlation between adsorbed nitrate and some biochar properties are presented in Table 5. Data obtained revealed significant (P<0.05) positive correlation between adsorbed nitrate with EC and specific surface area with the coefficient of determination (R) of 0.99, and 0.91 respectively. However, significant (P<0.05) negative correlation were observed between adsorbed nitrate with biochar pH and moisture content (Table 5).
Table 5. Pearson correlation between adsorbed Nitrate and some Biochar properties.
R values P. ValuepH (1:2.5 soil to water) -0.54 0.07pH (1:2.5 soil to 0.01 CaCl2) -0.653 0.021EC 0.99 <.0001Moist. content -0.856 <.0001ZPC Na -0.568 0.054ZPC KCl -0.566 0.055PO4
3- -0.65 0.022SO4
2- 0.97 <.0001Specific surface area 0.905 <.0001
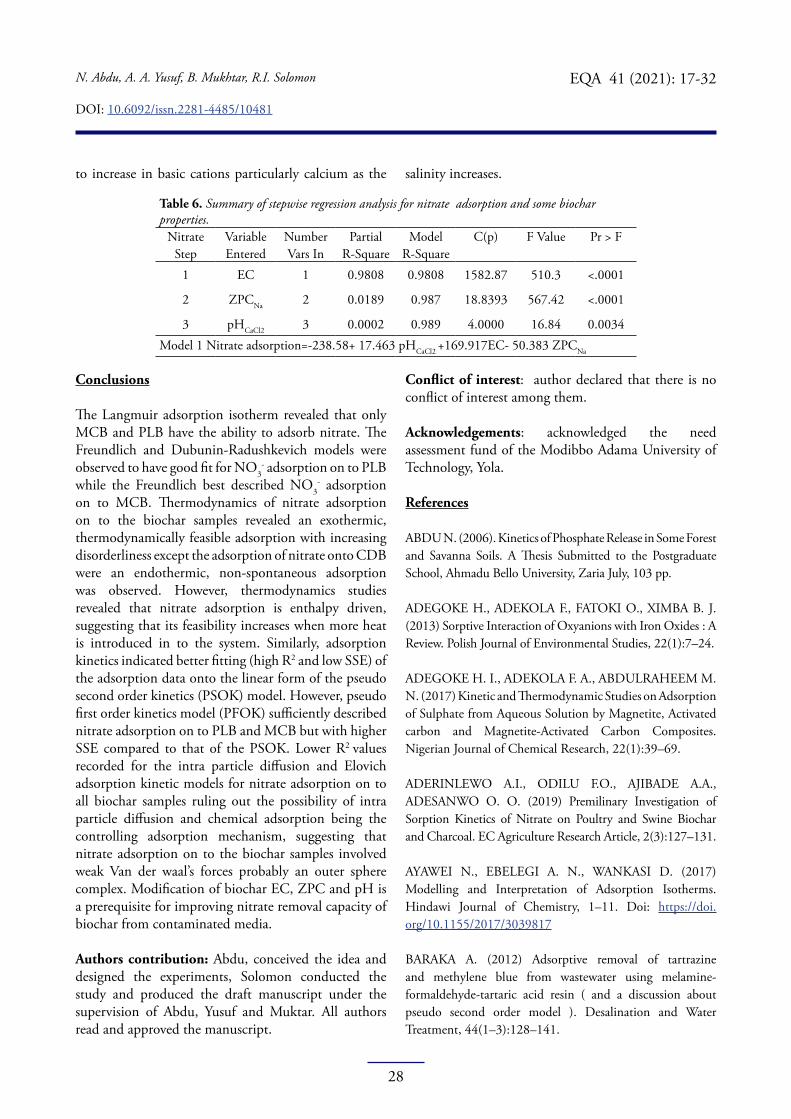
The significant positive correlation observed between adsorbed nitrates with biochar EC and specific surface area indicated increasing nitrate adsorption with increasing biochar EC and specific surface area. This may be attributed to increase in exchangeable basic cation at higher EC which resulted in more positively charged site for nitrate adsorption. It may also be due to large adsorption sites as result of the large surface area. Kowanga et al. (2016) ; Jindo et al. (2014) related high surface area, functional groups and porosity to physical adsorption. Zhao et al. (2018) reported that nitrate adsorption rate increased with increasing biochar dose and linked it to increased ionic strength. Despite these relationships, step wise regression analysis of adsorbed nitrate and biochar properties showed that only biochar EC, ZPC and pH in CaCl2 had combined significant influence on amount of nitrate adsorbed with R2 value of about 0.99 (Table 6). This implies that about 99% change in nitrate adsorption is accounted by the combined influence of these variables and may be attributed to protonation of the exchange sites due
28
N. Abdu, A. A. Yusuf, B. Mukhtar, R.I. Solomon
DOI: 10.6092/issn.2281-4485/10481
EQA 41 (2021): 17-32
to increase in basic cations particularly calcium as the salinity increases.
Table 6. Summary of stepwise regression analysis for nitrate adsorption and some biochar properties.
Nitrate Variable Number Partial Model C(p) F Value Pr > FStep Entered Vars In R-Square R-Square
1 EC 1 0.9808 0.9808 1582.87 510.3 <.0001
2 ZPCNa 2 0.0189 0.987 18.8393 567.42 <.0001
3 pHCaCl2 3 0.0002 0.989 4.0000 16.84 0.0034Model 1 Nitrate adsorption=-238.58+ 17.463 pHCaCl2 +169.917EC- 50.383 ZPCNa
Conclusions
The Langmuir adsorption isotherm revealed that only MCB and PLB have the ability to adsorb nitrate. The Freundlich and Dubunin-Radushkevich models were observed to have good fit for NO3
- adsorption on to PLB while the Freundlich best described NO3
- adsorption on to MCB. Thermodynamics of nitrate adsorption on to the biochar samples revealed an exothermic, thermodynamically feasible adsorption with increasing disorderliness except the adsorption of nitrate onto CDB were an endothermic, non-spontaneous adsorption was observed. However, thermodynamics studies revealed that nitrate adsorption is enthalpy driven, suggesting that its feasibility increases when more heat is introduced in to the system. Similarly, adsorption kinetics indicated better fitting (high R2 and low SSE) of the adsorption data onto the linear form of the pseudo second order kinetics (PSOK) model. However, pseudo first order kinetics model (PFOK) sufficiently described nitrate adsorption on to PLB and MCB but with higher SSE compared to that of the PSOK. Lower R2 values recorded for the intra particle diffusion and Elovich adsorption kinetic models for nitrate adsorption on to all biochar samples ruling out the possibility of intra particle diffusion and chemical adsorption being the controlling adsorption mechanism, suggesting that nitrate adsorption on to the biochar samples involved weak Van der waal’s forces probably an outer sphere complex. Modification of biochar EC, ZPC and pH is a prerequisite for improving nitrate removal capacity of biochar from contaminated media.
Authors contribution: Abdu, conceived the idea and designed the experiments, Solomon conducted the study and produced the draft manuscript under the supervision of Abdu, Yusuf and Muktar. All authors read and approved the manuscript.
Conflict of interest: author declared that there is no conflict of interest among them.
Acknowledgements: acknowledged the need assessment fund of the Modibbo Adama University of Technology, Yola.
References
ABDU N. (2006). Kinetics of Phosphate Release in Some Forest and Savanna Soils. A Thesis Submitted to the Postgraduate School, Ahmadu Bello University, Zaria July, 103 pp.
ADEGOKE H., ADEKOLA F., FATOKI O., XIMBA B. J. (2013) Sorptive Interaction of Oxyanions with Iron Oxides : A Review. Polish Journal of Environmental Studies, 22(1):7–24.
ADEGOKE H. I., ADEKOLA F. A., ABDULRAHEEM M. N. (2017) Kinetic and Thermodynamic Studies on Adsorption of Sulphate from Aqueous Solution by Magnetite, Activated carbon and Magnetite-Activated Carbon Composites. Nigerian Journal of Chemical Research, 22(1):39–69.
ADERINLEWO A.I., ODILU F.O., AJIBADE A.A., ADESANWO O. O. (2019) Premilinary Investigation of Sorption Kinetics of Nitrate on Poultry and Swine Biochar and Charcoal. EC Agriculture Research Article, 2(3):127–131.
AYAWEI N., EBELEGI A. N., WANKASI D. (2017) Modelling and Interpretation of Adsorption Isotherms. Hindawi Journal of Chemistry, 1–11. Doi: https://doi.org/10.1155/2017/3039817
BARAKA A. (2012) Adsorptive removal of tartrazine and methylene blue from wastewater using melamine-formaldehyde-tartaric acid resin ( and a discussion about pseudo second order model ). Desalination and Water Treatment, 44(1–3):128–141.
29
N. Abdu, A. A. Yusuf, B. Mukhtar, R.I. Solomon
DOI: 10.6092/issn.2281-4485/10481
EQA 41 (2021): 17-32
BORCHARD N., SCHIRRMANN M., KAMMANN C., WRAGE-MÖNNIG N., ESTAVILLO J. M., NOVAK J. (2019) Biochar, soil and land-use interactions that reduce nitrate leaching and N 2 O emissions : A meta-analysis. Science of the Total Environment, 651:2354–2364. Doi: https://doi.org/10.1016/j.scitotenv.2018.10.060
CATALDO D.A., HAROON M., SCHRADER L.E., YOUNGS V.L. (1975) Rapid Colorimetric Determination of Nitrate in Plant-Tissue by Nitration of Salicylic-Acid. Communications in Soil Science and Plant Analysis, 6(1):71–80. Doi: https://doi.org/10.1080/00103627509366547
CHATTERJEE S., WOO S. H. (2009) The removal of nitrate from aqueous solutions by chitosan hydrogel beads, 164:1012–1018. Doi: https://doi.org/10.1016/j.jhazmat.2008.09.001
CROMBIE K., MASEK O. (2014) Pyrolysis biochar systems, balance between bioenergy and carbon sequestration. Global Change Biology Bioenergy, Doi: https://doi.org/10.1111/gcbb.12137
DADA A.O., OLALEKAN A.P., OLATUNYA A.M., DADA O. (2012) Langmuir , Freundlich , Temkin and Dubinin – Radushkevich Isotherms Studies of Equilibrium Sorption of Zn 2 + Unto Phosphoric Acid Modified Rice Husk. IOSR Journal of Applied Chemistry (IOSR-JAC), 3(1):38–45. Doi: https://doi.org/10.9790/5736-0313845
DO D.D. (1998) Adsorption Analysis: Equilibria and Kinetics. Imperial College Press. London. 918pp.
DOMINGUES R.R., TRUGILHO P. F., SILVA C.A., DE MELO I. C. N. A., MELO L. C. A., MAGRIOTIS Z.M., SÁNCHEZ-MONEDERO M.A. (2017) Properties of biochar derived from wood and high-nutrient biomasses with the aim of agronomic and environmental benefits. PLoS ONE, 12(5):1–19. Doi: https://doi.org/10.1371/journal.pone.0176884
DUBININ M.M. (1969) the Potential Theory of Adsorption of Gases and Vapors Vapors for Adsorbents with Energetically Non uniform Surfaces. In Theory of Adsorption of Gases and Vapors (pp. 235–241). Doi: https://doi.org/10.1021/cr60204a006
ENDERS A., HANLEY K., WHITMAN T., JOSEPH S., LEHMANN J. (2012) Characterization of biochars to evaluate recalcitrance and agronomic performance.
Bioresource Technology, 114:644–653. Doi: https://doi.org/10.1016/j.biortech.2012.03.022
EYKELBOSH A. J., JOHNSON M. S., COUTO E.G. (2015) Biochar decreases dissolved organic carbon but not nitrate leaching in relation to vinasse application in a Brazilian sugarcane soil. Journal of Environmental Management, 149: 9–16. Doi: https://doi.org/10.1016/j.jenvman.2014.09.033
FANG C., ZHANG T., LI P., JIANG R., WANG Y. (2014) Application of Magnesium Modified Corn Biochar for Phosphorus Removal and Recovery from Swine Wastewater. International Journal of Environmental Research. Public Health, 11:9217–9237. Doi: https://doi.org/10.3390/ijerph110909217
FIOL N., VILLAESCUSA I. (2008) Determination of sorbent point zero charge: Usefulness in sorption studies. Environmental Chemistry Letters, 7(1):79–84. Doi: https://doi.org/10.1007/s10311-008-0139-0
GOGOI P., DUTTA N.N., RAO P.G. (2010) Adsorption of Catechin from aqueous solution of polymeris resin and and activated carbon. Indian Journal of Chemical Technology, 337–345.
GUNAMANTHA I.M., WIDANA G.A.B. (2018) Characterization The Potential Of Biochar From Cow And Pig Manure For Geoecology Application. International Conference on Green Agro-Industry and Bioeconomy. IOP Publishing Series : Earth and Enviroment, 131(1):1–7. Doi: https://doi.org/10.1088/1755-1315/131/1/012055
HARTZ T.K., BOTTOMS T. G. (2009). Nitrogen requirements of drip irrigated tomatoes. Nitrogen Requirements of Drip Irrigated Tomatoes, 44:1988–1993.HELFFERICH F. G. (1962) Ion Exchange. New York: Mc- Graw-Hill, 624 pp.
HUO L., YANG Q., SHANG H. (2012) Kinetics and Thermodynamic Study of nitrate Adsorption on Granular Ferric Hydroxide. Fresenius Environmental Bulletin, 21(3):789–796.
INYINBOR A.A., ADEKOLA F.A., OLATUNJI G. A. (2016) Kinetics , isotherms and thermodynamic modeling of liquid phase adsorption of Rhodamine B dye onto Raphia hookerie fruit epicarp. Water Resources and Industry, 15:14–27. Doi: https://doi.org/10.1016/j.wri.2016.06.001

30
N. Abdu, A. A. Yusuf, B. Mukhtar, R.I. Solomon
DOI: 10.6092/issn.2281-4485/10481
EQA 41 (2021): 17-32
ISRAEL U., EDUOK U.M. (2012) Biosorption of zinc from aqueous solution using coconut (Cocos nucifera L) coir dust. Scholars Research Library Archives of Applied Science Research, 4(2), 809–819. Doi: https://doi.org/10.1001/archinte.1986.00360230069012
ITODO A. U., ITODO H.U., GAFAR M.K. (2010) Estimation of Specific Surface Area using Langmuir Isotherm Method. Journal of Applied Science and Environmental Management, 14(4):141–145.
JINDO K., MIZUMOTO H., SAWADA Y., SANCHEZ-MONEDERO M. A., SONOKI T. (2014) Physical and chemical characterization of biochars derived from different agricultural residues. Biogeosciences, 11(23):6613–6621. Doi: https://doi.org/10.5194/bg-11-6613-2014
KAJJUMBA G. W., EMIK S., ÖNGEN A., ÖZCAN H. K., AYDIN S. (2018) Modelling of Adsorption Kinetic Processes—Errors, Theory and Application. In Advanced Sorption Process Applications (pp. 1–19).
KAUR R., SINGH J., KHARE R., CAMEOTRA S. S., ALI A. (2013) Batch sorption dynamics, kinetics and equilibrium studies of Cr(VI), Ni(II) and Cu(II) from aqueous phase using agricultural residues. Applied Water Science, 3(1):207–218. Doi: https://doi.org/10.1007/s13201-012-0073-y
KAYA N., YILDIZ Z., CEYLAN S. (2017) Preparation and characterisation of biochar from hazelnut shell and its adsorption properties for methylene blue dye Fındık kabuğundan biyokömür hazırlanması ve karakterizasyonu ve metilen mavisi boya için adsorpsiyon özellikleri Preparation and Character. Journal of Polytechnic, 0900, 13 pp. Doi: https://doi.org/10.2339/politeknik.386963
KNOWLES O. A., ROBINSON B. H., CONTANGELO A., CLUCAS L. (2011) Biochar for the mitigation of nitrate leaching from soil amended with biosolids. Science of the Total Environment, 409(17):3206–3210. Doi: https://doi.org/10.1016/j.scitotenv.2011.05.011
KOWANGA K.D., GATEBE E., MAUTI G. O., MAUTI E. M. (2016) Kinetic , sorption isotherms , pseudo-first-order model and pseudo-second-order model studies of Cu ( II ) and Pb ( II ) using defatted Moringa oleifera seed powder. The Journal of Phytopharmacology, 5(2):71–78.
KUJUNDZISKI A. P., MARKOVSKA L., MESHKO V. (2015) Scientific paper Adsorption kinetic models of heavy
metal ions on granular activated carbon, 56, 179–190. Doi: https://doi.org/ 10.5937/ZasMat1502179P
KUMAR P.S., RAMALINGAM S., SENTHAMARAI C., NIRANJANAA M., VIJAYALAKSHMI P., SIVANESAN S. (2010) Adsorption of dye from aqueous solution by cashew nut shell: Studies on equilibrium isotherm, kinetics and thermodynamics of interactions. Desalination, 261(1–2):52–60. Doi: https://doi.org/10.1016/j.desal.2010.05.032
KUMAR A., KUMAR N., LENKA S., TEDIA K. (2016) Soil and Tillage Research Biochar impact on nitrate leaching as influenced by native soil organic carbon in an Inceptisol of central India. Soil and Tillage Research, 157(3), 65–72. Doi: https://doi.org/10.1016/j.still.2015.11.009
LARGITTE L., PASQUIER R. (2016) Chemical Engineering Research and Design A review of the kinetics adsorption models and their application to the adsorption of lead by an activated carbon. Chemical Engineering Research and Design, 109, 495–504. Doi: https://doi.org/10.1016/j.cherd.2016.02.006
LAWRINENKO M., LAIRD D.A. (2015) Anion exchange capacity of biochar. Green Chemistry, 17:4628–4636. Doi: https://doi.org/10.1039/C5GC00828J
LEHMANN J., PEREIRA J., STEINER C., NEHLS T., ZECH W., D GLASER, B. (2003) Nutrient availability and leaching in an archaeological Anthrosol and a Ferralsol of the Central Amazon basin : Fertilizer , manure and charcoal amendments Nutrient availability and leaching in an archaeological Anthrosol and a Ferralsol of the Central Am. Plant and Soil, 249:343–357. Doi: https://doi.org/10.1023/A
LI S., ZHANG Y., YAN W., SHANGGUAN Z. (2018) Soil and Tillage Research E ff ect of biochar application method on nitrogen leaching and hydraulic conductivity in a silty clay soil. Soil and Tillage Research, 183:100–108. Doi: https://doi.org/10.1016/j.still.2018.06.006
MA X., ZHOU, B., BUDAI, A., JENG, A., HAO, X., WEI D. (2016) Study of Biochar Properties by Scanning Electron Microscope – Energy Dispersive X-Ray Spectroscopy (SEM-EDX). Communications in Soil Science and Plant Analysis, 3624. Doi: https://doi.org/10.1080/00103624.2016.1146742
MARY G. S., NIVEDITHA P. S. S., MARY G. S. (2016) Production , characterization and evaluation of biochar from pod (Pisum sativum), leaf (Brassica oleracea) and peel

31
N. Abdu, A. A. Yusuf, B. Mukhtar, R.I. Solomon
DOI: 10.6092/issn.2281-4485/10481
EQA 41 (2021): 17-32
(Citrus sinensis) wastes. International Journal of Recycling of Organic Waste in Agriculture, 5(1):43–53. Doi: https://doi.org/10.1007/s40093-016-0116-8
MEHDI V., MANSOORABAD A.O., MOHAMMADI M., ROSTAMI N. (2013) Investigation of Langmuir , Freundlich and Temkin Adsorption Isotherm of Tramadol by Multi-Wall Carbon Nanotube. Asian Journal of Chemistry, 25(10):5467–5469.
MOHANTY K., DAS D., BISWAS M.N. (2006) Preparation and characterization of activated carbon from Steculia alata nut-shell by chemical activation with zinc chloride to remove phenol from waste water. Adsorption, 12:119-125.
MUKHERJEE A., ZIMMERMAN A. R., HARRIS W. (2011) Surface chemistry variations among a series of laboratory-produced biochars. Geoderma, 163(3–4):47–255. Doi: https://doi.org/10.1016/j.geoderma.2011.04.021
MULU, B. D. (2013). Batch Sorption Experiments : Langmuir and Freundlich Isotherm Studies for the Adsorption of Textile Metal Ions onto Teff Straw ( Eragrostis tef ) Agricultural Waste. Journal of Thermodynamics, 6 pp.
ONYANGO, M. S., MASUKUME, M., OCHIENG, A., AND OTIENO, F. (2010). Functionalised natural zeolite and its potential for treating drinking water containing excess amount of nitrate. Water SA, 36(5), 655–662.
QIU H., LV L., PAN, B, ZHANG Q., ZHANG W., ZHANG, Q. (2009) Critical review in adsorption kinetic models. Journal of Zhejiang University SCIENCE A, 10(5):716–724. Doi: https://doi.org/10.1631/jzus.A0820524
SAHA P., CHOWDHURY S. (2011) Insight Into Adsorption Thermodynamics. In Thermodynamics (pp. 349–364). Prof. Mizutani Tadashi (Ed.), ISBN: 978-953-307-544-0, InTech, Available from: http://www.intechopen.com/books/thermodynamics/insight-into-adsorption-thermodynamics InTech. Doi: https://doi.org/10.5772/13474
THAJEEL A.S. (2013) Isotherm, Kinetic and Thermodynamic of Adsorption of Heavy Metal Ions onto Local Activated Carbon. Aquatic Science and Technology, 1(2), 53–77. Doi: https://doi.org/10.5296/ast.v1i2.3763
TONG X., YANG Z., XU P., LI Y., NIU X. (2017) Nitrate adsorption from aqueous solutions by calcined ternary Mg-Al-Fe hydrotalcite. Water Science and Technology, 1–11.
Doi: https://doi.org/10.2166/wst.2017.082
TRAN H.H., RODDICK F.A., O’DONNELL J.A. (1999) Comparison of chromatography and dessicant silica gels for the adsorption of metal ions- I. Adsorption and kinetics. Water Research, 33, 2985–2992.
TROY S. M.LAWLO, P.G., FLYNN C.J.O., HEALY M.G. (2014) The Impact of Biochar Addition on Nutrient Leaching and Soil Properties from Tillage Soil Amended with Pig Manure. Water Air Soil Pollution, 225(1900). Doi: https://doi.org/10.1007/s11270-014-1900-6
VIJAYARAGHAVAN K., PADMESH T. V. N., PALANIVELU K., VELAN M. (2006) Biosorption of nickel(II) ions onto Sargassum wightii: Application of two-parameter and three-parameter isotherm models. Journal of Hazardous Materials, 133(1–3):304–308. Doi: https://doi.org/10.1016/j.jhazmat.2005.10.016
YUE Y., LIN Q., XU Y., LI G., ZHAO X. (2017) Slow pyrolysis as a measure for rapidly treating cow manure and the biochar characteristics. Journal of Analytical and Applied Pyrolysis. Doi: https://doi.org/10.1016/j.jaap.2017.01.008
ZHANG L., LOÁICIGA H. A., XU M., DU C., DU Y. (2015) Kinetics and mechanisms of phosphorus adsorption in soils from diverse ecological zones in the source area of a drinking-water reservoir. International Journal of Environmental Research and Public Health, 12(11):14312–14326. Doi: https://doi.org/10.3390/ijerph121114312
ZHAO H., XUE Y., LONG L., HU X. (2018) Adsorption of nitrate onto biochar derived from agricultural residuals. Water Science and Technology, 77(2):548–554. Doi: https://doi.org/10.2166/wst.2017.568
ZHAO N., YANG X., ZHANG J., ZHU L., LU Y. (2017) Adsorption mechanisms of dodecylbenzene sulfonic acid by corn straw and poplar leaf biochars. Materials, 10(1119):15. Doi: https://doi.org/10.3390/ma10101119
ZHENG H., WANG Z., DENG X., ZHAO J., LUO Y., NOVAK J., XING B. (2013) Characteristics and nutrient values of biochars produced from giant reed at different temperatures. Bioresource Technology, 130:463–471. Doi: https://doi.org/10.1016/j.biortech.2012.12.044
32
N. Abdu, A. A. Yusuf, B. Mukhtar, R.I. Solomon
DOI: 10.6092/issn.2281-4485/10481
EQA 41 (2021): 17-32
Cinétique et thermodynamique de l’adsorption de nitrate par biocharResumé
La concentration élevée de nitrate dans les eaux de surface et souterraines est un problème universel de pollution de l’eau pour plusieurs. Quatre échantillons de biochar ont été produits et soumis à une expérience de sorption discontinue. Les données obtenues ont été ajustées dans les formes linéaires de quatre modèles d’isotherme et de cinétique d’adsorption. Une analyse de régression par moindres carrés a été utilisée pour tester le meilleur modèle d’isotherme et cinétique d’ajustement en utilisant le coefficient de détermination (R2). Les résultats ont révélé que seuls le biochar en épi de maïs (MCB) et le biochar de litière de volaille (PLB) avaient la capacité d’adsorber le nitrate avec des quantités maximales de nitrate adsorbé (73.915 et 133.887 mgg-1). De même, la cinétique d’adsorption a indiqué un meilleur ajustement des données d’adsorption sur la forme linéaire du modèle de pseudo-cinétique du second ordre (PSOK). Des valeurs de R2 inférieures enregistrées par la diffusion intra-particules et les modèles cinétiques d’adsorption Elovich suggèrent que le processus d’adsorption était physique et que la diffusion intra-particules n’était pas l’étape de contrôle de la vitesse. De même, une variation de 99% de l’adsorption des nitrates a été expliquée par l’influence combinée de la conductivité électrique du biochar (EC), du point de charge zéro (ZPC) et du pH. Par conséquent, la modification de l’EC, du ZPC et du pH du biochar est nécessaire pour utiliser le biochar pour éliminer avec succès le nitrate des environnements pollués.
Mots-clés: isothermes d’adsorption, cinétique, biochar, nitrate, thermodynamique
Cinetica e termodinamica dell’adsorbimento dei nitrati da parte di biocharRiassunto
L’elevata concentrazione di nitrati nelle acque superficiali e sotterranee rappresenta una sfida universale per l’inquinamento idrico per molti. Sono stati prodotti quattro campioni di biochar e sottoposti a esperimento di assorbimento batch. I dati ottenuti sono stati inseriti nelle forme lineari di quattro modelli di isoterma e cinetica di adsorbimento. L’analisi di regressione del minimo quadrato è stata utilizzata per testare l’isoterma e il modello cinetico più adatti utilizzando il coefficiente di determinazione (R2). I risultati hanno rivelato che solo biochar di pannocchia di mais (MCB) e lettiera di pollame biochar (PLB) avevano la capacità di adsorbire il nitrato con quantità massime di nitrato adsorbito (73.915 e 133.887 mgg-1). Analogamente, la cinetica di adsorbimento ha indicato un migliore adattamento dei dati di adsorbimento sulla forma lineare del modello di cinetica di pseudo secondo ordine (PSOK). Valori R2 inferiori registrati dalla diffusione intra-particella e dai modelli cinetici di adsorbimento di Elovich suggeriscono che il processo di adsorbimento era fisico e la diffusione intra-particella non era la fase di controllo della velocità. Allo stesso modo, la variazione del 99% nell’adsorbimento dei nitrati è stata spiegata dall’influenza combinata di conducibilità elettrica (EC) biochar, punto di carica zero (ZPC) e pH. Pertanto, la modifica di biochar EC, ZPC e pH sono necessari per utilizzare biochar per rimuovere con successo il nitrato dagli ambienti inquinati.
Parole chiave: isoterme di adsorbimento, cinetica, biochar, nitrati, termodinamica