kinetics of oxygen consumption after a single … of oxygen consumption after a single isometric...
TRANSCRIPT

Kinetics of Oxygen Consumption after a Single Isometric Tetanus of Frog Sartorius Muscle at 20~
M I C H A E L M A H L E R
From the Department of Physiology, School of Medicine, University of California at Los Angeles, Los Angeles, California 90024. Dr. Mahler's present address is the Department of Pharmacology, School of Medicine, University of Southern California, Los Angeles, Califor- nia 90033.
n B S T R A C T The time-course of the rate of oxygen consumption ((202) has been measured in the excised frog sartorius muscle after single isometric tetani of 0.1- 1.0 s at 20~ To measure A(2o2(t), the change in (202 from its basal level, a novel method was devised, based on the validity in this tissue of the one-dimensional diffusion equation fi)r oxygen, established in the preceding paper. After a tetanus, A(2o2 reached a peak within 45-90 s, then declined exponentially, and could be well fit by AQo2(t) = O.0 + 0a(e -#lt - e-k2t), r2 (= l/k2), which characterized the rise of ~Qo2, was a decreasing function of tetanus duration (range: from 1.1 -+ 0.28 min [n = 5] for a 0.l-s tetanus, to 0.34 + 0.05 min[n = 8] for a 1.0-sec tetanus).rT (= 1/ kl), which characterized the decline of ~ o 2 , was not dependent on tetanus duration, with mean 3.68 -+ 0.24 min (n = 46). A fi)rthcoming paper in this series shows that these kinetics of ~ o 2 are the responses to impulse-like changes in the rate of ATP hydrolysis. The variation ofT2 with tetanus duration thus indicates the involvement of a nonlinear process in the coupling of 02 consumption to ATP hydrolysis. However, the monoexponential decline of ~o~(t) , with time constant independent of tetanus duration, suggests that during this phase, the coupling is rate-limited by a single reaction with apparent first order kinetics.
I N T R O D U C T I O N
T w o f u n d a m e n t a l tenets o f musc le energet ics a re tha t the f ree e n e r g y fo r cell func t ion a n d m a i n t e n a n c e is en t i re ly p r o v i d e d by the hydrolys is o f adenos ine t r i p h o s p h a t e (ATP) , a nd tha t the p r i m a r y source o f A T P is the ox ida t ion o f substrates by mo lecu l a r o x y g e n . A c o u p l i n g be tween the hydrolys is o f A T P and its resynthes is via oxidat ive me tabo l i sm thus a p p e a r s essential fo r n o r m a l muscle func t ion , a n d the e luc ida t ion o f the m e c h a n i s m s by which this occurs is a cent ra l p r o b l e m in the s tudy o f metabol ic con t ro l in muscle (Chance et al., 1962; J6bsis , 1964; J a c o b u s a n d L e h n i n g e r , 1973; O w e n and Wilson, 1974; Saks et al., 1974, 1976). T h e s e e f for t s a re h a n d i c a p p e d , however , by the absence o f a genera l quant i ta t ive desc r ip t ion o f the d y n a m i c s o f this c o u p l i n g as it exists in an intact muscle .
F r o m the po in t o f view o f systems analysis, it is na tu ra l to cons ide r the events which l ink o x y g e n c o n s u m p t i o n to A T P hydrolys is as a system, fo r which the
J. G~N. PHYSIOL. �9 The Rockefeller University Press �9 0022-1295/78/0501-055951.00 559
560 THE JOURNAL OF GENERAL P H Y S I O L O G Y ' V O L U M E 71- 1978
input is the rate o f A T P hydrolysis, and the ou tpu t is the rate o f oxygen consumpt ion (Qo2), bo th considered as functions o f time. From measurements of the kinetics o f (2o2 elicited by impulse changes in the rate o f A T P hydrolysis, it is possible to decide whether the system is linear, and if it is, to formulate a single system equation, valid at all times, which relates the (2o2 to the rate o f A T P hydrolysis (Milsum, 1966; Riggs, 1970). In the experiments described in this paper , it was intended that stimulation o f the excised sartorius muscle o f Rana pipiens for 0.1-1.0 s at 20~ would produce a t ime-course o f change in its rate o f A T P hydrolysis which, on the time scale o f oxidative recovery metabo- lism, would satisfactorily approximate an impulse. Dur ing the stimulation, the nmscle pe r fo rmed a maximal isometric contraction. The experiments were designed to quantify the t ime-course o f change in (2o2 f rom its basal level (AQo2) after the tetanus, and it was thus intended that these kinetics would represent an impulse response o f the system.
The kinetics o f recovery oxygen consumpt ion in an isolated muscle at 20~ do not appear to have been previously repor ted . The method used here to measure A(2o2(t) takes advantage o f the fact that (202 and intramuscular Poz in the excised f rog sartorius are linked by the one-dimensional diffusion equation for oxygen (Eq. 1 below; Gore and Whalen, 1968; Mahler, 1978b). The time-course o f Po2 at a closed surface o f a muscle was measured before, dur ing, and after an isometric tetanus; in terms of Eq. 1, this was P(0, t). Given P(0, t), techniques o f systems theory were used to solve the diffusion equation for AQo~(t).
M A T E R I A L S A N D M E T H O D S
Measurement of Po2 at the Muscle Surface
The technique used to measure the time-course of Po2 at a closed muscle surface during and after an isometric contraction was identical to that described in the preceding paper (Mahler, 1978b). For the present experiments, a pair of stimulating electrodes and a strain gauge were incorporated into the muscle chamber. The stimulating electrodes were situated on the chamber floor, and lay perpendicular to long axis of a muscle, between the pelvic bone and the oxygen electrode. The strain gauge was attached to a clamp which held the pelvic bone. The experimental protocol before the stimulation of a muscle was essentially the same as that for the method I experiments described previously. A drained muscle was mounted in the chamber at its in vivo length, with the oxygen electrode recessed, and the chamber was then immersed in the water bath. The chamber gas composition was usually 75.2% 02, 3.0% CO2, and 21.8% N2, but in a few experiments was 95% 02, 5% CO2. A few minutes after the muscle temperature had reached 20~ the oxygen electrode was brought into contact with the lower surface of the muscle. The subsequent time-course of the Po2 at the muscle surface was generally similar to that in the method I experiments described in the preceding paper, but was not formally analyzed. In the present context, the purpose of this period was to ensure that before the muscle was stimulated, the surface Po~, and by implication, the Qo2 and the intramuscular Po2 profile, had become constant. If the Po2 trace did not eventually become level, the muscle was discarded; this occurred in about 10% of experiments. If the Po~ trace became level, the muscle was stimulated for 0.1-2.0 s at a just supramaximal voltage, with stimuli of duration 0.6 ms and frequency 70 Hz. In all cases, the contraction was isometric.
During the contraction, and in some cases for several seconds thereafter, the electrode
MAHLER Kinetics of 02 Consumption in Stimulated Frog Sartorius 561
current rose above its precontraction level. Usually, this rise had the form of a spike of small amplitude, which appeared to be caused at least in part by pressure exerted on the electrode dur ing the tetanus, and possibly in part by electrical phenomena. After the spike, the electrode current was in most cases at its original level, and then began a gradual decline due to the change in Po2 at the muscle surface (cf. Fig. 1). Occasionally, the current immediately after the spike was marginally higher or lower than its precontraction level, and this was attributed to a slight repositioning of the muscle as a result of the tetanus, with an attendant small change in the muscle thickness over the cathode. In cases when the electrode current was still elevated above its precontraction level after ~10 s from the beginning of the stimulation, records were discarded. As explained in the following section, the first reading from acceptable records was usually not taken until 24 s after the contraction. Records obtained after an isometric tetanus were analyzed only if they eventually re turned to a steady level, indicating that the Qo2 had become constant. After the last suitable record of P(0, t) had been obtained, the oxygen electrode was withdrawn from the muscle surface, and again exposed to the chamber gas; this made it possible to measure the drift of the recording system dur ing the entire experimental period. This averaged - 1 % per h. The drift was assumed to have occurred at a constant rate, and the Po2 records were corrected accordingly.
Calculation of Qq ) from P(O, t)
For these calculations, it was assumed that the intramuscular Po2 profile was related to the Qo2 by the one-dimensional Fick diffusion equation:
02P OP D ~ ~ -~ (x, t) - ,~ ~ (x, t) = Q(t), (1)
where P is the partial pressure of oxygen (Po2), {2 is the {202, x is the distance perpendicular to the muscle surface, t is time, ot is the solubility of oxygen in muscle, and D is the diffusion coefficient for oxygen. This equation tacitly asssumes that Qo2 is uniform throughout the muscle, and thus varies only with time. If so, Eq. 1 implies that for each time-course of change by the surface Po2 from its initial steady-state value, denoted A P(0, t), there is a unique A Q(t).
The idea of calculating the kinetics of Qo2 in an isolated tissue from the kinetics of Po2 at its surface, via the one-dimensional diffusion equation for O~, appears to have originated with the work of Connelly et al. (1953) on isolated nerve. However, the mathematical techniques used by these authors were accurate only in special cases. For the present paper, a numerical method derived from the theory of linear systems has been used, which allows the calculation of A Q(t) from an arbitrary A P(0, t). The diffusion equation has the form of a system differential equation, with Q(t) as the input , and P(x, t) the output. As shown in Appendix I, for a muscle oxygenated only from one surface, and there by a constant Po2, for the case x = 0 the transfer function for this system has the form:
s e c h ( / v ~ ) - 1 H ( ~ ) = , ( 2 )
ors
where l is the thickness of the muscle above the platinum cathode, and s is a dummy complex variable. AQ(t) can be expressed in terms of AP(0, t) by the equation:
hQ(t) = ..~-' { ~[AP(O,How)t)](co)_'[j (t), (3)
where ,~ and o% -~ denote the direct and inverse Fourier transforms, o is a dummy
562 T H E J O U R N A L O F G E N E R A L P H Y S I O L O G Y " V O L U M E 71 �9 1 9 7 8
complex frequency, and./ = ~/---1. The derivation of Eq. 3 is also given in Appendix I. In the present case, AP(0, t) is not known in closed fi~rm, but only as a series of points. In practice, therefi)re, the exact Fourier transfi)rms in Eq. 3 were approximated by their discrete fi)rms, as computed by a Fast Four ier Transfi)rm (FFT) rout ine (Brigham. 1974). The result ing AQ(t) was thus also given as a series of points, with the same time base as AP(0, t). The values used f i ) rD and a in Eq. 2 were 1.34 • 10-:' cm2/s and 0.0307 ~! 02/ g. mm Hg, respectively (Mahler, 1978b).
To de termine the errors inherent in the use of the discrete Fourier transfi~rm rather than its exact fi)rm, and as a general test of the computat ional method, an exper iment was simulated analytically. The muscle was assumed to be initially in steady state, and Qo2 was then allowed to change from its basal level with the time course AQ(t) = e -t - e -l~ The diffusion equation was then solved to yield an exact expression fi)r the cor responding change in P(0, t); cf. Appendix I I . As required by the FFT routine, this curve was then sampled at a fixed time interval, and using this data, ~Q(t) was calculated via the method outl ined above. With as few as 64 output points, the calculated values matched the known, exact values with 1% accuracy; the total amount of extra oxygen consumed, f~ AQ(t) dt, was approximated to about 2% accuracy by numerically integrat- ing the calculated points with the trapezoidal rule. For higher sampling rates, the calculated and exact values of AQ(t) could be made virtually identical. This method can be generally appl ied to recover the input to any stable linear system fi)r which the output and transfer function are known, and is considerably more accurate than the "unit response" method traditionally used fi)r the correction of myothermal records (Hill, 1966, Chapter 13). The transfi)rm method is discussed in greater detail in a separate paper (Mahler, 1978a).
In practice, because of the large amounts of computer storage necessary to process records of > 128 points, the exper imental records of P(0, t) were usually sampled at 24-s intervals, and either 64 or 128 points were used in the FFT routines. Curve fitting to the calculated points fi)r AQo2(t) was done with a nonlinear least squares method (Brown and Dennis, 1970).
With a few exceptions, all experiments were done dur ing the months of December and January.
R E S U L T S
Kinetics o f (202 after an Isometric Tetanus
Fig. 1 shows a typ ica l r e c o r d i n g o f t he Po2 at t he l o w e r s u r f a c e o f a musc l e a f t e r an i s o m e t r i c t e t a n u s . I n e v e r y case , these r e c o r d s d i s p l a y e d an ini t ia l de c l i ne a l o n g an S - s h a p e d p a t h , wi th in f l ec t ion p o i n t a t - 1 m i n , to a m i n i m a l level r e a c h e d a f t e r - 3 - 5 m i n , fo l lowed by a g r a d u a l r ise back to a s t e a d y level , aga in wi th an S - s h a p e d t i m e - c o u r s e , wi th t he f ina l level r e a c h e d a f t e r 20-50 ra in . O n the a v e r a g e , fo r c o n t r a c t i o n s o f 0 .1-0 .4 s, this f inal P02 m a t c h e d the p r e c o n t r a c - t ion va lue ; fo r l o n g e r t e t an i , the f inal P02 t e n d e d to be s l ight ly l o w e r t h a n the in i t ia l level . T h e l o n g e r the d u r a t i o n o f t he t e t a n u s , the l a r g e r was t he t r a n s i e n t in t he su r f ace P02. T h e re l a t ive t ime c o u r s e o f P02 s h o w e d l i t t le va r i a t i on with the t e t a n u s d u r a t i o n in a g iven musc le , at leas t fo r c o n t r a c t i o n s o f 0 .1 -1 .0 s, a l t h o u g h f r o m o n e m u s c l e to t he nex t , t he t ime s p a n s i n v o l v e d cou ld vary c o n s i d e r a b l y .
I t s h o u l d be e m p h a s i z e d tha t a c c o r d i n g to the d i f f u s i o n e q u a t i o n , the i n t r a m u s c u l a r Po2 was at its lowest at t he s u r f a c e w h e r e it was b e i n g m e a s u r e d ,

MAHCER Kinetics of O~ Consumption in Stimulated Frog Sartorius 563
a n d w h e r e i t was typ ica l ly at leas t 200 m m H g (e .g . , cf. Fig . 1), well in excess o f t he r e p o r t e d "cr i t ical Po2" f o r this m u s c l e (Hi l l , 1948; G o r e a n d W h a l e n , 1968). I t s e e m s safe to i n f e r t ha t t he (2o2 was n e v e r l im i t e d by 02 d e l i v e r y .
F ig . 2 shows e x a m p l e s o f the t i m e - c o u r s e o f t he s u p r a b a s a l r a t e o f o x y g e n c o n s u m p t i o n , AQ(t), c a l c u l a t e d f r o m t h e r e c o r d s o f s u r f a c e Po2; f o r the sake o f c la r i ty , t he d i s c r e t e va lues o f AQ(t) have b e e n c o n n e c t e d by c o n t i n u o u s l ines . T h e osc i l l a t ions e v i d e n t in these r e c o r d s , whi le no d o u b t d u e in p a r t to b o t h v a r i a t i o n in t he s u r f a c e Po2 a n d to e r r o r s in s a m p l i n g it, can also be a t t r i b u t e d in p a r t to t he use o f d i s c r e t e r a t h e r t h a n exac t F o u r i e r t r a n s f o r m s in the ca l cu la t ion o f 2~Q(t) via Eq. 3 ( B r i g h a m , 1974).
I n a l m o s t all cases , it was a p p a r e n t t ha t the d e s c e n d i n g l i m b o f hQ(t) c o u l d be well a p p r o x i m a t e d by a s ing le e x p o n e n t i a l ; a c c o r d i n g l y , t h e be s t - f i t t i ng c u r v e o f t he f o r m a + be -et was c a l c u l a t e d fo r e ach r e c o r d . A l t h o u g h the g o o d n e s s o f fi t was d i f f i cu l t to q u a n t i f y ? it was n e v e r t h e l e s s e v i d e n t f r o m visual i n s p e c t i o n tha t
t
200 rnm ~ "l 0 j 3rnin
FIGURE I. Photograph of a typical recording of the time-course o f Po2 at the lower surface of a muscle befiwe, dur ing, and after an isometric tetanus at 20~ Tetanus durat ion 0.8 s, Inset: photograph of the recording of tension developed dur ing the tetanus. One division on the abscissa corresponds to 40 ms, and on the ordinate , tf~ 2 g.
fo r t e t an i o f 0 .1 -1 .0 s, the fits c o u l d be c o n s i d e r e d qu i t e g o o d in a b o u t 90% o f all cases . C u r v e s a a n d b o f Fig . 2 a r e e x a m p l e s o f a v e r a g e fi ts , c h o s e n as m u c h to i l l u s t r a t e typ ica l d e v i a t i o n s f r o m an e x p o n e n t i a l t i m e - c o u r s e , as a s t r ic t a d h e r - ence to it: in c u r v e a , t he osc i l la t ions in t he l a t t e r p a r t o f t he c u r v e a r e u n u s u a l l y l a rge ; in c u r v e b, a f t e r AQ(t) has d r o p p e d to a b o u t 10% o f its p e a k va lue , it r e m a i n s s l ight ly b u t cons i s t en t ly h i g h e r t h a n the be s t - f i t t i ng e x p o n e n t i a l fo r a b o u t l0 min ; as d i s cus sed be low, this t e n d e n c y was a c c e n t u a t e d fo r t e t an i o f l o n g e r t h a n 1.0 s. T h e fit shown in Fig . 2c was a m o n g the bes t o b s e r v e d .
The parameter
r = erro (~Q[ti]) z L I t |
which approximates the average relative error, did not appear to be a particularly useful index of the goodness of tic. In cases for which the oscillations ar(mnd the fitted curve were relatively large, but still quite uniform, so that the fit would be subjectively judged very good, the values of r were typically relatively large; in comparison, smaller values ofr were often obtained when the deviations were smaller, but less uniformly distributed about the fitted curves, so that the fits appeared by inspection to be considerably worse. The average value for r was about 0.15; for records a, b, and c of Fig. 2, the values of r are 0.147, 0.107, and 0.098, respectively.

564 THE .JOURNAL OF GENERAL PHYSIOLOGY " VOLUME 71 �9 1978
0.6
0.4
0.2
0
0
/ ' ~ a 1/29 0.2s
r= = 2.48min
(p.l/g.min) v ~
200 400 600 800 tO00 1 2 0 0 1400
t(s)
3.0
225
1.5
075
0
0
AQot(t ] (p.l Icj.min)
b 1/29 0 8 s
T I : 2 l ~ rain
4(30 800 1200 1600 2000 2400 2800
t(s)
20 A QO/t) (H'I/cJ'min)
12/23 0 5 s
15 c "{'1 = 7.97 rain
I0
05
0
O 400 800 1 2 0 0 1600 2000 2400 2800
t (s)
FIGURE 2. Typ i ca l r e c o r d s o f t h e ca l cu l a t ed t i m e - c o u r s e o f AQo2 a f t e r i s o m e t r i c t e t an i (>f 0 .1 -1 .0 s at 20~ T e t a n u s d u r a t i o n s (a) 0.2 s, (b) 0.8 s, a n d (c), 0.5 s. C u r v e b is d e r i v e d f r o m t h e Po2 r e c o r d s h o w n in Fig . 1. S m o o t h cu rves : b e s t - f i t t i n g c u r v e s o f t h e f i ) rm a + b e - t ' l t .

MAHLER Kinetics of 02 Consumption in Stimulated Frog Sartorius 565
It was de t e rmined in early exper iments that, af ter a 2-s tetanus, the Po~ at the closed surface o f the muscles sometimes fell to zero and remained there for several minutes; this occur red in muscles 1.0-1.2 mm thick, despite a Po2 o f about 540 mm Hg at the u p p e r surface. These exper iments proved incidentally useful, by provid ing fu r the r evidence that, for a Pou o f zero, the electrode cur ren t was the same whether the external medium was a muscle or a test gas, an assumption that was made routinely in the calibration o f the electrode currents r eco rded f rom muscle (cf. Methods in Mahler, 1978b). For the main body o f exper iments , tetani of 1 s or less were used, to ensure that the muscles were well oxygenated . However , several exper iments were done in which muscles were adequately oxygenated af ter tetani o f 1.2-2.0 s. Fig. 3 shows the results o f one such exper iment . In general , the t ime-course o f AiQo2 was at first
8
~ Q02(t) (~.1/g.min)
11/25 20 S T~-- 2.35rain
0 600 1 2 0 0 1800 2400 3000 3600 4200 4800
t (s)
FIGURE 3. T h e ca lcu la ted t i m e - c o u r s e o f AQo2 a f t e r an i somet r ic t e t a n u s o f 2.0 s.
S m o o t h curve : bes t - f i t t ing c u r v e o f the f o r m a + be -~'t .
similar to that described above for shor ter tetani; once it had fallen to - 2 0 % of its peak value, however , the subsequent decline to a steady value was markedly slower than for the shor ter tetani, so that the ent ire descending limb o f ~ o 2 was poorly fit by a single exponent ia l .
Fig. 4 illustrates the depen d en ce on tetanus dura t ion o f the time constant o f the descending limb o f AQoz(t); for reasons made clear below, this time constant will be designated T T. T h e values plotted represen t all exper iments with tetani o f 0.1-1.0 s (n = 46). Linear regression showed no d ep en d en ce ofT1 on tetanus dura t ion (r = -0 .041, P > 0.7); this conclusion is c louded, however, by the scatter in the values OfT1 (range, 1.9-8.0 min). An alternative approach was to consider only cases in which two or more exper iments had been done with a single muscle, and to compare , for all possible pairs o f such exper iments , the value of~'~ for the longer tetanus o f the pair to that for the shor ter . T h e results o f these comparisons are shown graphically in Fig. 5. When the values ofT1 were plotted against each o ther pairwise, the points clustered along the line o f identity; for the 59 possible pairs, based on 45 exper iments in 14 muscles, the

5 6 6 THE JOURNAL OF GENERAL PHYSIOLOGY �9 VOLUME 71 �9 1978
mean value of (~'longer t~tanush'shorter t~tanus) was 0.999 -+ 0.022. Clearly, any depend- ence of~'l on the tetanus durat ion must be slight over the range 0.1-1.0 s. The mean value ofT1 for all experiments was 3.68 + 0.24 min (n = 46); inasmuch as the distribution was somewhat skewed, it is also o f interest that the median value was 3.09 min.
The final value o f A(2o2 after a tetanus, denoted (AQo2)0, represents the change in the basal level o f Qo2 f rom its precontract ion value. For tetani o f 0.1- 0.4 s, (AQo2)0 was negligible (pooled mean = 0.0012 -+ 0.0048 t~l/g, rain, n = 19). For tetani of 0.5 s and hmger , the average value of (A(2o2)0 ranged f rom 0.02 to 0.11 /~l/g. rain; in comparison, the resting (2o2 at 20~ was previously observed to be about 0.5/.d/g. rain (Mahler, 1978b). (AQo2)b was quite variable for tetani o f 0.5 s and longer: it was sometimes near zero, even for tetani o f 2.0 s (cf. Fig.
6.0
,5.0
4 0
3.0
20
1.0
mn tL t . . . . . . . . . . . . .
+ t
0 0.2 04 0.6 0.8 1.0
tetanus duration (s)
FIGURe: 4. The relationship between the duration of an isometric tetanus and the time constant 7~ of AQo2(t) after the tetanus, based on pooled data from all experiments with tetani of 0.1-1.0 s. Dashed line: ~'1 = 3.68 min, the mean value. The actual line of best fit is Y = (3.79 +- 0.48) + (0.21 +- 0.77)X. (r = - 0.041).
3), and was significantly different f rom zero only for 1.0 s tetani. However, a small increase in the basal Qo2 does appear to have occurred in some experi- ments.
Except fi)r the fact that AQo2 reaches its peak value only after 45-90 s, its general t ime-course as repor ted here is well described as the response of a first o rder system to an impulse input. An exact first o rder response would have the f o r m ;
A Q o 2 ( t ) = A ( ~ o 2 ( 0 ) . e -kt , ( 4 )
and this time-course was in fact proposed by Kushmerick and Paul (1976) to describe their results at 0~ This raises the question of whether the present exper iments can distinguish with certainty between the observed kinetics and those of Eq. 4. A related but more fundamenta l question is whether the calculated 45-90-s rise in AQo2 is a methodological artifact. With regard to the second question, two factors can be identified that might cause the recorded

MAHLER Kinetics of Oz Consumption in Stimulated Frog Sartorius 567
t ime-course o f Po2 to change m o r e slowly than that actually occur r ing at the lower surface o f the muscle; this would in tu rn cause the calculated A(2o2(t) to lag beh ind the t rue curve. T h e first factor is a lag in the response o f the system used to record Po~; the second is the existence o f a layer o f connect ive tissue and Ringer fluid be tween the muscle fibers and the oxygen electrode. T h e i r effects were deduced by mak ing app rop r i a t e modif icat ions in the equations by which AQo~(t) is l inked to the observed P(0, t), calculating the new values for AQo2(t) f rom a sample expe r imen ta l record o f P(0, t), and then c o m p a r i n g these new values to the original calculated t ime-course o f AQo2. T h e response t ime of the record ing system was incorpora ted into Eq. 3 as an addit ional first o rde r
(Tf) longer tetanus (rain) o /
?s s o / /
6,0 , / d /
/
4,5 /
30 o Ogo~ ~ ~
~ % ~ 1.5 /
/ /
0 i , , , , , , , , , ,
0 1,5 50 4.5 60 7.5
(TI) shorter tetanus ( rain )
FIGURE 5. The relationship between the value ofT, for the longer tetanus and that for the shorter tetanus fi)r all possible pairs of measurements of A()o2(t) after tetani of different durations on a single muscle. Dashed line: line of identity. The actual line of best fit is Y = (-0.012 --+ 0.222) + (0.997 --- 0.058)X. (r = 0.92).
system, with a t ime constant o f 2.0 s (Mahler , 1978b), and as expected , the result ing changes in AQo~(t) were negligible.
T o est imate the effect on the calculated AQo2 o f the layer of connect ive tissue and Ringer solution lying between the muscle f ibers and the oxygen electrode, it was assumed that the Po2 profi le within this layer was d e t e r m i n e d by the one- dimensional diffusion equat ion (Eq. 1), that its rate o f oxygen consumpt ion was zero, and that D and c~ had the same values there as in water. T h e existence o f the layer necessitates a change in the boundary condit ion for Po2 at the lower surface o f the muscle; the derivat ion o f the modif ied system t ransfer funct ion relat ing AQo2(t) to the observed P(0, t) is given in Append ix IV o f Mahler (1976). It was assumed that 25 /xm was a generous u p p e r limit for the thickness o f the nonconsuming layer. According to Hill (1949), the excised f rog sartorius has at its "outer" surface, which was originally next to the skin, a layer o f connect ive tissue with average thickness about 6 /xm, whereas at the " inner" surface, no such layer is evident . In the present exper iments , it was the inner surface which

568 T H E J O U R N A L OF G E N E R A L P H Y S I O L O G Y �9 V O L U M E 71 �9 1 9 7 8
was in contact with the oxygen electrode, so the nonconsuming layer was probably composed simply of Ringer solution. Hill (1949) es t imated the thickness of the layer of Ringer solution between a d ra ined muscle and a the rmopi le to be about 1 or 2 /zm. In the present context , it seems realistic to accept this only as a lower limit; using the fact that a muscle weighs - 6 % more when d ra ined than when blotted, it can be calculated that if in a dra ined muscle this extra weight is due to a layer o f Ringer solution spread uni formly over the entire pe r iphery , then the thickness o f the layer will be about 20 /zm for muscles o f the size used in the present work. Accordingly, in calculating the effect on AQo2(t) o f the nonconsuming layer, it was assumed that the layer was no more than 25 /~m thick. Even when this f igure was used, the calculated t ime-course of AQo2 was only slightly changed: dur ing the first 1-2 min, individual values were generally increased by 2-10%, but the t ime at which the peak in AQo2 occur red was the same; in the latter por t ion o f the curve, the values were in general slightly smaller; the area unde r the curve and the t ime constant ~'1 were smaller by only a few percent . Because these effects were small, and no m e a s u r e m e n t s were made of the thickness o f the nonconsuming layer, correct ions o f this type were not incorpora ted into the results.
It remains to be cons idered whe ther the me thodo logy used here makes it possible to rule out a monoexponen t i a l t ime-course for A(2o2 du r ing the entire recovery per iod. This quest ion was answered by assuming that AQo2(t) did in fact have the f o r m p roposed in Eq. 4, calculating the co r r e spond ing t ime-course of Po2 at the muscle surface predic ted by the diffusion equat ion, and c o m p a r i n g this record to those observed exper imenta l ly (for details, cf. A p p e n d i x II) . T h e results are shown graphically in Fig. 6. A(2o2(t) can, fi)r the pu rpose of these calculations, be well a p p r o x i m a t e d by the funct ion e - k i t - e - ~ 2 t , where kl and k2 have the values 0.29 min -2 and 2.0 min -~ , co r r e spond ing to t ime constants o f 3.5 rain and 30 s, respectively. These observed kinetics are shown in the inset o f Fig. 6 as curve a. T h e co r r e spond ing monoexponen t i a l t ime-course , e-k1 t, appears as curve b. Curve c is the t ime-course of Apo2 at the muscle surface predicted by Eq. 1 when AQo2(t) is specified by curve a; it closely matches the exper imenta l records (cf. Fig. 1). Curve d shows, on the same scale, the time- course o f Apo2 which would occur if AQo2(t) was given by b ra ther than a.
Given exact values f rom curve c, the t ransf l)rm m e t h o d can recover the input e -k~t - e -k2t with a high degree o f accuracy (cf. Methods, and Mahler , 1978a); given points f r o m curve d, its input e -k1r can also be a p p r o x i m a t e d with good accuracy. 2 In practice, points f rom exper imenta l records were read by eye; this was p resumably done with small r a n d o m errors , bu t these can be shown to have a negligible effect on the accuracy of the t ransf l ) rm method . I t fl)llows that if the micro-O2-electrode and record ing system were sufficiently stable, respon- sive, and sensitive that a Po2 t ransient descr ibed by curve d would not be recorded as curve c , it will then be demons t r a t ed that the m e t h o d used here was adequate to dist inguish a (2o2 t ransient o f the fo rm e -k~t - e -k2t f rom one of the fo rm e -k,t. This appa ra tus was stable to within 1% per h, and had a t ime
2 Mahler, M. Unpublished observation.

MAHLER Kinetics of 02 Consumption in Stimulated Frog Sartorius 569
constant o f about 2 s (cf. Mahler , 1978b). Al though no specific exper iments were done to de t e rmine the limits o f its sensitivity, its excellent linearity implies that changes in Po2 on the o rd e r o f a few mm Hg can be measured , and previous workers have rout inely used similar ins t ruments for this purpose (e.g. Connelly et al. 1953; Gore and Whalen, 1968; Kawashiro et al., 1975; Kushmer- ick and Paul, 1976). In contrast , Figs. 1 and 6 illustrate that u n d e r the conditions o f the present exper iments , the observed records describe large changes in electrode cur ren t , with max imum deflections on the o rde r of 50%, and occur gradually over many minutes; moreover , on a realistic scale, a curve o f form d would di f fer f rom one o f fo rm c by as much as 30-40 mm Hg. It follows that according to the methodology employed in this paper , it can be concluded that af ter a tetanus o f 0 .1 -1 .0 s, AQo~(t) does not have the fo rm Q a e - k i t .
0
-0.4
-0.8
-12
-16
A p02(t ) (arbitrary units)
c
,o AQ0=(t)
d o.Ts b
0 , 6 0
0 1 , " " ~
o ~ z~ 3~ ,~
0 2 4 6 8 I0 12 14 16
t (rnin)
FIGURE 6. Inset: curve a, AQo2(t) = e -'~'~t - e - k 2 t ; curve b . AQo2(t) = e - k i t . Curve c is the time-cnurse of APo2 at a muscle surface predicted by the diffusion equation (Eq. 1) when A(2o2(t) is given by curve a. Curve d is the corresponding time-course of APoz when AQo2(t) is given by curve b.
A somewhat more subtle question is whe ther any constants C and k can be found for which a monoexponen t ia l AQoz(t) given by C e - k t can p roduce a time- course o f haPo2 which will match, within exper imenta l e r ro r , the observed kinetics given by curve c. Given the validity o f Eq. 1, this possibility can also be ruled out. For a monoexponent ia l AQo2(t), Apo2 will always have a cusp at t = 0, and a monotonical ly increasing slope du r ing the initial phase o f recovery (cf. curve d); in contrast , the exper imenta l records invariably followed an S-shaped path du r ing this t ime, with a p ro n o u n ced "shoulder" at the start (cf. Fig. 1 and curve c). This initial discrepancy could be lessened, and the t rough points in APo2 made to coincide, only by choosing k considerably smaller than kl, with appropr ia te scale factor C; this resulted in a wide divergence between the ascending limbs o f the predicted and observed curves o f APo2. These results a rgue that the initial 45-90-s rise in AQo2 calculated by the present me thod is a
real p h e n o m e n o n , and it thus appears justified to incorpora te these early kinetics into the quantif icat ion o f A(2o2(t).
570 T H E , J O U R N A L OF G E N E R A L P H Y S I O L O G Y �9 V O L U M E 71 . 1978
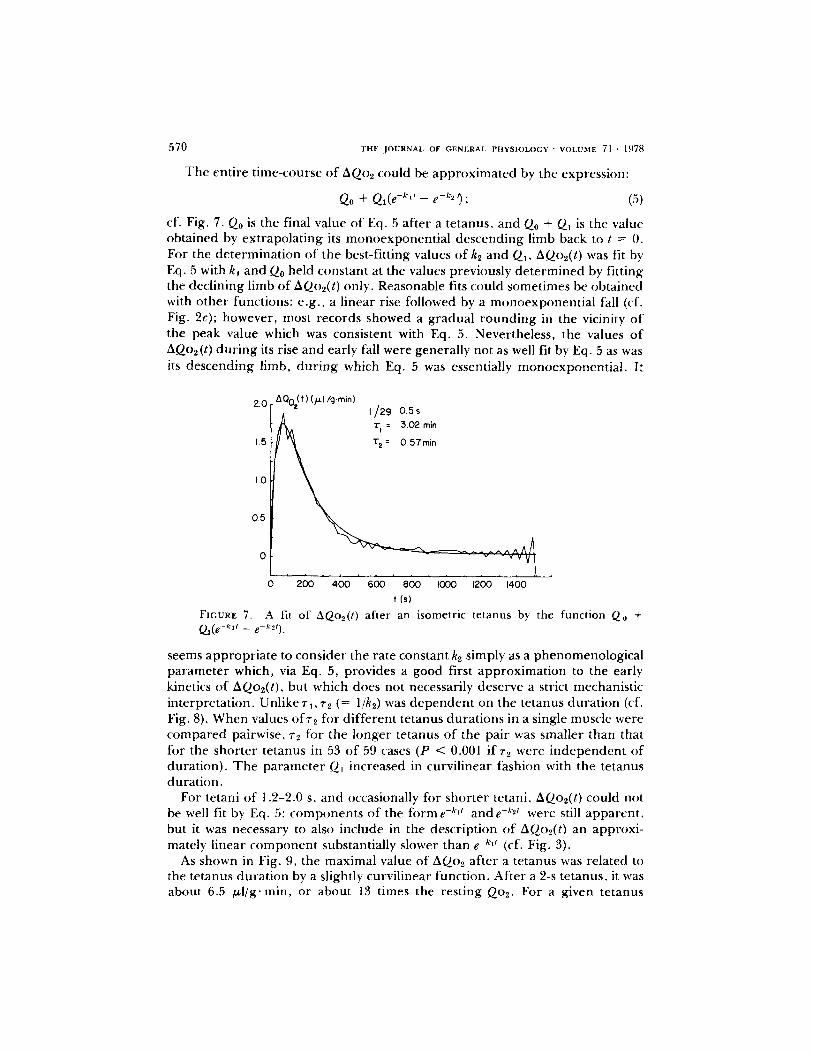
T h e ent ire t ime-course o f AQo2 could be approx imated by the expression:
Qo + Ql(e - k ' t - e-k=t); (5)
cf. Fig. 7. Q0 is the final value o f Eq. 5 af ter a tetanus, and Q0 + Q1 is the value obtained by extrapolat ing its monoexponent ia l descending limb back to t = 0. For the de te rmina t ion of the best-fitting values o f k2 and QI, AQo2(t) was fit by Eq. 5 with k~ and Q0 held constant at the values previously de te rmined by fitting the declining limb of A(2o2(t) only. Reasonable fits could sometimes be obtained with o ther functions: e.g. , a l inear rise fi)llowed by a monoexponen t ia l fall (cf. Fig. 2c); however, most records showed a gradual round ing in the vicinity o f the peak value which was consistent with Eq. 5. Nevertheless, the values o f AQo2(t) du r ing its rise and early fall were generally not as well fit by Eq. 5 as was its descending limb, du r ing which Eq. 5 was essentially monoexponent ia l . It
2.0 AQoz(t) (k~l Ig'min] 1/29 0.5s
/~ T, = 302 min
1.5 : '
0.5
. . . . ^ ^ A / ~ A
0 ~ -vvy 1
0 200 4 0 0 600 800 I000 1200 1400
t (s)
FIGURE 7. A fit of AQo2(t) after an isometric tetanus by the function Q0 + Q1(e-~',, - e-~'2,).
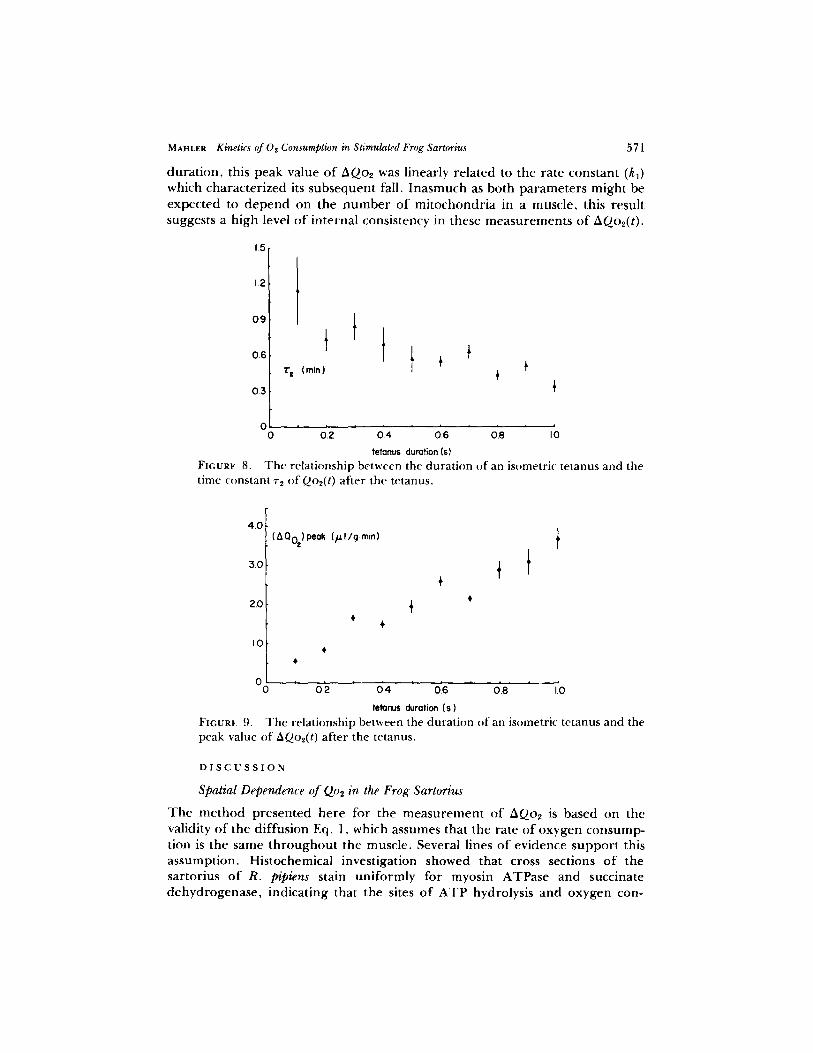
seems appropr ia te to consider the rate constant k2 simply as a phenomenologica l parameter which, via Eq. 5, provides a good first approximat ion to the early kinetics o f AQo2(t), but which does not necessarily deserve a strict mechanistic interpretat ion. Unlike r l , ~'2 (= l/k2) was d ep en d en t on the tetanus dura t ion (cf. Fig. 8). When values of~'2 ft)r d i f ferent tetanus durat ions in a single muscle were compared pairwise, ~'2 for the longer tetanus o f the pair was smaller than that fi)r the shor te r tetanus in 53 o f 59 cases (P < 0.001 if72 were i ndependen t o f durat ion). T h e paramete r Q1 increased in curvil inear fashion with the tetanus durat ion.
For tetani o f 1.2-2.0 s, and occasionally fi)r shor ter tetani, AQo2(t) could not be well fit by Eq. 5: components of the fi)rm e -kit and e -k2t were still apparent , but it was necessary to also include in the descript ion o f AQo~(t) an approxi- mately l inear componen t substantially slower than e -~',t (cf. Fig. 3).
As shown in Fig. 9, the maximal value o f AQo2 after a tetanus was related to the tetanus durat ion by a slightly curvilinear function. After a 2-s tetanus, it was about 6.5 /~l/g. min, or about 13 times the resting Qoz. For a given tetanus
MAHLER Kinetics of 02 Consumption in Stimulated Frog Sartorius 571
duration, this peak value of AQ02 was linearly related to the rate constant (k~) which characterized its subsequent fall. Inasmuch as both parameters might be expected to depend on the number of mitochondria in a muscle, this result suggests a high level of internal consistency in these measurements of AQo2(t).
1.5
1.2
0.9
0.6
0.3
0 0
"r'= (min)
02 04 0.6 08 10
tetonus durotion (s) FIGURE 8. T h e r e l a t i o n s h i p be tween the d u r a t i o n o f an i somet r ic t e t a n u s a n d the t ime c o n s t a n t rz o f Qoz(t) a f t e r the t e t anus .
4.0
3.0
2.0
/0
0 0
(AQ02} peak (yllg.min)
§ +
0 2 0 4 0.6 0.8 1.0
~ r ~ s durofion (s ) FIGURE 9. T h e r e l a t i o n s h i p b e t w e e n the d u r a t i o n o f an i somet r ic t e t a n u s a n d the peak va lue o f AQo2(t) a f t e r the t e t anus .
D I S C U S S I O N
Spatial Dependence of Qo2 in the Frog Sartorius
The method presented here for the measurement of AQo2 is based on the validity of the diffusion Eq. 1, which assumes that the rate of oxygen consump- tion is the same throughout the muscle. Several lines of evidence support this assumption. Histochemical investigation showed that cross sections of the sartorius of R. pipiens stain uniformly for myosin ATPase and succinate dehydrogenase, indicating that the sites of ATP hydrolysis and oxygen con-

572 T H E , J O U R N A L O F G E N E R A L P H Y S I O L O G Y ' V O L U M E 71 - 1 9 7 8
sumption are un i formly distributed. Single fiber cross sections typically cut 40- 100 mitochondria , and the average area "served" by a mi tochondr ion is roughly 20 ftm2. 3 The validity o f Eq. 1 in the resting sartorius (Mahler , 1978b) indicates that the resting Qo2 is un i form th roughou t the muscle. Finally, results consistent with the uniformity o f muscle oxygen consumpt ion were provided by experi- ments designed to test the effect o f the placement o f the oxygen electrode on the measured AQ(t) for a tetanus o f 0.2 s. In the first o f a lpair o f exper iments , a muscle was moun ted in the usual way, with the plat inum cathode ~8 inm from the pelvic bone, and approximate ly equidistant f rom the lateral edges o f the muscle (cf. Fig. 1 o f Mahler, 1978b). For the second exper iment , the positions o f the ends o f the muscle were exchanged, so that the cathode now lay 8 mm from the distal end , and 20-25 mm f rom the pelvic bone. On average, Q0, Q1, r , , ~'2, and the total oxygen consumpt ion f~AQ.(t) agreed to within 10% for the two electrode placements (n = 6).
Comparison with Previous Work
TIME-COURSE OF A Q o 2 T h e results presented here show that af ter a single br ief isometric tetanus o f 20~ the t ime-course o f AQo~ in the excised f rog sartorius quickly becomes monoexponent ia l . These kinetics are consistent with virtually all previous observations in this field, made on skeletal muscles o f the frog at 0~ for which ~- -~ 10-20 min (Hill, 1940a; Kushmerick, and Paul, 1976), and at 12~ (r -~ 10 min, Baskin and Gaffin, 1965); the dog (~- = 24 s at 36~ Piiper et al., 1968); and man (~- -~ 45 s; for review cf. Berg, 1947, and Casaburi et al., 1977). T h e kinetics o f oxygen consumpt ion in f rog skeletal muscle at 20~ have apparent ly not been previously described; however , Godf ra ind-deBecker (1972, 1973) r epor ted that af ter isometric tetani o f 0.5-1.5 s by excised toad and frog sartorii at 20~ the rate o f heat product ion became monoexponen t ia l af ter 2-3 rain, with a time constant o f 3.3-4.0 rain, and that N A D H fluorescence in the toad sartorius had essentially the same kinetics dur ing this time span. Both o f these processes can be expected to occur in parallel with AQo2 (Hill, 1940a, b; J6bsis and Duffield, 1967). T h e results o f Godf ra ind-deBecker (1972, 1973) thus seem quantitatively consistent with those r epor t ed here.
According to the present results, the time constant o f the descending limb o f AQo2(t) af ter a tetanus is i ndependen t o f the tetanus dura t ion over the range 0.1-1.0 s. This conclusion is also consistent with virtually all previous results, except those o f Kushmerick and Paul (1976), who repor ted that af ter single tetani in the sartorius o f R. pipiens at 0~ the exponent ia l t ime constant fi)r AQo2 increased markedly with the tetanus dura t ion over the range 1-30 s. In contrast, Hill (1940a) concluded on the basis o f similar exper iments with R. temporaria that the time constant for AQo2 was invariant for tetani o f up to 20 s. Moreover , the rate o f aerobic recovery heat product ion , which according to Hill (1940a, b) parallels AQoz, has also been repor ted to have a time constant which does not vary with the tetanus dura t ion, in excised sartorii o f the f rog at 0~ (Hill, 1940b) and the toad at 20~ (Godfra ind-de Becker, 1973). Analogous results have been r epor t ed for canine and h u m an skeletal muscle. Piiper et al.
3 Eisenberg, B., and A. Kuda. Unpublished observation.

MAHLEa Kinetics of Oz Consumption in Stimulated Frog Sartorius 573
(1968) used the Fick principle to approximate transient kinetics of oxygen uptake by the in situ dog gastrocnemius during series of tetani of fixed duration and rate; these series presumably caused approximately stepwise increases in the rate of ATP utilization by the muscle, in contrast to the impulse increase which presumably accompanies a single tetanus (cf. Introduction). The tran- sients in oxygen uptake measured by Piiper et al. could be approximated by curves of the form (1 - e-trY), with ~" independent of the steady state Qo2 over a wide range in the latter. In the context of a systems analysis of the link between ATP splitting and oxygen consumption, these results are consistent with the independence of~'l from tetanus duration reported by Hill (1940a) and in this paper. Moreover, numerous studies on the kinetics of oxygen uptake in man during work suggest that there is a wide range of conditions for which AQo2 has exponential kinetics in human skeletal muscle after a step change in work rate, with time constant again independent of step size (cf. Casaburi et al., 1977 for review).
According to the present results, A(2o2 in the frog sartorius does not have exclusively monoexponential kinetics after a single tetanus at 20~ an initial rapid component is present which results in a delayed rise to the peak value. The only strictly comparable published evidence appears to be that reported by Hill (1940a) and Kushmerick and Paul (1976) for the excised frog sartorius at 0~ Hill's results were similar to those reported here, in that differentiation of his records of cumulative suprabasal oxygen consumption after a tetanus indicates that AQo2(t) reached its peak value only after 2-3 rain. In contrast, Kushmerick and Paul concluded that AQo2(t) was at its peak by the end of a tetanus. Examination of their experimental records shows that suprabasal oxygen uptake was essentially zero for several minutes after a tetanus; because the rate of 02 consumption is the sum of the rate of uptake and the rate at which the muscle 02 store is decreasing, it fi)llows that for AQo2(t) to have been maximal by the end of a tetanus, the calculated rate of depletion of the 02 store of the muscle must have been relatively large during the early phase of recovery. This rate was calculated via the diffusion equation (Eq. 1), with the diffusion coefficient for oxygen in muscle at 0~ assumed to have the value 2.75 x 10 -4 cm2/min (Hill, 1966). However, as reported in the preceding paper (Mahler, 1978b), although Eq. 1 does appear to be valid in the excised frog sartorius, D has the value 4.94 (--- 0.16) • 10 -4 cm2/min at 0~ from which it follows that the actual changes in the 02 store of the muscle wer eonly about half as large as those calculated by Kushmerick and Paul (1976), and that the initial phase of AQo2(t) in their experiments may have been similar to that reported here and by Hill (1940a). A similar criticism in fact applies to the results of Hill (1940a) as well, and implies that the peak values of A(2o2 in his experiments occurred somewhat later than is evident from his corrected records. Indirect measures of the early kinetics of AQo2 in amphibian skeletal muscle after single tetani also appear consistent with the results reported here. A delayed rise to a maximum has been reported for the NADH fluorescence change in the toad sartorius at 12~ 06bsis and Duffield, 1967) and 20~ (Godfraind-deBecker, 1972, 1973), and fi)r the rate of aerobic recovery heat production in the frog sartorius at 0~

574 T H E J O U R N A L O F G E N E R A L P H Y S I O L O G Y " V O L U M E 71 �9 1 9 7 8
(Har t ree and Hill, 1922; Hill, 1940b) and 20~ (Har t r ee and Hill, 1922; Hill, 1966).
According to the results summar ized in Fig. 9, the longer the dura t ion o f an isometric tetanus, the faster is the rise of A0-o2(t) to its peak value af ter the tetanus. Al though no comparab le analysis o f the early kinetics o f AQo2(t) af ter a contract ion has been publ ished, similar behavior has been r epo r t ed for the rate o f aerobic heat p roduc t ion in the f rog sartorius at 20~ (Har t r ee and Hill, 1922; Hill, 1966) and for N A D H fluorescence in the toad sartorius at 12~ (J6bsis and Duffield, 1967).
SENSITIVITY Oxygen uptake by an excised muscle has previously been measured directly, as the a m o u n t o f Oz r emoved f rom a well-stirred chambe r (for methods cf. Fenn, 1927; Gemmill , 1936; Hill, 1940a; Kushmer ick and Paul, 1976). A potential difficulty with such methods is that the rate at which oxygen disappears f rom the chamber is of ten quite small in compar i son with the a m oun t actually present . For example , O2-filled chambers typically contain roughly 5 ml 02 (Fenn, 1927; Gemmill , 1936; Hill, 1940a; Baskin and Gaffin, 1964); even a Ringer-fil led c h a m b e r (Kushmer ick and Paul, 1976) o f 5 ml, if bubbled with 95% 02 at 20~ would contain 140 /~1 Oz. In compar i son , according to the present results, the total suprabasal oxygen consumpt ion by a 60-rag muscle af ter a 1.0 s tetanus is only - 1 /M, or for a 0.1-s tetanus, 0.2 /xl; moreover , these volumes are consumed only over a per iod o f 20-40 rain. With the method described in this paper , the kinetics o f muscle oxygen consumpt ion are not measured directly, but deduced f rom the kinetics of Po2 at a muscle surface. Al though this technique undoubted ly entails a more complicated set o f assumptions than previous methods , it appears to o f fe r considerably grea te r sensitivity. For an app rop r i a t e choice of the chambe r gas, the change in surface Po2 af ter a te tanus can be made to consti tute a large, easily measu red fraction o f the initial value. For example , with a chambe r gas conta ining 5-10% 02. it is possible to measure AQo2(t) in the f rog sartorius af ter a single isometric twitch at 0oC.2
Implications for Control of O.o2
T h e overall aim o f this and the accompany ing papers (Mahler, 1978 b, c) has been to provide data which would make it possible to quantify the dynamic coupl ing between the rates o f A T P hydrolysis and 02 consumpt ion in well oxygena ted muscle cells. I f a system is def ined by specifying these rates as its input and ou tpu t , respectively, the prob lem at hand becomes one o f system identification. Evidence presented in a fo r thcoming p a p e r in this series indicates that dur ing and af ter a single isometric tetanus o f 1 s or less at 20~ the time- course of the suprabasal rate of A T P hydrolysis in the sartorius o f R . pipiens can be well described as an impulse, and it follows that in the present context , the kinetics o f A0.o2 r epor t ed here for tetani o f 1 s or less are those o f impulse responses. T h e application o f these results to the de te rmina t ion o f general equations l inking the rates o f A T P hydrolysis and 02 consumpt ion in this muscle is in tended to be the topic o f a separa te paper . However , some fundamen ta l conclusions can be noted here. First, the system is nonl inear . I f it were linear, then for tetani o f increasing dura t ion , which produce impulse-l ike inputs o f

MAnLER Kinetics of O= Consumption in Stimulated Frog Sartorius 5 7 5
increasing area , the t ime constants r l and r= o f AQo2(t) would r ema in fixed. T h e variat ion o f rz with te tanus dura t ion (cf. Fig. 8) thus indicates the involvement of a nonl inear process. Second, the monoexponen t i a l decline of AQoz(t) f rom its peak value a f te r a te tanus, with t ime constant (rl) i n d e p e n d e n t o f te tanus dura t ion (cf. Figs. 4 and 5), suggests that du r ing this per iod, the sequence of events l inking A T P hydrolysis and 02 consumpt ion is rate- l imited by a single reaction with a p p a r e n t first o rde r kinetics. An essentially similar hypothesis was advanced by Hill (1940a) to explain his results at 0~
A D D E N D U M
For the calculation o f A Q(t), the t ransfer funct ion H ( s ) w h i c h links A P(0, t ) and A Q(t) has been evaluated via Eq. 2, using an average value o f D based on previous exper iments , and individually measured values o f / . Dur ing the review of this paper , it was pointed out that if an e x p e r i m e n t of the type described here is accompan ied by one done with the muscle in the rest ing state, by e i ther o f methods I or I I described in the p reced ing paper , a s impler represen ta t ion is possible for H(s). In the me thod I and I I exper iments , the t ime-course o f Po2 at the muscle surface becomes monoexponen t i a l , with rate constant k = rr2D/4l 2. H(s) can thus be expressed as:
s e c h ( 1 . 5 7 1 x / ~ ) - 1 H(s) = (6)
OlS
Eq. 6 appea r s p re fe rab le to Eq. 2 for two reasons. First, it is potentially more accurate , because it involves one less measu red pa rame te r ; moreove r , k can usually be measured with excellent accuracy, especially with me thod I I (cf. Fig. 5 o f Mahler , 1978b). Second, if Eq. 6 is used, the exper imen ta l p rocedu re for measu r ing A Q(t) can be simplified considerably, because the muscle thickness I need not be measu red (cf. Methods).
A P P E N D I X I
Derivat ion of Eqs. 2 and 3
The one-dimensional diffusion equation.
02P OP Dol ~ ( x , t) -- a ~ ( x , t) = Q(t), (1.1 a)
has the form of a system diferential equation, for which Q(t) is the input, and P(x, t) is the output. For the conditions of the present experiments, the initial and boundary conditions on P(x, t) are:
Q0 P(x, 0) = P0 - 2~a(/~ - xZ); (1.2a)
P(l, t) = P0; (l.3a)
and
~--(0, p t) = 0; 0 . 4 a ) i~x

576 T H E J O U R N A L O F G E N E R A L P H Y S I O L O G Y �9 V O L U M E 71 �9 1 9 7 8
where P0 denotes the Po2 of the chamber gas. Q0 is the basal rate of oxygen consumpt ion . and l is the muscle thickness. For a change in Q(t) f rom Q0, deno ted AQ(t), the co r r e s p o n d i n g forced o u t p u t is A P ( x , t), where:
AQ(t) = Q(t) - Qo, ( l .5a)
and
A P ( x , t) = P(x , t) - P(x , 0). ( l .6a)
Th e purpose of this A p p e n d i x is to derive the t ransfer funct ion of this system for the case x = O, i.e., to evaluate the funct ion:
Ap(0, t)](s) H(s) - .~[ AQ(t)](s) " (1.7a)
This analysis can be simplified by sett ingQ0 = 0 = P0. These condi t ions do not alter the form of H(s), but allow Eqs. 1.2a , 1.3a, 1.Sa, and 1.6a to be rewri t ten:
P(x, 0) = 0; (1.8a)
P(I, t) = O; (1.9a)
AQ(t) = Q(t); (1.10a)
and
A P ( x , t) = P(x , t). (1.11a)
It will be shown below that the explicit form of Eq. 1.7a is:
s e c h ( l x / J / O ) - 1 H(s) = (1.12 a)
m
This equat ion is der ived below by first tak ing the Laplace t ransf i ) rm of Eq. 1.1 a with respect to t, t hen solving the resul t ing o rd inary different ial equat ion in x.
T h e Laplace t r ans fo rm with respect to t o f Eq. 1.1 a is:
02p D a ~ ( x , s) - o~P(x, s) = Q.(s), (1.13a)
where P(x, s) denotes .~[P(x, t)](s) , and (~(s), .~[Q(t)](s) . Eq. 1.13a is an ordinary differential equat ion in x , which fi)r the sake of simplification can be writ ten as:
d2y k2y = /3, 1.14a) dx 2
where
an d
y(x) = p ( x , s);
k 2 = s / D ;
1.15a)
1.16a)
/3 = O,(s)/Dc~. (1.17a)
On e way to solve Eq. 1.14a is to take its Laplace t ransf iwm with respect tox. which yields:
u2.~(u) - k2~(u) = -# + /z .y(0) + y'(0), (1.18a)

MAHLER Kinetics of Oz Consumption in Stimulated Frog Sartorins 577
where37(u) denotes LP[y(x)](u). T h e b o u n d a r y condi t ion Eq. 1.4a on P(x, t) can be used to show thaty ' (0) = 0, as follows:
y(x) = ~ P ( x , t)](s); (1.19 a)
d {Jct[P(x, t)](s)} = ~ t [ OP (x, t)](s); (1.20 a) y'(x) = (x) = ~x L Ox
y' (0) = ,5~t[ OP (0, ,)l ($) = t0](s) = 0 (1.21 a) k Ox J
It thus follows f rom Eq. 1.18a that:
y(u) - / 3 +/x2y(0) (1.22a) (/z* - kS)it
A B C - + + (1.23a)
Evaluat ing the partial fract ions in Eq. 1.23a gives:
A = 2 ~ + y(0).2, (1.24a)
B = A; (1.25a)
C = - O / k S. (1.26a)
T h e solution o f Eq 1.14a is thus:
y(x) = A(e -Ax + e -hx) + C+ (1.27a)
[/3 1 (e-~X + e+kX) /3 (1.28a) = ~ + y(0) 2 k 2'
= y(0)-cosh(kx) + ~ [cosh(kx) - 1]. (1.29a)
Using Eqs. 1.16a and 1.17a,
y(x) = y ( 0 ) . c o s h ( x X / ~ ) + t ~ ( s ) [ c o s h ( x X / ~ ) - 1]. (1.30a) o r s
T h e object o f this der ivat ion is to express /6(0, s), or y(O), in te rms o f 12(s). Th is can be done by evaluat ing Eq. 1.30a at x = l. F rom b o u n d a r y condi t ion Eq. 1.10a we have:
y(l) = P(l, s) = ~[P(l , t)](s) = 0. (1.31 a)
On the o the r hand, Eq. 1.30a implies that:
y(/) = y(0) .cosh(l s V ~ ) + l~(s) [cosh(/X/sVsVsV~) - 1]. (1.32a) o r s
It follows that:
y(0) I~(s) [ 1 - c o s h ( l X / s / D ) ] = as c-osh(~-sX/~ / ; (1.33a)
_ t ~ ( s ) [ s e c h ( / x / ~ ) - 1], (1.34a) o r s
578 T H E J O U R N A L OF G E N E R A L P H Y S I O L O G Y " V O L U M E 71 �9 1 9 7 8
which is equivalent to Eq. 1.12a and to text Eq. 2. Tex t Eq. 3 follows f rom Eq. 1.7a. For any funct ion f(t), de f ined for 0 -< t < ~, if one
formal ly de f ines f ( t ) = 0 for 0o < t < 0, it follows f rom the def ini t ions o f the Laplace and Four ie r t r ans fo rms that:
~[f(t)](~o) = ~[/(t)](jco). (1.35a)
T h e r e f o r e , it follows f rom Eqs. 1.7a and 1.35a that:
~:[A P(O, t)](cn) H0"co) - ( 1.36 a)
~[A Q(t)](co) '
which implies that:
~[A Q(t)](co) - ~[A P(0, t)](oJ) (1.37 a) H(flo)
T a k i n g the inverse Four i e r t r ans fo rm of Eq. 1.37a yields text Eq. 3.
A P P E N D I X I I
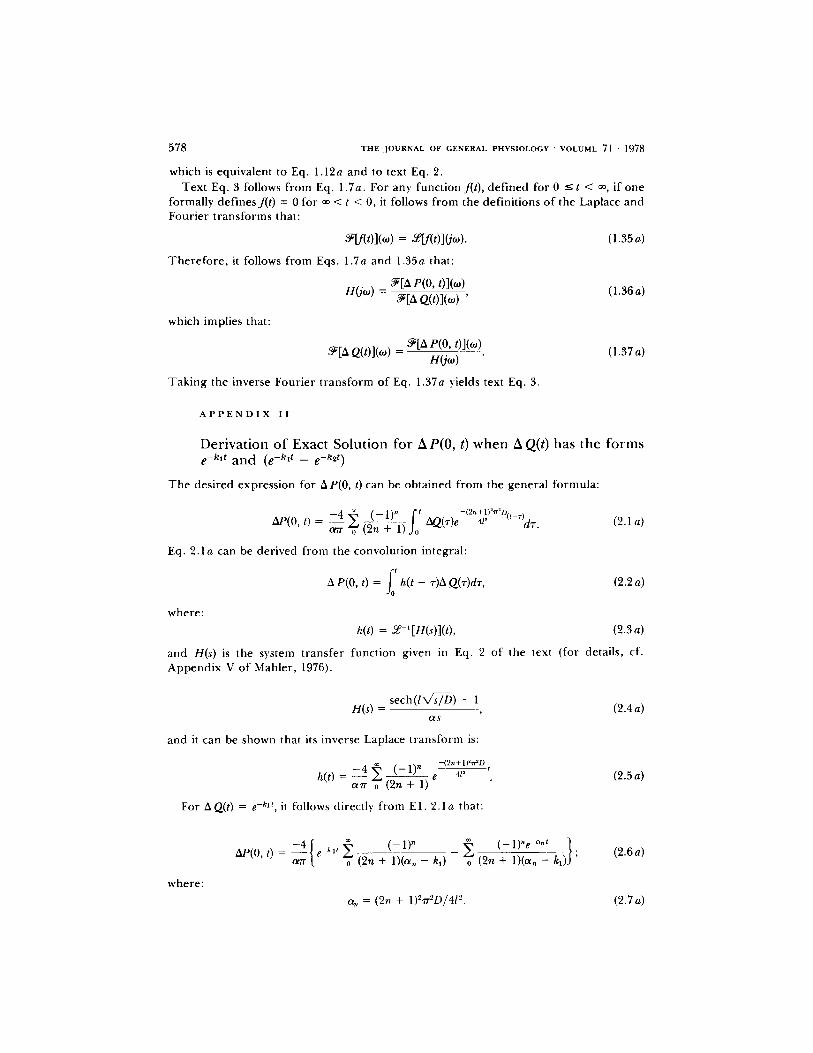
Derivation o f Exact Solution for A P(O, t) when A Q(t) has the forms e -k ' t and (e -kx t - e -k2 t )
The des i red express ion for AP(0, t) can be ob ta ined f rom the genera l fo rmula :
A P ( ( ) , t ) = - 4 s ( -1 )" f( ' -(2"+l)2"2D~t T, 0 (2n + 1) ) ~ (~ ' ) e 4~ " - "d~-.
Eq. 2.1a can be der ived f rom the convolut ion integral :
A P(O, t) = h(t - r)A Q(z)dr,
where:
(2.1 a)
(2.2 a)
h(t) = s l[H(s)](t), (2.3a)
and H(s) is the system t rans fe r function given in Eq. 2 of the text (for detai ls , cf. A p p e n d i x V of Mahler , 1976).
s e c h ( / k / ~ ) - 1 H(s) = , (2.4 a)
OL$
and it can be shown that its inverse Laplace t r ans fo rm is:
where:
- ( 2 n + l)m~/aD
h(t) = - 4 o~ ( -1 ) " 4t ~ .t a-~ (2n + 1~ e (2.5a)
For A Q.(t) = e -kit, it follows direct ly f rom E l . 2 .1a that:
~u~ t ) = e-k1' ~~ (2n + 0 1)(OZn-k0 0 ( 2 n + I ) ~ - Z kl ) ; (2.6a)
a,, = (2n + 1)27r2D/412. (2.7a)
MAHLER Kinetics of 02 Consumption in Stimulated Frog Sartorius 579
For ~Q(t) = e -~'lt - e -k2t, evaluating Eq. 2.1a gives:
AP(0, t ) = - 4 { ~ ~ ( - I ) he-kIt ~ ( -1 ) ne-~"t a--~ (2n + ~ ~ k,) - 0 (2n + 1)(a, - k0 (2.8 a)
(_ 1),,e-k 2t ~ (_ l),e-,~t
- + 0 E ( 2 . + - k , ) j
To obtain curves c and d in Fig. 6, computer programs were written to evaluate Eqs. 2.6a and 2.8a.
I would like to thank Ivan Whitehorn, Nick Ricchiuti, and Bernard Tai for technical help, Robert Eisenberg, Arthur Peskoff, and Richard Mathias for stimulating discussions on mathematical matters, Chris Clausen for invaluable advice on APL programming, and Earl Homsher and Charles Kean for general discussions. This work was supported by training grant HL-05696 and Program Project grant HL-11351 from the U. S. Public Health Service.
Received for publication 18 January 1978.
R E F E R E N C E S
BASKIN, R. J., and S. GAFFIN. 1965. Oxygen consumption in frog sartorius muscle. I. The isometric twitch. J. Cell. Comp. Physiol. 65:19-26.
BERG, W. E. 1947. Individual differences in respiratory gas exchange dur ing recovery from moderate exercise. Am. J. Physiol. 149:597-610.
BRIGHAM, E. O. 1974. The Fast Fourier Transform. Prentice-Hall, Inc., Englewood Cliffs, N.J . 91-109, 124-125,132-137.
BROWN, K. M., and J. E. DENNXS, JR. 1970. Derivative free analogues of the Levenberg- Marquardt and Gauss algorithms for nonlinear least squares approximation. IBM Philadelphia Scientific Center Technical Report No. 320-2994, August, 1970.
CASABURI, R., B. J. WHIPP, K. WASSERMAN, W. L. BEAVER, and S. N. KOYAL. 1977. Ventilator)' and gas exchange dynamics in response to sinusoidal work.J. Appl. Physiol. 42:300-311.
CHANCE, B., G. MAVRIELLO, and X. AUBERT. 1962. ADP arrival at muscle mitochondria following a twitch. In Muscle as a Tissue. K. Rodahl and S. M. Horvath, editors. McGraw-Hill Book Company, New York. 128-145.
CONNELLY, C. M., D. W. BRONK, and F. BRINK. 1953. A sensitive respirometer for the measurement of rapid changes in metabolism of oxygen. Rev. Sci. Instrum. 24:683-695.
FzNN, W. O. 1927. The gas exchange of isolated muscles dur ing stimulation and recover)'. Am. J. Physiol. 83:309-322.
GEMMILL, C. L. 1936. The respirator)' metabolism of stimulated frog's muscle. Am. J. Physiol. 115:371-375.
GODFRAINI)-DrBEcKER, A. 1972. Heat production and fluorescence changes of toad sartorius muscle dur ing aerobic recover)' after a short tetanus. J. Physiol. (Lond.). 225:719-734.
GODFRAIND-DEBECKER, A. 1973. La restauration post-t~tanique du muscle stri~ thermo- g~n~se et fluorescence. Vander, Louvain, Belgium. 55-58.
GORE, R. W., and W. J. WHALEN. 1968. Relations among tissue Po2, Qo2, and resting heat production of frog sartorius muscle. Am. J. Physiol. 214:277-286.
HARTREE, W., and A. V. HILL. 1922. The recover)' heat production of muscle.J. Physiol. (Lond. ). 56:367-381.
5 8 0 THE ,JOURNAL OF GENERAL PHYSIOLOGY �9 VOLUME 71 �9 1978
HILL, A. V. 1949. Myothermic methods. Proc. R. Soc. Set. B Biol. Sci. 136:228-241. H I L L , A. V. 1966. Trails and Trials in Physiolog3'. The Williams & Wilkins Company,
Baltimore. 189-207, 211,304-330. HILL, D. K. 1940a. The time course of the oxygen consumption of stimulated frog's
muscle. J. Physiol. (Lond. ). 98:207-227. HILL, D. K. 1940b. The time course of evolution of oxidative recovery heat of frog's
muscle. J. Physiol. (Lond. ). 98,454-459. HILL, D. K. 1948. Oxygen tension and the respiration of resting frog's muscle.J . Physiol.
(Lond. ). 107:479-495. JAcoBus, W. E., and A. L. LrHNISGEa. 1973. Creatine kinase of rat heart mitochondria .
Coupling of creatine phosphorylat ion to electron transport . J. Biol. Chem. 248:4803- 4810.
J6nsIs, F. F. 1964. Basic processes in cellular respiration. Hand. Physiol. 1:(Sect. 3. Respiration) 63-124.
J6BsIs, F. F., and J. C. DVFFIELD. 1967. Oxidative and glycolytic recovery metabolism in muscle. Fluorometric observations on their relative contributions. J. Gen. Physiol. 50:1009-1047.
KAWASHIRO, T. , W. NVSSE, and P. SC~mD. 1975. Determination of diffusivity of oxygen and carbon dioxide in respir ing tissue: results in rat skeletal muscle. Pfluegers Arch. Eur.J. Physiol. $59:231-251.
KVSHMm~ICK, M. J . , and R. J. PAVL. 1976. Aerobic recovery metabolism following a single isometric tetanus in frog sartorius muscle at 0~ Physiol. (Lond.). 254:693-709.
MAHLEn, M. 1976. Initial creatine phosphate breakdown and kinetics of recovery oxygen consumption for single isometric tetani of the frog sartorius muscle at 20~ Ph.D. Dissertation. University of California at Los Angeles.
MAHLER, M. 1978a. A comparison of methods for comput ing time-variant input to a biological system when output and transfer function are known. Submitted for publication.
MAHLER, M. 1978b. Diffusion and consumption of oxygen in the resting frog sartorius muscle .J . Gen. Physiol. 71:533-557.
MAHLER, M. 1978c. The relationship between initial creatine phosphate breakdown and recovery oxygen consumption for a single isometric tetanus of the frog sartorius muscle at 20~ Submitted for publication.
MILSUM, J. H. 1966. Biological Control Systems Analysis. McGraw Hill Book Company, New York.
OWEN, C. S., and D. F. WILSON. 1974. Control of respiration by the mitochondrial phosphorylat ion state. Arch. Biochem. Biophys. 161:581-591.
PIIPER, J., P. E. DIPRAMPERO, and P. CERRETELLI. 1968. Oxygen debt and high energy phosphates in gastrocnemius muscle of the dog. Am. J. Physiol. 215:523-531.
RIGGS, D. S. 1970. Control Theory and Physiological Feedback Mechanisms. The Williams & Wilkins Company, Baltimore. 91-112.
SAKS, V. A., G. B. CHERNOUSOVA, IV. I. VORONKOV, V. N. SMIRNOV, and E. I. CHAZOV. 1974. Study of energy t ransport mechanism in myocardial cells. Circ. Res. 34-35(Suppl. 3):138-148.
SAKS, V. A., N. V. LIPINA, V. N. SMIRNOV, and E. I. CHASOV. 1976. Studies of energy t ransport in heart cells. The functional coupling between mitochondrial creatine phosphokinase and ATP-ADP translocase: kinetic evidence. Arch. Biochem. Biophys. 173:34-41.