kinetics of tn5 transposition
TRANSCRIPT
Gene, 32 (1984) 91-98
Elsevier
GENE 1139
91
Kinetics of Tn5 transposition
(Phage A; transposase; maxicells; c1 repressor; neomycin phosphotransferase; kanamycin resistance)
Osvaldo L. Rossetti *, Ronni Altman * and Ry Young
Department of Medical Biochemistry, Texas A&M University, College Station. TX 77843-l 1 I2 (U.S.A.) Tei. (409) 845-2087
(Received February 8th, 1984)
(Revision received May lOth, 1984)
(Accepted June 30th, 1984)
SUMMARY
The kinetics of Tn5 transposition and gene expression were studied. For about 2 h after infection with ATn5, Tn5 transpositions accumulate, reaching a level of about 1.5 % of the infected cells. After 2 h transposition is essentially turned off. In cells carrying a resident Tn5, transposition is undetectable after infection. The synthesis of the TnS-specific proteins ~58 and ~54 and the k~~ycin-resist~ce protein were studied in pre-irradiated cells infected with ATn5. The synthesis of ~58 and ~54 peaked early after infection and was significantly reduced, relative to pneo, by 2 h after infection. Moreover, ~54 appeared to reach a maximum later than ~58. These kinetic data put new constraints on models for the regulation of Tn5 transposition.
INTRODUCTION
The regulation of transposition of the Km’ element Tn5 has been extensively studied (Berg, 1977; Berg et al., 1981; 1982; Biekand Roth, 1981; Isberg et al., 1982; Johnson et al., 1982). Tn5 transposes much
*Present addresses: (O.L.R.) INTA - Departamento de Virolo-
gia, 1712~Castelar, Buenos Aires (Argentina) Tel. 54-l-90-1641;
(R.A.) Department of Biology, California Institute of Technol-
ogy, Pasadena, CA 91125 (U.S.A.) Tel. (213)356-4923.
Abbreviations: Ap, ampicillin; bp, base pairs; IS, insertion
sequence; Km, kanamycin; LB, Luria broth, see MATERIALS
AND METHODS, section b; m.o.i., muItiplicity ofinfection; p58
and p54,58- and 54-kDaI polypeptides; r (superscript), resistant;
SDS, sodium dodecyl sulfate; Tc, tetracycline; Tn, transposon;
TyM, see MATERIALS AND METHODS, section b; [ 1,
indicates plasmid-carrier state; : :, novel joint.
0378-l 119~84/$03.00 0 1984 Elsevier Science Publishers
less frequently in cells already carrying the right arm of the transposon, the insertion sequence ISSOR, which encodes the polypeptides ~58 and p54 (Biek and Roth, 1980; Rothstein and Reznikoff, 1981; Isberg et al., 1982; Johnson et al., 1982). This regu- lation does not affect the expression of fusion genes consisting of the amino-terminal sequences of ~58 and p54 and the carboxy-terminal sequences of gene IucZ(Isberget al., 1982; Johnson et al., 1982). Lack- ing an effect at the level of gene expression, several investigators have concluded that Tn5 transposition is regulated at the level of protein function, presum- ably by inhibition of the putative transposase activity (Isberg et al., 1982; Johnson et al., 1982).
There have been almost no data concerning the kinetics of this phenomenon, either the kinetics by which transposition events accumulate when Tn5 is introduced into a cell, or the kinetics of gene
92
expression for the ~58 and ~54 reading frame. In this work we describe the time-course of transposition after a cell is infected with a bacteriophage lambda carrying Tn5. Also, in a strain constructed to allow suppression of both host and bacteriophage genes, the labeling kinetics of the main Tn5 gene products are determined. The results are discussed in terms of current models for Tn5 regulation.
MATERIALS AND METHODS
(a) Enzymes
Restriction enzymes, T4 DNA polymerase, and T4 DNA ligase were purchased from Bethesda Research Laboratories. Lysozyme was obtained from Sigma.
(b) Growth media
TyM is LB medium (10 g tryptone, 5 g yeast extract, 5 g NaCl per liter) supplemented with 0.2% maltose. LB-Ap, LB-Tc, and LB-Km are plating media containing 1.5% agar and 50 pg Ap/ml, 10 pg Tc/ml, or 50 pg Km/ml. Minimal medium M9 was described by Miller (1972).
(c) Bacterial and bacteriophage strains
The Escherichiu coli K-12 strains and the bacterio- phage strains used in this study are listed in Table I. The vector for Tn5 transposition is JJ7221 Tn5 ~1857 described previously by Berg (1977). The b221 de- letion spans the 1 att int xis region and thus prevents integrative recombination (see Davidson and Szy- balski, 1971). This insertion is the kanl insertion which has been localized to bp 34 224 on the 2 linear map by heteroduplex analysis (see Daniels et al., 1983). In our hands, restriction enzyme analysis of DNA prepared from small single plaque lysates suggests that the insertion is at bp 34 000-34 100, in or near the genes rul and ~111 and oriented such that ISSOL is nearest the pi_ promoter (not shown). The small discrepancy between the published insertion site and the site deduced from the restriction analysis was not investigated further, since it is immaterial to the conclusions drawn here. DNA prepared from some bulk lysates showed a variable proportion of molecules in which the orientation of the Tn5 element had been reversed (not shown), probably due to homology-dependent intramolecular recombination between the ISSOL and ISSOR inverted repeats.
The plasmid pOR19 was constructed by cutting pBR322 with EcoRI, filling in the staggered ends using T4 DNA polymerase, and resealing with T4 DNA ligase, thus eliminating the EcoRI site. The plasmid pKB252 was constructed by Backman et al. (1976) and provided by R. Isberg.
TABLE I
E. co/i strains and bacteriophages
Laboratory designation Original designation Genotype Source
E. coli strains
Ymel
RY1113
RY1160
RY1635
RY 1906
RY1907
RY 1908
RY1909
Ymel
MM294
GM119
XK1890
RY1160[pOR19]
RY1635 [pKB252]
RY1906::TnS
SE5000
pro phe supF
endA hsdR hsdM pro supE
dam cmb metBl galK2 galT22 lacy1
ISX- 18 supE
uvrA gal lea ile val pro
amp tet
tei
amp recA A lac rpsL
Laboratory stock
Laboratory stock
Laboratory stock
Laboratory stock
This study
This study
This study
Scott Emr (unpublished)
Phage
ti22 1 Tn5
ti221
&an1 a221 Tn5 ~1857
llb221cI857
Berg (1977)
Laboratory stock
93
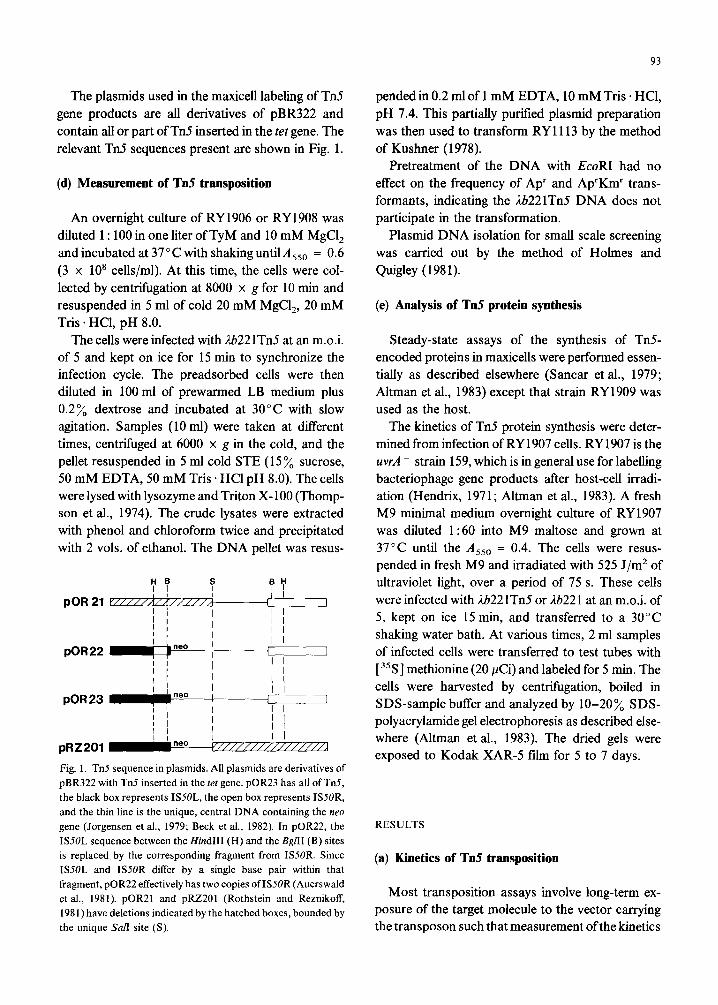
The plasmids used in the maxicell labeling of Tn5 gene products are all derivatives of pBR322 and contain all or part of Tn5 inserted in the tet gene. The relevant Tn5 sequences present are shown in Fig. 1.
(d) Measurement of Tn5 transposition
An overnight culture of RY 1906 or RY 1908 was diluted 1: 100 in one liter of TyM and 10 mM MgCl, and incubated at 37°C with shaking until&, = 0.6 (3 x lo8 cells/ml). At this time, the cells were col- lected by centrifugation at 8000 x g for 10 min and resuspended in 5 ml of cold 20 mM MgCl,, 20 mM Tris * HCI, pH 8.0.
The cells were infected with Ab221Tn5 at an m.o.i. of 5 and kept on ice for 15 min to synchronize the infection cycle. The preadsorbed cells were then diluted in 100 ml of prewarmed LB medium plus 0.2% dextrose and incubated at 30°C with slow agitation. Samples (10 ml) were taken at different times, centrifuged at 6000 x g in the cold, and the pellet resuspended in 5 ml cold STE (15% sucrose, 50 mM EDTA, 50 mM Tris * HCl pH 8.0). The cells were lysed with lysozyme and Triton X-100 (Thomp- son et al., 1974). The crude lysates were extracted with phenol and chloroform twice and precipitated with 2 ~01s. of ethanol. The DNA pellet was resus-
I 1 pOR22 1
I I I I I I I
I I I 1 I I
pOR23 -1_ nao , I I I
I j I I I
I I I I I I
1 I I I I nao pRZ201 :
Fig. 1. Tn5 sequence in plasmids. All plasmids are derivatives of
pBR322 with Tn5 inserted in the ret gene. pOR23 has all of Tn5,
the black box represents ISSOL, the open box represents ISSOR,
and the thin line is the unique, central DNA containing the neo
gene (Jorgensen et al., 1979; Beck et al., 1982). In pOR22, the
ISSOL sequence between the Hind111 (H) and the BgflI (B) sites
is replaced by the corresponding fragment from ISSOR. Since
ISSOL and ISSOR differ by a single base pair within that
fragment, pOR22 effectively has two copies ofIS5OR (Auerswald
et al., 1981). pOR21 and pRZ201 (Rothstein and Reznikoff,
1981) have deletions indicated by the hatched boxes, bounded by
the unique &z/I site (S).
pended in 0.2 ml of 1 mM EDTA, 10 mM Tris . HCl, pH 7.4. This partiahy purified plasmid preparation was then used to transform RY 1113 by the method of Kushner (1978).
Pretreatment of the DNA with EcoRI had no effect on the frequency of Ap’ and Ap’Km’ trans- formants, indicating the Ab221Tn5 DNA does not participate in the transformation.
Plasmid DNA isolation for small scale screening was carried out by the method of Holmes and Quigley (1981).
(e) Analysis of Tn5 protein synthesis
Steady-state assays of the synthesis of TnS- encoded proteins in maxicells were performed essen- tially as described elsewhere (Sancar et al., 1979; Altman et al., 1983) except that strain RY1909 was used as the host.
The kinetics of Tn5 protein synthesis were deter- mined from infection of RY 1907 cells. RY 1907 is the uvrA - strain 159, which is in general use for labelling bacteriophage gene products after host-cell irradi- ation (Hendrix, 1971; Altman et al., 1983). A fresh M9 minimal medium overnight culture of RY1907 was diluted 1: 60 into M9 maltose and grown at 37°C until the Asso = 0.4. The cells were resus- pended in fresh M9 and irradiated with 525 J/m* of ultraviolet light, over a period of 75 s. These cells
were infected with Ab221Tn5 or lb221 at an m.o.i. of 5, kept on ice 15 min, and transferred to a 30°C shaking water bath. At various times, 2 ml samples of infected cells were transferred to test tubes with [ 35S] methionine (20 &i) and labeled for 5 min. The cells were harvested by centrifugation, boiled in SDS-sample buffer and analyzed by 10-20x SDS- polyacrylamide gel electrophoresis as described else- where (Altman et al., 1983). The dried gels were exposed to Kodak XAR-5 film for 5 to 7 days.
RESULTS
(a) Kinetics of Tn5 transposition
Most transposition assays involve long-term ex- posure of the target molecule to the vector carrying the transposon such that measurement ofthe kinetics
94
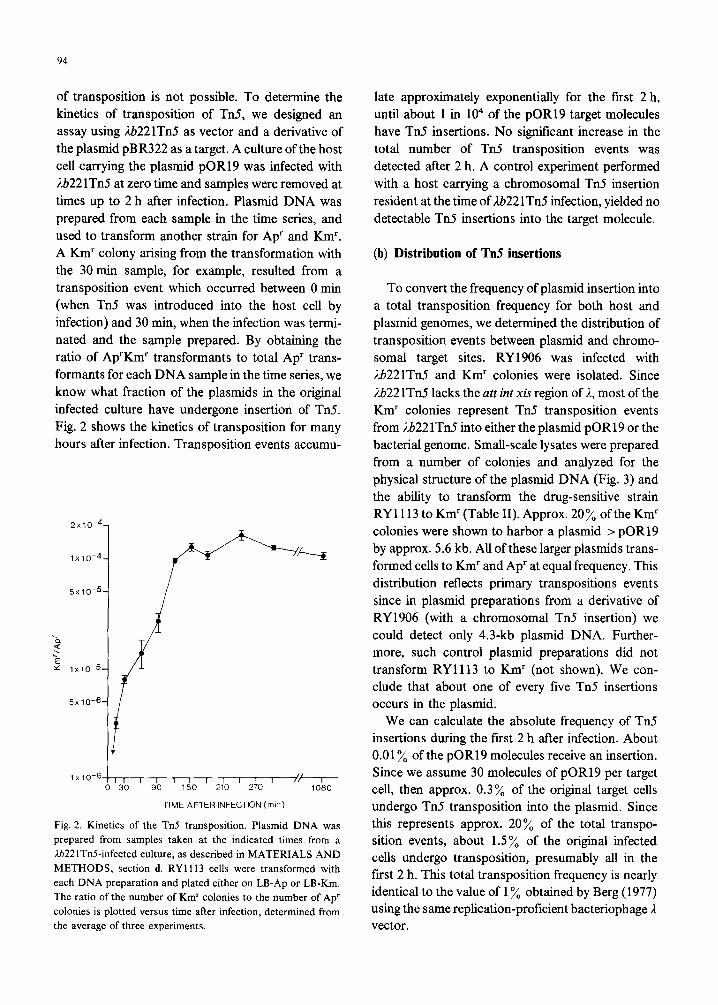
of transposition is not possible. To determine the kinetics of transposition of Tn5, we designed an assay using Lb221TnS as vector and a derivative of the plasmid pBR322 as a target. A culture of the host cell carrying the plasmid pOR19 was infected with lb22 lTn5 at zero time and samples were removed at times up to 2 h after infection. Plasmid DNA was prepared from each sample in the time series, and used to transform another strain for Ap’ and Km’. A Km’ colony arising from the transformation with the 30 min sample, for example, resulted from a transposition event which occurred between 0 min (when Tn5 was introduced into the host cell by infection) and 30 min, when the infection was termi- nated and the sample prepared. By obtaining the ratio of Ap’Km’ transformants to total Ap’ trans- formants for each DNA sample in the time series, we know what fraction of the plasmids in the original infected culture have undergone insertion of Tn5. Fig. 2 shows the kinetics of transposition for many hours after infection. Transposition events accumu-
2x10⁻⁴-
1x10⁻⁴-
5x 10⁻⁵-
>
‘E y 1x10⁻⁵-
i
l@jllil TIME AFTER INFECTION (min)
Fig. 2. Kinetics of the Tn5 transposition. Plasmid DNA was
prepared from samples taken at the indicated times from a
ti221TnCinfected culture, as described in MATERIALS AND
METHODS, section d. RYll13 cells were transformed with
each DNA preparation and plated either on LB-Ap or LB-Km.
The ratio of the number of Km’ colonies to the number of Ap’
colonies is plotted versus time after infection, determined from
the average of three experiments.
late approximately exponentially for the first 2 h, until about 1 in lo4 of the pOR19 target molecules have Tn5 insertions. No significant increase in the total number of Tn5 transposition events was detected after 2 h. A control experiment performed with a host carrying a chromosomal Tn5 insertion resident at the time of Lb22 lTn5 infection, yielded no detectable Tn5 insertions into the target molecule.
(b) Distribution of Tn5 insertions
To convert the frequency of plasmid insertion into a total transposition frequency for both host and plasmid genomes, we determined the distribution of transposition events between plasmid and chromo- somal target sites. RY1906 was infected with Ab221Tn5 and Km’ colonies were isolated. Since
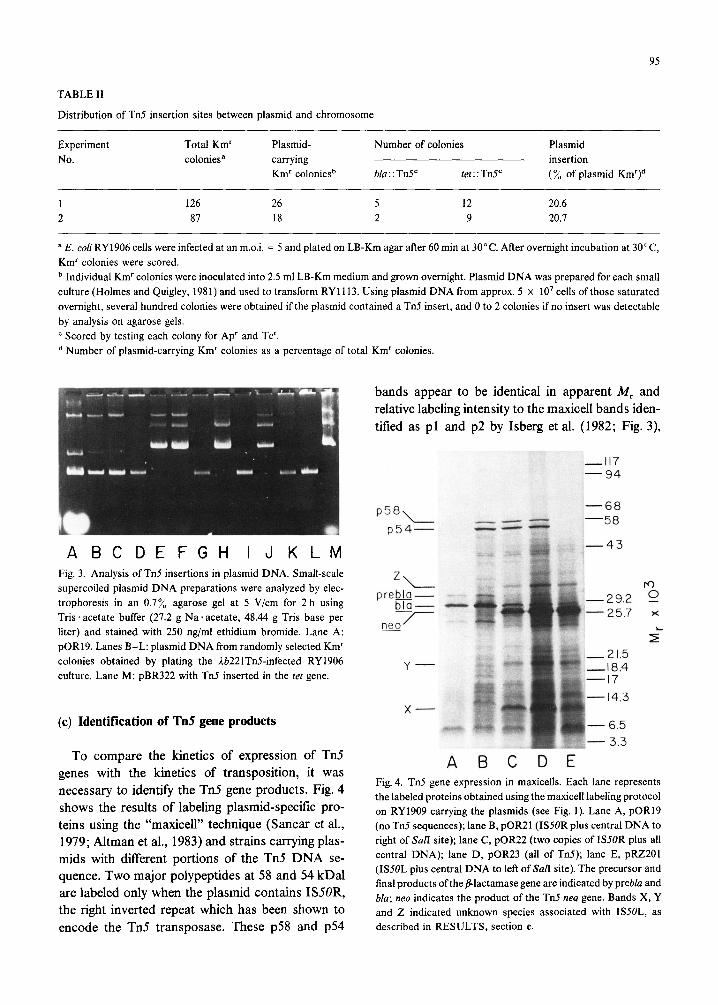
Ab22 lTn5 lacks the aft int xis region of I, most of the Km’ colonies represent Tn5 transposition events from Lb221Tn5 into either the plasmid pOR19 or the bacterial genome. Small-scale lysates were prepared from a number of colonies and analyzed for the physical structure of the plasmid DNA (Fig. 3) and the ability to transform the drug-sensitive strain RY 1113 to Km’ (Table II). Approx. 20% of the Km’ colonies were shown to harbor a plasmid > pOR19 by approx. 5.6 kb. All of these larger plasmids trans- formed cells to Km’ and Ap’ at equal frequency. This distribution reflects primary transpositions events since in plasmid preparations from a derivative of RY1906 (with a chromosomal Tn5 insertion) we could detect only 4.3-kb plasmid DNA. Further- more, such control plasmid preparations did not transform RY 1113 to Km’ (not shown). We con- clude that about one of every live Tn5 insertions occurs in the plasmid.
We can calculate the absolute frequency of Tn5 insertions during the first 2 h after infection. About 0.01% of the pOR19 molecules receive an insertion. Since we assume 30 molecules of pOR19 per target cell, then approx. 0.3% of the original target cells undergo Tn5 transposition into the plasmid. Since this represents approx. 20% of the total transpo- sition events, about 1.5% of the original infected cells undergo transposition, presumably all in the first 2 h. This total transposition frequency is nearly identical to the value of 1% obtained by Berg (1977) using the same replication-proficient bacteriophage A vector.
95
TABLE II
Distribution of Tn5 insertion sites between plasmid and chromosome
Experiment Total Km’
No. colonies” Plasmid- carrying Km’ colonies”
Number of colonies
bla : : Tn5” ret : : Tn5’
Plasmid insertion (% of plasmid Km’)d
1 126 26 5 12 20.6
2 87 18 2 9 20.7
a E. coli RY 1906 cells were infected at an m.o.i. = 5 and plated on LB-Km agar after 60 min at 30°C. After overnight incubation at 3O”C, Km’ colonies were scored. b Individual Km’colonies were inoculated into 2.5 ml LB-Km medium and grown overnight. Plasmid DNA was prepared for each small culture (Holmes and Quigley, 1981) and used to transform RYll13. Using plasmid DNA from approx. 5 x 10’ cells of those saturated overnight, several hundred colonies were obtained if the plasmid contained a Tn5 insert, and 0 to 2 colonies if no insert was detectable
by analysis on agarose gels. c Scored by testing each colony for Ap’ and Tc’. d Number of plasmid-carrying Km’ colonies as a percentage of total Km’ colonies.
ABCDEFGH IJKLM Fig. 3. Analysis of Tn5 insertions in plasmid DNA. Small-scale supercoiled plasmid DNA preparations were analyzed by elec- trophoresis in an 0.7% agarose gel at 5 V/cm for 2 h using Tris . acetate buffer (27.2 g Na acetate, 48.44 g Tris base per liter) and stained with 250 ng/ml ethidium bromide. Lane A: pOR19. Lanes B-L: plasmid DNA from randomly selected Km’ colonies obtained by plating the Lb221TGinfected RY1906 culture. Lane M: pBR322 with Tn5 inserted in the tet gene.
(c) Identification of Tn5 gene products
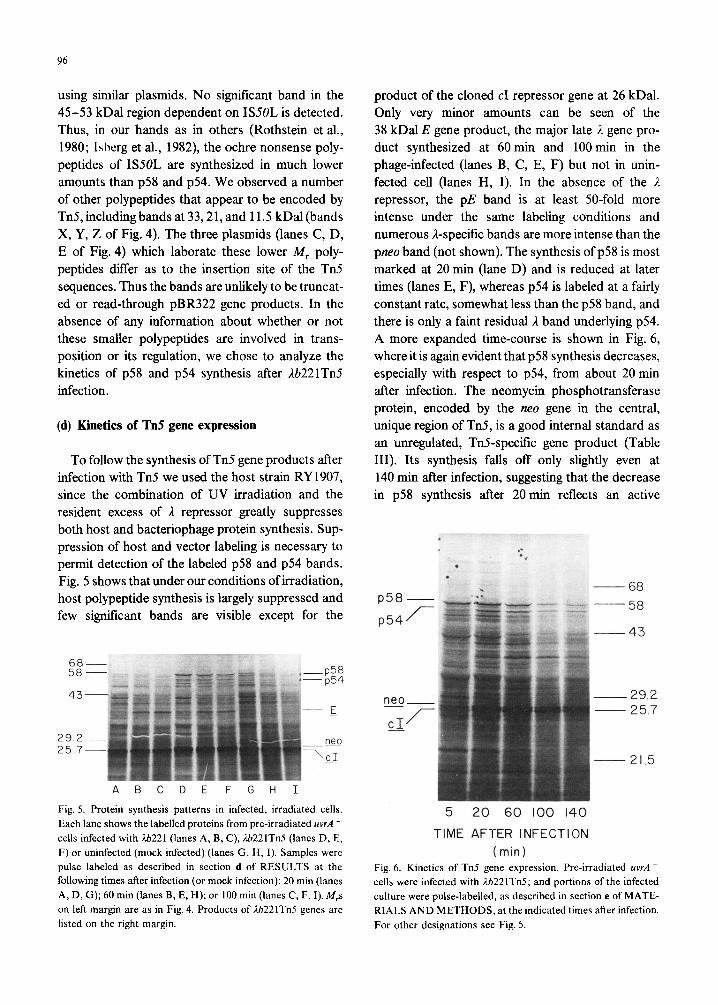
To compare the kinetics of expression of Tn5 genes with the kinetics of transposition, it was necessary to identify the Tn5 gene products. Fig. 4 shows the results of labeling plasmid-specific pro- teins using the “maxicell” technique (Sancar et al., 1979; Altman et al., 1983) and strains carrying plas- mids with different portions of the Tn5 DNA se- quence. Two major polypeptides at 58 and 54 kDal are labeled only when the plasmid contains ISSOR, the right inverted repeat which has been shown to encode the Tn5 transposase. These ~58 and p54
bands appear to be identical in apparent M, and relative labeling intensity to the maxicell bands iden- tified as pl and p2 by Isberg et al. (1982; Fig. 3)
~58~ D54-
zL web&---
ne7 -
-117 -94
-68
2 1.5 e-18.4 i-17 -14.3
- 6.5 - 3.3
m 0 - X
r’
A I3 C D E Fig. 4. Tn5 gene expression in maxicells. Each lane represents the labeled proteins obtained using the maxicell labeling protocol on RY1909 carrying the plasmids (see Fig. I). Lane A, pOR19 (no Tn5 sequences); lane B, pOR21 (ISSOR plus central DNA to right of &r/I site); lane C, pOR22 (two copies of IS50R plus all central DNA); lane D, pOR23 (all of Tti); lane E, pRZ201 (ISSOL plus central DNA to left of SalI site). The precursor and final products ofthe /l-lactamase gene are indicated by prebla and bla; neo indicates the product of the Tn.5 neo gene. Bands X, Y and 2 indicated unknown species associated with ISSOL, as described in RESULTS, section c.
96
using similar plasmids. No significant band in the 45-53 kDal region dependent on ISSOL is detected. Thus, in our hands as in others (Rothstein et al., 1980; Ihberg et al., 1982), the ochre nonsense poly- peptides of ISSOL are synthesized in much lower amounts than ~58 and ~54. We observed a number of other polypeptides that appear to be encoded by Tn5, including bands at 33,21, and 11.5 kDa1 (bands X, Y, Z of Fig. 4). The three plasmids (lanes C, D, E of Fig. 4) which laborate these lower M, poly- peptides differ as to the insertion site of the Tn.5 sequences. Thus the bands are unlikely to be truncat- ed or read-through pBR322 gene products. In the absence of any information about whether or not these smaller polypeptides are involved in trans- position or its regulation, we chose to analyze the kinetics of ~58 and ~54 synthesis after %221Tn5 infection.
(d) Kinetics of Tn5 gene expression
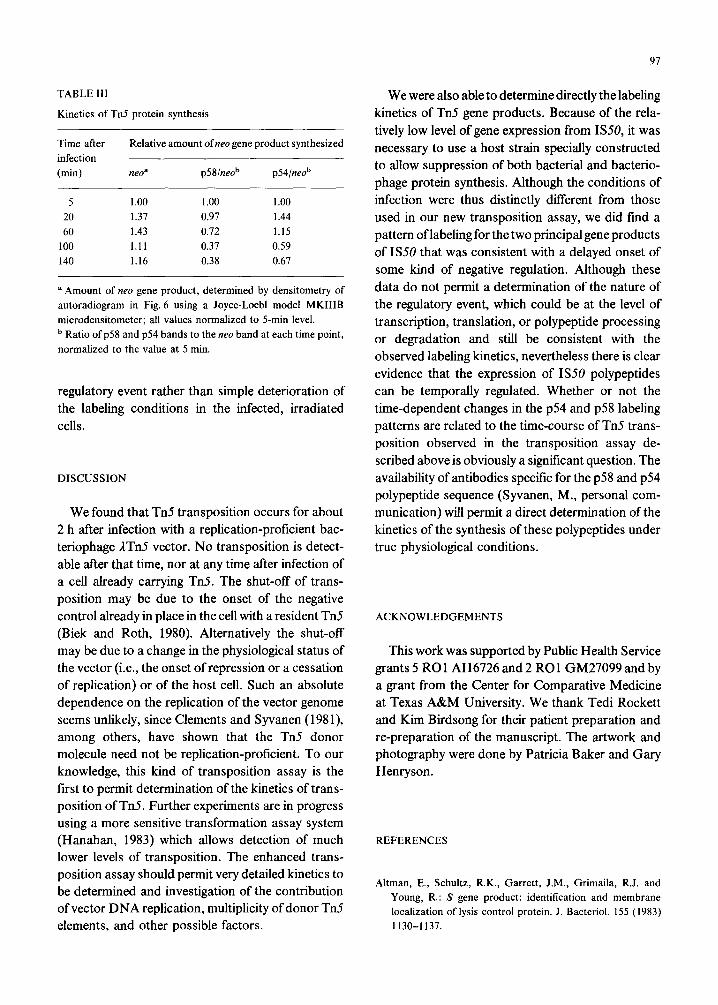
To follow the synthesis of Tn5 gene products after infection with Tn5 we used the host strain RY 1907, since the combination of UV irradiation and the resident excess of A repressor greatly suppresses both host and bacteriophage protein synthesis. Sup- pression of host and vector labeling is necessary to permit detection of the labeled ~58 and ~54 bands. Fig. 5 shows that under our conditions of irradiation, host polypeptide synthesis is largely suppressed and few significant bands are visible except for the
_p58 - p54
neo ---
-\cJ
A B C D E F G H I
Fig. 5. Protein synthesis patterns in infected, irradiated cells.
Each lane shows the labelled proteins from pre-irradiated uvrA -
cells infected with ti221 (lanes A, B, C), ti221TnS (lanes D, E,
F) or uninfected (mock infected) (lanes G, H, I). Samples were
pulse labeled as described in section d of RESULTS at the
following times after infection (or mock infection): 20 min (lanes
A, D, G); 60 min (lanes B, E, H); or 100 min (lanes C, F, I). M,s
on left margin are as in Fig. 4. Products of rlb221Tn5 genes are
listed on the right margin.
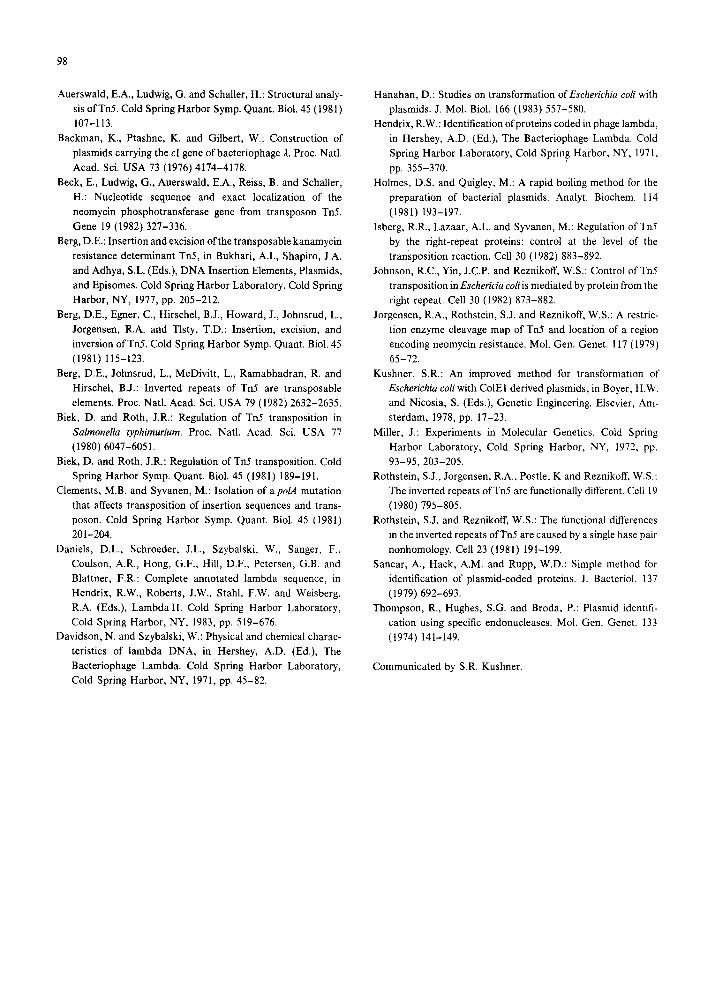
product of the cloned cl repressor gene at 26 kDa1. Only very minor amounts can be seen of the 38 kDal E gene product, the major late I gene pro- duct synthesized at 60 min and 100 min in the phage-infected (lanes B, C, E, F) but not in unin- fected cell (lanes H, I). In the absence of the 2 repressor, the pE band is at least 50-fold more intense under the same labeling conditions and numerous I-specific bands are more intense than the pneo band (not shown). The synthesis of p58 is most marked at 20 min (lane D) and is reduced at later times (lanes E, F), whereas ~54 is labeled at a fairly constant rate, somewhat less than the ~58 band, and there is only a faint residual ?, band underlying ~54. A more expanded time-course is shown in Fig. 6, where it is again evident that ~58 synthesis decreases, especially with respect to ~54, from about 20 min after infection. The neomycin phosphotransferase protein, encoded by the neo gene in the central, unique region of Tn5, is a good internal standard as an unregulated, TnS-specific gene product (Table III). Its synthesis falls off only slightly even at 140 min after infection, suggesting that the decrease in ~58 synthesis after 20 min reflects an active
~58
P54
net -
CI
f
I-
f
68
58
43
29.2
.25.7
21.5
5 20 60 100 140
TIME AFTER INFECTION
(min) Fig. 6. Kinetics of Tn5 gene expression. Pre-irradiated uvrA
cells were infected with lb221Tti; and portions of the infected
culture were pulse-labelled, as described in section e of MATE-
RIALS AND METHODS, at the indicated times after infection.
For other designations see Fig. 5.
97
TABLE III
Kinetics of Tti protein synthesis
Time after
infection
(min)
Relative amount ofneo gene product synthesized
neoa p58jneo” p54/neob
5 1 .oo 1.00 1 .oo 20 1.37 0.97 1.44 60 1.43 0.72 1.15
100 1.11 0.37 0.59
140 1.16 0.38 0.67
a Amount of neo gene product, determined by densitometry of
autoradiogram in Fig. 6 using a Joyce-Loebl model MKIIIB
microdensitometer; all values normalized to 5-min level.
b Ratio of p58 and ~54 bands to the neo band at each time point,
normalized to the value at 5 min.
regulatory event rather than simple deterioration of the labeling conditions in the infected, irradiated cells.
DISCUSSION
We found that Tn5 transposition occurs for about 2 h after infection with a replication-proficient bac- teriophage ITn.5 vector. No transposition is detect- able after that time, nor at any time after infection of a cell already carrying Tn5. The shut-off of trans- position may be due to the onset of the negative control already in place in the cell with a resident Tn5 (Biek and Roth, 1980). Alternatively the shut-off may be due to a change in the physiological status of the vector (i.e., the onset of repression or a cessation of replication) or of the host cell. Such an absolute dependence on the replication of the vector genome seems unlikely, since Clements and Syvanen (198 l), among others, have shown that the Tn5 donor molecule need not be replication-proficient. To our knowledge, this kind of transposition assay is the first to permit determination of the kinetics of trans- position of Tn5. Further experiments are in progress using a more sensitive transformation assay system (Ham&an, 1983) which allows detection of much lower levels of transposition. The enhanced trans- position assay should permit very detailed kinetics to be determined and investigation of the contribution of vector DNA replication, multiplicity of donor Tn5 elements, and other possible factors.
We were also able to determine directly the labeling kinetics of Tn5 gene products. Because of the rela- tively low level of gene expression from IS50, it was necessary to use a host strain specially constructed to allow suppression of both bacterial and bacterio- phage protein synthesis. Although the conditions of infection were thus distinctly different from those used in our new transposition assay, we did find a pattern of labeling for the two principal gene products of IS50 that was consistent with a delayed onset of some kind of negative regulation. Although these data do not permit a determination of the nature of the regulatory event, which could be at the level of transcription, translation, or polypeptide processing or degradation and still be consistent with the observed labeling kinetics, nevertheless there is clear evidence that the expression of IS50 polypeptides can be temporally regulated. Whether or not the time-dependent changes in the p54 and p58 labeling patterns are related to the time-course of Tn5 trans- position observed in the transposition assay de- scribed above is obviously a significant question. The availability of antibodies specific for the p58 and p54 polypeptide sequence (Syvanen, M., personal com- munication) will permit a direct determination of the kinetics of the synthesis of these polypeptides under true physiological conditions.
ACKNOWLEDGEMENTS
This work was supported by Public Health Service grants 5 RO 1 AI16726 and 2 RO 1 GM27099 and by a grant from the Center for Comparative Medicine at Texas A&M University. We thank Tedi Rockett and Kim Birdsong for their patient preparation and re-preparation of the manuscript. The artwork and photography were done by Patricia Baker and Gary Henryson.
REFERENCES
Altman, E., Schultz, R.K., Garrett, J.M., Grimaila, R.J. and
Young, R.: S gene product: identification and membrane
localization of lysis control protein. J. Bacterial. 155 (1983)
1130-1137.
98
Auerswald, E.A., Ludwig, G. and Schaller, H.: Structural analy-
sis ofTn5. Cold Spring Harbor Symp. Quant. Biol. 45 (1981)
107-l 13.
Backman, K., Ptashne, K. and Gilbert, W.: Construction of
plasmids carrying the CI gene of bacteriophage 1. Proc. Natl.
Acad. Sci. USA 73 (1976) 4174-4178.
Beck, E., Ludwig, G., Auerswald, E.A., Reiss, B. and Schaller,
H.: Nucleotide sequence and exact localization of the
neomycin phosphotransferase gene from transposon Tn5.
Gene 19 (1982) 327-336.
Berg, D.E.: Insertion and excision of the transposable kanamycin
resistance determinant Tn5, in Bukhari, AI., Shapiro, J.A.
and Adhya, S.L. (Eds.), DNA Insertion Elements, Plasmids,
and Episomes. Cold Spring Harbor Laboratory, Cold Spring
Harbor, NY, 1977, pp. 205-212.
Berg, D.E., Egner, C., Hirschel, B.J., Howard, J., Johnsrud, L.,
Jorgensen, R.A. and Tlsty, T.D.: Insertion, excision, and
inversion of Tn5. Cold Spring Harbor Symp. Quant. Biol. 45
(1981) 115-123.
Berg, D.E., Johnsrud, L., McDivitt, L., Ramabhadran, R. and
Hirschel, B.J.: Inverted repeats of Tn5 are transposable
elements. Proc. Natl. Acad. Sci. USA 79 (1982) 2632-2635.
Biek, D. and Roth, J.R.: Regulation of Tn5 transposition in
Salmonella typhimurium. Proc. Natl. Acad. Sci. USA 17
(1980) 6047-6051.
Biek, D. and Roth, J.R.: Regulation of Tn5 transposition. Cold
Spring Harbor Symp. Quant. Biol. 45 (1981) 189-191.
Clements, M.B. and Syvanen, M.: Isolation of a polA mutation
that affects transposition of insertion sequences and trans-
poson. Cold Spring Harbor Symp. Quant. Biol. 45 (1981)
201-204.
Daniels, D.L., Schroeder, J.L., Szybalski, W., Sanger, F.,
Coulson, A.R., Hong, G.F., Hill, D.F., Petersen, G.B. and
Blattner, F.R.: Complete annotated lambda sequence, in
Hendrix, R.W., Roberts, J.W., Stahl, F.W. and Weisberg,
R.A. (Eds.), Lambda II. Cold Spring Harbor Laboratory,
Cold Spring Harbor, NY, 1983, pp. 519-676.
Davidson, N. and Szybalski, W.: Physical and chemical charac-
teristics of lambda DNA, in Hershey, A.D. (Ed.), The
Bacteriophage Lambda. Cold Spring Harbor Laboratory,
Cold Spring Harbor, NY, 1971, pp. 45-82.
Hanahan, D.: Studies on transformation of Escherichia coli with
plasmids. J. Mol. Biol. 166 (1983) 557-580.
Hendrix, R.W.: Identification ofproteins coded in phage lambda,
in Hershey, A.D. (Ed.), The Bacteriophage Lambda. Cold
Spring Harbor Laboratory, Cold Spring Harbor, NY, 1971,
pp. 355-370.
Holmes, D.S. and Quigley, M.: A rapid boiling method for the
preparation of bacterial plasmids. Analyt. Biochem. 114
(1981) 193-197.
Isberg, R.R., Lazaar, A.L. and Syvanen, M.: Regulation of Tn5
by the right-repeat proteins: control at the level of the
transposition reaction. Cell 30 (1982) 883-892.
Johnson, R.C., Yin, J.C.P. and Reznikoff, W.S.: Control of Tn5
transposition in Eschericia co/i is mediated by protein from the
right repeat. Cell 30 (1982) 873-882.
Jorgensen, R.A., Rothstein, S.J. and Reznikoff, W.S.: A restric-
tion enzyme cleavage map of Tn5 and location of a region
encoding neomycin resistance. Mol. Gen. Genet. 117 (1979)
65-72.
Kushner, S.R.: An improved method for transformation of
Escherichia coli with ColEl derived plasmids, in Boyer, H.W.
and Nicosia, S. (Eds.), Genetic Engineering. Elsevier, Am-
sterdam, 1978, pp. 17-23.
Miller, J.: Experiments in Molecular Genetics. Cold Spring
Harbor Laboratory, Cold Spring Harbor, NY, 1972, pp.
93-95,203-205.
Rothstein, S.J., Jorgensen, R.A., Pestle, K and Reznikoff, W.S.:
The inverted repeats of Tn5 are functionally different. Cell 19
(1980) 795-805.
Rothstein, S.J. and Reznikoff, W.S.: The functional differences
in the inverted repeats of Tn5 are caused by a single base pair
nonhomology. Cell 23 (1981) 191-199.
Sancar, A., Hack, A.M. and Rupp, W.D.: Simple method for
identification of plasmid-coded proteins. J. Bacterial. 137
(1979) 692-693.
Thompson, R., Hughes, S.G. and Broda, P.: Plasmid identifi-
cation using specific endonucleases. Mol. Gen. Genet. 133
(1974) 141-149.
Communicated by S.R. Kushner.