kinetics study of the solvent extraction of lipids from chlorella vulgaris
TRANSCRIPT
International Journal of Engineering and Technical Research (IJETR)
ISSN: 2321-0869, Volume-1, Issue-10, December 2013
28 www.erpublication.org
Abstract— The aim of this investigation was to reduce the
chemical hazard and possibly the production time of biodiesel
from microalgae by investigating the process of hexane lipid
extraction. This extraction process is energy-intensive and
time-consuming. Hexane, a toxic solvent, is traditionally used
for microalgae lipid extractions. The goals of this project were to
(1) evaluate the less hazardous heptane as a substitute for
hexane and (2) determine the kinetics of the extraction process
for hexane and heptane at different solvent volume to dry
microalgae mass ratios (R, mL solvent/g dry microalgae). To
accomplish the first goal, the project included growth,
monitoring, and harvesting of Chlorella vulgaris microalgae in
reverse osmosis water and analyzing the lipid extraction using
hexane and heptane. The second goal was accomplished by
proposing a kinetics model of lipid extraction, measuring the
hexane and heptane extracted lipids as function of the extraction
time and fitting the data to the kinetic model. Using a
spectrophotometer, it was determined that hexane and heptane
extract similar material. For both solvents, the extraction
process followed a first order model: τ dY/dt = (K-Y), where Y is
the grams of lipid extracted per 100 gram dry microalgae, K is
the maximum gram of lipid which can be extracted in the
process per 100 gram dry microalgae, t is the extraction time
(min), and τ is the time constant for the process (min). A smaller
τ implies a faster extraction process, while a higher K indicates a
higher lipid extraction yield. It was found that for hexane with R
= 5, K = 2.75 and τ = 10. Increasing R to 30 amplifies K to 3.90
and τ to 20. For heptane with R = 5, K = 1.80 and τ = 2. When R
was increased to 30, K rose to 2.61 and τ to 7. For a given R,
heptane extraction is faster, but hexane extraction has a higher
maximum yield.
Index Terms— Biodiesel, Chlorella vulgaris, Extraction
Kinetics, Heptane Extraction, Hexane Extraction, Lipid
Extraction.
A. Microalgae Lipid Composition
The United States Department of Energy studied the algae
to biodiesel process starting in the 1970’s [1]. Recently, the
production and characterization of microalgae biodiesel has
expanded [2-25] and spread to many countries [26]. Lipids
and fatty acids exist in algae. They function as membrane
components, storage products, and as energy source. Lipids
are classified according to their polarity. Table I. summarizes
Manuscript received December 06, 2013.
Brian McConnell, Chemical Engineering Department, University of
New Hampshire, Durham, NH 03824, USA.
Ihab H. Farag, Chemical Engineering Department, University of New
Hampshire, Durham, NH 03824, USA Mobile phone: +1-603-767-4442.
The authors would like to acknowledge the support from the UNH Hamel
Center for Undergraduate Research
the characteristics of polar and non-polar compounds
Microalgae have both non-polar (lipophilic or neutral)
carbon chains (like fatty acids) and polar (hydrophilic) lipids.
The major part of the non-polar (neutral) lipids are
triglycerides and free fatty acids. Triglycerides-esters are the
major components of oils. These consist of one molecule of
glycerol and three molecules of fatty acids. Polar or
hydrophilic lipids, like phospholipids are glycerides in which
a polar group replaced one or more of the fatty acids. The
non-polar triglycerides are used to create biodiesel by the
transesterification reaction. Hence, their efficient extraction is
very important in the production of microalgae biodiesel. The
characteristics of an oil are usually described in terms of its
fatty acids composition. Fatty acids have a carboxyl group
(COOH) which is polar and a hydrocarbon chain which is
non-polar. The number of carbon atoms and double bonds in
the hydrocarbon chain describes fatty acids. The most
common fatty acids in edible oils have 18 carbon atoms.
Table I. Features of Polar and Non-Polar Compounds
Polar Compounds Non-Polar Chemicals
Covalent compounds with
the shared pair of
electrons moves towards
the atom with greater mass
involved in the bonding
Covalent compounds with
the shared pair of
electrons are at an equal
distance from the two
bonded atoms
The greater mass atom
will have a slight negative
charge. The other atom
will have a slight positive
charge. The two centers of
charge cause the molecule
to be “dipole”
There is no separation in
the positive and negative
charges of the molecule
Higher melting and
boiling points compared
to non-polar compounds
Relatively lower melting
and boiling points
Relatively stronger forces
between molecules
Weak Van der Waal’s
forces between molecules
Polar solutes dissolve in
polar solvents
Non-polar solutes
dissolve in non-polar
solvents
Solvate and form ions
when dissolve in water
Not water-soluble. Hence
these do not dissociate to
form ions in water
Conduct electricity in
aqueous solution
Do not conduct electricity
in aqueous solution
Examples include: water,
urea, methanol, ethanol,
formic acid
Examples include:
pentane, toluene, hexane,
heptane, benzene
Kinetics Study of the Solvent Extraction of Lipids
from Chlorella vulgaris
Brian McConnell, Ihab H. Farag
Kinetics Study of the Solvent Extraction of Lipids from Chlorella vulgaris
29 www.erpublication.org
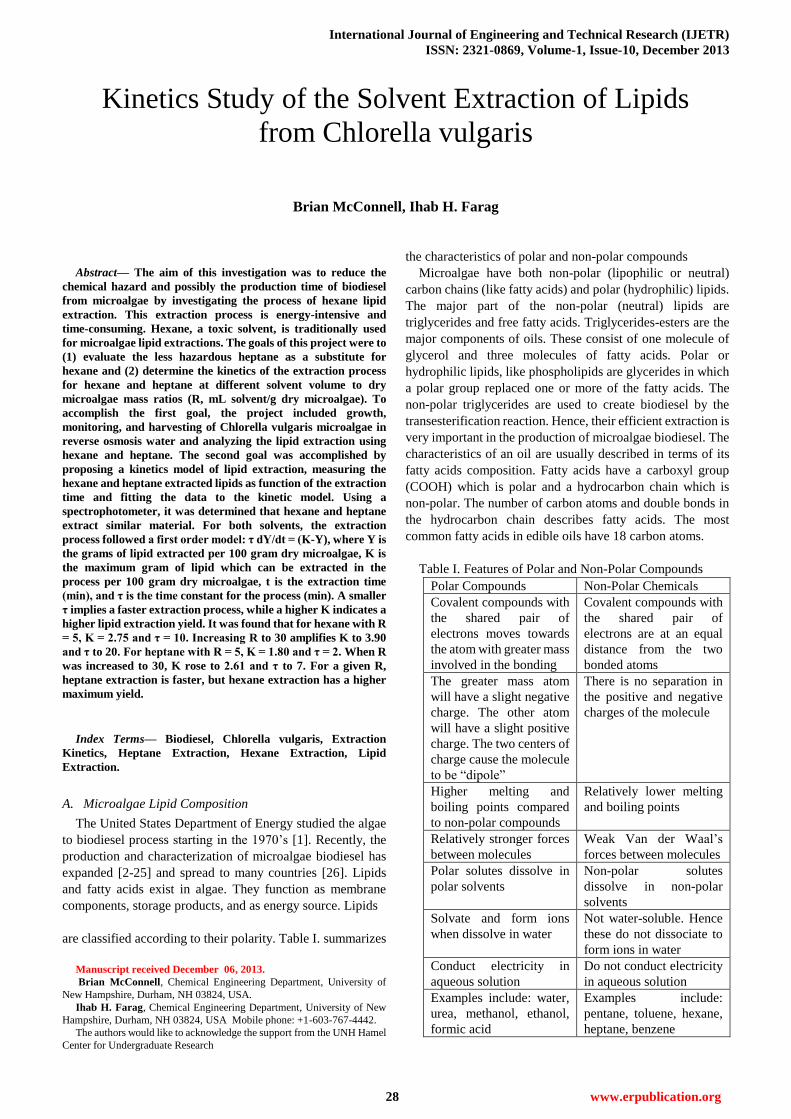
These fatty acids include stearic, oleic, linoleic (2 double
bonds) and linolenic (3 double bonds) acids.
The types of fatty acids produced by the microalgae cell
depend on the conditions in which the cell was grown. Some
of the factors which affect lipid production include nutrient
composition and availability, temperature, light intensity, and
aeration rate. Usually, the microalgal fatty acids have
hydrocarbon chains ranging from 12 to 22 carbons. The
extent of unsaturation can vary, but the number of double
bonds never exceeds six. The length of the hydrocarbon chain
and the degree of unsaturation influences the heating value,
viscosity, cloud point, and pour point of the biodiesel which is
created [18, 27]. The most common fatty acid in Chlorella
vulgaris is the unsaturated Linoleic acid, with two double
bonds (18:2) [28], Fig. 1.
B. Microalgae Lipid Extraction
Halim et al. [27] proposed the following five-step
mechanism for the solvent lipid extraction from microalgae.
1. The solvent penetrates the external surface of the cell, i.e.,
the cell membrane and enters the cytoplasm. The
cytoplasm is that part of the cell between the cell
membrane and the nuclear envelope. This jelly-like
substance is where the functions for cell expansion,
growth, metabolism, and replication are carried out.
2. The non-polar solvent interacts with the non-polar lipids
in the cytoplasm. Since both molecules are non-polar, the
interactions are van der Waals forces.
3. The solvent and lipid form a complex.
4. The solvent-lipids complex will diffuse out of the cell
because of concentration driving force (gradient).
5. The solvent-lipids complex moves through the static film
surrounding the cell (boundary layer) and enters the bulk
solvent.
Figure 2 shows the five-step lipid extraction mechanism.
Fig. 1. Linoleic Acid Structure. Reproduced from
http://www.chemtube3d.com/ClaydenLinoleic.html
Fig. 2. Lipid Extraction Mechanism.
C. Hexane Solvent Substitution
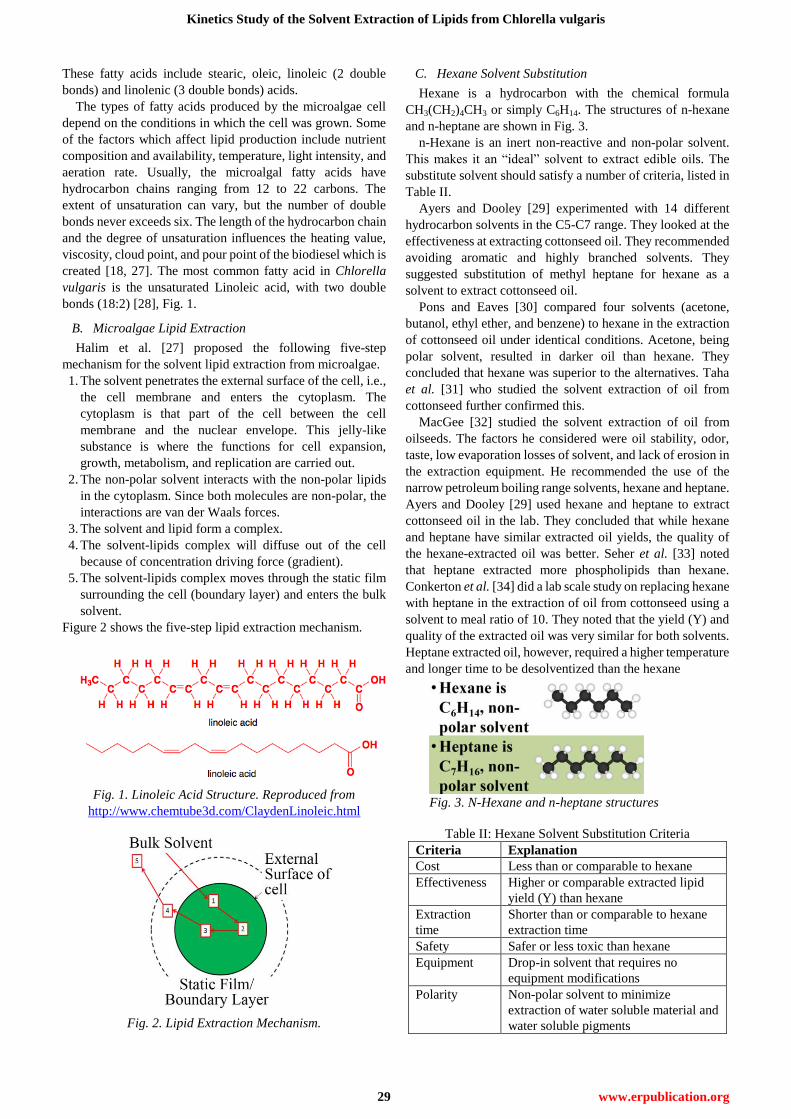
Hexane is a hydrocarbon with the chemical formula
CH3(CH2)4CH3 or simply C6H14. The structures of n-hexane
and n-heptane are shown in Fig. 3.
n-Hexane is an inert non-reactive and non-polar solvent.
This makes it an “ideal” solvent to extract edible oils. The
substitute solvent should satisfy a number of criteria, listed in
Table II.
Ayers and Dooley [29] experimented with 14 different
hydrocarbon solvents in the C5-C7 range. They looked at the
effectiveness at extracting cottonseed oil. They recommended
avoiding aromatic and highly branched solvents. They
suggested substitution of methyl heptane for hexane as a
solvent to extract cottonseed oil.
Pons and Eaves [30] compared four solvents (acetone,
butanol, ethyl ether, and benzene) to hexane in the extraction
of cottonseed oil under identical conditions. Acetone, being
polar solvent, resulted in darker oil than hexane. They
concluded that hexane was superior to the alternatives. Taha
et al. [31] who studied the solvent extraction of oil from
cottonseed further confirmed this.
MacGee [32] studied the solvent extraction of oil from
oilseeds. The factors he considered were oil stability, odor,
taste, low evaporation losses of solvent, and lack of erosion in
the extraction equipment. He recommended the use of the
narrow petroleum boiling range solvents, hexane and heptane.
Ayers and Dooley [29] used hexane and heptane to extract
cottonseed oil in the lab. They concluded that while hexane
and heptane have similar extracted oil yields, the quality of
the hexane-extracted oil was better. Seher et al. [33] noted
that heptane extracted more phospholipids than hexane.
Conkerton et al. [34] did a lab scale study on replacing hexane
with heptane in the extraction of oil from cottonseed using a
solvent to meal ratio of 10. They noted that the yield (Y) and
quality of the extracted oil was very similar for both solvents.
Heptane extracted oil, however, required a higher temperature
and longer time to be desolventized than the hexane
Fig. 3. N-Hexane and n-heptane structures
Table II: Hexane Solvent Substitution Criteria
Criteria Explanation
Cost Less than or comparable to hexane
Effectiveness Higher or comparable extracted lipid
yield (Y) than hexane
Extraction
time
Shorter than or comparable to hexane
extraction time
Safety Safer or less toxic than hexane
Equipment Drop-in solvent that requires no
equipment modifications
Polarity Non-polar solvent to minimize
extraction of water soluble material and
water soluble pigments
International Journal of Engineering and Technical Research (IJETR)
ISSN: 2321-0869, Volume-1, Issue-10, December 2013
30 www.erpublication.org
extraction. This was in agreement with earlier results of
Johnson and Lusas [35]. They concluded that heptane offers a
potential alternative to hexane for oil extraction from
cottonseed.
D. Extraction Kinetics Modeling
Patricelli et al. [36] proposed a mathematical model for the
extraction of oil from rapeseed in a batch reactor. The
equation is derived from mass balances, solid-liquid
equilibrium, and mass transfer rate expressions. The model
gives the concentration of oil in the solvent over time. It
involves two simultaneous processes, washing and diffusion.
Both of these processes have a different kinetic coefficient.
Patricelli’s model is:
(1)
where is the oil concentration in the solvent at any
given time t, is the final oil concentration (hypothetical)
in the solvent phase due to the washing stage alone, is the
final oil concentration (hypothetical) in the solvent phase due
to the diffusion stage alone, is the kinetics coefficient for
the washing stage, and is the kinetics coefficient for the
diffusion stage. The microalgae lipid extraction does not have
a washing step because all of the algal lipids are contained
within the cell. Since the original model was the sum of the
separate washing and diffusion stages, the washing term can
be dropped. The simplified expression is
. (2)
Equation (2) is in the same form as a first order process. In
order to make this point clear and for the ease of use, Eqn. (2)
was written differently. The kinetics model of this study is:
(3)
where Y is the lipid yield (grams of lipid extracted per 100 g
dry algae), K is the maximum yield (grams of lipid extracted
per 100 g dry algae) which can be obtained in the process with
the given solvent, t is the extraction time, and is the time
constant for the process. If the maximum yield (K) is large,
many lipids will be extracted and the solvent is very effective.
If the maximum yield (K) is small, a small amount of lipid will
be extracted and the solvent is not very effective. If the time
constant ( ) is large, the process is slow and it will take a long
time for the yield to reach its maximum. If the time constant
( ) is small, the process is fast and it will take a short time for
the yield to reach its maximum.
II. KINETICS MODELING OF LIPID EXTRACTION FROM DRY
MICROALGAE
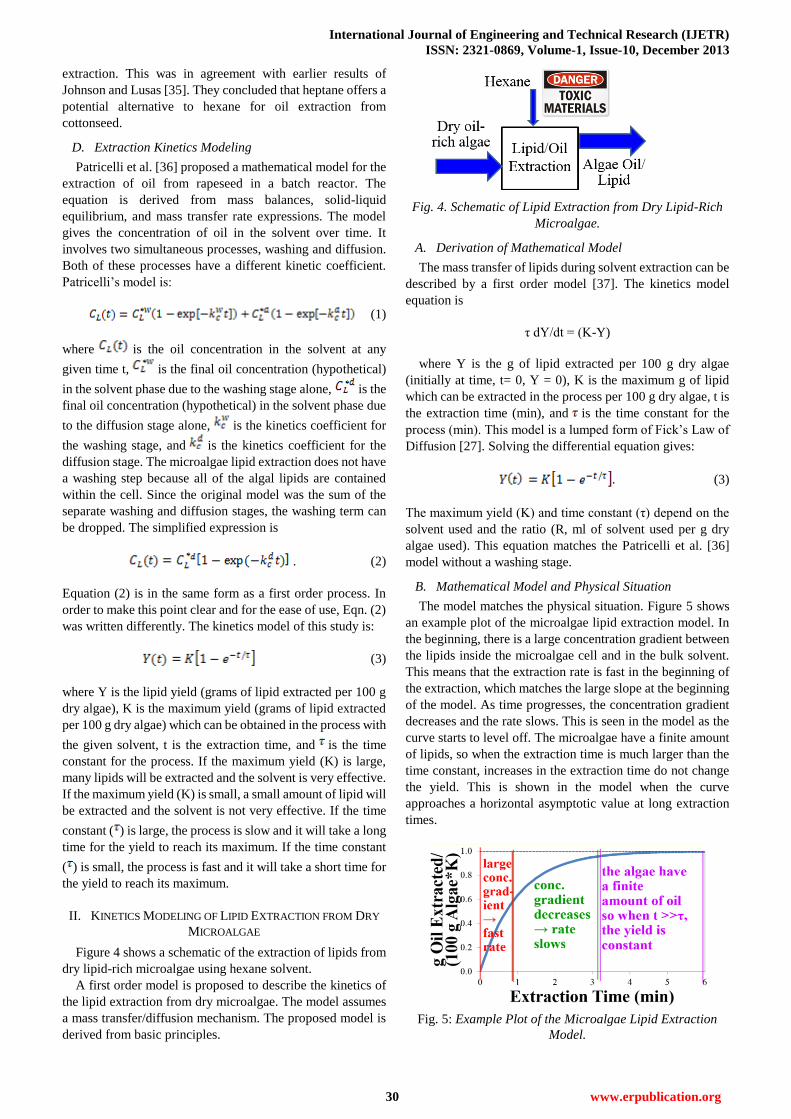
Figure 4 shows a schematic of the extraction of lipids from
dry lipid-rich microalgae using hexane solvent.
A first order model is proposed to describe the kinetics of
the lipid extraction from dry microalgae. The model assumes
a mass transfer/diffusion mechanism. The proposed model is
derived from basic principles.
Fig. 4. Schematic of Lipid Extraction from Dry Lipid-Rich
Microalgae.
A. Derivation of Mathematical Model
The mass transfer of lipids during solvent extraction can be
described by a first order model [37]. The kinetics model
equation is
τ dY/dt = (K-Y)
where Y is the g of lipid extracted per 100 g dry algae
(initially at time, t= 0, Y = 0), K is the maximum g of lipid
which can be extracted in the process per 100 g dry algae, t is
the extraction time (min), and is the time constant for the
process (min). This model is a lumped form of Fick’s Law of
Diffusion [27]. Solving the differential equation gives:
. (3)
The maximum yield (K) and time constant (τ) depend on the
solvent used and the ratio (R, ml of solvent used per g dry
algae used). This equation matches the Patricelli et al. [36]
model without a washing stage.
B. Mathematical Model and Physical Situation
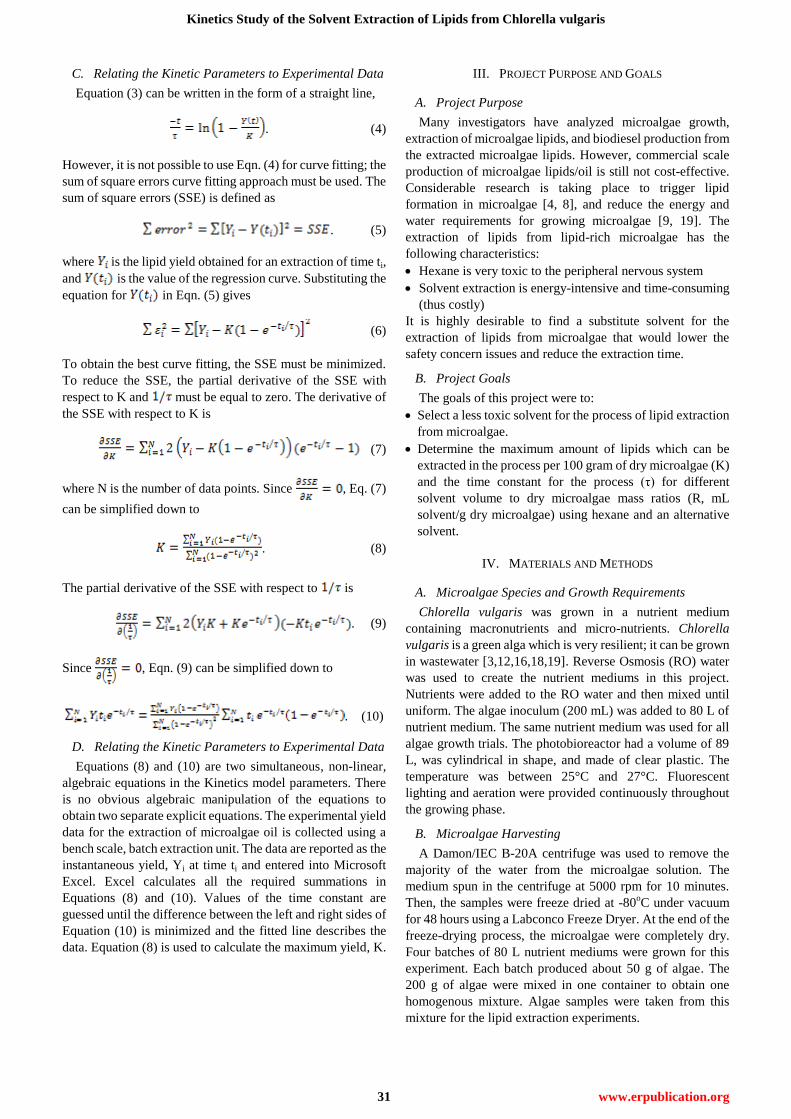
The model matches the physical situation. Figure 5 shows
an example plot of the microalgae lipid extraction model. In
the beginning, there is a large concentration gradient between
the lipids inside the microalgae cell and in the bulk solvent.
This means that the extraction rate is fast in the beginning of
the extraction, which matches the large slope at the beginning
of the model. As time progresses, the concentration gradient
decreases and the rate slows. This is seen in the model as the
curve starts to level off. The microalgae have a finite amount
of lipids, so when the extraction time is much larger than the
time constant, increases in the extraction time do not change
the yield. This is shown in the model when the curve
approaches a horizontal asymptotic value at long extraction
times.
Fig. 5: Example Plot of the Microalgae Lipid Extraction
Model.
Kinetics Study of the Solvent Extraction of Lipids from Chlorella vulgaris
31 www.erpublication.org
C. Relating the Kinetic Parameters to Experimental Data
Equation (3) can be written in the form of a straight line,
. (4)
However, it is not possible to use Eqn. (4) for curve fitting; the
sum of square errors curve fitting approach must be used. The
sum of square errors (SSE) is defined as
. (5)
where is the lipid yield obtained for an extraction of time ti,
and is the value of the regression curve. Substituting the
equation for in Eqn. (5) gives
(6)
To obtain the best curve fitting, the SSE must be minimized.
To reduce the SSE, the partial derivative of the SSE with
respect to K and must be equal to zero. The derivative of
the SSE with respect to K is
(7)
where N is the number of data points. Since , Eq. (7)
can be simplified down to
. (8)
The partial derivative of the SSE with respect to is
. (9)
Since , Eqn. (9) can be simplified down to
. (10)
D. Relating the Kinetic Parameters to Experimental Data
Equations (8) and (10) are two simultaneous, non-linear,
algebraic equations in the Kinetics model parameters. There
is no obvious algebraic manipulation of the equations to
obtain two separate explicit equations. The experimental yield
data for the extraction of microalgae oil is collected using a
bench scale, batch extraction unit. The data are reported as the
instantaneous yield, Yi at time ti and entered into Microsoft
Excel. Excel calculates all the required summations in
Equations (8) and (10). Values of the time constant are
guessed until the difference between the left and right sides of
Equation (10) is minimized and the fitted line describes the
data. Equation (8) is used to calculate the maximum yield, K.
III. PROJECT PURPOSE AND GOALS
A. Project Purpose
Many investigators have analyzed microalgae growth,
extraction of microalgae lipids, and biodiesel production from
the extracted microalgae lipids. However, commercial scale
production of microalgae lipids/oil is still not cost-effective.
Considerable research is taking place to trigger lipid
formation in microalgae [4, 8], and reduce the energy and
water requirements for growing microalgae [9, 19]. The
extraction of lipids from lipid-rich microalgae has the
following characteristics:
Hexane is very toxic to the peripheral nervous system
Solvent extraction is energy-intensive and time-consuming
(thus costly)
It is highly desirable to find a substitute solvent for the
extraction of lipids from microalgae that would lower the
safety concern issues and reduce the extraction time.
B. Project Goals
The goals of this project were to:
Select a less toxic solvent for the process of lipid extraction
from microalgae.
Determine the maximum amount of lipids which can be
extracted in the process per 100 gram of dry microalgae (K)
and the time constant for the process (τ) for different
solvent volume to dry microalgae mass ratios (R, mL
solvent/g dry microalgae) using hexane and an alternative
solvent.
IV. MATERIALS AND METHODS
A. Microalgae Species and Growth Requirements
Chlorella vulgaris was grown in a nutrient medium
containing macronutrients and micro-nutrients. Chlorella
vulgaris is a green alga which is very resilient; it can be grown
in wastewater [3,12,16,18,19]. Reverse Osmosis (RO) water
was used to create the nutrient mediums in this project.
Nutrients were added to the RO water and then mixed until
uniform. The algae inoculum (200 mL) was added to 80 L of
nutrient medium. The same nutrient medium was used for all
algae growth trials. The photobioreactor had a volume of 89
L, was cylindrical in shape, and made of clear plastic. The
temperature was between 25°C and 27°C. Fluorescent
lighting and aeration were provided continuously throughout
the growing phase.
B. Microalgae Harvesting
A Damon/IEC B-20A centrifuge was used to remove the
majority of the water from the microalgae solution. The
medium spun in the centrifuge at 5000 rpm for 10 minutes.
Then, the samples were freeze dried at -80oC under vacuum
for 48 hours using a Labconco Freeze Dryer. At the end of the
freeze-drying process, the microalgae were completely dry.
Four batches of 80 L nutrient mediums were grown for this
experiment. Each batch produced about 50 g of algae. The
200 g of algae were mixed in one container to obtain one
homogenous mixture. Algae samples were taken from this
mixture for the lipid extraction experiments.
International Journal of Engineering and Technical Research (IJETR)
ISSN: 2321-0869, Volume-1, Issue-10, December 2013
32 www.erpublication.org
C. Lipid Extraction Experimental Setup
The lipid extractions in this project followed the work of
Ferrentino [15]. He used dry algae powder and a Soxhlet
extractor. He heated hexane at reflux (70°C) for 5 hours. The
dry algae powder was contained between two layers of glass
wool inside the Soxhlet. The hexane removes the lipids from
the dry algae and returns back to the hexane reboiler at the
bottom of the unit. The glass wool holds the algae inside the
Soxhlet and prevents any solids from entering the reboiler.
After the extraction was completed, the hexane was
evaporated to obtain dry lipids. The lipid content was
reported as the mass of dry lipids per mass of dry algae.
This project did not use a Soxhlet extractor. Instead, the dry
algae was put directly into the solvent and heated under reflux
inside a round bottom flask.
A hot water bath was used because it makes controlling the
temperature of the extraction easy and it ensured uniform
heating. The hot water bath sat on a combined hot plate and
stirrer. Both the hot water bath and solvent mixture was mixed
throughout the extraction. The round bottom flask had three
ports. The water-cooled condenser was connected directly to
the round bottom flask using one of the ports. The other ports
could be used to take samples or insert/remove a stir bar.
Since the condenser was not closed at the top, the system was
at atmospheric pressure. This reduced the risk of breaking
glassware or other accidents. Figure 6 shows the setup.
D. Lipid Extraction Procedure
The extraction rate depends significantly on the surface
area of cells exposed to the solvent. If there are big clumps,
the surface area will be decreased. The microalgae in this
project were ground to a fine powder. The majority of
extractions completed for this project were done with 5.00 g
of microalgae. This amount of algae was large enough so that
there were no inaccuracies with mass measurements, but not
so large that the algae supply was used up quickly. The
solvent (mL) to algae (g) ratio R determined the amount of
solvent to use once the algae had been weighed out. For this
project, R values of 5:1 and 30:1 were tested. The solvent,
algae, and stir bar were combined in the round bottom flask
and heated for either 1 minute, 4 minutes, 30 minutes, or 60
minutes. After the extraction time was up, the round bottom
flask was removed from the hot water bath and allowed to
cool. Cold water was running through the condenser for the
entire extraction and cool down processes.
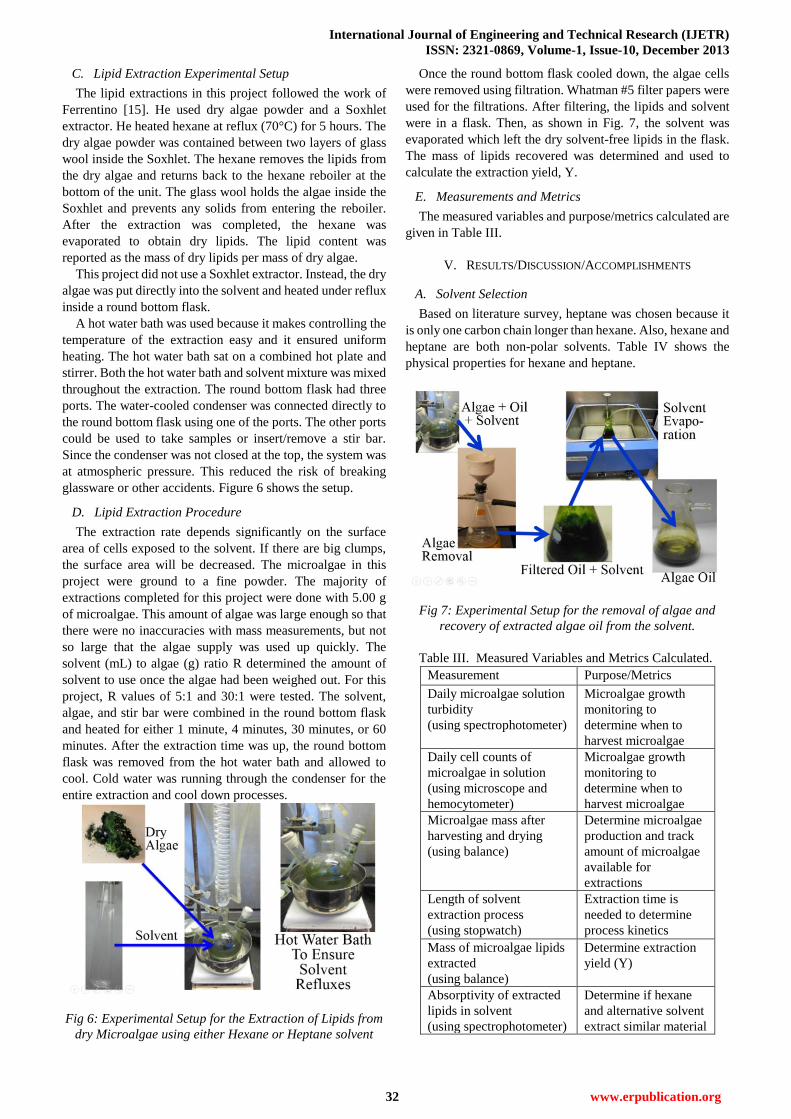
Fig 6: Experimental Setup for the Extraction of Lipids from
dry Microalgae using either Hexane or Heptane solvent
Once the round bottom flask cooled down, the algae cells
were removed using filtration. Whatman #5 filter papers were
used for the filtrations. After filtering, the lipids and solvent
were in a flask. Then, as shown in Fig. 7, the solvent was
evaporated which left the dry solvent-free lipids in the flask.
The mass of lipids recovered was determined and used to
calculate the extraction yield, Y.
E. Measurements and Metrics
The measured variables and purpose/metrics calculated are
given in Table III.
V. RESULTS/DISCUSSION/ACCOMPLISHMENTS
A. Solvent Selection
Based on literature survey, heptane was chosen because it
is only one carbon chain longer than hexane. Also, hexane and
heptane are both non-polar solvents. Table IV shows the
physical properties for hexane and heptane.
Fig 7: Experimental Setup for the removal of algae and
recovery of extracted algae oil from the solvent.
Table III. Measured Variables and Metrics Calculated.
Measurement Purpose/Metrics
Daily microalgae solution
turbidity
(using spectrophotometer)
Microalgae growth
monitoring to
determine when to
harvest microalgae
Daily cell counts of
microalgae in solution
(using microscope and
hemocytometer)
Microalgae growth
monitoring to
determine when to
harvest microalgae
Microalgae mass after
harvesting and drying
(using balance)
Determine microalgae
production and track
amount of microalgae
available for
extractions
Length of solvent
extraction process
(using stopwatch)
Extraction time is
needed to determine
process kinetics
Mass of microalgae lipids
extracted
(using balance)
Determine extraction
yield (Y)
Absorptivity of extracted
lipids in solvent
(using spectrophotometer)
Determine if hexane
and alternative solvent
extract similar material
Kinetics Study of the Solvent Extraction of Lipids from Chlorella vulgaris
33 www.erpublication.org
Table IV: Properties of Hexane and Heptane [38]
Property Hexane Heptane
Chemical Formula/ Structure C6H14
C7H16
Solvent type Non-polar Non-polar
Toxicity to the peripheral
nervous system very toxic
slightly
toxic
Boiling Point (1 atm) 68°C 98 °C
Vapor Pressure (25 °C) 17.3 kPa 5.3 kPa
Energy Required to Boil from
20ºC 475 kJ/kg 493 kJ/kg
Cost, (Industrial Scale),
$/gallon 1.15-1.19 1.21-1.64
Algae Lipid Extraction
Effectiveness
Very
Effective
To be
Determined
Hexane is very toxic to the peripheral nervous system
whereas heptane is only slightly toxic. This is a major
advantage for heptane. Heptane has a boiling point of 98°C at
1 atm which is 30°C greater than hexane’s boiling point.
Using a solvent with a high boiling point is advantageous
because diffusion is faster at higher temperatures and the cell
membranes are more likely to break spilling out the lipids.
Since heptane is less volatile than hexane, there will be less
fugitive emissions from equipment. The energy required to
bring the solvents from 20°C to their boiling point, and then
vaporize them is roughly the same. Finally, when purchased
on an industrial scale, the costs for hexane and heptane are
comparable.
B. Heptane Viability
Based on the literature review and the comparison of the
physical and chemical properties, heptane seemed like a good
candidate, but it had to be proven in the laboratory. First, a
lipid extraction was performed with hexane. Instead of
completely evaporating the solvent, a portion of the
solvent-lipid mixture was analyzed in the spectrophotometer.
The absorbance of the sample was measured at wavelengths
ranging from 340 nm to 970 nm. At each wavelength, the
machine was zeroed with a sample of pure hexane so the
absorbance measurement was due only to the lipids in the
hexane. There was a major absorbance peak at 410 nm, and a
minor absorbance peak at 640 nm. The procedure was
repeated with heptane. Heptane had a major absorbance peak
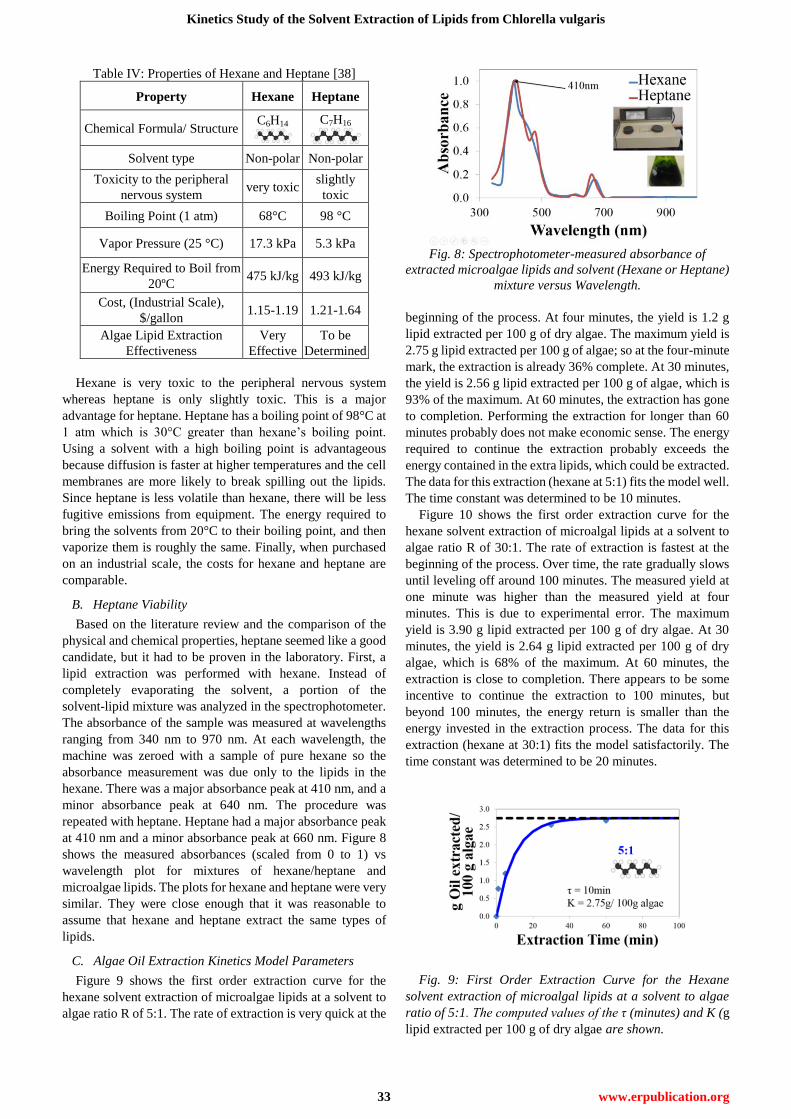
at 410 nm and a minor absorbance peak at 660 nm. Figure 8
shows the measured absorbances (scaled from 0 to 1) vs
wavelength plot for mixtures of hexane/heptane and
microalgae lipids. The plots for hexane and heptane were very
similar. They were close enough that it was reasonable to
assume that hexane and heptane extract the same types of
lipids.
C. Algae Oil Extraction Kinetics Model Parameters
Figure 9 shows the first order extraction curve for the
hexane solvent extraction of microalgae lipids at a solvent to
algae ratio R of 5:1. The rate of extraction is very quick at the
Fig. 8: Spectrophotometer-measured absorbance of
extracted microalgae lipids and solvent (Hexane or Heptane)
mixture versus Wavelength.
beginning of the process. At four minutes, the yield is 1.2 g
lipid extracted per 100 g of dry algae. The maximum yield is
2.75 g lipid extracted per 100 g of algae; so at the four-minute
mark, the extraction is already 36% complete. At 30 minutes,
the yield is 2.56 g lipid extracted per 100 g of algae, which is
93% of the maximum. At 60 minutes, the extraction has gone
to completion. Performing the extraction for longer than 60
minutes probably does not make economic sense. The energy
required to continue the extraction probably exceeds the
energy contained in the extra lipids, which could be extracted.
The data for this extraction (hexane at 5:1) fits the model well.
The time constant was determined to be 10 minutes.
Figure 10 shows the first order extraction curve for the
hexane solvent extraction of microalgal lipids at a solvent to
algae ratio R of 30:1. The rate of extraction is fastest at the
beginning of the process. Over time, the rate gradually slows
until leveling off around 100 minutes. The measured yield at
one minute was higher than the measured yield at four
minutes. This is due to experimental error. The maximum
yield is 3.90 g lipid extracted per 100 g of dry algae. At 30
minutes, the yield is 2.64 g lipid extracted per 100 g of dry
algae, which is 68% of the maximum. At 60 minutes, the
extraction is close to completion. There appears to be some
incentive to continue the extraction to 100 minutes, but
beyond 100 minutes, the energy return is smaller than the
energy invested in the extraction process. The data for this
extraction (hexane at 30:1) fits the model satisfactorily. The
time constant was determined to be 20 minutes.
Fig. 9: First Order Extraction Curve for the Hexane
solvent extraction of microalgal lipids at a solvent to algae
ratio of 5:1. The computed values of the τ (minutes) and K (g
lipid extracted per 100 g of dry algae are shown.

International Journal of Engineering and Technical Research (IJETR)
ISSN: 2321-0869, Volume-1, Issue-10, December 2013
34 www.erpublication.org
Fig. 10: First Order Extraction Curve for the Hexane solvent
extraction of microalgal lipids at a solvent to algae ratio R of
30:1. The computed values of the τ and K are shown.
Figure 11 shows the first order extraction curve for the
heptane solvent extraction of microalgal lipids at a solvent to
algae ratio R of 5:1. The rate of extraction is very quick. The
extraction has gone to completion after 4 minutes. The
maximum yield K is 1.80 g lipid extracted per 100 g of dry
algae. At four minutes, the yield is 1.64 g lipid extracted per
100 g of dry algae so the extraction is already 91% complete.
The extraction does not need to be conducted for longer than
7 minutes because at that point, the extraction has gone to
completion. The yield at the 60-minute mark is slightly lower
than the yield at 4 and 30 minutes; this is due to experimental
error. The data for this extraction (heptane at 5:1) fits the
model well. The time constant was determined to be 3
minutes.
Figure 12 shows the first order extraction curve for the
heptane solvent extraction of microalgal lipids at a solvent to
algae ratio R of 30:1. The rate of extraction is very quick at
the beginning of the process, and over time, it slows. At 4.75
minutes, the yield is 1.1 g lipid extracted per 100 g of dry
algae. The maximum yield is 2.61 g lipid extracted per 100 g
of dry algae so at the four-minute mark, the extraction is
already 42% complete. At 30 minutes, the yield is 2.60 g lipid
extracted per 100 g of dry algae, which is the maximum. At 60
minutes, the extraction has gone to completion. Performing
the extraction for longer than 60 minutes probably does not
make economic sense. The energy required to continue the
extraction probably exceeds the energy contained in the extra
lipids that could be extracted. The data for this extraction
(heptane at 30:1) fits the model well. The time constant was
determined to be 7 minutes.
Fig. 11: First Order Extraction Curve for the Heptane solvent
extraction of microalgal lipids at a solvent to algae ratio R of
5:1. The computed values of the τ and K are shown.
Fig. 12: First Order Extraction Curve for the Heptane
solvent extraction of microalgal lipids at a solvent to algae
ratio R of 30:1. The computed values of the τ and K are shown
D. Effect of the solvent to dry algae ratio (R)
Figure 13 shows the first order extraction curves for the
hexane solvent extractions of microalgal lipids at solvent to
dry algae ratios R of 5:1 and 30:1. For extractions less than 20
minutes, solvent to algae ratios of 5:1 and 30:1 will produce
similar results. The 5:1 extraction is at completion at 20
minutes. After 20 minutes, the curve levels off. On the other
hand, the 30:1 extraction is not done at 20 minutes. After 20
minutes, the amount of lipids extracted continues to increase.
If hexane lipid extraction is to be done for less than 20
minutes, it is recommended to use an R of 5:1 since this will
minimize solvent expenses without sacrificing results. If the
hexane oil extraction is to be done for longer than 20 minutes,
it is recommended to use an R of 30:1.
Figure 14 shows the extraction curves for the heptane
solvent extractions of microalgal lipids at R of 5:1 and 30:1.
For extractions with heptane that last less than 10 minutes,
an R of 5:1 is recommended because it will give a higher
extraction yield. For heptane extractions longer than 10
minutes, it is recommended that an R of 30:1 be used because
the yield will be higher.
Fig. 13: Comparison of Extraction Kinetics for Hexane at
solvent to algae ratios R of 5:1 and 30:1
Fig. 14: Comparison of Extraction Kinetics for Heptane at
solvent to algae ratios R of 5:1 and 30:1
Kinetics Study of the Solvent Extraction of Lipids from Chlorella vulgaris
35 www.erpublication.org
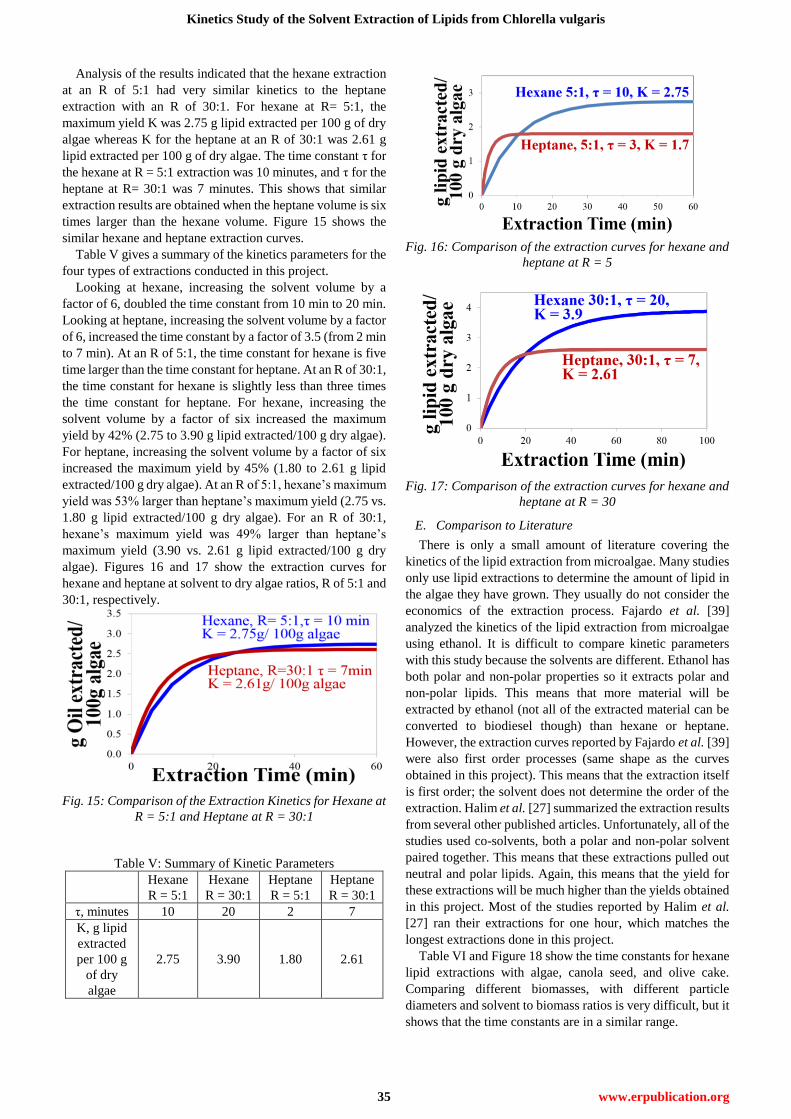
Analysis of the results indicated that the hexane extraction
at an R of 5:1 had very similar kinetics to the heptane
extraction with an R of 30:1. For hexane at R= 5:1, the
maximum yield K was 2.75 g lipid extracted per 100 g of dry
algae whereas K for the heptane at an R of 30:1 was 2.61 g
lipid extracted per 100 g of dry algae. The time constant τ for
the hexane at R = 5:1 extraction was 10 minutes, and τ for the
heptane at R= 30:1 was 7 minutes. This shows that similar
extraction results are obtained when the heptane volume is six
times larger than the hexane volume. Figure 15 shows the
similar hexane and heptane extraction curves.
Table V gives a summary of the kinetics parameters for the
four types of extractions conducted in this project.
Looking at hexane, increasing the solvent volume by a
factor of 6, doubled the time constant from 10 min to 20 min.
Looking at heptane, increasing the solvent volume by a factor
of 6, increased the time constant by a factor of 3.5 (from 2 min
to 7 min). At an R of 5:1, the time constant for hexane is five
time larger than the time constant for heptane. At an R of 30:1,
the time constant for hexane is slightly less than three times
the time constant for heptane. For hexane, increasing the
solvent volume by a factor of six increased the maximum
yield by 42% (2.75 to 3.90 g lipid extracted/100 g dry algae).
For heptane, increasing the solvent volume by a factor of six
increased the maximum yield by 45% (1.80 to 2.61 g lipid
extracted/100 g dry algae). At an R of 5:1, hexane’s maximum
yield was 53% larger than heptane’s maximum yield (2.75 vs.
1.80 g lipid extracted/100 g dry algae). For an R of 30:1,
hexane’s maximum yield was 49% larger than heptane’s
maximum yield (3.90 vs. 2.61 g lipid extracted/100 g dry
algae). Figures 16 and 17 show the extraction curves for
hexane and heptane at solvent to dry algae ratios, R of 5:1 and
30:1, respectively.
Fig. 15: Comparison of the Extraction Kinetics for Hexane at
R = 5:1 and Heptane at R = 30:1
Table V: Summary of Kinetic Parameters
Hexane
R = 5:1
Hexane
R = 30:1
Heptane
R = 5:1
Heptane
R = 30:1
τ, minutes 10 20 2 7
K, g lipid
extracted
per 100 g
of dry
algae
2.75 3.90 1.80 2.61
Fig. 16: Comparison of the extraction curves for hexane and
heptane at R = 5
Fig. 17: Comparison of the extraction curves for hexane and
heptane at R = 30
E. Comparison to Literature
There is only a small amount of literature covering the
kinetics of the lipid extraction from microalgae. Many studies
only use lipid extractions to determine the amount of lipid in
the algae they have grown. They usually do not consider the
economics of the extraction process. Fajardo et al. [39]
analyzed the kinetics of the lipid extraction from microalgae
using ethanol. It is difficult to compare kinetic parameters
with this study because the solvents are different. Ethanol has
both polar and non-polar properties so it extracts polar and
non-polar lipids. This means that more material will be
extracted by ethanol (not all of the extracted material can be
converted to biodiesel though) than hexane or heptane.
However, the extraction curves reported by Fajardo et al. [39]
were also first order processes (same shape as the curves
obtained in this project). This means that the extraction itself
is first order; the solvent does not determine the order of the
extraction. Halim et al. [27] summarized the extraction results
from several other published articles. Unfortunately, all of the
studies used co-solvents, both a polar and non-polar solvent
paired together. This means that these extractions pulled out
neutral and polar lipids. Again, this means that the yield for
these extractions will be much higher than the yields obtained
in this project. Most of the studies reported by Halim et al.
[27] ran their extractions for one hour, which matches the
longest extractions done in this project.
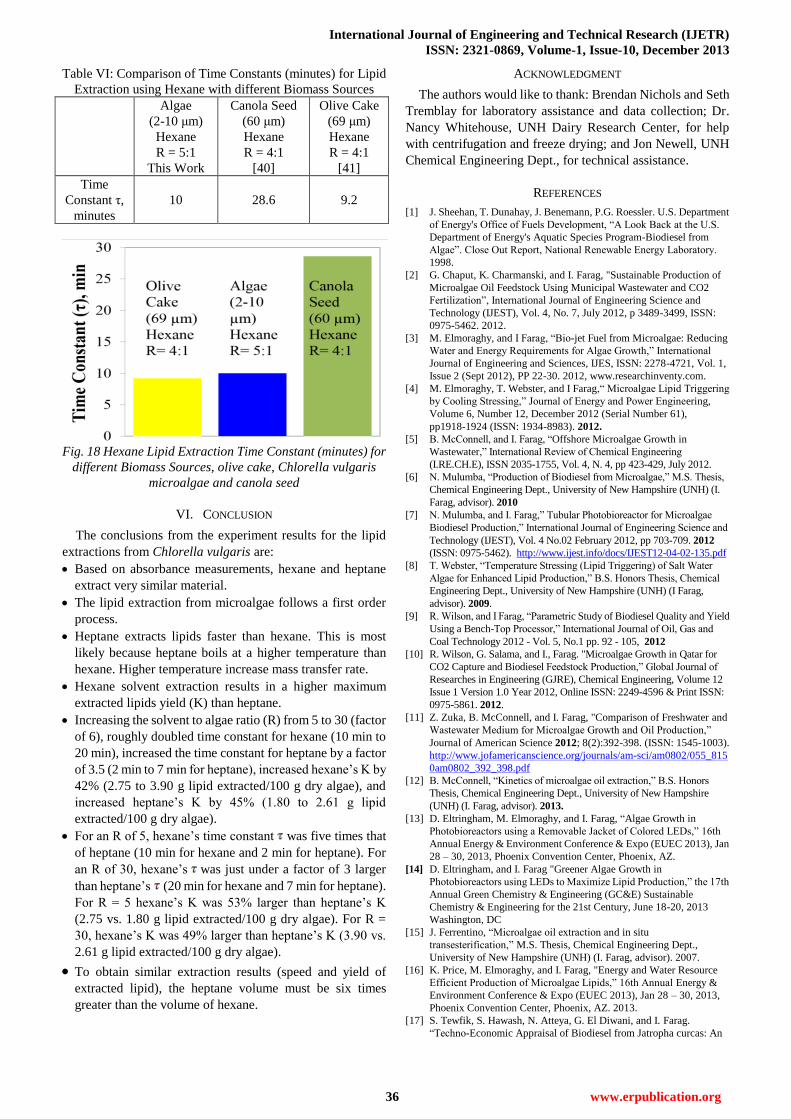
Table VI and Figure 18 show the time constants for hexane
lipid extractions with algae, canola seed, and olive cake.
Comparing different biomasses, with different particle
diameters and solvent to biomass ratios is very difficult, but it
shows that the time constants are in a similar range.
International Journal of Engineering and Technical Research (IJETR)
ISSN: 2321-0869, Volume-1, Issue-10, December 2013
36 www.erpublication.org
Table VI: Comparison of Time Constants (minutes) for Lipid
Extraction using Hexane with different Biomass Sources
Algae
(2-10 μm)
Hexane
R = 5:1
This Work
Canola Seed
(60 μm)
Hexane
R = 4:1
[40]
Olive Cake
(69 μm)
Hexane
R = 4:1
[41]
Time
Constant τ,
minutes
10 28.6 9.2
Fig. 18 Hexane Lipid Extraction Time Constant (minutes) for
different Biomass Sources, olive cake, Chlorella vulgaris
microalgae and canola seed
VI. CONCLUSION
The conclusions from the experiment results for the lipid
extractions from Chlorella vulgaris are:
Based on absorbance measurements, hexane and heptane
extract very similar material.
The lipid extraction from microalgae follows a first order
process.
Heptane extracts lipids faster than hexane. This is most
likely because heptane boils at a higher temperature than
hexane. Higher temperature increase mass transfer rate.
Hexane solvent extraction results in a higher maximum
extracted lipids yield (K) than heptane.
Increasing the solvent to algae ratio (R) from 5 to 30 (factor
of 6), roughly doubled time constant for hexane (10 min to
20 min), increased the time constant for heptane by a factor
of 3.5 (2 min to 7 min for heptane), increased hexane’s K by
42% (2.75 to 3.90 g lipid extracted/100 g dry algae), and
increased heptane’s K by 45% (1.80 to 2.61 g lipid
extracted/100 g dry algae).
For an R of 5, hexane’s time constant was five times that
of heptane (10 min for hexane and 2 min for heptane). For
an R of 30, hexane’s was just under a factor of 3 larger
than heptane’s (20 min for hexane and 7 min for heptane).
For R = 5 hexane’s K was 53% larger than heptane’s K
(2.75 vs. 1.80 g lipid extracted/100 g dry algae). For R =
30, hexane’s K was 49% larger than heptane’s K (3.90 vs.
2.61 g lipid extracted/100 g dry algae).
To obtain similar extraction results (speed and yield of
extracted lipid), the heptane volume must be six times
greater than the volume of hexane.
ACKNOWLEDGMENT
The authors would like to thank: Brendan Nichols and Seth
Tremblay for laboratory assistance and data collection; Dr.
Nancy Whitehouse, UNH Dairy Research Center, for help
with centrifugation and freeze drying; and Jon Newell, UNH
Chemical Engineering Dept., for technical assistance.
REFERENCES
[1] J. Sheehan, T. Dunahay, J. Benemann, P.G. Roessler. U.S. Department
of Energy's Office of Fuels Development, “A Look Back at the U.S.
Department of Energy's Aquatic Species Program-Biodiesel from
Algae”. Close Out Report, National Renewable Energy Laboratory.
1998.
[2] G. Chaput, K. Charmanski, and I. Farag, "Sustainable Production of
Microalgae Oil Feedstock Using Municipal Wastewater and CO2
Fertilization”, International Journal of Engineering Science and
Technology (IJEST), Vol. 4, No. 7, July 2012, p 3489-3499, ISSN:
0975-5462. 2012.
[3] M. Elmoraghy, and I Farag, “Bio-jet Fuel from Microalgae: Reducing
Water and Energy Requirements for Algae Growth,” International
Journal of Engineering and Sciences, IJES, ISSN: 2278-4721, Vol. 1,
Issue 2 (Sept 2012), PP 22-30. 2012, www.researchinventy.com.
[4] M. Elmoraghy, T. Webster, and I Farag,“ Microalgae Lipid Triggering
by Cooling Stressing,” Journal of Energy and Power Engineering,
Volume 6, Number 12, December 2012 (Serial Number 61),
pp1918-1924 (ISSN: 1934-8983). 2012.
[5] B. McConnell, and I. Farag, “Offshore Microalgae Growth in
Wastewater,” International Review of Chemical Engineering
(I.RE.CH.E), ISSN 2035-1755, Vol. 4, N. 4, pp 423-429, July 2012.
[6] N. Mulumba, “Production of Biodiesel from Microalgae,” M.S. Thesis,
Chemical Engineering Dept., University of New Hampshire (UNH) (I.
Farag, advisor). 2010
[7] N. Mulumba, and I. Farag,” Tubular Photobioreactor for Microalgae
Biodiesel Production,” International Journal of Engineering Science and
Technology (IJEST), Vol. 4 No.02 February 2012, pp 703-709. 2012
(ISSN: 0975-5462). http://www.ijest.info/docs/IJEST12-04-02-135.pdf
[8] T. Webster, “Temperature Stressing (Lipid Triggering) of Salt Water
Algae for Enhanced Lipid Production,” B.S. Honors Thesis, Chemical
Engineering Dept., University of New Hampshire (UNH) (I Farag,
advisor). 2009.
[9] R. Wilson, and I Farag, “Parametric Study of Biodiesel Quality and Yield
Using a Bench-Top Processor,” International Journal of Oil, Gas and
Coal Technology 2012 - Vol. 5, No.1 pp. 92 - 105, 2012
[10] R. Wilson, G. Salama, and I., Farag. "Microalgae Growth in Qatar for
CO2 Capture and Biodiesel Feedstock Production,” Global Journal of
Researches in Engineering (GJRE), Chemical Engineering, Volume 12
Issue 1 Version 1.0 Year 2012, Online ISSN: 2249-4596 & Print ISSN:
0975-5861. 2012.
[11] Z. Zuka, B. McConnell, and I. Farag, "Comparison of Freshwater and
Wastewater Medium for Microalgae Growth and Oil Production,”
Journal of American Science 2012; 8(2):392-398. (ISSN: 1545-1003).
http://www.jofamericanscience.org/journals/am-sci/am0802/055_815
0am0802_392_398.pdf
[12] B. McConnell, “Kinetics of microalgae oil extraction,” B.S. Honors
Thesis, Chemical Engineering Dept., University of New Hampshire
(UNH) (I. Farag, advisor). 2013.
[13] D. Eltringham, M. Elmoraghy, and I. Farag, “Algae Growth in
Photobioreactors using a Removable Jacket of Colored LEDs,” 16th
Annual Energy & Environment Conference & Expo (EUEC 2013), Jan
28 – 30, 2013, Phoenix Convention Center, Phoenix, AZ.
[14] D. Eltringham, and I. Farag "Greener Algae Growth in
Photobioreactors using LEDs to Maximize Lipid Production,” the 17th
Annual Green Chemistry & Engineering (GC&E) Sustainable
Chemistry & Engineering for the 21st Century, June 18-20, 2013
Washington, DC
[15] J. Ferrentino, “Microalgae oil extraction and in situ
transesterification,” M.S. Thesis, Chemical Engineering Dept.,
University of New Hampshire (UNH) (I. Farag, advisor). 2007.
[16] K. Price, M. Elmoraghy, and I. Farag, "Energy and Water Resource
Efficient Production of Microalgae Lipids,” 16th Annual Energy &
Environment Conference & Expo (EUEC 2013), Jan 28 – 30, 2013,
Phoenix Convention Center, Phoenix, AZ. 2013.
[17] S. Tewfik, S. Hawash, N. Atteya, G. El Diwani, and I. Farag.
“Techno-Economic Appraisal of Biodiesel from Jatropha curcas: An
Kinetics Study of the Solvent Extraction of Lipids from Chlorella vulgaris
37 www.erpublication.org
Egyptian case study,” Journal of Agricultural Science and Technology
(JAST) B 2 (2012) 287-297. 2012.
[18] M. Elmoraghy (2013), “Production of Bio-Jet Fuel from Microalgae,”
M.S. Thesis, Chemical Engineering Dept., University of New
Hampshire (UNH) (I. Farag, Mentor). 2013.
[19] K. Price, and I. Farag, "Resources Conservation in Microalgae
Biodiesel Production,” International Journal of Engineering and
Technical Research (IJETR), ISSN: 2321-0869, Volume-1, Issue-8,
October 2013, pp 49-56,
http://erpublication.org/admin/vol_issue1/upload%20Image/IJETR01
1833.pdf
[20] Q. Hu, M. Sommerfeld, E. Jarvis, M. Ghirardi, M. Posewitz, M.
Seibert, et al., Microalgal triacylglycerols as feedstocks for biofuel
production: Perspectives and advances, Plant J. 54 (4) (2008) 621-639.
[21] H.C. Greenwell, L.M. Laurens, R.J. Shields, R.W. Lovitt, K.J. Flynn,
Placing microalgae on the biofuels priority list: A review of the
technological challenges, J. R. Soc. Interface 7 (46) (2010) 703-726.
[22] S. Kanes, “The Choice of Next-Generation Biofuels,” Equity Research
Industry Report, Scotia Capital, 2009.
[23] "2.3. Algal Production." FAO Corporate Document Repository.
Fisheries and Aquaculture Department”, Wed. 23 Sept. 2012.,
http://www.fao.org/docrep/003/W3732E/w3732e06.htm
[24] L. Xin, G. Ke,, S. Ying-xue, “Effects of different nitrogen and
phosphorus concentrations on the growth, nutrient uptake, and lipid
accumulation of a freshwater microalga Scenedesmus sp.”,
Bioresource Technology 101: 5494–5500, 2010.
[25] EPA (U.S. Environmental Protection Agency). 2008. Clean
Watersheds Needs Survey 2004.
[26] S.A. Khan, H. Rashmi, M.Z., Hussain, S. Prasad, U.C. Banerjee,
Prospects of Biodiesel Production from Microalgae in India.
Renewable & sustainable energy review, 2009: 13 (9). pp. 2361-2372.
[27] R. Halim, M.K. Danquah, and P.A. Webley. "Extraction of Oil from
Microalgae for Biodiesel Production: A Review." Biotechnology
Advances 30 (2012): 709-32. Print.
[28] J.Y. Lee, C. Yoo, S.Y. Jun, C.Y. Ahn, and H.M. Oh. "Comparison of
Several Methods for Effective Lipid Extraction from Microalgae."
Bioresource Technology 101.1 (2010): S75-77. Print.
[29] A.L. Ayers, J.J. Dooley, J. Am. Oil Chem. Soc. 25:372 (1948).
[30] W.A. Pons Jr., P.H. Eaves, “Aqueous acetone extraction of
cottonseed”, J. Am. Oil Chem. Soc., 44, 460–464 (1967).
[31] F.S. Taha, H.E. Helmy, A.S. EI-Nokrashy. “Changes in cottonseed oil
when used for frying vegetable products containing chlorophyll”,
Journal of the American Oil Chemists’ Society, 5, 267–271 (1988).
[32] A.E. MacGee, Oil & Soap 4:324 (1937).
[33] A. Seher, Ch.K. Moon, Z. Lebensm, Unters. Forsch. 167:82 (1978).
[34] E.J. Conkerton, P.J. Wan, O.A. Richard, “Hexane and Heptane as
Extraction Solvents for Cottonseed: A Laboratory-Scale Study”,
JAOCS, Vol. 72, no. 8 (1995).
[35] L.A. Johnson, E.W. Lusas, J. Am. Oil Chem. Soc. 60:181A (1983).
[36] A. Patricelli, A. Assogna, A. Casalaina, E. Emmi, G. Sodini, “Fattori
che influenzano l’estrazoine dei lipidi da semi decorticate di girasole”,
La Rivista Italiana Delle Sostanze Grasse, 56, 136-142 (1979).
[37] S.G. Ozkal, M.E. Yener, L. Bayindirli, LWT-Food Sci. Technol, Vol.
38, 2005, p. 611.
[38] Takeuchi et al., “A comparative study on the neurotoxicity of
n-pentane, n-hexane, and n-heptane in the rat.” British Journal of
Industrial Medicine. 1980 August; 37(3): 241–247.
[39] A.R. Fajardo, L.E. Cerdan, A.R. Medina, F.G.A. Fernandez, P.A.G.
Moreno, E.M. Grima. Lipid extraction from the microalga
Phaedactylum tricornutum. European Journal of Lipid Science
Technology 2007; 109:120–6.
[40] G.C. So, D.G. MacDonald. "Kinetics of Oil Extraction from Canola
(Rapeseed)." The Canadian Journal of Chemical Engineering 64.1
(1986): 80-86.
[41] S. Meziane, H. Kadi, O. Lamrous. "Kinetics Study of Oil Extraction
from Olive Foot Cake." Grasas Y Aceites 57.2 (2006).
Brian McConnell graduated from the University of
New Hampshire in May 2013 with a B.S. in Chemical Engineering (Summa
Cum Laude) with University Honors. He completed several projects during
his 3.5 years with the UNH Biodiesel Research Group. Some of his awards
include: 2010 UNH Research Experience and Apprenticeship Program
(REAP) grant, 2011 UNH Summer Undergraduate Research Fellowship
(SURF), 2011 United States Environmental Protection Agency Greater
Research Opportunities Fellowship for Undergraduate Environmental
Study, 2012 Barry M. Goldwater Scholar, 2013 UNH Undergraduate
Research Award, 2012 & 2013 UNH Undergraduate Research Conference
Award of Excellence. He has co-authored two peer-reviewed journal articles
and given presentations at two professional and four undergraduate research
conferences.
Ihab H. Farag Professor Emeritus, Chemical
Engineering at University of New Hampshire. In Sept 1976, he joined the
faculty at UNH after receiving his doctorate of Science (Sc.D.) from the
Massachusetts Institute of Technology (MIT) in Chemical Engineering. His
research has focused on biofuels, microalgae biodiesel (renewable
alternative to petro-diesel liquid fuel), bio-jet fuels, cleaner production,
energy efficiency, and chemical risk screening applications. He initiated the
Bio-Oil Group, the Biodiesel Research Group and the New Hampshire
Pollution Prevention Internship Program to involve and mentor
interdisciplinary students in research and industrial projects. Invited
presentations and briefings were given to the legislators on Pollution
Prevention, Biomass, Biodiesel and Bio-Oil. He has collaborated with
several countries, e.g., Bulgaria, Cambodia, Egypt, El Salvador, Pakistan,
Qatar, Thailand and Vietnam on the production of Biodiesel fuel from
Jatropha and microalgae and on Pollution Prevention applications. These
resulted in over 130 publications and presentations and being invited to be a
Keynote speaker and to organize international and regional conferences.
Dr. Farag received a number of prestigious awards, e.g., the US EPA
Environmental Merit award, the Coast Guard Meritorious Commendation,
the US Most Valuable Pollution Prevention (MVP2) Program award, and the
UNH award for Excellence in International Engagement. In addition, he
received several Outstanding Teaching awards at MIT and UNH.