kingdom of morocco transport sector strategy paper · kingdom of morocco transport sector strategy...
TRANSCRIPT
Report No. 971 2-MOR
Kingdom of MoroccoTransport Sector Strategy PaperSeptember 20, 1993
Infrastructure Operations DivisionCountry Department IMiddle East and North Africa Regional Office
FOR OFFICIAL USE ONLY
MICROGRAPHICS
Report No: 9712 MORType: SEC
Document of the Werld Bank
This document has a restricted distribution and may be used by recipientsonly in the performance of their official duties. Its contents may not otherwisebe disclosed without World Bank authorization.
Pub
lic D
iscl
osur
e A
utho
rized
Pub
lic D
iscl
osur
e A
utho
rized
Pub
lic D
iscl
osur
e A
utho
rized
Pub
lic D
iscl
osur
e A
utho
rized
Pub
lic D
iscl
osur
e A
utho
rized
Pub
lic D
iscl
osur
e A
utho
rized
Pub
lic D
iscl
osur
e A
utho
rized
Pub
lic D
iscl
osur
e A
utho
rized

CURRNCY FOUIVwALNTS
Currency Unit * Moroccan Dirhams (DH)DH 1.00 - US$0.11DH 9.00 * US$1.00
(As of January 1993)
FISCAL YEAR
January 1 - December 31
PR.INIPAL ABBRBVATIONS
CAP a Certificat d'Aptitude ProfessionnelleCNPAC . National Committee for Traffic Accident ForecastingCTM a National Interurban Bus CompanyDP - Ports DirectorateDRCR * Roads and Road Traffic DirectorateDTT * Directorate of Overland TransportGVW a Gross vehicle weightIRU * International Road Transport UnionIV a Inspecteur voyageurMOF = Ministry of FinanceMOT = Miniatry of TransportMPW = Ministry of Public WorksQAC = Casablanca Airport AuthorityODEP * National Port EnterpriseONCF - National Railway ServiceONDA 3 National Airport ServiceONICL = national Cereals BoardONT a National Road Freight Transport OfficePERL = Public Enterprise Restructuring LoanRAM = Royal Air MarocRAWC = Casablanca Port Authorityro-ro a roll-on/roll-offSDNT = National Transport Master Plan StudyTIR * International Road Transportvpd = vehicles per day
FOR OFFICIAL USE ONLYKINGDOM OF MOROCCQ
TRANSPORT SECTOR STRATEGY PAPER
Contents
Executive Summary . . . . . . . . . . . . . . . . . . . . . . . . . . i
I. TRANSPORT IN THE ECONOMY .1... . . . . . . . . . . . . . . . . . . I
A. Geographic and Economic Framework . . . . . . . . . . . . . . . 1
B. Institutions, Administration and Planning . . . . . . . . 1. . .C. Overview of the Sector .... . . . . . . . . . . . . . . . . 2D. Recent Investment Trends . . . . . . . . . . . . . . . . . . . 6
II. SECTOR DEVELOPMENT PROGRAM ... . . . . . . . . . . . . . . . . . . 8
A. Sectoral Issues .... . . . . . . . . . . . . . . . . . . . 8
B. Investment Rationalization and Strategy . . . . . . . . . . . . 8C. Enterprise Reform .... . . . . . . . . . . . . . . . . . . . 11D. Rationalization of the Transport System . . . . . . . . . . . . 15E. Environment and Safety .... . . . . . . . . . . . . . . . . 18
ANNEX 1: Transport Policy Matrix
ANNEX 2: The Transport System
TABLES
This report was prepared by Henri Beenhakker (Principal Economist) with theassistance of Philip Cornwell, Richard Timberlake and Bassem Younes(consultants).
This document has a restricted distribution and may be used by recipients only in the performanceof their official duties. Its contents may not otherwise be disclosed without World Bank authorization.
KINGDOM OF MOROCCO
TRANSPORT SECTOR STRATEGY PAPER
Executive Summarv
1. For its domestic transport needs, Morocco relies on all modes oftransport, including road, rail, coastal shipping and aviation. Shipping andaviation dominate international traffic, although there is a growing demand forcar ferry services to Europe across the Straits of Gibraltar. Road transport isthe dominant mode for both freight and passenger traffic but the railway playsa substantial role in the main urban corridor between Casablanca and Rabat andits eastward extension to Meknes and Fes. The classified road network includessome 28,000 km of paved roads and some 30,000 km of unpaved roads, the networkbeing concentrated mainly in the areas of economic activity to the north of theAtlas Mountains. The country is also served by a 1,800-km rail network, most ofwhich carries relatively high traffic densities ranging from 1.3 million to 5.5million traffic units per kilometer of line. There are 11 commercial ports, ofwhich the most important are Casablanca for commercial traffic and phosphates,Mohammedia for oil imports, Jorf Lasfar and Safi for mineral traffic, andTangiers for roll-on/roll-off (ro-ro) traffic with Europe. There are also 15commercial airports, of which 10 cater to tourist traffic from Europe.
2. Given the relatively broad distribution of economic activity in thenorthern part of the country and the dominance of Casablanca as the maincommercial port, the principal transport flows are organized around theseregions, where transport demand has increased steadily over the past decade atthe rate of 4-5% per year. This growth is expected to continue, in line withprojected increases in GDP. The main east-west corridor from Casablanca to Fesis now taking or, even greater significance with the development of trade amongthe Maghreb countries, while traffic on the north-south corridor linking theRabat-Casablanca area with Tangiers and Europe is also showing substantialgrowth. It is in these main corridors that investments are planned for the nextdecade, in order to meet expected increases in passenger and commodity flows.
3. Interurban bus services are provided by small private companies orcooperatives and by a public nationwide bus enterprise - National Interurban BusCompany (CTM) - which accounts for about 10% of the market. Altnough truckingis entirely in private hands, the National Office of Transport (ONT), a publicenterprise, acts as mandatory intermediary for some 1,300 operators belonging toprivate companies and cooperatives with trucks above 8 tons gross vehicle weight(GVW). This sector of the market accounts for about 32% of total traffic, whileprivate operators with trucks of up to and including 8 tons GVW, who are outsideONT control, account for 35%, and large own-account operator.s represent about33%. Thus it is possible that a large proportion of long and medium-distancefreight is being handled by small vehicles at considerable cost to the economy,when large trucks would be more economical. This possibility will beinvestigated during completion of the National Transport Master Plan (SDNT),which serves as the basis for development of an action plan. Vehicle fleetrenewal is also an issue reflecting high import duties for transport equipment.
4. Rail traffic has increased steadily in recent years and the Nationalrailway service (ONCF), plays a significant role in the movement o'c interurban
-ii-
passenger and freight traffic and in mineral traffic for export. ONCF carriessome 5.7 billion ton-km of freight traffic annually, of which 70% is accountedfor by movements of phosphate rock from the interior mines to the ports.Passenger traffic is around 2 billion passenger-km per year with about 15%accounted for by high-speed services currently provided on the 90-km routebetween Casablanca and Rabat. ONCF operates at a high level of efficiency, itsperformance indicators comparing more than favorably with those of advancedEuropean railways. However, ONCF's overall performance suffers from a lack oftransparency in its relationships with the Government, particularly concerningresponsibilities for infrastructure investments, compensation for public serviceobligations, and cost recovery on phosphate traffic.
5. Following a reorganization of the port sector in 1985, the portsystem is operated in an efficient manner, with revenues yielding a substantialsurplus over operating costs. The National Port Enterprise (ODEP), a publicenterprise, operates 11 commercial ports, of which four - Casablanca, JorfLasfar, Safi and Mohammedia - account for some 90% of total traffic. The maincommercial port is Casablanca, which handled 17 million tons in 1988, including10 million tons of mineral products and 3.5 million tons of general cargo.Containerization and roll-on/roll-off technology have penetrated a large shareof the general cargo market, and over 65% of unitizable cargo through the portof Casablanca is already containerized. At Tangiers, over 80% of the cargo isunitized, mainly in roll-on/roll-off trailers. Rapid increases in high-valueunitized goods have resulted in substantial investments being committed to thecreation of container terminal facilities in Casablanca, and investments areplanned for the installation of roll-on/roll-off facilities in Tangiers.Attention is also being given to the development of facilities for bulk traffic,particularly coal imports. However, Morocco still suffers from insufficientcapacity to handle an annual volume of 1.5-2 million tons of cereal imports,although there are now plans to construct a new silo in the port of Agadir.
6. International maritime and air services operate within the frameworkof bilateral agreements and international meetings governing rates and marketaccess. A trade logistics and facilitation study is currently being undertakenby the Government with a view to delineating issues related to commoditydistribution systems and to drawing up an appropriate plan of action.
Sector Investments
7. While minimal investments were made in transport during the 1960s,economic growth during the 1970s resulted in increased demands on the network andan increase in the transport investment program. Over the past decade,investments in transport have increased about 40% in real terms, from an annualaverage of DH 2.5 billion (US$360 million) during 1981-87 to about DH 4.7 billion(US$560 million) during the 1988-92 Plan. During the early 1980s, emphasis wasmainly on the development of port infrastructure, rehabilitation of the roadnetwork, and construction of an expressway between Casablanca and Rabat. Morerecently, civil aviation, particu'larly the procurement of aircraft, has seenmajor increases in line with the growth of tourism. The share of the road sectorhas also continued to increase as a result of the need to rehabilitate theprimary network. In contrast, the share of railway investment has decreased inrecent years following government action to reduce its support for investments
-iii-
in railway infrastructure. This weakening of government support comes at a timewhen capacity constraints are being felt on key sections of the railway network.
Sector Issues
8. These are four main areas in the transport sector on which theGovernment needs to focus its attention:l/
a) investment rationalization;
b) public enterprise reform;
c) rationalization of the transport system; and
d) environmental and safety aspects of transport programs.
9. At this time of budgetary constraints, there is an ever- increasingneed to rationalize the transport investment program and to define a highpriority program to support continued economic growth and the development ofexport trade. Particular attention reeds to be given to expansion of therehabilitation and maintenance program for the principal primary roads, theupgrading of some 6,000 km of secondary and tertiary routes, as well as themaintenance of some 30,000 km of unpaved tertiary roads. Studies to prepare sucha program have been launched with Bank assistance. Similarly, the Bank isassisting ONCF in the preparation of a major preinvestment study for the period1994-97, which is expected to establish preinvestment priorities and to identifya program designed to tackle the backlog in track renewal and rehabilitationwhich has been accumulating over the years. Although the major port investmentneeds in terms of container traffic are being met by the current ports program,little has been done to provide appropriate facilities for cereal handling,resulting in substantial foreign exchange losses on sea freight rates andhandling charges. Attention also needs to be focused on the rapid growth offerry traffic at Tangiers and the inadequate berth and storage facilitiescurrently available for this traffic. These issues need to be brought into focusduring the current updating of the Ports Master Plan Study.
10. Assistance with public enterprise reform was initiated in 1987 withthe Bank's First Public Enterprise Restructuring Loan (PERL). Since that time,support has also been provided through investment lending. The reform andfinancial restructuring of the public enterprises are now an integral part of theadjustment process, the main objectives being to increase operational efficiency,reduce the public sector deficit, and provide services which support economicgrowth. This approach places the institutional framework at the center of thereform process, this process being spelled out in the form of a performancecontract defining the respective responsibilities of both parties. Performancecontracts in the transport sector have been successfully implemented for RoyalAir Maroc (RAM) and the port enterprise, ODEP. A railway performance contractis now under preparation and is expected to include a clear definition ofresponsibilities for infrastructure investments, compensation payments for social
I/ The main issues and a proposed action plan are sunmarized in Annex 1.
- iv-
f.re reductions, and a revised rate for phosphate transport to provide recoveryaf long-run marginal costs.
11. In its initial conclusions, following its analysis of the optionsavailable for resolving the problems of road freight transport, the SNDT suggeststhe following measures for its rationalization:
(a) legalization of transport for hire by operators with trucks of upto and including 8 tons GVW; this would offer greater security andestablish a more sound basis for operation of these vehicles;
(b) rationalization of the sector through the establishment of specificcriteria for access to the transport market and a review of thepossibilities for eliminating tariff controls on transport for hireoperations; reinforcement of ONT's commercial activities;concentration of resources on technical inspections (vehiclesafety) and enforcement of the laws; improvements in the vocationaltraining offered to operators, culminatlng in the award of aCertificat d'aptiture professionnelle (CAP); and
(c) promotion of vehicle fleet renewal and development of the sectorthrough changes in the system of taxation, reducing taxes on thepurchase of new vehicles and (as far as possible) transferring theburden of those taxes to operating expenses.
12. Increasing attention uieeds to be given to the environmental ar.dsafety aspects of transport programs. Systematic studies are now beingimplemented in the port sector concerning dredging programs, and new guidelinesare being prepared for the vehicle inspection program. Support for both of theseprograms is being provided by ongoing Bank sector projects.
I. TRANSPORT IN THE ECONOMY
A. Geographic and Economic Framework
1.01 Over the past six years, Morocco has undertakca important structuralreforms and has achieved a modest economic growth rate with low inflation.During this period, the economy grew at an annual rate of about 3.3%, slightlyfaster than the increase in population The medium term program seeks toreinvigorate the economy and to achieve a growth rate of 4-5% per year. Thereform program is based largely on trade rationalization, increased publicenterprise efficiency, and price incentives in t-he agricultural sector. Inparallel, a major program of social development is being implemented. While therecovery process has been outstanding, the fall in tourism revenues in the wakeof the Gulf crisis was a severe blow. It is essential that Morocco continue itsreform process and make full use of its comparative advantages.
1.02 Morocco has a population of about 27 million and occupies an areaof some 459,000 km2, excluding the Western Sahara. Much of the population, andmost of the main urban centers, are located to the north of the Atlas Mountains,which stretch across the country from the south-west to the north-east. Inrecent years, the national population has increased at 2.6% per year, lut therate of increase of the urban population has been much higher - around 3.7% peryear. As a result, the rate of urbanization increased from around 30% in 1970to 46% in 1991. Although the coastal citie, of Casablanca (population 3 million)and Raba;-Sale (population 1 million) have historically dominated the urbanhierarchy, there is now a more balanced pattern of urban development, with some15 cities with populations of over 100,000. The major urban centers in theinterior include Fes (700,000) and Meknes (450,000) in the east, Marrakech(600,000) in the south, and Tangiers (400,000) in the north. Urban growth iscurrently centered in these medium-sized cities.
1.03 Tth. population distribution associated with the main areas ofeconomic activity, and the relative complementarity existing between the mainregions in terms of economic output, have contributed to high levels of transportdemand within the country. The main passenger and commodity flows areconcentrated in the corridor linking Casablanca and Rabat, with extensionseastward towards Meknes and Fes, and nc.thward to Tangiers. Marrakech and Agadirin the south also generate sulstantial traffic flows to and from the central andnorthern areas. Many of these movements are centered on Casablanca, thecountry's main port, which handles over 75% of Morocco's general cargo foreigntrade and nearly 90% of container and roll-on/roll-off (ro-ro) traffic.Superimposed on these movements are exports of phosphates and phosphatederivatives, which are carried by rail from the central and south-centrai partsof the country to the ports of Casablanca, Jorf Lasfar and Safi.
B. Institutions. Administration and Planning
1.04 The government agencies involved in the administration of thetransport system are: (a) the Ministry of Public Works (MPW), which isresponsible for the construction and maintenance of roads and port irfrastructurethrough its Road and Port Directorates; it also oversees cargo handling and portoperations carried out by the National port enterprise (ODEP); (b) the Ministryof Transport (MOT), responsible for the regulation and coordination of road, rail

-2-
and air transport through the Directorate of Overland Transport, the Directorateof Air Administratior., and the Directcrate of Transport Studies, Planning andCoordirnation. It also oversees public enterprises such as National RailwayService (ONCF), National Road Freight Transport Office (ONT), National AirportService (ONDA), National Interurban Bus Company (CTM), Royal Air Maroc (RAM), ardthe National Committee for Traffic Accident Forecasting (CNPCA); (c) the Ministryof Fisheries and Merchant Marine, which supeivisos the national shipping line(COMANAV) and provides maritime security through its Directorate of MerchantMarine; and (d) the Ministry of Interior, which supervises the local authoritiesas they become more and more involved in the planning and maintenance of localroads.
1.05 Given the large number of agencies involved in the management of thesector, there is sometimes an overlap of responsibilities between the differentagencies. In the ports subsector, both ODEP and the Ports Directorate (DP) ofMPW have responsibilities for planning port infrastructure and for overseeingport operations. With increasing decentralization and the -obilization ofresources at the loca'l authority level (including the introduction of a valueadded tax), it became necessary to allocate new responsibilities to both centraland local government. This has led to a redistribution of responsibilitiesconcerning the road network between MPW and the local authorities. In parallelwith increasing decentralization, there are moves to introduce more autonomy forpublic enterprises in the transport sector. The wovernment has decided toprivatize CTM. The financial restructuring of a number of public enterprises andthe preparation of performance contracts, clearly defining the respectiveresponsibilities of the Government and of the enterprises, ar- being pursued bythe Ministry of Finance (MOF). Performance contracts have been established withthe national &irline, RAM and port enterprise, ODEP, while a performance contractfor the ra't%--ys ONCF is in course of preparation.
1.06 Apart from routine activities, MOT is concerned mainly with theregulation of public road freight operations through ONT and the management ofairports through ONDA. ONCF, supported by MOT, is in process of clarifying itscomplex financial set-up. Coordination at the level of road and railinfrastructure development needs to be improved, an issue that will require closemonitoring as capacity constraints begin to affect transport facilities in thecoming decade. Coordination issues of this nature are ultimately left to thefinal decision of the Prime Minister. In early 1988, MOT started work on aNational Transport Master Plan Study (SDNT) with the objective of defining anaction plan for the sector and an investment program for the period 1993-97.This study fell behind schedule, and has now been overtaken by recent events, inparticular the launching of a number of subsectoral preinvestment studies. Thereasons why the study was not completed on time were its complexity and theinsufficient time allotted to it. MOT is awaiting its completion in order tostart preparing an action program.
C. Overview of the Sector
1.07 The Moroccan transport sector accounted for just under 7% of GDP in1990, compared to only 4% a decade earlier. The sector currently employs over140,000 persons, representing some 2.4% of the working population. The overlandtransport system is well developed and includes some 58,000 km of classified
-3.
roads and a railway network of about 1,800 km, of which 970 km are electrifiedand 240 km are double-track. There are 11 commercial ports and 15 airportshandling scheduled flights. Road transport carries by far the largest share ofpassenger traffic, accounting for about 90% (19.1 billion passenger-km per year)of total interurban passenger traffic (estimated at 21.4 billion passenger-km peryear); road transport also accounts for 43% of total freight transport, estimatedat 11 billion ton-km per year (70% excluding phosphate traffic). However, themarket share of the railway is much more important in the main rail corridorbetween Marrakech, Casablanca, Rabat and Kenitra and the extension eastward toFes and Oujda and northward to Tangiers. Over half of total interurban traffictakes place in this extended corridor, with the railway handling about 20% ofpassenger traffic and 50% of freight traffic. About 4 billion ton-km of railtraffic, or 70% of the total, relate to captive phosphate traffic en route to theports of Jorf Lasfar, Casablanca and Safi for export.
1.08 Both road and rail traffic have increased fairly steadily over thepast decade at a rate of 4-5 % per annum. In fact, the railway has increased itsshare of interurban passenger traffic from a low 6% in 1977 to around 10% at thepresent time, mainly as a result of improved services, in particular the fasttrains between Casablanca and Rabat. Total port traffic reached 36 million tonsin 1988 and is composed of 24 million tons of solid bulk cargo, 7 million tonsof liquid bulk, and 5 million tons of general cargo, of which about 30% isunitized (containers or ro-ro). Total port traffic increased by over 5% per yearduring the period 1983-87, but jumped by 13% in 1988 as a result of increases inexport traffic. This growth has increased the need to further develop containerand ro-ro facilities and to provide facilities for bulk imports of coal andcereals.
Road Infrastructure
1.09 Morocco's road network comprises about 58,000 km of classifiedroads, of which 28,000 km are paved. The paved network includes some 9,000 kmof primary roads, which carry traffic volumes ranging from about 750 to over5,000 vpd, with an overall average of 1,500 vpd. The network is concentratedmainly in the area to the north of the Atlas Mountains, the south being servedby a limited network of key primary routes linking the main population centers.The quality of the network is uneven; there are only 1,500 km of primary routeswith pavement widths of at least 7 meters; much of the network is substandard andinadequate for the volumes of traffic carried. About 60% of the paved network(some 16,000 km) have pavement widths of less than 6 meters, while about 20%(about 6,000 km) have widths of less than 4 meters. In addition, there are some30,000 km of unpaved classified roads which have received little maintenance inrecent years. The network also includes a 90 km expressway between Casablancaand Rabat, completed in 1987.
Road Transport
1.10 Interurban bus and truck services are operated mainly by privatecompanies and cooperatives. Bus routes and service frequencies are regulated;fares are subject to a maximum established by a committee headed by the PrimeMinister and based on MOT's recommendations. Although all trucks are owned bythe private sector, ONT acts as mandatory intermediary for some 1,300 pri.vete
-4-
operators and cooperatives offering for-hire services. The market is split intothree segments: (a) operators with trucks of up to and including 8 tons grossvehicle weight (GVW), which carry about 35% of freight nationwide; (b) own-account operators, with vehicles in excess of 8 tons gross vehicle weight (GWW),which handle about 33% of interurban road freight traffic; and (c) publiccarriers with trucks of over 8 tons GVW, affiliated with ONT, wnich handle theremaining 32% of the road freight market.
1.11 Taken as a whole, road freight transport wo-ks reasonably well, withhigh rates of vehicle utilization and overall load factors of about 60% for mostinterurban movements. For category (a) and (b) vehicles (para. 1.10), theaverage age is high and on the rise: over 10 years for light- and medium-sizedtrucks, and about 8 years for semi-trailers; for category (c) vehicles, theaverage age Is 7 years. This reflects the low level of tariffs, low maintenancelabor costs, and, above all, the high customs and import duties on new vehicles.A large percentage of long- and medium-distance freight is handled by smallvehicles, whereas considerable savings could be achieved through the use oflarger and more efficient trucks. This skew in traffic distribution reflects thefact that public operators of heavy trucks of over 8 tons GVW are obliged tc usethe services of ONT, which has the monopoly on road freight services. ONT actsas a marketing agency, charging a reference (maximum) tariff, to which it appliespreferential rates depending on consignment size, trip frequency, trip distance,road conditions, and fuel differential; the rates applied vary between 3% and 6%depending on the product transported. To compensate its members for empty back-hauls, ONT receives an additional one percent. Possible rationalization of thesystem has been discussed for a number of years but little progress has beenmade.
Railways
1.12 Railwav services are provided by ONCF, which is under h.hadministration and jurisdiction of MOT. ONCF operates about 1,000 trains perweek over its 1,800 km network, the services being evenly divided betweenpassenger and freight services, e,.cl'iding phosphates. Average traffic densityexceeds 4 million traffic units per route kilometer, higher than that of the mainEuropean railways. ONCF has a fleet of some 240 locomotives, 370 passenger carsand over 10,000 freight cars, which are kept in good condition thanks to adequatemaintenance facilities. Availability and productivity of locomotives and rollingstock are good compared with Western European levels and have gradually beenimproved over the years. Average availability is 83Z for electric locomotives,85% for main line diesels, 75 to 80% for passenger coaches and 95% for freightstock. ONCF has a total staff of about 13,000, including 600 managerial staff.Productivity is high (590,000 traffic units per employee)2 and training programscontinue to emphasize the introduction of modern methods of management andoperation. In recent years, ONCF has introduced improved cost accounting andmanagement information systems and is now in a position to formulate improvedpricing and management pclicies. The transport of phosphate rock from the minesin the interior to the ports, where it is exported, accoints for about 70% of the
2/ Traffic unit = passenger-km and ton-km coembined
-5-
5.7 billion ton-km of freight traffic and provides 40% of ONCF's revenue.Passenger traffic amounts to about 2 billion passenger-km per year, includingfast passenger trains between Casablanca and Rabat. Dassenger trains operate athigh occupancy ratios, on the order of 85% for most trains. Although fares wouldhave to be increased to cover operating costs and long-run marginal costs, thequality of service provided on high grade trains has improved considerably andmuch of this traffic is probably inelastic to gradual changes in fares.
forts and Maritime Trans..r_t
1.13 Morocco's port infrastructure has expanded rapidly to cope witnincreas'ng demands for maritime transport and related activities. Elevencommercial ports form three main groups: a northern group comprising Tangiers andNador; a central group comprising Kenitra, Mohammedia, Casablanca and JorfLasfar; and a southern group comprising Safi, Agadir, Tan-Tan, LaAyoune andDaklila. Agadir, Nador, and the main port, Casablanca, are well diversified.Other ports are somewhat specialized: petroleum products are essentially handledat Mohammedia, phosphate products at Jorf Lasfar and Safi, and passenger trafficat Tangiers. The 11 ports have a total of 150 berths, with an overall length ofabout 21,500 meters and an average length per berth of 150 meters. All ports useeither mobile or fixed cranes (about 160) for vertical lifting of general cargo.Specialized equipment is available for solid bulk commodities, such as mineralproducts and cereals (nine gantry cranes). During the 1980s, there was a majorexpansion in port infrastructure but there is now an urgent need to adapt thesefacilities to the latest develnpments in handling techniques, such as containerand ro-ro technology, and to meet the demand for bulk imports of coal andcereals.
1.14 The port system, like sh. .ailways, was developed to handlephosphate exports, which have stabilized in recent years at 14 million tonsanrually. Total port traffic in 1988 amounted to 38 million tons, of which 18million tons were mineral products, mainly pbosphate exports, and 10 million tonswere liquid bulk commodities, of which crude oil accounted for 5 million tons.Of the eleven commercial ports, four - Casablanca, Jorf Lasfar, Safi andMohammedia - handle about 90X of total traffic. The main port of Casablancahandled 17 million tons in 1988, including 10 million tons of mineral products,and imports and exports of industrial goods totaling 3.5 million tons. About 30%of general cargo traffic was containerized or handled as ro-ro traffic.
1.15 Maritime transport accounts for 98% of Morocco's volume of foreigntrade, with European trade amounting to some 50% of the total. Maritime shippingis largely based on two major public shipping companies in Morocco, COMANAV,which operates liner services, and MARPHOCEAN, which operates phosphate rockships and chemical carriers. Two public companies are specialized in themaritime transport of petroleum pzoducts (PETROCAB) and citrus (SOFRUW.4). Thereare also several Moroccan private shipping lines handling specific products, suchas citrus, and passenger traffic. A number of foreign shipping lines are alsopresent, hence there is some degree of competition in the general cargo transportfield. Altogether, Moroccan shipping lines control about 20% of the total volume(33% of total value) of Moroccan freight and about 50% of general cargo traffic.

-6-
Civil Aviation
1.16 Civil aviation plays a major role in the country's economy and moreparticularly in the tourism sector, one of the country's sources of roreignexchange earnings. Of the 15 airports open to domestic and internationaltraffic, three account for about 80% of total passenger traffic: Casablanca(2,000,000), Agadir (740,000) and Marrakech (700,000). Scheduled commercial airservices are provided by RAM, whose fleet comprises 28 aircraft, including 2Boeing 747s, 2 Boeing 707s, 8 Boeing 727s, 2 Boeing 757s, 11 Boeing 737s, and 3ATR42s. In order to replaLe older Boeing 727s and 737s, and to expand services,RAM has begun to take delivery of 10 new aircraft (737-400s and 737-500s). RAMis a profitable enterprise and, currently carries about 2 million passengersannually. However, RAM's profitability results partly from high fares,particularly for services to and from France, which it operates in pool with AirFrance. Other foreign carriers are also present, but their services are limited.
D. Recent Investment Trends
1.17 Until the mid-1970s, few efforts were mude to expand or improve thetransport system, since the facilities inherited at independence were generallyadequate to handle transport demand. However, the growth of the economy duringthe 1970s, and the nes~d to rehabilitate existing infrastructure, required thattransport sector investment be increased. Over the past decade, investments haveincreased about 40X in real terms, from an annual average of about DH 2.5 billion(US$360 million) during 1981-87 to an annual average of about DH 4.7 billion(US$560 million) during the 1988-92 Plan. This change in investment levels hasalso been accompanied by a shift in priorities among the transport subsectors.
1.18 In the early 1980s, up to one third of the total program was devotedto the development of port infrastructure, including new ports at Jorf Lasfar andAgadir. In contrast, the shars of port development during the current plan hasbeen considerably reduced, the emphasis now being on adapting existing portfacilities to new handling technologies. Priority is now being given toincreased investment in road rehabilitation and maintenance, although much of theproposed increase is for local unclassified roads, following the transfer ofpart of the new value added tax to the local authorities. Civil aviation,particularly the procurement of aircraft, has also seen substantial increases inrecent years, in line with the growth of tourism. In contrast, investment inrailways has fallen in real terms since the end of the 1981-87 Plan, when theGovernment decided to decrease its support for railway investments, trimming itscapital subsidy from DH 800 million (US$100 million) in 1987 to an annual averageof DH 200 million (US$25 million) during the 1988-92 plan.
-7-
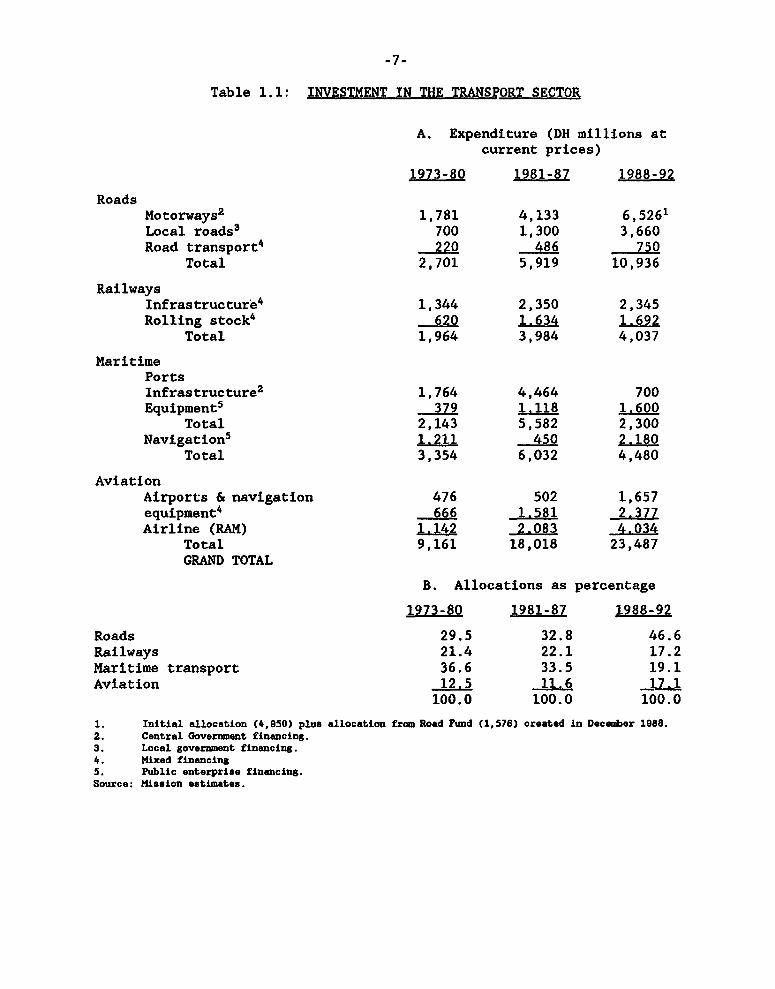
Table 1.1, INVESTMENT IN THE TRANSPORT SECTOR
A. Expenditure (DH millions atcurrent prices)
1973-80 1981-87 1988-92
RoadsMotorways2 1,781 4,133 6,5261Local roads3 700 1,300 3,660Road transport4 220 486 750
Total 2,701 5,919 10,936
RailwaysInfrastructure4 1,344 2,350 2,345Rolling stock4 620 1.634 1.692
Total 1,964 3,984 4,037
MaritimePortsInfrastructure2 1,764 4,464 700Equipment5 379 1.118 1.600
Total 2,143 5,582 2,300Navigation5 1.211 450 2.180
Total 3,354 6,032 4,480
AviationAirports & navigation 476 502 1,657equipment4 666 1.581 2.377Airline (RAM) 1.142 2.083 4.034
Total 9,161 18,018 23,487GRAND TOTAL
B. Allocations as percentage
1973-80 1981-87 1988-92
Roads 29.5 32.8 46.6Railways 21.4 22.1 17.2Maritime transport 36.6 33.5 19.1Aviation 12.5 11.6 17.1
100.0 100.0 100.0
1. Initial allocation (4,950) plus allocation from Road Fumd (1,576) created in December 1988.2. Central Government financing.3. Local government financing.4. Mixed financing5. Public enterprise financing.Source: Mission estimates.
-8-
II. SECTOR DEVELOPMENT PROGRAM
A. Sectoral Issues
2.01 Transport and distribution costs account for a substantial share ofthe cost of delivered goods. This means that these services have to becompetitive in order to achieve economies in the use of scarce resources, toincrease market-oriented activity with a view to encouraging regional and ruraldevelopment, and to enhance competitiveness in foreign markets. In short,efficiency objectives are at the core of any strategy to enhance the supportingrole provided by the transport sector in the development of the economy.
2.02 Following is an analysis of the key issues at stake in thedevelopment of the transport sector, with proposed strategies for dealing withthese issues over the medium term. The issues to be addressed are:
(a) rationalization of investment program: improved coordination amongsubsectors, emphasis on rehabilitation and maintenance, andlimiting of new investments to high priority programs designed toimprove efficiency and service quality;
(b) Dublic enterRrise reform: continuation of the program of publicenterprise reform, emphasizing greater accountability, operationalefficiency, sound pricing and cost recovery policies, andpossibilities for privatization;
(c) rationalization: rationalization of the transport system includingimproved market access, with the consequent encouragement ofcompetition and efficiency, and improvements designed to increasethe speed and efficiency of international transport services;
(d) environmental imnacts: heightened attention to minimization of theenvironmental impacts of transport infrastructure and services,particularly those related to port development, road safety, andvehicle emissions.
2.03 These issues need to be addressed in order to upgrade the efficiencyof the transport system and to reduce the sector's financial burden on theGovernment.
B. Investment Rationalization and Strategy
2.04 With increasing constraints on resources, there is a need torationalize the transport investment program and to apply sound economic criteriain the selection of investments for the sector. Investment levels in thetransport sector have increased in recent years and have mainly reflected anemphasis on the development of new infrastructure rather than on improving andmaximizing the use of existing facilities. A number of preinvestment studies havebeen launched with a view to preparing a sound investment strategy for the period1994-97. As the results of these studies are not yet available, the followingdiscussion is concerned with defining the main deficiencies in recent investmenttrends and establishing the main thrust of transport investment for the mediumterm.
-9-
Road Infrastructure
2.05 In recent years, rehabilitation and maintenance of the paved roadnetwork have fallen behind schedule. Some improvements in highway funding havebeen made recently, following the completion of a road user charges study in1988. This study showed that all road users were paying the full quantifiablecosts of road use and enabled MPW to set up a Road Fund in early 1989. Resourcesfrom this Fund - about DH 400 million annually - cover routine maintenancerequirements as well as part of the rehabilitation program. In 1989 and 1990,the Road Fund provided incremental resources over and above those allocated fromthe budget (about DH 800 million annually). However, budget allocations for 1991were reduced and the program is again falling short of requirements. Moreover,the amounts budgeted relate almost entirely to the 28,000 km paved network andlittle attention has been given to upgrading and maintaining some 30,000 km ofunpaved rural roads which also form part of the classified network. Whilereclassification of the network will result in a redistribution ofresponsibilities between central and local governments, much of the local roadnetwork will remain urder central government control, and appropriate resourcesneed to bA allocated to the betterment and maintenance of this network. Roadsand Road Traffic Directorate (DRCR) has recently initiated a study of the ruralroad network, including some 10,000 km of unclassified roads, with a view toestablishing a sound rural road betterment and maintenance program for the periodof the 1994-97 Plan.
Rai lwavs
2.06 A large backlog of rehabilitation and renewal needs also developedin the railway sector during the second half of the 1980s. During the pastdecade, ONCF experienced growth in passenger and freight traffic of at least 4%per year, which resulted in the need for continuing investment both inmodernization and rehabilitation of railway infrastructure and in equipmentrenewal and expansion. However, the railway suffered a substantial loss ofresources in 1988 when the capital subsidy was cut from DH 800 million to DH 200million annually. This decrease in the government transfers was to have beenaccompanied by the application of an agreed program of general tariff increases,compensation for social fare reductions, and a revised rate for phosphatetransport. These additional resources failed to materialize and ONCF began toreduce its investments in maintenance and rehabilitation, while being obliged tomaintain its commitment to new investments already committed. Investments intrack renewal during the current 1988-92 Plan were spread out until 1994,providing for 40 km of renewal each year, instead of the normal rate of at least70 km. The backlog should be cleared over the next five years.
2.07 ONCF recently launched a preinvestment study to establish itsinvestment priorities for the period 1994-97. This study is expected toemphasize the need for a stepped-up program of track renewal, beginning in 1994.Continuation of the track doubling program eastward towards Fes should,therefore, be appropriately phased to take account of the need to clear thebacklog of track renewal and rehabilitation requirements. The renewal programshould be given priority following completion of the ongoing track doubling
-10-
between Rabat and Kenitra (40 km) in 1993. As such, ONCF would be able toconsolidate its fast-train services and begin to tackle the track renewal backlogprior to embarking on further modernization of the network.
Port Sector
2.08 The emphasis in the port sector over the past decade has been on thedevelopment of new infrastructure. The sector suffered from poor coordinationbetween medium term infrastructure needs and the immediate operationalrequirements of the ports. Although this lack of coordination started to improvesomewhat in 1985 with the creation of ODEP, this improvement came too late toensure the timely adaptation of existing facilities to meet rapid changes incargo handling technology.
2.09 Current investments in new container handling facilities in the portof Casablanca are long overdue, the delay being attributable mainly to theinability of MPW and the port enterprise, ODEP, to reach a decision on thelocation and size of the container port and the phasing of its development.Similar problems have occurred with the development of bulk handling facilities.For instance, a coal berth completed at Jorf Lasfar in the mid 1980s hasinsufficient draft for 60,000-ton coal carriers. Similarly, despite cerealimports averaging 2 million tons annually over the last decade, only 50% of thoseimports are handled in bulk silos, the higher sea freight rates and handlingcharges resulting in substantial foreign exchange losses. These investmentissues are currently being addressed as part of a Bank-supported Port SectorProject. This project also includes a provision to update an existing portmaster study with a special emphasis on linking medium term planning andoperational analysis at each port in order to gauge the full potential ofexisting facilities before resorting to new investments.
Airport Infrastructure
2.10 With the current downturn in air traffic, particularly touristtraffic to Morocco, part of the somewhat ambitious airport expansion programcould be postponed. ONDA has planned a DH 1.2 billion program for the period1991-94. Most of this has been allocated to completion of a major terminalextension at Casablanca airport, ongoing works at the new airport in Agadir, andimprovements at Marrakech airport. However, the program also includesimprovements at a large number of minor airports which should now be postponed.Emphasis should be given to ongoing improvements in navigation and controlequipment and to the trainir.g program supported by bilateral financing fromCanada and a number of other countries.
Coordination of New Investments
2.11 Investments in infrastructure improvement will continue to becrucial to the process of upgrading efficiency and quality of service. However,these investments need to be evaluated by means of appropriate methodologies andstrict economic criteria.
2.12 In the short-to-medium term, there are unlikely to be major problemsin selecting options for alternative investments in the main transport corridors.
-11-
For instance, ongoing investments in railway track doubling between Rabat andKenitra (40 km) are justified on capacity grounds. Similarly, the existing roadbetween Rabat and Kenitra is also operating well beyond capacity and a newexpressway is now planned over this route. Beyond Kenitra, expresswaydevelopment is planned northward tow&rds Larache and Tangiers, while railinfrastructure improvements will take place eastward towards Meknes and Fes, acorridor in which the railway has a natural advantage. This pattern ofdevelopment is likely to provide the least cost solution to meet traffic demandsin the medium term. For expressway development, the justification north ofKenitra is based on distance savings for long distance traffic. However, thetraffic potential is low and a phased program of construction should beconsidered in order to optimize the investment. Moreover, each section shouldbe justified on economic grounds and not in terms of the availability offinancing from toll revenue generated on the existing expressway network.Similarly, the ONCF track doubling program needs to be phased to take account ofthe backlog of track renewal requirements and the results of the ongoingpreinvestment studies.
C. Enterprise Reform
2.13 Public enterprises in the transport sector in Morocco have sufferedfrom a lack of transparency in their relationships with the Government and froma lack of autonomy in day-to-day operations. The reform and financialrestructuring of these enterprises now form integral parts of the adjustmentprocess, the new objectives being to reduce the public sector deficit and tosupport trade rationalization through the provision of demand-responsiveservices. This approach places the institutional setting and the relationshipbetween enterprise and Government at the center of the reform process. It startswith an understanding of the purpose of the enterprise and what is expected ofit, clarifies the roles and responsibilities of the Government and theenterprise, and then considers the appropriate regulatory and institutionalframework. Clearly, this requires a comprehensive approach which goes beyond theoperational and financial considerations of the enterprise alone. A program ofpublic enterprise reform has been underway in Morocco since the mid-1980s and hasbeen supported by the Bank through both adjustment lending and project lending.However, there have been mixed results in the implementation of this program.For instance, while there has been some success in the port and air transportsectors, a number of issues need to be resolved in the railway sector. Lack ofGovernment commitment to the reform program has been the main problem. This lackof commitment is evident not only on the part of the MOF, but also on the partof some technical ministries concerned.
-12-
Railways
2.14 Improved relationships with the Government are central toimprovements in operational and financial performance. Although phosphatetariffs are adjusted annually for inflation, the base rate needs to be revisedto provide for proper cost recovery. This is a major issue, given the importanceof phosphates in operating revenue. Despite lack of support on tariffadjustments and compensation payments, the Government transferred to ONCFfinancing responsibilities previously vested in the Government and cut itscontribution to the investment program from some DH 800 million (US$100 million)in 1987 to less than DH 200 million (US$25 million) annually during the 1988-92Plan. During the same period, ONCF also embarked on several large modernizationinvestments and held back on certain tariff increases because of competition fromroad transport. While the transfer of financing responsibilities to ONCF hadbeen foreseen at the start of the 1988-92 Plan, this was to have been accompaniedby compensation for social fare reductions and a revised rate for phosphatetransport. In addition, the financial objectives set for ONCF, calling for totalcost recovery in the medium term, proved to be over-optimistic. These financialobjectives, together with the political power of the phosphate industry, provedto be key obstacles to negotiation of the phosphate transport tariff. Despitethese difficulties, ONCF more than covered its operating expenses and was ableto use the surplus to make a substantial contribution to its investments, theworking ratio improving from 84 in 1989 to a level of 75 in 1991. However, ONCFis presently unable to bridge the current resource gap that followed limitedgovernment participation in railway investments, and in this situation itscurrent lack of liquidity was inevitable. A clear definition of responsibilitiesbetween ONCF and the Government is therefore required in the form of an approvedperformance contract, which should be accompanied by a financial restructuringprogram that will take care of debts accumulated over the last four years.
2.15 A more realistic overall financial objective has now been proposedfor ONCF, which would require the enterprise to cover the long term marginal costof its services. The proposed system would involve setting tariffs at a levelsufficient to cover long term recurrent costs: users would pay operating expensesin full, plus a provision for fixed asset renewal at replacement cost. The non-renewable portion of infrastructure investments (right-of-way, unpaved roads,bridges and tunnels) would be financed by the Government and recouped throughgeneral taxation. In return, ONCF would be required to continue to reduce costs,particularly for passenger traffic, and to demonstrate the economic viability ofits investment program using an agreed methodology and applying well-definedcriteria. Government participation would thus be established on an objectivebasis rather than on the current basis, which derives primarily from budgetaryconsiderations. ONCF recently launched a preinvestment study of the maincomponents of its proposed program over the four-year period 1994-97, which willsubsequently be approved by the Government. ONCF is also undertaking aninventory and replacement-cost revaluation of its fixed assets, to be used as anobjective basis for general tariff setting. A cost accounting study has recentlybeen completed by independent auditors with a view to revising the phosphatetariff base rate. Compensation payments for social fare reductions would be paidby the Government and ONCF's arrears to the MOF would be cleared over a four-yearperiod. In addition, coordination between ONT and ONCF is in need ofimprovement. These revised objectives would constitute the main components of
-13-
a performance contract to be agreed between ONCF and the Government. Thisperformance contract is ready to be finalized.
Ports
2.16 In December 1984, the Government transferred all commercial portactivities from the civil service to an autonomous enterprise, ODEP. However,the MPW retained overall responsibility for port administration, planning,construction, maintenance and dredging, as well as safety of port operations.ODEP is a financially autonomous enterprise engaged in commercial activity [Acaract6re Industriel et commercial] which took over cargo handling from theformer R6gie d'Acconage du Port de Casablanca (RAPC). Its responsibilityencompasses a wide spectrum of port operations, especially cargo handling andmaintenance. A Technical Committee for each port, chaired by the local portrepresentative of the MPW, is consulted on all matters connected with portoperations and maintenance. Both the local authorities and the users arerepresented on the Technical Committees.
2.17 So far, the new sector organization has substantially achieved itsobjectives. These are to raise port efficiency, reduce subsidies, and restorethe financial viability of the sector. First, most performance indicators forport operations are markedly better than before 1985. Second, although theGovernment still finances dredging and breakwater maintenance, maintenance ofport facilities has improved without increasing the financial burden on thebudget. Current plans foresee that ODEP will be responsible in the future forthe construction and maintenance of port infrastructure, except for breakwaters,dredging, and jetty maintenance, which will remain the responsibility of theGovernment. Formal transfer of publicly-owned assets to ODEP is planned in thenear future. Finally, ODEP's financial situation is healthy, since theenterprise generates a surplus enabling it to finance its investments and to paythe Government a fee for the use of port infrastructure.
2.18 ODEP's present organization is satisfactory and no major changes arerequired. The main issues are essentially investment-related, particularly theneed to increase capacity for unitized traffic in Casablanca and Tangiers, andto develop handling facilities for major bulk imports of coal and cereals. Theseinvestments will provide substantial support for the development of foreign tradethrough the reduction of distribution costs for major import and exportcommodities. A four-year investment program to facilitate these measures isbeing supported by a Bank-financed Port Sector Project. Institutionalimprovements also being addressed under the project relate to overall planningfor the port sector, principles of tariff setting and adjustment procedures,financial and physical performance indicators, transfer of fixed assets to ODEP,level of user fees paid by ODEP, and clearance of arrears owed to the formerRAPC. Responsibilities for cereal handling, currently handled by NationalCereals Board (ONICL), also need to be clarified; ideally they should beintegrated into ODEP's activities. These various items are covered in a draftperformance contract to be agreed between the Government and ODEP.
Other Enterprises
2.19 RAM has had performance contracts since 1982. Although under the

-14-
supervision of MOT for technical matters, and MOF for financial matters, RAMoperates essentially as a private concern. The Government owns 98% of RAM'sshares, the remainder being privately owned. Overall, RAM is an efficient andprofitable enterprise, with a 19% return on net fixed assets during 1987-90. RAMrecently embarked on a major equipment replacement program involving theacquisition of 10 Boeing 737-400s and 737-500s.
2.20 ONT does not have a performance contract with the Government. Itis a profitable organization posting satisfactory operating results. It receivesno government subsidies and enjoys no tax exemptions. As road freight transportorganizer, using an approved vehicle fleet, it increased its performance asfollows over the period 1986-90:
Tonnage transported + 18.50%Ton-km + 20.00%Turnover + 38.60%Approved vehicle fleet + 13.80%Available capacity + 26.00%
ONT also plays a role in international road freight transport, arelatively new activity for Morocco. Given the country's poor level ofparticipation in international road traffic, ONT's action is essentially aimedat bringing in Moroccan carriers, through implementation of a medium-term programcomprising several modules, ranging from sensitization to prospection for exportand import freight opportunities, with assistance provided at the level ofinvestment portfolio preparation. The results have been remarkable, thepercentage of participation by Morocco increasing from 0.75% in 1988 to 10.50%in 1990. In the area of facilitation of international road transport operations,ONT is recognized by the Customs authorities and by the International RoadTransport Union (IRU), guarantor association under the International RoadTransport (TIR) Convention.
Privatization
2.21 There is already substantial private sector involvement in theprovision of transport services in Morocco. The road freight transport industryis entirely in private hands, being composed of several thousand private owner-operators with small trucks of up to and ir.cluding 8 tons GVW, about 1,300operators belonging to private companies and private cooperatives with a fleetof about 2,850 larger trucks (average GVW 14.5 tons) which are required tooperate under the supervision of ONT, and several hundred own-account operatorswith a total of some 5,000 large trucks (average GVW 22 tons), (para. 1.10 -1.11). Interurban bus transport is also privately owned, with the exception ofthe approximately 10% of the market handled by the public enterprise, CTM. TheSDNT, in process of completion, will examine how the efficiency and profitabilityof individual operators could be improved, in particular through the definitionof criteria for access to the public transportation business.
2.22 In the maritime sector, some minor port operations are undertakenby private firms. These include pilotage, towage and stevedoring on board ships,which are essentially operations requiring limited investment and thus involvinglittle risk. ODEP is also considering privatizing certain areas of its
-15-
operations, such as leisure port development. However, ODEP's port operationsare generally efficient in terms of berth throughput and there is no need at thepresent time to seek further private sector involvement. Moreover, it isunlikely that sufficient private sector interest could be generated in the largeinvestments currently being undertaken by ODEP in container handling and in bulkterminal facilities. ONCF is also considering privatizing certain areas of itsoperations, particularly its chain of luxury hotels. The subcontracting ofrailway catering may also be considered.
2.23 In the highway sector, an attempt was made to seek private sectorinvolvement in the development of a toll expressway concession. However, littleinterest was shown by the private sector in this proposal and the Governmentsubsequently created a public enterprise to operate the existing Casablanca-Rabatexpressway as a toll facility and to plan and implement the extension of thislink northward beyond Rabat. The Government may consider privatizing the tollroad concession by launching a competition for a management contract.
2.24 Finally, a large number of small private firms are involved in ancillaryand support activities in the transport sector, particularly forwarding andshipping agents. These agents should be encouraged to develop appropriatelogistical procedures to foster improvements in intermodal movements,particularly in connection with the export trade.
D, Rationalization of the Transport System
Road Freight
2.25 The road freight sector is facing three principal problems:
(a) need to legalize the operations of trucks of up to and includ,ng 8tons GVW (parc libre) in order to encourage investment;
(b) lack of specific criteria for access to the transport market; and
(c) heavy tax pressure on the road transport sector discouraging thepurchase of new vehicles and resulting in an aging fleet.
2.26 In its initial conclusions, following its analysis of the optionsavailable for resolving the problems of road freight, the SNDT suggests thefollowing measures for rationalizing the sector:
(a) legalization of transport for hire by operators with trucks of upto and including 8 tons GVW; this would offer greater security andestablish a more sound basis for operation of these vehicles;
(b) rationalization of the sector through the establishment of specificcriteria for access to the transport market and a review of thepossibilities for eliminating tariff controls on transport for hireoperations; reinforcement of ONT's commercial activities;concentration of resources on technical inspections (vehiclesafety) and enforcement of the laws; improvements in the vocationaltraining offered to operators, culminating in the award of a
-16-
CertlfLcat d'aptltude professlonnelle (CAP);
(c) promotion of vehicle fleet renewal and development of the sectorthrough changes in the system of taxation by reducing taxes on thepurchase of new vehicles and (.s far as possible) transferring themto operating expenses.
Interurban Bus Services
2.27 The interurban bus sector is almost entirely operated by privatecompanies. An exception is the high-quality, air-conditioned services operatedby CTM on a small number of routes. Access to the interurban bus sector isregulated by the National Transport Commission. Each major town has anInspecteur Voyageurs (IV) as the local Directorate of Overland Transport (DTT)representative. The IV is in charge of organization and supervision at the localbus station. Any private operator may apply for a transport permit, stating hisproposed itinerary and frequency of service. Once authorized by the provincialcommittee, the service must be provided as stated in the permit, otherwise thepermit may be canceled.
2.28 The present situation depends heavily on the judgment of eachprovincial committee. It has to make an assessment of the need for and viabilityof each route; it also has to balance profitable with non-profitable routes toensure that all areas are served.
2.29 Bus fares are calculated on the basis of route distance, and a tableof fare rates is reviewed regularly by a national committee. The SDNT indicatesthat current rates permit a modest profit on average routes, with the result thatthere is little renewal of the bus fleet.
2.30 Demand is highly seasonal, with maximum demand occurriag during thesummer months. The quality of privately operated buses is generally satisfactoryand they tend to be sufficiently maintained. In many rural areas, buses providevirtually the only means of inter-provincial travel, although there is somecompetition from taxis on a few routes.
2.31 Control of service quality is a difficult issue, since there aredemands for different service levels, including a minimum-price service. Nocompromise should be accepted where vehicle safety is concerned, and publicservice vehicle inspections should be held more frequently and their qualityupgraded. Also, the IVs should be given authority to ban from service, on adaily basis, any vehicle which does not comply with minimum standards (e.g.safety, cleanliness, emissions).
2.32 To encourage improvements in service quality, premium fares shouldbe permitted on routes served by more than one operator. Surcharges could bebased on the availability of air conditioning and of facilities for watching TVor videos or listening to music, and on seat spacing.
Interurban Taxi Services
2.33 The National Transport Study surveys indicate that nearly 20Q of
-17-
interurban road journeys are made by taxi. The average load is five passengersand overloading occurs frequently. A large proportion of interurban taxiservices are illegal (and uninsured), and are provided almost exclusively bydiesel- powered vehicles receiving preferential tax treatment. Many of thevehicles are old and in unroadworthy condition. The combination of these factorsenables interurban taxis to charge prices offering effective competition with busfares, the latter being subject to regulation. However, in terms of energyconsumption and safety, the market share of taxis seems undesirably high.
2.34 The Study recommends that tighter controls be introduced, includingstiffer penalties for illegal operations. Registered interurban taxis should beregularly inspected and their approved seating capacity marked on the vehicle;all seats should be provided with seat belts and the use of these made mal.Iatory.
International Transport Services
2.35 Moroccan shipping lines account for 20% of total traffic and 50,; ofgeneral cargo traffic. In addition to COMANAV and MARPHOCEAN, nine small privateMoroccb firms and four major foreign lines operate shipping services. Althoughthere is some degree of competition among the shipping services, rates are mainlygoverned by international conferences and access to the market is limited. Asimilar situation exists for air transport services, and both passenger and cargorates to Europe are set at high levels. Demand for cargo s^rvices, particularlyfor high value perishable goods, far outstrips supply. As an extension of therecent UNDP Trade Facilitation Project, the Government has launched a TradeLogistics and Facilitation Study to analyze the costs of the logistic chainsinvolved in the movement of key imports and exports and the related constraints.The study is being directed by the Ministry of Foreign Trade as part of theagreements for SAL II, which includes a trade development component.
2.36 The task concentrates primarily on the documentary and proceduralobstructions to the easy movement of goods, using the same analytical andcorrective techniques and inter-institutional cooperation approaches developedby the Trade Facilitation Project. However, work carried out so far has revealeda number of other substantive constraints on day-to-day trading operations. Ithas become clear, for instance, that one of the reasons why the trader hasdifficulty in managing intermodal transport procedures is that in Morocco thisactivity is little understood and poorly carried out. One of the problems ofcompliance with the more complex procedures - for example, documentary creditsor temporary admission - is that the trader or his agent can have considerabledifficulty in obtaining and circulating the necessary information.
2.37 The study also examines transport services and facilities currentlyavailable to Moroccan traders and their agents in terms of quality, costs andchoice. The findings will be compared with corresponding resources available totypical international trading competitors. The main characteristics of moderntransport systems will be described and factors of particular relevance toMoroccan international trade patterns will be identified. The role,contribution, and requirements of transport intermediaries - including freightforwarders, express carriers and container operators - will be described andassessed. Any constraints on freedom of choice in transport services will beidentified and their effects on competitiveness evaluated. Recommendations will

-18
be made as to changes required in the management and operation of transportent3rprises, including changes in the regulatory framework.
2.38 Transport and information services are key to the success otinternational trading, particularly for those industries on which Morocco willneed to rely for export expansion. For this reason, the study will prepare acomprehensive action plan which will address the main procedural, documentary,supervisory and physical constraints affecting key distribution chains. Thestudy will also pull together, in a coherent framework, the recommendations onroad transport rationalization provided by the SDNT and certain specificrecommendations on the streamlining of customs inspection procedures, limitationof container movements, and introduction of simplified documents and MIS systems.
E. Environment and Safety
2.39 Increasing attention is now being paid to the environmental andsafety aspects of transport programs in Morocco. The ongoing Highway SectorProject provides support for an improved road safety program involving measuresto strengthen the vehicle testing program. Technical assistance under thisprogram will also propose standards for engine emission levels with a view tointroducing controls to limit air pollution. At the same time, the RoadsDirectorate is establishing a database for monitoring accident black spots, whichwould also be used to establish priorities in correcting deficiencies in the mainroad network.
2.40 Design work for the new container termLnal in the port of Casablanca,prepared under the Port Sector project, includes specific provisions forminimizing environmental impact. The project is also helping the Government tolimit the environmental impact of dredging operations in Moroccan ports. Asystematic study is currently being undertaken with specific reference to themethodology used to analyze dredged material samples, the condition of theselected dredged material disposal sites, and the introduction of measures tolimit pollution resulting from dredging operations. Studies are also planned toidentify the additional investments required in Moroccan ports for dredgingmaterial removal and deballasting facilities. Support for such projects couldbe provided by the Global Environment Facility. The port project also providesfor a radar control tower in the Straits of Gibraltar to assist shipping andensure greater safety in this heavily trafficked area. This facility forms partof a system being established by the Ministry of Merchant Marine in collaborationwith ODEP to limit the possibility of marine accidents and specifically theimpact of oil spills.
2.41 Finally, the Government is showing renewed interest in the railwaymodernization program, particularly the upgrading of rail services in the mainrail corridor between Casablanca and Fes. This corridor is operating at fullcapacity in terms of existing rail services and the ongoing modernization programis justified in that its purpose is to avoid potential diversion of traffic toroad transport The upgrading program has major environmental and safetyadvantages over road transport alternatives. These include lower energy use perunit of traffic, reducing air pollution levels, smaller right-of-way losses,lower noise levels, reduced congestion effects, and lower accident rates.Although difficult to quantify, these benefits need -o be evaluated and taken

-19-
into account in the assessment of investment programs in the main transportcorridors.
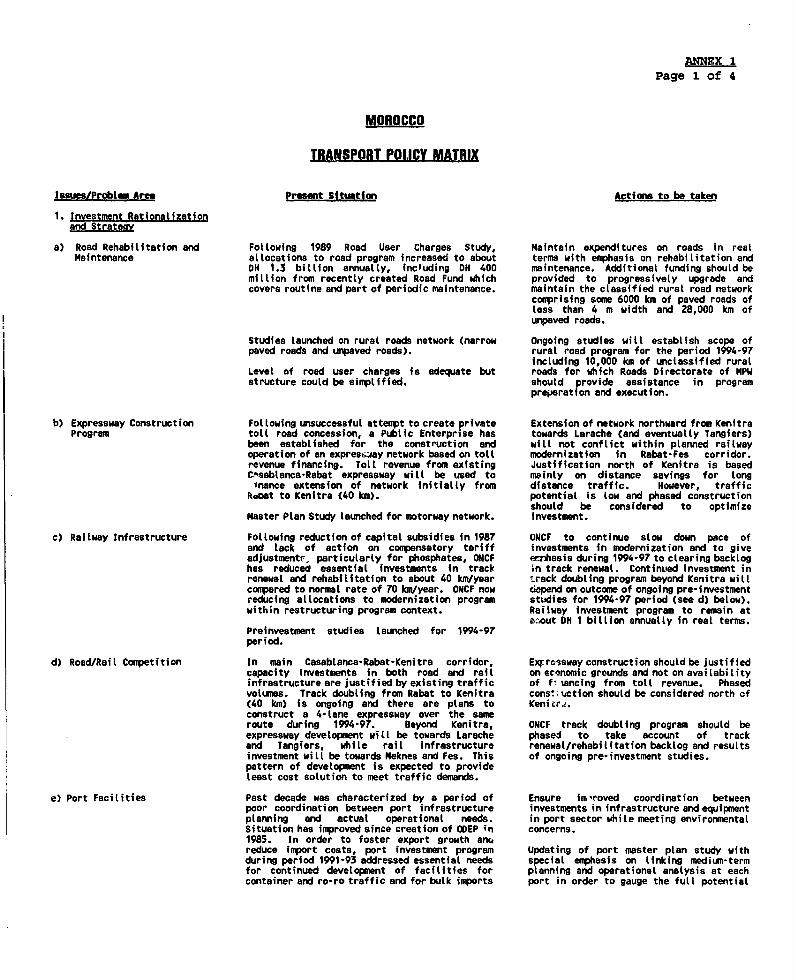
ANMX 1Page 1 of 4
MOROCCO
TRANSPORT POLICY MATRIX
Issues/Proble. Area Prerent Situation Actions to be taken
1. !nvestment Rationalizationand Stratecv
a) Road Rehabilitation and Following 1989 Road User Charges Study, Maintain expenditures on roads in realMaintenance allocations to road program increased to about terms with emphasis on rehabilitation and
DH 1.3 billion annually, including DH 400 maintenance. Additional funding should bemillion from recently created Road Furd which provided to progressively upgrade andcovers routine and part of periodic maintenance. maintain the classified rural road network
comprising some 6000 km of paved roads ofless than 4 m width and 28,000 km ofunpaved roads.
Studies launched on rural roads network (narrow Ongoing studies will establish scope ofpaved roads and unpaved roads). rural road program for the period 1994-97
including 10,000 km of unclassified ruralLevel of rood user charges is adequate but roads for which Roads Directorate of MPWstructure could be simptified. should provide assistance in program
preparation and execution.
b) Expressway Construction Following unsuccessful attempt to create private Extension of network northward from KenitraProgram to(l road concession, a Public Enterprise has towards Larache (and eventually Tangiers)
been established for the construction and will not conflict within planned railwayoperation of an exprescjay network based on toll modernization in Rabat-Fes corridor.revenue financing. Toll revenue from existing Justification north of Kenitra is basedCAsablanca-Rabat expressway will be used to msinly on distance savings for longInance extension of network initially from distance traffic. However, trafficRaoat to Kenitra (40 km). potential is low and phased construction
should be considered to optimizeMaster Plan Study launched for motorway network. investment.
c) Railway Infrastructure Following reduction of capital subsidies in 1987 ONCF to continue slow down pace ofand lack of action on compensatory tariff investments in modernization and to giveadjustment,. particularly for phosphates, ONCF wrhasis during 1994-97 to clearing backloghas reduced essential investments in track in track renewal. Continued investment inrenewal and rehabilitation to about 40 km/year track doubling program beyond Kenitra willcompared to normal rate of 70 km/year. ONCF now depend on outcome of ongoing pre-investmentreducing allocations to modernization program studies for 1994-97 period (see d) below).withfn restructuring program context. Railway investment program to remain at
a.:out DH 1 billion annually in real terms.Preinvestment studies launched for 1994-97period.
d) Road/Rail Competition In main Casablanca-Rabat-Kenitra corridor, ExFrrsswayconstructionshouldbe justifiedcapacity investments in both road and rail oneconomic grounds and not on availabilityinfrastructure are justified by existing traffic of f iancing from toll revenue. Phasedvolumes. Track doubling from Rabat to Kenitra cons!;iction should be considered north of(40 km) is ongoing and there are plans to Kenicr.construct a 4-tlane expressway over the sameroute during 1994-97. Beyond Kenitra, ONCF track doubling program should beexpressway development will be towards Larache phased to take account of trackand Tangiers, while rail infrastructure renewal/rehabilitation backlog and resultsinvestment will be towards Meknes and Fes. This of ongoing pre-investment studies.pattern of development is expected to provideleast cost solution to meet traffic demands.
e) Port Facilities Past decade was characterized by a period of Ensure im-roved coordination betweenpoor coordination between port infrastructure investments in infrastructure and equipmentplanning and actual operational needs. in port sector while meeting environmentalSituation has improved since creation of ODEP in concerns.1985. In order to foster export growth anmreduce import costs, port investment program Updating of port master plan study withduring period 1991-93 addressed essential needs special emphasis on linking medium-termfor continued development of facilities for planning and operational analysis at eachcontainer and ro-ro traffic and for bulk inports port in order to gauge the full potential
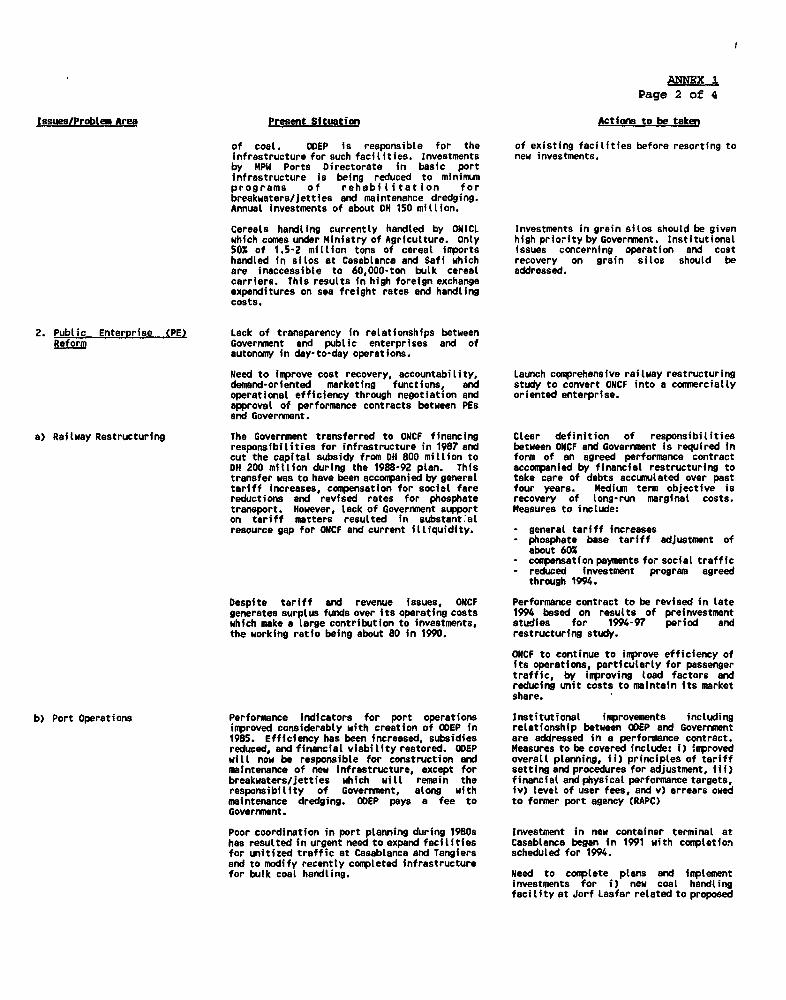
ANNX I
Page 2 of 4
Issues/Problem Aer Present Situation Actions to be taken
of coal. OWEP is responsible for the of existing facilities before resorting toinfrastructure for such facilities. Investments new investments.by MPW Ports Directorate in basic portinfrastructure is being reduced to minimumprograms of rehabilitation forbreakwaters/jetties and maintenance dredging.Annual Investments of about OH 150 million.
Cereals handling currently handled by ONICL Investments in grain silos should be givenwhich comes under Ministry of Agriculture. Onty high priority by Government. Institutional50% of 1.5-2 million tons of cereal imports issues concerning operation and costhandled in silos at Casablanca and Safi which recovery on grain silos should beare inaccessible to 60,000-ton bulk cereal addressed.carriers. This results in high foreign exchangeexpenditures on sea freight rates and handlingcosts.
2. Public EnterPrise (PE) Lack of transparency in relationships betweenReform Govermnent and public enterprises and of
autonomy in day-to-day operations.
Need to Improve cost recovery, accountability, Launch comprehensive railway restructuringdemand-oriented marketing functions, and study to convert ONCF into a commerciallyoperational efficiency through negotiation and oriented enterprise.approval of performance contracts between PEsand Government.
a) Railway Restructuring The Government transferred to ONCF financing Clear definition of responsibilitiesresponsibilities for infrastructure in 1987 and between ONCF and Government Is required incut the capital subsidy from DH 800 million to form of an agreed performance contractOH 200 million during the 1988-92 plan. This accompanied by financial restructuring totransfer was to have been accompanied by general take care of debts accumulated over pasttariff increases, compensation for social fare four years. Mediuman term objective isreductions and revised rates for phosphate recovery of long-run marginal costs.transport. However, lack of Government support Measures to include:on tariff maTters resulted in substant:alresource gap for ONCF and current illiquidity. - general tariff increases
- phosphate base tariff adjustment ofabout 60%
- compensation payments for social traffic- reduced investment program agreed
through 1994.
Despite tariff and revenue issues, ONCF Performance contract to be revised in lategenerates surplus funds over its operating costs 1994 based on results of preinvestmentwhich make a large contribution to investments, studies for 1994-97 period andthe working ratio being about 80 in 1990. restructuring study.
ONCF to continue to improve efficiency ofits operations, particularly for passengertraffic, by improving load factors andreducing unit costs to maintain its marketshare.
b) Port Operations Performance indicators for port operations Institutional improvements includingimproved considerably with creation of ODEP in relationship between ODEP and Government1985. Efficiency has been increased, subsidies are addressed in a performance contract.reduced, and financial viability restored. ODEP Measures to be covered include: i) improvedwill now be responsible for construction and overall planning, ii) principles of tariffmaintenance of new infrastructure, except for setting and procedures for adjustment, iii)breakwaters/jetties which will remain the financial and physical performance targets,responsibility of Government, along with iv) level of user fees, and v) arrears owedmaintenance dredging. 00EP pays a fee to to former port agency (RAPC)Goverrment.
Poor coordination in port planning during 1980s Investment in new container terminal athas resulted in urgent need to expand facilities Casablanca began in 1991 with completionfor unitized traffic at Casablanca and Tangiers scheduled for 1994.and to modify recently completed infrastructurefor bulk coal handling. Need to complete plans and implement
investments for i) new coal handlingfacility at Jorf Lasfar related to proposed
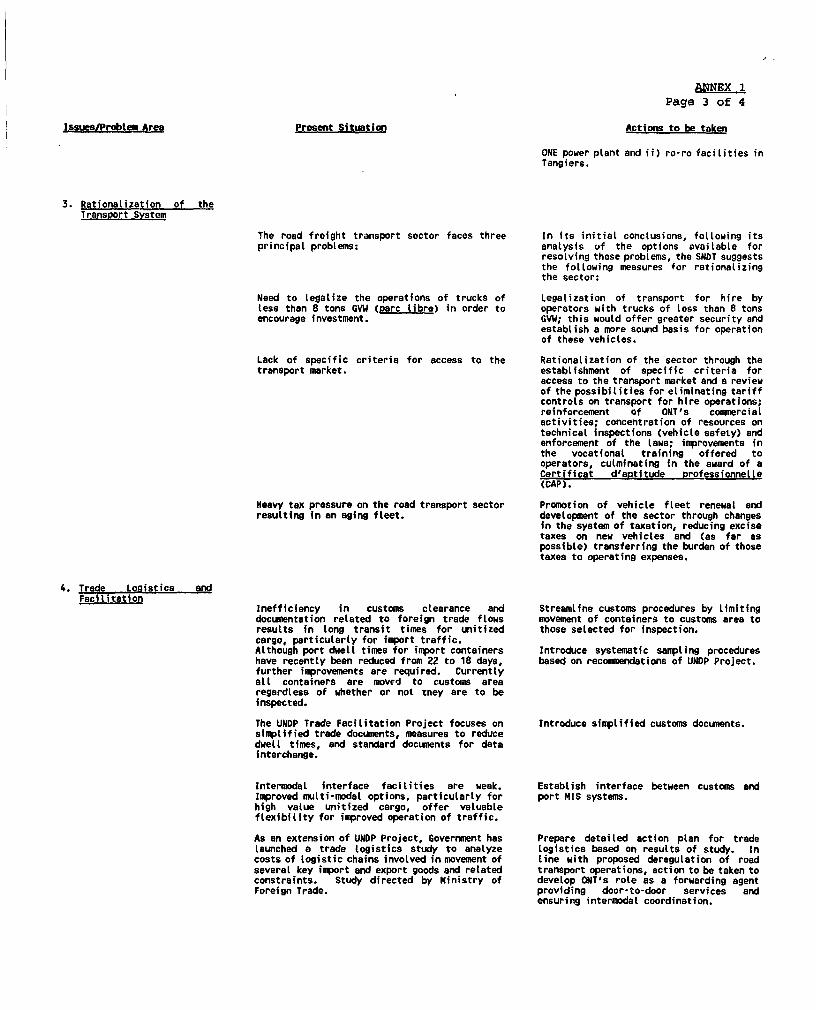
ANNEX 1Page 3 of 4
Issues/Problem Area Present Situation Actions to be taken
ONE power plant and ii) ro-ro facilities inTangiers.
3. ationalization of theTransport System
The road freight transport sector faces three In its initial conclusions, following itsprincipal problems; analysis of the options available for
resolving these problems, the SNDT suggeststhe following measures for rationalizingthe sector:
Need to legalize the operations of trucks of Legalization of transport for hire byless than 8 tons GVW (parc libre) in order to operators with trucks of less than 8 tonsencourage investment. GVW; this would offer greater security and
establish a more sound basis for operationof these vehicles.
Lack of specific criteria for access to the Rationalization of the sector through thetransport market. estabLishment of specific criteria for
access to the transport market and a reviewof the possibilities for eliminating tariffcontrols on transport for hire operations;reinforcement of ONT's commercialactivities; concentration of resources ontechnical inspections (vehicle safety) andenforcement of the laws; improvements inthe vocational training offered tooperators, culminating in the award of aCertificat d'aotitude professionnelle(CAP).
Heavy tax pressure on the road transport sector Promotion of vehicle fleet renewal andresulting in an aging fleet. development of the sector through changes
in the system of taxation, reducing excisetaxes on new vehicles and (as far aspossible) transferring the burden of thosetaxes to operating expenses.
4. Trade Logistics andFacilitation
Inefficiency in customs clearance and Streamline customs procedures by Limitingdocumentation related to foreign trade flows movement of containers to customs area toresults in long transit times for unitized those selected for inspection.cargo, particularly for import traffic.Although port dwell times for import containers Introduce systematic sampling procedureshave recently been reduced from 22 to 18 days, based on recommendations of UNDP Project.further improvements are required. Currentlyall containers are moved to custons arearegardless of whether or not tney are to beinspected.
The UNDP Trade Facilitation Project focuses on Introduce simplified customs documents.simplified trade documents, measures to reducedwell times, and standard documents for datainterchange.
Intermodal interface facilities are weak. Establish interface between customs andImproved multi-modal options, particularly for port MIS systems.high value unitized cargo, offer valuableflexibility for improved operation of traffic.
As an extension of UNDP Project, Goverrmnent has Prepare detailed action plan for tradelaunched a trade logistics study to analyze logistics based on results of study. Incosts of logistic chains involved in movement of line with proposed deregulation of roadseveral key import and export goods and related transport operations, action to be taken toconstraints. Study directed by Ministry of develop ONT's role as a forwarding agentForeign Trade. providing door-to-door services and
ensuring intermodal coordination.
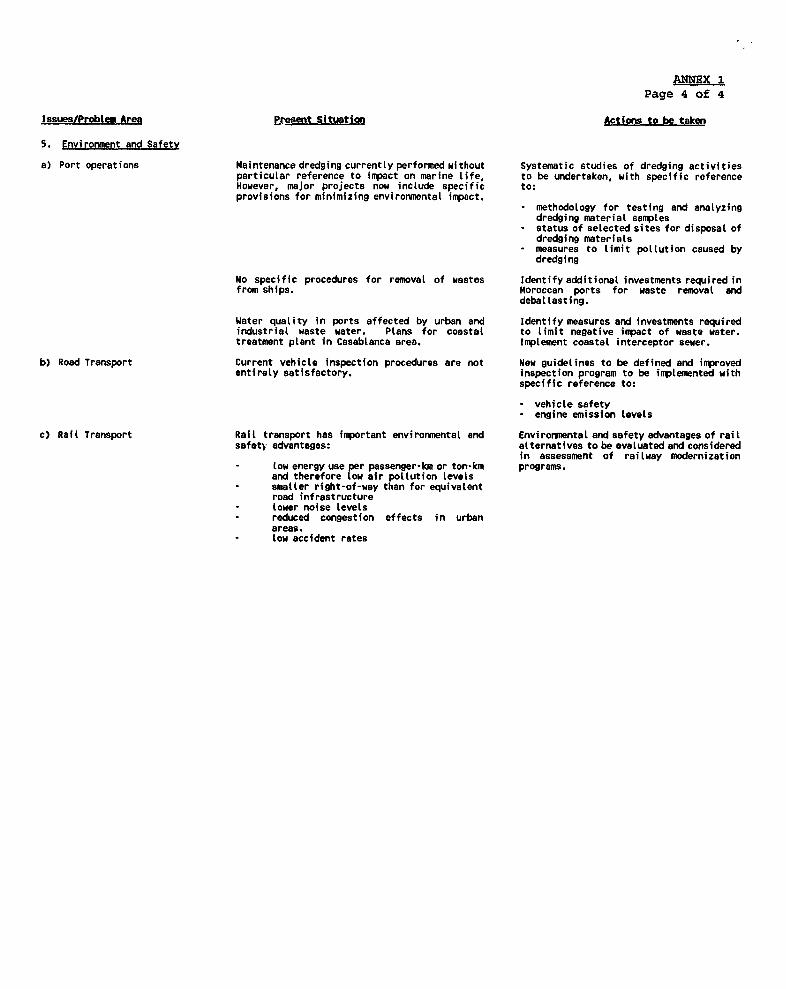
ANNEX IPage 4 of 4
Issues/Problem Area Present Situation Actions to be taken
5. Environment and Safety
a) Port operations Maintenance dredging currently performed without Systematic studies of dredging activitiesparticular reference to impact on marine Life, to be undertaken, with specific referenceHowever, maJor projects now include specific to:provisions for minimizing environmental impact.
- methodology for testing and analyzingdredging material sanpLes
- status of selected sites for disposal ofdredging materials
- measures to limit pollution caused bydredging
No specific procedures for removal of wastes Identify additional investments required infrom ships. Moroccan ports for waste removal and
deballasting.
Water quality in ports affected by urban and Identify measures and investments requiredindustrial waste water. Plans for coastal to Limit negative inpact of waste water.treatment plant in Casablanca area. Implement coastal interceptor sewer.
b) Road Transport Current vehicle inspection procedures are not New guidelines to be defined and inprovedentirely satisfactory. inspection program to be implemented with
specific reference to:
- vehicle safety- engine emission levels
c) Rail Transport Rail transport has important environmental and Environmental and safety advantages of railsafety advantages: alternatives to be evaluated and considered
in assessment of railway modernizationtow energy use per passenger-km or ton-km programs.and therefore low air pollution levels
- smaller right-of-way than for equivalentroad infrastructure
- lower noise levels- reduced congestion effects in urban
areas.- low accident rates
ANNEX 2Page 1 of 4
THE TRANSPORT SYSTEM
A. Passenaer Traffic
1. Total annual passenger-km increased at an average of about 4.8% per yearbetween 1977 and 1988, from 12.8 to 21.4 billion (Table 1). In 1988, 92% ofinterurban passengers traveled by road, nearly 8% by rail, and less than 1% byair (Table 2). The average distance traveled by air (170 km) was similar to thatfor rail passenger travel (181 km), both being greater than the average triplength by road (138 km). Only about 6% of road and rail journeys and 13% ofjourneys by air were made for purposes of work, the majority being for a varietyof personal reasons (Table 3).
B. Freight Traffic
Foreian Trade
2. Between 1983 and 1988, export tonnage increased by an average of4.2% per year and import tonnage by an average of 6.6% per year (Table 4).Export and import tonnages reached some 35.9 million tons and 14.7 million tons,respectively, in 1988.
3. Although total general cargo port traffic increased by about 6.4%per year between 1983 and 1988, unitizable freight grew much more rapidly forimports - by 8.8% per year - but dropped by 5.5% per year for exports (excludingfruit and vegetables) (Table 5).
Domestic Freiaht
4. Between 1976 and 1988, the domestic freight market nearly doubledin terms of tons transported, increasing from 33.9 million tons to 61.3 milliontons per year (Table 6). Average haul lengths decreased over the same period,from 211 to 175 km, and consequently total ton-km grew less rapidly than totaltons transported. In 1988, 23.5 million tons of phosphates were transported -38% of total domestic freight tonnage. Some 45% of total tonnage was carried byroad, 54% by rail, and about 2% by coastal shipping. Excluding phosphatetraffic, about three quarters was carried by road and about one quarter by rail,coastal shipping accounting for about 2%. Average haul lengths by road and railwere similar - 166 km and 172 km respectively.
C. Road SubsectorThe Network
5. The classified road network comprises some 58,500 km, of which halfis paved (Table 7). The primary network includes 9,400 km of paved and 1,500 kmof unpaved roads; the secondary network includes 6,250 km of paved and 2,400 ofunpaved roads; and the tertiary network includes 12,850 km of paved and 26,100of unpaved roads.
6. Only 6% of the network consists of roads more than 7m wide (i.e.,

ANNEX 2Page 2 of 4
more than 2 traffic lanes); the majority of the network (61% of route length)comprises roads of 4-6m width (Table 8). Only about 1,500 km of the road networkcarried more than 3,000 vpd in 1988, but accounted for 34% of total vehicle-km(Table 9).
Vehicle Fleet
7. Between 1980 and 1986, the registered vehicle fleet grew at anaverage rate of 4.0% per year to reach approximately 556,000 motor vehicles,comprising 377,600 passenger cars (68% of the fleet) and 178,400 trucks and buses(Table 10).
Road PassenQer Traffic
8. Between 1977 and 1982, road traffic increased at 6.2% per year onaverage, but then declined slightly between 1982 and 1985, from 21.2 million to20.4 million vehicle-km per day (Table 11). Over the period 1977-1988, privateroad transport increased from 3,800 million to 5,486 million vehicle-km per year,but its market share dropped from 32% in 1977 to just under 29% in 1988; themarket share of interurban buses also declined, falling from 57.5% in 1977 to52.1% in 1988. Over the same period, the market share of illegal taxis tripled,from 3.2 to 6.6%, and that of large interurban taxis increased from 7.3 to 11.5%(Table 12).
Road Freioht Traffic
9. The structure and development of the interurban road freight marketare shown in Table 13. Between 1976 and 1988, the market nearly tripled in termsof tons transported (from 13 million to 34 million tons per year) and increasedby about 50% in terms of ton-km (from 3,244 million to 4,742 million ton-km).The market share of the ONT Parc public declined slightly in terms of ton-km, andthat of the Parc libre (vehicles up to and including 8 tons GVW) increasedslightly; the share of own-account operators remained stable.
10. The size of the oarc public under the auspices of ONT increasedsteadily between 1979 and 1988, from 2,116 to 2,609 vehicles (Table 14). Theaverage carrying capacity of the vehicles also increased, from 13.7 tons in 1979to 15.9 tons in 1988. The tonnage handled by ONT increased by nearly 40% overthe decade 1978-88, while ton-km increased by 36% (Table 15).
Road Accidents
11. The number of reported road accidents declined over the first partof the decade 1977-87, but has been on the rise from 1980 to the present day(Table 16). In 1987, there were 27,154 reported road accidents, resulting in36,902 injuries and 2,269 fatalities. Although the number of fatal accidentsdecreased from 2,659 in 1977 to 2,269 in 1987, the fatality rate remainsrelatively high by international standards (Table 17), even though the overallaccident rate was comparable to that of the USA in 1985 (Table 18). WA..1le utlyabout one quarter of road accidents in Morocco occur outside urban areas, theseaccount for around two thirds of fatalities and about 40% of injuries (Table 19).
ANNEX 2Page 3 of 4
D. Rail Subsector
Rolling Stock
12. ONCF has a total of 244 locomotives, of which 108 are electric and136 diesel powered (Table 20). The average locomotive age is 17 years; aboutthree quarters of the locom,tives are more than 10 years old. Line capacitycharacteristics are shown in Table 21.
Railway Passenoer Traffic
13. In 1989, ONCF transported 11.8 million passengers, but passengervolumes have stagnated over the past four years, mainly because of capacityconstraints. However, rail passenger traffic measured in passenger-km hascontinued to increase at about 2.5% per year since 1987, although this issignificantly less than the 12% average annual rate achieved during the period1980-87, with some 48% of passengers traveling in 2nd class, 49% in class E, and3% in 1st class (Table 22).
Raiiway Freiaht Traffic
14. Total rail freight traffic measured in ton-km increased by 5%between 1980 and 1988, reaching 5.7 million ton-km (Table 23). However, trafficdeclined in 1989 to 4.5 billion ton-km, owing mainly to a sharp downturn inphosphate traffic, which fell from 23 million tons (4.1 billion ton-km) to 16.5million tons (2.9 billion ton-km). Phosphate markets were reestablished in 1990and rail freight traffic has now returned to 1988 levels.
15. In 1987, rail freight, excluding phosphates, comprised mineralproducts (34%), chemical products and fertilizers (19%), agricultural products(13%), food products (8%), petroleum products (8%), and miscellaneous goods (18%)(Table 24).
E. Civil Aviation Subsector
16. There are 10 airports open to international traffic in Morocco, sixof which can accommodate Boeing 747s (Table 25). Three airports - Casablanca,Agadir and Marrakech - handle about 80% of total airport passenger traffic(Tables 26 and 27); Casablanca Airport (Mohammed V) is the busiest, followed byAgadir and Marrakech.
17. Until recently, there were two carriers, Royal Air Maroc (RAM) andRoyal Air Inter (RAI) but the latter was absorbed into RAM in 1989. RAMcurrently handles some 2 million passengers annually, just over 10% of this totalrepresenting domestic traffic. Passenger traffic accounts for over 80% ofrevenues and load factors average about 60%.
F. Maritime Subsector
18. The eleven national ports have a total of 147 berths, the largestport being Casablanca, with 48 berths (Table 28). More than 16,500 ship

ANNEX 2Page 4 of 4
movements were recorded in 1988, of which 6,220 were at Casablanca and 4,885 atTangiers (Table 29). Casablanca had the highest berth occupancy rate in 1988(Table 30). Total tonnage handled in 1988 was 38.4 million tons, comprisingmineral products (18.0 million tons - 47%), liquid bulk (10.6 million tons -28%), general cargo (5.6 million tons - 14%), dry bulk (2.3 million tons; 6%) andcereals (1.9 million tons - 5%) (Table 31).
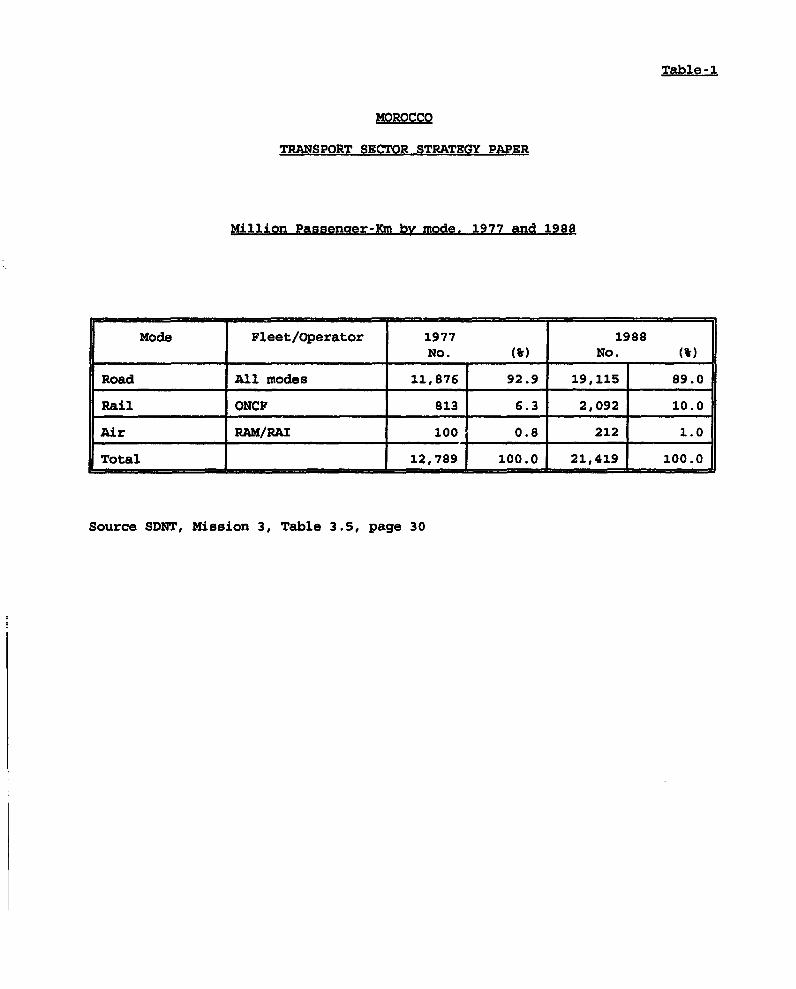
Table-1
MOROCC
TRANSPORT SECTOR STRATEGY PAPER
Million Passenaer-Km by modg, 1977 and 1988
Mode Fleet/Operator 1977 1988
l ~~~ ~ ~~~ ~ ~~~No. ()No.(%
Road All modes 11,876 92.9 19,115 89.0
Rail ONCF 813 6.3 2,092 10.0
Air RAM/RAI 100 0.8 212 1.0
Total _ 12,789 100.0 21,419 100.0
Source SDNT, Mission 3, Table 3.5, page 30

Table-2
MQROCCO
TRANSPORT SECTOR STRATEGY PAPER
Passenaer Market Shares and AveraQe Trip Lenaths. 1988
Market Share by Mode
Mode Passengers PKM Avg. Journey
(Million) (Million) Length (km)
Road 138.4 92.1 19,115.5 89.7 138
Rail 11.6 7.7 2,092.5 10.0 181
Air 0.4 0.3 68.1 0.3 170
Total 150.4 100.0 21,276.1 100.0 142
Source: SDNT, Mission 3, Table 3.22, page 46
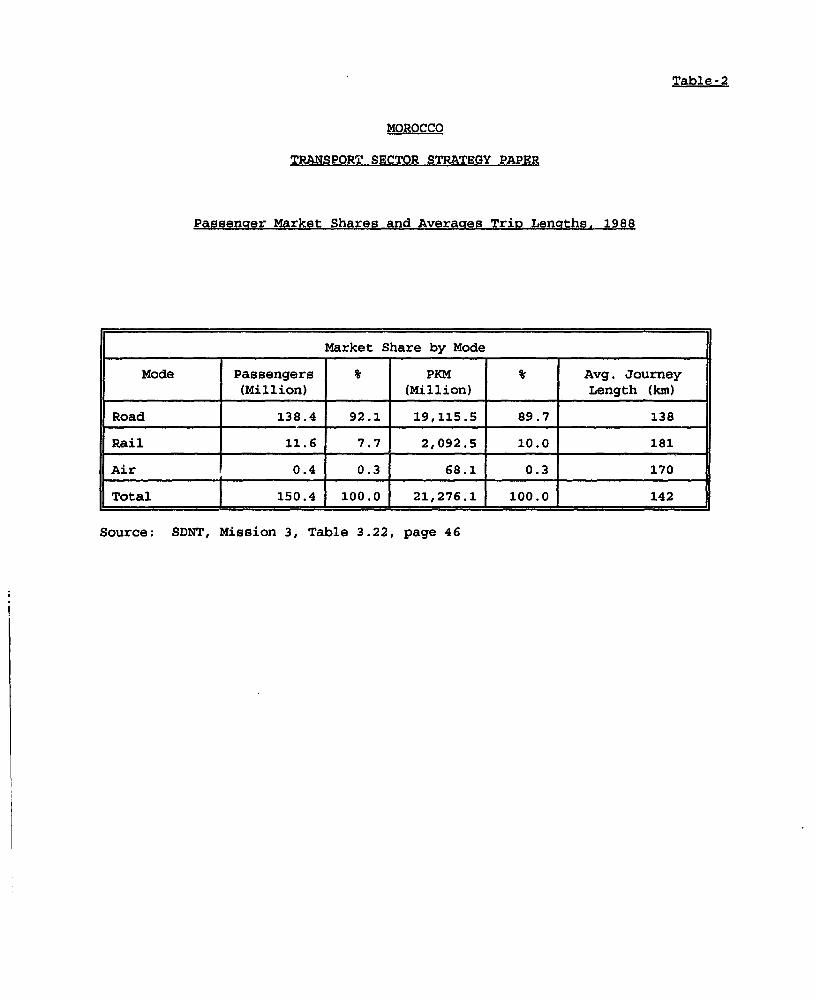
Table-2
MOROCCO
TRANSPORT SECTOR STRATEGY PAPER
PassenQer Market Shares and Averaaes Trip Lenoths. 1988
Market Share by Mode
Mode Passengers * PKM Avg. Journey
(Million) (Million) Length (km)
Road 138.4 92.1 19,115.5 89.7 138
Rail 11.6 7.7 2,092.5 10.0 181
Air 0.4 0.3 68.1 0.3 170
Total 150.4 100.0 21,276.1 100.0 142
Source: SDNT, Mission 3, Table 3.22, page 46
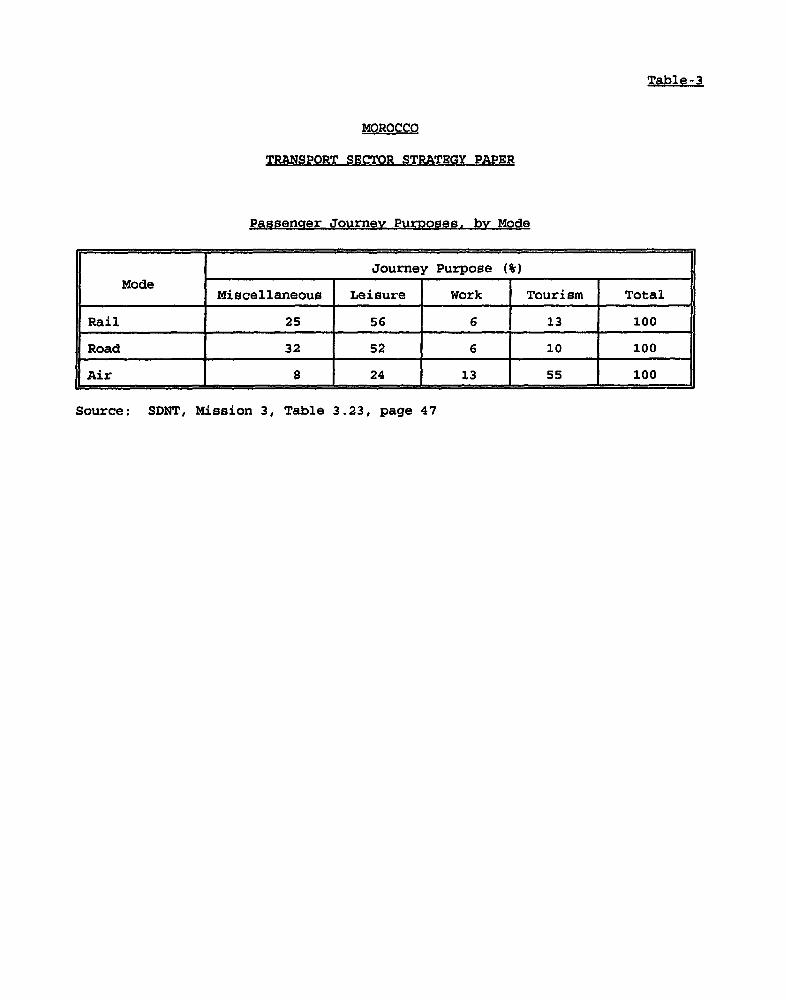
Table -3
MOROCCO
TRANSPORT SECTOR STRATEGY PAPER
Passencer Journey Purposes. by Mode
Journey Purpose (%)
Mode Miscellaneous Leisure Work Tourism Total
Rail 25 56 6 13 100
Road 32 52 6 10 100
Air 8 24 13 55 100
Source: SDNT, Mission 3, Table 3.23, page 47
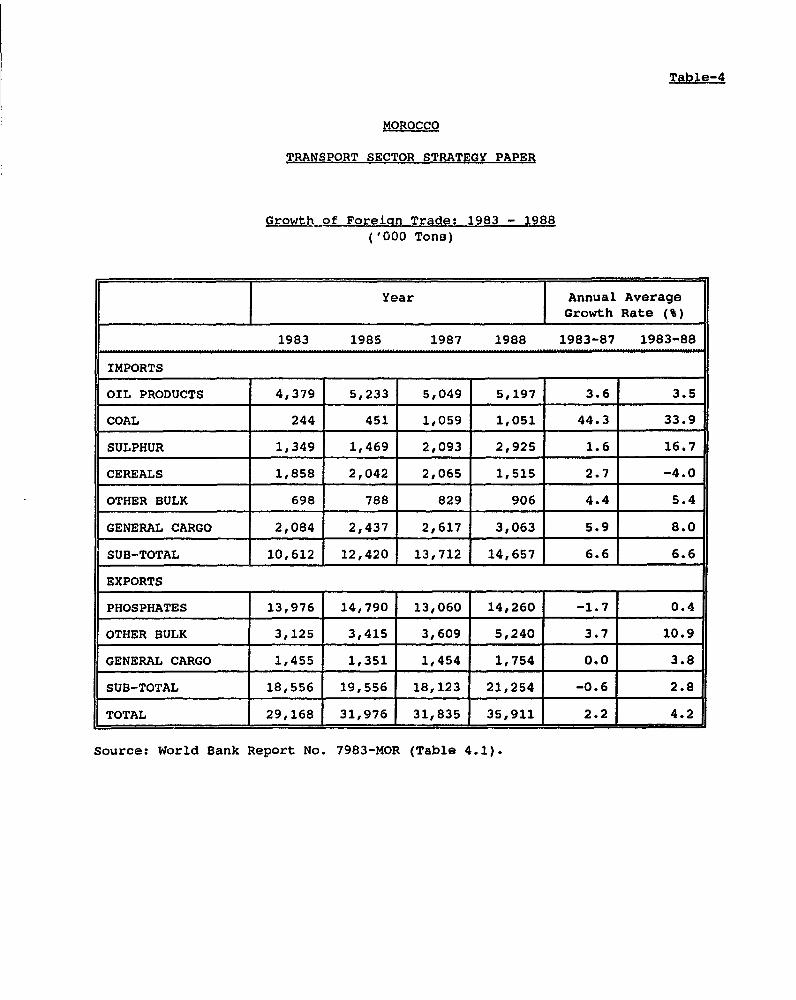
Table-4
MOROCCO
TRANSPORT SECTOR STRATEGY PAPER
Growth of Foreign Trade: 1983 - 1988('000 Tons)
Year Annual AverageGrowth Rate (_) l
1983 1985 1987 1988 1983-87 1983-88
IMPORTS
OIL PRODUCTS 4,379 5,233 5,049 5,197 3.6 3.5
COAL 244 451 1,059 1,051 44.3 33.9
SULPHUR 1,349 1,469 2,093 2,925 1.6 16.7
CEREALS 1,858 2,042 2,065 1,515 2.7 -4.0
OTHER BULK 698 788 829 906 4.4 5.4
GENERAL CARGO 2,084 2,437 2,617 3,063 5.9 8.0
SUB-TOTAL 10,612 12,420 13,712 14,657 6.6 6.6
EXPORTS
PHOSPHATES 13,976 14,790 13,060 14,260 -1.7 0.4
OTHER BULK 3,125 3,415 3,609 5,240 3.7 10.9
GENERAL CARGO 1,455 1,351 1,454 1,754 0.0 3.8
SUB-TOTAL 18,556 19,556 18,123 21,254 -0.6 2.8
TOTAL 29,168 31,976 31,835 35,911 2.2 4.2
Source: World Bank Report No. 7983-MOR (Table 4.1).
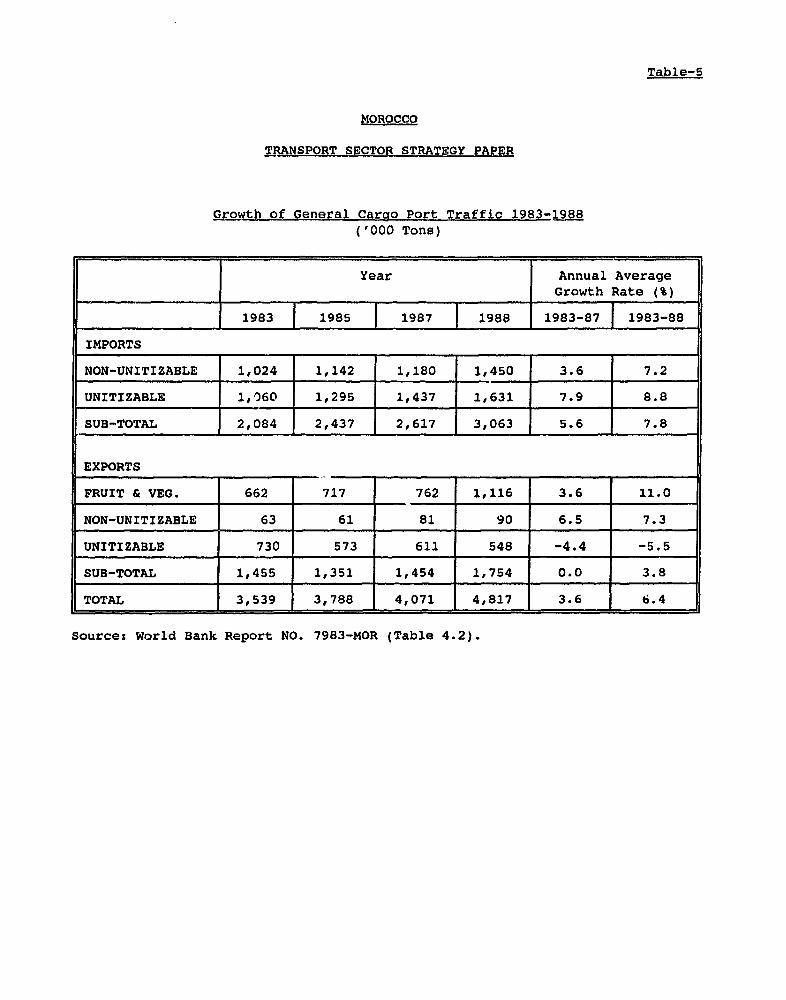
Table-5
MOROCCO
TRANSPORT SECTOR STRATEGY PAPER
Growth of General Cargo Port Traffic 1983-1988
('000 Tons)
Year Annual Average
l ~~~~~~~~~~~~~~Growth Rate (%)
1983 1985 1987 1988 1983-87 1983-88
IMPORTS
NON-UNITIZABLE 1,024 1,142 1,180 1,450 3.6 7.2
UNITIZABLE 1,060 1,295 1,437 1,631 7.9 8.8
SUB-TOTAL 2,084 2,437 2,617 3,063 5.6 7.8
EXPORTS
FRUIT & VEG. 662 717 762 1,116 3.6 11.0
NON-UNITIZABLE 63 61 81 90 6.5 7.3
UNITIZABLE 730 573 611 548 -4.4 -5.5
SUB-TOTAL 1,455 1,351 1,454 1,754 0.0 3.8
TOTAL 3,539 3,788 4,071 4,817 3.6 6.4
Source: World Bank Report NO. 7983-MOR (Table 4.2).
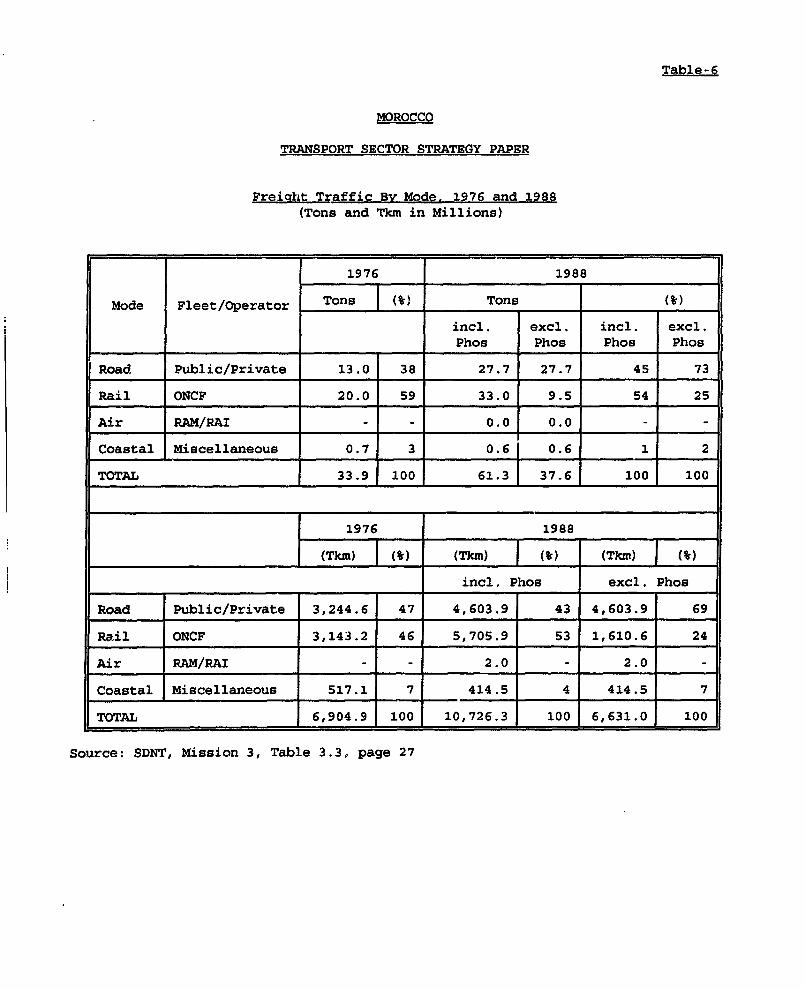
Table-6
MQROCCO
TRANSPORT SECTOR STRATEGY PAPER
Freiqrht Traffic By Mode, 1976 and 1988(Tons and Tkm in Millions)
1976 1988
Mode Fleet/Operator Tons (P) Tons (W)
incl. excl. incl. excl.Phos Phos Phos Phos
Road Public/Private 13.0 38 27.7 27.7 45 73
Rail ONCF 20.0 59 33.0 9.5 54 25
Air RAM/RAI - - 0.0 0.0 -
Coastal Miscellaneous 0.7 3 0.6 0.6 1 2
TOTAL 33.9 100 61.3 37.6 100 100
1976 1988
(Tkm) |() (Tkm) |(%) (Tkm) |(e)
incl. Phos excl. Phos
Road Public/Private 3,244.6 47 4,603.9 43 4,603.9 69
Rail ONCF 3,143.2 46 5,705.9 53 1,610.6 24
Air RAM/RAI - - 2.0 - 2.0
Coastal Miscellaneous 517.1 7 414.5 4 414.5 7
TOTAL 6,904.9 100 10,726.3 100 6,631.0 100
Source: SDNT, Mission 3, Table 3.39 page 27
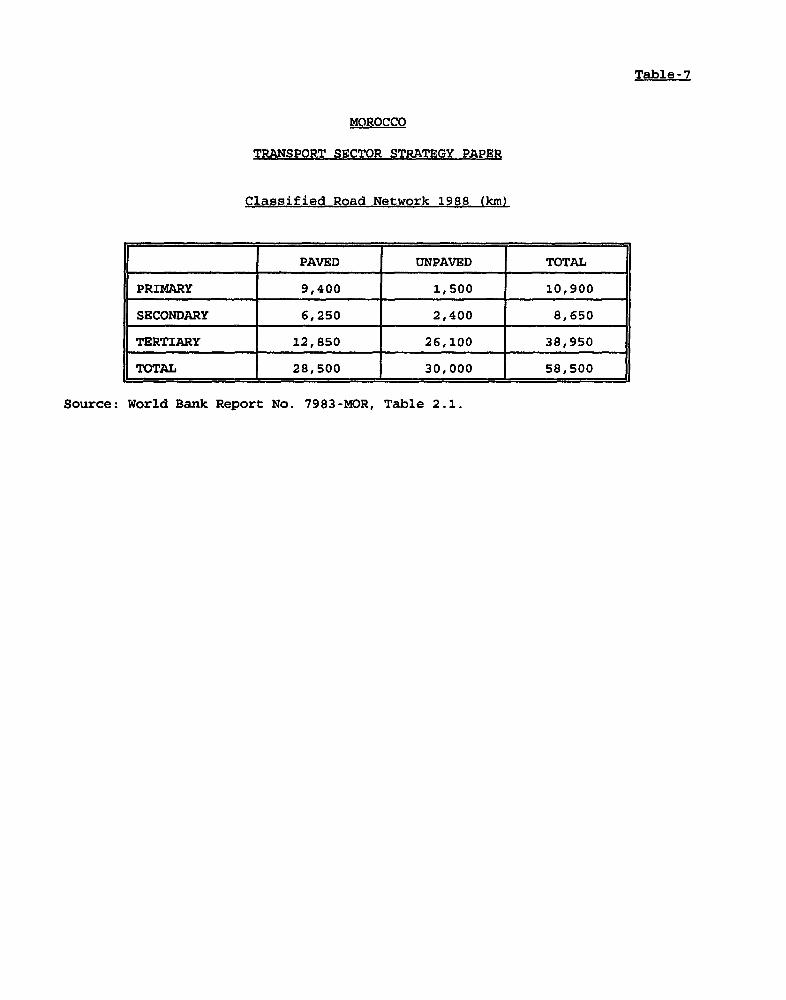
Table-7
MOROCCO
TRANSPORT SECTOR STRATEGY PAPER
Classified Road Network 1988 (km)
PAVED UNPAVED TOTAL
PRIMARY 9,400 1,500 10,900
SECONDARY 6,250 2,400 8,650
TERTIARY 12,850 26,100 38,950
TOTAL 28,500 30,000 58,500
Source: World Bank Report No. 7983-MOR, Table 2.1.

Table-8
MOROCCO
TRANSPORT SECTOR STRATEGY PAPER
Length of Road Network (Km) By Pavement Width
Classification under 4 m 4 to 6 m 6 to 7 m over 7 m
Primary and Secondary 1,133 10,056 2,676 1,459
Tertiary 4,857 6,499 288 62
TOTAL 5,990 16,555 2,964 1,521
in * 22 61 11 6
Source: World Bank (Report No. 7983-MOR, Table 2.2).
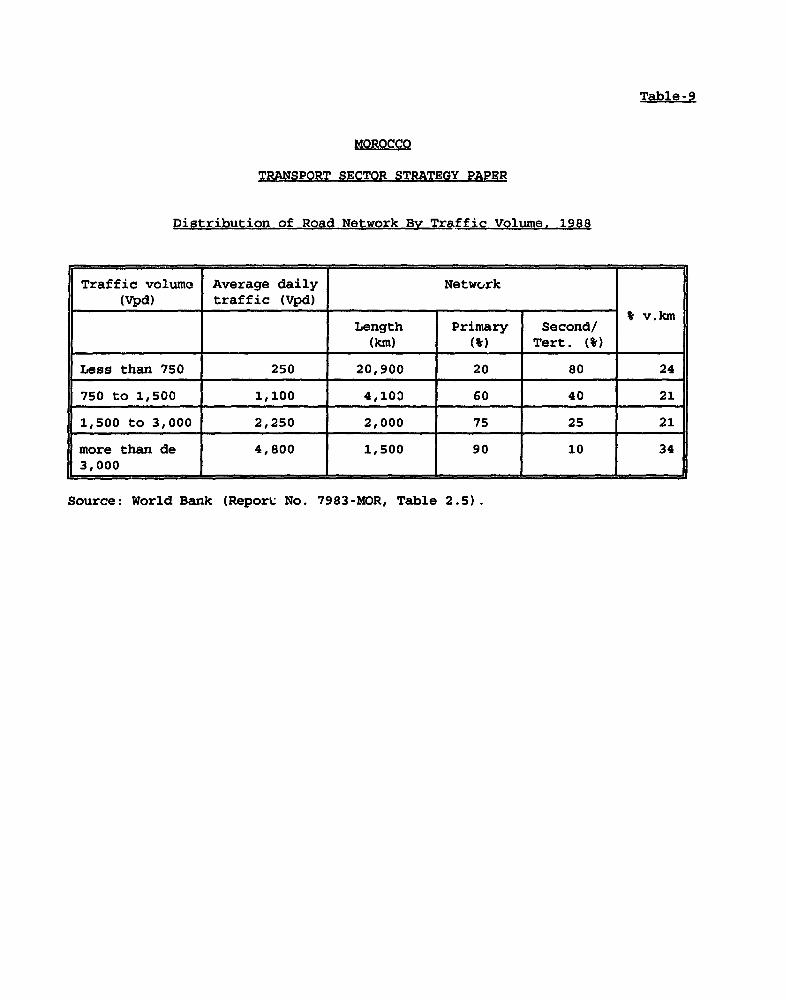
Table-9
MOROCCO
TRANSPORT SECTOR STRATEGY PAPER
Distribution of Road Network By Traffic Volume. 1988
Traffic volumo Average daily Network(Vpd) traffic (Vpd)_
%- v.kcmLength Primary Second/
(km) (t) Tert. (W)
Less than 750 250 20,900 20 80 24
750 to 1,500 1,100 4,103 60 40 21
1,500 to 3,000 2,250 2,000 75 25 21
more than de 4,800 1,500 90 10 343,000 ___
Source: World Bank (Report No. 7983-MOR, Table 2.5).
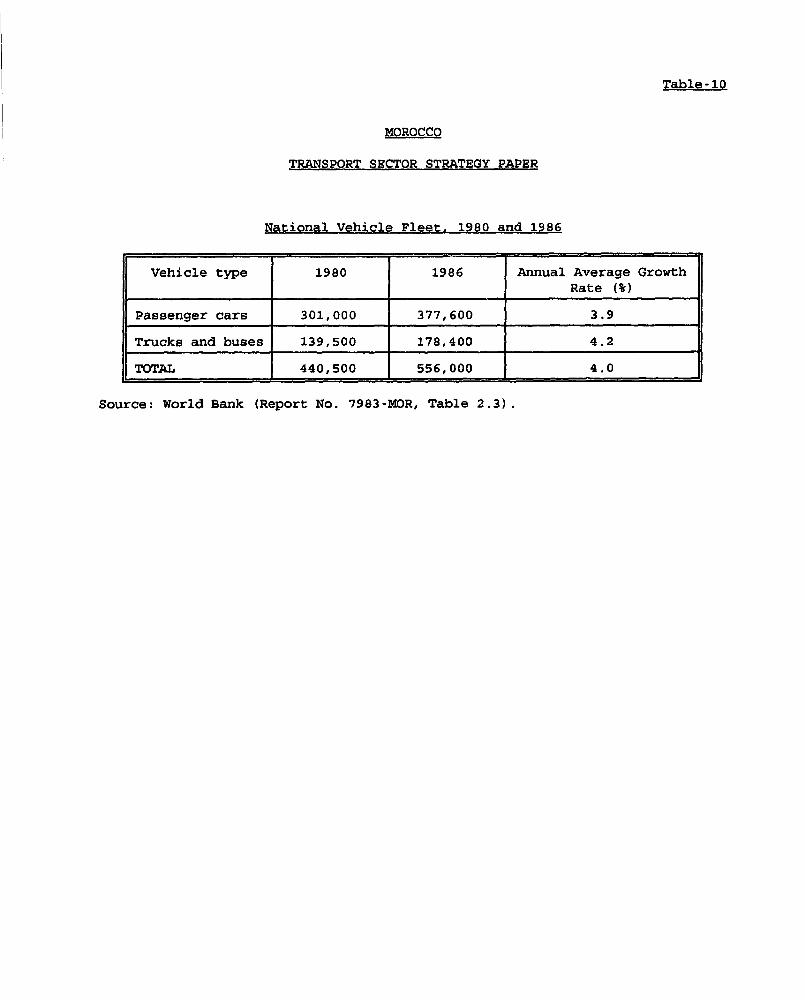
Table-10
MOROCCO
TRANSPORT SECTOR STRATEGY PAPER
National Vehicle Fleet, 1980 and 1986
Vehicle type 1980 1986 Annual Average Growth___________ Rate (%)
Passenger cars 301,000 377,600 3.9
Trucks and buses 139,500 178,400 4.2
TOTAL 440,500 556,000 4.0
Source: World Bank (Report No. 7983-MOR, Table 2.3).

Table-li
MOROCCO
TRANSPORT SECTOR STRATEGY PAPER
Daily Road Traffic Volumes 1976 - 1985
(Million Vehicle-Km per Day)
1976 1977 1978 1979 1980 1981 1982 1983 1984 1985
13.7 15.5 17.1 18.4 18.7 19.6 21.2 20.6 20.0 20.4
Source: World Bank (Report No. 7983-MOR, Table 2.4).
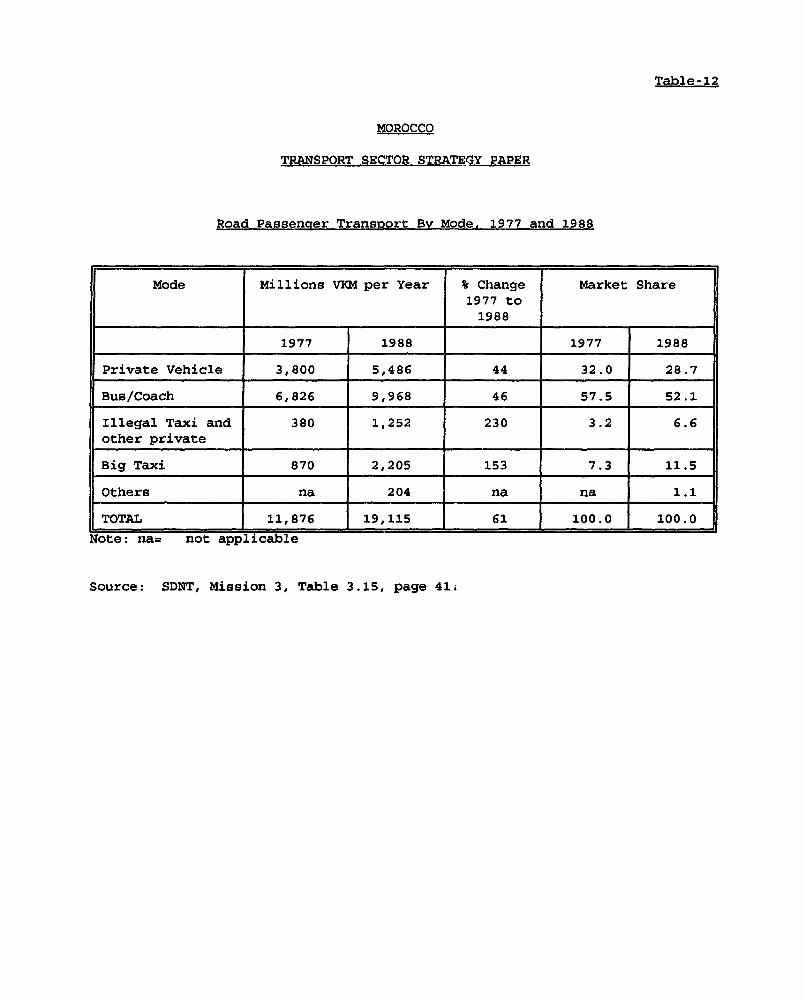
Table- 12
MOROCCO
TRANSPORT SECTOR STRATEQY PAPER
Road Passenger Transoort By Mode. 1977 and 1988
Mode Millions VKM per Year v Change Market Share
1977 to1988
1977 1988 1977 1988
Private Vehicle 3,800 5,486 44 32.0 28.7
Bus/Coach 6,826 9,968 46 57.5 52.1
Illegal Taxi and 380 1,252 230 3.2 6.6
other private
Big Taxi 870 2,205 153 7.3 11.5
Others na 204 na na 1.1
TOTAL 11,876 19,115 61 100.0 100.0
Note: na= not applicable
Source: SDNT, Mission 3, Table 3.15, page 41'
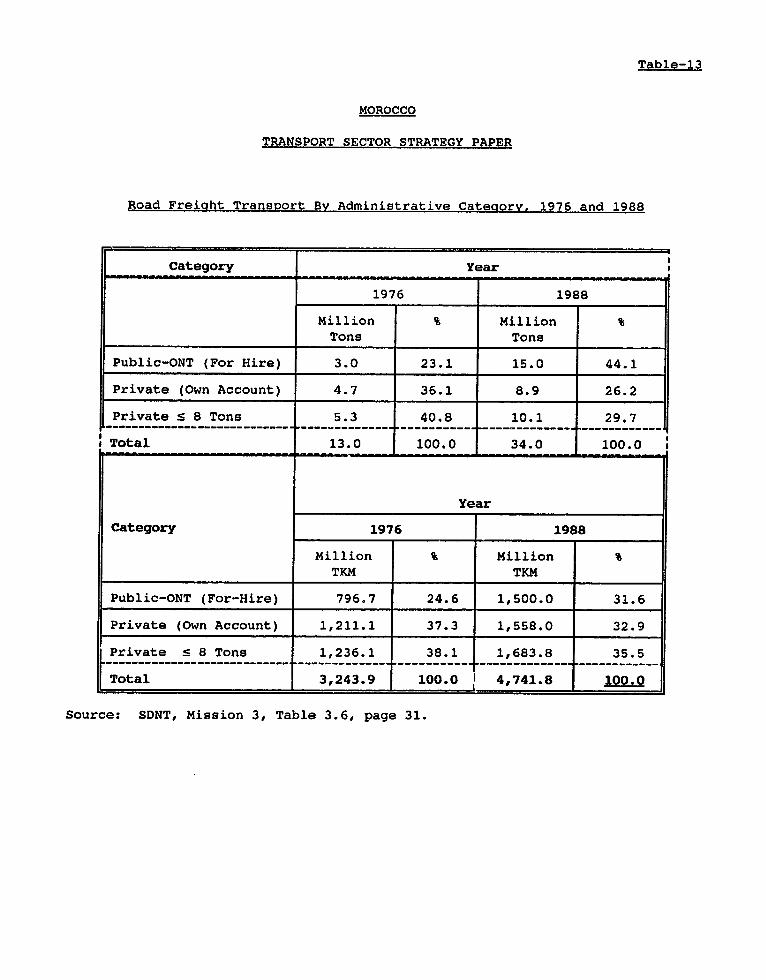
Table-13
MOROCCO
TRANSPORT SECTOR STRATEGY PAPER
Road Freight Transport By Administrative Categorv. 1976 and 1988
Category Year
1976 1988
Million % MillionTons Tons
Public-ONT (For Hire) 3.0 23.1 15.0 44.1
Private (Own Account) 4.7 36.1 8.9 26.2
Private S 8 Tons 5.3 40.8 10.1 29.7…___________________________. ---------------------------------------------
T Total 13.0 100.0 34.0 100.0
Year
Category 1976 1988
Million Million %TKM TKM
Public-ONT (For-Hire) 796.7 24.6 1,500.0 31.6
Private (Own Account) 1,211.1 37.3 1,558.0 32.9[ Private 5 8 Tons 1,236.1 38.1 1,683.8 35.5
Total 3,243.9 100.0 4,741.8 100.0
Source: SDNT, Mission 3, Table 3.6, page 31.
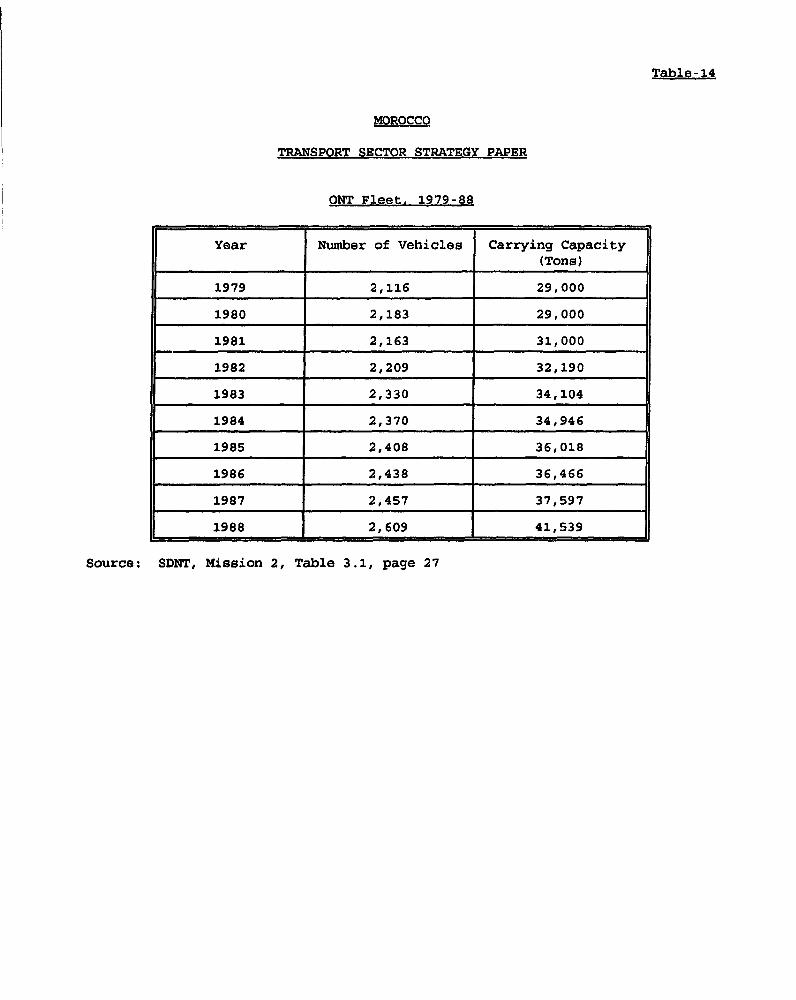
Table- 14
MOROCCO
TRANSPORT SECTOR STRATEGY PAPER
ONT Fleet, 1979-88
Year Number of Vehicles Carrying Capacity(Tons)
1979 2,116 29,000
1980 2,183 29,000
1981 2,163 31,000
1982 2,209 32,190
1983 2,330 34,104
1984 2,370 34,946
1985 2,408 36,018
1986 2,438 36,466
1987 2,457 37,597
1988 2,609 41,539
Source: SDNT, Mission 2, Table 3.1, page 27
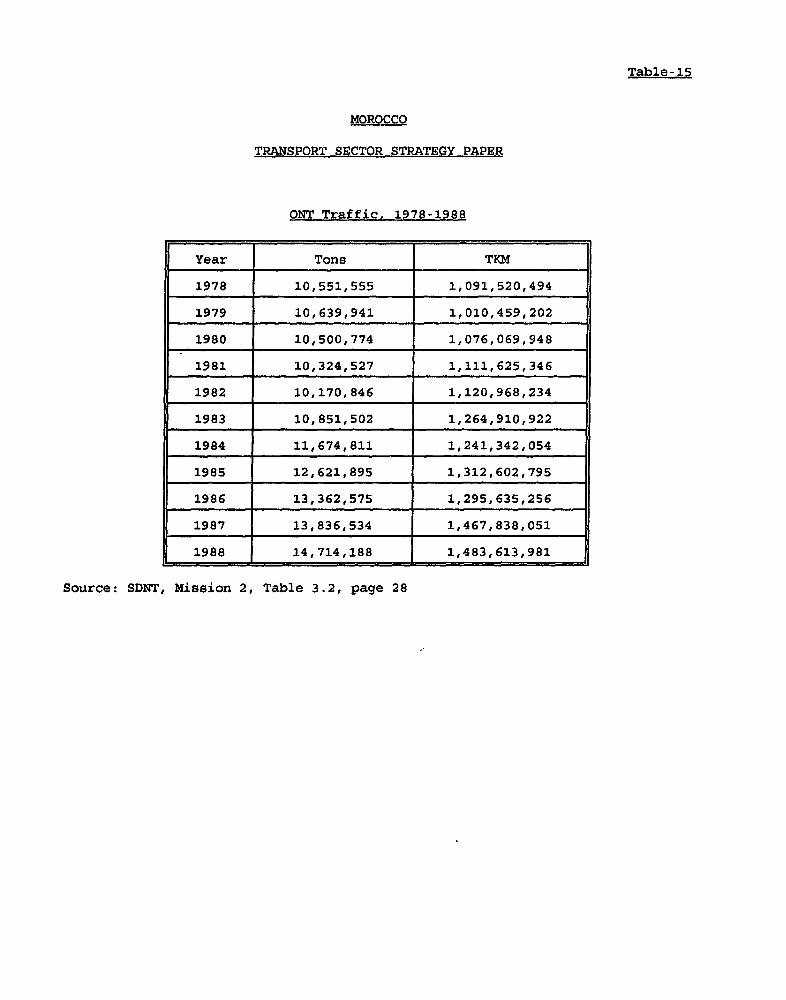
Table-15
MOROCCO
TRANSPORT SECTOR STRATEGY PAPER
ONT Traffic, 1978-1988
Year Tons TKM
1978 10,551,555 1,091,520,494
1979 10,639,941 1,010,459,202
1980 10,500,774 1,076,069,948
1981 10,324,527 1,111,625,346
1982 10,170,846 1,120,968,234
1983 10,851,502 1,264,910,922
1984 11,674,811 1,241,342,054
1985 12,621,895 1,312,602,795
1986 13,362,575 1,295,635,256
1987 13,836,534 1,467,838,051
1988 14,714,188 1,483,613,981
Source: SDNT, Mission 2, Table 3.2, page 28
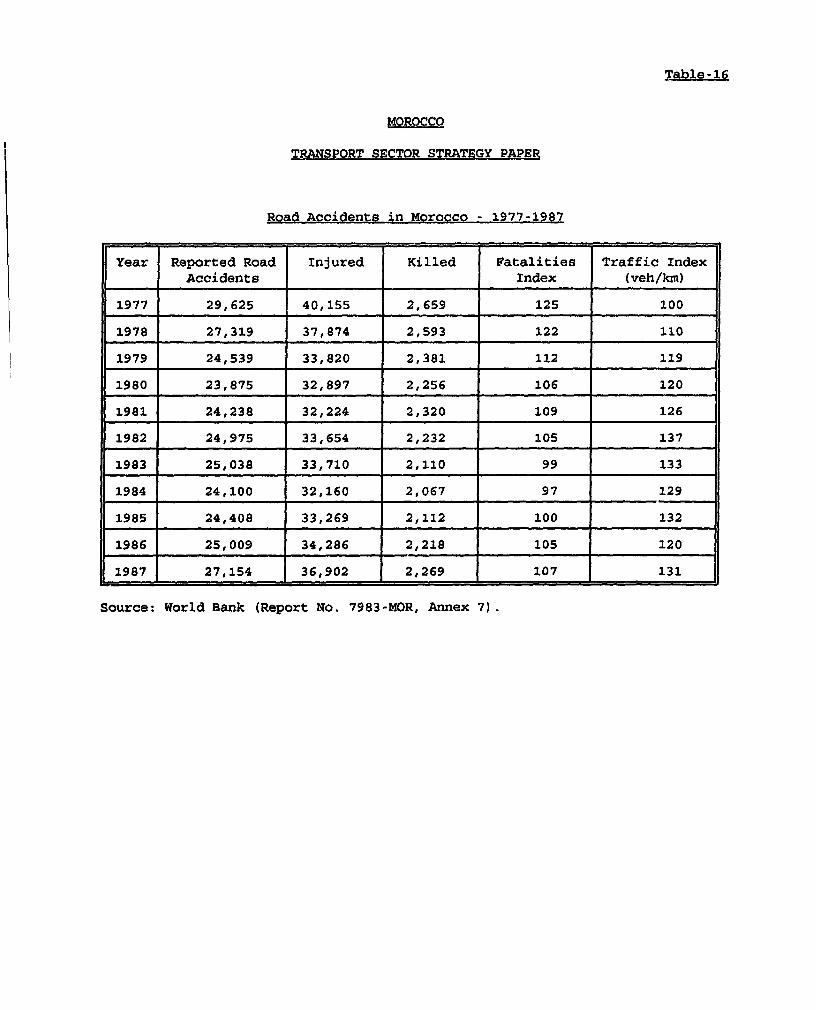
Table-16
MOROCCO
TRANSPORT SECTOR STRATEGY PAPER
Road Accidents in Morocco - 1977-1987
Year Reported Road Injured Killed Fatalities Traffic IndexAccidents Index (veh/km)
1977 29,625 40,155 2,659 125 100
1978 27,319 37,874 2,593 122 110
1979 24,539 33,820 2,381 112 119
1980 23,875 32,897 2,256 106 120
1981 24,238 32,224 2,320 109 126
1982 24,975 33,654 2,232 105 137
1983 25,038 33,710 2,110 99 133
1984 24,100 32,160 2,067 97 129
1985 24,408 33,269 2,112 100 132
1986 25,009 34,286 2,218 105 120
1987 27,154 36,902 2,269 107 131
Source: World Bank (Report No. 7983-MOR, Annex 7).
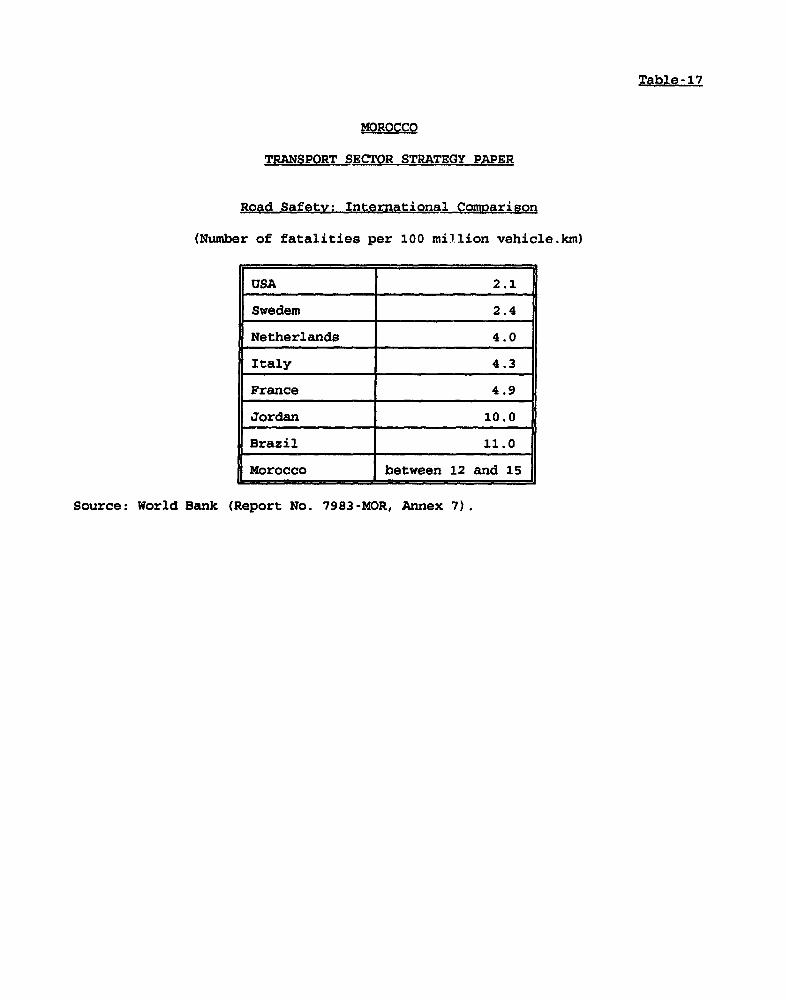
Table- 17
MOROCCO
TRANSPORT SECTOR STRATEGY PAPER
Road Safety: International Comparison
(Number of fatalities per 100 million vehicle.km)
USA 2.1
Swedem 2.4
Netherlands 4.0
Italy 4.3
France 4.9
Jordan 10.0
Brazil 11.0
Morocco between 12 and 15
Source: World Bank (Report No. 7983-NOR, Annex 7).
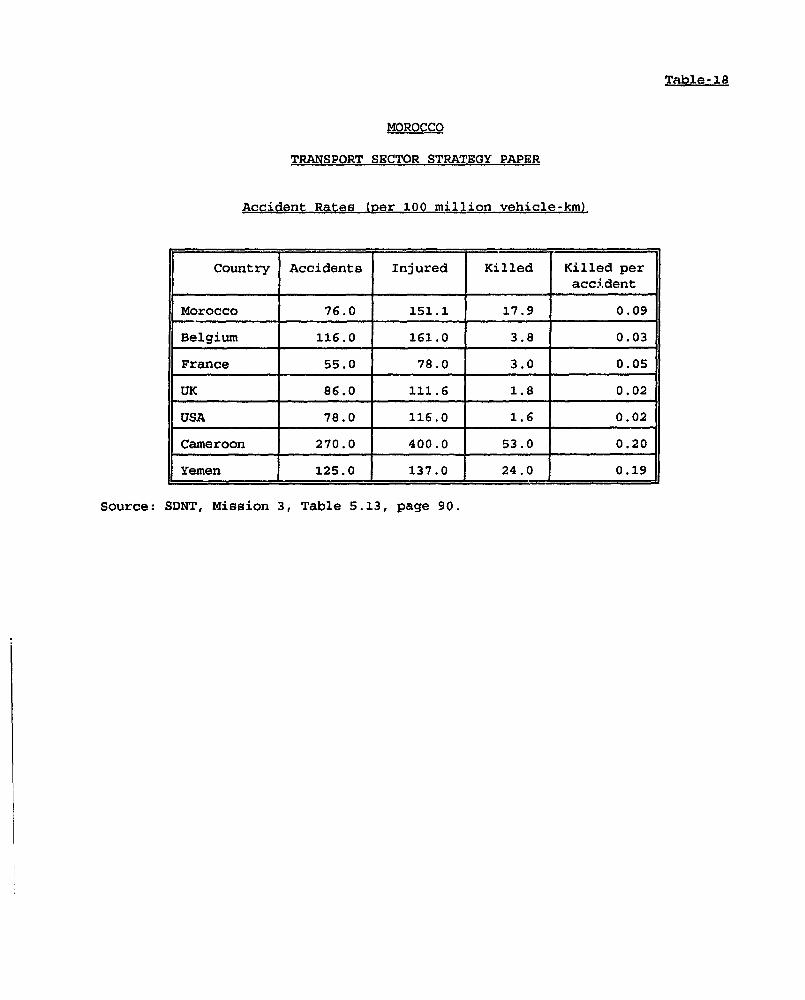
Table- 18
MOROCCO
TRANSPORT SECTOR STRATEGY PAPER
Accident Rates (per 100 million vehicle-km}
Country Accidents Injured Killed Killed per
accident
Morocco 76.0 151.1 17.9 0.09
Belgium 116.0 161.0 3.8 0.03
France 55.0 78.0 3.0 0.05
UK 86.0 111.6 1.8 0.02
USA 78.0 116.0 1.6 0.02
Cameroon 270.0 400.0 53.0 0.20
Yemen 125.0 137.0 24.0 0.19
Source: SDNT, Mission 3, Table 5.13, page 90.
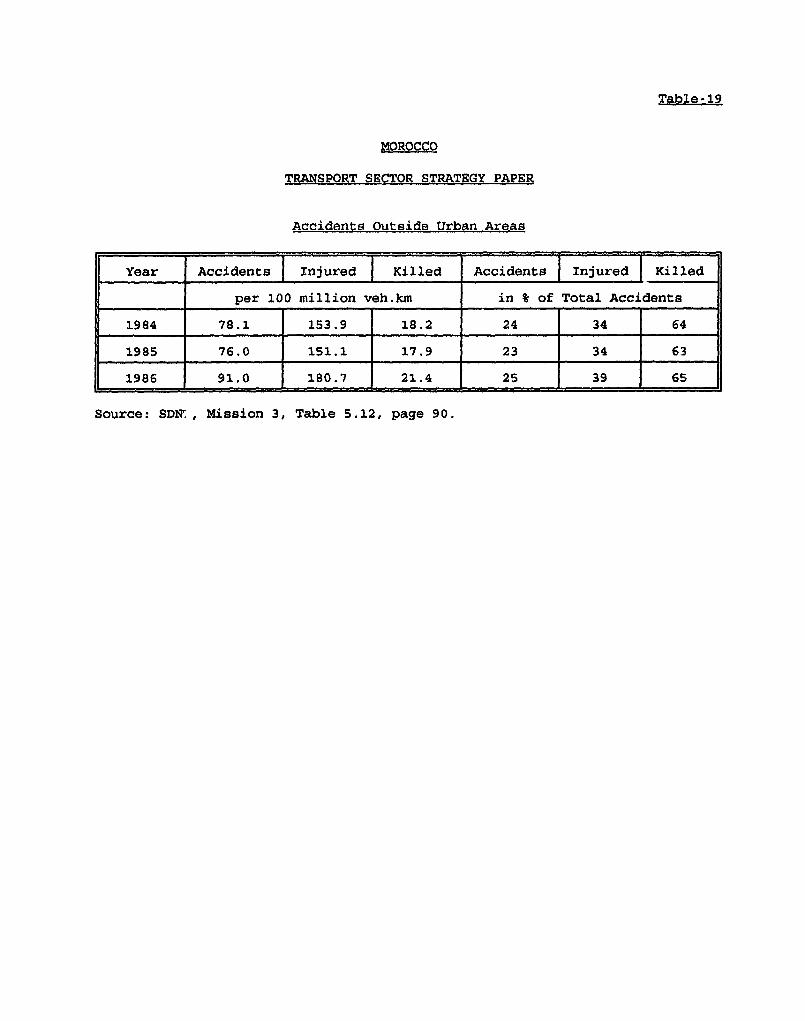
Table-19
MOROCCO
TRANSPORT SECTOR STRATEGY PAPER
Accidents Outside Urban Areas
Year Accidents I Injured Killed Accidents j Injured I Killed
__ _ ____ per 100 million veh.km in t of Total Accidents
1984 78.1 153.9 18.2 24 34 64
1985 76.0 151.1 17.9 23 34 63
1986 91.0 180.7 21.4 25 39 65
Source: SDIq, Mission 3, Table 5.12, page 90.
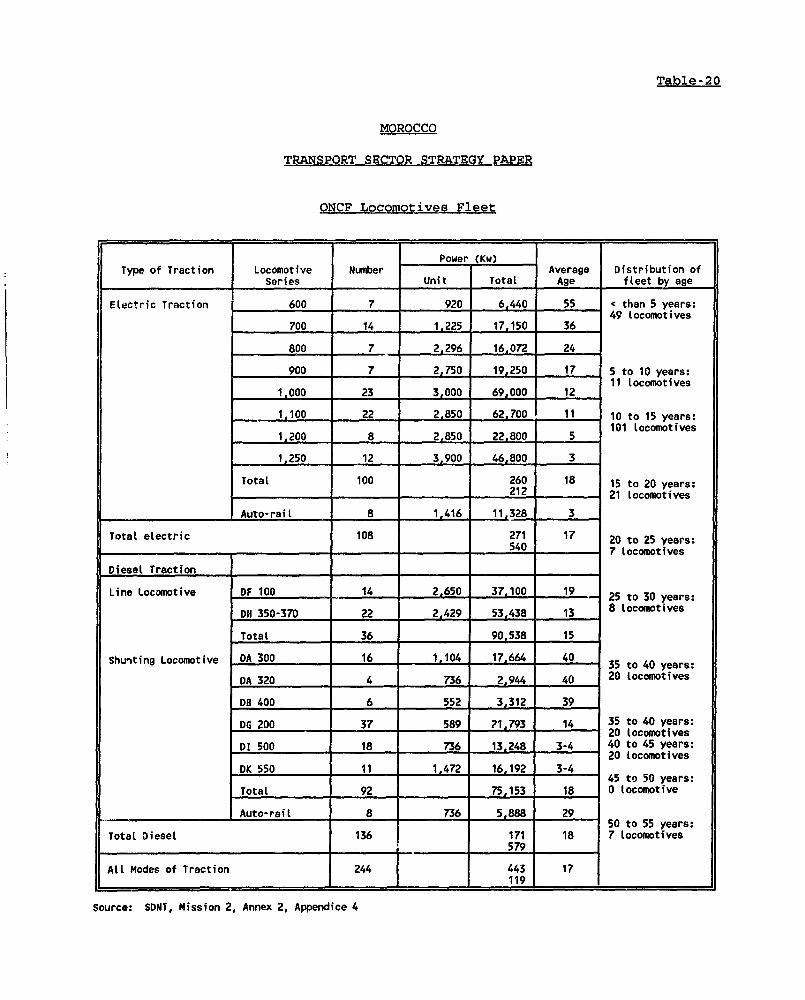
Table- 20
MOROCCO
TRANSPORT SECTOR STRATEGy PAPER
ONCF Locomotives Fleet
Power (Kw)Type of Traction Locomotive Number Average Distribution of
Series Unit Total Age fleet by age
Electric Traction 600 7 920 6,440 55 < than 5 years:49 locomotives
700 14 1,225 17,150 36
S00 7 _ 2296 16,072 24
900 7 2,750 19 250 17 5 to 10 years:11 Locomotives
1.000 23 3,000 69,000 12
1 100 22 2,850 62.700 11 10 to 15 years:_ _ ~~~~101 locomotives
1.200 8 2,850 22.800 5
1,250 12 3.900 46.800 3
Total 100 260 18 15 to 20 years:212 21 Locomotives
.________________ Auto-rail 8 1.416 11 328 3
Total electric 108 271 17 20 to 25 years:.. ___________________ ._____________ _ .540 _ _ _ 7 Locomotives
DieseL Traction
Line Locomotive DF 100 14 2,650 37,100 19 25 to 30 years-
DH 350-370 22 2,429 53,438 13 8 Locomotives
TotaL 36 90,538 15 _
Shunting Locomotive DA 300 16 1.104 17.664 40 35 to 40 years:
DA 320 4 736 I 2944 40 20 locomotives
DB 400 6 552 3,312_ 39
DG 200 37 589 21.793 14 35 to 40 years:20 locomotives
Di 500 18 736 13 248 3-4 40 to 45 years:20 locomotives
DK 550 11 1.472 16 192 3-445 to 50 years:
TotaL 92 75,153 18 0 locomotive
Auto-rail 8 _ 736 5,888 2950 to 55 years:
TotaL Diesel 136 171 18 7 locomotives__________ 579
ALL Modes of Traction 244 443 17_ . 119 _ _ _
Source: SDNT, Mission 2, Annex 2, Appendice 4
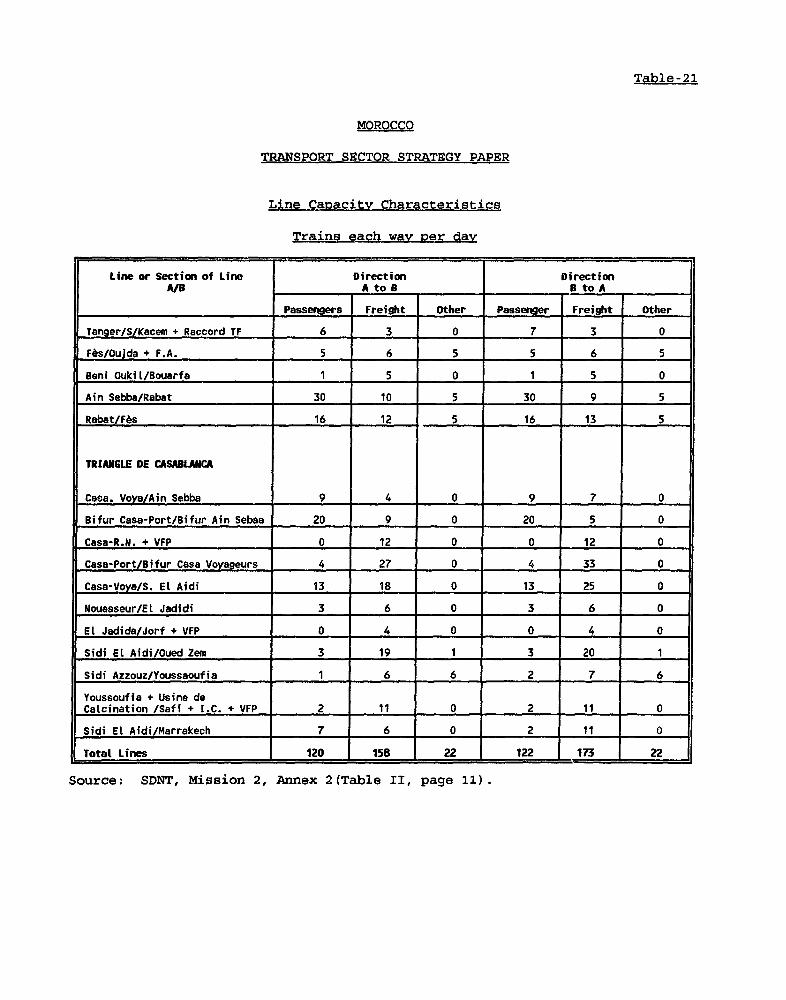
Table-21
MOROCCO
TRANSPORT SECTOR STRATEGY PAPER
Line Capacitv Characteristics
Trains each way per dav
Line or Section of Line Direction Direction| A/_A AtoB B_ to A
Passengers Freight Other Passenger Freight Other
Tanger/S/Kacem + Raccord TF 6 3 0 7 3 0
Fes/Ouida + F.A. 5 6 5 5 6 5
Beni Oukit/Bouarfa 1 5 0 1 5 0
Ain Sebba/Rabat 30 10 5 30 9 5
Rabat/Fes 16 12 5 16 13 5
TRIANGLE DE CASABLANCA
Casa. Voya/Ain Sebba 9 4 0 9 7 0
Bifur Casa-Port/Bifur Ain Sebaa 20 9 0 20 5 0
Casa-R.N. + VFP 0 12 0 0 12 0
Casa-Port/Bifur Casa Voyageurs 4 27 0 4 33 0
Casa-Voya/S. El Aidi 13 18 0 13 25 0
Nouasseur/EL Jadidi 3 6 0 3 6 0
EL Jadida/Jorf + VFP 0 4 0 0 4 0
Sidi EL Aidi/Oued Zem 3 19 1 3 20 1
Sidi Azzouz/Youssaoufia 1 6 6 2 7 6
Youssoufia + Usine deCalcination /Safi + I.C. + VFP 2 11 0 2 11 0
Sidi EL Aidi/Marrakech 7 6 0 2 11 0
Total Lines 120 158 22 122 173 22
Source: SDNT, Mission 2, Annex 2(Table II, page 11).

MOROCCOTRANSPORT SECTOR STRATEGY PAPER
ONCF Passenger Traffic
Number of passengers Number of passengers/km ('000) AverageYear 1 st Class 2nd Class Econ. Class Total 1 st Class 2nd Class Econ. Class Total dist/pass.
1963 108,875 712,142 3,098,589 3,919,606 25,307 163,679 297,816 486,802 124.21964 118,267 763,314 3,164,048 4,045,629 30,471 180,588 313,352 524,411 129.6
1973 146,793 971,710 3,204,178 4,322,681 48,661 251,572 323,986 624,219 144.41974 161,072 1,193,776 3,971,515 5,326,363 52,551 311,290 411,996 775,837 146.71975 120,167 1,306,972 4,183,325 5,610,464 40,650 343,835 450,638 835,123 148.91976 107,425 1,487,356 4,191,243 5,786,024 37,758 364,399 425,661 827,818 143.11977 109,416 1,680,000 3,353,824 5,143,240 36,529 417,000 359,943 813,472 142.41978 136,598 1,982,000 2,977,790 5,096,388 45,301 495,000 330,846 871,147 170.91979 120,928 1,853,000 2,632,545 4,606,473 41,983 473,000 288,514 803,497 174.41980 159,352 1,978,000 2,985,265 5,122,617 54,926 516,000 364,683 935,609 182.61981 181,451 2,337,000 3,609,696 6,128,147 61,848 616,000 461,967 1,139,815 185.91982 230,146 2,666,814 4,622,849 7,519,809 76,057 701,910 596,793 1,374,760 182.81983 229,888 2,636,765 4,908,658 7,775,311 74,104 684,731 648,390 1,407,225 180.91984 285,519 3,689,563 5,586,087 9,561,169 75,623 806,385 738,026 1,620,034 169.91985 259,860 4,946,148 5,779,521 10,985,529 70,705 984,276 771,612 1,826,593 166.31986 287,055 5,432,001 5,883,449 11,602,505 80,510 1,072,928 804,841 1,958,279 168.81987 322,495 5,723,752 6,108,190 12,154,437 87,593 1,115,855 865,497 2,068,945 170.21988 321,592 5,353,798 5,880,302 11,555,692 88,061 1,128,177 876,250 2,092,488 181.11989 377.484 5,673,936 5,730,864 11,782,284 107,451 1,184,626 875,553 2,167,630 184.0
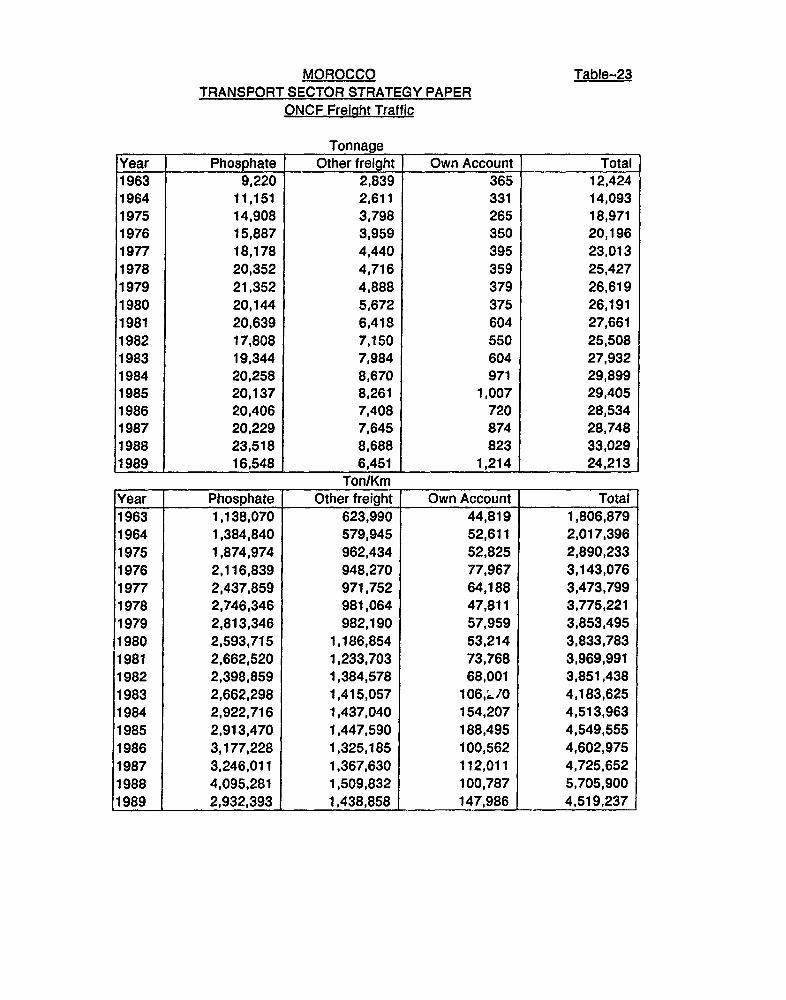
MOROCCO Table-23TRANSPORT SECTOR STRATEGY PAPER
ONCF Freight Traffic
TonnageYear Phosphate Other freight Own Account Total1963 9,220 2,839 365 12,4241964 11,151 2,611 331 14,0931975 14,908 3,798 265 18,9711976 15,887 3,959 350 20,1961977 18,178 4,440 395 23,0131978 20,352 4,716 359 25,4271979 21,352 4,888 379 26,6191980 20,144 5,672 375 26,1911981 20,639 6,418 604 27,6611982 17,808 7,150 550 25,5081983 19,344 7,984 604 27,9321984 20,258 8,670 971 29,8991985 20,137 8,261 1,007 29,4051986 20,406 7,408 720 28,5341987 20,229 7,645 874 28,7481988 23,518 8,688 823 33,0291989 16,548 6,451 1,214 24,213
T on/Km
Year Phosphate Other freight Own Account Total1963 1,138,070 623,990 44,819 1,806,8791964 1,384,840 579,945 52,611 2,017,3961975 1,874,974 962,434 52,825 2,890,2331976 2,116,839 948,270 77,967 3,143,0761977 2,437,859 971,752 64,188 3,473,7991978 2,746,346 981,064 47,811 3,775,2211979 2,813,346 982,190 57,959 3,853,4951980 2,593,715 1,186,854 53,214 3,833,7831981 2,662,520 1,233,703 73,768 3,969,9911982 2,398,859 1,384,578 68,001 3,851,4381983 2,662,298 1,415,057 106,~./O 4,183,6251984 2,922,716 1,437,040 154,207 4,513,9631985 2,913,470 1,447,590 188,495 4,549,5551986 3,177,228 1,325,185 100,562 4,602,9751987 3,246,011 1,367,630 112,011 4,725,6521988 4,095,281 1,509,832 100,787 5,705,9001989 2,932,393 1,438,858 147,986 4,519,237

Table- 24
MOROCCO
TRA1lSPORT SECTOR STRATEGY PAPER
Rail FreiQht Traffic By Commodity, 1986 and 1987
Commodity Tons ('000) Ton-Km ('000)
1986 1987 X Change 1986 1987 X Change
Agricultural Products 670 827 +23.4 177,201 190,576 7.5of whiich:CereaLs 553 735 +32.9 145,276 167,575 +15.3
Citrus Fruits 66 39 -40.1 15,228 9,416 +38.2
Food Products of which: 497 511 +2.8 122,825 124,867 +1.7
unrefined suigar 156 148 -5.1 16,360 14,365 -12.2
refined sugar 179 198 +10.6 52,059 54,614 +5.0
Mineral Products of which: 2,776 3,075 +10.8 477,954 506,672 +6.0
Sulphur 1,134 1,091 -3.8 28,364 27,321 -3.7
Coal 165 342 +107.3 71,825 123,714 +72.2
Cement and Clinker 515 592 +15.0 215,810 198,015 -8.2
Sand and Gravel 729 829 +13.7 95,943 98,748 +2.9
Petroletu Products of which: 690 737 +6.8 115,076 118,494 +3.0
crude oil 87 52 -40.2 19,536 11517 -41.0
black prodtcts 297 363 +22.2 36,503 43,855 +20.1
Chemical Products andFertilizers of which: 2,843 2,650 -6.8 289,678 283,513 -2.1
IC fertilizers I_
Safari fertilizers 1,005 1,082 +7.7 118,124 139,109 +17.8
iwrvrted fertilizers 140 117 -16.4 22.986 16,219 -29.4
exported fertilizers 283 252 -11.0 75,166 65.971 -12.2
phosphoric acid 1,265 1,053 -16.8 31,617 26,322 -16.7
Miscellaneous 653 719 +10.1 243,010 255,529 +5.2
Total excluding 8,129 8,519 +4.8 1,425,747 1,479,641 +3.8Phosphates
Source: SDNT, Mission 2, Annex 2: Table 1 page 8
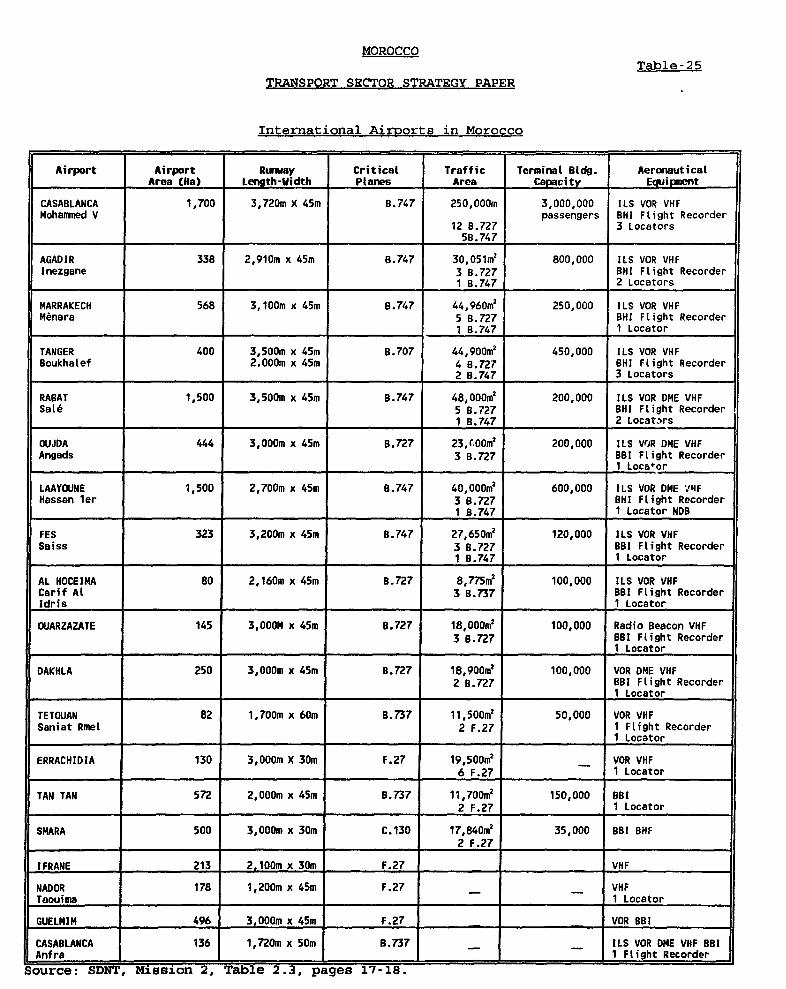
MOROCCOTable-25
TRANSPORT SECTOR STRATEGY PAPER
International Airoorts in Morocco
Airport Airport Runway Critical Traffic Terminal Bldg. Aeronautical-____________ Area (Ha) Length-Width Planes Area Capacity E ipment
CASABLANCA 1,700 3,720m X 45m 8.747 250,000m 3,000,000 ILS VOR VHFMohammed V passengers BHI Flight Recorder
12 8.727 3 Locators_____ ____ ____ ____ ____ ____5B.747 _ _ _ _ _ _ _ _
AGADIR 338 2,910m x 45m 8.747 30,051m2 800,000 ILS VOR VHFInezgane 3 B.727 BHI Flight Recorder
1 8.747 2 Locators
MARRAKECH 568 3,100m x 45m 8.747 44,960m' 250,000 ILS VOR VHFM&nara 5 B.727 8HI Flight Recorder
1 8.747 1 Locator
TANGER 400 3,500m x 45m B.707 44,900r2 450,000 ILS VOR VHFBoukhalef 2.000m x 45m 4 8.727 BHI Flight Recorder
______________ _______________ ________________ ______________ 2 8.747 _ _2 B.747 _ 3 Locators
RABAT 1,500 3,500m x 45m 8.747 48,000m2 200,000 ILS VOR OME VHFSal6 5 8.727 BHI Flight Recorder
1 8.747 2 Locators
OUJDA 444 3,000m x 45m 8.727 23,(00m2 200,000 ILS VOJR DME VHFAngads 3 B.727 8BI Flight Recorder
________________ _______________________________ I 1 Locator
LAAYOLINE 1,500 2,700m x 45m 8.747 40,000.2 600,000 ILS VOR DME VhFHassan ler 3 8.727 BHI Flight Recorder
_______________ ________________ 1 8.747 1 Locator NDB
FES 323 3,200m x 45m 8.747 27,650.2 120,000 ILS VOR VHFSaiss 3 8.727 BBI Flight Recorder
1 8.747 1 Locator
AL HOCEIMA 80 2,160m x 45m B.727 8,775.2 100,000 ILS VOR VHFCarif Al 3 8.737 BBI Flight RecorderIdris 1 Locator
OUARZAZATE 145 3,OOOM x 45m B.727 18,000,2 100,000 Radio Beacon VHF3 8.727 8B! Flight Recorder
_____ ____ ____ _____ ____ ____ ____ ____ ____ ___ _ ____ ____ ____ ____ ____ ___I Locator
DAKHLA 250 3,000m x 45m B.727 18,900,2 100,000 VOR DME VHF2 8.727 881 Flight Recorder
_____ ____ _________ ____ ____ __ __ ____ ____ ___ _ ____ ____ __ __ ____ ____ ____ I Locator
TETOUAN 82 1,700m x 60m 8.737 11,500m2 50,000 VOR VHFSaniat Rmel 2 F.27 I Flight Recorder
1 Locator
ERRACHIDIA 130 3,000m X 30m F.27 19,500,2 _ VOR VHF6 F.27 1 Locator
TAN TAN 572 2,000m x 45m 8.737 11,700m2 150,000 8B1.____ _ 2 F.27 1 Locator
SMARA 500 3,000m x 30m C.130 17,840m2 35,000 BBI BHF2 F.27
IFRANE 213 2,100m x 30m F.27 VHF
NADOR 178 1,200m x 45m F.27 VHFTaouima ____ 1 Locator
GUELMIM 496 3,000m x 45m F.27 VOR BBI
CASABLANCA 136 1,720m x 50m B.737 [_ ILS VOR DME VHF BBIAnfra 1 Flight Recorder
Source: SDNT, Mission 2, Table 2.3, pages 17-18.
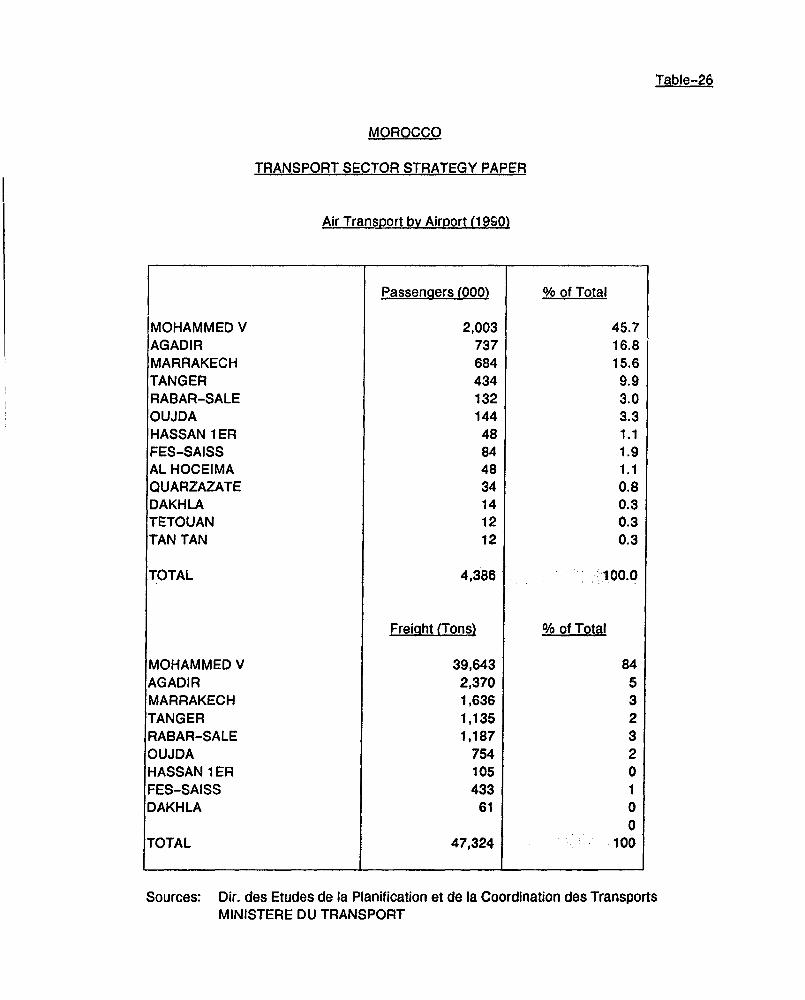
Table-26
MOROCCO
TRANSPORT SECTOR STRATEGY PAPER
Air Transport by Airport (1990)
Passengers (000) % of Total
MOHAMMED V 2,003 45.7AGADIR 737 16.8MARRAKECH 684 15.6TANGER 434 9.9RABAR-SALE 132 3.0OUJDA 144 3.3HASSAN 1ER 48 1.1FES-SAISS 84 1.9AL HOCEIMA 48 1.1QUARZAZATE 34 0.8DAKHLA 14 0.3TETOUAN 12 0.3TAN TAN 12 0.3
TOTAL 4,386 :1nn.0
Freight (Tons) % of Total
MOHAMMED V 39,643 84AGADIR 2,370 5MARRAKECH 1,636 3TANGER 1,135 2RABAR-SALE 1,187 3OUJDA 754 2HASSAN 1ER 105 0FES-SAISS 433 1DAKHLA 61 0
0TOTAL 47,324 100
Sources: Dir. des Etudes de la Planification et de la Coordination des TransportsMINISTERE DU TRANSPORT
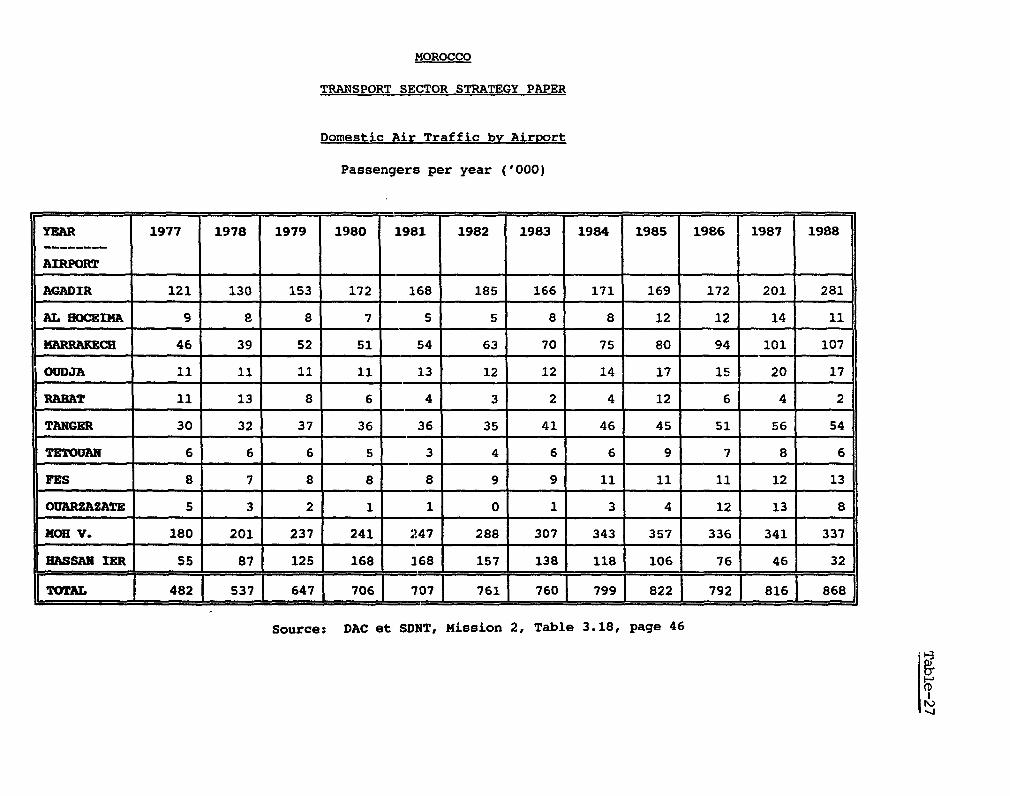
MOROCCO
TRANSPORT SECTOR STRATEGY PAPER
Domestic Air Traffic by Airport
Passengers per year ('000)
YEAR 1977 1978 1979 1980 1981 1982 1983 1984 1985 1986 1987 1988
AIRPORT
AGADIR 121 130 153 172 168 185 166 171 169 172 201 281
AL HOCEMA 9 8 8 7 5 5 8 8 12 12 14 11
MARPRAMCH 46 39 52 51 54 63 70 75 80 94 101 107
OUDJA 11 11 I 11 11 13 12 12 14 17 15 20 17
RABAT 11 13 8 6 4 3 2 4 12 6 4 2
TANGER 30 32 37 36 36 35 41 46 45 51 56 54
TETOUAN 6 6 6 5 3 4 6 6 9 7 8 6
FES 8 7 8 8 8 9 9 11 11 11 12 13
OUARZAZATE 5 3 2 1 1 0 1 3 4 12 13 8
MEo V. 180 201 237 241 247 288 307 343 357 336 341 337
HASSAN IER 55 87 125 168 168 157 138 118 106 76 46 32
TOTAL 482 5 647_ 706 _707 71 760 799 822 7921 816 68
Source: DAC et SDNT, Mission 2, Table 3.18, page 46
(D
-3j
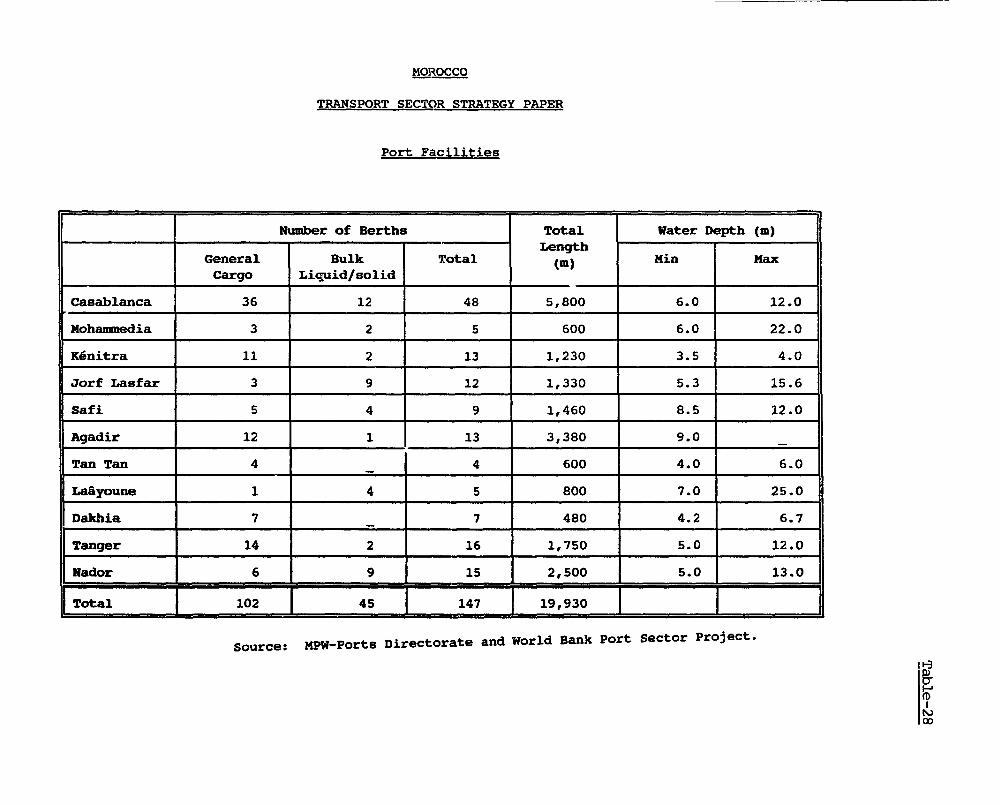
MOROCCO
TRANSPORT SECTOR STRATEGY PAPER
Port Facilities
Number of Berths Total Water Depth (m)Length
General Bulk Total (m) min MaxCargo Liquid/solid
Casablanca 36 12 48 5,800 6.0 12.0
Mohammedia 3 2 5 600 6.0 22.0
K6nitra 11 2 13 1,230 3.5 4.0
Jorf Lasfar 3 9 12 1,330 5.3 15.6
Safi 5 4 9 1,460 8.5 12.0
Agadir 12 1 13 3,380 9.0
Tan Tan 4 4 600 4.0 6.0
Lahyoune 1 4 5 800 7.0 25.0
Dakhia 7 7 480 4.2 6.7
Tanger 14 2 16 1,750 5.0 12.0
Nador 6 9 _ 15 2,500 5.0 13.0
Total 102 45 147 T 19,930
Source: MPW-Ports Directorate and World Bank Port Sector Project.
(D~I00
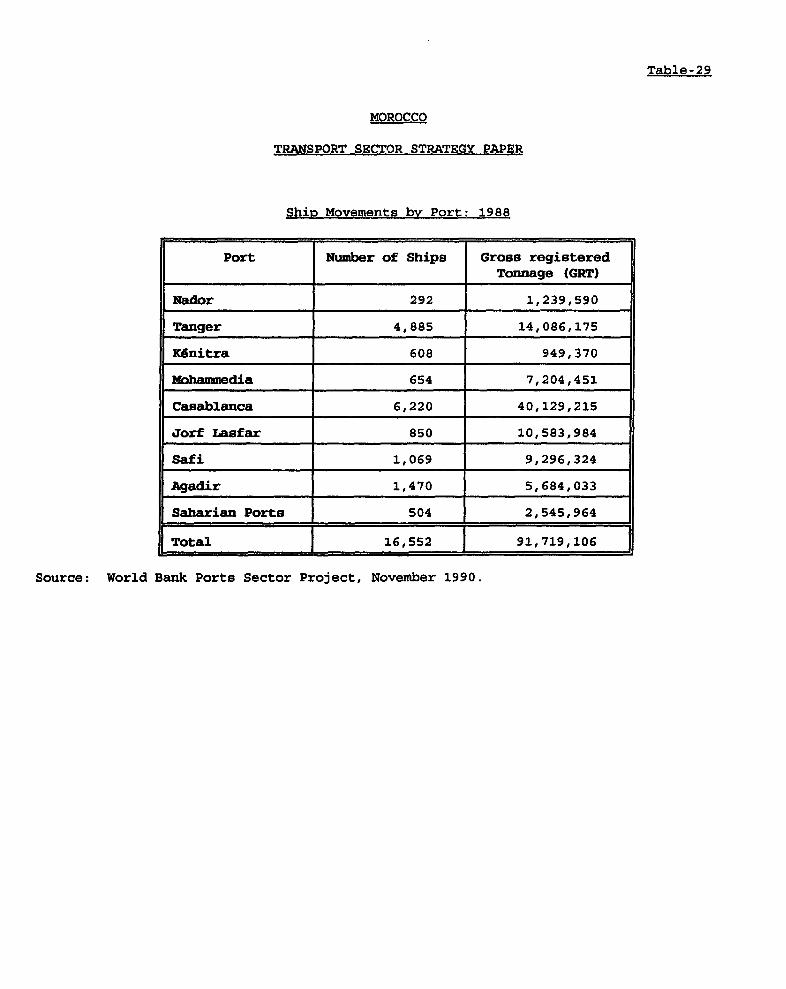
Table-29
MOROCCO
TRANSPORT SECTOR STRATEGY PAPER
Ship Movements by Port: 1988
Port Number of Ships Gross registeredTonnage (GRT)
Nador 292 1,239,590
Tanger 4,885 14,086,175
K6nitra 608 949,370
Nbhammedia 654 7,204,451
Casablanca 6,220 40,129,215
Jorf Lasfar 850 10,583,984
Safi 1,069 9,296,324
Agadir 1,470 5,684,033
Saharian Ports 504 2,545,964
L Total 16,552 91,719,106
Source: World Bank Ports Sector Project, November 1990.
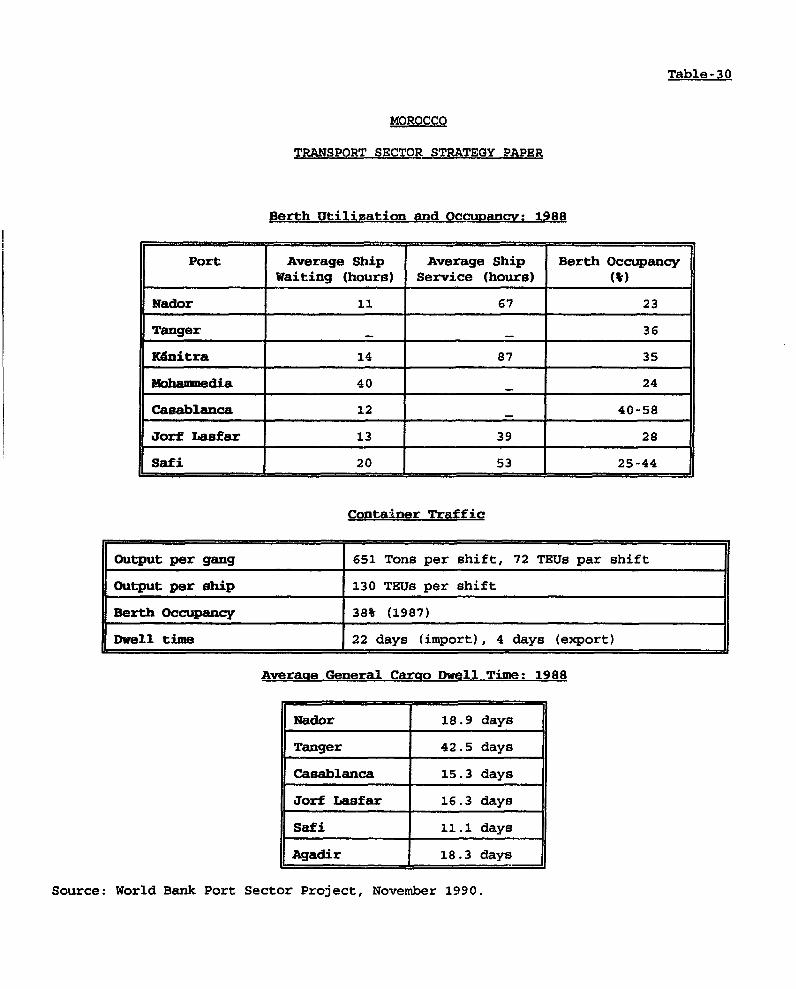
Table-30
MOROCCO
TRANSPORT SECTOR STRATEGY PAPER
Berth Utilization and Occupancy: 1988
Port Average Ship Average Ship Berth OccupancyWaiting (hours) Service (hours) (e)
Nador 11 67 23
Tanger 36
R4nitra 14 87 35
|Mhammedia 40 24
Casablanca 12 40-58
Jorf Lasfar 13 39 28
Safi 20 53 25-44
Container Traffic
Output per gang 651 Tons per shift, 72 TEUs par shift
Output per ship 130 TEUs per shift
Berth Occupancy 38W (1987)
Dwell time 22 days (import), 4 days (export)
Averaue General Cargo Dwell Time: 1988
Nador 18.9 days
Tanger 42.5 days
Casablanca 15.3 days
Jorf Lasfar 16.3 days
Safi 11.1 days
Agadir 18.3 days
Source: World Bank Port Sector Project, November 1990.

MOROCCO
TRANSPORT SECTOR STRATEGY PAPER
Distribution of Traffic by Port: 1988*
('000 Tons)
Port Liquid Bulk Minerals Cereals Dry Bulk General Cargo Total
Casablanca 1,558 10,305 998 361 3,502 16,724
Mohamnedia 4,865 17 10 4,892
Safi 1,656 3,147 193 638 196 5,830
Jorf Lasfar 1,834 3,747 127 1,184 41 6,933
Tanger 90 176 499 765
Nador 56 426 204 491 1,177
Agadir 312 225 221 26 510 1,294
U6nitra 82 47 7 276 412
Saharan Ports 184 144 18 34 380
Total 10,637 18,041 1,919 2,251 5,559 38,407
* Includes coastal traffic
Source: World Bank, Port Sector project, November 1990.
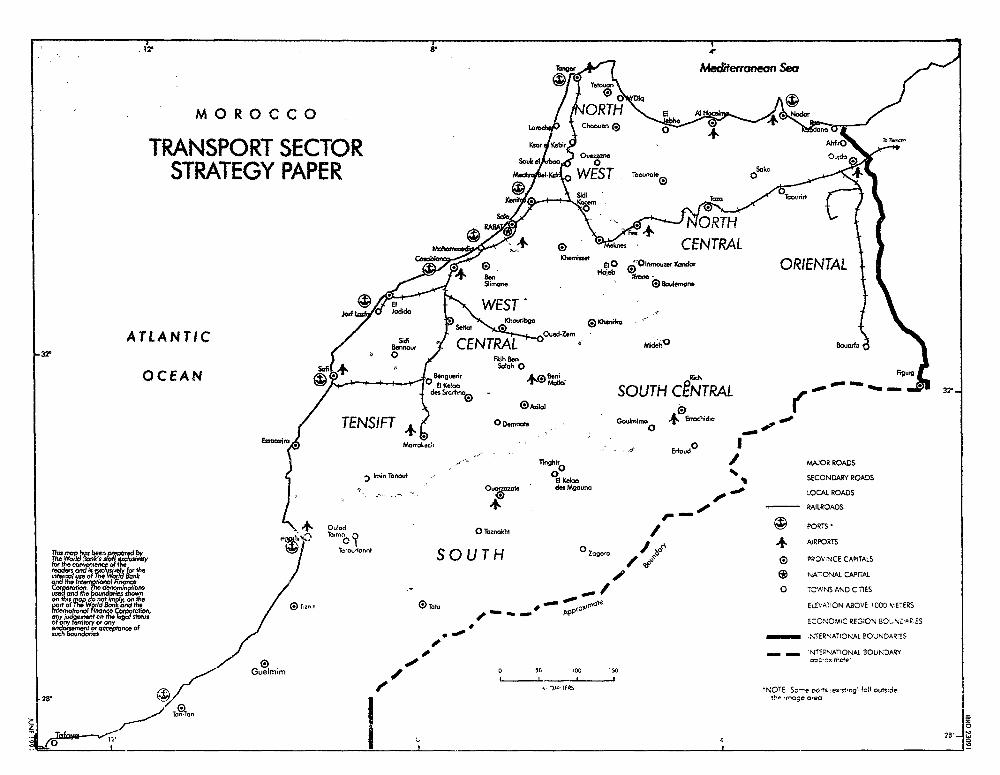
wrof7 M~~he&yanenSea
MOROCCO
TRANSPORT SECTOR Onda
STRATEGY PAPER Mi WEST _
* s nen CENTRALEaO EWn ORIENTAL
, WEST' bouiemone/ J9udiJubo 3badfl o*
ATLANTICSiiMd0A T L A N T I C / 0~~~~~~~~~~ ~~en9nou CETooue 2u MlhO3uaod
O C E A N G So nglerir Fks9 + hloEn Een Figu OCEAN mien4,9 ;rdft ElS h~ SOUTH CENTRAL
TENSIFT ODmnots Gokimi ' da _
0~~~~~
n.n TonoW .O Knt SECONDARY ROADS4. .,- -, _ , O reo dc MsounrzLOCAL ROADS
/ RAI~~~LROADS
+ 0.1.d ~~0 Taznakhl /PORTS0 +~~~~~~~~~/~4 PURPORTS
zno n n ut V 1 ~nnnTowwt S O U T H 0 Zngna / n OVNCECAPrcALS
on7g1l 7ha ofth d Bank e NA1ONAL CAPITALC,
t.ion t0 T WNS AND CIIESmTemaf onThe nanE Z Tot.o gone
ELEVATION ABOVE I OO VETERSIr=ownlfiqnQnr O.r ~hrw s _;ppr aoynd jooen thnm legol statusECONOM1C REGION B0L%ZUE,ES
of 0 .00 ~~~~~~~~~~~~~~~~~~~~~~~~~~~~~~~~~~~~~~NTERNATIONAL BOUNOAR:ES
r-rhowndodes - _ NTEPNATIONAt BOUNDARY
Guemim 0 sC 00o m50
20 / ' -). irRs *OhE S-o'e 015 ero 01091 I~IdT
z J Ton.Ton |~~~~~~~~~~~~~~~~~~~~~~~~~~~~~~~~~~~~~~~~~~~~~~~~~~2_ _ _ _ I 2S___