kinross gold corp q4 2015 earnings webcast presentation
TRANSCRIPT

1www.kinross.com
1
KINROSS GOLD CORPORATIONQ4 & FY 2015 Results Conference Call & Webcast
February 11
2016
2www.kinross.com
2
CAUTIONARY STATEMENT ON FORWARD-LOOKING INFORMATION
All statements, other than statements of historical fact, contained or incorporated by reference in or made in giving this presentation and responses to questions,
including but not limited to any information as to the future performance of Kinross, constitute “forward looking statements” within the meaning of applicable securitieslaws, including the provisions of the Securities Act (Ontario) and the provisions for “safe harbour” under the United States Private Securities Litigation Reform Act of1995 and are based on expectations, estimates and projections as of the date of this presentation. Forward-looking statements contained in this presentation includethose statements on slides with, and statements made under, the headings “Strong Balance Sheet”, “2016 Outlook”, “Organic Growth Opportunities”, “Kinross ValueProposition”, “Attractive Future Growth Opportunities”, “Compelling Valuation”, “2015 Mineral Reserves and Resources”, “Exploration Highlights”, and include withoutlimitation statements with respect to our guidance for production, production costs of sales, all-in sustaining cost and capital expenditures, continuous improvementand other cost savings opportunities, as well as references to other possible events include, without limitation, possible events; opportunities; statements with respectto possible events or opportunities; estimates and the realization of such estimates; future development, mining activities, production and growth, including but notlimited to cost and timing; success of exploration or development of operations; the future price of gold and silver; currency fluctuations; expected capitalrequirements; government regulation; and environmental risks. The words “2016E”, “ahead”, “alternative”, “anticipate”, “assumption”, “believe”, “budget”,“contemplate”, “contingent”, “driver”, “encouraging”, “enhancing”, “estimate”, “expect”, “explore”, “feasibility”, “flexibility”, “focus”, “forecast”, “forward”, “future”,“guidance”, “initiative”, “indicate”, “intend”, “measures”, “objective”, “on track”, “opportunity”, “optimize”, “options”, “outlook”, “PFS”, “phased”, “plan”, “positive”,“positioned”, “possible”, “potential”, “principle”, “pre-feasibility”, “priority”, “pro-forma”, “projected”, “proposition”, “prospective”, “risk”, “strategy”, “study”, “target”,“think”, “tracking”, “upside” or “view”, or variations of or similar such words and phrases or statements that certain actions, events or results may, can, could, would,should, might, indicates, or will be taken, and similar expressions identify forward looking statements. Forward-looking statements are necessarily based upon anumber of estimates and assumptions that, while considered reasonable by Kinross as of the date of such statements, are inherently subject to significant business,economic and competitive uncertainties and contingencies. Statements representing management’s financial and other outlook have been prepared solely forpurposes of expressing their current views regarding the Company’s financial and other outlook and may not be appropriate for any other purpose. Many of theseuncertainties and contingencies can affect, and could cause, Kinross’ actual results to differ materially from those expressed or implied in any forward lookingstatements made by, or on behalf of, Kinross. There can be no assurance that forward looking statements will prove to be accurate, as actual results and futureevents could differ materially from those anticipated in such statements. All of the forward looking statements made in this presentation are qualified by thesecautionary statements, and those made in our filings with the securities regulators of Canada and the U.S., including but not limited to those cautionary statementsmade in the “Risk Factors” section of our most recently filed Annual Information Form, the “Risk Analysis” section of our FYE 2015 Management’s Discussion andAnalysis, and the “Cautionary Statement on Forward-Looking Information” in our news release dated February 10, 2016, to which readers are referred and which areincorporated by reference in this presentation, all of which qualify any and all forward‐looking statements made in this presentation. These factors are not intended torepresent a complete list of the factors that could affect Kinross. Kinross disclaims any intention or obligation to update or revise any forward‐looking statements or toexplain any material difference between subsequent actual events and such forward‐looking statements, except to the extent required by applicable law.
Other information
Where we say "we", "us", "our", the "Company", or "Kinross" in this presentation, we mean Kinross Gold Corporation and/or one or more or all of its subsidiaries, asmay be applicable.
The technical information about the Company’s mineral properties contained in this presentation (other than exploration activities) has been prepared under thesupervision of Mr. John Sims, an officer of the Company who is a “qualified person” within the meaning of National Instrument 43-101 (“NI 43-101”). The technicalinformation about the Company’s exploration activities contained in this news release has been prepared under the supervision of Mr. Sylvain Guerard, an officer ofthe Company who is a “qualified person” within the meaning of NI 43-101.
3www.kinross.com
3
FOURTH QUARTER & FULL-YEAR 2015HIGHLIGHTS

4www.kinross.com
4
OPERATIONAL EXCELLENCE
STRONG TRACK RECORD2012 2013 2014 2015
MET or EXCEEDED annual production guidance
MET or came in UNDER annual cost of sales guidance
MET or came in UNDER annual capital expenditures guidance
CONSISTENTLY MEETING OR OUTPERFORMINGTARGETS

5www.kinross.com
5
Original 2015 Guidance
Revised 2015 Guidance 2015 Results
Gold equivalent production (oz.)(1) 2.4 to 2.6Moz. 2.5 to 2.6Moz. 2.6Moz.
Production cost of sales (US$/oz.)(2) $720 to $780 $690 to $730 $696
All-in sustaining cost (US$/oz.)(3) $1,000 to $1,100 $975 to $1,025 $975
Capital Expenditures (US$M) $725 $650 $610
2015 HIGHLIGHTS
DELIVERING STRONG PERFORMANCE
• Operations delivered solid results in 2015:
HIGH-END of 2015 revised guidance for production
LOW-END of 2015 revised guidance for cost of sales and all-in sustaining cost
BELOW 2015 revised guidance for capital expenditures
Continued track record of meeting or beating our operational targets
(1) Refer to endnote #1.(2) Refer to endnote #2.(3) Refer to endnote #3.

6www.kinross.com
6662015 PRODUCTION HIGHLIGHTS
OPERATIONAL EXCELLENCE
Fort Knox, AK• Produced over 400koz., 2nd
highest in 19-year history
Round Mountain, NV• Highest production since
2009 with costs down 12%
Kupol-Dvoinoye, Russia• Achieved record mill
throughput in Q4 2015

7www.kinross.com
7
OPERATIONAL EXCELLENCE
REDUCING COSTS
FX AND OIL PRICES
• Benefiting from foreign exchange, particularly for Brazilian real and Russian rouble
Kupol-Dvoinoye achieved LOWEST cost of sales since 2011
• Benefits from lower oil, particularly at mines in US and Mauritania
OPERATIONAL IMPROVEMENTS• Achieving cost savings through continuous
improvement initiatives. Highlights include: Record throughput at KUPOL in Q4 2015 ROUND MOUNTAIN heap leach
enhancements Improved throughput at TASIAST
Production Cost of Sales(2)
(US$ per gold equivalent ounce)
(2) Refer to endnote #2.
$743$720
$696
2013 2014 2015
Achieved cost of sales at the low-end of revised 2015 guidance

8www.kinross.com
8
STRONG BALANCE SHEET
FINANCIAL STRENGTH & FLEXIBILITY
$984
$1,044
31-Dec-14 31-Dec-15
• Increased cash balance by ~$60 MILLION since year-end 2014, despite lower gold prices
• REPAID $80 million of debt
• Strong financial position following the acquisition of producing mines in Nevada
Pro-forma liquidity of $1.9 BILLION(i)
US
$ m
illio
ns
CASH AND CASH EQUIVALENTS
(i) Pro-forma the $610M all cash Nevada transaction.

9www.kinross.com
9
ACQUIRED QUALITY PRODUCING MINES IN NEVADA• Two quality producing mines in an excellent jurisdiction
• Enhances U.S. operating portfolio: adds production, increases estimated mine life and projected free cash flow, and lowers costs
• Clear upside potential at Bald Mountain and Round Mountain
• Maintains balance sheet strength: all cash transaction increases overall cash flow, lowers costs and enhances credit metrics

10www.kinross.com
10
2016 OUTLOOK
FORECASTING RECORD PRODUCTION
2.6
2.7 – 2.9
2015 2016E
Gold Equivalent Production(millions)
• Expect to produce 2.7 – 2.9 milliongold equivalent ounces in 2016(4)
Includes approximately 350koz.of additional production from Nevada acquisition
• Over 60% of expected production from the Americas
(4) Refer to endnote #4.
11www.kinross.com
11
2016 OUTLOOK
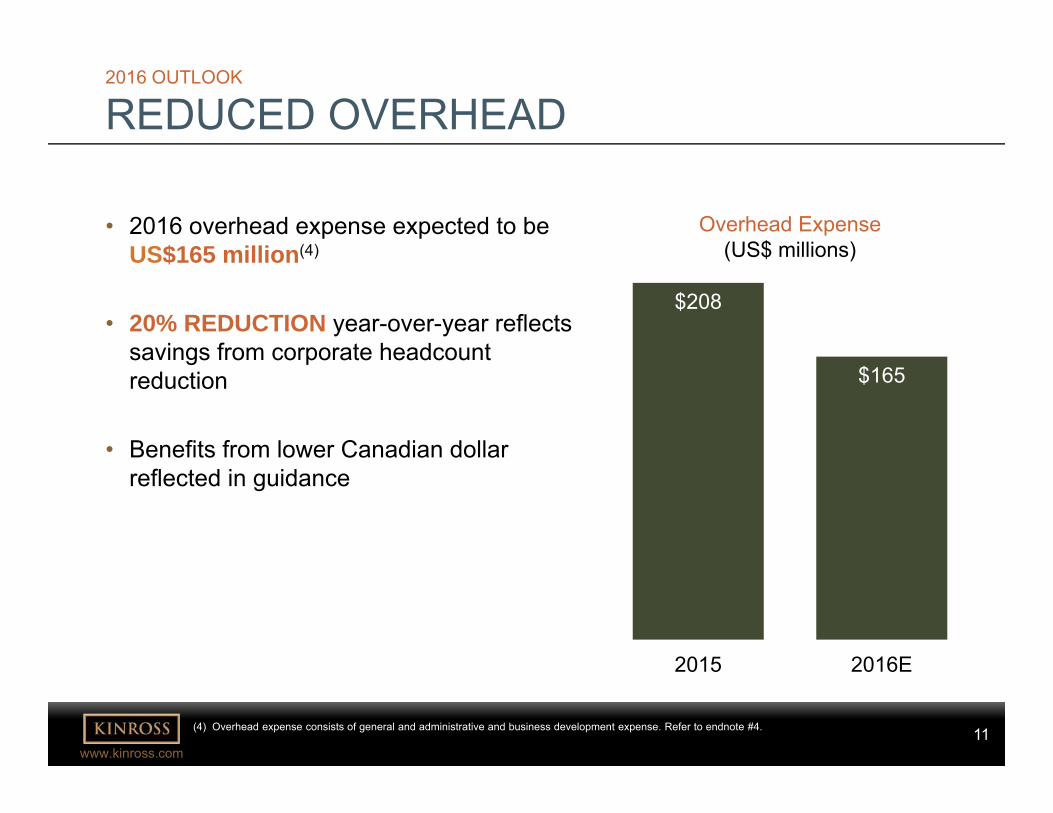
REDUCED OVERHEAD
$208
$165
2015 2016E
Overhead Expense(US$ millions)
• 2016 overhead expense expected to be US$165 million(4)
• 20% REDUCTION year-over-year reflects savings from corporate headcount reduction
• Benefits from lower Canadian dollar reflected in guidance
(4) Overhead expense consists of general and administrative and business development expense. Refer to endnote #4.
12www.kinross.com
12
2016 OUTLOOK
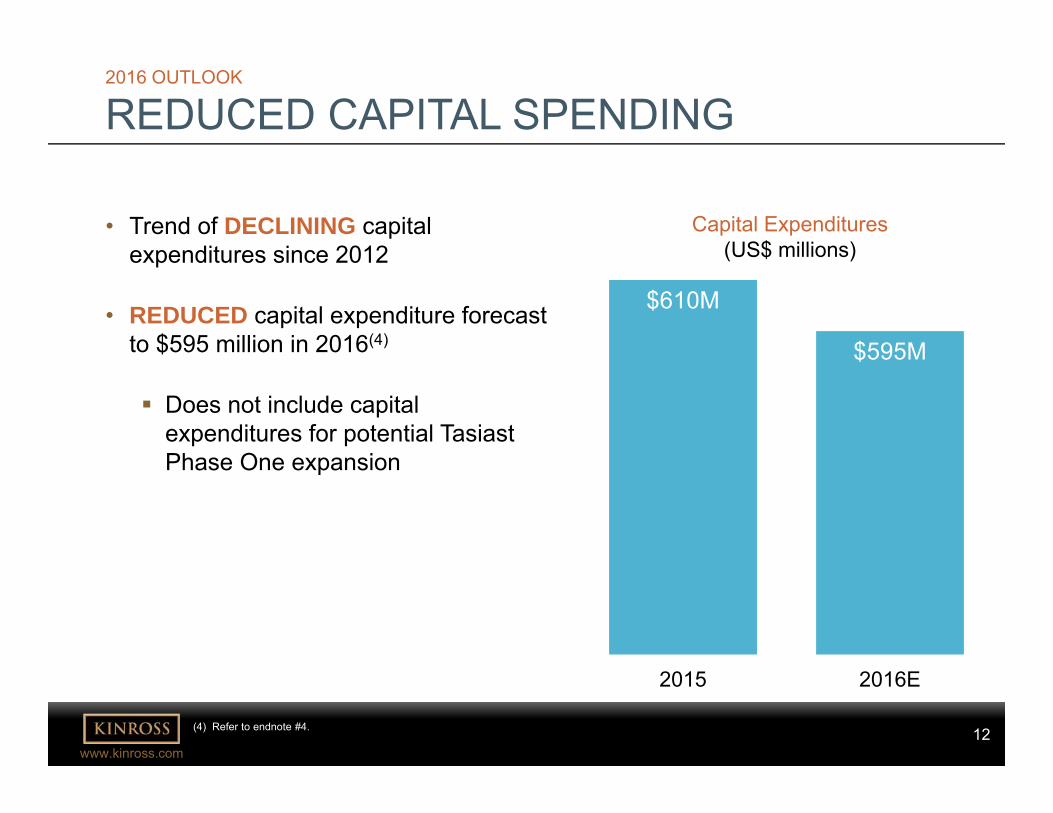
REDUCED CAPITAL SPENDING
$610M
$595M
2015 2016E
• Trend of DECLINING capital expenditures since 2012
• REDUCED capital expenditure forecast to $595 million in 2016(4)
Does not include capital expenditures for potential Tasiast Phase One expansion
Capital Expenditures(US$ millions)
(4) Refer to endnote #4.

13www.kinross.com
13
ORGANIC GROWTH OPPORTUNITIES
PHASED APPROACH TO TASIAST EXPANSIONPotential to add incremental capacity in two phases by leveraging existing infrastructure
• PHASE ONE would increase throughput to 12,000 tpd with the addition of a gyratory crusher and oversized SAG mill
• PHASE TWO would further increase total throughput significantly with additional milling, leaching, thickening and refining capacity
• Opportunity to realize Tasiast’s growth potential while substantially lowering overall expected capital costs compared with the previous estimate of $1.6 billion
• Studies progressing well; expect to provide results and file updated technical report in late March 2016

14www.kinross.com
14
ORGANIC GROWTH OPPORTUNITIES
LA COIPA PROJECT• Pre-feasibility study on La Coipa completed during Q3 2015• Completed additional exploration work to assess opportunities to extend estimated
mine life beyond 5.5 years contemplated in the PFS results• Phase 7 and Catalina deposits added 1Moz. Au to mineral resource estimates• 2016 plans include additional infill drilling at Catalina, and drilling along 3km prospective
corridor
14

15www.kinross.com
15
KINROSS VALUE PROPOSITIONEXCELLENT OPERATIONAL TRACK RECORD
• Continuing to meet or outperform our operational targets
STRONG BALANCE SHEET
• $1.9B in liquidity with net debt to EBITDA ratio of 1.5x(i)
• Repaid the Kupol loan during Q3, ahead of schedule
ATTRACTIVE FUTURE GROWTH OPPORTUNITIES
• LA COIPA pre-feasibility study generated positive results
• Phased approach to TASIAST expansion offers a financially prudent alternative to realizing significant growth potential
• Mineral reserve conversion and exploration at BALD MOUNTAIN North and South Zones
COMPELLING VALUATION
• Attractive value opportunity relative to peers, considering annual production, cost structure, track record and relatively low-risk growth opportunities
SHARE INFORMATION
K – Toronto Stock Exchange
KGC – New York Stock Exchange
(i) Pro-forma the Nevada acquisition, which closed January 11, 2016.

16www.kinross.com
16FINANCIAL HIGHLIGHTS

17www.kinross.com
17
Q4 & FULL-YEAR 2015
FINANCIAL RESULTSAll figures in US$ millions, except ounces, per share and per ounce amounts Q4 2015 Q4 2014 2015 2014
Attributable gold equivalent ounces (oz.)(1)
Produced 623,716 672,051 2,594,652 2,710,390
Sold 632,411 651,498 2,608,870 2,715,358
Average realized gold price ($/oz.) $1,108 $1,201 $1,159 $1,263
Production cost of sales ($/oz.)(2)
Gold equivalent $688 $714 $696 $720
All-in sustaining cost ($/oz. Au eq.)(3) $991 $1,006 $975 $973
Capital expenditures ($M) $160.7 $189.4 $610.0 $631.8
Revenue $706.2 $791.3 $3,052.2 $3,466.3
Adjusted operating cash flow(5) $203.8 $217.2 $786.6 $1,023.8
per share $0.18 $0.19 $0.69 $0.89
Adjusted net earnings (loss) attributable to common shareholders(5) ($68.8) ($6.0) ($91.0) $131.1
per share $(0.06) ($0.01) ($0.08) $0.11
(1) Refer to endnote #1(2) Refer to endnote #2.
(3) Refer to endnote #3.(5) Refer to endnote #5.

18www.kinross.com
18
Q4 & FULL-YEAR 2015
NON-CASH IMPAIRMENT CHARGE
CASH GENERATING UNIT TOTAL AFTER-TAX IMPAIRMENT (US$M)
Fort Knox $240
Tasiast $147
Round Mountain (50% ownership at Dec.31.15) $43
Inventory and other asset write-downs $260
TOTAL $690
• Recorded after-tax non-cash property, plant & equipment impairment charges of US$430 million
Resulted from lower near and long-term gold price assumptions
• Also recorded inventory and other asset write-downs of US$260 million
Primarily due to a change in accounting estimates for supplies inventory
Write-down of low-grade stockpiles and dump leach inventory at Tasiast and stockpiles at Maricunga
Note: Totals in the table above may not add due to rounding.
19www.kinross.com
19
2016 OUTLOOK
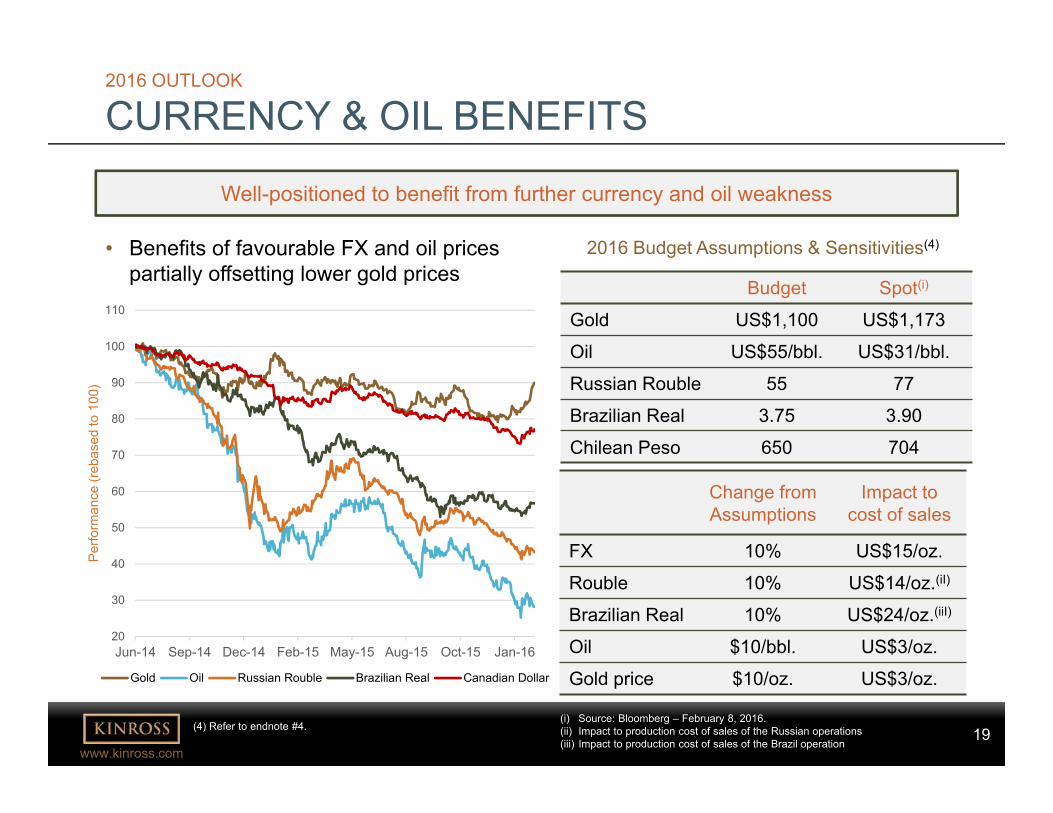
CURRENCY & OIL BENEFITS
Well-positioned to benefit from further currency and oil weakness
Change from Assumptions
Impact to cost of sales
FX 10% US$15/oz.
Rouble 10% US$14/oz.(iI)
Brazilian Real 10% US$24/oz.(iiI)
Oil $10/bbl. US$3/oz.
Gold price $10/oz. US$3/oz.
Budget Spot(i)
Gold US$1,100 US$1,173
Oil US$55/bbl. US$31/bbl.
Russian Rouble 55 77
Brazilian Real 3.75 3.90
Chilean Peso 650 704
2016 Budget Assumptions & Sensitivities(4)• Benefits of favourable FX and oil prices partially offsetting lower gold prices
20
30
40
50
60
70
80
90
100
110
Jun-14 Sep-14 Dec-14 Feb-15 May-15 Aug-15 Oct-15 Jan-16
Per
form
ance
(reb
ased
to 1
00)
Gold Oil Russian Rouble Brazilian Real Canadian Dollar
(i) Source: Bloomberg – February 8, 2016.(ii) Impact to production cost of sales of the Russian operations(iii) Impact to production cost of sales of the Brazil operation
(4) Refer to endnote #4.

20www.kinross.com
20
FINANCIAL DISCIPLINE
FUEL & CURRENCY HEDGES
Managing exposure to fluctuations in foreign currency and input commodity prices
% of 2016 exposure hedged Average Rate
Brazilian real 27% 3.75
Chilean peso 24% 653
Russian rouble - -
Canadian dollar 41% 1.26
Oil & Fuel 26%(ii) (Refer to note i)
(i) Consists of crude oil swap contracts (404,400 barrels at an average rate of $47.55) as at December 31, 2015.(ii) As a result of pre-paid fuel purchases mainly relating to the Company’s Russian operations and fixed pricing in Ghana and Brazil, Kinross’ unhedged, free-
floating oil & fuel exposure for 2016 is ~53% of total consumption
Summary of foreign currency and energy hedges as at December 31, 2015
• Made strategic decision to reduce tenor and amount of oil and currency hedges:
Prefer to be hedged no more than 18 months out
No more than 50% of exposure

21www.kinross.com
21
STRONG BALANCE SHEET
SOLID FINANCIAL POSITION
$0.6
$1.3
Cash & cash equivalents Undrawn credit facilities
PRO-FORMA LIQUIDITY POSITION(i)
Maintaining balance sheet strength & financial flexibility remain priority objectives
MAINTAINING FINANCIAL FLEXIBILITY
• Improved balance sheet during 2015:
Added $60M to cash position, ending the period with over $1.0B in cash and cash equivalents
Repaid $80M of debt
• Only debt maturity prior to 2019 is $250M of senior notes due in September 2016
• Liquidity position remains strong post-Nevada acquisition, with ~$600M in cash & cash equivalents and $1.3B in undrawn credit facilities
$1.9B
(i) Pro-forma the acquisition of the Nevada assets, which closed January 11, 2016.

22www.kinross.com
22OPERATING HIGHLIGHTS

23www.kinross.com
23
2016E GOLD EQUIVALENT PRODUCTION(1,4)
OPERATIONAL EXCELLENCE
DIVERSIFIED PORTFOLIO OF OPERATING MINES
GLOBAL PORTFOLIOOperating mineDevelopment project
Round Mountain
Kettle River-Buckhorn
Fort Knox
La Coipa
Paracatu
Maricunga
KupolDvoinoye
Chirano
Tasiast
AMERICASRUSSIA
WEST AFRICA
(3) Refer to endnote #3.
Over 60% of estimated 2016 gold equivalent production from mines located in the Americas
61%14%
25%
Americas West Africa Russia
2.7-2.9M ounces
(1) Refer to endnote #1.(4) Refer to endnote #4.
Bald Mountain
24www.kinross.com
24
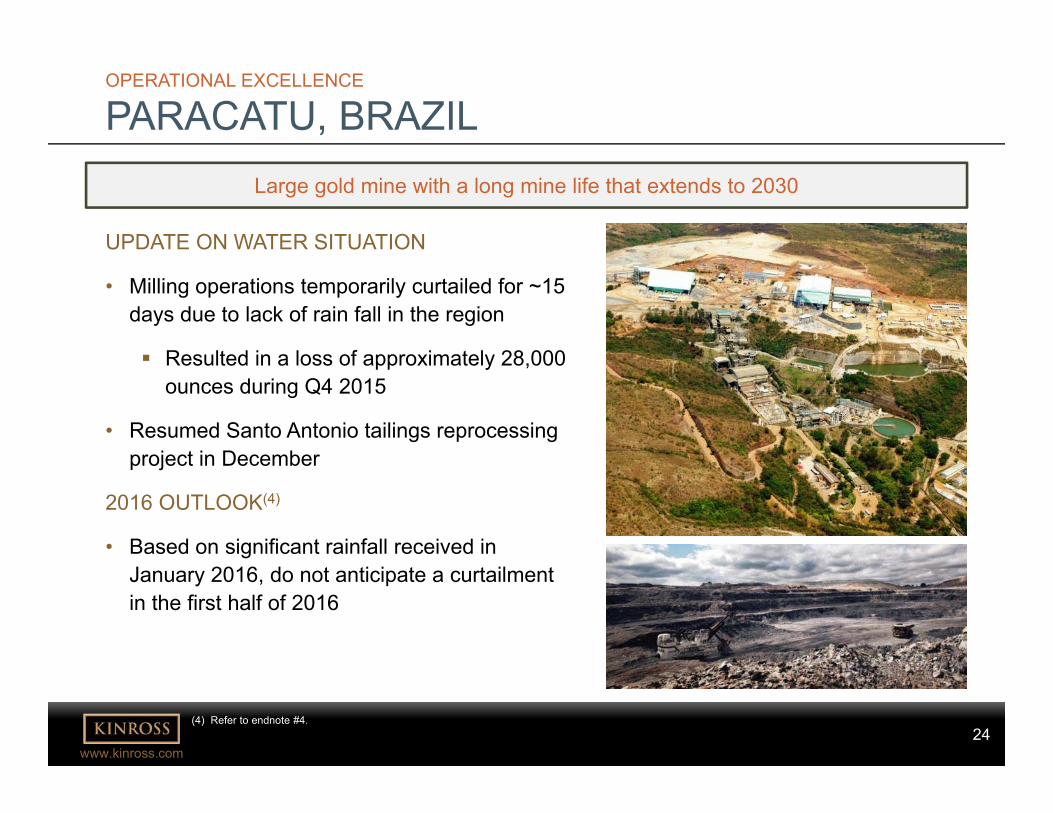
OPERATIONAL EXCELLENCE
PARACATU, BRAZILLarge gold mine with a long mine life that extends to 2030
UPDATE ON WATER SITUATION
• Milling operations temporarily curtailed for ~15 days due to lack of rain fall in the region
Resulted in a loss of approximately 28,000 ounces during Q4 2015
• Resumed Santo Antonio tailings reprocessing project in December
2016 OUTLOOK(4)
• Based on significant rainfall received in January 2016, do not anticipate a curtailment in the first half of 2016
(4) Refer to endnote #4.

25www.kinross.com
25
OPERATIONAL EXCELLENCE
TASIAST, MAURITANIAIn Q4 2015, achieved lowest cost of sales since Q1 2013
COST REDUCTIONS
• Reduced oil and labour costs benefitting operation
Reduced workforce by 240 employees
CONTINUOUS IMPROVEMENT BENEFITS
• Comprehensive review of crushing and grinding circuit to identify opportunities for improvement
• Completed upgrades to the tertiary crushing circuit, secondary crusher and conveyor in November
• Resulted in increased throughput:
Averaged 7,500 tpd in Q4 2015, a 10% increase from Q3 2015 average of 6,800 tpd

26www.kinross.com
26
OPERATIONAL EXCELLENCE
BALD MOUNTAIN, NEVADAQuality producing mine with significant exploration potential
GOOD FIT WITHIN KINROSS’ PORTFOLIO• Open-pit run-of-mine heap leach operation
Opportunity to leverage Kinross’ expertise as a world-class open-pit and heap leach operator
• Large estimated mineral resource base with multiple sources of potential mineral reserve additions
• Excellent exploration potential with known targets and additional brownfield and greenfield opportunities
INTEGRATION PROCEEDING WELL
• New GM transferred from Round Mountain
• Established a new exploration team and commenced drilling
27www.kinross.com
27
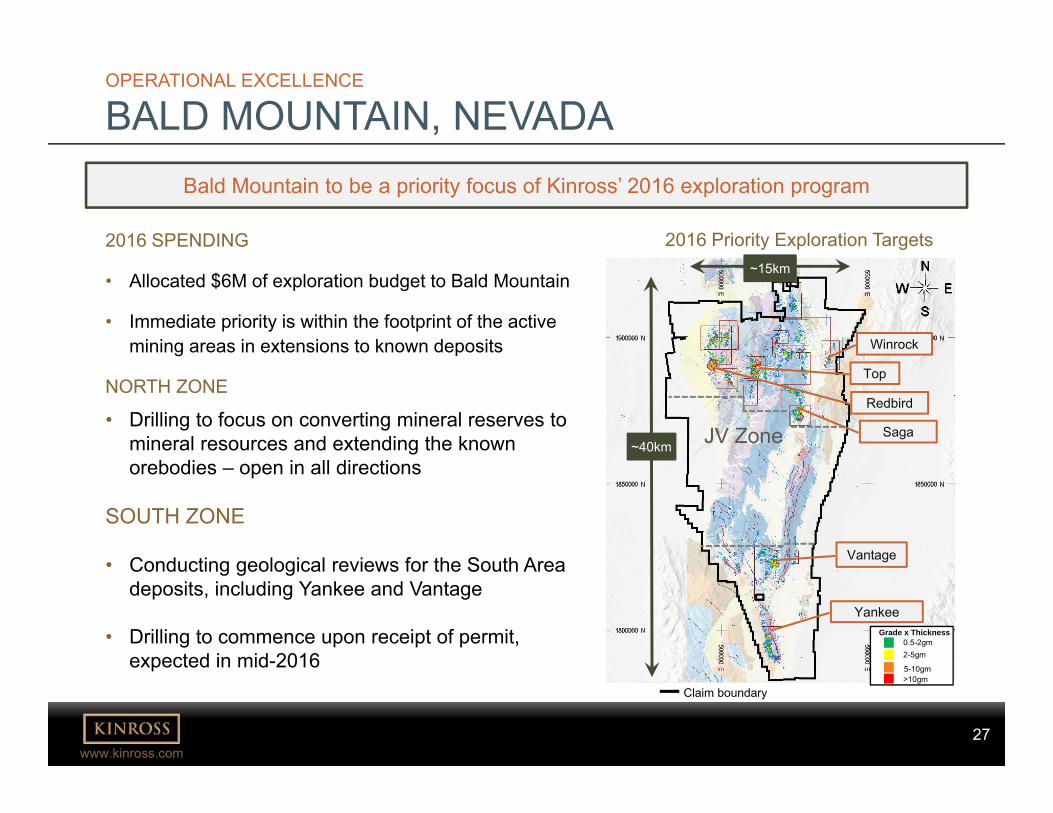
OPERATIONAL EXCELLENCE
BALD MOUNTAIN, NEVADABald Mountain to be a priority focus of Kinross’ 2016 exploration program
2016 SPENDING
• Allocated $6M of exploration budget to Bald Mountain
• Immediate priority is within the footprint of the active mining areas in extensions to known deposits
NORTH ZONE
• Drilling to focus on converting mineral reserves to mineral resources and extending the known orebodies – open in all directions
SOUTH ZONE
• Conducting geological reviews for the South Area deposits, including Yankee and Vantage
• Drilling to commence upon receipt of permit, expected in mid-2016
Claim boundary
~15km
~40km
Winrock
Top
Redbird
Saga
Vantage
Yankee
JV Zone
>10gm
2-5gm0.5-2gm
Grade x Thickness
5-10gm
2016 Priority Exploration Targets

28www.kinross.com
28RESERVE & RESOURCE UPDATE

29www.kinross.com
29
4.0 4.7
2014 2015
Moz
.
INFERRED GOLD RESOURCES
23.128.6
2014 2015
Moz
.
MEASURED & INDICATED GOLD RESOURCES
34.4 34.0
2014 2015
Moz
.
PROVEN & PROBABLE GOLD RESERVES
QUALITY OVER QUANTITY
2015 MINERAL RESERVES AND RESOURCES(6)
2P MINERAL RESERVE ESTIMATES MAINTAINED AT 34Moz.
• Additions largely offset depletion
• Added 1.8Moz. Au through acquisition of Nevada assets
• Net addition of 0.2Moz. at high-grade Chirano mine
• 0.4Moz. added at Kupol, replacing large portion of ounces depleted during 2015
INCREASE OF 5.5Moz. M&I MINERAL RESOURCE ESTIMATES
• 4.2Moz. added through acquisition of Nevada assets
• Exploration success added:
0.9Moz. at La Coipa Phase 7 and Catalina deposits
0.3Moz. at Tamaya, a prospective oxide target locatedon the Tasiast Sud license
(6) Refer to endnote #6.

30www.kinross.com
30
EXPLORATION HIGHLIGHTS
LA COIPA, CHILEEncouraging results along a prospective 3 km trend

31www.kinross.com
31
EXPLORATION HIGHLIGHTS
CHIRANO, GHANAExploration focused on 8 km mine trend to target open-pit and underground extensions
SURAW• Significant gold mineralization was extended 200 m south of the existing M&I mineral resource
estimates and also 300 m down dip• 2015 results demonstrate upside potential of the deposit
AKWAABA• Drilling delineated potential extension of the mineralization ~100 m down dip below current
reserve limits• Planning infill drilling in 2016 to better define the orebody extension and evaluate economic
viability

32www.kinross.com
32
EXPLORATION HIGHLIGHTS
SEPTEMBER NORTH-EAST, RUSSIASEPTEMBER NORTH-EAST
• Defined near-surface, high-grade M&I mineral resource estimate of 68koz. Au grading 32 g/t(6)
• Material being fast-tracked to production, expected in 2017
DVOINOYE ZONE 1
• Located on the current mining lease
• Drilling confirmed continuity and grade of a mineralized vein at the bottom of a historically mined open-pit
• Mineral resource estimate expected in 2016
(6) Refer to endnote #6.

33www.kinross.com
33
TRACK RECORD OVER PAST 4 YEARS
Consecutive years
METguidance targets
10%
DECREASED all-in
sustaining cost
$1.9
$1.3
$0.6 $0.6
2012 2013 2014 2015
MAINTAINED strong balance
sheet
Repaid $700M of
debt
Liquidity position
$1.9 billion
Produced over
10Moz.gold equivalent
LOWEREDannual capex
by $1.3B
34www.kinross.com
34APPENDIX

35www.kinross.com
35
ENDNOTES1) Unless otherwise noted, gold equivalent production, gold equivalent ounces sold and production cost of sales figures
in this presentation are based on Kinross’ 90% share of Chirano production and sales.
2) Attributable production cost of sales per gold equivalent ounce sold and per gold ounce sold on a by-product basis arenon-GAAP measures. For more information and a reconciliation of this non-GAAP measure for the three and twelvemonths ended December 31, 2015 and 2014, please refer to the news release dated February 10, 2016, under theheading “Reconciliation of non-GAAP financial measures”, available on our website at www.kinross.com.
3) All-in sustaining cost is a non-GAAP measure. For more information and a reconciliation of this non-GAAP measurefor the three and twelve months ended December 31, 2015 and 2014, please refer to the news release dated February10, 2016 under the heading “Reconciliation of non-GAAP financial measures”, available on our website atwww.kinross.com.
4) For more information regarding Kinross’ production, cost and capital expenditures outlook for 2016, please refer to thenews release dated February 10, 2016 which is available on our website at www.kinross.com. Kinross’ outlook for2016 represents forward-looking information and users are cautioned that actual results may vary. Please refer to theCautionary Statement on Forward-Looking Information on slide 2 of this presentation and in our news release datedFebruary 10, 2016, available on our website at www.kinross.com.
5) Adjusted net earnings attributable to common shareholders and adjusted operating cash flow numbers are fromcontinuing operations and are non-GAAP financial measures. For more information and a reconciliation of these non-GAAP measures for the three and twelve months ended December 31, 2015 and 2014, please refer to the newsrelease dated February 10, 2016, under the heading “Reconciliation of non-GAAP financial measures”, available onour website at www.kinross.com.
6) For more information regarding Kinross’ 2015 mineral reserve and mineral resource estimates, please refer to ourAnnual Mineral Reserve and Mineral Resource Statement as at December 31, 2015 contained in our news releasedated February 10, 2016, which is available on our website at www.kinross.com.
36www.kinross.com
36
KINROSS GOLD CORPORATION 25 York Street, 17th Floor │Toronto, ON │ M5J 2V5
www.kinross.com