kisii county government...kisii county government ministry of agriculture, livestock, fisheries and...
TRANSCRIPT

Kisii County Government
Ministry of Agriculture, Livestock, Fisheries and
Cooperative Development
Task Force Report on the Coffee Sector
June 2014

ii
Acknowledgement
On behalf of the Members of the Task Force, let me take this opportunity to thank the H.E James
E.O. Ongwae, the Governor of Kisii County and County Minister for Agriculture, Hon. Vincent
Sagwe; first for his timely concern about the challenges facing the coffee sector in Kisii County,
and second, for initiating a process for instituting reforms to improve and enhance the sector‟s
performance. As members of the task force, we feel honored and privileged to have been
entrusted with the task of looking into the various issues and challenges affecting the coffee
sector in order to identify recommendations to spur improvement and safeguard the future
sustainability of sector in the county.
Further, on behalf of the task force members, I wish to extend my sincere gratitude to all the
stakeholders who participated in this process for their contribution and support. The input of
various coffee growers, the coffee societies, Coffee Research Foundation of Kenya (CRFK),
various Government Departments and institutions is gratefully acknowledged. I also wish to
register my appreciation to the Government of Ethiopia and the County Government of Nyeri for
their invaluable input and allowing visitation by members of the task force. This enabled the
taskforce to gather very useful benchmarking facts and information.
I am also indebted to our consultant - Brightpath Consulting Limited; who provided technical
support and assisted us in finalizing the report. The industry insights and expertise of the
consultant were invaluable. In addition, I would like to express our appreciation to His
Excellency, The Governor and the County Government for the provision of secretariat and
logistical support that enabled us to complete the assignment.
Finally, I wish to thank, in a special way, members of the taskforce for their dedication, diligence
and commitment throughout the various stages of the assignment. This task would not have been
completed without your commitment.
Mr. Elijah Mochorwa
Chairman, Coffee Task Force
June 2014

iii
Task Force Members
1) Elijah Momanyi Mochorwa Chairman
2) Vincent M. Kenyariri County Co-operative Commissioner
3) Javan Ngeywo Coffee Board of Kenya
4) Stephen Keuku Chairman, Nyakoe F.C.S
5) David Mose Nyamumbo County Director of Agriculture
6) Richard Getonto Secretary, Coffee Estates
7) Barnabas Oyugi Chairman, Coffee Estates
8) Abel Mainga Gusii Coffee Farmers Co-operative Union
9) Lilian M. Sosi Youth SACCO
10) Julius Maganga Chairman, Nyamonya F.C.S
11) Elijah Nyarumi Representative for the Challenged
12) Vincent Mokua Oigo CEO, Wakenya SACCO
13) Daniel Orina Secretariat
14) Rose. Sereti Secretariat
Consultants
1) Josiah Ateka Brightpath Consulting Limited
2) Forah Obebo Brightpath Consulting Limited

iv
Table of Contents
Acknowledgement ....................................................................................................................................... ii
Table of Contents ........................................................................................................................................ iv
Executive Summary ................................................................................................................................. viii
Chapter 1: Introduction ............................................................................................................................. 1
1.1 Background ............................................................................................................................................. 1
1.2 The Kenyan Coffee sector....................................................................................................................... 2
1.3 Challenges in the Coffee Sector .............................................................................................................. 3
1.4 Coffee Industry Policy Reforms in Kenya .............................................................................................. 4
1.5 Terms of Reference ................................................................................................................................. 6
1.6 Methodology ........................................................................................................................................... 6
1.7 Organization of the Report ...................................................................................................................... 7
Chapter 2: The Coffee Industry Structure ............................................................................................... 8
2.1 Policy, Regulatory and Research Functions............................................................................................ 8
2.2 Production and Trade Functions ........................................................................................................... 10
Chapter 3: Findings of the Task force ................................................................................................... 12
3.1 Nature and Ownership of Gusii Coffee Farmers Co-operative Union (TOR 1) ................................... 12
3.2 Composition of the Co-operative Societies (TOR 2) ............................................................................ 15
3.3 Status of Audited accounts (TOR 3) ..................................................................................................... 17
3.4 Production for all Societies and the Union in the period 2008 – 2013 (TOR 4) ................................... 19
3.5 Schedule of Coffee Payments in the period 2008 – 2013 (TOR 5)....................................................... 23
3.6 Debts owed by Societies and the Union in the period 2008 – 2013...................................................... 27
3.7 Machinery Status and needs for all societies in Kisii County (TOR 7) ................................................ 34
3.8: Relationship between the Union and Wakenya Pamoja Sacco ............................................................ 34
Chapter 4: Summary of key challenges and Benchmarking ................................................................ 35
4.1 Key Challenges facing the sector .................................................................................................... 35
4.2 Benchmarking ....................................................................................................................................... 41
Chapter 5: Recommendations and Strategies for Change .................................................................... 45
6.0 Conclusion ........................................................................................................................................... 51
7.0 References ............................................................................................................................................ 52
8.0 Annex ................................................................................................................................................... 53
Annex 1: Declaration by Task Force Members .......................................................................................... 53
Annex 2: Attached as separate booklet ....................................................................................................... 53

v
List of Tables
Table 1.1: Coffee Production in Kenya.
Table 1.2: Coffee Sector Reforms in Kenya
Table 3.1: Schedule of Land /plots owned by Union
Table 3.2: Schedule of Assets at Simbauti Farm (owned by the union)
Table 3.3: Schedule of Motor Vehicles owned by the Union
Table 3.4: Schedule of Plant and Machinery owned by the Union
Table 3.5: Schedule of Office Equipment owned by the Union
Table 3.6: Schedule of Shares owned by the Union.
Table 3.7 Schedule of Debts owed to the Union
Table 3.8: Liabilities of the Union
Table 3.9: Composition of the Co-operative Societies affiliated to the Union
Table 3.10: Audit Status for Societies
Table 3.11: Coffee production per Society 2008/09-2012/13
Table 3.12: Schedule of coffee payments 2008/09 to 2012/13
Table 3.13: Summary of debt owed by the Union (GCFCU) as per the Union
Table 3.14: Summary of debt owed by the Societies as per the Union
Table 3.15: Summary of loans owed by the Societies
Table 4.1: The Kisii Coffee Sector SWOT Analysis
Table 4.2: Comparative productivity figures by County

vi
List of figures
Figure 1.1: Coffee growing areas in Kenya
Figure 2.1: The Kenyan coffee Value chain actors
Figure 3.1: Area under Coffee in Kenya by County
Figure 3.2: Average annual production by County
Figure 3.3: Combined Five year average annual production for Smallholders
Figure 3.4: Five year annual production by society between 2008/09 to 2012/2013
Figure 3.5: Five year annual production trend by society between 2008/09 to2012/2013
Figure 3:6 Annual total coffee payments in the period 2008/09 -2012/13
Figure 3.7: Five year total payment trend for the societies 2008/09 to 2012/13
Figure 3.8: Five year total payment trend for the societies 2008/09 to 2012/13
Figure 3.9: Five Year Cumulative Debts Owed By Societies by Item
Figure 3.10: Five Year Cumulative Debts Owed By Societies by Percentage

vii
List of Acronyms
CBK Coffee Board of Kenya
CODEF Coffee Development Fund
COTU Central Organisation of Trade Unions
CRFK Coffee Research Foundation of Kenya
GCFCU Gusii Coffee Farmers Co-operative Union
KCTA Kenya Coffee Traders association
KPCU Kenya Planters Coffee Union
MFI Micro Finance Institution
MoIED Ministry of Industrialization and Enterprise Development
N.S.S.F National Social Security Fund
OD Overdraft
SWOT Strengths, Weaknesses, Opportunities and Threats
TOR Terms of Reference
WPM Wakenya Pamoja Sacco

viii
Executive Summary Coffee is undoubtedly one of the most important agricultural commodities in Kenya. As the
fourth largest foreign exchange earner, the coffee sector is important to the national and the
county economy. In Kisii County, the sector is organized into an umbrella Union which manages
22 societies with an estimated membership of about 55,000 farmers. The sector is a source of
livelihood for many people through its linkages in production, processing, milling, marketing
and consumption.
Over the years the sector has been facing various farm level, production, processing and
marketing challenges. To address these problems, a number of reforms have been undertaken in
the last two decades to try and improve the sector. Some of the major reforms included;
liberalization in production and marketing, removal of licenses and controls in production and
minimization of government involvement in the coffee industry. Even with these reforms, the
coffee sector continues to be under great stress and most of the anticipated gains from reforms
have not been realized. The implementation of the new constitution to devolve key functions
means that the coffee sector now falls entirely under county government. With this view, the
county government must enact legislation and policies geared towards revamping the sector.
It is against this background that the county government appointed a task force to investigate the
problems that beset the sector and make appropriate recommendations. To deliver on its
assignment, the task force adopted various approaches to gather information. These included;
bench marking visits by members of the task force to regions/countries with similar industry
structures; discussions with relevant industry stakeholders; literature review and written
submissions from stakeholders.
A summary of the major concerns and recommendations are as follows:
a) Farm Level
The key concerns include: poor delivery of extension services; poor adoption of improved
technologies; weaknesses in grower education; low farm productivity; over-reliance in
inorganic fertilizers; delays in payments; rising cost of production and price fluctuations.

ix
The recommendations to address these concerns include:
The county government to second a unit of extension services to address the unique and
specific grower education needs in the sector; the county government to identify specific
farm level interventions to support farmers in adoption of technologies; the county
government to enact legislation to guide payments to the farmers for coffee deliveries.
b) Production and Processing
The key concerns include: Capacity bottlenecks due to old, obsolete and inappropriate
processing machinery; lack of standardized production procedures and manuals to guide
processing and quality control at the various processing levels; uneconomical production
units i.e. factory and societies.
The recommendations to address these concerns include:
The county government to conduct an audit and needs assessment of machinery of all the
union and all societies; the county government to assist the union in the establishment of a
modern model coffee processing factory to act as bench mark to the others; the county
government to support a factory modernization program to address capacity needs and
bottlenecks; the union with the support of the county government to develop standard
production procedure manuals to guide processing and quality control at the various
processing levels.
c) Policy and Regulatory framework
The key concerns include; poor relationship among stakeholders; lack of clarity of roles
among stakeholders; weak regulatory framework and monitoring especially in curbing illegal
trade and coffee theft; weak mechanism for on-going monitoring of performance at the
various levels in the coffee value chain; too many actors in the coffee sector whose margins
result in the loss of value to the growers
The recommendations to address these concerns include:
The county government to enact legislation on the roles and functions of the stakeholders in
the sector and establish a clear industry structure that eliminates the role of middlemen. The
county government to establish a security system to address coffee thefts and security of
coffee factories and its assets and a mechanism for monitoring of performance

x
d) Management of Asset and Liabilities
The key concerns include; Presence of a large pool of assets that are not profitable and are
not aligned with the strategic direction of the sector. ; irregular disposal of the union`s assets;
lack of clear guidelines and criteria for asset management, acquisition and disposal; too many
unsustainable and non-performing debts; lack of a policy framework to guide borrowing of
loans by the union and the societies.
The recommendations to address these concerns include:
The county government to develop clear guidelines and criteria for asset management,
acquisition and disposal; disposal of the loss making and non-core assets; the county
government to initiate forensic investigation on all loans and debts to establish their
credibility and authentication; the county government to establish a mechanism for
settlement of the outstanding debts for the union and societies.
e) Governance Challenges
The key concerns include: inappropriate governance structure due lack of clarity of roles and
functions of the union board and management; inappropriate guidelines to govern
composition and eligibility of stakeholders in the union board; weaknesses in the staff
compliment and human resource capacity.
The recommendations to address these concerns include:
The union to be restructured to respond to the current needs of the sector and inculcate
professionalism and efficiency in its operations; The county government to second key
technical/management staff to the union to establish internal structures for the union in the
medium term; the county government to enact legislation to govern the composition and
eligibility of stakeholders in the union board ; The process of corporate governance
restructuring to be in line with Chapter 6 of the new constitution to ensure that election or
appointment of officers representing any interests in the sector will be officers with high
integrity and competent skills.

xi
f) Financial management and controls
The key concerns identified include: lack of clear policies, procedure manuals to guide
financial management, and accounting; poor book keeping of accounting records; poor
monitoring and enforcement of audit; non-issuance of payslips and statements to farmers.
The recommendations to address these concerns include
The county government to assist the union to develop policies and procedures manuals to
guide financial management and accounting; the county government to assist the union in the
establishment of clear management and information systems for its operations; The county
government to enforce immediate compliance of the audit requirements; the county
government to establish a mechanism for monitoring the implementation of audit reports; the
county government to enact legislations to guide borrowing and debt management in the
sector; the county government to enact legislation and stringent by-laws for deterrence and
minimization of financial mismanagement and corruption; Prosecution of all persons
implicated in any corruption dealings and economic crimes and these people must be barred
from holding any office in line with chapter six of the constitution. All those who have
embezzled funds must repay
g) Value Addition and Branding
The key concerns include: Limited value addition of coffee; lack of brand identity; lack of a
niche market; lack of clear policy framework to support value addition; unco-ordinated
milling and marketing where some societies avoid milling and marketing through their union.
This is a major anomaly and that is the conduit for stealing farmers‟ proceeds through
various advances from millers and marketers.
The recommendations to address these concerns include
The county government to commission a feasibility study to establish an optimal value
addition model for the sector; the union together with county government to pursue branding
and establishment of niche markets; The union to provide land for the establishment of an
ultra-modern coffee house and mall; Funds or proceeds from sale of non-core assets to fund
value addition; the county government to pursue private – public partnerships approaches in
the sector; the county government to legislate laws to facilitate central milling and marketing
of coffee from the county and develop a structured and guaranteed system of payments to the
farmers and other stakeholders in the value chain.

xii
Other recommendations include:
i) The county government to establish a mechanism of streamlining Wakenya Pamoja
Sacco with a view to putting it on a growth path of making it a full – fledged bank;
ii) The county government to assist the union in establishing full computerization of the
operations and activities across the value chain
iii) The county government should facilitate capacity building of the stakeholders
especially the staff and management committees of the societies
It is hoped that implementation of this report will revitalize the sector for the benefit of the
farmers and other stakeholders. Towards this end the county government should establish an
implementation framework for this report. In implementing the report the county government
should explore opportunities for collaboration with the neighbouring counties

1
Chapter 1: Introduction
1.1 Background
Coffee is one of the most traded commodities in the world with an estimated value of over 80
billion US Dollars annually. Globally, the five leading coffee producers are: Brazil, Vietnam
Colombia, Indonesia, and India in that order. Ethiopia which is considered the birthplace of
coffee, is the leading producer in Africa and it`s the 7th largest coffee producer in the world. The
other leading producers are Rwanda, Uganda, Ivory Coast, Tanzania and Kenya. According to
ICO (2010), Kenya is the 21st largest producer of coffee in the world, producing over 50 million
kilograms annually.
Despite the proximity of Kenya to Ethiopia which is widely believed to be the region from which
coffee originated, coffee was not cultivated in Kenya until 1893, when missionaries imported
coffee trees from Brazil (Gathura, 2013). Today, an estimated 170,000 Ha of arable land in
Kenya spread across the various coffee growing regions in the country (see fig 1.1).
Source: David, 2001
Figure 1.1: Coffee growing areas in Kenya

2
1.2 The Kenyan Coffee sector
The coffee sector in Kenya is one of the important economic agricultural activities in terms of
income generation, employment creation, foreign exchange earnings and tax revenue. The sector
is the fourth largest foreign exchange earner after tea, tourism and horticulture. According to the
Kenya Economic Survey (2013) coffee exports account for approximately five percent of all
exports from Kenya. In addition, the coffee industry, due to its forward and backward linkages,
directly and indirectly benefits about six million people in the country.
In terms of production, Kenya grows mainly the Arabica variety. The predominant commercial
cultivars are the SL28, SL34, K7 and Ruiru ll. Pockets of the Blue mountain and French mission
however still exists in the older establishments. A new variety, Batian, that was released by the
Coffee Research Foundation of Kenya (CRFK) in 2011 is also being promoted.
Kenya‟s coffee is characterized by a dual production system comprising of co-operative
societies, which service most of the small-scale farmers and the large-scale coffee estates. The
cooperative societies process their coffee through their factories, serve as the custodians of the
coffee for their members and are supposed to benefit individual members through economies of
scale. Each cooperative owns and manages one or more wet-processing factories.
According to the CBK, estimates there are currently over 700,000 small holders who produce on
individual plots of less than 2 hectares and market their coffee through 450 active Co-operative
Societies. Within the large scale sub sector, there are 3,300 small to medium estates with farm
sizes ranging from 5 to 10 hectares and about 100 large estates with sizes of between 10 hectares
and over 200 acres
On average, smallholders (co-operatives) produce about 56% of Kenya‟s coffee while 44% of
the production is under the estates sub-sector. This is a shift from a decade ago when
smallholders were producing about 66% of the total production (see table 1.1).

3
Table 1.1: Coffee Production in Kenya
Year
Estates production
(metric tons)
smallholders
production (metric
tons)
total (Metric
ton) Hectares
Productivity
(kgs/ha)
2003/2004 18,473.0 29,958.0 48,431.0 170,000.0
284.89
2004/2005 20,745.0 24,500.0 45,245.0 170,000.0
266.15
2005/2006 21,975.0 26,860.0 48,835.0 170,000.0
287.26
2006/2007 23,850.0 29,150.0 53,000.0 170,000.0
311.76
2007/2008 18,900.0 23,100.0 42,000.0 170,000.0
247.06
2008/2009 25,650.0 32,350.0 58,000.0 170,000.0
341.18
Source: CBK statistics (Various)
1.3 Challenges in the Coffee Sector
In spite of its importance, the coffee industry in Kenya has been facing several production,
processing and marketing challenges over the last two decades. The challenges include;
Poor adoption of production technologies, low farm productivity and low farm level
earnings
Incessant conflicts within co-operative societies and governance challenges.
The intricate relationship between the various stakeholders has led to conflicts and
controversies that have added to the problem of decreasing coffee production.
Specifically, the balancing of the interests of the cooperatives, the regulator and the
millers has been less than harmonious.
Declining land holding sizes, aging coffee plants and competition with other agricultural
enterprises.
Poor post-harvest handling; there is limited capacity by the handlers of the processing
equipment and procedures leading to loss of quality at the various processing levels.
Rising cost of production (COP) while the prices in the world market have continued to
fluctuate and mostly are on the declining trend. The gains that were anticipated as a result
of enhanced competition following liberalization have not been realized.
Governance problems that have led to an increase in mismanagement of coffee co-
operatives. Corruption, lack of financial accountability and transparency are some of the
mismanagement issues that cut across most institutions in the coffee industry.
Delays in payments to growers and the politicization of co-operatives has led to splits that
continue to erode their economies of scale.

4
1.4 Coffee Industry Policy Reforms in Kenya
To address the above challenges, a number of policy reforms have been made in the coffee
industry. Table 1.2 below summarizes the key reforms have been undertaken in Kenya‟s coffee
sector since early 1990s.
Table 1.2: Coffee Sector Reforms in Kenya
Period Reform
1992 In October 1992 CBK was mandated to conduct the Nairobi coffee auction in US
dollars. Gradually permission was given for coffee farmers to be paid in dollars and
they were also allowed to retain dollars for their own use.
1993 A direct payment system was also introduced to reduce the delays in payments that
characterized the old pool system. Three commercial millers were licensed in 1993
thereby breaking the monopoly held by Kenya Planters Cooperative Union (KPCU)
1996 The minimum acreage required for a farmer to be licensed as a coffee planter was
reduced from 10 to 5 acres to improve production.
1998 The government removed its tight control over the way co-operatives operate when a
new Co-operative Act was enacted. The government has retained a minimal regulatory
role in the co-operatives while encouraging members of the societies to run them as
economic units.
2002 In order to harmonize the policy reforms already implemented and to complete
institutional and legal reforms, a new coffee Act came into force in April 2002. The
salient features of new Act included;
Separation of the roles of regulation and marketing with CBK role confined to
regulation
Removal of old draconian rules on coffee uprooting, planting and
intercropping, Limitation of deductions to cater for CBK and CRFK expenses
to 3% of gross proceeds, allowing private sector players to offer extension and
advisory services.
However even under the new Act farmers were not allowed to trade in cherry
at the farm gate level and all coffee sold in Kenya had to pass through a
central auction.
2006 Full liberalization, the marketing of coffee by removing the involvement of the

5
Coffee Board of Kenya in marketing.
Introduction of direct sales to allow farmers to negotiate their prices directly with
the consumers.
Establishment of the Coffee Development Fund (CODEF) so that farmers can
access credit.
To further remove the financial burden to farmers, the Government waived and
took over loans to farmers worth about 6 billion shillings in the period 2008 -
2012.
2012 The devolution of the agriculture function where the coffee sector falls.
The implication is that the responsibility for management of the coffee sector falls
entirely with the county government.
2013 The enactment of the Agricultural Food and Fisheries Act no 13 of 2013. The
purpose of the reform was to consolidate the numerous pieces of legislations
within the agriculture sector to address overlap of functions.
This reform has led to restructuring of the CBK which has now been merged
under the Agricultural Food and Fisheries Authority.
Source: Author`s compilation from various sources.
The emerging policy and institutional framework impacted both positively and negatively on
smallholder farmers‟ welfare. On the positive side, the reforms have reduced the government
involvement in coffee matters while encouraging farmers and private sector participation. On the
negative note, a number of issues are still outstanding, despite the above reforms.
Coffee production is currently faced with a number of production, processing, marketing and
governance challenges that must be addressed and managed for increased productivity and
farmer returns. It is against this backdrop and in light of the rising stakeholder expectations
following inauguration of the county government that the Minister for Agriculture, appointed a
task force to investigate the problems that beset the sector and make appropriate
recommendations. The appointment of the task force was also informed by concerns about the
future sustainability of the sector in view of a changing environment characterized by new
challenges such as climate change, the rising cost of inputs, a diminishing resource base (farm
size), and risk management problems. The terms of reference of the task force are listed in
section 1.5 below.
6
1.5 Terms of Reference
1. To determine the Nature and Ownership of Gusii Coffee Farmers Co-operative Union
(GCFCU) in terms of its assets and liabilities.
2. To determine the composition of co-operative societies affiliated to the union in terms of
names, status (active or inactive), number and names of factories, number of growers and
number of trees as per the last census done
3. To determine the status of audited accounts for the union, all affiliated societies and non
– affiliated societies in Kisii County
4. Production for all Societies and the Union in the period 2008 – 2013
5. Schedule of Coffee Payments in the period 2008 – 2013
6. Debts owed by Societies and the Union in the period 2008 – 2013; the nature, source,
purpose and mode of payment
7. Machinery status and needs for all societies in Kisii County
8. Challenges facing the Union, Societies and Farmers in Kisii County
9. The role of Coffee Research Foundation in Kisii County
10. The Role of Coffee Board of Kenya in Kisii County
11. Relationship between the Union and Wakenya Pamoja Sacco
12. Recommendations
1.6 Methodology
To deliver on its assignment, the taskforce adopted various approaches to gather information.
These included;
Meeting and discussions with relevant industry stakeholders.
Visits to local co-operative societies, private estates and the union.
Consultative meetings with the county government and members of the county assembly.
Request for written submissions from some industry stakeholders.
Benchmarking visits by members of the task force to regions/countries with similar
industry structures.
Reference to secondary data sources including published reports and industry websites.
The information gathered from the above sources was then discussed and reviewed
consultatively among the taskforce members and other stakeholders before the report was
compiled.

7
1.7 Organization of the Report
This report is organized in five chapters. Chapter one details the background information, and
highlights the need for the formation of the taskforce. Chapter two characterizes the structure of
the coffee sector in Kenya and discusses the role of some of the key stakeholders; specifically the
CBK and CRFK.
This is followed by chapter three, which presents the task force findings based on the terms of
reference. Chapter four provides a summary of the key challenges in the sector and also looks at
benchmarking and any cross cutting issues. The report then concludes with chapter five which
discusses the recommendations and strategies for change in the sector.

8
Chapter 2: The Coffee Industry Structure
The coffee industry in Kenya operates under the coffee Act (Cap 333) and the Agricultural Act
(Cap 318) of laws of Kenya and is structured into policy, regulatory, research, production and
trade functions.
2.1 Policy, Regulatory and Research Functions
The policy, regulatory and research functions in the coffee industry falls under the Ministry of
Agriculture, which, with the assistance of the agencies under it, formulates laws and policies to
regulate the coffee sector.
a) The Coffee Board of Kenya ( TOR 10)
The role of the CBK as stipulated in the act is to;
Formulate policies and rules to regulate and develop the coffee industry in consultation with
the Ministry of Agriculture.
Carry out registration and licensing of coffee nurseries, growers, pulping stations, millers,
marketing agents, management agents, buyers, roasters, packers, warehousemen and
auctioneers to ensure adherence to standards.
Provide advisory services related to coffee production and quality enhancement.
Collect, collate, analyze data, maintain a database on the coffee industry and document and
monitor it through registration of any persons dealing with coffee.
Represent the government in international fora in regard to coffee matters.
Arbitrate in case of any disputes in the industry.
Encourage environmentally friendly, ethical and hygienic coffee production, processing and
marketing practices, in order to enhance quality of coffee and sustainability.
Identify, develop and promote new and emerging domestic and global markets
In the past, the mandate of CBK laid a lot of emphasis on regulating production and processing
and marketing. However following amendments of the Coffee Act, its mandate for marketing of
coffee has been removed.

9
2.1.1 Key Observations
In the case of Kisii County the stakeholders have raised their concerns regarding the role of the
CBK in curbing illegal trade and coffee theft. Further, they have expressed concerns relating to
the following;
Weaknesses in grower education
Lack of price advisory information to the growers
Lack of timely dissemination of the of policy changes affecting the sector.
b) The Coffee Research Foundation of Kenya (TOR 9)
The principal function of the Foundation is to carry out research into and investigate all issues
relating to coffee and other agricultural and commercial systems associated with coffee. Other
services provided to the coffee growers include soil and leaf analysis, coffee planting materials,
pesticides analysis and field advisory training of coffee farmers. In order to discharge its
mandate, the Foundation has established research stations across the country. The substations are
located at Mariene (Meru), Kisii, Namwela, Kitale and Koru (Kipkelion).
The activities of Coffee Research Foundation are funded mainly through a levy on coffee sales.
However, in most of the years, funds from the levy have not adequately covered the
Foundation‟s budget.
The Coffee Research Foundation is credited with some achievements which have contributed
significantly to the growth and development of the coffee industry in the country. Some of these
achievements include selection of high yielding, high quality Arabica coffee varieties, such as,
SL28, SL34, K7 and the disease resistant hybrid variety Ruiru II and Batian
Despite some of these achievements, a key concern by stakeholders is that the CRFK activities
have been heavily skewed towards improving farm production and coffee yields with little focus
on coffee value addition. The view of the stakeholders is that the CRFK focus should be
redirected to assist the industry enhance coffee value addition through research focused on
consumers which then could inform the coffee blenders and packers in formulating brands. The
stakeholders also feel that they are not benefiting from the proximity of the local CRFK station
with regard to farmer advisory services and establishment of coffee nurseries.

10
2.2 Production and Trade Functions
The Coffee value chain is characterised by the presence of many players. The key actors, their
interaction and their relationship within the Kenyan coffee industry are illustrated in Figure 2.1
below.
Source: USAID (2010)
Figure 2.1: The Kenyan coffee value chain actors
The main actors include;
Producers: Production is constituted by 700,000 small holder farmers who produce
about 28,000 metric tons and are organised into 450 co-op societies; The small and
medium estates farmers are over 3,300 and own 5 to 10 acres while the large scale
farmers/estates are over 100 and own farms of 10 acres and above.
Wet Millers: There are over 4,000 wet processing plants. Smallholders deliver harvested
cherries to a co-operative society‟s processing factory, where it is pulped, washed and
dried.
Dry Millers: There are a number of dry millers and they include; KPCU, Socfinaf, Thika
Coffee Mill, Sasini, Central Kenya Coffee Mills, Gusii Coffee Mills and Hema Millers.

11
Millers process parchment and `mbuni` into seven official grades based on bean size and
bean density, ready for auctioning.
Marketing Agents: The marketing agents are responsible for: ensuring presentation of
coffee in the auction, preparation of the auction catalogue, setting of reserve prices,
selection of an auctioneer. There are eight marketing agents and they include; Coffee
management services, Eaagads, Tropical Farm Management, Sasini, KCCE, Sustainable
Management services, Nyambene and KPCU.
Auction System: This has been the traditional method of marketing Kenya coffee. There
are over 90 registered coffee exporters who bid for coffee at the auction in Nairobi.
2.3 The key Observations
i) There are too many actors in the coffee sector whose margins result in the loss of value to
the grower.
ii) There is no marketing agent for the coffee from county.
iii) The role of GCFCU as a marketing agent is dormant.
iv) The second window that allows for direct sales has not been utilised.

12
Chapter 3: Findings of the Task force
This chapter discusses the findings of the task force for each of the items in the terms of
references.
3.1 Nature and Ownership of Gusii Coffee Farmers Co-operative Union (TOR 1)
The Gusii Coffee Farmers Co-operative Union is a Kenyan Co-operative union representing
approximately 75,000 coffee growers who are organized into 27 cooperatives societies in Kisii
and Nyamira Counties. The societies that are affiliated to the union are listed in table 3.9.The
main functions of the union include:
Maintaining books of account for the societies.
Coordinating transport and logistics for the societies.
Coffee milling – In July 2011, the union operationalized a new coffee mill with the
objective of reducing wastage, transportation and warehousing costs.
Maintaining and servicing of coffee machinery for the societies.
Establishing of coffee nurseries.
Conducting educational meetings for the farmers and society officials.
The task force established that the union and the societies have the following assets and
liabilities as per the schedules provided.
3.1.1 Assets Owned by the Union
a) Table 3.1 : Schedule of Land /plots owned by Union
Asset Description Asset No Land rates
outstanding
Remarks
1 14 acres Houses Union main
office and Coffee
mill at Mwembe
Block 245 Kshs 62,300 Formerly 16 acres
One acre given to Wakenya
Pamoja Sacco
One acre sold to finance a coffee
mill
2 acres) Houses Getembe
bookshop
Block II/88 Kshs 37,206 Lease expired in 1973
3 (acres) Masaba Building Block III/130 Kshs 39,916 Lease expired 1986
4 (acres) Next to Masaba
General stores
Block III/131 Kshs 32,852 Lease expired 1986
5 (acres) Property at
industrial area
Block III/23 Kshs 41,505 Occupied by a church paying
50,000 per month.
Lease expired 1989
6 (acres) Property at
industrial area
Block III/21 Kshs 20,506 Lease expired 1997
Undeveloped with coffee
Source: GCFCU

13
b) Table 3.2: Schedule of Assets at Simbauti Farm (owned by the union)
Asset Description Status
Total Land 400 acres Original acreage 1,130 acres
400 acres remaining as per
the search from lands
Houses all the operations in
the farm
Operations in the Farm
a Coffee plantation 10 acres Operational
b Tea Plantation 158 acres Operational
c Banana plantation 10 acres Operational
d Offices and staff houses 2 permanent staff houses
One semi-permanent house
and 6 temporary houses
Rented out
e Buildings 2 permanent , one
incomplete
50 number temporary
houses
Operational
f Dairy (cattle) 26 number Operational
g Goats 51 number Operational
Source: GCFCU
c) Table 3.3: Schedule of Motor Vehicles owned by the Union
Asset Description Status and remarks
1 Mitsubishi Lorry KAL 241G Operational
2 Mitsubishi Lorry KAL 570S Operational
3 Mitsubishi Lorry KBR 244P Purchased at Kshs 10,224,280 in 2010
Mitsubishi Lorry KAL 241G Operational
4 Tractor KYY 734 Operational
5 Tractor KAK 750D Operational
Source: GCFCU
d) Table 3.4: Schedule of Plant and Machinery Owned by the Union
Asset Description Status and remarks
1 Coffee Milling machine Capacity - 1.2
tonnes per hour
Purchased at Kshs 17, 150,000 in
2011
2 Maize Sheller Located at Simbauti farm
3 Water Pump
4 Weighing scales
Source: GCFCU

14
e) Table 3.5: Schedule of Office Equipment owned by the Union
Asset Description
1 Computers 6 Number
2 Printers 2 Number
3 Photocopier 1 Number
4 Furniture Various
5 Mower and loose tools Various
Source: GCFCU
f) Table 3.6: Schedule of Shares owned by the Union
Asset Value in Kshs
1 Co-operative Bank 900,400
2 KPCU 140,979
3 CIC 134,160
4 CODIC 30,000
TOTAL
1,205,539
Source: GCFCU
g) Table 3.7 Schedule of Debts owed to the Union
Asset Value in Kshs
1 Members 37,201,141
2 Non- Members 1,395,013
3 Rent due from tenants 2,254,266
TOTAL 40,850,420
Source: GCFCU
3.1.2 Liabilities of the Union
Table 3.8: Liabilities of the Union
Liability Value in Kshs
1 Share Capital 6,223,614
2 Capital Reserves 185,475,556
3 Statutory Reserves 8,379,745
4 General Reserves 114,618,417
5 Appropriation Account 42,939,627
6 Deferred Tax Liability 188,694
7 Creditors 17,093,256
8 Legal fees –Nyatundo & Co. advocates 2,750,559
9 Legal fees –Ogamba and Co advocates 1,635,922
10 KRA 2,940,907
TOTAL LIABILITIES 382,246,297
Source: GCFCU

15
3.1.3 Key Observations
i) All the leases of the union are expired
ii) There are many unsustainable debts owed to and by the Union
iii) There is no mention of storage or warehousing facilities which points to capacity issues
in handling coffee storage.
iv) There is no valuation to ascertain the true value of the assets.
v) There is no asset register to back the records obtained from the Union.
vi) There is non-optimal utilization of Simbaut farm.
3.2 Composition of the Co-operative Societies (TOR 2)
The TOR was to determine the co-operative societies affiliated to the union in terms of names,
status (active or inactive), number and names of factories, number of growers, trees as per the
last census done. The findings are as tabulated in table 3.9 below.
Table 3.9: Composition of the Co-operative Societies affiliated to the Union
S/No Name of
Society
Annual
Production
(Kgs)
Area
(Ha)
Active
members
No of
factories
Name Of
Factory
Status
A – Active
X – Inactive
1 Kenyenya 92711 421 5498 5
Main A
Nyabioto A
Omogumo A
Eburi A
Borabu A
2 Gesarara1 1387 447 2526 4 Main A
Getwanyansi A
Rianyambaka A
Bochura A
3 Marani 59382 383 3400 4 Main A
Nyabonge A
Nyanchogu A
Rigoma A
4 Nyamache 94871 371 3434 1 Main A
5
Nyaigwa
38690
175
2639
4
Main A
Ekerubo A
1 not affiliated

16
Megogo A
Mwancha A
6
Kiomooncha
24497
135
3320
4
Main A
Sieka A
Nyagoto A
Nyamagoma A
7
Nyaguta
28334
113
2000
2
Main A
Nyaboterere A
8
Nyambunde
31902
151
2201
2
Main A
Kionyo A
9
Kenyoro
37415
263
5200
4
Main A
Gesuguri A
Nyamagundo A
Gesebe A
10
Gakero
13959
203
4037
3
Main A
Itabago A
Kebege A
11
Magena
2
Main A
Nyamonyo A
12
Mogonga
45677
376
2200
2
Main A
Enkurongo A
13
Nyamosongo
14740
78
996
2
Main A
Nyamokenye A
14
Riasuta
16027
165
1350
3
Main A
Orienyo A
Nyagetonkono A
15
Nyamonya
16214
90
3000
3
Main A
Nyagancha A
Motonto A
16
Nyamarambe
33518
289
2201
3
Main A
Mosache X
Nyakorere A
17 Nyaturubo 18240 82 2594 1 Main A
18
Nyakoe
17179
77
622
2
Kiogo A
Ngege A
19 Nyosia 5714 117 650 1 Main A
20
Mobamba
7035
48
2270
3
Main A
Masongo A
Mosasa A
21
Iyabe
1706
226
1500
2
Main A
Kebacha
22
Nyachenge
6639
21
4009
2
Main A
Iringa A
Source: GCFCU

17
3.2.1 Key Observations
i) Although most of the factories owned by the societies are active, there are concerns about
their capacity and the fact some of machinery is old and leading to loss of quality at
processing.
ii) There is also possibility of capacity mismatches which impact negatively on the ability of
the societies to enjoy economies of scale leading to high cost structures.
3.3 Status of Audited accounts (TOR 3)
The TOR was to determine the status of audited accounts for the union, all affiliated societies
and non –affiliated societies in Kisii County. The Gusii Coffee Farmers Co-operative union is
responsible for ensuring that all the accounts of the union have been audited. Both the private
and government audit agencies are eligible for auditing the financial records. Note that the
GCFCU was last audited in the period 2011/2012.
3.3.1 Audit Status per Society
The following table 3.10 shows the last audit period for each of the societies
Table 3.10: Audit Status for Societies
S/No Name of Society Last Period of Audit Remarks
1 Kenyenya 2011/12 Compliant
2 Gesarara 2011/12 Compliant
3 Marani 2010/11 Compliant
4 Nyamache 2010/11 Compliant
5 Nyaigwa 2011/12 Compliant
6 Kiomooncha 2009/10 Overdue
7 Nyaguta 2011/12 Compliant
8 Nyambunde 2010/11 Overdue
9 Kenyoro 2010/11 Overdue
10 Gakero 2010/11 Overdue
11 Magena* - Started operation in 2011/12
12 Mogonga 2010/11 Overdue
13 Nyamosongo 2011/12 Compliant
14 Riasuta 2008/09 Long overdue
15 Nyamonya 2011/12 Compliant
16 Nyamarambe 2006/07 Long overdue

18
17 Nyaturubo 2011/12 Compliant
18 Nyakoe 2004/05 Long overdue
19 Nyosia 2010/11 Overdue
20 Mobamba 2001/01 Long overdue
21 Iyabe 2011/12 Compliant
22 Nyachenge 1992/93 Long overdue
Source: GCFCU
3.3.2: Key Observations of Status of audit
i) Eight out of 22 societies had up to date audited accounts up to the year 2011/2012
namely: Kenyenya, Gesarara, Nyaigwa, Nyaguta, Nyamosongo, Nyamonya,
Nyaturubo, and Iyabe. The due period for audit is 2012/2013 meaning that they were
up to date at the time of collecting data by the task office.
ii) Seven societies were audited in 2010/2011 namely: Marani, Nyamache, Nyambunde,
Kenyoro, Gakero, Mogonga and Nyosia. These societies have not been audited for
last two years namely 2011/12 and 2012/13.
iii) Six societies have not been audited for a substantial period of time. They are
Nyachenge (1992/93), Mobamba (2001/01), Nyakoe (2004/05) Nyamarambe
(2006/07), Riasuta (2008/09), Kiomooncha (2009/10).
iv) The findings on the status on the audit, points to weaknesses in monitoring and
enforcement of the audit function. The task force could not verify the extent of
implementation of the audit findings nor verify the quality of the audits.

19
3.4 Production for all Societies and the Union in the period 2008 – 2013 (TOR 4)
The total production (kgs) of all the societies for the period 2008 – 2013 is shown in table 3.11
Table 3.11: Coffee production per Society 2008/09-2012/13
YEARS
S/No
Name of
Society 2008/09 2009/10 2010/11 2011/12 2012/13 Total
Average
Per
Society
1 Kenyenya 948,219.0 556,265.0 806,047.0 1,437,311.0 1,279,797.0 5,027,639.0 1,005,527.8
2 Gesarara 702,789.0 377,478.0 520,272.0 770,030.0 844,332.0 3,214,901.0 642,980.2
3 Marani 270,682.0 356,294.0 473,974.0 622,789.0 656,649.0 2,380,388.0 476,077.6
4 Nyamache 427,914.0 335,996.0 419,034.0 579,286.0 520,591.0 2,282,821.0 456,564.2
5 Nyaigwa 343,702.0 232,137.0 611,196.0 392,792.0 513,343.0 2,093,170.0 418,634.0
6
Kiomooncha 510,802.0 211,484.0 430,046.0 357,324.0 384,325.0 1,893,981.0 378,796.2
7 Nyaguta 328,223.0 170,002.0 272,371.0 315,892.0 320,221.0 1,406,709.0 281,341.8
8 Nyambunde 311,458.0 176,790.0 229,207.0 263,705.0 234,541.0 1,215,701.0 243,140.2
9 Kenyoro 238,995.0 130,525.0 207,611.0 132,081.0 292,383.0 1,001,595.0 200,319.0
10 Gakero 211,328.0 63,570.0 126,945.0 199,602.0 341,329.0 942,774.0 188,554.8
11 Magena 201,577.0 106,091.0 139,563.0 171,354.0 232,826.0 851,411.0 170,282.2
12 Mogonga 201,105.0 191,817.0 236,082.0 95,807.0 90,242.0 815,053.0 163,010.6
13
Nyamosongo 308,649.0 82,025.0 186,299.0 - 188,451.0 765,424.0 153,084.8
14 Riasuta 54,597.0 77,203.0 98,432.0 179,287.0 285,544.0 695,063.0 139,012.6
15 Nyamonya - 96,141.0 158,449.0 49,495.0 379,017.0 683,102.0 136,620.4
16
Nyamarambe 139,551.0 48,576.0 74,626.0 182,430.0 187,178.0 632,361.0 126,472.2
17 Nyaturubo 185,787.0 46,546.0 132,500.0 107,003.0 124,897.0 596,733.0 119,346.6
18 Nyakoe 122,712.0 99,495.0 78,568.0 97,557.0 98,768.0 497,100.0 99,420.0
19 Nyosia 46,343.0 35,434.0 45,547.0 38,846.0 43,890.0 210,060.0 42,012.0
20 Mobamba - 28,494.0 42,355.0 65,498.0 59,248.0 195,595.0 39,119.0
21 Iyabe - 8,286.0 10,215.0 5,111.0 28,372.0 51,984.0 10,396.8
22 Nyachenge - 11,278.0 17,211.0 20,476.0 - 48,965.0 9,793.0
Total Per
Year 5,554,433.0 3,441,927.0 5,316,550.0 6,083,676.0 7,105,944.0 27,502,530.0
Source: Author – Adapted from the data from Ministry of Industrialization

20
3.4.1 Production Systems
Kisii is one the coffee growing counties in the west of Rift valley. Coffee production in the
County is characterized by a dual production system; the estates and smallholder farmers who
are organized into 22 active cooperative societies with a membership of about over 55,000 coffee
growers. The production conditions in the county are generally good and characterized by high
altitude, red volcanic soils and which are deep and rich in organic matter and high rainfall.
In terms of production, the county produces an annual average of 5.5 million kilograms of coffee
from a total planted area of about 5000 hectares. According to the Kenya coffee Traders
association (2013), Kisii County contributes approximately 5 % and 2% of Kenya‟s total area
under coffee and the country‟s annual coffee production respectively as shown in Figures 3.1 and
3.2 below.
Source: KCTA (2013)
Figure 3.1: Area under Coffee in Kenya by County
Source: KCTA (2013)
Figure 3.2: Average annual production by County

21
The inconsistency observed in the country„s contribution to the national statistics in terms % area
planted and % contribution to the annual national production- provides important insights
regarding underlying weaknesses in the county coffee production system.
3.4.3: Key observations
i) There is a general increase in the production over the last five years as shown by the
annual county production trends in figure 3.3
0
2000000
4000000
6000000
8000000
2008/09 2009/10 2010/11 2011/12 2012/13
FIG : TOTAL COFFEE PRODUCTION BY YEAR
Co
ffee
pro
du
ctio
n in
KG
S
Source: Author
Figure 3.3: Combined Five year average annual production for Smallholders
v) There are no clear and consistent trends in productivity and production changes across
the societies. There are very wide productivity variations across societies. While
production is rising for some societies, others have depicted a declining trend (see table
3.11)
vi) The productivity variations across societies are apparently not driven by weather
conditions.
vii) Some societies have very low production. Figure 3.4 shows that the average 5 year
annual production per society between 2008/09 to 2011/2013. The figure reveals that
some of the societies are very small producing hardly 10,000 Kgs of coffee per year.

22
This level of production is not sufficient to enable their members enjoy the economies of
collective action.
-
500,000.00
1,000,000.00
1,500,000.00
KEN
YEN
YA
GES
AR
AR
A
MA
RA
NI
NYA
MA
CH
E
NYA
IGW
A
KIO
MO
ON
CH
A
NYA
GU
TA
NYA
MB
UN
DE
KEN
YOR
O
GA
KER
O
MA
GEN
A
MO
GO
NG
A
NYA
MO
SON
GO
RIA
SUTA
NYA
MO
NYA
NYA
MA
RA
MB
E
NYA
TUR
UB
O
NYA
KO
E
NYO
SIA
MO
BA
MB
A
IYA
BE
NYA
CH
ENG
E
Source: Author
Figure 3.4: Five year annual production by society between 2008/09 to 2012/2013
viii) Analysis of the production trends for the individual societies shows that the coffee
production system (enterprise) is highly volatile, implying that any productivity gains can
be wiped out instantaneously (see Figure 3.5).
0
50000
100000
150000
200000
250000
300000
350000
400000
2008/09 2009/10 2010/11 2011/12 2012/13
NYAGUTA
NYAMBUNDE
KENYORO
GAKERO
MAGENA
MOGONGA
Source: Author
Figure 3.5: Five year annual production trend by society between 2008/09 - 2012/2013

23
The volatility is explained by the fact that most small-scale producers rely heavily on the
returns from one season to finance the next, through taking care of the coffee bushes and
the acquisition of inputs for disease control. Where the incomes have fallen or are
altogether nonexistent, the maintenance of the plants suffers, leading to lower or no yield.
3.4.4: Key factors influencing Production and Productivity
The key factors identified by the task force to explain the production and productivity
bottlenecks in the county include:
a) The extension services delivery to farmers is poor and farmers may not be aware of the
improved technologies.
b) Poor producer incentives due to delays in coffee payments and high processing costs
c) Lack of mechanism for quality feedback from buyers.
d) Conflicting messages from government departments- specifically the department of
agriculture and that of cooperatives.
e) Weak mechanism for on-going monitoring of performance at the various levels in the
coffee value chain
f) Low adoption of superior varieties such as Ruiru II and Batian
g) Processing Capacity bottlenecks leading quality loss and reduced earnings
3.5 Schedule of Coffee Payments in the period 2008 – 2013 (TOR 5)
The TOR was to develop schedule of coffee payments for all affiliated societies and non –
affiliated societies in Kisii County. The schedule of coffee payments by society for the last five
years as per the terms of reference is presented table 3.12 below.

24
Table 3.12: Schedule of coffee payments 2008/09 to 2012/13
Years
Name of
Society 2008/09 2009/10 2010/11 2011/12 2012/13
5 year
Average
3 Yr Average
[2008/09 -2010/11
3 Yr Average
[2010/11 - 2012/13] % Change
Kenyenya 21,826,211 18,483,401 35,307,571 62,116,777 26,363,163 32,819,425 25,205,727.67 41,262,503.67 64%
Nyaguta 18,323,575 44,648,477 29,872,967 28,973,609 19,401,426 28,244,011 30,948,339.67 26,082,667.33 -16%
Gesarara 14,259,707 26,065,725 32,457,589 23,014,774 19,292,794 23,018,118 24,261,007.00 24,921,719.00 3%
Marani 5,965,254 8,548,424 25,995,901 26,081,453 19,924,852 17,303,177 13,503,193.00 24,000,735.33 78%
Nyaigwa 10,672,432 5,371,299 15,878,630 19,196,871 9,090,418 12,041,930 10,640,787.00 14,721,973.00 38%
Kiomooncha 10,641,361 6,596,743 14,923,864 8,568,549 6,167,759 9,379,655 10,720,656.00 9,886,724.00 -8%
Mogonga 5,142,299 7,664,993 12,852,088 10,283,037 9,791,347 9,146,753 8,553,126.67 10,975,490.67 28%
Nyakoe 4,785,594 10,849,385 11,457,208 8,214,750 6,531,890 8,367,765 9,030,729.00 8,734,616.00 -3%
Nyamache 7,619,079 6,617,229 25,578,675 840,646 1,055,385 8,342,203 13,271,661.00 9,158,235.33 -31%
Nyambunde 5,004,074 3,965,549 8,457,030 10,999,865 2,839,201 6,253,144 5,808,884.33 7,432,032.00 28%
Kenyoro 5,277,880 2,655,468 9,594,563 4,403,939 3,800,670 5,146,504 5,842,637.00 5,933,057.33 2%
Gakero 3,230,900 2,282,654 5,511,516 5,615,830 4,604,361 4,249,052 3,675,023.33 5,243,902.33 43%
Magena 3,490,604 2,656,651 4,538,423 6,789,821 3,468,200 4,188,740 3,561,892.67 4,932,148.00 38%
Nyamosongo 5,134,557 2,634,046 7,499,366 4,956,927 5,056,224 5,089,323.00 6,228,146.50 22%
Nyaturubo 4,564,129 2,478,908 3,567,680 5,751,411 3,568,323 3,986,090 3,536,905.67 4,295,804.67 21%
Nyamarambe 1,636,900 1,196,426 2,567,706 4,738,113 3,530,231 2,733,875 1,800,344.00 3,612,016.67 101%
Riasuta 1,198,707 1,710,432 1,775,141 3,779,744 4,273,305 2,547,466 1,561,426.67 3,276,063.33 110%
Nyamonya 2,821,653 5,237,313 1,078,985 1,295,912 2,608,466 4,029,483.00 2,537,403.33 -37%
Nyosia 2,879,546 985,391 2,021,821 1,105,582 1,232,326 1,644,933 1,962,252.67 1,453,243.00 -26%
Nyachenge 528,289 463,726 550,742 869,766 382,878 559,080 514,252.33 601,128.67 17%
Iyabe 170,214 287,552 58,895 599,739 279,100 228,883.00 315,395.33 38%
Total Per
Year 132,181,098 158,866,794 255,933,346 232,482,417 152,171,107 187,915,710 182,327,079.33 213,528,956.67 17.11%
Source: Author – Adapted from the data from Ministry of Industrialization

25
3.5.1 Key Observations :
i) There is an erratic trend in coffee payments of in the period 2008 – 2013 as shown in
figure 3.6
0
50000000
100000000
150000000
200000000
250000000
300000000
2008/09 2009/10 2010/11 2011/12 2012/13
FIG: TOTAL COFFEE PAYMENTS BY TOTAL PER YEAR
Source: Author
Figure 3:6 Annual total coffee payments in the period 2008/09 -2012/13
ii) Analysis of the payments reveals that the trends on payments do not follow the trends in
production. While production appears to be rising, payment to growers is on a downward
trend (see figure 3.7).
Source: Author
Figure 3.7: Five year total payment trend for the societies 2008/09 to 2012/2013

26
iii) There are no clear and consistent trends in payments across the societies. While
payments went up substantially for some societies, a number of societies recorded a
decline (see figure 3.8).
Source: Author
Figure 3.8: Five year total payment trend for the societies 2008/09 to 2012/2013
i) The variations in payment trends across societies apparently not driven by prices. This implies
that there are other underlying performance related fundamentals.

27
3.6 Debts owed by Societies and the Union in the period 2008 – 2013
The TOR was to determine the nature, source, purpose and status of the debt.
The taskforce was presented with different debt schedules as under:
3.6.1: Debts owed by union
It was established that the union owes different creditors as shown in Table 3.13
Table 3.13: Summary of debt owed by the Union (GCFCU) as per the Union
S/no Item description Amount
1 Kenya Revenue Authority 3,500,000
2 Farm Salaries 2,000,000
3 Migos & Ogamba & Co Advocates 7,000,000
4 Nyatundo & Co Advocates 6,000,000
5 N.S.S.F 5,000,000
6 County Government (Former Municipal Council ) 3,000,000
7 Union Staff Allowances 3,962,035
8 Simbauti Staff Leave Allowance 1,460,329
Total 31,922,364
Source: Author – Adapted from the data from GCFCU
Table 3.13 above presents the schedule that was provided by the union. However these debts are
significantly different from those in Table 3.8 which raises questions on the validity of the debts
3.6.2: Summary of Debts owed by the Societies
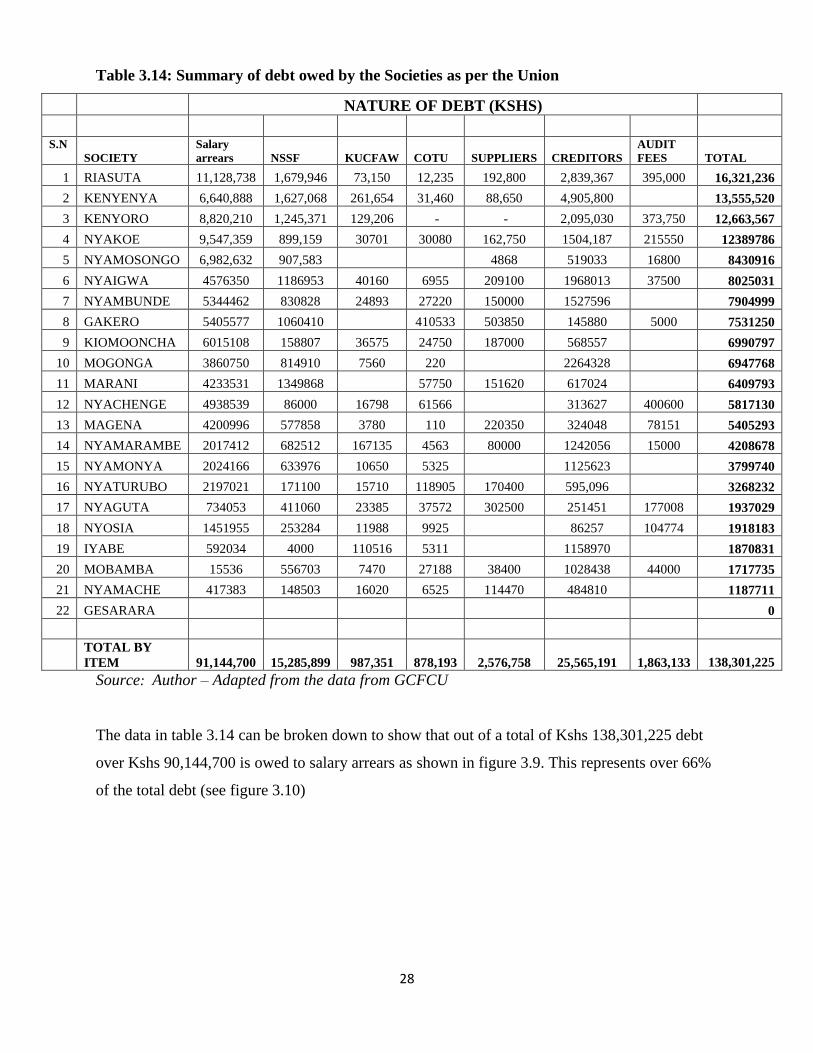
a) Table 3.14 shows the schedule of debts owed by the societies according to the records held
by the union. As of end 2013 the debts are estimated at about Kshs 138,301,225.
28
Table 3.14: Summary of debt owed by the Societies as per the Union
NATURE OF DEBT (KSHS)
S.N
O SOCIETY
Salary
arrears NSSF KUCFAW COTU SUPPLIERS CREDITORS
AUDIT
FEES TOTAL
1 RIASUTA 11,128,738 1,679,946 73,150 12,235 192,800 2,839,367 395,000 16,321,236
2 KENYENYA 6,640,888 1,627,068 261,654 31,460 88,650 4,905,800 13,555,520
3 KENYORO 8,820,210 1,245,371 129,206 - - 2,095,030 373,750 12,663,567
4 NYAKOE 9,547,359 899,159 30701 30080 162,750 1504,187 215550 12389786
5 NYAMOSONGO 6,982,632 907,583 4868 519033 16800 8430916
6 NYAIGWA 4576350 1186953 40160 6955 209100 1968013 37500 8025031
7 NYAMBUNDE 5344462 830828 24893 27220 150000 1527596 7904999
8 GAKERO 5405577 1060410 410533 503850 145880 5000 7531250
9 KIOMOONCHA 6015108 158807 36575 24750 187000 568557 6990797
10 MOGONGA 3860750 814910 7560 220 2264328 6947768
11 MARANI 4233531 1349868 57750 151620 617024 6409793
12 NYACHENGE 4938539 86000 16798 61566 313627 400600 5817130
13 MAGENA 4200996 577858 3780 110 220350 324048 78151 5405293
14 NYAMARAMBE 2017412 682512 167135 4563 80000 1242056 15000 4208678
15 NYAMONYA 2024166 633976 10650 5325 1125623 3799740
16 NYATURUBO 2197021 171100 15710 118905 170400 595,096 3268232
17 NYAGUTA 734053 411060 23385 37572 302500 251451 177008 1937029
18 NYOSIA 1451955 253284 11988 9925 86257 104774 1918183
19 IYABE 592034 4000 110516 5311 1158970 1870831
20 MOBAMBA 15536 556703 7470 27188 38400 1028438 44000 1717735
21 NYAMACHE 417383 148503 16020 6525 114470 484810 1187711
22 GESARARA 0
TOTAL BY
ITEM 91,144,700 15,285,899 987,351 878,193 2,576,758 25,565,191 1,863,133 138,301,225
Source: Author – Adapted from the data from GCFCU
The data in table 3.14 can be broken down to show that out of a total of Kshs 138,301,225 debt
over Kshs 90,144,700 is owed to salary arrears as shown in figure 3.9. This represents over 66%
of the total debt (see figure 3.10)

29
0
10000000
20000000
30000000
40000000
50000000
60000000
70000000
80000000
90000000
100000000
Source: Author – Adapted from the data from GCFCU
Figure 3.9: Five Year Cumulative Debts Owed By Societies by Item
(As per Table 3.13)
Salary arrears 66%
NSSF 11%
KUCFAW 1%
COTU 1%
SUPPLIERS 2% CREDITORS
18%
AUDIT FEES 1%
FIVE YEAR DEBT OWED BY PERCENTAGE
Source: Author – Adapted from the data from GCFCU
Figure 3.10: Five Year Cumulative Debts Owed By Societies by Percentage
(As per Table 3.14)
FIVE YEAR CUMULATIVE DEBT OWED BY ITEM

30
b) Loans Owed By The Society
In addition to the above debt, the societies have additional liabilities in form of loans taken
from various financing institutions. The schedule of the loans as presented to the task force is
presented in table 3.15. However some of the data presented did not have details on the
purpose, principal, lender, and mode of payment of the loans (see table 3.15)
Table 3.15: Summary of loans owed by the Societies
MARANI
s/no Purpose Principal Lender Mode of
payment
Outstanding
Balance
1 Servicing machines 250,000 Wakenya Pamoja 20% deduction 100,000
NYAIGWA
s/no Purpose Principal Lender Mode of
payment
Outstanding
Balance
1 Payment to members
2011/2012
12,800,000 Sasini Mills Coffee proceeds 6,000,000
2 Payment to members
2011/2012
5,000,000 OOP – Bank Coffee proceeds 5,000,000
3 Salary arrears
2011/2012
8,599,200 Sasini Mills Coffee proceeds 8,599,200
4 Engine repair
2011/2012
1,400,000 Ranberger Coffee proceeds 1,400,000
TOTAL
20,999,200
KIOMOONCHA
s/no Purpose Principal Lender Mode of
payment
Outstanding
Balance
1 Chemicals
2011
3,000,000 Co-op Bank 20% payment 2,700,000
2 Advance payment
2009
250,000 Wakenya Pamoja 20% payment 400,000
3 Advance payment
2010
932,829 CODF - 582,451
TOTAL
3,682,451
NYAMARAMBE
s/no Purpose Principal Lender Mode of
payment
Outstanding
Balance
1 Crop Advance - Wakenya Pamoja - 2,244,831
2 CODF - Wakenya Pamoja - 1,347,747
3 OD 32,700 Wakenya Pamoja - 32,700
TOTAL
3,625,278
NYACHENGE
s/no Purpose Principal Lender Mode of Outstanding

31
payment Balance
1 Advance 500,000 Wakenya Pamoja Coffee proceeds 500,000
2 Processing 87,000 Wakenya Pamoja Coffee proceeds 87,000
3 Salary arrears 4,938,539 - - 4,938,539
4 Retirees arrears 3,136,270 - - 3,136,270
TOTAL
8,661,809
RIASUTA
s/no Purpose Principal Lender Mode of
payment
Outstanding
Balance
1 Repair and Processing 1,200,000 Wakenya Pamoja Coffee proceeds 1,200,000
TOTAL
1,200,000
NYAMACHE
s/no Purpose Principal Lender Mode of
payment
Outstanding
Balance
1 Purchase of Chemicals 2,900,000 Co-operative Bank Coffee proceeds 2,900,000
2 Coffee advance 600,000 CMS Coffee proceeds 600,000
3 Advance 74,000 Wakenya Pamoja Coffee proceeds 74,000
TOTAL
3,574,000
KENYENYA
s/no Purpose Principal Lender Mode of
payment
Outstanding
Balance
1 Working Capital 2,830,000 Co-operative Bank Coffee proceeds 2,830,000
2 Purchase of Chemicals 3,500,000 Stanbex Coffee proceeds 3,500,000
3 Crop Advance 2,500,000 Wakenya Pamoja Coffee proceeds 2,500,000
TOTAL
8,830,000
MAGENA
s/no Purpose Principal Lender Mode of
payment
Outstanding
Balance
1 Store Construction 1,500,000 Co-operative Bank Coffee proceeds 1,500,000
2 Advance 500,000 Wakenya Pamoja Coffee proceeds 500,000
3 Advance 257,000 Gusii Coffee Mills Coffee proceeds 257,000
TOTAL
2,257,000
MOGONGA
s/no Purpose Principal Lender Mode of
payment
Outstanding
Balance
1 Advance 355,540 Wakenya Pamoja Coffee proceeds 355,540
2 OD (1980) 332,896 Wakenya Pamoja Coffee proceeds 332,896
TOTAL
688,436
KENYORO
s/no Purpose Principal Lender Mode of Outstanding

32
payment Balance
1 Farm inputs 3,000,000 Co-operative Bank Coffee proceeds 3,000,000
2 Crop Advance 800,000 Wakenya Pamoja Coffee proceeds 800,000
TOTAL
3,800,000
GAKERO
s/no Purpose Principal Lender Mode of
payment
Outstanding
Balance
1 Advance 1,700,000 Wakenya Pamoja Coffee proceeds 1,700,000
2 Salary Arrears 1,500,000 - - 1,500,000
TOTAL
3,200,000
NYAMONYA
s/no Purpose Principal Lender Mode of
payment
Outstanding
Balance
1 Loan 500,076 Wakenya Pamoja Coffee proceeds 500,076
2 Advance 8,177 Wakenya Pamoja Coffee proceeds 8,177
3 Loan 4,000,000 - - 4,000,000
TOTAL
4,508,253
NYAMOSONGO
s/no Purpose Principal Lender Mode of
payment
Outstanding
Balance
1 Loan 464,994 Wakenya Pamoja Coffee proceeds 464,994
2 OD 2,845 - Coffee proceeds 2,845
TOTAL
467,839
NYAMBUNDE
s/no Purpose Principal Lender Mode of
payment
Outstanding
Balance
1 Stabex Loan for
Purchase of Chemicals
6,000,000 Co-operative Bank Coffee proceeds 6,000,000
2 Crop Advance 8,000,000 Sasini Mills Coffee proceeds 8,000,000
3 Loan 583,589 Wakenya Pamoja Coffee proceeds 583,589
4 OD 16,900 Wakenya Pamoja Coffee proceeds 16,900
TOTAL
14,600,489
NYAGUTA
s/no Purpose Principal Lender Mode of
payment
Outstanding
Balance
1 Operations (Advance)
2012/13
450,000 Wakenya Pamoja Operations
Account – 20%
400,000
2 500,000 GCFCU Operations
Account – 20%
500,000
TOTAL
900,000
NYATURUBO

33
s/no Purpose Principal Lender Mode of
payment
Outstanding
Balance
1 Operations (Advance)
2012/13
800,000 Wakenya Pamoja Operations
Account – 20%
800,000
2 Salary Arrears 5,100,000 Wakenya Pamoja Operations
Account – 20%
5,100,000
TOTAL
5,900,000
NYOSIA
s/no Purpose Principal Lender Mode of
payment
Outstanding
Balance
1 Operations (Advance)
2008
880,000 Wakenya Pamoja Operations
Account and
Members
Account
1,095,208
TOTAL
1,095,208
GESARARA
s/no Purpose Principal Lender Mode of
payment
Outstanding
Balance
1 Salary Arrears 12,000,000 12,000,000
2 Gratuity 3,000,000 3,000,000
TOTAL
15,000,000
IYABE
s/no Purpose Principal Lender Mode of
payment
Outstanding
Balance
1 OD (1992) 35,000 Wakenya Pamoja Coffee proceeds 702,000
2 Crop Advance 31,521 Wakenya Pamoja Coffee proceeds 31,521
TOTAL
733,521
GRAND TOTAL 103,823,484
Source: Author – Adapted from the data from Ministry of Industrialization
3.6.3 Key observations
i) There is a large and unsustainable debt for the union and societies. The union has an
estimated debt of 31,922,364.The amount of debts outstanding for the societies is Kshs
138,301,225 and the loan outstanding is for Kshs 103,823,484
ii) There is inconsistency in the reporting of debt of the union. For instance see table 3.8 and
3.13

34
iii) There are no effective controls to obligate the societies market their coffee through the
union. Some of the societies by pass the union to sell or mill their coffee to independent
millers. This provides a big loophole for fraud and corruption considering the weak
financial monitoring systems at the society level.
iv) Most of the data is unclear as relates the date when the debt was incurred, the purpose
and the nature of the balances outstanding pointing to weakness in record keeping and
accounting
v) It is not clear whether the loans waived by government affect the status of debts or not
vi) There was no evidence to back up the debts presented although these is from balance
sheets,
vii) There are no clear records debts owed to both the union and the societies
3.7 Machinery Status and needs for all societies in Kisii County (TOR 7)
The task force established that most of the coffee factories in the county have old and obsolete
machinery leading to wastage, quality losses and high cost structures. There is need for the
county government to commission a full machinery audit to ascertain the full extent of the
problem.
3.8: Relationship between the Union and Wakenya Pamoja Sacco
There following observations were deduced about Wakenya Pamoja Sacco;
Wakenya Pamoja SACCO is now owned by the shareholders, but the release from the
original owner the union was done without regard to the farmers.
The number of delegates are too many and need to be reduced
The original owners to be listened to and be brought back on board.
In elections all the members no matter the size of shares should be allowed to vote and
this requires the repealing of the SACCO by- laws to be all inclusive. The minister to
come up with regulations and rules for the amending of the by-laws. This should include
clear guidelines for conducting elections
There are staff capacity and competency bottlenecks
Wakenya Pamoja Sacco to grow into a full-fledged bank

35
Chapter 4: Summary of key challenges and Benchmarking
The task force established that although the coffee sector has a huge potential, there are a number
of challenges that affect its performance. This chapter provides a summary of the main
challenges and problems that affect the sector.
4.1 Key Challenges facing the sector
a) Farm Level Challenges
i) Poor delivery of extension services leading to; poor adoption of improved
technologies, weaknesses in grower education, lack of price advisory information to
the growers and lack of timely dissemination of the of policy changes affecting the
industry.
ii) Low farm productivity which leads to low farming earnings. When benchmarked the
county productivity compares unfavorably with counties such Nyeri and Kirinyaga as
shown in table 4.2 below.
iii) Delays in payments to growers leading to poor producer incentives
iv) Declining land holding sizes, aging coffee plants and competition with other
agricultural enterprises.
v) Rising cost of production (COP) while the prices in the world market have continued
to fluctuate and mostly are on the declining trend. The gains that were anticipated as a
result of enhanced competition following liberalization have not been realized.
vi) The exposure to price risks arising from fluctuations of coffee prices, exchange rates
and performance risks in marketing institutions.
vii) The coffee production system (enterprise) is highly volatile, implying that any
productivity gains can be wiped out instantaneously. There are no clear and consistent
trends in productivity and production changes across the societies.
viii) Over –reliance on inorganic fertilizers and other commercial inputs in the
production of coffee
b) Production and Processing
i) Capacity bottlenecks due to old, obsolete and inappropriate processing machinery.
This has led to wastage, loss of quality and high processing costs.

36
ii) Lack of standardized production procedure manuals to guide processing and quality
control at the various processing levels.
iii) Lack of a mechanism for quality feedback from buyers.
iv) Uneconomical production units (factory / societies) - Some of the units are too small
to allow for the economies of scale.
v) There is no clear and updated inventory of the status of the machinery or its capacity.
c) Policy and Regulatory framework
i) The intricate relationship between the various stakeholders has led to conflicts and
controversies. The balancing of the interests of the cooperatives, the union, the
farmers, the regulator, the millers and other stakeholders has been less than
harmonious due lack of clarity on the roles of each of the stakeholders.
ii) Concerns by stakeholders regarding the role of the CBK in curbing illegal trade and
coffee theft. There is feeling among stakeholders that activities of CBK are not visible
on the ground.
iii) Although the coffee sector has been reformed to allow farmers to market their own
coffee, there is no enabling framework to support coffee trade and marketing. The
marketing license for the union is also expired.
iv) Conflicting messages from government departments specifically the department of
Agriculture and that of Cooperatives. There is a conflict in the line ministries that
deal with coffee and other related bodies. For instance the department of cooperatives
tends to patronize coffee marketing at the expense of other crops.
v) Weak mechanism for on-going monitoring of performance at the various levels in the
coffee value chain
d) The Coffee Structure and Role Actors
i) There are too many actors in the coffee sector whose margins result in the loss of
value to the grower.
ii) There is no clear structure that is customized to meet the unique needs of the county.
There is concern that the existing structure is generic and is not customized to meet
the unique needs of the county.

37
e) Management of Asset and Liabilities
i) Large pool of assets that are not optimally utilized. Some of the assets are non –
profitable and are not aligned with the strategic direction of the sector.
ii) There is unclear or irregular disposal of the Union`s assets e.g. part of Simbauti farm.
iii) Lack of clear guidelines and criteria for asset management, acquisition and disposal.
iv) Most of the leases of the union are expired.
v) There is no valuation to ascertain the true value of the assets.
vi) There is no clear and updated register of assets owned by the union and the societies.
vii) There are many unsustainable and non-performing debts owed to and by the Union
and Societies. There are inconsistencies in reporting of liabilities
viii) There is no policy framework to guide borrowing of loans by the union and the
individual societies.
f) Governance Challenges
i) There is an inappropriate governance structure due lack of clarity of roles and
functions of the Union Board and Management leading to conflict and duplicity of
roles. For instance the stakeholders feel that powers at the union are vested in one
office and that there is no transparency and accountability as the union CEO signs
cheques on behalf of the other signatories (one signature can withdraw society
money)
ii) There are no clear guidelines to govern an appropriate composition and eligibility of
stakeholders in the Union board. As currently constituted, the board has only farmer
representatives without provision for professionals.
iii) There are no guidelines for the remuneration of the Union Board.
iv) There is no committee to provide oversight on the operations of the coffee mill. The
coffee mill also lacks the liquoring section. To streamline the operations of the mill,
the coffee mill should be managed as an independent unit of the union.
v) Incessant conflicts within co-operative societies.
vi) There is corruption and lack of transparency and accountability especially in the
finances. There is no receipting of moneys from primary society.
vii) There are weaknesses in the staff compliment due to lack of clear human resource
policies and succession planning. The union structure for instance lacks key functions

38
such as the internal audit function and technical services. Again, most of the union
and society staff lack capacity, requisite skills to discharge their functions.
g) Financial management and controls
i) There are no clear policies, procedures and manuals to guide financial management
and accounting. The manuals should provide details for internal control systems, asset
management, credit control, cash flow, book keeping, and accounting for the sector.
ii) Poor book keeping of accounting records.
iii) Poor monitoring and enforcement of the audit. The task force established that a
number of societies had not complied with the law requirement regarding audit.
iv) An inappropriate model for financing the activities of the union. The current cost
sharing system is not pegged on services delivered and hardly benefits the societies.
v) There are no clear guidelines to government utilization of coffee cess.
vi) There no set policies to guide borrowing and debt management.
vii) Lack of clear and stringent by laws for deterrence and minimization of financial
mismanagement and corruption.
viii) The farmers and societies do not get statements of their coffee deliveries and the
payments do not go directly to the farmers` accounts.
h) Relationship with Wakenya Pamoja Sacco
i) Although Wakenya Pamoja Sacco and Union are independent entities this
relationship is not well understood. The stakeholders also feel that the change of
ownership was done without regard to the farmers.
ii) The number of delegates are too many and need to be reduced
iii) Lack of strategic direction and growth path of the Sacco. The peers of WPS are
already organized into strong national MFIs e.g. UNAITAS.
i) Value Addition and Branding
i) Limited value addition of coffee
ii) Lack of brand identity market- for instance Kisii has not leveraged on production of
the blue mountain variety-which the county is known for.
iii) Lack of clear policy framework to support value addition

39
iv) Uncoordinated milling and marketing where some societies avoid milling and
marketing through their union. This is a major anomaly and is the conduit for
stealing farmers‟ proceeds through various advances from millers and marketers.
There is need to address the above challenges with a view to strengthen the coffee sector of the
county. The challenges and opportunities for revitalization of the sector are summarized in the
SWOT table below.

40
Table 4.1: The Kisii Coffee Sector SWOT Analysis
Strengths Weaknesses Opportunities Threats
i) Ideal climatic conditions
ii) Pool of coffee
knowledge
iii) Renowned coffee variety
- Blue Mountain
iv) Availability of Renown
coffee research facility
v) Availability of superior
coffee varieties (New /
Improved)
vi) Devolution of functions
vii) Good will from the
County government
viii) A good asset base at the
union
i) Poor extension and advisory services
ii) Small and Uneconomical units at the farm
and society levels
iii) Old and obsolete processing technologies
iv) Capacity bottlenecks and mismatch especially
at processing, warehousing and level.
v) Poor keeping and management of records
vi) Non optimal management of assets and
liabilities and debts which are now
overwhelming
vii) Inappropriate human resource structure and
compliment
viii) Limited value addition of coffee
ix) Inappropriate policy framework - There is a
conflict in the line ministries that deal with
coffee and other related bodies and 10. The
Department of cooperatives tends to patronize
coffee marketing at the expense of other
crops.
x) A poor Governance structure and weak by
laws leading to poor accountability
xi) Lack of appropriate mechanism for
performance monitoring and audit
xii) Weak regulatory framework leading to weak
regulation- the activities of CBK are not
visible on the ground
xiii) Lack of transparency leading to value
leakage along the value chain
xiv) Multiplicity of players leading to duplication
and poor coordination
xv) Lack of brand identity
xvi) Large pool of assets that are not optimally
utilized
xvii) Poor utilization of Cess and cost sharing
levy
i) Liberalization of sector allowing
farmers to market their coffee
directly
ii) Value addition
iii) Penetration of niche markets –
emerging markets, specialty
markets, consumer preferences,
youth and local consumption
iv) Certification for sustainability
v) Adoption of modern technology
and ICT
vi) Use of devolution platform to
revitalize the sector
vii) Reorganization of the regulatory
function following the
consolidation of agricultural
parastatals
viii) Optimal utilization of the large
asset base
ix) Possibility for Private public
partnerships especially in value
addition of coffee
x) Organized and aggregated
marketing
i) Climate change effects
ii) Competition from other
enterprises
iii) Changing consumer
preferences
iv) Price volatility – leading to a
very unstable farming
system
v) Illegal coffee deals /
hawking
vi) Age profile of farmers –
most farmers are old and
young people not willing to
go into farming
vii) Climate change
viii) Rising Consumer concerns
about food safety and health
issues associated with coffee
ix) High level of debt by the
societies
Source: Author

41
4.2 Benchmarking
In order to suggest credible recommendations, the task force undertook visits to Nyeri County
and Ethiopia to benchmark and compare experiences. The comparative productivity performance
by county as shown in table 4.2 while the experiences of the Nyeri and Ethiopian models are
shown in box 4.1 and 4.2 below.

42
Table 4.2: Comparative productivity figures by County
Estimated Area under coffee Annual production metric tonnes Productivity Kgs/Ha
County Estates
Small
holders Total Estates
Small
holders Total Estates
Small
holders Total
Kiambu 12814.0 10830.0 23644.0 15633.0 2560.0 18193.0 1220.0 236.4 769.5
Kirinyaga 1590.0 6245.0 7835.0 2194.0 5870.0 8064.0 1379.9 940.0 1029.2
Muranga 1138.0 12187.0 13325.0 1662.0 2925.0 4587.0 1460.5 240.0 344.2
Nyeri 1106.0 11374.0 12480.0 1634.0 6630.0 8264.0 1477.4 582.9 662.2
Embu 336.0 6499.0 6835.0 397.0 2268.0 2665.0 1181.5 349.0 389.9
Meru 640.0 7706.0 8346.0 328.0 2624.0 2952.0 512.5 340.5 353.7
Tharaka –Nithi 344.0 3802.0 4146.0 175.0 1167.0 1342.0 508.7 306.9 323.7
Machakos 1877.0 6526.0 8403.0 1443.0 2803.0 4246.0 768.8 429.5 505.3
Makueni 1736.0 1736.0 763.0 763.0 439.5 439.5
Kisii & Nyamira 144.0 5869.0 6013.0 29.0 1174.0 1203.0 201.4 200.0 200.1
Baringo 146.0 677.0 823.0 1.0 115.0 116.0 6.8 169.9 140.9
Kericho 557.0 2879.0 3436.0 298.0 1238.0 1536.0 535.0 430.0 447.0
Nakuru 1256.0 309.0 1565.0 705.0 111.0 816.0 561.3 359.2 521.4
Trans Nzoia, Keiyo & Marakwet 2440.0 341.0 2781.0 437.0 113.0 550.0 179.1 331.4 197.8
Migori and H/bay 34.0 1329.0 1363.0 3.0 106.0 109.0 88.2 79.8 80.0
Bungoma 183.0 6230.0 6413.0 34.0 1246.0 1280.0 185.8 200.0 199.6
Kakamega and Vihiga 487.0 487.0 20.0 20.0 41.1 41.1
Total 24,605.0 85,026.0 109,631.0 24,973.0 31,733.0 56,706.0 1,015.0 373.2 517.2
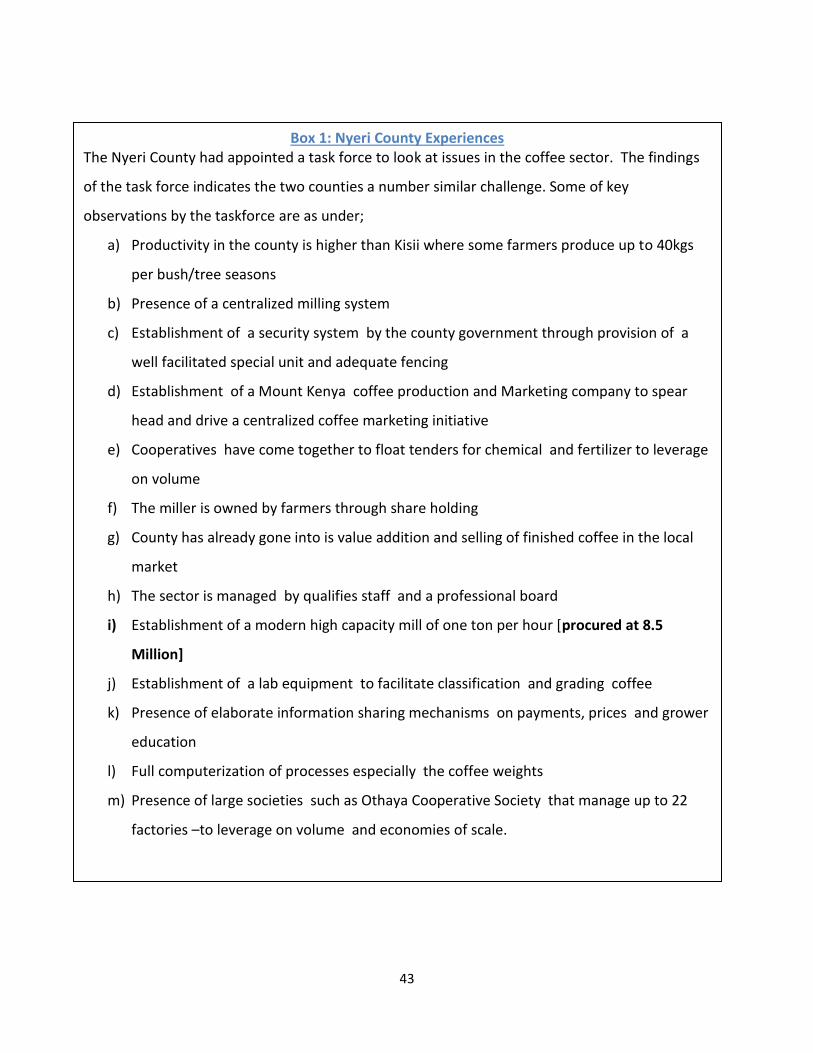
43
Box 1: Nyeri County Experiences The Nyeri County had appointed a task force to look at issues in the coffee sector. The findings
of the task force indicates the two counties a number similar challenge. Some of key
observations by the taskforce are as under;
a) Productivity in the county is higher than Kisii where some farmers produce up to 40kgs
per bush/tree seasons
b) Presence of a centralized milling system
c) Establishment of a security system by the county government through provision of a
well facilitated special unit and adequate fencing
d) Establishment of a Mount Kenya coffee production and Marketing company to spear
head and drive a centralized coffee marketing initiative
e) Cooperatives have come together to float tenders for chemical and fertilizer to leverage
on volume
f) The miller is owned by farmers through share holding
g) County has already gone into is value addition and selling of finished coffee in the local
market
h) The sector is managed by qualifies staff and a professional board
i) Establishment of a modern high capacity mill of one ton per hour [procured at 8.5
Million]
j) Establishment of a lab equipment to facilitate classification and grading coffee
k) Presence of elaborate information sharing mechanisms on payments, prices and grower
education
l) Full computerization of processes especially the coffee weights
m) Presence of large societies such as Othaya Cooperative Society that manage up to 22
factories –to leverage on volume and economies of scale.
n)
o) xisting collaboration with Dedan Kimathi University

44
Renewal of Union expired lease
Lack of adequate Storage capacity to handle coffee deliveries
Legal fees owed to : Nyatundo & Co advocates and Migos Ogamba & Co. Advocates
Lack of adequate transport –there is need to procure two lorries Development of the
union plots located at the industrial area
Commercial development of the 3 plots within the CBD
Acquisitions of a : Coffee Roaster, Drying Machine, Weighbridge
Box 2: Ethiopian Experiences Ethiopia is the largest producer of coffee in Africa with over 120 species. The sector is a
leading export commodity and contributes about 26% of GDP. From the visit the task force
made the following observations;
a) The millers are largely owned by cooperatives but there are also a few private
entrepreneurs
b) There are no of middlemen in the coffee value chain
c) There are no cases of coffee theft as security is well organized
d) The government has made legislation to protect the coffee sector to eliminate cartel
and middlemen
e) Presence of a central marketing system
f) Presence of quality, delivery and payment guarantee.
g) Presence of an elaborate storage and warehousing system by the union. Buyers deposit
their money before collection of coffee
h) 40% of the finished coffee is locally consumed
i) There is a presence of direct sales as main way of selling the coffee
j) There is no use of chemical fertilizers. Only organic manure is used to grow coffee
k) The cost of farm inputs is significantly low.

45
Chapter 5: Recommendations and Strategies for Change
The task force was commissioned to look into various issues affecting the coffee sector and
make appropriate recommendations to enhance efficiency, competitiveness and value realization
in the sector. This chapter contains recommendations and strategies for change in the coffee
sector in Kisii county based on the taskforce`s findings. It is anticipated that implementation of
the recommendations will result in improved performance of the sector. A summary of the of
the key findings and recommendations are as follows
a) Farm Level:
To address the farm level challenges and concerns, it is recommended that;
i) The County government seconds a unit of extension services to address the unique
and specific advisory and grower education needs in sector
ii) The county government to enact legislation to guide payment to the farmers for
coffee deliveries. The guidelines should address the mode of payment, delays in
release of payments and the relative sharing of revenue from the sale of “made
coffee”, between the union and the farmers,
iii) The county government to identify specific farm level interventions to support
farmers in adoption of technologies and replacement of aging coffee plants. This
should by guided by a needs assessment and feasibility study taking into
consideration regional best practices.
iv) The county government to establish policy guidelines to address the problem of
declining farm size and non-optimal farm units.
v) The union in conjunction with the county government to establish guidelines (by –
laws) to ensure that farmers are responsible for maintaining and harvesting quality
coffee
ix) The county government to promote the use of organic fertilizers and other
alternative inputs in the production of coffee

46
b) Production and Processing
To address the production and processing challenges, it is recommended that;
i) The county government to assign technical staff from the ministry of agriculture to
conduct an audit and needs assessment of machinery of the Union and all Societies
ii) The county government to assist the union in the establishment of a modern model
coffee processing factory to act as bench mark to the others.
iii) The county government to support a factory modernization program to address
capacity needs and bottlenecks. This should also address any existing capacity
mismatches and underutilization.
iv) The union with support of the county government and industry experts should
develop standard production procedure manuals to guide processing and quality
control at the various processing levels.
v) The union and county government to look into the possibility of pursuing relevant
certification to enhance improvement of internal systems and promote market
penetration.
c) Policy and Regulatory framework
To address the policy and regulatory challenges, it is recommended that;
i) The county government to establish legislation on the roles and functions of the
stakeholders in the sector. This should eliminate any conflicting roles and ambiguities
of the various stakeholders
ii) The county government to establish a clear industry structure that eliminates the role
of middlemen.
iii) The county government to establish a security system to address coffee thefts and
security of coffee factories and its assets.
iv) The county government should establish a mechanism for monitoring of performance
at the various levels in the coffee value chain. This however should be aligned with
ongoing reorganization of the regulatory function (The CBK)

47
d) Management of Asset and Liabilities
To address the challenges of management of asset, debt, and liabilities, it is
recommended that;
i) The County government to develop clear guidelines and criteria for asset
management, acquisition and disposal.
ii) The sale of part of Simbauti farm should be investigated
iii) The union to pursue development of core assets to maximize the shareholder value
iv) The union to dispose assets that are non – profitable and are those that are not aligned
with the strategic direction of the sector. This is to unlock value of the assets for the
benefit the shareholders.
v) The county government to assist to assist the union and the societies to renew expired
leases and obtain titles for any unregistered land. All titles should be held by the
county government in trust on behalf of the union. Any sale or transfer of land must
be approved by the county government.
vi) The union to undertake immediate valuation of all the assets and update the register
of assets owned by the union. This should also apply for all the societies.
vii) The county government to establish a mechanism for authentication and settlement of
the outstanding debts for the Union and Societies.
e) Governance Challenges
To address the governance challenges in the sector it is recommended that;
i) The Union to be restructured to respond to the current needs of the sector and
inculcate professionalism and efficiency in its operations. The new structure should
address weaknesses in human resource policies.
ii) The county government to establish an appropriate governance structure that will
ensure clarity of roles and functions of the Union board and Management. The Board
should play the role of giving policy direction and oversight while Management
should take responsibility and accountability of the day to day operations of the
union. This is line with the best corporate practice.

48
iii) The county government to second key technical/management staff to the Union to
establish internal structures for the union in the medium term. This is to facilitate the
establishment of an optimal management model for the sector.
iv) The county government to enact legislation to govern the composition and eligibility
of stakeholders into the union board and its affiliates. The composition of the board
should allow for incorporation of professionals with key competencies to join the
board. The legislation should also provide clear guidelines on elections of the Board.
v) The county government to develop guidelines for the remuneration of the Union
Board.
vi) The process of corporate governance restructuring should be guided by Chapter 6 of
the new constitution to ensure the election or appointment of officers representing any
interests in the sector will be officers with high integrity and competent skills.
vii) Any officers who have mismanaged the societies should be barred from holding
office.
f) Financial management and controls
To address the financial management problems and controls in the sector it is
recommended that;
i) The county government to assist the union to develop policies and procedures
manuals to guide financial management and accounting. The manuals should provide
details for internal control systems, asset management, credit control, cash flow, book
keeping, and accounting for the sector.
ii) The county government to assist the union in the establishment of clear management
and information systems for its operations.
iii) The county government to enforce immediate compliance of the audit requirements.
The societies that have not been audited should be audited with immediate after the
adoption this report
iv) The county government to establish a mechanism for monitoring the implementation
of audit reports
v) The county government to enact legislations to guide borrowing and debt
management in the sector

49
vi) The county government to identify an appropriate model for financing the activities
of the union. The current cost sharing system should be replaced with system pegged
on services delivered and revenue generated
vii) The county government to enact legislations and stringent by-laws for deterrence and
minimization of financial mismanagement and corruption
viii) The county government to initiate forensic investigation on all loans and debts to
establish their credibility. All those who have embezzled funds must
repay/prosecuted.
g) Value Addition and Branding
To address Value Addition and Branding the sector it is recommended that;
i) The county government should commission a feasibility study to establish an optimal
value addition model for the sector
ii) The union together with county government should aggressively pursue branding,
establishment of niche markets for its coffee including and leveraging on the
strengths such as the blue mountain variety.
iii) The union to provide land for the establishment of an ultra-modern coffee house and
mall
iv) Funds / proceeds from sale of non-core assets to fund value addition
v) The county government to pursue private – public partnerships approaches in driving
the process of value addition is highly desirable as long as farmer‟s interests are not
infringed upon
vi) The county government to legislate laws to facilitate central milling and marketing of
coffee from the county and develop a structured and guaranteed system of payments
to the farmers and other stakeholders in the value chain.
vii) Key union facilities such as the mill should be run as an independent subsidiary of
the union in order to protect proceeds from milling. It is also expected that the value
addition arm of the union should be an independent subsidiary of the union

50
h) Relationship with Wakenya Pamoja Sacco
To address the Relationship with Wakenya Pamoja Sacco issue it is recommended that;
i) The commercialization of the SACCO needs to be investigated further to establish if
the original owners were taken care of during the transition
ii) The union and Wakenya Pamoja Sacco to provide clarification to farmers and
stakeholders on their relationship.
iii) The county government to establish a mechanism of streamlining the SACCO with a
view to putting it on a growth path of becoming a full – fledged bank in the county. A
local bank is necessary for strategic reasons.
Other recommendations
i) The union should pursue with assistance from the county government full
computerization of the operations and activities across the value chain
ii) The county government should facilitate capacity building of the stakeholders
especially the staff and management committees of the societies
iii) The county government to establish an implementation framework for this report.
iv) In implementing the report the county government should explore opportunities for
collaboration with the neighbouring counties

51
6.0 Conclusion
It is thought through that the coffee sector remains to be one of the most important sectors both
in the county and country. Even with reforms that have been undertaken over the years, there still
remain many challenges that affect the sector. Reforms such as liberalization were not well
coordinated and the farmer‟s representatives, union, agents, millers and marketers have over the
years taken advantage of this to fleece the farmers.
The implementation of the new constitution to devolve key functions means that the coffee
sector now falls entirely under county government. With this view, the county government must
enact legislation and policies geared towards revamping the sector. The county government must
initiate forensic investigation on all loans and debts to establish their credibility. All those who
have embezzled funds must repay. Any officers who have mismanaged the societies should be
barred from holding office.
In its current state, the Union needs be strengthened with competencies and focus on its core
business. Key union facilities such as the mill should be run as an independent subsidiary of the
union in order to protect proceeds from milling. It is also expected that the value addition arm of
the union should be an independent subsidiary of the union. With the ever changing economic
environment of the sector, the role of strategic investors in driving the process of value addition
is highly desirable as long as farmer‟s interests are not infringed upon. In addition, the process of
corporate governance restructuring in line with Chapter 6 of the new constitution will ensure the
election or appointment of officers representing any interests in the sector will be officers with
high integrity and competent skills.

52
7.0 References
ICO (2010). Coffee Statistics. International Coffee Organisation, London
Gathura M.N (2013) Factors affecting Small-Scale Coffee Production in Githunguri District,
Kenya International Journal of Academic Research in Business and Social Sciences September
2013, Vol. 3, No. 9
Republic of Kenya (Various) Economic Survey, Government Printer: Nairobi
USAID (2010) Kenya Coffee Industry Value Chain Analysis: Profiling the actors, their
interactions, costs, constraints and opportunities; East Africa Trade Hub, Nairobi
Various oral and written submissions from stakeholders

53
8.0 Annex
Annex 1: Declaration by Task Force Members
S No Name Designation Signature
1. Elijah M. Mochorwa Chairman
2. Vincent M. Kenyariri County Co-operative Commissioner
3. Javan Ngeywo Coffee Board of Kenya
4. Stephen Keuku Chairman, Nyakoe F.C.S
5. David Mose Nyamumbo County Director of Agriculture
6. Richard Getonto Secretary, Coffee Estates
7. Barnabas Oyugi Chairman, Coffee Estates
8. Abel Mainga Gusii Coffee Farmers Co-operative Union
9. Lilian M. Sosi Youth SACCO
10. Julius Maganga Chairman, Nyamonya F.C.S
11. Elijah Nyarumi Representative for the Challenged
12. Vincent Mokua Oigo CEO, Wakenya SACCO
13. Daniel Orina Secretariat
14. Rose. Sereti Secretariat
Annex 2: Attached as separate booklet