kissei kissei annual report 2008 september 2006; a substantial fall in sales for our parkinson’s...
TRANSCRIPT

KISSEIAnnual Report 2008

Contents
About Kissei
Guided by its management philosophy, the Kissei Group aims to make significant
contributions to society. It promotes management policies that emphasize the importance of
shareholders, employees, local communities, history and culture, and the environment.
The management vision underpinning its core pharmaceutical business challenges
Kissei Pharmaceutical Co., Ltd., to be an R&D-oriented pharmaceutical company that contributes
to human health care with innovative drug products.
To this end, Kissei promotes research and development activities from the patient’s perspective,
striving to manufacture the highest quality pharmaceuticals while collecting and providing
information necessary to use the products safely.
In addition, each Group company assists in our pharmaceutical business and leverages
their technologies to help develop our operations both domestically and internationally.
A Message from the President 1The New Medium-Term Management Plan 3Research and Development 4Corporate Governance 6Corporate Social Responsibility (CSR) 7Financial Review 8Risk Factors 9Financial Summary 10
Yumegohan: for patients with renal diseaseYumegohan: for patients with renal disease
Throking: for seniorsThroking: for seniors
Cupagalorie: energy supplementCupagalorie: energy supplement
Main Pharmaceutical Products(Generic name in parentheses):
Main Nutritional FoodsMain Nutritional Foods
UriefUrief®® (silodosin): (silodosin): dysuria associated with benign dysuria associated with benign
prostatic hyperplasia (BPH)prostatic hyperplasia (BPH)
SalagenSalagen®® (pilocarpine): dry mouth (pilocarpine): dry mouth
GlufastGlufast®® (mitiglinide): type 2 diabetes (mitiglinide): type 2 diabetes
BezatolBezatol®® (bezafibrate): hyperlipidemia (bezafibrate): hyperlipidemia
CinalongCinalong®® (cilnidipine): hypertension (cilnidipine): hypertension
UtemerinUtemerin®® (ritodrine H (ritodrine HCCl): l): threatened abortion and threatened abortion and
premature laborpremature labor
XanbonXanbon®® (ozagrel Na): acute cerebral thrombosis, etc. (ozagrel Na): acute cerebral thrombosis, etc.
RizabenRizaben®® Eye Drops (tranilast): allergic conjunctivitis Eye Drops (tranilast): allergic conjunctivitis
RizabenRizaben®® (tranilast): allergy, hypertrophic scar, etc. (tranilast): allergy, hypertrophic scar, etc.
DomenanDomenan®® (ozagrel H (ozagrel HCCl): bronchial asthma l): bronchial asthma
CabaserCabaser®® (cabergoline): Parkinson’s disease, etc. (cabergoline): Parkinson’s disease, etc.
Consolidated Balance Sheets 12Consolidated Statements of Income 14Consolidated Statements of Changes in Net Assets 15Consolidated Statements of Cash Flows 16Notes to the Consolidated Financial Statements 17Report of Independent Auditors 27Board of Directors / Corporate Data 28Investor Information 29

� K ISSEI Annual Repor t 2008
Review of OperationsOverview of Operations in the Year Under Review
A Message from the President
Mutsuo KanzawaPresident and Chief Executive Officer
The Japanese economy in fiscal 2008, the year ended March 3�,
2008, remained on a moderate recovery track, supported by a steady
flow of exports to emerging economies and sustained growth in
corporate capital spending. However, long-term crude oil price
hikes, an economic slowdown in the United States, a strong yen,
and a stagnant stock market were all significant causes for concern.
These factors led to an increasing sense of uncertainty about the
future of the Japanese economy.
The pharmaceutical industry faced increasingly challenging
conditions caused by the effects of government policies aimed at
curbing the cost of medical treatment through the promotion of
generic drugs and other measures, and increasingly intense inter-
company competition.
The information services, retailing, and construction industries
continued to perform solidly, supported by increasing IT investment
against a backdrop of strong corporate earnings. However, competition
remained intense, and the decline in private-sector orders due to the
implementation of the revised Buildings Standards Law exacerbated
a situation already characterized by a continued fall in public
spending, while competition remained fierce.
In this environment, Kissei cultivated Urief ®, a drug launched in
May 2006 for dysuria associated with benign prostatic hyperplasia
(BPH); the insulin secretagogue Glufast ®, which received approval
in May 2007 for an additional indication as a combination therapy
with alpha-glucosidase inhibitor, Alpha-GI; and Salagen®, a
therapeutic agent for patients with dry mouth induced by radiation
therapy, which received approval for an additional indication in
November 2007 as a therapeutic agent for dry mouth in patients
with Sjögren’s syndrome. In addition to these development
activities, we actively collected and disseminated information on
existing pharmaceutical products.
In R&D, we pushed forward with all our development themes.
Accordingly, in April 2007 in Japan we applied for an additional
indication approval for Glufast® to be used in combination with an
insulin sensitizer, jointly developed with Takeda Pharmaceuticals
Co., Ltd. In June 2007, we applied for an additional formulation of
Urief ® jointly developed with Daiichi Sankyo Co., Ltd. Further, in
January 2008 we entered into an agreement with Pneuma Partners LLC,
of the U.S., concerning the research, development, and marketing in
Japan of calfactant (generic name), now being developed by Pneuma
as a treatment for acute respiratory distress syndrome.
In June 2007, we commenced a licensing agreement with Eisai
Co., Ltd., for the exclusive development and commercialization
rights to Glufast ® in ASEAN countries. In September, we agreed a
contract with Eisai for the development and commercialization
rights to Glufast ® in China.
In July 2007, we entered an agreement with Nuon Therapeutics, Inc.,
of the U.S., for the research and development, manufacturing, and
marketing of the anti allergy drug Tranilast (brand name in Japan:
Rizaben®) in the field of autoimmune diseases, such as multiple sclerosis.
Kissei discovered and has marketed the drug since its foundation.
Furthermore, our licensing partner Watson Pharmaceuticals, Inc.
filed a new drug application in February 2008 with the U.S. Food
and Drug Administration (FDA) for silodosin (brand name in Japan:
Urief ®), a novel drug for dysuria associated with BPH.
In other businesses, the Company is focusing on improving
synergies among Group companies by taking positive steps to
restructure its operations. On April �, 2007, consolidated subsidiary
Hashiba 920 Co., Ltd., merged with non-consolidated subsidiary
Kissei Technos Co., Ltd., and the surviving company’s corporate
name was changed to Hashiba Technos Co., Ltd.
As a result, in the fiscal year under review, net sales reached
¥6�.48 billion, a 4.3% decrease from the previous year. We recorded
year-on-year increases of 6�.4% in operating income, to ¥4.27
billion, and 48.�% in net income, to ¥2.33 billion.
Looking at each business segment, although new products
Urief ®, Glufast ®, and Salagen® together with revenues from
licensing fee royalties contributed to pharmaceutical business
segment sales, the termination of our contract to market the
portable blood glucose monitoring system FreeStyle ®Kissei from

2 KISSEI Annual Repor t 2008
September 2006; a substantial fall in sales for our Parkinson’s
disease treatment Cabaser ®, following revisions to its package insert
from April 2007; and a decrease in sales due to the effect of generic
and competing drugs impacted the overall growth of sales. As a
result, sales declined �.5% year on year, to ¥54.77 billion.
In the other businesses segment, sales in information services
were robust, but sluggish for retail, which include sales of
construction-related materials, as well as for construction projects.
Consequently, sales declined 22.3%, to ¥6.7� billion.
Outlook for the Current Fiscal YearThe pharmaceutical industry will likely continue to face a difficult
environment due to a series of government reforms implemented
from April 2008, including National Health Insurance (NHI) price
reforms, revisions to medical treatment fees, policies to promote
the use of generic drugs, and a series of medical system reforms
including further revisions to the Latter-Term Elderly Medical
System. The operating environment in other businesses is
characterized by increasing uncertainty about the direction of the
economy, and we anticipate conditions will remain challenging due
to price competition.
In this setting, we aim to establish a management structure that
can leverage Group synergies. Further, we will strive to realize
returns on past investments in R&D and to improve profitability.
The table below shows our performance forecasts for the fiscal
year ending March 3�, 2009.Millions of yen
Forecast for year ending March 2009
Results for year ended March 2008
Change (%)
Net sales ¥63,300 ¥61,481 3.0%
Operating income 4,950 4,270 16.0
Net income 3,150 2,326 35.5
Net Sales
In our pharmaceutical business, we are forecasting increased revenues
as we implement decisive measures to counter the negative effect of
NHI price revisions and other detrimental factors. These include
measures to cultivate our new products, including Urief ® and
Glufast ®, and to increase revenues from licensing fee royalties. In our
other businesses, we are anticipating higher sales for each of our
operations in information services, retail, and construction projects.
Income
The Company will continue to actively invest in R&D, principally in
its pharmaceutical business. Moreover, we expect operating income,
and net income to increase as new product developments reduce the
cost of sales as a percentage of net sales. We do not expect any non-
operational or extraordinary income or expenses.
Management Strategy
The pharmaceutical industry’s operating environment is currently
undergoing dramatic change. With government finances in a
difficult state and serious consideration being given to NHI system
restructuring, we anticipate low growth in the domestic market for
pharmaceutical medical treatments. Also, in contrast to the global
shortage of “seed” compounds, which serve as the foundation for
the development of next-generation pharmaceuticals, technological
innovation has resulted in new categories of pharmaceuticals, such
as biomedicines, coming to the fore. Accordingly, the competition
to develop new drugs in these areas is growing increasingly fierce.
Within this environment, in April 2008 we announced our new
three-year medium-term management plan, called the “Changing
Plan (plan for change).” Under this new plan, we will continue to
cultivate the three new drugs launched under the previous medium-
term management plan and improve profitability by implementing
policies to increase efficiency throughout our operations. Based on
this improved profit foundation, we will continue to focus on drug
discovery, maintaining our status as an R&D-oriented
pharmaceutical company.
In fiscal 2009, the first year of the new plan, we will take concrete
steps to address the following key management issues: improving
profitability by increasing sales of our three new drugs; constructing
a stable overseas revenue base; and strengthening and enhancing
our R&D pipeline. At the same time, we will work to fortify our
corporate governance system, maintain a CSR-centered management
structure, and maximize corporate value while striving to retain
stakeholder trust.
June 2008
Mutsuo Kanzawa
President and Chief Executive Officer

3 K ISSEI Annual Repor t 2008
Strengthen and
Enhance our R&D Pipeline
Continuously Launch New Drugs
Improve ProfitabilityIncrease sales of new drugs
Establish an overseas revenue base
Enter into the biomedicine market
The New Medium-Term Management Plan
April 2008 marked the starting point of the “Changing Plan,”
our new three-year medium-term management plan. The plan’s
fundamental aims are to improve profitability by cultivating new
drugs to increase sales, establish a stable overseas revenue base,
and launch products in the new market category of biopharmaceuticals.
In addition, the plan targets the creation of a strategic R&D pipeline
to develop the next generation of pharmaceuticals and the establishment
of a system for the continuous creation of new drugs. These initiatives
are detailed as follows.
�. We will continue to cultivate our three new drugs, Urief ®,
Glufast ®, and Salagen®, launch products in the biomedicines
market, and increase profitability in the domestic market for
pharmaceutical medical treatments.
2. We will work to launch our original drugs through licensing
agreements with pharmaceutical companies in the U.S. and Europe,
develop new products to expand our markets, and establish a stable
overseas revenue base.
3. We will implement policies to increase efficiency throughout
our operations and to create a highly productive business structure
that will increase operating income per employee. Based on this
income structure and our long-term vision, we will enhance our
R&D pipeline through positive measures for drug discovery and
licensing.
4. We will work to create a corporate culture that allows our
employees to pursue their dreams and to feel a sense of worth
and fulfillment in their work. We will also strive to maintain
good relations with our stakeholders and to adhere to standards
of behavior prescribed by society.

4 KISSEI Annual Repor t 2008
Research and Development
The Kissei Group is carrying out R&D activities in its core
pharmaceutical business to realize its management vision of being
an R&D-oriented pharmaceutical company that contributes to
human health care with innovative drug products. To this end, the
Company positions R&D investment as a key priority, promotes
the introduction of strategic R&D themes, and works to strengthen
and enhance its R&D pipeline. The current status of our
pharmaceutical business’s R&D efforts in Japan and overseas are
as follows.
In Japan, in May 2007 an application for an additional
indication filed in October 2005 for the insulin secretagogue
Glufast ® as a combination therapy with alpha-glucosidase
inhibitor was approved, while in October 2007, an application for
an additional indication filed in December 2005 for Salagen® as a
therapeutic agent for dry mouth in patients with Sjögren’s
syndrome was also approved.
In April 2007, we applied for the approval of an additional
indication to Glufast ® for combination therapy with an insulin
sensitizer, jointly developed with Takeda Pharmaceuticals Co., Ltd.
Likewise, in June 2007 we applied for an additional formulation of
Urief ®, jointly developed with Daiichi Sankyo Co., Ltd.
In addition, in the fiscal year under review we progressed
through a phase II/III clinical trial for JR-0�3, a treatment for renal
anemia (gene-spliced human erythropoietin); a phase II clinical
trial for KUC-7483, a therapeutic agent for overactive bladder; and
phase I clinical trials for KGT-�68�, a treatment for diabetes.
Further, in January 2008 we entered into an agreement with
Pneuma Partners LLC, of the U.S., concerning the research,
development, and marketing in Japan of calfactant (generic name),
now under development by Pneuma as a treatment for acute
respiratory distress syndrome.
Overseas, we are aggressively developing licensing strategies for
proprietary Kissei products to create a stable overseas revenue base.
In February 2008, Watson Pharmaceuticals, Inc., of the U.S.,
one of our licensing partners, filed a new drug application for
silodosin (brand name in Japan: Urief ®) with the U.S. FDA.
Additionally, Recordati S.p.A., of Italy, is currently implementing
phase III clinical trials for the drug. In cooperation with these two
companies, we are maximizing shared data to achieve rapid and
efficient development in Europe and North America. In Asia,
Daiichi Sankyo Co., Ltd., is currently implementing phase III
clinical trials in China.
In August 2007, Elixir Pharmaceuticals Inc., of the U.S.,
commenced phase III clinical trials for mitiglinide (brand name
in Japan: Glufast ®); in June 2007, we entered a licensing agreement
with Eisai Co., Ltd., for the exclusive development and commercialization
rights to Glufast ® in ASEAN countries; and in September 2007, we
commenced another contract with Eisai for the development and
commercialization rights to Glufast ® in China. In January 2008,
we applied for approval for the drug in China.
In addition, KGT-�68�, which has been licensed out to
GlaxoSmithKline plc, of the U.K., is in phase II clinical trials for a
treatment for type 2 diabetes, while KUR-�246, licensed out to
MediciNova, Inc., of the U.S., is also in phase II clinical trials as a
treatment for status asthmatics.
Further, in July 2007 we entered into a contract with Nuon
Therapeutics Inc., of the U.S., for Tranilast (brand name in
Japan: Rizaben®), our proprietary allergic conjunctivitis treatment,
for the R&D, production, and marketing of the drug for other
areas including autoimmune disorders such as multiple sclerosis.
In other businesses, we are creating platforms from which we can
expand operations by actively investing in a range of areas, such as
the latest IT for software development.
Our R&D expenses in the fiscal year under review totaled
¥��.36 billion, or �8.5% of net sales.
Pharmaceutical Business
The Kissei Group continues to actively pursue R&D in its core
areas, particularly metabolism and endocrinology, primarily for
diabetes, and urogenital. Total R&D expenses in this business
sector in the fiscal year under review were ¥��.28 billion.
Other Businesses
Aiming to develop operations on a global scale, we have established
a development system for medical software and other package
software. In this business segment, we also continue to develop and
promote next-generation technologies. As such, R&D expenses in
the fiscal year under review totaled ¥84 million.

5 K ISSEI Annual Repor t 2008
R&D Pipeline (In-House) As of June 2008
R&D Pipeline (Out-Licensing) As of June 2008
Development Stage
Brand Name /Generic Name /Development Code Product Origin Development Company Therapeutic Target
NDA
GLUFAST® /Mitiglinide
Kissei Kissei / Takeda (Japan)(co-development)
Improvement of postprandial plasma glucose transition in patients with type 2 diabetes mellitus–combination therapy with insulin sensitizer (additional indication)
URIEF® /Silodosin
Kissei Kissei / Daiichi Sankyo (Japan)(co-development)
Dysuria associated with benign prostatic hyperplasia (BPH)(additional formulation: Tablet)
Phase II / IIIJR-013 JCR (Japan) Kissei / JCR (Japan)
(co-development)Renal anemia on dialysis
Phase IIKUC-7483 Kissei Kissei Overactive bladder
KLS-0611 Kissei Kissei Dry eye
Phase I KPS-0373 Shionogi (Japan) Kissei Spinocerebellar ataxia
DevelopmentStage
Generic Name / Development Code
LicensedCompany Territory Therapeutic Target
Approved
Silodosin / KMD-3213
Choongwae (Korea) South Korea Dysuria associated with benign prostatic hyperplasia (BPH)
Mitiglinide / KAD-1229
Hikma (Jordan) Middle East Type 2 diabetes
NDA
Silodosin / KMD-3213
Watson (U.S.) U.S., Canada, Mexico Dysuria associated with benign prostatic hyperplasia (BPH)
Mitiglinide / KAD-1229
Eisai (Japan) China a) Type 2 diabetes
ASEAN (10 countries)
Phase III
Silodosin / KMD-3213
Recordati (Italy) Europe, Middle East, Africa Dysuria associated with benign prostatic hyperplasia (BPH)
Daiichi Sankyo (Japan) China
Synmosa (Taiwan) Taiwan, Hong Kong b)
Mitiglinide / KAD-1229
Elixir (U.S.) North America, Central America, South America
Type 2 diabetes
Orient Europharma (Taiwan) Taiwan, Hong Kong b)
Phase III preparation
Mitiglinide / KAD-1229
USV (India) India b) Type 2 diabetes
Phase II
KGT-1681 GlaxoSmithKline (U.K.) Countries of the world Type 2 diabetes
KUR-1246 MediciNova (U.S.) Countries of the world, except Japan
Status asthmatics, threatened premature labor
Phase I
KGT-1681 GlaxoSmithKline (U.K.) Countries of the world Obesity
KGA-3235 Dainippon Sumitomo(Japan)
Japan Type 2 diabetes
Notes: a) Clinical studies and NDA were conducted by Kissei. b) Phase l and phase ll are not required.

6 KISSEI Annual Repor t 2008
Corporate Governance
Basic Approach to Corporate GovernanceOne of the core management challenges of the Company is to
strengthen its system of corporate governance to raise corporate value
and ensure consistent growth as a company with a clear raison d’être.
Explanation of Corporate Governance Bodies
Kissei’s Board of Directors sets basic strategies for the Company
and makes final decisions on all important matters while providing
oversight of business execution. In principle, the body convenes
once a month to engage in active debate over operations, with
priority on making prompt business decisions and increasing the
transparency of operations. There are no external board members.
The Company also has a corporate auditor system comprised of
two in-house and two external auditors. The corporate auditors
join the meetings of the Board of Directors and freely share their
opinions. One of the corporate auditors is also licensed as an
attorney to provide a special perspective on operations. Further, the
two external auditors have no special interests in the Company.
Internal Control System and Risk Management Structure
The Kissei Group operates under the management philosophy of
“Contributing to society through high-quality, innovative
pharmaceutical products,” and “Promoting public service by
company employees.” The Company’s code of conduct manual
guides employee conduct, with the aim of upholding high ethical
standards in R&D, manufacturing, and sales, activities that are
fundamental to our business as a company involved in life sciences. In
addition, Kissei has established a Compliance Committee that
provides advice to the Board of Directors to help ensure that all laws
and regulations are followed both in letter and spirit. A Compliance
Program is conducted on a regular basis and as part of this program
our “Compliance Program Manual” is continually updated with
employees receiving regular instruction on compliance issues. In
May 2006, Kissei also created a Basic Policy on Internal Controls, in
which every employee is trained. Company rules, risk management
practices, compliance issues, and other internal measures are
promoted based on this basic policy.
Internal Audits
Kissei has an independent Auditing Department that reports
directly to the president. The five-member body conducts internal
audits for each department and internal system in the Company
based on a yearly auditing plan, ensuring that all departments carry
out business activities in an appropriate manner.
Independent Auditor
Kissei regularly undergoes outside auditing by an independent
auditor. The independent auditor engages in discussions with
member of the board, finance officers, and corporate auditors,
which aid the strengthening of the corporate governance structure.
Diagram of Corporate Governance Bodies and Internal Control System
Election / Retirement Election / Retirement Election / Retirement
Board of Managing Directors
Management Committee
Audit
Election / Retirement, Audit
Audit
Audit
Report
General Meeting of Shareholders
Independent AuditorBoard of Directors14 Directors
Board of Corporate Auditors4 Corporate Auditors (2 external)
Risk Management Committee Executive in Charge of Risk Management
Compliance Committee Executive in Charge of Ethics/Environment
Auditing Department
Business Departments
CEO
Audit

7 K ISSEI Annual Repor t 2008
Corporate Social Responsibility (CSR)
The Kissei Group’s management philosophy is “to contribute to
society through high-quality, innovative pharmaceutical products”
and “to promote public service by company employees.” This
philosophy has served as the starting point for our CSR-centered
management since the Company was founded. In addition to
maintaining systems to promote CSR throughout the Group, we are
further broadening the scope of our CSR initiatives.
Compliance InitiativesAll of our employees are expected to act in accordance with societal
and corporate ethics. The Company believes this enhances our
products’ brand power and image, and improves corporate value and
the bonds of trust we share with our stakeholders.
The Company has developed its basic principles for employee
behavior from the perspective of maintaining CSR-based management.
In �999, we created the “Kissei Pharmaceuticals Code of Conduct”
to guide employee behavior; and in 200� we published the first version
of the “Kissei Pharmaceuticals Compliance Program Manual.”
The Code of Conduct and the Compliance Program Manual were
created to ensure that employees adhere to newly enacted laws and
regulations and that their behavior reflects environmental changes
both within and outside the Company. In April 2007, we published the
third revised edition of the manual, which is distributed to all Group
employees to provide practical guidance on compliance matters.
Consideration for SocietyAs a responsible corporate citizen, we place great importance on our
relations with local communities and society at large. We actively
participate in and contribute to the lives of the people in our local
communities through participation in cultural, medical treatment,
health, welfare, environmental, and sports activities. One example is
the Saito Kinen Festival, a global music festival held each fall in the
town of Matsumoto, in Nagano Prefecture. We have been the festival’s
main sponsor since it began in �992.
We also sponsor multifaceted research into the causes, prevention,
diagnosis, and treatment of a range of conditions affecting women
of reproductive age, particularly in the perinatal period, as well as
conditions affecting middle-aged and elderly women.
Our goal is to contribute to the improved health and welfare of
the people of Japan by helping to develop new medical treatments
and the medical profession itself. To this end, we established the
Kanzawa Medical Research Foundation in �997 to promote and
provide support for excellence in medical research.
Consideration for CustomersWe have established a Product Customer Service Center to respond
to inquiries not only from medical professionals, such as doctors
and pharmacists, but also from patients and their families.
Further, from October 2006 we introduced our Safety Information
Providing System, which enables our medical representatives (MR),
essentially product information specialists, to provide product safety
information directly to relevant medical staff via portable devices. It
allows us to rapidly provide safety information to ensure all our
pharmaceuticals are used safely and correctly.
Consideration for EmployeesOur fundamental philosophy toward our employees is based on our
vision of “mutually respecting different philosophies and values,
and providing a stimulating working environment to help build a
dynamic and creative company.”
We strive to maintain an ideal workplace, such as through
appropriate systems for recruitment, work, and managing employees,
and have introduced work systems that enable employees to choose
a way of working best suited to their situation and life plan. In many
divisions and departments, we have introduced various flexible work
hour systems, such as an imputed working hour system and flextime.
Our goal is to create a working environment that allows all of our
employees to fully utilize their abilities.
Consideration for the EnvironmentOur basic environment policy is based on the following fundamental
company goal: “As a drug discovery company that aims to ensure
the future health of people around the world, we will actively work
to preserve the environment as part of our corporate social
responsibilities and contribute to realizing an affluent and comfortable
society.” To help achieve this goal, we strive to minimize the impact
of all our activities on the environment.
As part of a series of environmental initiatives, we have steadily
increased the number of our locations with accreditation for
environmentally friendly workplace policies. In 2000, we received
ISO �400� accreditation for environment management systems at
our company head office, Matsumoto and Shiojiri plants, and
Nutritional Business Center. We subsequently obtained accreditation
for our Tokyo head office and Toxicological Laboratories.
In September 2007, we also acquired ISO �400� accreditation for our
Central Research Laboratories and Pharmaceutical Laboratories.

8 KISSEI Annual Repor t 2008
Financial Review
Financial PositionAs of the end of the fiscal year ended March 3�, 2008, total assets had
decreased 8.0% year on year, or ¥�3.02 billion, to ¥�50.57 billion.
Current assets fell ¥8.�6 billion, to ¥85.56 billion, primarily due to a
decrease in cash on hand and in banks and notes and accounts
receivable. Investments and advances were down ��.�% year on year,
to ¥30.34 billion, which can mainly be attributed to a decrease in
investments in securities due to a fall in the market value of shares
accompanying the decline of the stock market. Property, plant and
equipment was largely unchanged, falling 3.4%, to ¥29.59 billion.
Total liabilities at the fiscal year-end had fallen 2�.2% year on year, or
¥8.56 billion, to ¥3�.79 billion. Current liabilities increased ¥5.27 billion,
to ¥26.42 billion, as a decrease in notes and accounts payable was offset
by a change in classification from fixed to current liabilities for a ¥�2.09
billion portion of the second unsecured convertible bonds that became
redeemable within the fiscal year. Fixed liabilities decreased ¥�3.83 billion,
to ¥5.38 billion. This was principally due to the reclassification of
convertible bonds from fixed to current liabilities and to a decrease in
deferred tax liabilities, non-current.
Net assets at the fiscal year-end were down 3.6%, or ¥4.46 billion,
to ¥��8.78 billion. This was due to an increase in retained earnings
that failed to offset a decrease in unrealized holding gains on securities.
As a result, the shareholders’ equity ratio increased from 75.3% at
the end of the previous fiscal year to 78.8%.
Financial ResultsConsolidated net sales in the fiscal year under review were down 4.3%,
to ¥6�.48 billion. The majority of this total was provided by the Kissei
Group’s core pharmaceutical business, which registered strong gains
for sales of its new drugs Urief ®, Glufast ®, and Salagen®, as well as an
increase in licensing fee royalties received. However, these gains were
absorbed by various factors, including the termination of our contract
to market the FreeStyle®Kissei portable blood glucose monitoring
system from September 2006; a substantial fall in sales of the Parkinson’s
disease treatment Cabaser ®, following revisions to its package insert
from April 2007; and a decrease in sales due to the effect of generic and
competing drugs. As a result, sales declined �.5% year on year, or ¥0.8�
billion, to ¥54.77 billion.
In other businesses, strong sales were recorded in information services
operations, but sales declined in retail operations and construction
project operations. Consequently, other business sales fell 22.3%, or
¥�.92 billion, to ¥6.7� billion.
In the pharmaceutical business, the cost of sales as a percentage of
segment sales decreased 5.7 percentage points because of changes to
the composition of segment sales for products, an increase in licensing
fees, a reduction in fixed manufacturing costs, and heightened
production efficiency associated with the production of new products.
In addition, in other businesses the cost of sales as a percentage of
segment sales fell 3.5 percentage points, and consequently the overall
cost of sales as a percentage of segment sales declined 6.5 percentage
points year on year. As a result, gross profit increased 6.9% year on
year, or ¥2.49 billion, to ¥ 38.68 billion.
SG&A expenses increased due to higher research and development
expenses, primarily related to increases in R&D costs and depreciation
accompanying new facilities coming on-line.
Cost of sales edged down slightly, despite continued investment in
the launch of additional indications for Urief®, Glufast®, and Salagen®.
Expenses relating to contract medical representatives were reduced
and other costs cut through increased efficiency. As a result, operating
income increased 6�.4%, or ¥�.62 billion, to ¥4.27 billion.
Other income decreased ¥326 million year on year, to ¥20� million,
as increases to interest in interest and dividend income and a recording
of disposition of sales information was counteracted by a write-down
of investments in securities and decreases in gain on sale of investments
in securities and other, net.
As a result, income before income taxes and minority interests
increased 40.9%, year on year, or ¥�.30 billion, to ¥4.47 billion, and net
income increased 48.�%, or ¥0.76 billion, to ¥2.33 billion.
Basic Policy on the Distribution of Profits/ Dividends for the Fiscal Year Under Review and the Current Fiscal YearThe Company aims to secure a solid management base while providing
stable, sustainable returns to investors through cash dividends. While
working to make efficient use of capital, we consider paying fair
dividends to shareholders in accordance with profit levels to be a key
management issue.
The Company’s basic dividend policy is twice-yearly dividend
payments, comprised of interim and year-end dividends. The amount
of the interim dividend is decided by the Board of Directors, while the
amount of the year-end dividend is decided at the General Meeting
of Shareholders. Also, as stipulated by the Company’s Articles of
Incorporation, the interim dividend payment date is established by
resolution of the Board of Directors on September 30 of each fiscal year.
Giving the highest priority to increasing shareholder value, we
will acquire and dispose of treasury stock flexibly, and as necessary, in
accordance with operational developments, and by resolution of the
Board of Directors.
Internal funds are maintained to respond to expected changes in
government policy, system reforms, and the challenges of increasing
globalization. At the same time, we will actively invest in R&D to
develop drugs that people need. We believe this policy will not only
generate profits in the future, but also enable us to return profits to
our shareholders through appropriate dividend payments.
For the fiscal year under review, ended March 3�, 2008, we
distributed a year-end dividend of ¥�4.0 per share. Together with the
interim dividend of ¥�4.0 per share, this gives a total cash dividend for
the year of ¥28.0 per share.
In the current fiscal year, ending March 3�, 2009, we plan a special
dividend of ¥2.0 per share, split equally between the interim and year-
end dividend, to commemorate the 20th anniversary of the Company’s
listing on Tokyo Stock Exchange. Consequently, both the interim cash
dividend and year-end cash dividend will be ¥�5.0 per share,
comprised of an ordinary cash dividend of ¥�4.0 per share and a
commemorative dividend of ¥�.0 per share, giving a full-year dividend
of ¥30.0 per share.

9 K ISSEI Annual Repor t 2008
Risk Factors
The following risk factors could potentially affect the Kissei Group’s
operating results and financial position. Forward-looking statements
are based on the judgments the Group has made from consolidated
financial statements for the end of the current fiscal year under review.
1. R&DThe process of developing pharmaceuticals — from the R&D stage
to approval and sales — requires large investments of both time
and funds. When developing new drugs, the chances of discovering
beneficial indications are limited. In addition, the Company can
guarantee neither that a new drug undergoing development or an
additional indication will have its intended benefit nor predict
when the drugs will be approved.
2. Government PolicyThe prices of pharmaceuticals in Japan are set based on the
government’s NHI drug price standards. Generally, the prices are
revised biannually. There may be revisions or other changes to the
medical insurance system in Japan that go beyond the Company’s
forecast, such as the introduction of diagnosis procedure combinations
or the promotion of generic drugs, which would negatively impact
the Company’s operating results and financial position.
3. Competition with Other Companies’ ProductsThe Group faces competition from companies selling products
with the same application. In addition, once a patent expires,
price competition with generic products of the same composition
intensifies. This competition could have a serious impact on the
sales of existing drugs.
4. Unexpected Side-Effect RisksThere is a risk that a pharmaceutical may produce an unexpected
side effect that was undiscovered at the R&D stage. If unforeseen
side effects or serious adverse events occur, the use of a drug may
be limited, or sales of the drug may be terminated completely.
5. Manufacturing and ProcurementMalfunctions with production equipment or the inability to procure
raw materials in a timely fashion could delay or shut down drug
manufacturing. In addition, a quality problem may cause a drug to
be recalled, which would negatively impact the Company’s operating
results and financial position.
6. Intellectual Property RisksIn the event that the Kissei Group is unable to appropriately protect
its intellectual property, a third party may be able to use the Kissei
Group’s technology, which would undermine its competitive
superiority in the market.
7. Legal RisksAt present, there are no outstanding legal problems affecting the
Kissei Group’s management. There is the possibility, however,
that in the course of its business activities, the Kissei Group could
face lawsuits in the future both at home and abroad regarding
patent, product liability, environment, and labor matters.
8. Environmental ConservationPharmaceutical chemical substances used in research and manufacturing
processing could have an impact on the environment. Every department
and work site in the Group is working diligently to follow stringent
substance management rules and protect the environment. However,
if chemical substances were found to have polluted areas around a
work site, legal action may be taken against the work site, and the
Company may be faced with large costs to restore the environment,
which would negatively impact the Company’s operating results
and financial position.
9. Information ManagementThe Group is paying close attention to the need to protect
information by establishing strict rules for the management of
personal and confidential information as well as providing education
on this issue to employees. However, if an unexpected incident occurred
in which information was improperly disclosed, the Group’s image
may be tarnished, which would negatively impact the Company’s
operating results and financial position.
Besides the risk factors mentioned above, there are various
other risks.

10 KISSEI Annual Repor t 2008
Financial SummaryKissei Pharmaceutical Co., Ltd. and its subsidiaries Years ended March 31
’06 ’07 ’08’04 ’05
Billions of Yen
0
20
40
60
80
Net Sales
’06 ’07 ’08’04 ’05
Billions of Yen
Operating Income and Operating Income Margin
0
2.0
4.0
6.0
8.0
0
3.0
6.0
9.0
12.0
Operating IncomeOperating Income Margin
%
’06 ’07 ’08’04 ’05
Billions of Yen
Net Income and Return on Sales
0
2.0
4.0
6.0
0
4.0
8.0
12.0
Net IncomeReturn on Sales
%
’06 ’07 ’08’04 ’05
Yen Yen
Net Income per Share and Net Assets per Share
0
30
60
90
120
150
0
500
1,000
1,500
2,000
2,500
Net Income per ShareNet Assets per Share
Thousands of U.S. Dollars Except Millions of Yen Excet per Share Data per Share Data1
1998 1999 2000 2001 2002 2003 2004 2005 2006 2007 2008 2008
Net Sales ¥ 56,687 ¥ 55,974 ¥ 57,029 ¥ 58,937 ¥ 59,929 ¥ 59,529 ¥ 58,226 ¥ 60,933 ¥ 64,008 ¥ 64,216 ¥ 61,481 $ 614,810 Gross Profit 40,786 39,854 41,147 41,847 40,534 39,636 36,869 37,407 35,726 36,197 38,680 386,800 Operating Income 13,038 11,545 12,571 9,786 6,958 6,073 6,210 5,517 1,877 2,646 4,270 42,700 Net Income 5,439 5,334 5,724 4,383 4,837 2,231 5,600 4,735 2,045 1,570 2,326 23,260 Total Assets 137,353 138,934 146,649 149,189 155,740 151,582 162,842 164,944 174,115 163,584 150,566 1,505,660 Total Net Assets 92,778 97,234 105,437 108,017 109,832 108,636 116,266 120,086 124,260 123,232 118,775 1,187,750 Per Share (Yen and Dollars): Net Income2 : Primary ¥93.3 ¥91.5 ¥98.2 ¥76.0 ¥84.9 ¥39.4 ¥101.8 ¥86.5 ¥37.3 ¥28.9 ¥42.9 $0.429 Fully-Diluted 83.0 82.0 88.4 68.8 76.5 35.8 88.7 75.5 33.5 27.1 40.2 0.402 Cash Dividends 14.0 15.0 14.0 14.0 14.0 14.0 17.0 20.0 24.0 28.0 28.0 0.280
R&D Expenses ¥8,873 ¥9,284 ¥9,231 ¥11,517 ¥13,045 ¥13,074 ¥9,826 ¥9,893 ¥10,574 ¥10,473 ¥11,361 $113,610 (% of Net Sales) 15.7% 16.6% 16.2% 19.5% 21.8% 22.0% 16.9% 16.2% 16.5% 16.3% 18.5% Capital Investment 1,244 1,341 1,474 2,081 1,216 1,292 1,818 1,660 2,284 3,954 2,460 24,600 Current Ratio 514.0% 561.2% 589.1% 653.8% 488.2% 567.3% 498.1% 512.4% 342.3% 443.2% 323.9% Return on Equity 6.0% 5.6% 5.7% 4.1% 4.4% 2.0% 5.0% 4.0% 1.7% 1.3% 1.9% Return on Assets 3.9% 3.9% 4.0% 3.0% 3.2% 1.5% 3.6% 2.9% 1.2% 0.9% 1.5%
Number of Shares Issued (Thousands) 58,279 58,279 58,279 57,295 56,795 56,795 56,795 56,795 56,795 56,796 56,839 Number of Employees 1,697 1,663 1,630 1,616 1,632 1,665 1,677 1,686 1,759 1,777 1,844
Note: Figures shown above were extracted from financial statements published in the respective years and the retrospective adjustments for the changes in accounting policies and adoption of new accounting standards incurred in the later years have not been reflected. 1. U.S. dollar amounts are translated at the rate of ¥100=U.S.$1, the approximate effective rate of exchange at March 31, 2008. 2. Net income per share is computed based on the weighted average number of shares of common stock after subtracting the weighted average number of shares of treasury stock for the year.

11 K ISSEI Annual Repor t 2008
’06 ’07 ’08’04 ’05
Billions of Yen
R&D Expenses
0
5.0
10.0
15.0
0
10
20
30
R&D Expenses% of Net Sales
%
’06 ’07 ’08’04 ’05
Billions of Yen
Total Assets and Total Net Assets
0
60
120
180
Total AssetsTotal Net Assets
’06 ’07 ’08’04 ’05
%
0
2.0
4.0
6.0
ROEROA
ROE and ROA
’06 ’07 ’08’04 ’05
%
0
20
40
80
60
100
Equity Ratio
Thousands of U.S. Dollars Except Millions of Yen Excet per Share Data per Share Data1
1998 1999 2000 2001 2002 2003 2004 2005 2006 2007 2008 2008
Net Sales ¥ 56,687 ¥ 55,974 ¥ 57,029 ¥ 58,937 ¥ 59,929 ¥ 59,529 ¥ 58,226 ¥ 60,933 ¥ 64,008 ¥ 64,216 ¥ 61,481 $ 614,810 Gross Profit 40,786 39,854 41,147 41,847 40,534 39,636 36,869 37,407 35,726 36,197 38,680 386,800 Operating Income 13,038 11,545 12,571 9,786 6,958 6,073 6,210 5,517 1,877 2,646 4,270 42,700 Net Income 5,439 5,334 5,724 4,383 4,837 2,231 5,600 4,735 2,045 1,570 2,326 23,260 Total Assets 137,353 138,934 146,649 149,189 155,740 151,582 162,842 164,944 174,115 163,584 150,566 1,505,660 Total Net Assets 92,778 97,234 105,437 108,017 109,832 108,636 116,266 120,086 124,260 123,232 118,775 1,187,750 Per Share (Yen and Dollars): Net Income2 : Primary ¥93.3 ¥91.5 ¥98.2 ¥76.0 ¥84.9 ¥39.4 ¥101.8 ¥86.5 ¥37.3 ¥28.9 ¥42.9 $0.429 Fully-Diluted 83.0 82.0 88.4 68.8 76.5 35.8 88.7 75.5 33.5 27.1 40.2 0.402 Cash Dividends 14.0 15.0 14.0 14.0 14.0 14.0 17.0 20.0 24.0 28.0 28.0 0.280
R&D Expenses ¥8,873 ¥9,284 ¥9,231 ¥11,517 ¥13,045 ¥13,074 ¥9,826 ¥9,893 ¥10,574 ¥10,473 ¥11,361 $113,610 (% of Net Sales) 15.7% 16.6% 16.2% 19.5% 21.8% 22.0% 16.9% 16.2% 16.5% 16.3% 18.5% Capital Investment 1,244 1,341 1,474 2,081 1,216 1,292 1,818 1,660 2,284 3,954 2,460 24,600 Current Ratio 514.0% 561.2% 589.1% 653.8% 488.2% 567.3% 498.1% 512.4% 342.3% 443.2% 323.9% Return on Equity 6.0% 5.6% 5.7% 4.1% 4.4% 2.0% 5.0% 4.0% 1.7% 1.3% 1.9% Return on Assets 3.9% 3.9% 4.0% 3.0% 3.2% 1.5% 3.6% 2.9% 1.2% 0.9% 1.5%
Number of Shares Issued (Thousands) 58,279 58,279 58,279 57,295 56,795 56,795 56,795 56,795 56,795 56,796 56,839 Number of Employees 1,697 1,663 1,630 1,616 1,632 1,665 1,677 1,686 1,759 1,777 1,844
Note: Figures shown above were extracted from financial statements published in the respective years and the retrospective adjustments for the changes in accounting policies and adoption of new accounting standards incurred in the later years have not been reflected. 1. U.S. dollar amounts are translated at the rate of ¥100=U.S.$1, the approximate effective rate of exchange at March 31, 2008. 2. Net income per share is computed based on the weighted average number of shares of common stock after subtracting the weighted average number of shares of treasury stock for the year.

12 KISSEI Annual Repor t 2008
Consolidated Balance Sheets Kissei Pharmaceutical Co., Ltd. and its subsidiariesAt March 31, 2007 and 2008 Thousands of U.S. Dollars Millions of Yen (Note 3)
Assets 2007 2008 2008
Current Assets: Cash on hand and in banks (Note 4) ¥ 33,480 ¥ 12,067 $ 120,670 Short-term investments in specified trusts 2,717 2,275 22,750 Marketable securities (Note 4 and 5) 14,143 33,882 338,820 Notes and accounts receivable 27,990 23,420 234,200 Less: allowance for doubtful accounts (52) (82) (820) 27,938 23,338 233,380 Inventories (Note 6) 10,877 10,120 101,200 Deferred tax assets – current (Note 9) 1,880 1,914 19,140 Other current assets 2,685 1,962 19,620 Total current assets 93,720 85,558 855,580
Investments and Advances: Investments in securities (Note 5) 30,921 26,789 267,890 Investments in unconsolidated subsidiaries 958 928 9,280 Leasehold deposits and guarantee deposits 451 434 4,340 Other investments and advances 1,804 2,191 21,910 Total investments and advances 34,134 30,342 303,420
Property, Plant and Equipment (Note 2): Buildings and structures 33,878 35,112 351,120 Machinery and equipment 11,910 13,488 134,880 45,788 48,600 486,000 Less: accumulated depreciation (30,414) (32,534) (325,340) 15,374 16,066 160,660 Land 13,402 13,441 134,410 Construction in progress 1,854 79 790 Total property, plant and equipment 30,630 29,586 295,860
Other Assets: Deferred tax assets – non-current (Note 9) 372 1,666 16,660 Deferred charges and other 4,728 3,414 34,140
Total assets ¥163,584 ¥150,566 $1,505,660
The accompanying notes are an integral part of these statements.

13 K ISSEI Annual Repor t 2008
Thousands of U.S. Dollars Millions of Yen (Note 3)
Liabilities and Shareholders' Equity 2007 2008 2008
Current Liabilities: Short-term bank loans (Note 7) ¥ 2,470 ¥ 2,270 $ 22,700 Current portion of long-term debt (Note 7) 24 12,154 121,540 Notes and payables: Trade 9,549 4,352 43,520 Other 3,804 2,763 27,630 13,353 7,115 71,150 Income taxes payable (Note 9) 1,212 1,137 11,370 Accrued expenses and bonuses to employees 1,867 2,210 22,100 Reserve for sales returns 20 24 240 Reserve for sales rebates 591 577 5,770 Reserve for sales promotion expenses 281 247 2,470 Other current liabilities 1,329 681 6,810 Total current liabilities 21,147 26,415 264,150
Long-Term Liabilities Long-term debt (Note 7) 12,274 405 4,050 Accrued retirement benefits to employees (Note 10) 3,455 3,385 33,850 Accrued retirement benefits to directors and corporate auditors 1,448 1,586 15,860 Deferred tax liabilities – non-current (Note 9) 2,027 — — Total liabilities 40,351 31,791 317,910
Commitments and Contingent Liabilities (Note 11)
Net Assets (Note 2): Common stock: Authorized: 227,000,000 shares Issued: 56,796,454 shares and 56,838,791 shares at March 31, 2007 and 2008, respectively 24,221 24,271 242,710 Additional paid-in capital 24,114 24,165 241,650 Retained earnings 71,528 72,407 724,070 Treasury stock (2,539,319 shares and 2,579,849 shares at March 31, 2007and 2008) (4,119) (4,208) (42,080) Total shareholders’ equity 115,744 116,635 1,166,350 Valuation, translation adjustments and others: Unrealized holding gains on securities 7,357 1,986 19,860 Total valuation, translation adjustments and others 7,357 1,986 19,860 Minority interests in consolidated subsidiaries 131 154 1,540 Total net assets 123,232 118,775 1,187,750 Total liabilities and net assets ¥163,584 ¥150,566 $1,505,660

14 KISSEI Annual Repor t 2008
Thousands of U.S. Dollars Millions of Yen (Note 3)
2006 2007 2008 2008
Net Sales ¥64,008 ¥64,216 ¥61,481 $614,810 Cost of Sales 28,282 28,019 22,801 228,010 Gross profit 35,726 36,197 38,680 386,800
Selling, General and Administrative Expenses (Note 14) 33,849 33,551 34,410 344,100 Operating income 1,877 2,646 4,270 42,700
Other Income (expenses): Interest and dividend income 387 555 713 7,130 Interest expense (214) (177) (159) (1,590) Loss on sale or disposal of properties (34) (40) (384) (3,840) Gain on sale of marketable securities 70 35 5 50 Income from investments in partnerships — — 156 1,560 Gain on sales of fixed assets — — 19 190 Gain on sale of investments in securities 1,330 1,049 361 3,610 Disposition of sales information — — 571 5,710 Holding gains and losses for specified money in trust 680 (224) (586) (5,860) Write-down of investments in securities (3) (240) (268) (2,680) Loss on disposal of inventories — (306) (141) (1,410) Loss from investments in partnerships (67) — — — Impairment loss on fixed assets (Note 15) (258) — — — Stipulated compensation (Note 16) (148) — — — Loss on disposal of merchandise (Note 17) — (52) — — Extraordinary contribution on withdrawal from pension fund (Note 18) — (64) — — Evaluation loss in affiliates’ investments — — (86) (860) Other, net (33) (9) 0 0 1,710 527 201 2,010 Income before income taxes and minority interests 3,587 3,173 4,471 44,710
Income Taxes (Note 9): Current 1,420 1,787 1,839 18,390 Deferred 120 (221) 284 2,840 1,540 1,566 2,123 21,230 Minority Interests (2) (37) (22) (220) Net income ¥ 2,045 ¥ 1,570 ¥ 2,326 $ 23,260
U.S. Dollars Yen (Note 3)
Per Share (Note 2): Net income: Primary ¥37.3 ¥28.9 ¥42.9 $0.429 Fully-diluted 33.5 27.1 40.2 0.402 Cash dividends 24.0 28.0 28.0 0.280
The accompanying notes are an integral part of these statements.
Consolidated Statements of Income Kissei Pharmaceutical Co., Ltd. and its subsidiariesFor the years ended March 31, 2006, 2007 and 2008

15 K ISSEI Annual Repor t 2008
Millions of Yen
Number of Unrealized Minority shares of Additional holding interests in common Common paid-in Retained gains on Treasury consolidated stock stock capital earnings securities stock subsidiaries
Balance at March 31, 2005 56,795,185 ¥24,220 ¥24,112 ¥71,344 ¥ 4,391 ¥(3,981) ¥ 93 Net income for the year — — — 2,045 — — — Cash dividends paid — — — (1,195) — — — Bonuses to directors and corporate auditors — — — (35) — — — Reduction due to change in scope of consolidation — — — (771) — — — Treasury stock purchased (36,900 shares) — — — — — (79) – Unrealized holding gains on securities — — — — 4,209 — — Gain on sale of treasury stock (1,542 shares) — — 0 — — — — Increase in minority interests — — — — — — 2 Balance at March 31, 2006 56,795,185 24,220 24,112 71,388 8,600 (4,060) 95 Net income for the year — — — 1,570 — — — Cash dividends paid — — — (1,411) — — — Bonuses to directors and corporate auditors — — — (19) — — — Execution of convertible bonds* 1,269 1 1 — — — — Treasury stock purchased (29,012 shares) — — — — — (59) — Unrealized holding gains on securities — — — — (1,243) — — Gain on sale of treasury stock (558 shares) — — 1 — — — — Increase in minority interests — — — — — — 36 Balance at March 31, 2007 56,796,454 24,221 24,114 71,528 7,357 (4,119) 131 Net income for the year — — — 2,326 — — — Cash dividends paid — — — (1,519) — — — Bonuses to directors and corporate auditors — — — — — — — Execution of convertible bonds* 42,337 50 50 — — — — Treasury stock purchased (41,103 shares) — — — — — (90) — Unrealized holding gains on securities — — — — (5,371) — — Gain on sale of treasury stock (573 shares) — — 1 — — 1 — Increase due to merger — — — 73 — — — Increase in minority interests — — — — — — 23 Balance at March 31, 2008 56,838,791 ¥24,271 ¥24,165 ¥72,408 ¥ 1,986 ¥(4,208) ¥154
Thousands of U.S. Dollars (Note 3)
Number of Unrealized Minority shares of Additional holding interests in common Common paid-in Retained gains on Treasury consolidated stock stock capital earnings securities stock subsidiaries
Balance at March 31, 2007 56,796,454 $242,210 $241,140 $715,280 $73,570 $(41,190) $1,310 Net income for the year — — — 23,260 — — — Cash dividends paid — — — (15,190) — — — Bonuses to directors and corporate auditors — — — — — — — Execution of convertible bonds* 42,337 500 500 — — — — Treasury stock purchased — — — — — (900) — Unrealized holding gains on securities — — — — (53,710) — — Gain on sale of treasury stock — — 10 — — 10 — Increase due to merger — — — 730 — — — Increase in minority interests — — — — — — 230 Balance at March 31, 2008 56,838,791 $242,710 $241,650 $724,080 $19,860 $(42,080) $1,540
The accompanying notes are an integral part of these statements. * Execution of No.1 Convertible Corporate Bonds, face value ¥3 million, each item recorded an increase of the amounts below.
Shares issued 42,337 Common stock ¥49,999,997 Additional paid-in capital ¥50,337,625
Consolidated Statements of Changes in Net Assets Kissei Pharmaceutical Co., Ltd. and its subsidiariesFor the years ended March 31, 2006, 2007 and 2008

16 KISSEI Annual Repor t 2008
Consolidated Statements of Cash Flows Kissei Pharmaceutical Co., Ltd. and its subsidiariesFor the years ended March 31, 2006, 2007 and 2008 Thousands of U.S. Dollars Millions of Yen (Note 3)
2006 2007 2008 2008
Cash Flows from Operating Activities: Income before income taxes and minority interests ¥ 3,587 ¥ 3,173 ¥ 4,471 $ 44,710 Depreciation and amortization 3,138 3,229 3,863 38,630 Impairment loss on fixed assets 258 — — — Change in allowance reserves (59) (96) 396 3,960 Interest and dividend income (387) (555) (713) (7,130) Interest expense 214 177 159 1,590 Foreign exchange (gain) loss (33) (0) 6 60 Gain from sale of securities (1,400) (35) (5) (50) (Gain) loss from evaluation of securities (680) 224 586 5,860 Loss on sales of property, plant and equipment — — (19) (190) Disposition of sales information — — (571) (5,710) Loss from evaluation of investment securities 3 240 268 2,680 Evaluation loss in affiliates’ investments — — 86 860 Loss on sale or disposal of properties 11 12 374 3,740 Loss on sale of investments in securities — (1,049) (362) (3,620) Increase (decrease) in notes and accounts receivable 1,332 (2,795) 4,719 47,190 (Increase) decrease in inventories (2,516) 1,786 757 7,570 (Increase) decrease in other current assets (19) 138 984 9,840 (Decrease) increase in notes and accounts payable (74) 413 (5,196) (51,960) Increase (decrease) in other current liabilities 1,538 (267) (1,956) (19,560) Bonuses to directors and corporate auditors (36) (20) — — Other cash flows from operating activities, net 80 (2) (144) (1,440) Sub total 4,957 4,573 7,703 77,030 Receipt of interest and dividends 347 515 676 6,760 Payment of interest (214) (178) (161) (1,610) Payment of income taxes (2,019) (951) (1,912) (19,120) Net cash provided by operating activities 3,071 3,959 6,306 63,060 Cash Flows from Investing Activities: Increase in time deposits (79) (70) (102) (1,020) Decrease in time deposits 78 79 97 970 Reduction of investments in specified trusts 833 119 89 890 Acquisition of investments in specified trusts — — (200) (2,000) Purchase of securities (627) (528) — — Proceeds from sales of marketable securities 1,451 8,247 3,600 36,000 Acquisition of property and equipment (2,364) (3,954) (2,546) (25,460) Proceeds from sales of property and equipment 43 7 114 1,140 Proceeds from subsidies received from the government — — 160 1,600 Purchase of intangible assets (725) (1,326) (316) (3,160) Acquisition of investments in securities (3,172) (3,374) (5,607) (56,070) Proceeds from sales of investments in securities 3,181 2,440 1,069 10,690 Payments for loans (141) (166) (245) (2,450) Collection of loans 163 163 265 2,650 Long-term advance payment costs (8) (11) (11) (110) Proceeds from disposition of sales information — — 571 5,710 Other cash flows from investing activities, net (203) (32) 7 70 Net cash (used in) provided by investing activities (1,570) 1,594 (3,055) (30,550) Cash Flow from Financing Activities: Increase in short-term bank loans 2,030 1,560 590 5,900 Repayment of short-term bank loans (2,205) (1,730) (790) (7,900) Increase in long-term debt — — 400 4,000 Repayment of long-term debt (41) (26) (40) (400) Cash dividends paid by the Company (1,195) (1,411) (1,519) (15,190) Payments on redemption of convertible notes — (9,583) — — Treasury stock purchase (82) (60) (90) (900) Treasury stock sale 3 4 1 10 Net cash used in financing activities (1,490) (11,246) (1,448) (14,480) Effect of exchange rate changes on cash and cash equivalents 33 0 (6) (60) Increase (decrease) in cash and cash equivalents 43 (5,693) 1,798 17,980 Cash and cash equivalents at beginning of year (Note 4) 48,983 49,647 43,954 439,540 Receipts of cash and cash equivalents from merger — — — — Receipts of cash and cash equivalents due to change in scope of consolidation 621 — 122 1,220 Cash and cash equivalents at end of year (Note 4) ¥49,647 ¥ 43,954 ¥45,874 $458,740
The accompanying notes are an integral part of these statements.

17 K ISSEI Annual Repor t 2008
Notes to the Consolidated Financial Statements Kissei Pharmaceutical Co., Ltd. and its subsidiaries
1. Basis of Presenting the Consolidated Financial Statements
The accompanying consolidated financial statements of Kissei
Pharmaceutical Co., Ltd. (the “Company”) and its subsidiaries (the
“Companies”) are prepared on the basis of accounting principles
generally accepted in Japan, which are different in certain respects
as to application and disclosure requirements of International
Financial Reporting Standards, and are compiled from the consoli-
dated financial statements prepared by the Company as required by
Financial Instrument and Exchange Low.
2. Summary of Significant Accounting Policies(1) Scope of ConsolidationThe number of subsidiaries the Company had for the years ended
March 31, 2007 and 2008 were nine and eight, respectively, of which
three were consolidated in the respective years. The significant
subsidiaries which have been consolidated with the Company are
listed below:
Consolidated Forecast Millions of Yen Equity ownership Name of subsidiaries percentage Paid-in capital
Kissei Shoji Co., Ltd. 100 % ¥ 50 millionKissei Comtec Co., Ltd. 84 334 millionHashiba Technos Co., Ltd. 100 45 million
* On April 1, 2007, consolidated subsidiary Hashiba 920 Co., Ltd.,
merged with non-consolidated subsidiary Kissei Technos Co., Ltd.,
and the surviving company’s corporate name was changed to
Hashiba Technos Co., Ltd.
(2) Consolidation and EliminationIn preparing the accompanying consolidated financial statements,
all significant inter-company transactions, account balances and
unrealized profits between the Companies have been eliminated,
and the portion thereof attributable to minority interests is charged
to minority interests.
In eliminating investments in the common stock of the consoli-
dated subsidiaries against the underlying equity in the net assets of
the subsidiaries, differences between the cost of the investments and
the underlying equity in net assets were not recognized for the three
years ended March 31, 2008.
(3) Investments in Non-consolidated Subsidiaries and Affiliates
Investments in unconsolidated subsidiaries and affiliates are carried
at cost, cost being determined by the moving average method, as
there would be no significant effect on consolidated net income if
they were accounted for by the equity method.
(4) Valuation of SecuritiesHeld-to-maturity debt securities are carried at amortized cost.
Marketable securities classified as other securities are carried at
fair value as of the balance sheet date with changes in unrealized
holding gain or loss, net of the applicable income taxes, included
directly in net assets. The cost of securities sold is primarily deter-
mined by the moving average method.
Non-marketable securities classified as other securities are stated
at cost primarily determined by the moving average method.
Specified money in trust is stated at market value.
(5) Inventory ValuationInventories are stated at cost, cost being determined by the average
method.
(6) Property, Plant and EquipmentDepreciation is computed on the declining-balance method at rates
based on the estimated useful lives of assets. The range of useful
lives is principally from 3 to 50 years for buildings and structures.
Depreciation for buildings (excluding leasehold improvements
and auxiliary facilities attached to buildings) acquired on or after
April 1, 1998 is computed on the straight-line method.
In accordance with the revision made to the Corporate Tax Law
of Japan (the “Tax Law”) which went into effect on April 1, 2007,
effective the year ended March 31, 2008, the Company and consoli-
dated subsidiaries have adopted the new method prescribed in the
revised Tax Law for depreciating property, plant and equipment
acquired on or after April 1, 2007. The effect of this change on the
consolidated financial statements for the year ended March 31, 2008
was immaterial.
In addition to the above adoption, effective the year ended March
31, 2008, these companies depreciate the difference between 5% of
acquisition cost and nominal value by the straight-line method over
a period of five years from the year following the year in which the
accumulated depreciation has reached 95% of acquisition cost with
respect to property, plant and equipment acquired on or before
March 31, 2007. The effect of this change on the consolidated finan-
cial statements for the year ended March 31, 2008 was immaterial.
The cost of property and equipment retired or otherwise dis-
posed of and accumulated depreciation in respect thereof are
eliminated from the related accounts, and the resulting gain or loss
is charged to income.
Normal repairs and maintenance, including minor renewals and
improvements, are charged to income as incurred.
(7) AmortizationAmortization of intangible assets and deferred charges included in
“Other Assets” is computed on the straight-line method over
respective periods as prescribed by Japanese tax laws.
Software costs for internal use are amortized over their expected
useful lives (mainly 5 years) on a straight-line basis.
Research and development costs incurred for specific projects, in
search of new products and new technology, are recognized as an
expense when incurred.
(8) Accounting for Consumption TaxConsumption tax is imposed at the flat rate of 5% on all domestic
consumption of goods and services (with certain exemptions).
Consumption tax withheld upon sale and consumption tax paid
by the Companies on their purchases of goods and services are not
included in the respective revenue, cost or expenses in the accom-
panying consolidated statements of income.

18 KISSEI Annual Repor t 2008
(9) Foreign Currency TranslationReceivables and payables denominated in foreign currencies are
translated at the current exchange rate prevailing on the respective
balance sheet dates and the resulting exchange gains or losses are
recognized in the determination of net income for the relevant period.
Investments in unconsolidated subsidiaries denominated in for-
eign currencies are translated at the historical exchange rates
prevailing at the time such transactions were made.
(10) Income TaxesIncome taxes of the Companies consist of corporate income taxes,
local inhabitants taxes and enterprise taxes.
The asset and liability approach is used to recognize deferred tax
assets and liabilities in respect of temporary differences between the
carrying amounts and the basis of assets and liabilities.
(11) Allowances, Accrued Bonuses to Employees and Reserves for Certain Expenses
(i) Allowance for doubtful accounts
The Companies provide an allowance for doubtful accounts based
on the percentage of their own actual bad debt loss history against
the balance of total receivables in addition to the amount of uncol-
lectible receivables estimated on an individual basis.
(ii) Accrued bonuses to employees
“Accrued bonuses to employees” is provided for based on estimated
amounts which the Companies should pay to employees in sum-
mer, for their services rendered during the six-month period ended
on the balance sheet dates.
(iii) Reserve for sales returns
“Reserve for sales returns” is computed based on the percentage of
the Companies’ own actual return history in the preceding two years.
(iv) Reserve for sales rebates
“Reserve for sales rebates” is provided for in an amount equivalent
to the expected amount payable by the Companies to dealers in
respect of the balance of accounts receivable at the balance sheet
date. In estimating the amount of rebates, the Companies apply the
actual rebate rates allowed in the six-month period preceding the
balance sheet dates.
(v) Reserve for sales promotion expenses
“Reserve for sales promotion expenses” is provided for in an
amount which the Companies expect to pay in relation to dealers’
inventories at the balance sheet dates. In estimating the amount of
sales promotion expenses, the Companies apply the rate of such
expenses against dealers’ inventories based on the experience in the
six-month period preceding the balance sheet dates.
(vi) Accrued retirement benefits to employees
To account for retirement benefits to employees, the Companies
recognize accrued benefits on a consolidated basis at the end of the
fiscal year based on the value of the projected benefit obligation and
the estimated fair value of the plan assets.
Prior service cost is amortized on a straight-line basis over a term
that does not exceed the average remaining service period of employ-
ees who are expected to receive benefits under the plans (10 years).
Unrecognized net actuarial gains or losses are amortized from
the following year on a straight-line basis over a term that does not
exceed the average remaining service period of employees who are
expected to receive benefits under the plans (10 years).
(vii) Accrued retirement benefits to directors
and corporate auditors
“Accrued retirement benefits to directors and corporate auditors”
are provided for at an amount equal to the liability the Companies
would have to pay if all directors and corporate auditors resigned at
the balance sheet dates.
(12) Net Income and Dividends per ShareNet income per share of common stock is based upon the weighted
average number of shares of common stock outstanding during
each fiscal year appropriately adjusted for subsequent free distribu-
tion of shares (stock splits).
Cash dividends per share shown for each year in the accom-
panying consolidated statements of income represent dividends
approved or declared as applicable to the respective years.
Fully-diluted net income per share is computed based on the
assumption that the convertible notes were fully converted into
common stock on the date of issue or at the beginning of the
respective years subsequent to the issue, with appropriate adjust-
ments for related interest expenses (net of tax).
(13) Reclassification of AccountsPrior years’ amounts have been reclassified to conform with the
current year’s presentation.
(14) Research and Development ExpensesResearch and development expenses are recognized as an expense
when incurred in accordance with the Japanese accounting
standards.
(15) Impairment of Fixed AssetsOn August 9, 2002, the Business Accounting Council of Japan
issued new accounting standards entitled “Statement of Opinion on
the Establishment of Accounting Standards for Impairment of
Fixed Assets.” Further, on October 31, 2003, the Accounting
Standards Board of Japan issued Financial Accounting Standards
Implementation Guidance No. 6 – “Application Guidance on
Accounting Standards for Impairment of Fixed Assets.” These stan-
dards are effective from the fiscal year beginning April 1, 2005.
The companies adopted these standards in the fiscal year ended
March 31, 2006. As a result, property, plant and equipment as of
March 31, 2006 decreased by ¥258 million, and income before
income taxes and minority interest for the year ended March 31,
2006 decreased by the same amount, as compared with the amount
which would have been reported if the previous standards had been
applied consistently. The accumulated impairment loss is deducted
from net book value of each asset.

19 K ISSEI Annual Repor t 2008
(16) Accounting Standard for Prsentation of Net Assets in the Balance Sheet
Effective from the year ended March 31, 2007, the Companies have
applied “Accounting standards for presentation of net assets in the
balance sheet (Accounting Standards Board of Japan Statement
No.5)”, and “Implementation guidance for Accounting standards
for presentation of net assets in the balance sheet (Accounting
Standards of Japan Guidance No.8)” both issued by the Accounting
Standard Board of Japan on December 9, 2005.
The amounts corresponding to the conventional “Shareholders’
equity” in the balance sheet is ¥123,101 million.
“Net assets” in the balance sheets for this year is presented
according to the revision of “Regulations Concerning the
Terminology, Form and Presentation Methods of Consolidated
Financial Statements” dated on April 25, 2006. Furthermore, the
Companies presented its net assets in the balance sheets using the
new presentation as of March 31, 2007 and 2008.
(17) Change to the Method of Presentation for Certificates of Deposits
Certificates of Deposits, which were included in “Cash on hand and
in banks” in the consolidated balance sheets at March 31, 2007, are
included in “Investments in securities” at March 31, 2008, in accor-
dance with the revisions to the “Practical Guidelines on Accounting
Standards for Financial Instrument” and “Q&A on Accounting
Standards for Financial Instruments”. The amount of certificates of
deposits were ¥19,340 million at March 31, 2007 and 2008.
3. United States Dollar AmountsThe Companies maintain their accounting records in yen. The dol-
lar amounts included in the consolidated financial statements and
notes thereto represent the arithmetical results of translating yen to
dollars on the basis of ¥100=U.S.$1, the approximate effective rate
of exchange at March 31, 2008. The inclusion of such dollar
amounts is solely for convenience and is not intended to imply that
yen amounts have been or could be converted, realized or settled in
dollars at ¥100=U.S.$1 or at any other rate.
4. Cash and Cash EquivalentsCash and cash equivalents at March 31, 2007 and 2008 are as follows: Thousands of Millions of Yen U.S. Dollars
2007 2008 2008
Cash on hand and in banks ¥33,480 ¥12,067 $120,670 Marketable securities 14,143 33,882 338,820 Time deposits with original maturities of over three months (70) (74) (740) Marketable securities with maturities of over three months (3,599) — — Cash and cash equivalents ¥43,954 ¥45,875 $458,750
5. SecuritiesThe acquisition cost, carrying amount, gross unrealized holding gains and losses for securities with fair value by security type at March 31,
2007 and 2008 are as follows.
Available-for-sale securities: Millions of Yen
2007
Gross Gross Carrying unrealized unrealized Cost amount holding gains holding losses
Equity securities ¥14,021 ¥25,987 ¥12,563 ¥597 Corporate debt securities 3,998 3,997 1 3 Other 899 862 1 38 ¥18,918 ¥30,846 ¥12,565 ¥638

20 KISSEI Annual Repor t 2008
Millions of Yen
2008
Gross Gross Carrying unrealized unrealized Cost amount holding gains holding losses
Equity securities ¥19,155 ¥22,512 ¥4,808 ¥1,451 Corporate debt securities 399 379 1 20 Other 896 834 — 63 ¥20,450 ¥23,725 ¥4,809 ¥1,534
Thousands of U.S. Dollars
2008
Gross Gross Carrying unrealized unrealized Cost amount holding gains holding losses
Equity securities $191,550 $225,120 $48,080 $14,510 Corporate debt securities 3,990 3,790 10 200 Other 8,960 8,340 — 630 $204,500 $237,250 $48,090 $15,340
The carrying amount of securities where no market value is available at March 31, 2007 and 2008 is summarized as follows.
Other securities: Carrying amount
Thousands of Millions of Yen U.S. Dollars
2007 2008 2008
Certificates of Deposit ¥ — ¥19,340 $193,400 Unlisted stocks (except for over-the-counter securities) 1,746 1,721 17,210 Other 12,471 15,886 158,860 ¥14,217 ¥36,947 $369,470
Proceeds, gross realized gains and gross realized losses from the sale of available-for-sale securities in respect of the year ended March 31,
2008 were ¥493 million ($4,930 thousand) , ¥370 million ($3,700 thousand) and ¥8 million ($80 thousand), respectively.
The balance in specified trusts was ¥2,716 million in fiscal 2007 and ¥2,274 million (U.S. $22,740 thousand) in fiscal 2008.
6. InventoriesInventories at March 31, 2007 and 2008 consisted of the following: Thousands of Millions of Yen U.S. Dollars
2007 2008 2008
Merchandise ¥ 2,891 ¥ 2,756 $ 27,560 Finished goods 1,588 1,198 11,980 Work-in-process 2,392 1,818 18,180 Raw materials 3,241 3,655 36,550 Supplies 765 693 6,930 ¥10,877 ¥10,120 $101,200
7. Short-Term Bank Loans and Long-Term DebtShort-term bank loans outstanding at March 31, 2007 and 2008 represent one-year notes issued by the Companies to banks. Short-term
bank loans made during the years ended March 31, 2007 and 2008 bore interest at an average annual rate of 1.74% and 1.67%, respectively.
Maximum month-end balance and average month-end balance of short-term bank loans outstanding for the years ended March 31, 2007
and 2008 is as follows: Thousands of Millions of Yen U.S. Dollars
2007 2008 2008
Maximum month-end balance ¥3,460 ¥3,440 $34,400 Average month-end balance ¥3,020 ¥3,038 $30,380

21 K ISSEI Annual Repor t 2008
Long-term debt of the Companies at March 31, 2007 and 2008 consisted of the following: Thousands of Millions of Yen U.S. Dollars
2007 2008 2008
Non-secured loans with financial institutions, bearing interest at rates ranging from 2.00% to 6.00% due from 2007 to 2027 ¥ 107 ¥ 467 $ 4,670 0.8% convertible notes due 2008 12,191 12,091 120,910 12,298 12,558 125,580 Less: current maturities due within one year (24) (12,154) (121,540) ¥12,274 ¥ 404 $ 4,040
The 0.8% convertible notes due September 30, 2008 were issued on August 23, 1996 with a principal amount of ¥15,000 million. The
notes can be repurchased at any time in their entirety at the option of the Company and may be redeemed at the discretion of the Company
at a price of ¥105 from October 1, 2002 to September 30, 2003, ¥104 from October 1, 2003 to September 30, 2004, ¥103 from October 1,
2004 to September 30, 2005, ¥102 from October 1, 2005 to September 30, 2006, ¥101 from October 1, 2006 to September 30, 2007 and ¥100
from October 1, 2007 to September 29, 2008. The holder of the convertible notes is entitled to convert ¥1,000,000 for shares at a current con-
version price of ¥2,362 per share. The conversion price is subject to adjustment for subsequent stock splits and other circumstances.
The notes are convertible at any time prior to September 29, 2008. The number of shares which would be issued upon conversion of the
notes outstanding at March 31, 2008 is 5,128 thousand shares.
The aggregate annual maturities of long-term loans outstanding at March 31, 2008 are as follows: Millions of Thousands of Yen U.S. Dollars
Year ending March 31 2009 ¥ 63 $ 630 2010 63 630 2011 63 630 2012 and thereafter 278 2,780 ¥467 $4,670
8. Research and Development ExpensesResearch and development expenses were included in selling, general and administrative expenses for the years ended March 31, 2006, 2007
and 2008 amounting to ¥10,574 million, ¥10,473 million and ¥11,361 million ($113,610 thousand), respectively.
9. Income TaxesIncome taxes in Japan applicable to the Companies for the years ended March 31, 2006, 2007 and 2008 consisting of corporate income tax
(national), enterprise tax (local) and resident income taxes (local) at the approximate rates were as follows: Rates on taxable income
2006 2007 2008
Corporate income tax 30.0% 30.0% 30.0% Enterprise tax 7.2 7.2 7.2 Resident income taxes 6.1 6.1 6.1 43.3% 43.3% 43.3% Statutory tax rate in effect to reflect the deductibility of enterprise tax when paid 40.4% 40.4% 40.4%
Effective income tax rates applicable in the accompanying consolidated statements of income differ from the above-mentioned statutory
tax rates. The principal reason for such differences is that entertainment expenses the purposes of sales promotion as defined by Japanese tax
law are not tax deductible.
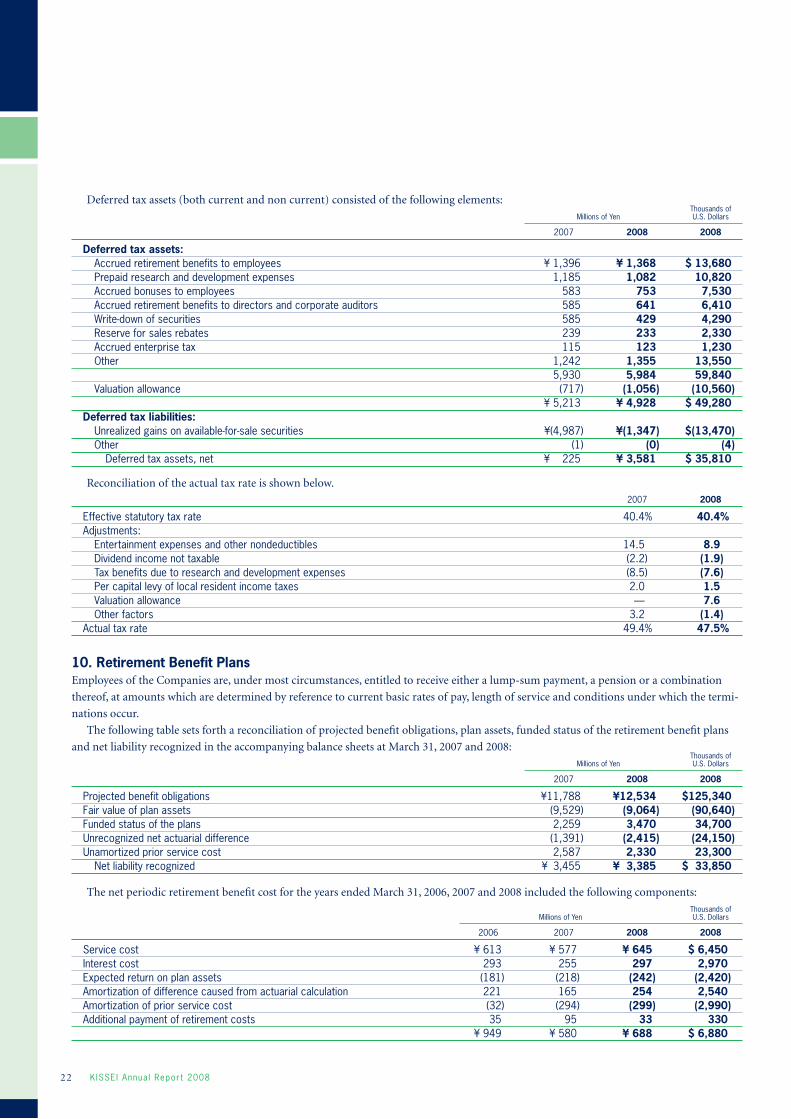
22 KISSEI Annual Repor t 2008
Deferred tax assets (both current and non current) consisted of the following elements: Thousands of Millions of Yen U.S. Dollars
2007 2008 2008
Deferred tax assets: Accrued retirement benefits to employees ¥ 1,396 ¥ 1,368 $ 13,680 Prepaid research and development expenses 1,185 1,082 10,820 Accrued bonuses to employees 583 753 7,530 Accrued retirement benefits to directors and corporate auditors 585 641 6,410 Write-down of securities 585 429 4,290 Reserve for sales rebates 239 233 2,330 Accrued enterprise tax 115 123 1,230 Other 1,242 1,355 13,550 5,930 5,984 59,840 Valuation allowance (717) (1,056) (10,560) ¥ 5,213 ¥ 4,928 $ 49,280 Deferred tax liabilities: Unrealized gains on available-for-sale securities ¥(4,987) ¥(1,347) $(13,470) Other (1) (0) (4) Deferred tax assets, net ¥ 225 ¥ 3,581 $ 35,810
Reconciliation of the actual tax rate is shown below.
2007 2008
Effective statutory tax rate 40.4% 40.4% Adjustments: Entertainment expenses and other nondeductibles 14.5 8.9 Dividend income not taxable (2.2) (1.9) Tax benefits due to research and development expenses (8.5) (7.6) Per capital levy of local resident income taxes 2.0 1.5 Valuation allowance — 7.6 Other factors 3.2 (1.4) Actual tax rate 49.4% 47.5%
10. Retirement Benefit PlansEmployees of the Companies are, under most circumstances, entitled to receive either a lump-sum payment, a pension or a combination
thereof, at amounts which are determined by reference to current basic rates of pay, length of service and conditions under which the termi-
nations occur.
The following table sets forth a reconciliation of projected benefit obligations, plan assets, funded status of the retirement benefit plans
and net liability recognized in the accompanying balance sheets at March 31, 2007 and 2008: Thousands of Millions of Yen U.S. Dollars
2007 2008 2008
Projected benefit obligations ¥11,788 ¥12,534 $125,340 Fair value of plan assets (9,529) (9,064) (90,640) Funded status of the plans 2,259 3,470 34,700 Unrecognized net actuarial difference (1,391) (2,415) (24,150) Unamortized prior service cost 2,587 2,330 23,300 Net liability recognized ¥ 3,455 ¥ 3,385 $ 33,850
The net periodic retirement benefit cost for the years ended March 31, 2006, 2007 and 2008 included the following components:
Thousands of Millions of Yen U.S. Dollars
2006 2007 2008 2008
Service cost ¥ 613 ¥ 577 ¥ 645 $ 6,450 Interest cost 293 255 297 2,970 Expected return on plan assets (181) (218) (242) (2,420) Amortization of difference caused from actuarial calculation 221 165 254 2,540 Amortization of prior service cost (32) (294) (299) (2,990) Additional payment of retirement costs 35 95 33 330 ¥ 949 ¥ 580 ¥ 688 $ 6,880

23 K ISSEI Annual Repor t 2008
The discount rate used to determine the actuarial present value of projected benefit obligations under the plan that covers the employees
of the Companies was 2.5% as of March 31, 2007 and 2008. The rate of expected return on plan assets was 2.5% as of March 31, 2007 and
2008. Attribution of retirement benefits to each year of service of the employees is based on the “benefit/years-of-service” approach, whereby
the same amount of benefits is attributed to each year.
11. Commitments and Contingent Liabilities(1) Finance LeasesAll finance lease contracts, other than those by which the ownership of the leased assets is transferred to lessees, are accounted for using a
method similar to that for operating leases.
Lease rental expenses on finance lease contracts without ownership transfer for the years ended March 31, 2006, 2007 and 2008 are
summarized as follows: Thousands of Millions of Yen U.S. Dollars
2006 2007 2008 2008
Lease rental expenses ¥365 ¥180 ¥179 $1,790
Assumed data in respect of the acquisition cost, accumulated depreciation, net book value and depreciation expense of the leased assets
(machinery and equipment), including the portion of interest thereon, for the year ended March 31, 2008 is summarized as follows:
Millions of Thousands of Yen U.S. Dollars
Acquisition cost ¥928 $9,280 Accumulated depreciation 631 6,310 Net book value ¥297 $2,970 Depreciation ¥179 $1,790
Depreciation is computed using the straight-line method over the lease term of the leased assets with no residual value.
The amount of outstanding future lease payments due at March 31, 2007 and 2008, including the portion of interest thereon, is summa-
rized as follows: Thousands of Millions of Yen U.S. Dollars
2007 2008 2008
Future lease payments: Within one year ¥130 ¥150 $1,500 After more than one year 124 147 1,470 Total ¥254 ¥297 $2,970
(2) Contingent LiabilitiesThe Companies had contingent liabilities arising from notes discounted by banks in the ordinary course of business in the amount of ¥16
million ($160 thousand) at March 31, 2008.
In addition, the Companies were contingently liable for guarantees in respect of loans borrowed by its unconsolidated subsidiaries for an
amount of ¥170 million ($1,700 thousand) at March 31, 2008.
12. Segment Information(1) Industry Segment InformationThe Company and its subsidiaries operate principally in the following two industrial segments:
Pharmaceuticals ....................... Ethical pharmaceuticals
Other ......................................... Sale of materials and other goods
Information solution services
Construction subcontracting
Facilities and equipment management

24 KISSEI Annual Repor t 2008
The industry segment information of the Company and its consolidated subsidiaries for the three years ended March 31, 2008 is presented below:
Millions of Yen
2006
Industry segment Elimination of Inter-segment Consolidated Pharmaceuticals Other Total sales total
Sales: Sales to outside customers ¥ 56,643 ¥ 7,365 ¥ 64,008 ¥ — ¥ 64,008 Inter-segment sales 0 4,606 4,606 (4,606) — Total sales 56,643 11,971 68,614 (4,606) 64,008 Operating expenses 54,852 11,837 66,689 (4,559) 62,130 Operating income ¥ 1,790 ¥ 135 ¥ 1,925 ¥ (48) ¥ 1,877 Assets ¥167,072 ¥10,668 ¥177,740 ¥(3,625) ¥174,115 Depreciation ¥ 2,891 ¥ 395 ¥ 3,286 ¥ (148) ¥ 3,138 Capital expenditure ¥ 3,571 ¥ 404 ¥ 3,975 ¥ (958) ¥ 3,017
Millions of Yen
2007
Industry segment Elimination of Inter-segment Consolidated Pharmaceuticals Other Total sales total
Sales: Sales to outside customers ¥ 55,579 ¥ 8,637 ¥ 64,216 ¥ — ¥ 64,216 Inter-segment sales 0 6,146 6,146 (6,146) – Total sales 55,579 14,783 70,362 (6,146) 64,216 Operating expenses 53,490 14,088 67,578 (6,008) 61,570 Operating income ¥ 2,089 ¥ 695 ¥ 2,784 ¥ (138) ¥ 2,646 Assets ¥156,247 ¥12,385 ¥168,632 ¥(5,049) ¥163,583 Depreciation ¥ 2,960 ¥ 439 ¥ 3,399 ¥ (171) ¥ 3,228 Capital expenditure ¥ 5,772 ¥ 548 ¥ 6,320 ¥(1,029) ¥ 5,291
Millions of Yen
2008
Industry segment Elimination of Inter-segment Consolidated Pharmaceuticals Other Total sales total
Sales: Sales to outside customers ¥ 54,768 ¥ 6,713 ¥ 61,481 ¥ — ¥ 61,481 Inter-segment sales 0 7,479 7,479 (7,479) — Total sales 54,768 14,192 68,960 (7,479) 61,481 Operating expenses 50,967 13,607 64,574 (7,363) 57,211 Operating income ¥ 3,801 ¥ 585 ¥ 4,386 ¥ (116) ¥ 4,270 Assets ¥145,027 ¥ 7,442 ¥152,469 ¥(1,903) ¥150,566 Depreciation ¥ 3,565 ¥ 518 ¥ 4,083 ¥ (220) ¥ 3,863 Capital expenditure ¥ 3,093 ¥ 535 ¥ 3,628 ¥ (840) ¥ 2,788
Thousands of U.S. Dollars
2008
Industry segment Elimination of Inter-segment Consolidated Pharmaceuticals Other Total sales total
Sales: Sales to outside customers $ 547,680 $ 67,130 $ 614,810 $ — $ 614,810 Inter-segment sales 0 74,790 74,790 (74,790) — Total sales 547,680 141,920 689,600 (74,790) 614,810 Operating expenses 509,670 136,070 645,740 (73,630) 572,110 Operating income $ 38,010 $ 5,850 $ 43,860 $ (1,160) $ 42,700 Assets $1,450,270 $ 74,420 $1,524,690 $(19,030) $1,505,660 Depreciation $ 35,650 $ 5,180 $ 40,830 $ (2,200) $ 38,630 Capital expenditure $ 30,930 $ 5,350 $ 36,280 $ (8,400) $ 27,880

25 K ISSEI Annual Repor t 2008
(2) Geographic Segment InformationAs the Companies are all incorporated in Japan, information by geographic segment is not applicable.
(3) Export SalesExport sales information of the Companies for the three years ended March 31, 2008 is omitted because export sales account for less than
10% of total sales.
13.Business Transactions with Parties Related to the Company Fiscal 2007 (April 1, 2006—March 31, 2007)
Executives, main individual stockholders, etc.Position ExecutiveName Kunio KanzawaAddress —Capital or Investment Amount (Millions of Yen) —Type of Business / Work Chairman of the Company, Director of Kanzawa Medical Research Foundation% of Voting Rights Owned (Ownership) Direct 5.1Relationship Concurrent Posts Held, etc. — Relationship with Place of Business —Type of Business Transaction Donation paid to Kanzawa Medical Research FoundationAmount (Millions of Yen) 19Item —Year-End Balance (Millions of Yen) —
Notes: 1. The above amounts do not include consumption tax. 2. The business transactions with Kanzawa Medical Research Foundation are third-party transactions.
Fiscal 2008 (April 1, 2007—March 31, 2008)
Executives, main individual stockholders, etc.Position ExecutiveName Kunio KanzawaAddress —Capital or Investment Amount (Millions of Yen) —Type of Business / Work Chairman of the Company, Director of Kanzawa Medical Research Foundation% of Voting Rights Owned (Ownership) Direct 5.0Relationship Concurrent Posts Held, etc. — Relationship with Place of Business —Type of Business Transaction Donation paid to Kanzawa Medical Research FoundationAmount (Millions of Yen) 16Item —Year-End Balance (Millions of Yen) —
Notes: 1. The above amounts do not include consumption tax. 2. The business transactions with Kanzawa Medical Research Foundation are third-party transactions.

26 KISSEI Annual Repor t 2008
14. Selling, General and Administrative ExpensesA summary of selling, general and administrative expenses for each of the three years in the period ended March 31, 2008 is as follows:
Thousands of Millions of Yen U.S. Dollars
2006 2007 2008 2008
Advertising and sales promotion expenses ¥ 4,985 ¥ 4,723 ¥ 4,167 $ 41,670 Payroll costs 7,626 7,783 8,312 83,120 Research and development expenses 10,574 10,473 11,361 113,610 Traveling expenses 1,726 1,864 1,941 19,410 Depreciation 1,350 1,343 1,455 14,550 Other 7,587 7,365 7,174 71,740 ¥33,849 ¥33,551 ¥34,410 $344,100
15. Impairment Loss on Fixed AssetsAsset impairment losses were booked for the following asset groups at March 31, 2006.
Location Use Type Asset Impairment (Millions of Yen)
Matsumoto, Nagano Rental Land 99Azumino, Nagano Recreation Land 158
The Companies have created asset groupings with values based on the minimum units used in the independent cash flow statement.
Rental assets and recreational assets were grouped separately.
The impairment of the above assets was booked as an extraordinary loss of ¥258 million after reducing the value of the assets from the
book value to the current fair value, which reflects declining land prices in recent years.
The fair value of the assets is the net value the Companies would expect to receive upon the sale of the assets, based upon a real estate val-
uation conducted in accordance with industry standards.
16. Stipulated CompensationSupply contracts stipulate a minimum purchase volume. In past years, the Company paid compensation for falling short of the minimum.
The compensation amount was confirmed in the term under review and thus booked in the consolidated financial statement for the year
ended March 31, 2006.
17. Loss on Disposal of MerchandiseThe loss is related to the disposal of inventory accompanying end of sales for portable blood glucose monitoring system for the year ended
March 31, 2007.
18. Extraordinary Contribution on Withdrawn from Pension FundThe loss is related to the donations to special fund on the occasion of consolidated subsidiary Hashiba 920 Co., Ltd. voluntary withdrawal
from the Nagano Prefecture construction industry corporate employees’ pension fund for the year ended March 31, 2007.

27 K ISSEI Annual Repor t 2008
Report of Independent Auditors

28 KISSEI Annual Repor t 2008
Board of Directors As of June 26, 2008
Corporate Data As of June 26, 2008
Chairman:Kunio Kanzawa
President and Chief Executive Officer:Mutsuo Kanzawa
Executive Vice President:Hiroshi Saito
Executive Managing Director:Yukiyoshi Ajisawa
Managing Directors:Keiichiro Yanagisawa
Seiichiro Furihata
Directors:Sukio Adachi
Masuo Akahane
Imao Mikoshiba
Hiroe Sato
Nobuo Shibata
Masaki Morozumi
Yasunori Nakata
Yoshio Furihata
Auditors:Tetsuo Yabana
Yoshinobu Kubota
Kiyoshi Kumazawa
Hiroshi Ueno
Head Office: 19-48, Yoshino, Matsumoto City, Nagano 399-8710, Japan
Telephone: (0263) 25-9081
Tokyo Head Office: 8-9, Nihonbashi-Muromachi 1-chome, Chuo-ku, Tokyo
103-0022, Japan
Telephone: (03) 3279-2761
Tokyo Head Office (Koishikawa): 1-3, Koishikawa 3-chome, Bunkyo-ku, Tokyo 112-0002, Japan
Telephone: (03) 5684-3530
Date of Establishment:August 9, 1946
Capital:¥24,271 million
Number of Employees:1,600
Central Research Laboratories:Azumino City, Nagano
Toxicological Laboratories:Azumino City, Nagano
Joetsu Chemical Laboratories:Joetsu City , Niigata
Pharmaceutical Laboratories:Azumino City, Nagano
Plants:Matsumoto City, Shiojiri City
Distribution Center:Shiojiri City
Information Center:Matsumoto City
Nutritional Business Center:Shiojiri City
Branches: Sapporo, Sendai, Kan-etsu, Tokyo, Yokohama, Matsumoto, Nagoya,
Kyoto, Osaka, Takamatsu, Hiroshima, Fukuoka
Offices: Hakodate, Asahikawa, Yamagata, Morioka, Akita, Aomori,
Koriyama, Takasaki, Utsunomiya, Mito, Niigata, Tokyo-fourth,
Tama, Chiba-first, Chiba-second, Atsugi, Okazaki, Gifu, Mie,
Shizuoka, Shiga, Kanazawa, Kita Osaka, Nara, Sakai, Kobe, Himeji,
Yamaguchi, Okayama, Kitakyushu, Oita, Nagasaki, Kumamoto,
Kagoshima, Okinawa
Subsidiaries:Consolidated Subsidiaries
Kissei Shoji Co., Ltd.
Kissei Comtec Co., Ltd.
Hashiba Technos Co., Ltd.
Non-consolidated Subsidiaries
Kissei America, Inc.
Mitsui Kanko Co., Ltd.
Kissei Wellcom Co., Ltd.
Planet Computer Technology (BeiJing) Co., Ltd.

29 K ISSEI Annual Repor t 2008
Investor Information As of March 31, 2008
Common Stock:Authorized: 227,000,000 shares
Issued: 56,838,791 shares
Number of Shareholders:3,190 (Year-on-year change: 379 decrease)
Principal Shareholders: Number of shares held Voting right (Thousands) (%)
The Dai-ichi Mutual Life Insurance Company 3,418 6.3Kanzawa Limited 3,178 5.9Kunio Kanzawa 2,702 5.0Mizuho Bank, Ltd. 2,670 4.9The Hachijuni Bank, Ltd. 2,670 4.9Japan Trustee Services Bank, Ltd. (Trust account) 1,938 3.6The Master Trust Bank of Japan, Ltd. (Trust account) 1,806 3.3Mutsuo Kanzawa 1,469 2.7Trust & Custody Services Bank, Ltd. (Trust account) 1,442 2.7Nabelin Co., Ltd. 1,219 2.2
Note: Kissei holds 2,579,849 shares of treasury stock.
Composition of Shareholders:By Category
%
Financial institutions: 57(21,100 thousand shares)
Securities companies: 28(410 thousand shares)
Non-Japanese institutionsand individuals: 122(7,463 thousand shares)
Individuals and others: 2,728(13,958 thousand shares)
37.1
0.7Other companies: 255(13,905 thousand shares)
24.5
13.1
24.6
By Number of Shares Held
%
1,000 – 4,999 shares: 1,783(2,943 thousand shares)
5.2
1 – 999 shares: 1,012(324 thousand shares)
0.5
5,000 – 9,999 shares: 143(963 thousand shares)
1.7
10,000 – 49,999 shares: 136(2,943 thousand shares)
5.2
100,000 – 499,999 shares: 55(12,094 thousand shares)
21.3
50,000 – 99,999 shares: 37(2,615 thousand shares)
4.6
500,000 – 999,999 shares: 11(7,723 thousand shares)
13.6
1,000,000 and over shares: 13(27,230 thousand shares)
47.9

Annual Report 200819-48, Yoshino, Matsumoto City, Nagano 399-8710, JapanURL: http://www.kissei.co.jp/
Printed in JapanIn consideration of environmental concerns, this report is printed on FSC-certified paper using the waterless printing process and soy ink.