klamath river fall chinook age-specific escapement, 2001 run
TRANSCRIPT

Klamath River Fall Chinook Salmon Age-Specific Escapement, River Harvest, and Run Size Estimates, 2009 Run
Klamath River Technical Team
22 February 2010
Summary
The number of Klamath River fall Chinook salmon returning to the Klamath River Basin (Basin) in 2009 was estimated to be:
Run Size
Age Number Proportion
2 11,938 0.11
3 78,708 0.70
4 16,387 0.15
5 5,653 0.05
Total 112,686 1.00
Preseason forecasts of the number of fall Chinook salmon adults returning to the Basin and the corresponding post-season estimates are:
Adults
Sector Preseason
Forecast Postseason
EstimatePre / Post
Run Size 130,200 100,700 1.29
Fishery Mortality
Tribal Harvest 30,900 28,400 1.09
Recreational Harvest 30,800 5,600 5.50
Drop-off Mortality 3,300 2,600 1.27
65,000 36,600 1.78
Escapement
Hatchery Spawners 24,600 19,600 1.26
Natural Area Spawners 40,700 44,600 0.91
65,300 64,200 1.02
Introduction
This report describes the data and methods used by the Klamath River Technical Team (KRTT) to estimate age-specific numbers of fall Chinook salmon returning to the Basin in 2009. The estimates provided in this report are consistent with the Klamath Basin Megatable (CDFG 2010) and with the 2010 forecast of ocean stock abundance (KRTT 2010). Age-specific escapement estimates for 2009 and previous years, coupled with the coded-wire tag (CWT) recovery data from Basin hatchery stocks, allow for a cohort reconstruction of the hatchery
1

and natural components of Klamath River fall Chinook salmon (Goldwasser et al. 2001, Mohr 2006a, KRTT 2010). Cohort reconstruction results enable forecasts to be developed for the current year’s ocean stock abundance, ocean fishery contact rates, and percent of spawners expected in natural areas (KRTT 2010). These forecasts are necessary inputs to the Klamath Ocean Harvest Model (Mohr 2006b); the model used by the Pacific Fishery Management Council to forecast the effect of fisheries on Klamath River fall Chinook salmon.
Methods
The KRTT obtained estimates of abundance and age composition separately for each sector of harvest and escapement. Random and nonrandom sampling methods of various types were used throughout the Basin (Table 1) to obtain the data from which the Klamath Basin Megatable totals and estimates of age composition were derived. The KRTT relied on surrogate data where the sample of scales was insufficient for estimation of age composition, or was altogether lacking, within a particular sector.
Estimates of age composition were based on random samples of scales (Table 2) whenever possible. Generally, each scale was aged independently by two trained readers. In cases of disagreement, a third read was used to arbitrate. Statistical methods (Cook and Lord 1978, Cook 1983, Kimura and Chikuni 1987) were used to correct the reader-assigned age composition estimates for potential bias based on the known-age vs. read-age validation matrices. The method used to combine the random sample’s known ages (CWT fish) and unknown read ages for estimation of the escapement or harvest age-composition is described in Appendix A. In cases where scales were believed to be non-representative of the age-two component, the KRTT relied on analysis of length-frequency histograms. In these cases, all fish less than or equal to a given fork-length “cutoff” were assumed to be age-two, and all fish greater than the cutoff length were assumed to be adults. The cutoff value varied by sector, and was based on location of the length-frequency nadir and, if appropriate, known-age (CWT) length-frequencies. As before, scales were used to estimate the age composition of adults (Appendix A). An indirect method was used to estimate age composition for natural spawners in the Trinity River above the Willow Creek Weir (WCW). Age-specific numbers of fall Chinook salmon that immigrated above WCW were estimated by applying the age composition from scales collected at the weir to the estimate of total abundance above the weir. Next, the age composition of returns to Trinity River Hatchery and the harvest above WCW were estimated. The age composition of natural spawners above the weir was then estimated as the age-specific abundances above the WCW, minus the age-specific hatchery and harvest totals. The specific protocols used to develop estimates of age composition for each sector are provided in Table 3. A summary of the KRTT minutes specific to each sector is given in Appendix B for the Klamath River and Appendix C for the Trinity River.
Results A total of 14,753 scales from 17 different sectors were aged for this analysis (Table 2). Of these, 1,594 were from known-age (CWT) fish. Known-age scales provide a direct check, or “validation,” of accuracy of the scale-based age estimates (Tables 4a and 4b, Appendices D and E). Overall, the scale-based ages were generally accurate. For the Trinity River, accuracy was 100% for age-2 fish, 98% for age-3 fish, 93% for age-4 fish, and 100% for age-5 fish. For the Klamath River the accuracy was 97% for age-2 fish, 97% for age-3 fish, 84% age-4 fish, and 89% for age-5 fish. The statistical bias-adjustment methods employed are intended to correct for scale-reading bias, but the methods assume that the known-age vs. read-age validation matrices are themselves well estimated (Kimura and Chikuni 1987).
2

Table 5 presents estimates of age-specific returns to Basin hatcheries and spawning grounds, as well as Basin harvest by Tribal and recreational fisheries and the drop-off mortality associated with those fisheries. Table 6 displays the Table 5 estimates as proportions. Calculations underlying the results summarized in Table 5 are presented in Appendix F. The final estimates of the 2008 Klamath Basin age composition were slightly modified from the preliminary age composition. Final estimates are presented in Appendix G.
List of Acronyms and Abbreviations ad-clipped adipose fin removed CDFG California Department of Fish and Game CWT coded-wire tag EST Klamath River estuary FL fork length HVT Hoopa Valley Tribe IGH Iron Gate Hatchery KRTAT Klamath River Technical Advisory Team KRTT Klamath River Technical Team KT Karuk Tribe LRC Lower Klamath River Creel M&U Klamath River below Weitchpec: “middle” section (Hwy 101–Surpur Ck) and “upper” section (Surpur Ck—Trinity River) SCS Siskiyou County Schools SRRC Salmon River Restoration Council TRH Trinity River Hatchery UR TRIBS Upper Klamath River Tributaries USFS U.S. Forest Service USFWS U.S. Fish and Wildlife Service WCW Willow Creek Weir YT Yurok Tribe YTFP Yurok Tribal Fisheries Program
Literature Cited CDFG (California Department of Fish and Game). 2010. Klamath River basin fall Chinook salmon
spawner escapement, in-river harvest and run-size estimates, 1978–2009. Available from W. Sinnen, CDFG, 5341 Ericson Way, Arcata, CA 95521.
Cook, R.C. and G.E. Lord. 1978. Identification of stocks of Bristol Bay sockeye salmon,
Oncorhynchus nerka, by evaluating scale patterns with a polynomial discriminant method. Fishery Bulletin 76:415–423.
Cook, R.C. 1983. Simulation and application of stock composition estimators. Canadian Journal of
Fisheries and Aquatic Sciences 40:2113–2118. Goldwasser, L., M.S. Mohr, A.M. Grover, and M.L. Palmer-Zwahlen. 2001. The supporting
databases and biological analyses for the revision of the Klamath Ocean Harvest Model. Available from M.S. Mohr, National Marine Fisheries Service, 110 Shaffer Road, Santa Cruz, CA 95060.
Kimura, D.K. and Chikuni, S. 1987. Mixtures of empirical distributions: an iterative application of the
age-length key. Biometrics 43:23–35.
3

KRTT (Klamath River Technical Team). 2010. Ocean abundance projections and prospective
harvest levels for Klamath River fall Chinook, 2009 season. Available from the Pacific Fishery Management Council, 7700 NE Ambassador Place, Suite 101, Portland, OR 97220-1384. <http://www.pcouncil.org/salmon/salother.html>
Mohr, M.S. 2006a. The cohort reconstruction model for Klamath River fall Chinook salmon.
Unpublished report. National Marine Fisheries Service, Santa Cruz, CA. Mohr, M.S. 2006b. The Klamath Ocean Harvest Model (KOHM): model specification. Unpublished
report. National Marine Fisheries Service, Santa Cruz, CA.
Klamath River Technical Team Participants
California Department of Fish and Game
Melodie Palmer-Zwahlen Wade Sinnen
Hoopa Valley Tribe
George Kautsky Billy C. Matilton
KMZ Ocean Recreational Fishery
Jerry Barnes National Marine Fisheries Service
Michael O’Farrell U.S. Fish and Wildlife Service
Joe Polos Yurok Tribe
Desma Williams
Acknowledgements The Klamath River Technical Team thanks the following individuals for their expert assistance in compiling and reviewing the data for this report: Sara Borok, Mary Claire Kier, Jennifer Simon, Marc Heisdorf, Brett Kormos, Diana Chesney, and Morgan Knechtle of the California Department of Fish and Game; and Steve Gough of the U.S. Fish and Wildlife Service. The Yurok Tribe and U.S. Fish and Wildlife Service performed the scale reading analysis for the Klamath River while the Hoopa Valley Tribe performed the scale reading analysis for the Trinity River. The U.S. Fish and Wildlife Service provided scale reading assistance to the Yurok Tribe. Scale collections were provided by the California Department of Fish and Game, Hoopa Valley Tribe, U.S. Fish and Wildlife Service, and Yurok Tribe.
4

Sampling Location Estimation and Sampling Methods Agency
Hatchery Spawners
Iron Gate Hatchery (IGH) Direct count. All fish examined for fin-clips, tags, marks. Systematic random sample ~10% bio-
sampleda . All ad-clipped fish bio-sampled.
CDFG
Trinity River Hatchery (TRH) Direct count. All fish bio-sampled. Scales collected from ~20% of all fish by systematic random sampling of aggregated ad- and non-ad-clipped fish.
CDFG, HVT
Natural SpawnersSalmon River Basin Redd count twice weekly. Adults = 2 * redd counts+live fish observed on last survey; total run =
adults/(1-jack proportion from scale sample). Bio-data collected from carcasses. Total estimate was adjusted downward to account for spatiotemporal overlap of spring/fall Chinook.
CDFG,USFS,YT,KT, SRRC, SCS
Scott River Basin Video count above weir at river mile 21, and mark-recapture carcass estimate (Schaefer) below weir with reaches surveyed twice weekly. Bio-data collected from all carcasses.
CDFG, SCS
Shasta River Basin Video count above weir. Bio-data collected from carcasses upstream of video weir/trap site 1-day per week and mortalities stranded on weir. In addition, bio-data were collected from live fish sub-samples three days per week from a trap adjoining the video flume at the weir site.
CDFG, SCS
Bogus Creek Basin Video count above weir and five days per week direct carcass count below weir. Bio-data taken from a systematic random sample (1:4). All ad-clipped fish were bio-sampled.
CDFG, YT
Klamath River mainstem (IGH to Shasta R) Petersen mark-recapture carcass estimate. River sections are surveyed weekly. Bio-data collected from fresh carcasses.
USFWS, YT
Klamath River mainstem (Shasta R to Indian Cr) Redd count based on weekly surveys. Adults = 2 * redd counts; total run = adults/(1-proportion jacks estimated in IGH to Shasta reach). No bio-data collected.
USFWS, KT
Klamath Tributaries (above Trinity, including Pine Creek)
Periodic redd surveys, the majority of which were performed weekly. Adults=2 * redd counts+live fish observed on last day surveyed. Total run = adults/(1-proportion jacks). Bio-data collected from all carcasses recovered.
USFS,CDFG
Blue Creek Weekly surveys. Jacks and adults estimated as the peak count of successive weekly snorkel surveys. Bio-data collected from all fresh carcasses.
YT
Trinity River (mainstem above WCW) Petersen mark-recapture run-size estimate; marks applied at WCW, recovered at TRH. All fish bio-sampled . Scales taken at WCW in systematic random sample (1:2). Total natural escapement calculated from WCW run size minus TRH return minus recreational harvest.
CDFG, HVT
Trinity River (mainstem below WCW) Bi-weekly redd surveys. Adults = 2 * redd counts. Total run = adults/(1-proportion jacks estimated for upper Trinity natural escapement ). Bio-samples from all recovered carcasses.
HVT
Trinity Tributaries (above Reservation; below WCW) Redd surveys. Adults = 2 * redd counts plus live fish observed on the last survey date. Total run = adults/(1-proportion jacks estimated for upper Trinity natural escapement ). No bio-data collected.
CDFG
Hoopa Reservation Tributaries Redd surveys. Adults = 2 * redd counts. Total run = adults/(1-proportion jacks estimated for upper Trinity natural escapement ). Bio-data collected.
HVT
Recreational HarvestKlamath River (below Hwy 101 bridge) Jack and adult estimates based on access point creel survey during three randomly selected
days per statistical week. Bio-data collected during angler interviews.CDFG
Klamath River (Hwy 101 to Weitchpec) Jack and adult estimates based on access point creel survey during three randomly selected days per statistical week. Bio-data collected during angler interviews.
CDFG
Klamath River (Weitchpec to IGH) No survey. Upper Klamath adult harvest estimated using the ratio of lower river to total adult river harvest during the years 1999-2002. Upper river adult harvest=total adult harvest minus lower river adult harvest. Upper river total harvest=upper river adult harvest /(1-proportion jacks estimated by IGH and Bogus weighted average).
CDFG
Trinity River Basin (above WCW) Jack and adult harvest estimates based on estimated harvest rates from recovery of reward tags (applied at WCW) multiplied by WCW jack and adult run sizes.
CDFG
Trinity River Basin (below WCW) Roving access creel survey during three randomly selected days per statistical week stratified by weekdays and weekend days (1 weekday and 2 weekend). Bio-data collected during angler interviews.
HVT
Tribal Harvest
Klamath River (below Hwy 101) Daily harvest estimates based on effort and catch-per-effort surveys. Bio-data collected during net harvest and buying station interviews.
YT
Klamath River (Hwy 101 to Trinity mouth) Daily harvest estimates based on effort and catch-per-effort surveys. Bio-data collected during net harvest interviews.
YT
Trinity River (Hoopa Reservation) Effort and catch-per-effort surveys 4 random days per statistical week. Bio-data collected during net harvest interviews.
HVT
Fishery Dropoff MortalityRecreational Angling Dropoff Mortality 2.04% Not directly estimated. Assumed rate relative to fishery impacts = .02; relative to fishery harvest
= .02/(1-.02).KRTAT
Tribal Net Dropoff Mortality 8.7% Not directly estimated. Assumed rate relative to fishery impacts = .08; relative to fishery harvest = .08/(1-.08).
KRTAT
Table 1. Estimation and sampling methods used for the 2009 Klamath River fall Chinook run assessment.
a Biological samples("bio-samples" or "bio-data") of live fish or carcasses generally include: sex, fork length, scales, tags or marks, and CWT recovery from ad-clipped fish.
5
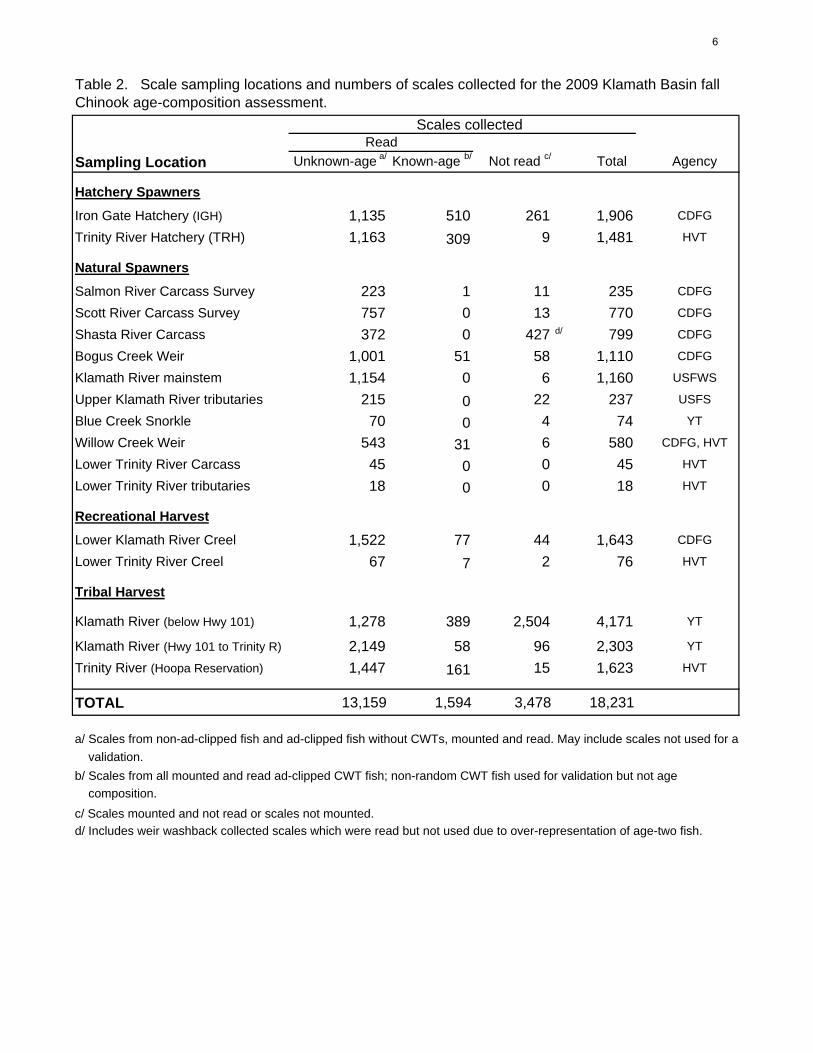
Scales collected
Sampling Location Unknown-age a/ Known-age b/ Not read c/ Total Agency
Hatchery Spawners
Iron Gate Hatchery (IGH) 1,135 510 261 1,906 CDFG
Trinity River Hatchery (TRH) 1,163 309 9 1,481 HVT
Natural Spawners
Salmon River Carcass Survey 223 1 11 235 CDFG
Scott River Carcass Survey 757 0 13 770 CDFG
Shasta River Carcass 372 0 427 d/ 799 CDFG
Bogus Creek Weir 1,001 51 58 1,110 CDFG
Klamath River mainstem 1,154 0 6 1,160 USFWS
Upper Klamath River tributaries 215 0 22 237 USFS
Blue Creek Snorkle 70 0 4 74 YT
Willow Creek Weir 543 31 6 580 CDFG, HVT
Lower Trinity River Carcass 45 0 0 45 HVT
Lower Trinity River tributaries 18 0 0 18 HVT
Recreational Harvest
Lower Klamath River Creel 1,522 77 44 1,643 CDFG
Lower Trinity River Creel 67 7 2 76 HVT
Tribal Harvest
Klamath River (below Hwy 101) 1,278 389 2,504 4,171 YT
Klamath River (Hwy 101 to Trinity R) 2,149 58 96 2,303 YT
Trinity River (Hoopa Reservation) 1,447 161 15 1,623 HVT
TOTAL 13,159 1,594 3,478 18,231
a/ Scales from non-ad-clipped fish and ad-clipped fish without CWTs, mounted and read. May include scales not used for ag
validation.
b/ Scales from all mounted and read ad-clipped CWT fish; non-random CWT fish used for validation but not age
composition.
c/ Scales mounted and not read or scales not mounted.
d/ Includes weir washback collected scales which were read but not used due to over-representation of age-two fish.
Table 2. Scale sampling locations and numbers of scales collected for the 2009 Klamath Basin fall Chinook age-composition assessment.
Read
6

Sampling Location Age Composition Method
Hatchery SpawnersIron Gate Hatchery (IGH) Jack/adult structure from scale-age analysis.
Trinity River Hatchery (TRH) Jack/adult structure from scale-age analysis.
Natural SpawnersSalmon River Basin Jack/adult structure from scale-age analysis.
Scott River Basin Jack/adult structure from scale-age analysis.
Shasta River Basin Jack/adult structure from scale-age analysis.
Bogus Creek Basin Jack/adult structure from scale-age analysis.
Klamath River mainstem (IGH to Shasta R) Jack/adult structure from scale-age analysis.
Klamath River mainstem (Shasta R to Indian Cr) Surrogate: Klamath mainstem (IGH to Shasta R) age-structure.
Klamath tributaries (above Reservation) Jack/adult structure from scale-age analysis.
Blue Creek Jacks estimated by direct observation. Adult structure from scale-age analysis.
Trinity River (above WCW) Jack/adult structure derived from subtracting age specific TRH counts and recreational harvest estimate above WCW from the age specific total run estimate above WCW derived from scale-age analysis.
Trinity River (mainstem below WCW) Surrogate: Mainstem natural spawners above WCW age-structure.
Trinity Tributaries (above Reservation to WCW ) Surrogate: Mainstem natural spawners above WCW age-structure.
Hoopa Reservation Tributaries Surrogate: Mainstem natural spawners above WCW age-structure.
Recreational HarvestKlamath River (below Hwy 101 bridge) Jack/adult structure from scale-age analysis.
Klamath River (Hwy 101 to Weitchpec) Jack/adult structure from scale-age analysis.
Klamath River (Weitchpec to IGH) Surrogate: IGH and Bogus Creek weighted age composition.
Trinity River Basin (above WCW) Jack component based on estimated jack harvest rate. Surrogate: Adult age composition from Trinity River Basin Recreational Harvest (below WCW).
Trinity River Basin (below WCW) Jack/adult structure from scale-age analysis.
Tribal HarvestKlamath River (below Hwy 101) Jacks component based on estimated jack harvest. Adult structure from
scale-age analysis.Klamath River (Hwy 101 to Trinity mouth) Jack/adult structure from scale-age analysis.
Trinity River (Hoopa Reservation) Jack/adult structure from scale-age analysis.
Table 3. Age-composition methods used for the 2009 Klamath Basin fall Chinook run assessment.
7

Table 4a. 2009 Klamath River Basin scale validation matrices.
Number Known Age2 3 4 5
2 145 6 0 0Read 3 5 567 47 0
Age 4 0 12 274 35 0 0 4 25 Total
Total 150 585 325 28 1088
Percentage Known Age2 3 4 5
2 0.97 0.01 0.00 0.00Read 3 0.03 0.97 0.14 0.00
Age 4 0.00 0.02 0.84 0.115 0.00 0.00 0.01 0.89
Total 1.00 1.00 1.00 1.00
Table 4b. 2009 Trinity River Basin scale validation matrices.
Number Known Age2 3 4 5
2 9 0 0 0Read 3 0 440 3 0
Age 4 0 11 42 05 0 0 0 3 Total
Total 9 451 45 3 508
Percentage Known Age2 3 4 5
2 1.00 0.00 0.00 0.00Read 3 0.00 0.98 0.07 0.00
Age 4 0.00 0.02 0.93 0.005 0.00 0.00 0.00 1.00
Total 1.00 1.00 1.00 0.00
8

AGE Total Total Escapement & Harvest 2 3 4 5 Adults Run
Hatchery SpawnersIron Gate Hatchery (IGH) 1,229 8,982 3,184 97 12,263 13,492Trinity River Hatchery (TRH) 143 6,867 444 39 7,351 7,494
Hatchery Spawner subtotal 1,372 15,849 3,628 136 19,614 20,986
Natural SpawnersSalmon River Basin 516 1,291 511 403 2,204 2,720Scott River Basin 44 1,794 106 267 2,167 2,211Shasta River Basin 151 5,587 315 243 6,145 6,296Bogus Creek Basin 471 4,836 552 66 5,455 5,926Klamath River mainstem (IGH to Shasta R) 160 3150 1010 107 4,267 4,427Klamath River mainstem (Shasta R to Indian Cr) 135 2724 863 92 3,678 3,813Klamath Tributaries (above Trinity, including Pine Creek) 175 2,793 168 134 3,094 3,269Blue Creek 296 667 33 33 733 1,029
Klamath Basin subtotal 1,948 22,842 3,558 1,345 27,743 29,691
Trinity River (mainstem above WCW) 5,787 12,883 2,022 909 15,814 21,601Trinity River (mainstem below WCW) 195 435 68 31 534 729Trinity Tributaries (above Reservation; below WCW) 70 155 24 11 190 260Hoopa Reservation tributaries 113 251 39 18 308 421
Trinity Basin subtotal 6,165 13,724 2,153 969 16,846 23,011
Natural Spawners subtotal 8,113 36,566 5,711 2,314 44,589 52,702
Total Spawner Escapement 9,485 52,415 9,339 2,450 64,203 73,688
Recreational HarvestKlamath River (below Hwy 101 bridge) 319 966 154 71 1,191 1,510Klamath River (Hwy 101 to Weitchpec) 1,559 1,825 111 80 2,015 3,574Klamath River (Weitchpec to IGH) 155 1,259 340 15 1,614 1,769Trinity River Basin (above WCW) 146 389 57 37 483 629Trinity River Basin (below WCW) 36 216 34 22 272 308Subtotals 2,215 4,655 696 225 5,575 7,790
Tribal HarvestKlamath River (below Hwy 101) 43 13,055 4,216 2,194 19,465 19,508Klamath River (Hwy 101 to Trinity mouth) 39 3,548 926 295 4,769 4,808Trinity River (Hoopa Reservation) 96 3,217 689 247 4,153 4,249Subtotals 178 19,820 5,831 2,736 28,387 28,565
Total Harvest 2,393 24,475 6,527 2,961 33,962 36,355 TotalsHarvest and Escapement 11,878 76,890 15,866 5,411 98,165 110,043Recreational Angling Dropoff Mortality 2.04% 45 95 14 5 114 159Tribal Net Dropoff Mortality 8.7% 15 1,723 507 239 2,469 2,484
Total River Run 11,938 78,708 16,387 5,653 100,748 112,686
Table 5. Age composition of the 2009 Klamath Basin fall Chinook run.
9

AGEEscapement & Harvest 2 3 4 5
Hatchery SpawnersIron Gate Hatchery (IGH) 0.091 0.666 0.236 0.007Trinity River Hatchery (TRH) 0.019 0.916 0.059 0.005
Hatchery Spawner subtotal 0.065 0.755 0.173 0.006
Natural SpawnersSalmon River Basin 0.190 0.474 0.188 0.148Scott River Basin 0.020 0.811 0.048 0.121Shasta River Basin 0.024 0.887 0.050 0.039Bogus Creek Basin 0.080 0.816 0.093 0.011Klamath River mainstem (IGH to Shasta R) 0.036 0.712 0.228 0.024Klamath River mainstem (Shasta R to Indian Cr) 0.035 0.714 0.226 0.024Klamath tributaries (above Reservation) 0.053 0.854 0.051 0.041Yurok Reservation tributaries 0.288 0.648 0.032 0.032
Klamath Basin subtotal 0.066 0.769 0.120 0.045
Trinity River (mainstem above WCW) 0.268 0.596 0.094 0.042Trinity River (mainstem below WCW) 0.268 0.596 0.094 0.042Trinity tributaries (above Reservation) 0.268 0.596 0.094 0.042Hoopa Reservation tributaries 0.268 0.596 0.094 0.042
Trinity Basin subtotal 0.268 0.596 0.094 0.042
Natural Spawners subtotal 0.154 0.694 0.108 0.044
Total Spawner Escapement 0.129 0.711 0.127 0.033
Recreational HarvestKlamath River (below Hwy 101 bridge) 0.211 0.640 0.102 0.047Klamath River (Hwy 101 to Weitchpec) 0.436 0.511 0.031 0.022Klamath River (Weitchpec to IGH) 0.088 0.712 0.192 0.008Trinity River Basin (above WCW) 0.232 0.618 0.091 0.059Trinity River Basin (below WCW) 0.117 0.700 0.110 0.073Subtotals 0.284 0.598 0.089 0.029
Tribal HarvestKlamath River (below Hwy 101) 0.002 0.669 0.216 0.112Klamath River (Hwy 101 to Trinity mouth) 0.008 0.738 0.193 0.061Trinity River (Hoopa Reservation) 0.023 0.757 0.162 0.058Subtotals 0.006 0.694 0.204 0.096
Total Harvest 0.066 0.673 0.180 0.081 TotalsHarvest and Escapement 0.108 0.699 0.144 0.049Recreational Angling Dropoff Mortality 2.04% 0.283 0.597 0.088 0.031Tribal Net Dropoff Mortality 8.7% 0.006 0.694 0.204 0.096
Total River Run 0.11 0.70 0.15 0.05
Table 6. Age proportion of the 2009 Klamath Basin fall Chinook run.
10

Appendix A: Estimation of escapement age-composition from a random sample containing known-age (CWT) and unknown read-age fish. Denote the escapement at age as { , 2,3,4,5}, ,aN a N N a and for the random sample of size
fish, denote the following quantities: (n m)
known-age fish: number at age { , 2,3,4,5}, , / .a an a n n p n na a
unknown read-age fish: number at age { , 2,3,4,5}, , / .a am a m m r m ma a
bias-corrected unknown read-age proportions: * * *3 4 5{ , 2,3,4,5}, .a Ar a r r r r* *
age-2 proportion as estimated by size-frequency: 2 .s
1. Age 2–5 escapement by scales. Estimate aN as the sample known-age a fish plus the
unknown age portion of the escapement times the estimated age a proportion (bias-corrected):
*( ) , 2,3,4,5.a a aN np N n r a
2. Age-2 escapement by size-frequency, age 3–5 escapement by scales. Estimate 2N as the
total escapement times the size-frequency based estimated age-2 proportion. Estimate
aN for 3,4,5a as the sample known-age a fish plus the unknown age portion of the adult
escapement times the age a proportion among adults (bias-corrected):
2
* *2 2
, 2
[ (1 ) (1 )]( / ), 3,4,5a
a a A
Ns aN
np N s n p r r a
11

Appendix B. Klamath River – 2009 Details. Iron Gate Hatchery A systematic random bio-samplea was obtained from every tenth Chinook returning to IGH in 2009. Additionally every ad-clip fish not occurring in the random sample was bio-sampled as non-random. Scale-based age composition was used to apportion all age classes. Age composition was estimated from a total of 1,592b scales, of which 510 came from known-age CWT fish. Bogus Creek Total run was estimated by summing carcasses encountered below the video weir and videography (since 2002) counts above the weir. Biological samples were obtained from all areas using a systematic random sample of 1:4. Additionally, biological data were obtained from a non-random collection of every ad-clipped fish encountered. Age composition was estimated from a total of 1,030b scales, of which 51 came from known-age CWT fish. Shasta River Total run estimated by videography (since 1998). Bio-samples were collected from fish sampled in a trap located immediately upstream of the video flume, from all recovered carcasses for surveys in the lower seven miles on public and private lands where access is granted, and from an additional six miles on the upper Shasta River and Big Springs Creek. Bio-samples were also obtained from all fish that washed back onto the counting weir. Age composition was estimated from a total of 372 scales collected at the weir trap, of which none came from known-age, CWT fish. Scott River Total escapement was obtained using a Schaefer carcass mark-recapture estimator for reaches below a resistance board weir installed near Jones Beach, river mile 21. Videography was used to estimate the population above the weir augmented with carcass surveys above the weir for biological samples. Bio-samples were obtained from all suitable carcasses encountered. Age composition was estimated based on a total of 757 scales collected, none of which none were from known-age CWT fish. Salmon River In past years, carcass mark-recapture methods were used to estimate total fall Chinook spawners in the Salmon River. However, the 2009 mark-recapture data sheets were lost and the only information available was a summary of redd counts. The adult run estimate was obtained by multiplying total redd counts by two and adding the total of live fish observed during the final survey. Additionally, the number of adult spring Chinook salmon observed during snorkel surveys were subtracted from the total adult run. The total run (jacks and adults) was estimated by dividing the total adult fall Chinook salmon run by (1-proportion of jacks) in the run based on scale-age analysis. Age composition was estimated from a total of 224 scales of which one was from a known-age CWT fish. Klamath River Tributaries (above Reservation) The adult run estimate was obtained by multiplying total redd counts by two and adding the total of live fish observed during the final survey in each tributary. Age composition was estimated from a total of 215 scales of which none were from known-age CWT fish.
a Biological samples ("bio-samples") of live fish or carcasses generally included: sex, fork length, tags or marks, scales, and CWT recovery from ad-clipped fish. b Age composition estimates are made from scales sampled at random. Discrepancies between the number of scales used to estimate age composition reported here, and the sum of known and unknown age scales in Table 2, are due to the omission of nonrandom samples.
12
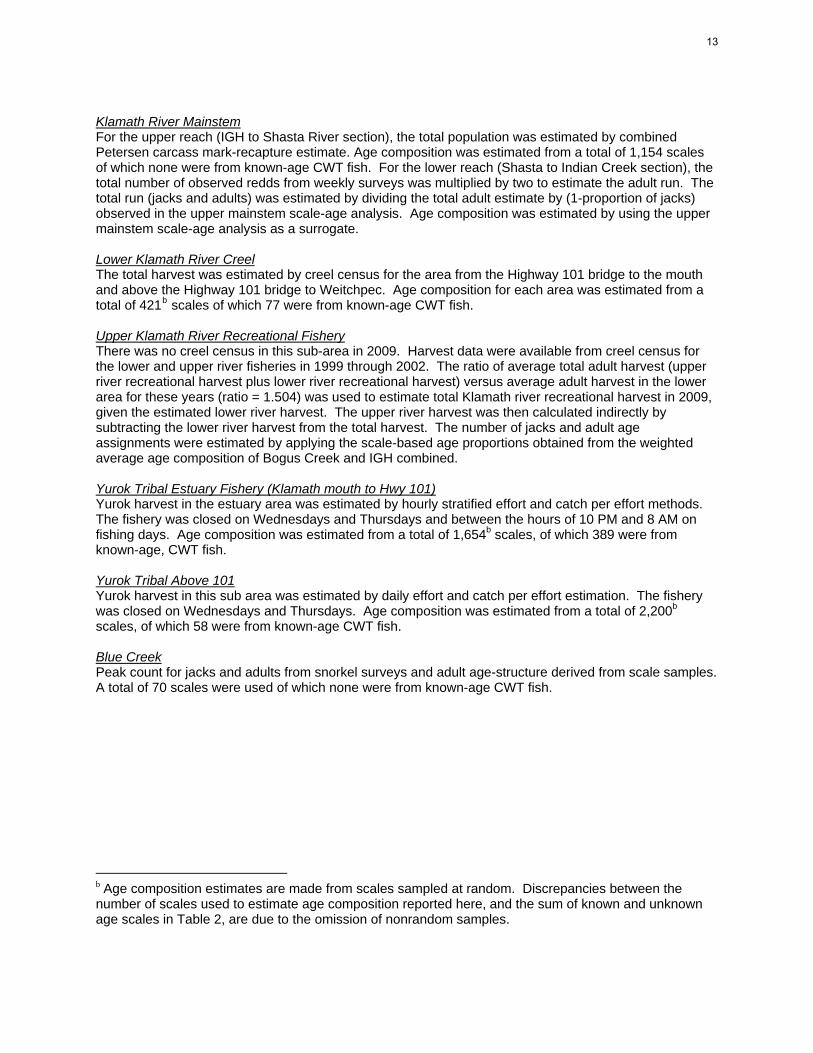
Klamath River Mainstem For the upper reach (IGH to Shasta River section), the total population was estimated by combined Petersen carcass mark-recapture estimate. Age composition was estimated from a total of 1,154 scales of which none were from known-age CWT fish. For the lower reach (Shasta to Indian Creek section), the total number of observed redds from weekly surveys was multiplied by two to estimate the adult run. The total run (jacks and adults) was estimated by dividing the total adult estimate by (1-proportion of jacks) observed in the upper mainstem scale-age analysis. Age composition was estimated by using the upper mainstem scale-age analysis as a surrogate. Lower Klamath River Creel The total harvest was estimated by creel census for the area from the Highway 101 bridge to the mouth and above the Highway 101 bridge to Weitchpec. Age composition for each area was estimated from a total of 421b scales of which 77 were from known-age CWT fish. Upper Klamath River Recreational Fishery There was no creel census in this sub-area in 2009. Harvest data were available from creel census for the lower and upper river fisheries in 1999 through 2002. The ratio of average total adult harvest (upper river recreational harvest plus lower river recreational harvest) versus average adult harvest in the lower area for these years (ratio = 1.504) was used to estimate total Klamath river recreational harvest in 2009, given the estimated lower river harvest. The upper river harvest was then calculated indirectly by subtracting the lower river harvest from the total harvest. The number of jacks and adult age assignments were estimated by applying the scale-based age proportions obtained from the weighted average age composition of Bogus Creek and IGH combined. Yurok Tribal Estuary Fishery (Klamath mouth to Hwy 101) Yurok harvest in the estuary area was estimated by hourly stratified effort and catch per effort methods. The fishery was closed on Wednesdays and Thursdays and between the hours of 10 PM and 8 AM on fishing days. Age composition was estimated from a total of 1,654b scales, of which 389 were from known-age, CWT fish. Yurok Tribal Above 101 Yurok harvest in this sub area was estimated by daily effort and catch per effort estimation. The fishery was closed on Wednesdays and Thursdays. Age composition was estimated from a total of 2,200b scales, of which 58 were from known-age CWT fish. Blue Creek Peak count for jacks and adults from snorkel surveys and adult age-structure derived from scale samples. A total of 70 scales were used of which none were from known-age CWT fish.
b Age composition estimates are made from scales sampled at random. Discrepancies between the number of scales used to estimate age composition reported here, and the sum of known and unknown age scales in Table 2, are due to the omission of nonrandom samples.
13

Appendix C. Trinity River – 2009 Details. Trinity River Hatchery (TRH) Sampling for scales was conducted in a systematic (1:5) random manner. Ad-clipped and non-ad-clipped fish were selected with equal probability. A total of 1,472 scales were aged, of which 309 scales came from known-age CWT fish. Scale samples were used to apportion all ages of the hatchery return. Upper Trinity River Recreational Harvest The general method for estimating the upper Trinity recreational harvest depends on the application of reward/non-reward program tags at the Willow Creek Weir (WCW) and subsequently returned by anglers. The harvest of jacks and adults was estimated using harvest rate estimates based on returns of WCW program tags and the total run estimated above WCW. The adult age-proportions estimated for the Lower Trinity River Creel were used as a surrogate for the adult component. Lower Trinity River Creel Roving creel census implemented in Trinity River below the WCW. A total of 74 scales were aged, of which 7 were from known-age CWT fish. Total harvest was apportioned by age using the scale-age proportions. Upper Trinity River Natural Escapement Natural escapement in the upper Trinity River above WCW was estimated by subtracting the age-specific returns to TRH and age-specific recreational harvest above WCW from the total estimated run above WCW. The total run above WCW was estimated using Petersen mark-recapture methods. The age structure of the run (including jacks) was estimated using age-composition determined from scales collected at WCW applied to the total run. A total of 574 scales were aged, of which 31 were from known-age CWT fish. Lower Trinity River Natural Escapement: The Lower Trinity natural escapement estimation area included total spawners estimated in both main-stem and tributary sub-areas (redds X 2). 45 scales were aged from the mainstem, and 18 scales were aged from the tributary sub-area. Ages were apportioned using the “Upper Trinity Natural Escapement” proportions as a surrogate due to the relatively low scale sample size for this sector. Hoopa Valley Tribal Harvest Hoopa Valley Tribal harvest is a composite of the gillnet and hook-and-line fisheries prosecuted by Tribal members. A total of 1,608 scales were aged of which 161 were from known-age, CWT fish. The total harvest was apportioned by age using these scale-age proportions.
14

Appendix D. 2009 Klamath age analysis
Unknown scales age composition as readAGE 2 AGE 3 AGE 4 AGE 5 TOTAL
BOGUS 82 793 93 11 979IGH 105 739 228 10 1,082SALMON 42 110 41 30 223SCOTT 21 601 53 82 757SHASTA (trap) 12 323 24 13 372MAINSTEM 48 838 240 28 1,154UR TRIBS 13 180 14 8 215LRC EST 73 220 36 15 344LRC UP 503 595 45 24 1,167YTFP EST 5 867 261 132 1,265YTFP M&U 33 1,591 395 123 2,142BLUE CRK 21 44 3 2 70
958 6901 1433 478 9770
Unknown scales corrected age proportions (Kimura method)
AGE 2 AGE 3 AGE 4 AGE 5 TOTALBOGUS 0.0780 0.8194 0.0913 0.0113 1.0IGH 0.0933 0.6667 0.2328 0.0071 1.0SALMON 0.1898 0.4744 0.1877 0.1481 1.0SCOTT 0.0201 0.8113 0.0480 0.1207 1.0SHASTA (trap) 0.0240 0.8876 0.0500 0.0384 1.0MAINSTEM 0.0355 0.7142 0.2262 0.0241 1.0UR TRIBS 0.0535 0.8543 0.0512 0.0410 1.0LRC EST 0.2128 0.6372 0.1026 0.0474 1.0LRC UP 0.4405 0.5063 0.0305 0.0226 1.0YTFP EST 0.0000 0.6720 0.2141 0.1139 1.0YTFP M&U 0.0081 0.7373 0.1930 0.0617 1.0BLUE CRK 0.3036 0.6334 0.0314 0.0316 1.0
Known CWT ages /a
AGE 2 AGE 3 AGE 4 AGE 5 TOTALBOGUS 16 49 19 0 84IGH 45 524 231 6 806SALMON 0 0 0 0 0SCOTT 0 0 0 0 0SHASTA 0 0 0 1 1MAINSTEM 4 5 14 1 24UR TRIBS 0 0 0 0 0LRC 5 53 4 0 62YTFP EST 0 155 106 7 268YTFP M&U 0 19 3 0 22BLUE CRK 0 0 0 0 0
70 805 377 15 1267Breakout within strataBogus1 3 17 8 0 28Bogus2 13 32 11 0 56LRC - lo 1 15 1 0 17LRC - mid 4 38 3 0 45YTFP MID 0 12 2 0 14YTFP UP 0 7 1 0 8
/a Table includes known-age fish whose scales were not mounted / read.
15

Appendix E. 2009 Trinity age analysisWCW = Willow Ck. Weir Cwt Age LOWTRINREC = Lower Trinity Recreational Cwt Age
no cwt 2 3 4 5 Total no cwt 2 3 4 5 Totalunreadable 6 0 0 0 0 6 unreadable 2 0 0 0 0 2
2 111 0 0 0 0 111 2 8 0 0 0 0 8Scale 3 362 0 30 0 0 392 Scale 3 46 0 6 0 0 52Ages 4 52 0 0 1 0 53 Ages 4 8 0 0 1 0 9
31 5 1 0 0 0 0 18 7 5 5 0 0 0 0 5543 549 0 30 1 0 580 67 69 0 6 1 0 76
HUPAHARV = Hoopa Tribal Net Harvest plus Tribal Hook-and-Line Cwt Age TRH = Trinity River Hatchery Cwt Ageno cwt 2 3 4 5 Total no cwt 2 3 4 5 Total
unreadable 14 0 1 0 0 15 unreadable 8 0 1 0 0 92 34 0 0 0 0 34 2 21 9 0 0 0 30
Scale 3 1078 0 137 2 0 1217 Scale 3 1047 0 267 1 0 1315Ages 4 248 0 4 17 0 269 Ages 4 89 0 7 23 0 119
161 5 87 0 0 0 1 88 309 5 6 0 0 0 2 81447 1461 0 142 19 1 1623 1163 1171 9 275 24 2 1481
LOWTRINTRIBS = Lower Trinity Tribs Cwt Age UPKLAMREC Upper Klamath Recreational Cwt Ageno cwt 2 3 4 5 Total NO DATA no cwt 2 3 4 5 Total
unreadable 0 0 0 0 0 0 unreadable2 5 0 0 0 0 5 2
Scale 3 9 0 0 0 0 9 Scale 3Ages 4 1 0 0 0 0 1 Ages 4
0 5 3 0 0 0 0 3 0 518 18 0 0 0 0 18 0 0 0 0 0 0 0
LOWTRINMAINSTEM = Lower Trinity Mainstem Cwt Age TribsAboveHoopa Cwt Ageno cwt 2 3 4 5 Total NO DATA no cwt 2 3 4 5 Total
unreadable 0 0 0 0 0 0 unreadable2 3 0 0 0 0 3 2
Scale 3 18 0 0 0 0 18 Scale 3Ages 4 8 0 0 0 0 8 Ages 4
0 5 16 0 0 0 0 16 0 545 45 0 0 0 0 45 0 0 0 0 0 0 0
POOLED data from all areas: Scale age-CWT age matrix. (B)(Includes only fish with both scale age and CWT known age.) Scale-CWT age matrix of proportions of column sums.
VALIDATION MATRIX 2 3 4 5 2 3 4 52 9 0 0 0 2 1.0000 0.0000 0.0000 0.00003 0 440 3 0 3 0.0000 0.9756 0.0667 0.0000
4x4 4 0 11 42 0 4 0.0000 0.0244 0.9333 0.00005 0 0 0 3 0.972440945 5 0.0000 0.0000 0.0000 1.0000
Corrected Scale age proportion vectors for scale-aged 2 - 5 fish.known scales 31 161 7 309 0 508 Correction Matrix for ages 2,3,4,5.
# unknown scales 543 1447 67 1163 18 3283 (Inverse of Scale-CWT age proportion matrix.)Willow Creek Weir Hoopa Tribal Lower Trinity TRH Lower Trinity Upper Trinity Upper Trin Lower 2 3 4 5
Age WCW NET HARVEST REC HARVEST HATCHERY CARCASS REC HARVEST Nat Escape Trin Tribs 2 1.0233 0.0000 0.0000 0.00002 0.2044 0.0235 0.1194 0.0181 0.0667 - 0.2679 0.2778 3 -0.0233 1.0000 -0.0126 0.00003 0.6775 0.7524 0.6962 0.9188 0.3977 0.7906 0.5964 0.5093 4 0.0000 0.0000 1.0126 0.00004 0.0849 0.1640 0.1097 0.0580 0.1801 0.1246 0.0936 0.0462 5 0.0000 0.0000 0.0000 1.00005 0.0331 0.0601 0.0746 0.0052 0.3556 0.0847 0.0421 0.1667
1.00000 1.00000 1.00000 1.00000 1.00000 1.00000 1.00000 1.00000
UNKNOWN CWTS 26 3 133 WCW scales(Estimated) (Estimated) known
CWTS Willow Creek Weir Hoopa Tribal Lower Trinity TRH Lower Trinity Upper Trinity Upper Trinity Hoopa age Total age WCW ageAge WCW NET HARVEST REC HARVEST HATCHERY CARCASS REC HARVEST Natural Hook&Line Age WCW nocwts cwts scales all scales proportions
2 0 0 0 37 0 2 31 0 2 111 0 111 0.20443 0 142 6 1463 0 45 727 0 3 368 0 368 0.67754 0 19 1 103 0 3 51 0 4 46 0 46 0.08495 0 1 0 9 0 0 4 0 5 18 0 18 0.0331
0 162 7 1612 0 51 814 0 543 0 543 1.0000
Total Adults onlyNatural Escapement, Trinity basin above WCW: Apportioned to age structure. TRH + Rec above Apportioned Natural Escapement
WCW+Natural minus TRH #s minus above WCW creel #sADULTS ONLY Age proportions Escapement Fudge Escapement Props
Rec above WCW 629 CDFG 2 0.2044 6076 0 5787 0.2679TRH 7494 Megatable 3 0.6775 20139 0 12883 0.5964Naturals 21601 Megatable 4 0.0849 2524 0 2022 0.0936Total 29724 5 0.0331 985 0 909 0.0421
29724
Add eachseason if needed
16

Appendix F. 2009 Klamath Basin fall Chinook age-composition calculation worksheet. 2009
# # Total Unk. AgeHatchery spawners Grilse Adults Run 2 3 4 5 Total 2 3 4 5 Total Scales Read Redds LiveIron Gate Hatchery (IGH) 1229 12263 13492 1229 8982 3184 97 13492 scales 0.0933 0.6667 0.2328 0.0071 1.0 1,082 <=58cm
IGH cwts 45 524 231 6 806Trinity River Hatchery (TRH) 143 7351 7494 143 6867 444 39 7494 scales 0.01806 0.9188 0.0580 0.0052 1.0 1163 <=57cm
Hatchery spawner subtotal: 1372 19614 20986 1372 15849 3628 136 20986 TRH cwts 37 1463 103 9 1612prop. hatchery grilse 0.065 proportion hatchery 0.186
Natural SpawnersTrinity River mainstem above WCW 5787 15814 21601 5787 12883 2022 909 21601 scales 0.26790 0.59640 0.09362 0.04208 1.0 543Trinity River mainstem below WCW 195 534 729 195 435 68 31 729Above WCW 0.26790 0.59640 0.09362 0.04208 1.0 267Salmon River Basin (includes Wooley Cr) 516 2204 2720 516 1291 511 403 2720 scales 0.18980 0.47440 0.18772 0.14809 1.0 223 1183 108Scott River 44 2167 2211 44 1794 106 267 2211 scales 0.02009 0.81128 0.04797 0.12066 1.0 757 <=58cmShasta River 151 6145 6296 151 5587 315 243 6296 scales 0.02395 0.88755 0.05004 0.03845 1.0 372 <=59cm
Shasta CWT 0 0 0 1 1Bogus Creek 471 5455 5926 471 4836 552 66 5926 scales 0.07795 0.81942 0.09130 0.01133 1.0 979 <=58cm
Bogus CWT 16 49 19 0 84Mainstem Klamath (IGH to Shasta R) 160 4267 4427 160 3150 1010 107 4427 scales 0.03545 0.71425 0.22625 0.02406 1.0 1,154 <=58cm
KR main CWT 4 5 14 1 24Mainstem Klamath (Shasta R to Indian Cr) 135 3678 3813 135 2724 863 92 3813 Upper Main 0.03545 0.71425 0.22625 0.02406 1.0 IGH to Shasta 1839
Main basin subtotals: 7,459 40,264 47,723 7,459 32,700 5,447 2,118 47,723
Klamath TributariesAiken Cr 0 0 0 0 0 0 0 0 scales 0.05349 0.85430 0.05124 0.04097 1.0 0 0Beaver Cr 32 565 597 32 510 31 24 597 scales 0.05349 0.85430 0.05124 0.04097 1.0 278 9Bluff Cr 1 21 22 1 19 1 1 22 scales 0.05349 0.85430 0.05124 0.04097 1.0 10 1Boise Cr 0 0 0 0 0 0 0 0 scales 0.05349 0.85430 0.05124 0.04097 1.0 0 0Camp Cr 26 462 488 26 417 25 20 488 scales 0.05349 0.85430 0.05124 0.04097 1.0 224 14Clear Cr 17 297 314 17 268 16 13 314 scales 0.05349 0.85430 0.05124 0.04097 1.0 145 7Dillon Cr 8 137 145 8 124 7 6 145 scales 0.05349 0.85430 0.05124 0.04097 1.0 62 13Elk Cr 16 285 301 16 257 15 12 301 scales 0.05349 0.85430 0.05124 0.04097 1.0 138 9Grider Cr 19 338 357 19 305 18 15 357 scales 0.05349 0.85430 0.05124 0.04097 1.0 167 4Horse Cr 5 80 85 5 72 4 3 85 scales 0.05349 0.85430 0.05124 0.04097 1.0 40 0Independence Cr 0 0 0 0 0 0 0 0 scales 0.05349 0.85430 0.05124 0.04097 1.0 0 0Indian Cr 30 523 553 30 472 28 23 553 scales 0.05349 0.85430 0.05124 0.04097 1.0 258 7Irving Cr 0 0 0 0 0 0 0 0 scales 0.05349 0.85430 0.05124 0.04097 1.0 0 0Perch Cr 0 0 0 0 0 0 0 0 scales 0.05349 0.85430 0.05124 0.04097 1.0 0 0Red Cap Cr 12 209 221 12 189 11 9 221 scales 0.05349 0.85430 0.05124 0.04097 1.0 101 7Rock Cr 1 23 24 1 21 1 1 24 scales 0.05349 0.85430 0.05124 0.04097 1.0 11 1Slate Cr 0 4 4 0 4 0 0 4 scales 0.05349 0.85430 0.05124 0.04097 1.0 2 0Seiad Cr 0 0 0 0 0 0 0 0 scales 0.05349 0.85430 0.05124 0.04097 1.0 0 0Thompson Cr 8 150 158 8 135 8 6 158 scales 0.05349 0.85430 0.05124 0.04097 1.0 72 6Ti Cr 0 0 0 0 0 0 0 0 scales 0.05349 0.85430 0.05124 0.04097 1.0 0 0Pine Cr (previously in Trin Tribs) 0 0 0 0 0 0 0 0 scales 0.05349 0.85430 0.05124 0.04097 1.0 0 0
Klamath trib subtotal: 175 3094 3269 175 2793 168 134 3269 1508 78
Trinity Tributaries SURROGATE - Trinity River Mainstem above WCW
Horse Linto Cr 59 160 219 59 130 20 9 219Above WCW 0.26790 0.59640 0.09362 0.04208 1.0 80 9Cedar Cr (trib to Horse Linto) 11 30 41 11 24 4 2 41Above WCW 0.26790 0.59640 0.09362 0.04208 1.0 15 1
Trinity trib subtotal: 70 190 260 70 155 24 11 260Non-reservation trib subtotal: 245 3284 3529 245 2948 192 145 3529
Reservation Tributaries-Hoopa ValleyCampbell Cr 0 0 0 0 0 0 0 0Above WCW 0.26790 0.59640 0.09362 0.04208 1.0 0Hostler Cr 0 0 0 0 0 0 0 0Above WCW 0.26790 0.59640 0.09362 0.04208 1.0 0Mill Cr 86 236 322 86 192 30 14 322Above WCW 0.26790 0.59640 0.09362 0.04208 1.0 118Pine Cr. (moved in 2007 to Klam tribs)Soctish Cr 0 0 0 0 0 0 0 0Above WCW 0.26790 0.59640 0.09362 0.04208 1.0 0Supply Cr 2 6 8 2 5 1 0 8Above WCW 0.26790 0.59640 0.09362 0.04208 1.0 3Tish Tang Cr 24 66 90 24 54 8 4 90Above WCW 0.26790 0.59640 0.09362 0.04208 1.0 33Other 0 0 0 0 0 0 0 0Above WCW 0.26790 0.59640 0.09362 0.04208 1.0 0
HVT reservation trib subtotal: 113 308 421 113 251 39 18 421Above WCW 0.26790 0.59640 0.09362 0.04208 1.0 154
Reservation Tributaries-Yurok Blue Cr 296 733 1029 296 667 33 33 1029 scales count 0.90956 0.04511 0.04533 1.0 70
Reservation tributaries subtotal: 409 1041 1450 409 918 72 51 1450
Natural spawner subtotal: 8113 44589 52702 8113 36566 5711 2314 52702
Total spawners: 9485 64203 73688 9485 52415 9339 2450 73688Angler HarvestKlamath River (below Hwy 101) 319 1191 1510 319 966 154 71 1510 scales 0.21277 0.63721 0.10260 0.04742 1.0 344 <=55
est-LRC CWT 1 15 1 0 17Klamath River (Hwy 101 to Weitchpec) 1559 2015 3574 1559 1825 111 80 3574 scales 0.44051 0.50633 0.03054 0.02261 1.0 1,167 <=55
mid-LRC CWT 4 38 3 0 45SURROGATE - Iron Gate+Bogus Weighted Totals
1700 13818 3737 163 19418Klamath River (Weitchpec to IGH) 155 1614 1769 155 1259 340 15 1769 IGH+Bogus 0.08756 0.71162 0.19244 0.00838 1.0 <=55
SURROGATE - Trinity Rec. Harvest below WCW - adults only
Trinity River (above Willow Cr. Weir) 146 483 629 146 389 57 37 629 TR LRC count 0.79064 0.12462 0.08475 1.0Grilse harvest rate<=54TR-up CWT 2 45 3 0 49 Paper CWTs
Trinity River (below Willow Cr. Weir) 36 272 308 36 216 34 22 308 scales 0.11940 0.69623 0.10974 0.07463 1.0 67TR-low CWT 0 6 1 0 7
Angler harvest subtotal: 2,215 5,575 7,790 2,215 4,655 696 225 7,790
Tribal HarvestKlamath River (Estuary) 43 19465 19508 43 13055 4216 2194 19508 scales count 0.6720 0.2141 0.1139 1.0 1,265 <=58cm
YTFP EST CWT 0 155 106 7 268Klamath River (101 to Trinity R) 39 4769 4808 39 3548 926 295 4808 scales 0.0081 0.7373 0.1930 0.0617 1.0 2,142 <=58cm
YTFP MU CWT 0 19 3 0 22Trinity River 96 4153 4249 96 3217 689 247 4249 scales 0.02350 0.75241 0.16397 0.06012 1.0 1447
HVT CWT 0 142 19 1 162Tribal harvest subtotal: 178 28387 28565 178 19820 5831 2736 28565
Total harvest: 2393 33962 36355 2393 24475 6527 2961 36355
TotalsIn-river run and escapement 11878 98165 110043 11878 76890 15866 5411 110043Angling drop-off mortality (2.04%) 45 114 159 45 95 14 5 159 0.02041 angling drop-off mortality rate on harvest Net drop-off mortality (8.7%) 15 2468 2484 15 1723 507 239 2484 0.08696 net drop-off mortality rate on harvest
Total in-river run 11938 100747 112686 11938 78708 16387 5653 112686 age comp of adults in total run total adults10.6% 69.8% 14.5% 5.0% 69.9% 14.6% 5.0% 89.4%
CALCULATED AGE
Feb 08 2010
Length Freq orSCALE AGE PROPORTIONS (unknowns)
17

AGE Total Total Escapement & Harvest 2 3 4 5 Adults Run
Hatchery SpawnersIron Gate Hatchery (IGH) 2,130 5,530 3,551 21 9,101 11,231Trinity River Hatchery (TRH) 801 1,485 2,961 5 4,451 5,252
Hatchery Spawner subtotal 2,931 7,015 6,512 26 13,552 16,483
Natural SpawnersSalmon River Basin 650 431 1,286 32 1,749 2,399Scott River Basin 1,228 167 3,227 51 3,445 4,673Shasta River Basin 3,621 1,222 1,456 63 2,741 6,362Bogus Creek Basin 1,565 1,076 1,911 14 3,001 4,566Klamath River mainstem (IGH to Shasta R) 834 960 3068 33 4,060 4,894Klamath River mainstem (Shasta R to Indian Cr) 365 415 1341 14 1,770 2,135Klamath Tributaries (above Trinity, including Pine Creek) 1,073 396 1,416 33 1,845 2,918Blue Creek 89 76 242 91 409 498
Klamath Basin subtotal 9,425 4,743 13,947 330 19,020 28,445
Trinity River (mainstem above WCW) 6,861 2,429 7,902 77 10,408 17,269Trinity River (mainstem below WCW) 394 140 454 4 598 992Trinity tributaries (above Reservation) 158 56 182 2 240 398Hoopa Reservation tributaries 385 136 443 4 584 969
Trinity Basin subtotal 7,798 2,761 8,981 87 11,830 19,628
Natural Spawners subtotal 17,223 7,504 22,928 417 30,850 48,073
Total Spawner Escapement 20,154 14,519 29,440 443 44,402 64,556
Recreational HarvestKlamath River (below Hwy 101 bridge) 521 36 99 7 141 662Klamath River (Hwy 101 to Weitchpec) 3,358 219 633 44 896 4,254Klamath River (Weitchpec to IGH) 160 285 236 1 523 683Trinity River Basin (above WCW) 194 54 227 0 281 475Trinity River Basin (below WCW) 75 14 65 0 78 153Subtotals 4,308 608 1,260 52 1,919 6,227
Tribal HarvestKlamath River (below Hwy 101) 302 2,546 14,102 1,062 17,710 18,012Klamath River (Hwy 101 to Trinity mouth) 187 445 2,122 70 2,636 2,823Trinity River (Hoopa Reservation) 152 234 1,667 12 1,913 2,065Subtotals 641 3,225 17,891 1,144 22,259 22,900
Total Harvest 4,949 3,833 19,151 1,196 24,178 29,127 TotalsHarvest and Escapement 25,103 18,352 48,591 1,639 68,580 93,683Recreational Angling Dropoff Mortality 2.04% 88 12 26 1 39 127Tribal Net Dropoff Mortality 8.7% 56 280 1,556 99 1,935 1,991
Total River Run 25,247 18,644 50,173 1,737 70,554 95,801
Appendix G. Age composition of the 2008 Klamath River fall Chinook run (finalized Feb 03, 2010).
18