km / h - 8 80 cities | creating cities for all
TRANSCRIPT

LIVABLE STREETS FOR ALL30 kmh / 20mph Speed Limits in Urban Neighbourhoods
MAXIMUM
30km / h

8-80 Cities Report ContributorsNatasja VanderBergGil PenalosaLauren SooleyAmanda O’RourkeRyan O’Connor
Released 2015

It’s Urgent: Time to slow downA message from 8 80 CitiesMore than 100,000 people are killed in traffic incidents around the world every month. Each day, nearly 750 people walking are killed by cars - that’s equivalent to four commercial planes full of passengers crashing on a daily basis (270,000 people annually). This problem is unacceptable, critically urgent, and entirely avoidable. For 8 80 Cities the solution is clear - slower speeds save lives. The time to act is now.
8 80 Cities is committed to creating vibrant cities and healthy communities where people can enjoy successful parks, streets and other public spaces. This includes improving the safety of people walking and cycling. Livable Streets for All, 30km/h Speed Limits in Urban Neighbourhoods presents the health, economic, environmental, and social benefits of slower speeds, and provides international case studies that prove safer streets are possible with the right policies and leadership. The evidence presented in this report shows that creating safer streets is not a technical or financial issue - it takes leadership at both the political and local levels. The purpose of this report is to advance the discussion and compel all cities to take action to reduce speed limits.
The benefits of establishing 30km/h speed limits in residential areas are clear. According to the World Health Organization1 a pedestrian has an 80 per cent chance of dying when hit at a speed of 50km/h, and a 5 per cent chance of dying when hit at 30km/h. A British Medical Journal study reported that slow zone areas reduced traffic casualities by 40 per cent.2 Slower speeds have also been linked to lower greenhouse gas emissions, and reduced respiratory problems for children. In addition to the health and safety benefits, slower speeds in residential areas allow city residents to comfortably walk on local streets and engage with their neighbours.
A growing number of cities worldwide are reducing speed limits. Cities like New York, London, Copenhagen, Portland, and Graz are proving that slower speeds can increase traffic efficiency and save lives. It is no coincidence that these cities consistently rank among the most livable in the world. We know that 30km/h speed limits in urban residential areas will save lives and substantially lower traffic-related injuries. Slower streets will also strenthen community life, boost public health, contribute to vibrant local economies, and improve the environment.
This report is a small community contribution from 8 80 Cities as part of our ongoing efforts to create successful cities and healthier communities. We appreciate your interest in this important issue, and we look forward to working with elected officials and communities members to lower speeds and create safer neighbourhoods.
1 World report on road traffic injury prevention. World Health Organization. 2004 www.who.int/violence_injury_prevention/publications/road_traffic/world_report/en/index.html2 20’s Plenty for Us. www.20splentyforus.org.uk
Emily MunroeExecutive Director, 8 80 Cities
Gil PenalosaFounder and Chair of the Board, 8 80 Cities

1234

CONTENT
INTRODUCTIONBENEFITS OF 30 KM/H STREETSCASE STUDIESMAKING IT HAPPEN

WHO WE ARE8 80 Cities is a non-profit organization based in Toronto, Canada. We are dedicated to contributing to the transformation of cities into places where people can walk, bike, access public transit, and visit vibrant parks and public places.
Our approach is to engage communities at all levels and across multiple sectors to inspire the creation of cities that are easily accessible, safe, and enjoyable for every-one. We have working experience in urban areas across Canada, the United States, Latin America, Europe, Asia, Australia, and New Zealand.
1
Would you send them outtogether for a walk or rideto the park?
1Think of a childyou love
23
If you wouldn’t,it needs to be improved.
If you would, it’s safe enough.
Think of an older adult you care about
Why 8 80?We are convinced that if everything we did in our public spaces was great for everyone from 8 years old to 80 years old, we would end up with healthy and vibrant communities for all.

REPORT OVERVIEW
2
This report is written in response to the increase in public awareness of speed limits on city streets. This document supports the movement towards lower speed limits and advocates for a change to be made in all cities and urban areas around the world. To address this, the report is divided into four sections:
Introduction: reviews the 30 km/h street movement and provides insight into the current situation in Toronto;
Benefits of 30 km/h Streets: outlines the advantages of lower speed limits on streets;
Case Studies: summarizes existing examples of change to 30km/h streets;
Making it Work: introduces the applicability of the concept in all urban areas; and concludes the report with recommendations for implementing 30km/h zones in any neighbourhood.

INTRODUCTION1


CURRENT SITUATION
5 LIVABLE STREETS FOR ALL - 8-80 CITIES - INTRODUCTION
Transportation is the primary function of a street or road. These pathways connect with each other, creating a larger transport network which connects people, places and spaces in a city. Currently however, high speed limits prioritize motor vehicles over other modes of transportation, which make streets unwelcoming to pedestrians and cyclists. In order to open up our streets to multiple transportation modes, the distinction should be made between streets – which connect people within neighbourhoods – and roads – which allow people to move as quickly as possible from one neighbourhood to another.
Our current speed limit system does not make a clear distinction between streets and roads. Charles Marohn, executive director of the non-profit Strong Towns, identifies the current North American street/road hybrid as a stroad. A stroad attempts to function like a road, moving cars quickly from one place to another. It features wide driving lanes, turning lanes to improve traffic flow and large scale developments bordering the edge of the sidewalk. Alternatively,
speed limits on stroads are low and the traffic signals, turning lanes and merging lanes function similarly to a street environment. Stroads have very bad safety records and are expensive to build. The stroad is too fast for good development and community, but also too slow to move people efficiently between neighbourhoods.
Value of Transportation Infrastructure vs. Speed Source: Charles Marohn, Strong Towns

LIVABLE STREETS FOR ALL - 8-80 CITIES - INTRODUCTION
MOVEMENT TOWARDS 30K/H STREETS
5 3025 4085 50
%KM/H
KM/H
KM/H
%%
6
“DECREASING VEHICLE SPEED TO 30 KM/H ON
RESIDENTIAL STREETS AND ADOPTING A CITYWIDE
SPEED LIMIT OF 40 KM/H ON ALL OTHER STREETS
WOULD IMPROVE SAFETY FOR CYCLISTS AND
PEDESTRIANS”
- Dr. David McKeown
In April 2012, the Toronto Board of Health released a report, Road to Health: Improving Walking and Cycling in Toronto to address active transportation in the city. In response to the report, Medical Officer of Health, Dr. David McKeown recommended a decrease in vehicle speed to 30 km/h on residential streets and 40 km/h on all other streets to improve safety for cyclists and pedestrians. Furthermore, he noted that a slight change in speed limits would have a large effect on pedestrian and cyclist safety.
Statistics show that 5% of pedestrians are likely to die as a result of a collision when a vehicle is travelling below 30 km/h. At 40 km/h, the risk increases to 25% and at 50 km/h, the risk of a pedestrian fatality is 85%.1
McKeown’s recommendations were met with criticism by many at city hall. However, across the globe, cities are re-evaluating the need for speed within urban centres. The following sections of this report will argue that reclaiming our neighbourhood streets for people by slowing car traffic down will promote vibrant, flourishing neighbourhoods by creating the space for human interaction and community.
Medical Officer of HealthCity of Toronto

30 KM/H STREETS2BENEFITS OF


SAFETY
305055
KM/H
KM/H
KM/H
45m
60m
75m
9 LIVABLE STREETS FOR ALL - 8-80 CITIES - BENEFITS OF 30 KM/H STREETS
Lower vehicle speed limits are safer for pedestrians and cyclists. If a collision occurs with a vehicle travelling at 50 km/h, the risk of pedestrian fatality is 85%. This risk decreases to 25% at 40 km/h and to 5% at speeds below 30 km/h. The difference in risk that a decrease in speed limits makes is a convincing argument for 30 km/h neighbourhoods.
In addition, stopping distance differs significantly between 30 km/h speeds and 50 km/h speeds. Stopping distance includes both the driver’s reaction time as well as braking. A vehicle travelling at 30 km/h requires a stopping distance of 45m. Driving at 50 km/h requires a stopping distance of 60m. Any increase in speed beyond 50 km/h significantly increases the required stopping distance. At 55 km/h a vehicle requires a stopping distance of 75m.
Research from the Netherlands reports an average injury decrease of 25% when speed limits of 50 km/h on urban residential streets are redesignated as 30 km/h zones.2

VISIBILITY
15-25 KM/H 30-50 KM/H
50-65 KM/H 70+ KM/H
LIVABLE STREETS FOR ALL - 8-80 CITIES - BENEFITS OF 30 KM/H STREETS 10
As vehicle speeds increase above 30 km/h, visibility of the street and surrounding area decreases. Increased speed prevents the brain from processing objects in our peripheral vision. Central vision is retained however; resulting is a tunnel-like field of vision on the road. This is problematic on wider streets where activity occurs on the side of the roadway, for example, parking and cyclists. The danger of decreased visibility is also recognised in residential areas where unexpected events occur, such as children chasing a ball into the street.
Additionally, at 30 km/h speeds drivers, pedestrians and cyclists are able to make eye contact with one another. Establishing eye contact between different road users increases visibility. The ability to establish appropriate eye contact drops rapidly as speed increases.3

ECONOMIC
Method Typical CostsTraffic Signs $75 - $100 per sign
Marked Crosswalk $100 - $300 for painted crosswalks, $3,000 for patterned concreteAshpalt Walkway $30 - $40 per linear foot for 5-foot wide walkway
Curb Ramps $1,500 per rampSpeed Humps $2,000 per humpTraffic Circles $4,000 for landscaped circle on asphalt streer, $6,000 on concrete street
Pedestrian Refuge Island $6,000 - $9,000, depending on materials and conditionsStreet Closures $6,500 for landscaped partial closure, $30,000 - $100,000 for full closure
Chokers $7,000 for landscape choker on asphalt street, $13,000 on concrete streetChicanes $8,000 for landscaped chicanes on asphalt streets, $14,000 on concrete streets
Bulbs $10,000 - $20,000 per bulbBike Lanes $10,000 - $50,000 per mile (to modify existing roadway)
Center Medians $15,000 - $20,000 per 100 feetTraffic Signals $15,000-60,000 for a new signal
Raised Intersection $70,000 + per intersection
Implementation of 30 km/h zones costs money. Whether minimal change is required or not, costs will always exist. However, these costs are significantly reduced when compared to traditional methods of traffic calming. Additionally, external costs related to environmental and health impacts will be reduced with the introduction of 30 km/h zones.
Designating streets with 30 km/h speed limits is a different approach than the one currently being adopted by North American cities. Currently, single streets are designated with 30 km/h speed limits, but are found among streets with 40 km/h or 50 km/h speed limits. In order to force drivers to slow down, physical traffic calming measures such as speed bumps and narrowed roadways are necessary. Although an integral component of creating safer streets, physical infrastructure changes require significant financial investments. On the other hand, 30 km/h zones
represent a cultural shift towards slower vehicle movement which does not require capital intensive roadway alterations. Implementation requires public awareness campaigns and enforcement, but not necessarily physical traffic calming measures. As such, 30 km/h zones can potentially be cheaper than our current system within which we attempt to physically slow traffic.
Additionally, designated 30km/h zones promote the use of active transport, where residents cycle and walk to nearby shops and services rather than drive. Thus, slow zones have economic benefits for the local economy by making it easier and more pleasant for residents to frequent local businesses. A study in London found that people who walked to town centres spent an average of £91 (around $164) per week, compared to car drivers (or passengers) who would spend £64 (around $115).4
1111 LIVABLE STREETS FOR ALL - 8-80 CITIES - BENEFITS OF 30 KM/H STREETS
Typical Traffic Calming Methods and Costs, 1996 Source: Making Streets that Work, City of Seattle. 1996.
Electricity and Heat Production
41%
Industry
18%
Light Duty Vehicle
10%
Other Transportation
14%
Residential
8%Other Sectors
9%

Electricity and Heat Production
41%
Industry
18%
Light Duty Vehicle
10%
Other Transportation
14%
Residential
8%Other Sectors
9%
12LIVABLE STREETS FOR ALL - 8-80 CITIES - BENEFITS OF 30 KM/H STREETS 12
ENVIRONMENT
There are both global and local environmental benefits of 30 km/h streets. Globally, designated 30 km/h zones help to combat climate change. Transportation is a large contributor to carbon emissions. Lower vehicle speed means less carbon dioxide emissions into the atmosphere. Additionally, a more consistent traffic flow occurs on roads which make walking, cycling and the use of public transit more enjoyable. The use of active transportation or public transit encourages traffic reduction and further reduces greenhouse gas emissions.
Carbon emissions per sector from fossil fuel use (exclude emissions from biofuel use or deforestationSource: Intergovernmental Panel on Climate Change. 2007
*Other sectors include commercial, public services, agriculture and energy industries other than electricity and heat production

BETTER AIR QUALITY
13
2x RISK OF CHILDRESPIRATORY PROBLEMS
IN AREAS OF INCREASED CONJESTION
13 LIVABLE STREETS FOR ALL - 8-80 CITIES - BENEFITS OF 30 KM/H STREETS
On a local scale, long-term improvements in air quality will reduce the negative heath effects related to carbon dioxide emissions. Additionally, reducing and slowing traffic on streets can have an immediate effect on the health of the residents who live on the streets. A limit of 30 km/h in streets improves air quality, as fewer exhaust gases are emitted. Children living near roads with heavy-duty vehicle traffic have twice the risk of respiratory problems as those living
near less congested streets. For seniors, air pollution can worsen existing health problems. Diverting heavy and fast-moving traffic out of neighbourhoods and onto artery roads (which have fewer residents living along them) has an immediate, quantifiable positive health benefits. Approximately 100,000 premature deaths are related to pollution each year in the WHO European Region. Emissions from road traffic account for a significant share of air pollution.
Source: World Health Organization. Air Pollution and Climate Change. 2013.

REDUCED NOISE
10 20 30 40
40
50
60
70
80
90
100
50 60 70 80 90 100 110 120 1300
SPEED KM/H
SOU
ND
LEV
EL (d
B)
14LIVABLE STREETS FOR ALL - 8-80 CITIES - BENEFITS OF 30 KM/H STREETS 14
Limiting vehicle speed to 30 km/h reduces traffic noise by up to 40% (3 dbA). At this rate, the source of traffic noise is almost halved. Ten cars travelling at 30 km/h make as much noise as five cars at 50 km/h.5
City dwellers grow accustomed to noise, and at times hardly seem to notice it. However, studies show that excessive noise levels harm human health and inter-fere with an individual’s daily activities. Noise has negative health effects, including disturbing sleep, and contributing to negative cardiovascular and psy-chophysiological effects. Noise reduces performance and provokes annoyance responses and changes in social behaviour. Noise, too, has negative effects on children’s sensitive and developing hearing. The WHO Children’s Environment and Health Action Plan for Europe has called for children to be protected from exposure to harmful noise, including traffic noise, at both home and school.
Speed vs. Sound under cruise conditions on average pavementSource: World Health Organization. Burden of disease from environmental noise
TEN
(10)
CAR
SFI
VE (5
) CAR
S
TRAVELLING AT
TRAVELLING AT
KM/H
KM/H
30
50 EQUAL TO =
NOISE OF

INCREASED PHYSICAL ACTIVITY
INC
REA
SED
RIS
K O
F C
ARD
IOVA
SCU
LAR
DIS
EASE
, D
IABE
TES
ETC
.
MORNING COMMUTE
LOW-LEVELPHYSICALACTIVITY
MID-LEVELPHYSICALACTIVITY
HIGH-LEVELPHYSICALACTIVITY
EVENING COMMUTE
1515 LIVABLE STREETS FOR ALL - 8-80 CITIES - BENEFITS OF 30 KM/H STREETS
Comfort levels of cyclists and pedestrians increase with a reduction in vehicle speed to 30 km/h. Therefore, a decrease in vehicle speed can increase opportunities for individuals to introduce physical activity into their daily routine, such as using active travel as a commuting option. Cycling and walking not only make people feel good, but also have significant health benefits. In 2011, 51% of Canadian adults were not getting the recommended levels of daily physical activity.6 Adopting cycling and walking as modes of transportation reduce a number of health-related problems including cardiovascular disease, diabetes and some cancers. Furthermore, regular exercise helps control weight, and contributes to mental well-being.
Increased exercise and active transportation options are beneficial to the healthy development of children. Youth make up only 12% of the population, but they account for 18% of pedestrians and 22% of cyclists involved in collisions.7 Parents are less likely to allow children to play outside in areas where there is a high threat from vehicle traffic. Active trips to school, for example, decline due to school location, accessibility by various modes and parental perceptions of safety.
For seniors, active transportation options can make a substantial difference to their well-being. In addition to the physical benefits listed, increased exercise in seniors can also contribute to improved mental health, by increasing opportunities for social interaction and reducing the risks associated with social isolation.

INCREASED HUMAN INTERACTION
DEC
REA
SED
HU
MAN
INTE
RAC
TIO
N
16LIVABLE STREETS FOR ALL - 8-80 CITIES - BENEFITS OF 30 KM/H STREETS 16
Designated 30 km/h zones make neighbourhoods better for the people who live in them. Active transportation increases opportunities for human interactions, such as meeting people and making friends. Residents living on streets with light vehicle traffic have, on average three more friends and twice as many acquaintances than people of similar demographics (i.e. income and age) living on streets with heavy traffic. Greeting someone as they pass is natural, and becomes more prevalent in situations where individuals can establish eye contact and are not distracted. Human interaction when confined to our motor vehicles is limited.
ACTIVE TRANSPORTATION
Active transportation in this report refers to human-powered forms of transportation, in particular walking and cycling. Additonally, it includes the use of mobility aids such as wheel chairs, and can also include other active transport options such as rollerblading and skateboarding. Active transportation can also be combined with other modes, such as public transit.

CASE STUDIES3


NEW YORK CITY, NY
1919 LIVABLE STREETS FOR ALL - 8-80 CITIES - CASE STUDIES
New York City’s Department of Transportation (DOT) has set up a Neighbourhood Slow Zone program to reduce speeds from 30mph to 20mph (30km/h). The program was first announced in 2010 as part of the DOT’s Pedestrian Safety Study and Action Plan, and supports the city’s effort to control speeding and prevent traffic fatalities. The Slow Zones are created in response to applications from neighbourhoods across the city. Applications are submitted by local community boards, civic associations, business improvement districts (BIDs) elected officials or other community institutions.
Applicants are encouraged to pick areas that: • Are approximately a quarter square mile (around 5 by 5 blocks)• Are primarily residential• Do not include wide, major streets or industrial or commercial areas• Have strong boundaries such as highways, parks, elevated trains, dead ends or major streets.
Applicants must provide evidence of community support and are judged on the following criteria8: • An analysis of traffic crashes inside the proposed zone, using official crash data records• Presence of schools, senior centers, daycare centers and small parks• Strength of the proposed zone’s boundaries• Location of bus and truck routes (ideally located outside or on the boundary of the proposed zone)• Proximity to subway stations• Letters of support• Fire stations and hospitals (should be outside or on the boundary of the proposed zone)• Feasibility for DOT to implement the zone
After each round of applications, the appropriate locations are selected. The DOT works with the community to develop a plan to install the Slow Zone. In addition to lowering the speed limit, the DOT also works with the community to install safety measures within the selected area in order to change driver behaviour. The goals of the Neighbourhood Slow Zone program are to lower the occurrence and severity of crashes and to enhance the quality of life in neighbourhoods.
In October 2013, the DOT announced its selection of 15 communities which would receive Neighbourhood Slow Zones over the next three years. These communities were selected from a total of 74 applications. These neighbourhoods will join the city’s 14 existing slow zones, which have been created since 2011. Locations were selected based on a number of traits including crash history, community support, and proximity of school and senior and daycare centres. Areas that included fire station, hospitals and truck routes were avoided. In 2016, the DOT plans to re-open the application process again.
Neighbourhood Slow Zones are established in small, self-sufficient areas consisting of mostly local streets with low traffic volumes and minimal through-traffic. Slow Zones are marked by blue gateway signs at all streets entering the area. Additionally, there are speed limit signs noting the 20mph speed limit zone, speed bumps and “20 MPH” stencilling on the road.

20LIVABLE STREETS FOR ALL - 8-80 CITIES - CASE STUDIES 20
CLAREMONT, BRONXOne of the first Neighbourhood Slow Zones was installed in the Claremont neighbourhood in the Bronx. Since 2011, the DOT has been using this area as a pilot 20mph slow zone and a model for future neighbourhoods. This neighbourhood was ranked No. 1 in killed or severly injured people per 100,000 residents. It also ranked No. 2 in the number of schools. The quarter mile zone features 14 speed bumps, 28 signs marking the 20mph speed limit and 46 “20MPH” stencils. Following the installation in 2011, the Claremont Slow Zone saw a 10% decrease in neighbourhood speeding.9
BEYOND LOWER SPEEDS: VISION ZEROIn the early days of his administration in 2014, Mayor Bill de Blasio announced a bold new program to eliminate all traffic fatalities in New York City. Vision Zero was established on the premise that all traffic crashes are preventable, and that there is no acceptable level of death or injury on city streets.
Shortly after launching Vision Zero, Mayor de Blasio enacted a citywide speed limit of 25mph (40km/h), while maintaining the option for residents to apply for a 20mph Neighbourhood Slow Zone. The citywide change took effect on November 7, 2014. The speed limit rollback took considerable leadership given the State of New York’s mandate that no local speed limits should be less than 30 mph. The Vision Zero program didn’t stop there.
The Vision Zero Action Plan identifies four key tools for creating safer streets10:1) Public dialogue and education
2) Law enforcement
3) Street design
4) Legislation Enact a 25 MPH citywide speed limit
Research from the NYC Department of Transportation shows that dangerous driver choices - like speeding and failing to yield - are the primary or contributing cause of 70% of pedestrian fatalities11. This is especially concerning in a city where 4,000 New Yorkers are seriously injured and more than 250 are killed each year in traffic crashes.
The Action Plan takes a holistic and comprehensive approach to reducing traffic fatalities. Vision Zero demonstrates that slower speed limits are not the only tool necessary for creating safer streets - albeit an important place to start. Legislation to reduce citywide speed limits mus also be met with a robust public educaion campaign, stronger law enforcement, and investments in smarter street design.
Host public workshops. Work directly with schools and senior centers to address the needs of the most vulnerable.Create neighbourhood-based action plansDrive education and awareness campaigns
Enforcing laws against risky driving behaviour (ie. speeding, improper turns, etc.)Increase red light cameras
Shortening crossing distances and adjusting signals at crosswalks50 safety intersection or corridor engineering projects in 2014New crosswalks and speed bumps
61st Street / Northern Boulevard: Vision Zero projects on this street include two new pedestrian islands, simplified vehicle movements, increased visibility for drivers, and a signal modification that gives pedestrians a “head start”
Safer Streets, Slower Speeds: November 2014

GRAZ, AUSTRIA
2121 LIVABLE STREETS FOR ALL - 8-80 CITIES - CASE STUDIES
In 1992, Graz became the first city in Europe to introduce speed limits for the whole city: 30 km/h on all residential areas/side roads and 50 km/h for all priority roads. This decision was made th the intent of increasing road safety and reducing pollution and noise.
The idea was initially greeted with opposition from the public. The former vice mayor of Graz recognized that it was difficult for people to vote on an issue before seeing the real effects of change and developed a two-year pilot project. The pilot project convinced the people living in Graz that 30km/h speed limits still allowed them to get around the city, but also made their streets more livable and hospitable to a variety of transportation options. After the two-year testing period, a large majority voted for the 30 km/h implementation. In 2003, an additional 23 km on 40 streets was added to 30 km/h zone. The final implementation resulted in almost 80% of city roads being set at 30 km/h speed limits.
The city saw a 12% drop in minor injuries and a 24% reduction in serious accidents after implementation of the reduced speed limit. The original decrease of accidents was attributed to the constant speed controls in place. However, without strict enforcement on the roads, accident levels rose again. Notably, approximately 80% of the accidents happened on roadways where the speed limit was 50 km/h. Since 2006, increased speed controls have been supported in order to improve traffic security.
56%
64%
44%
60%
72%77%
0%
10%
20%
30%
40%
50%
60%
70%
80%
90%
1985 1989 Aug-92 Sep-92 Mar-93 Jun-94
START OF PILOT PROJECT
START OF PUBLIC DEBATE
27182619 2646
2532 2480
2270
2019 2013
2282 22392351
20862191
21071996
0
500
1000
1500
2000
2500
3000
1982 1984 1986 1988 1990 1992 1994 1996 1998 2000 2002 2004 2006 2008 2009
29
1918
13
20
7
11 11
14
19
11
7
12 12
4
0
5
10
15
20
25
30
35
1982 1984 1986 1988 1990 1992 1994 1996 1998 2000 2002 2004 2006 2008 2009
Approval of 30 km/h speed limit12
Non-Lethal Accidents Caused By Individual Motor Car Traffic13
Fatal Accidents Caused by Individual Motor Car Traffic14
SPEED LIMITS INTRODUCED
SPEED LIMITS INTRODUCED

22LIVABLE STREETS FOR ALL - 8-80 CITIES - CASE STUDIES 22

UNITED KINGDOM
2323 LIVABLE STREETS FOR ALL - 8-80 CITIES - CASE STUDIES
There is a strong movement towards 30 km/h speed limits in the UK, led by an organization called 20’s Plenty for Us. This is a non-profit organization with nearly 250 local branches across the country promoting a default speed limit of 20mph on residential and urban streets.
In 2012, the percentage of pedestrian road fatalities in urban areas in the UK was 41%. Higher speed limits are recognised by the organization as decreasing public realm quality and creating barriers to active travel and healthy lifestyles. The speed limits are set without large investments in traffic calming measures, but instead depend on a culture shift and self- and community-enforcement.
Over 12 million people currently live in areas that have adopted or are in the process of adopting a policy of 30 km/h streets. Iconic cities including Oxford, Cambridge, Edinburgh and Liverpool have been joined by other UK areas such as Manchester, Birmingham and the City of London. Reducing speed limits to 30km/h has 80% support from the public and 75% support from drivers.15
PORTSMOUTH, UKIn March 2008, the City of Portsmouth city council set a 20mph speed limit on all residential roads and arterial routes. The decision was a collective commitment between councillors, traffic officers and the public. No traffic calming measures were installed. Instead, residents decided to simply drive slower. After implementation of the speed limits, it was found that the average speeds declined by 6-7mph on faster roads.16
57%
55%
49%
48%
47%
47%
44%
42%
42%
41%
41%
41%
40%
38%
38%
37%
36%
34%
32%
31%
30%
29%
28%
26%
20%
18%
0% 10% 20% 30% 40% 50% 60%
Ireland
Slovakia
Latvia
Spain
Romania
Poland
Hungary
Luxembourg
Austria
Estonia
United Kingdom
Czech Repulic
Cyprus
Finland
Germany
EU
Sweden
Portugal
France
Greece
Slovenia
Denmark
Italy
Belgium
Bulgaria
Netherlands
Edinburgh
Percentage of Pedestrian Fatalities, by Country16
EDINBURGH, UKEdinburgh became the first UK capital city to lay out a plan for a default speed limit of 20mph (30km/h) in January 2015. Implementation of the plan begins in late 2015 for residential roads and commercial districts. It will be completed in phases over the next 3 years. The new legislation will cover more than 80% of Edinburgh’s roads, including the entire city centre. The plan was celebrated by local advocates as an important step towards creating safer, more attractive and more enjoyable streets for everyone. Research also indicates that the new speed limits will improve vehicle flow through intersections.
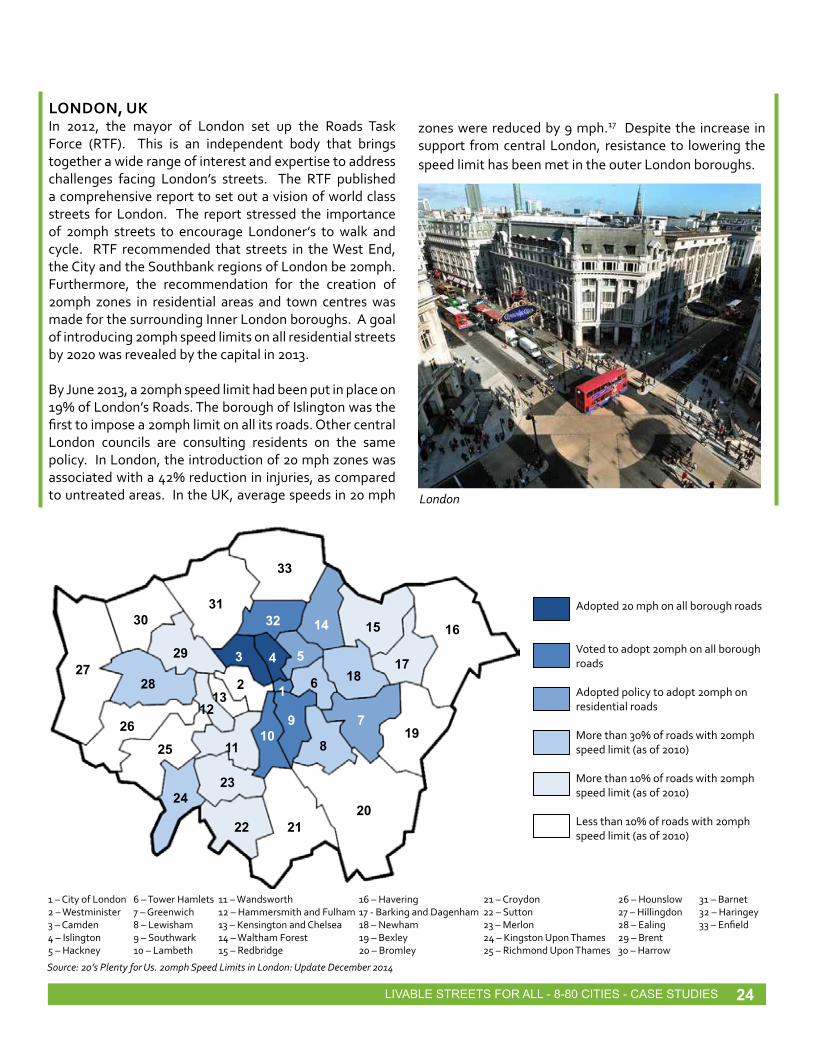
LONDON, UKIn 2012, the mayor of London set up the Roads Task Force (RTF). This is an independent body that brings together a wide range of interest and expertise to address challenges facing London’s streets. The RTF published a comprehensive report to set out a vision of world class streets for London. The report stressed the importance of 20mph streets to encourage Londoner’s to walk and cycle. RTF recommended that streets in the West End, the City and the Southbank regions of London be 20mph. Furthermore, the recommendation for the creation of 20mph zones in residential areas and town centres was made for the surrounding Inner London boroughs. A goal of introducing 20mph speed limits on all residential streets by 2020 was revealed by the capital in 2013.
By June 2013, a 20mph speed limit had been put in place on 19% of London’s Roads. The borough of Islington was the first to impose a 20mph limit on all its roads. Other central London councils are consulting residents on the same policy. In London, the introduction of 20 mph zones was associated with a 42% reduction in injuries, as compared to untreated areas. In the UK, average speeds in 20 mph
zones were reduced by 9 mph.17 Despite the increase in support from central London, resistance to lowering the speed limit has been met in the outer London boroughs.
12
3 4 5
6
7
8
910
11
1213
14 15 16
1718
19
202122
2324
2526
2728
29
3031
32
33
Adopted 20 mph on all borough roads
Voted to adopt 20mph on all borough roads
Adopted policy to adopt 20mph on residential roads
More than 30% of roads with 20mph speed limit (as of 2010)
More than 10% of roads with 20mph speed limit (as of 2010)
Less than 10% of roads with 20mph speed limit (as of 2010)
22LIVABLE STREETS FOR ALL - 8-80 CITIES - CASE STUDIES 24
London
1 – City of London2 – Westminister3 – Camden4 – Islington 5 – Hackney
6 – Tower Hamlets7 – Greenwich8 – Lewisham9 – Southwark10 – Lambeth
11 – Wandsworth12 – Hammersmith and Fulham13 – Kensington and Chelsea14 – Waltham Forest15 – Redbridge
16 – Havering 17 - Barking and Dagenham 18 – Newham19 – Bexley 20 – Bromley
21 – Croydon22 – Sutton23 – Merlon24 – Kingston Upon Thames25 – Richmond Upon Thames
26 – Hounslow27 – Hillingdon28 – Ealing29 – Brent30 – Harrow
31 – Barnet32 – Haringey33 – Enfield
Source: 20’s Plenty for Us. 20mph Speed Limits in London: Update December 2014

PORTLAND, OREGON
24
For years, community members and pedestrian and bicycle advocacy groups expressed concerns towards high vehicle speeds in Portland. Between 2006 and 2011, 654 cyclists and pedestrians in Portland were injured and 162 were killed.18 The Portland Bureau of Transportation (PBOT) indicated that speed was a major factor in the number and severity of crashes.
In 2011, the Oregon State Legislature passed a law (HB 3150) giving the City of Portland legal authority to reduce speed limits by 5 mph on residential streets that have fewer than 2,000 motor vehicles per day, travelling at less than 30 mph. The law also empowered the city to install traffic calming measures to reinforce the speed limits.19 In August 2012, a speed limit change from 25 mph to 20 mph was approved for a 70-mile network of neighbourhood greenways. Installation of 300 speed limit signs began in 2013. The goal of this implementation is to create safe and healthy neighbourhoods for people to explore on foot or by bicycle.
To ensure that the speed limit change remains effective, the City of Portland will design all new neighbourhood greenway projects and retrofit old projects with additional traffic calming methods. Traditional traffic calming measures have been recognised including speed bumps, diverters and islands. However, other innovative traffic calming measures such as intersection paintings have been used to help enforce the speed limits in neighbourhoods.
654162INJURED
KILLED
25 LIVABLE STREETS FOR ALL - 8-80 CITIES - CASE STUDIES

22LIVABLE STREETS FOR ALL - 8-80 CITIES - CASE STUDIES 26
CHART?? TEXT
20 mph Neighbourhood Greenways, PortlandSource: Portland Bureau of Transportation. 2012

30 KM/H STREETS IN ONTARIO
2931 LIVABLE STREETS FOR ALL - 8-80 CITIES - MAKING IT HAPPEN IN TORONTO
Momentum for creating Slow Zones is at its infancy stage in Ontario. All municipalities enforce reduced speed limits in school zones and designated community safety zones. Many neighbourhoods have installed traffic calming measures to slow traffic in residential areas. These efforts have led to greater public support for slower streets in Ontario. Existing precedents demonstrate that strong municipal pressure can create meaningful improvement. Provincial legislation passed in 1994 authorizes the City of Toronto to reduce speed limits to 30km/h on a street-by-street basis. This legislation marked a starting point, but reducing speeds one street at a time is difficult to implement and enforce. Lower speeds must be enacted on a neighbourhood or citywide basis to be effective.
An important step towards creating safer streets in Ontario began in early 2015 when the provincial government announced they will undertake comprehensive consultations with municipalities about reducing speed limits to 40km/h. The four options under consideration are: 1) maintaining the current 50km/h speed limit, 2) changing provincial law to reduce the limit to 40km/h, 3) allowing each municipality in Ontario to determine if it wants a lower residential speed limit, and 4) allowing municipalities to make the change in neighbourhoods that desire it.
Toronto
Thunder Bay
Ottawa
Oakville
Windsor
Sudbury

NORTH HAMILTON
30LIVABLE STREETS FOR ALL - 8-80 CITIES - MAKING IT HAPPEN IN TORONTO 32
Hamilton’s North End Neighbourhood is bounded by Hamilton Harbour to the north and west, Wel-lington Street to the east and the CN rail tracks to the south. The City of Hamilton conducted a traffic management study for the area in order to identify and resolve neighbourhood traffic problems. In 2007 a North End Traffic Management Plan (NETMP) was approved by council. The North End Neighbours (NEN) organization appealed this plan to the Ontario Municipal Board (OMB) after Council rejected its re-quest to have a neighbourhood-wide speed limit of 30 km/h.
On December 27th 2012, the OMB decision was made in favour of the Council approved plan. The decision reduced speed limits on most streets to 30 km/h and maintained a 50 km/h speed limit on James North and
Burlington Street.
Implementation of the plan was set to begin June 2013 and phased in over a two year period to 2015. The NETMP includes a 5-year pilot project to implement 30 km/h speed limits on all residential streets. Additional traffic calming measures include improved streetscaping and signage in order to convey to drivers that they are entering into an area where slower speeds are required. The plan also identifies a monitoring program to assess the impacts of the NETMP improvements. An implementation, review and analysis team was created to collect and update the data. Despite the initial disappointment with the OMB decision, the NEN have begun to work with the plan and are actively involved in the monitoring program.
Unveiling of 30 km/h street signs, August 2013
Unveiling of 30 km/h street signs, August 2013
North End Neighbourhood BoundariesSource: City of Hamilton

SLOWING TRAFFIC IN LOW AND MIDDLE-INCOME COUNTRIES
2527 LIVABLE STREETS FOR ALL - 8-80 CITIES - CASE STUDIES
Every six seconds, someone is killed or seriously injured on the world’s roads. Nearly 1.3 million people die and between 20 and 50 million people are injured each year in road crashes. More than 90% of the deaths occur in low- and middle-income countries even though those countries have less than half the world’s vehicles.20 Road traffic injuries pose a serious public health problem and, for low and middle-income countries, a substantial economic problem. Global losses due to road traffic injuries are estimated to total $518 billion and cost governments between 1 and 3% of their gross national product. In some cases, the loss experienced by low-income countries is more than the total amount of development assistance received.
Only 59 countries, which account for 39% of the world’s population (2.67 billion people) have implemented speed limits of 50 km/h or less on urban roads. Furthermore, these are the only countries which allow local authorities to reduce these speed limits.
The United Nations Decade of Action for Road Safety was launched in 2011 with a goal to stabilize and reduce the forecast level of road traffic fatalities around the world. The UN works with global partners to increase road safety activities conducted at the national, regional and global levels. Though beyond the scope of this report, it is important to note that investment and implementation of preventative measures in low and middle-income countries is essential to reduce the risk and severity of accidents.
Estimated road traffic death rate, per 100,000 (2014)Source: World Health Organization. Global Health Observatory (GHO) data: Road Safety. 2014
≤ 1010.1 - 2020.1 - 3030.1 - 4040.1 - 70Not applicableNo data

26LIVABLE STREETS FOR ALL - 8-80 CITIES - CASE STUDIES 28
Road Traffic Deaths Sign, IndiaMumbai, India
Latin America
Tanzania Cairo, Egypt Thika, Kenya
Pedestrian Crossing, India

MAKING IT HAPPEN4


SETTING THE STAGE FOR CHANGE
3133 LIVABLE STREETS FOR ALL - 8-80 CITIES - MAKING IT HAPPEN
Classifying urban roads for different purposes is not a new idea for cities. Engineers use road classification systems to design transportation systems that recognize the diversity of road uses and purposes. In most cities, every street owned by the municipality is classified by one of five categories: local road, collector road, minor arterial, major arterial or expressway. Some roads are intended to carry high volumes of traffic and others (the majority) are meant to carry lower traffic volumes at lower speeds.
In some cities, elected officials already have mechanisms to designate 30km/h speed limits. In Toronto, for example, special provincial legislation (enacted in 1994) authorized the City to post 30 km/h speed limits on streets with traffic calming devices. Currently, this legislative right is used to designate single streets as 30 km/h and requires infrastructure spending in the form of traffic calming measures.
Many cities are currently experimenting with slower speeds by enacting 30km/h limits on a street-by-street basis. However, these jurisdictions often enforce lengthy and complicated procedures that make it difficult for residents to reduce their local speed limits. Under Toronto’s current system, consideration for physical traffic calming can be initiated by: 1) a
City Councillor following a public meeting, 2) by a petition signed by 25% of affected households, or 3) by a survey conducted by a Ward Councillor. This request is the first step in the process. Upon receipt of the request, the Traffic Operations Staff of the City conducts a traffic analysis to determine the impact traffic calming measures would have on surrounding streets. The City then assesses the technical requirements, which include an analysis of current traffic speeds, traffic volume, block length, and the impact traffic calming would have on transit. In many cases, cities that allow slow zone neighbourhoods will require a formal polling process be completed. Finally, before any traffic calming measures are implemented, the neighbourhood poll must have a response rate of 50% of the affected households and an approval rate of 60% among those who respond.
Traffic calming measures can only be implemented on roads classified as local or collector. The case studies presented in the previous section demonstrate there is strong public support for slower streets in cities that implement 30km/h speed limits and traffic calming measures. This evidence suggests that enacting citywide speed reductions through pilot projects is an effective way to build a broad base of support for citywide 30km/h limits.
Road Class TOTALToronto and
East YorkEtobicoke - York North York Scarborough
Expressway 55 km 34 km 35 km 6 km 129 km
Major Arterial 159 km 244 km 173 km 180 km 757 km
Minor Arterial 124 km 97 km 59 km 131 km 411 km
Collector 115 km 188 km 212 km 256 km 771 km
Local 622 km 992 km 879 km 798 km 3,291 km
Road Classification, City of TorontoTOTAL 1,075 km 1,555 km 1,358 km 1,371 km 5,359 km

MAKING IT HAPPEN
32LIVABLE STREETS FOR ALL - 8-80 CITIES - MAKING IT HAPPEN 34
Cities around the world are proving that safer, slower streets are within reach. Lowering citywide speed limits to 30km/h takes leadership, collaboration, and a collective sense of urgency. These three foundational components can lead to happier and healthier communities in any city, large and small. This responsibility falls on all residents, public sector staff, and elected officials. It will take time, but there are immediate actions that all cities can take that will lead us in the right direction.
1) Enact legislation to reduce speed limits to 30km/hThe quickest way to create safer streets is to enact legislation that will cut speed limits to 30km/h in residential areas across entire jurisdictions. Modelled after New York City’s Vision Zero program, this change should be made after extensive public consultation and a substantial public awareness campaign. In contrast to taking the ‘slow zone’ approach, widespread speed limit reductions will shift behaviour and expectations more consistently. Although city-wide 30km/h limits are the goal, slow zone neighbourhoods may still be appropriate in cities that face particularly strong opposition to broader speed limit reductions. Slow zone neighbourhoods allow residents and public officials to experience the benefits of slower speeds prior to wider implementation. Appropriate slow zone neighbourhood include those with a high number of residences with families and schools. Implementing 30km/h zones would prove that slower speeds are primarily a neighbourhood-level initiative, and help dispel misconceptions that traffic efficiency would be affected on larger roads.
2) Create a culture of safter streetsAt the onset, establishing 30km/h neighbourhoods will require physical traffic calming measures and enforcement must be part of the implementation. Public education, new infrastructure investments, and enforcing fines must be combined to create an effective force for behaviour change. In the long-term
Slowing down, moving forwardgoal is to implement slow zones in a similar way as they have evolved in the United Kingdom, through a cultural shift rather than through costly enforcement. This can be achieved through inclusive community consultation, and robust public education campaigns. With political will and the support of elected officials and local residents, 8 80 Cities believes that 30 km/h zones could become a reality in any city.
3) Adopt a zero tolerance policy for pedestrian injuries and fatalitiesWe cannot accept any number of traffic-related fatalities and injuries as inevitable or acceptable. This applies to the most vulnerable road users (people walking and cycling), but also to motorists. These tragedies are preventable with the correct policy, design, and resident support. City councils everywhere must acknowledge these facts and begin taking action to address the behaviours, policies, outdated street design, and lack of enforcement that lead to death and injury. Adopting a comprehensive and holistic strategy like New York City’s Vision Zero would send a clear message that local elected officials are using all available tools to make the city’s streets safer for all.
4) Work with all stakeholders Significant legislative and behavioural changes cannot occur without a broad base of support and sense of urgency among all stakeholders. At the community level, local organizations (non-profits, resident associations, etc.) and institutions (schools, hospitals, etc.) must work together to present a strong and collective voice for change. At the policy level, all levels of government must collaborate to demonstrate leadership and to meaningfully consult with residents about their concerns. Senior levels of government must commit funding to offset the costs of running public education campaigns and traffic calming infrastructure investments which must be implemented to support speed reduction legislation.

32LIVABLE STREETS FOR ALL - 8-80 CITIES - MAKING IT HAPPEN 35
1. Erik Rosén, Ulrich Sander. Pedestrian fatality risk as a function of car impact speed. 2009.2. OECD (1998) Safety of vulnerable road users. Organisation for Economic Cooperation and Development OECD, Paris.3. Centre for Automotive Safety Research. Development of peripheral vision tests for driver assessment. 20054. Living Streets. Making the case for investment in the walking environment. 20125. World Health Organization. Burden of disease from environmental noise. Quantification of healthy life years lost. 20116. Statistics Canada. Canadian Health Measures Survey. 20117. US Department of Health and Human Services. Reducing Childhood Pedestrian Injuries. 2002.8. New York City Department of Transportation. Neighbourhood Slow Zones. 2014.9. Hristina Tisheva. First-Ever “Slow Zone” In NYC To Be Executed By Early October. The Bronx Times. 201110. City of New York. Vision Zero Action Plan. 201411. New York City Department of Transportation. Road Safety 2008-2011.12. Bristol Social Marketing Centre, University of West of England. Delivering soft measures to support signs. 201213. ibid14. ibid15.Source: Department for Transport, British Social Attitudes Survey – Attitudes to transport. 2012.16. 20’s Plenty for Us. www.20splentyforus.org.uk. 201317. International Transport Forum. Road Safety Annual Report 201318. Portland Bureau of Transportation. Portland Bike Survey 2012. 19. Bike Portland. Oregon Senate passes speed limit reduction bill. 201120. United Nations and Road Safety. 2011.
WORKS CITED

BLANK