knowledge, attitudes, and practice (kap) survey and...
TRANSCRIPT
Knowledge, Attitudes, and Practice (KAP) Survey and Barrier Analysis
for Infant and Young Child Feeding Practices
Sittwe and Pauktaw Townships,
Rakhine State – Republic of the Union of Myanmar
May – June 2015

2
Acknowledgements
This assessment was made possible by the hard work and dedication of the survey and data teams (listed below). A special thank you also goes out to the entire Nutrition Team in Sittwe and Pauktaw for their help with survey logistics, coordination, and translation. Finally, this assessment would not have been possible without SCI’s beneficiaries, who generously contributed their time and shared their experiences. We thank them for their cooperation and participation.
Annie Zhou Nutrition Consultant & Survey Manager
KAP Survey and Barrier Analysis Co-Facilitator and Team Leader: Kyaw Zaw Tun, Nutrition Project Coordinator KAP Survey & Barrier Analysis Individual Interviews: Bo Ni Helen Hla Hla Yee Hnin Ei Phyu Hnin Moe Ngwe Lae Yin Win Myat Kay Khine Myat Sandar Khine Myint Wai
Myo Myo Tun Myo Thant Zin Than Tun Hlaing Thet Mon Swe Thidar Pyone Thin Swe Zaw Htoo Zaw Zaw Htoo
Barrier Analysis Focus Group Discussions: Kyaw Moe Wai Saw Myat Thandar Data Entry: Aung Thein Kyaw Aung Lin Kyaw Kyaw Naing Myint Tun Phyu Phyu Win

3
EXECUTIVE SUMMARY
In early June 2012, conflict erupted between Buddhist and Muslim communities in Rakhine State, resulting a declaration of a State of Emergency by the Myanmar Government. The widespread inter-communal violence in and around the state capital of Sittwe claimed 78 lives, displaced 75,000 people from both communities to makeshift camps and destroyed 4800 buildings. In response to needs stemming from the conflict, Save the Children International’s (SCI) nutrition program started implementing Infant and Young Child Feeding (IYCF) activities in Sittwe Township in September 2012 and expanded in August 2013 to Pauktaw Township. In addition, antenatal and postnatal support services started in both Townships to optimize the health of mothers and infants, and an Outpatient Therapeutic Programme (OTP) in Pauktaw for the treatment of Severe Acute Malnutrition (SAM) was established. In order to monitor the progress of IYCF interventions and explore key barriers faced by caregivers, SCI conducted a Knowledge, Attitudes, and Practice (KAP) survey and Barrier Analysis in May-June 2015. The main objectives of the surveys were:
To assess trends in IYCF practices for children aged 0 to 23 months living in IDP camps in Sittwe and Pauktaw Townships, Rakhine State, Myanmar.
To determine barriers and facilitators to key IYCF behaviors for children aged 0-23 months living in IDP camps in Sittwe Rural and Pauktaw Townships, Rakhine State, Myanmar.
An exhaustive KAP was conducted in Sittwe Urban, Sittwe Rural and Pauktaw sites. Simple random sampling was used. Purposive sampling was used for the Barrier Analysis in Sittwe Rural and Pauktaw. The KAP survey found that both nutrition knowledge and program coverage increased from 2013, but there is a gap in converting knowledge to practice. For example, in all three locations at least 94% of caregivers knew as a minimum three out of four IYCF principles. Breastfeeding counsellors were named occasionally as influencers of IYCF practices whereas in 2013 they were almost never named. In Sittwe Rural and Pauktaw sites, Traditional Birth Attendants (TBAs) assist in almost 100% of deliveries and supplementation coverage for pregnant women is almost twofold that of 2013. However, only Pauktaw site has significantly improved its IYCF indicator progress compared to 2013, and in Sittwe Rural movement of the population and other challenges have led to some indicators decreasing. Moving forward, indicators that should be prioritized are exclusive breastfeeding for children under 6 months, timely complementary feeding, minimum dietary diversity, and consumption of iron-rich foods.
The Barrier Analysis found that key determinants separating doers and non-doers were self-efficacy, cues to action, and positive and negative attributes of the behavior. Doers found it easier than non-doers to remember to practice the recommended behaviors. Doers and non-doers also differ significantly in their recognition of advantages and disadvantages of practicing a behavior, with doers being more aware of positives and negatives. They are able to fully understand the implications of the action, whereas non-doers may only understand the positive and negative attributes at a superficial level. Finally, advice from BFCs and the absence of breastfeeding difficulties increased caregivers’ self-efficacy, or belief that they could practice exclusive breastfeeding. Key recommendations:
Shift program focus from knowledge to practice of key IYCF behaviors, particularly exclusive breastfeeding for children under 6 months, timely complementary feeding, minimum dietary diversity, and consumption of iron-rich foods. This could be implemented in the form of more supportive supervision and household visits by breastfeeding counsellors (BFCs), Community Development Facilitators (CDFs), and other SCI staff.
o In health education sessions, mother-to-mother support group meetings, and peer education sessions, focus on demonstrations and role playing to reinforce the transfer of knowledge that has occurred/is already occurring. Invite mothers to give testimonials.
o Conduct home observations around mealtimes (preparation and feeding) to ensure that best practices are being followed with regards to dietary diversity, food hygiene, hand washing, and interactive feeding.
4
o Utilize strong community presence and SCI data on birthdates to provide targeted support to caregivers of children at critical ages (after birth, before 6 months, 6-11 months).
o Involve older children and other family members in practicing appropriate feeding techniques. Since mothers are the primary decision makers when it comes to infant and young child feeding, mobilize mothers to take the lead in teaching their family members these techniques.
o Establish a referral process and a reminder system with MtMSGs and Peer Groups to help identify mothers with breastfeeding difficulties and to support mothers in remembering the key IYCF practices.
o Hold regular review meetings around supportive supervision visits with staff and volunteers to identify new IYCF issues, brainstorm solutions, and share successes.
Conduct a market assessment to identify key foods available during each season that can be procured cheaply to diversify children’s diets. Tailor cooking demonstrations each season to the locally available foods, focusing especially on underrepresented food groups such as dairy products, eggs, legumes and nuts, other fruits and vegetables, and iron-rich foods.
Incorporate Trials of Improved Practices (TIPs) Methodology to work with the community to find feasible solutions to infant and young child feeding challenges, especially for dietary diversity.

5
Table of Contents
ACKNOWLEDGEMENTS ........................................................................................................................ 2
EXECUTIVE SUMMARY ......................................................................................................................... 3
LIST OF ACRONYMS ............................................................................................................................. 6
1. INTRODUCTION ............................................................................................................................... 7
1.1 CONTEXT .......................................................................................................................................... 7 1.2 SURVEY OBJECTIVES .......................................................................................................................... 11
2. METHODOLOGY ............................................................................................................................. 11
2.1 SAMPLING METHOD ......................................................................................................................... 11 2.2 SAMPLE SIZE ................................................................................................................................... 11 2.3 SAMPLING PROCEDURE: SELECTING CHILDREN ......................................................................................... 12 2.4 PROGRAMME GOALS & INDICATORS ..................................................................................................... 13 2.5 QUESTIONNAIRE .............................................................................................................................. 15 2.6 TRAINING AND SUPERVISION ............................................................................................................... 15 2.7 DATA ENTRY AND ANALYSIS ................................................................................................................ 16
3. RESULTS ........................................................................................................................................ 17
3.1 SAMPLE CHARACTERISTICS .................................................................................................................. 17 3.2 INFANT AND YOUNG CHILD FEEDING ...................................................................................................... 17 3.2.1 BREASTFEEDING PRACTICES ........................................................................................................................ 18 3.2.2 COMPLEMENTARY FEEDING ........................................................................................................................ 22 3.3 NUTRITION PROGRAMME PERCEPTION .................................................................................................. 28 3.3.1 IMPACT OF NUTRITION EDUCATION SESSIONS ................................................................................................. 28 3.3.2 SUPPORT FOR BREASTFEEDING DIFFICULTIES .................................................................................................. 31 3.3.3 CARETAKER KNOWLEDGE OF IYCF PRINCIPLES ................................................................................................ 32 3.4 ANTENATAL/POSTNATAL SUPPORT ....................................................................................................... 32 3.4.1 ANC VISITS .............................................................................................................................................. 32 3.4.2 SUPPLEMENTATION DURING PREGNANCY ...................................................................................................... 36 3.4.3 DELIVERY ASSISTANCE ................................................................................................................................ 36 3.4.4 POSTNATAL SUPPORT ................................................................................................................................ 37
4. DISCUSSION ................................................................................................................................... 39
5. RECOMMENDATIONS ..................................................................................................................... 40
ANNEX 1. BARRIER ANALYSIS ............................................................................................................. 42
1. INTRODUCTION .................................................................................................................................. 42 2. OBJECTIVES .................................................................................................................................... 42 3. METHODOLOGY .............................................................................................................................. 42 4. RESULTS ........................................................................................................................................... 44 5. DISCUSSION ...................................................................................................................................... 45 6. RECOMMENDATIONS .......................................................................................................................... 48

6
LIST OF ACRONYMS
ACF Action Contre la Faim
ANC Antenatal Care
ANS Antenatal Support
BFC Breastfeeding Counsellor
CCCM Camp Coordination and Camp Management
CDF Community Development Facilitator
CHW Community Health Worker
EBF Exclusive Breastfeeding
GAM Global Acute Malnutrition
IDP Internally Displaced Persons
IYCF Infant and Young Child Feeding
IYCF-E Infant and Young Child Feeding in Emergencies
KAP Knowledge, Attitudes, and Practice
MHAA Myanmar Healthcare Assistants Association
MICS Multiple Indicator Cluster Survey
MoH Ministry of Health
MSF Medecins San Frontieres
MUAC Mid-Upper Arm Circumference
NGO Non-Governmental Organization
OTP Outpatient Therapeutic Program
PHC Primary Health Care
PLW Pregnant and Lactating Women
PNC Postnatal Care
PNS Postnatal Support
RNA Rapid Nutrition Analysis
RSB Rice Soya Blend
SAM Severe Acute Malnutrition
SC Stabilization Center
SCI Save the Children International
SMART Standardized Monitoring and Assessment of Relief and Transitions
TBA Traditional Birth Attendant
UNICEF United Nations Children's Fund
WASH Water, Sanitation, and Hygiene
WFP World Food Programme
WHO World Health Organization
WSB Wheat Soya Blend
7
1. Introduction
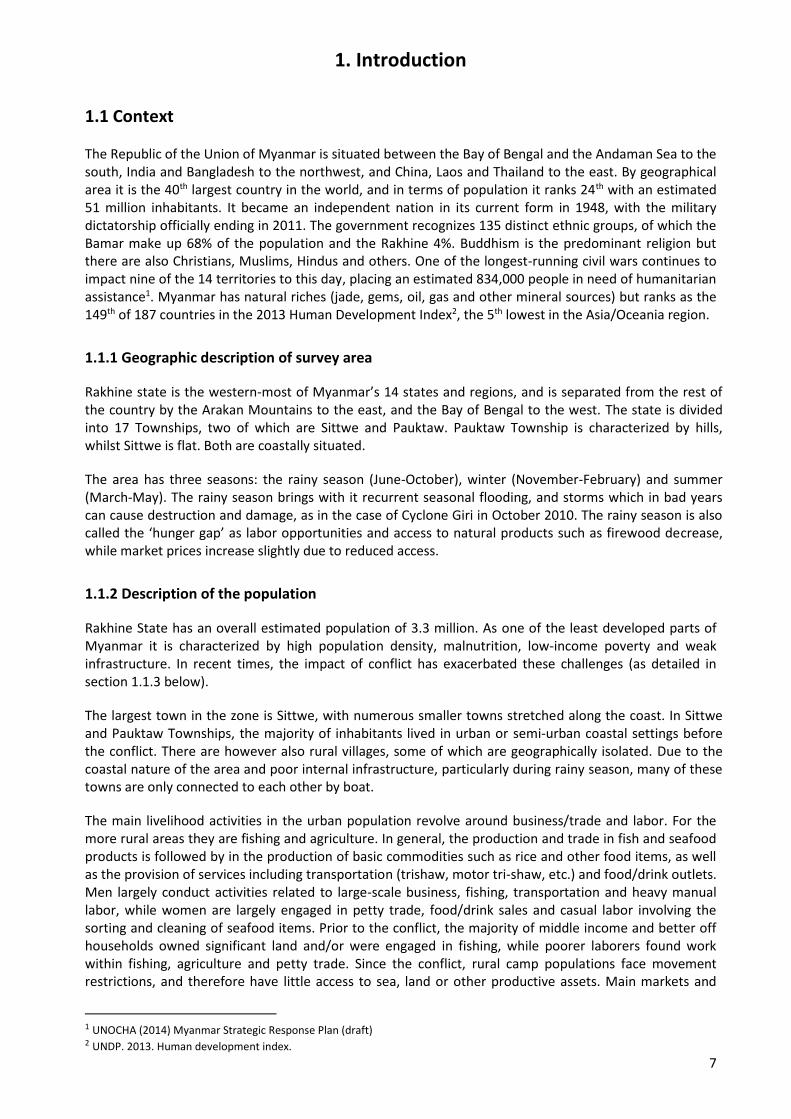
1.1 Context The Republic of the Union of Myanmar is situated between the Bay of Bengal and the Andaman Sea to the south, India and Bangladesh to the northwest, and China, Laos and Thailand to the east. By geographical area it is the 40th largest country in the world, and in terms of population it ranks 24th with an estimated 51 million inhabitants. It became an independent nation in its current form in 1948, with the military dictatorship officially ending in 2011. The government recognizes 135 distinct ethnic groups, of which the Bamar make up 68% of the population and the Rakhine 4%. Buddhism is the predominant religion but there are also Christians, Muslims, Hindus and others. One of the longest-running civil wars continues to impact nine of the 14 territories to this day, placing an estimated 834,000 people in need of humanitarian assistance1. Myanmar has natural riches (jade, gems, oil, gas and other mineral sources) but ranks as the 149th of 187 countries in the 2013 Human Development Index2, the 5th lowest in the Asia/Oceania region.
1.1.1 Geographic description of survey area
Rakhine state is the western-most of Myanmar’s 14 states and regions, and is separated from the rest of the country by the Arakan Mountains to the east, and the Bay of Bengal to the west. The state is divided into 17 Townships, two of which are Sittwe and Pauktaw. Pauktaw Township is characterized by hills, whilst Sittwe is flat. Both are coastally situated.
The area has three seasons: the rainy season (June-October), winter (November-February) and summer (March-May). The rainy season brings with it recurrent seasonal flooding, and storms which in bad years can cause destruction and damage, as in the case of Cyclone Giri in October 2010. The rainy season is also called the ‘hunger gap’ as labor opportunities and access to natural products such as firewood decrease, while market prices increase slightly due to reduced access.
1.1.2 Description of the population
Rakhine State has an overall estimated population of 3.3 million. As one of the least developed parts of Myanmar it is characterized by high population density, malnutrition, low-income poverty and weak infrastructure. In recent times, the impact of conflict has exacerbated these challenges (as detailed in section 1.1.3 below).
The largest town in the zone is Sittwe, with numerous smaller towns stretched along the coast. In Sittwe and Pauktaw Townships, the majority of inhabitants lived in urban or semi-urban coastal settings before the conflict. There are however also rural villages, some of which are geographically isolated. Due to the coastal nature of the area and poor internal infrastructure, particularly during rainy season, many of these towns are only connected to each other by boat.
The main livelihood activities in the urban population revolve around business/trade and labor. For the more rural areas they are fishing and agriculture. In general, the production and trade in fish and seafood products is followed by in the production of basic commodities such as rice and other food items, as well as the provision of services including transportation (trishaw, motor tri-shaw, etc.) and food/drink outlets. Men largely conduct activities related to large-scale business, fishing, transportation and heavy manual labor, while women are largely engaged in petty trade, food/drink sales and casual labor involving the sorting and cleaning of seafood items. Prior to the conflict, the majority of middle income and better off households owned significant land and/or were engaged in fishing, while poorer laborers found work within fishing, agriculture and petty trade. Since the conflict, rural camp populations face movement restrictions, and therefore have little access to sea, land or other productive assets. Main markets and
1 UNOCHA (2014) Myanmar Strategic Response Plan (draft) 2 UNDP. 2013. Human development index.

8
business centres also remain inaccessible, limiting opportunities for work, and leading to an increase in commodity prices for most goods of 10-20%. All communities within the area have seen an increase in fish and labor prices, as these were primarily areas of high Muslim involvement3. The main population group in the state is ethnic Rakhine (one of the centrally recognized 135 ethnicities in Myanmar) and is predominantly Buddhist. A vast majority of the Muslim minority is not recognized as citizens by the Myanmar government or the government of any other country and is therefore stateless. There have been decades of long-standing tension and division between the two groups with many root causes contributing to the outbreak of violence in 2012.
1.1.3 Conflict History
In early June 2012, conflict erupted between the Buddhist and Muslim communities, resulting in the Myanmar government declaring a State of Emergency. The widespread violence in and around the state capital of Sittwe claimed 78 lives, 4800 buildings were destroyed and population displacements forced 75,000 people from both communities to seek shelter in makeshift camps4. Widespread violence again broke out in surrounding townships in October 2012, including Pauktaw. Eighty-eight people were reported killed and thousands of homes were razed. An estimated further 64,000 people were displaced, the majority to hard-to-reach areas.
Temporary shelters were built and the government worked with international and national humanitarian agencies to cover life-saving needs such as food, non-food items, healthcare, Water, Sanitation and Hygiene (WASH) and education services. However, three years since the beginning of the crisis the situation remains severe; for 2015, an estimated 416,600 people (almost 13% of the population) are deemed in need of humanitarian assistance across the state5. Approximately 139,000 are Internally Displaced People (IDP), with 116,000 IDPs living across Sittwe and Pauk Taw 22 camps, and 23,000 others sheltered in host communities and villages6.
In Sittwe Township, the IDP camp population stands at 93,7077. 4,247 are Rakhine and the rest are Muslim. In Pauktaw Township, camps shelter 17,515 IDPs. The majority are Muslim IDPs, with the exception of 97 Rakhine. Numbers continue to fluctuate and further displacement is likely, both in light of camp-relocations instigated by local authorities, as well as by IDPs themselves. More than 24,000 Muslims have fled the country, mostly by dangerous sea crossings, which have already claimed some 400 lives8. Simultaneously, camp population sizes are increasing due to the movement restrictions and harsh conditions found in the host communities and surrounding areas9.
1.1.4 Services and humanitarian assistance
After the latest camp re-organization by the Rakhine State Government in September 2013, there are officially 5 urban and 12 rural IDP camps in Sittwe Township and 1 urban and 4 rural IDP camps in Pauktaw Township10 (see appendix 5 for names). In this context, urban camps host Rakhine populations and are defined by their closer proximity to town. Rural camps house Muslim populations and are mainly situated on flood plains (Pauktaw) and in coastal fields (Sittwe). All IDP communities, particularly rural ones, are still almost entirely reliant on humanitarian aid to cover all basic needs.
Although the majority of those affected are Muslim, both communities have suffered and have received humanitarian assistance. However, distrust and misperceptions about humanitarian aid continue to
3Rapid HEA, August 2013, SCI and Oxfam 4 Official Ministry of Information figures, 28th June 2012 5 UNOCHA (2015) Myanmar Strategic Response Plan 6 Ibid. 7 CCCM November 2013 8 UNOCHA (2014) Myanmar Strategic Response Plan (draft) 9 Rapid HEA, August 2013, SCI and Oxfam 10 CCCM November 2013

9
constrain access to vulnerable groups, as evidenced most recently with the suspension of MSF’s activities in February 2014 as well as the anti-Non-Governmental Organization (NGO) rioting in March 2014 and subsequent limited humanitarian activity.
1.1.5 Nutrition & health context According to Save the Children International (SCI)’s SMART survey conducted in urban and rural camps in Sittwe Township in late December 2012, low rates of acute malnutrition were found among children in urban IDP settings at 3.1% (1.3 –7.1 95% CI) GAM. However, children in rural IDP camps presented a mean prevalence of 14.4% (11.2 – 18.4 95% CI) GAM, very close to the World Health Organization’s (WHO) emergency threshold of 15%. More strikingly, in the same population, a high Severe Acute Malnutrition (SAM) prevalence of 4.5% (2.8 – 7.3 95% CI) was observed, which is above the 2% SAM threshold used by United Nations Children's Fund (UNICEF) to define a critical nutritional situation and immediate need for intervention. A Rapid Nutrition Analysis (RNA) conducted by SCI in Pauktaw in December 2012 indicated a similarly concerning scenario, with 20.8% GAM and 7.4% SAM rates. IDP camp children were more affected than those in the host community, with 0.5% SAM in the host communities but 9.8% SAM in the IDP camps. Results highlighted an urgent need for blanket supplementary feeding, therapeutic feeding interventions and support for Infant and Young Child Feeding practices in emergencies (IYCF-E)11. Another SMART survey conducted in January 2015 found significantly improved levels of GAM (8.6%, 7.0-10.5 95% CI) and SAM (1.3%, 0.7-2.3 95% CI) in Sittwe rural IDP camps compared to 2012. In Pauktaw, the GAM rate was estimated at 11.8% (8.9 – 15.5 95% CI) and SAM rate at 1.5% (0.8-2.9 95% CI). Stunting, or chronic malnutrition, remains above WHO’s emergency threshold of 40% in Sittwe Rural (46.4%, 43.4-49.4 95% CI) and Pauktaw (51.7%, 46.5-56.9 95% CI). Furthermore, a higher proportion of malnourished children come from the 6-23 month range than the 24-59 month range according to mid-upper arm circumference (MUAC) measurements. Pregnancy and the first two years of life are especially critical to a child’s health and development, and inadequate nutrition during this period can lead to permanent negative impacts on cognition, health, educational attainment, and economic productivity later in life. In comparison to the rest of the country, the 2009-2010 Multiple Indicator Cluster Survey (MICS) highlighted 10.0% GAM and 2.1% SAM rates globally. 47.8% of children were stunted, of which 12.7% were of the severe form. Underweight was present in 23.2% of children, with 5.6% in severe form. Rural areas were more affected by stunting and wasting, and under-nutrition was most common in Rakhine and Chin states12. SCI’s response in Pauktaw and Sittwe Townships encompasses nutrition, food aid, WASH, child protection, education, and camp coordination and camp management (CCCM) activities. Its main approach is to strengthen community-based activities, and to continue fostering acceptance by working with all communities. In response to the needs identified in the above assessments, the SCI nutrition program started implementing Infant and Young Child Feeding (IYCF) activities in Sittwe Township in September 2012, expanding in August 2013 to Pauktaw Township. Ante-Natal and Post-Natal Support (ANS/PNS) services to optimize mother and infant health were started in both Townships, as well the treatment of SAM through an Outpatient Therapeutic Programme (OTP) in Pauktaw. SCI currently leads the nutrition sector’s IYCF sub-sector technical working group. Other nutrition actors cover the rest of the Therapeutic and Targeted Supplementary Feeding Programme in Sittwe and Pauktaw for all IDP camps. There was a Stabilisation Centre (SC) in MSF’s rural Sittwe clinic until February 2014, when the Myanmar government suspended all MSF activities in Rakhine state. Another SC is run by the Ministry of Health (MoH) in Sittwe hospital. It accepts referrals from Pauktaw, but caretakers are often afraid to go to Sittwe due to the tensions. Supplementary feeding programs in both Sittwe and Pauktaw are delivered by the Myanmar Healthcare Assistants Association (MHAA). All IDPs receive World Food Programme (WFP) food rations, with supplementary rations given to Pregnant and Lactating Women (PLW) and children under five (U5) years of age. A small number of health actors
11Revised Rakhine Response Plan July 2012-June 2013, 16 November 2012 12 MNPED, MoH, UNICEF. 2010. Multiple Indicator Cluster Survey 2009-2010

10
run Primary Health Care (PHC) clinics across both Townships, including antenatal care (ANC), postnatal care (PNC), and delivery services. However needs are not all met, particularly for Pauktaw communities who are more remote and are often afraid to transfer to secondary care in Sittwe hospital. In addition, since MSF’s weekly PHC clinic was suspended in February 2014, Pauktaw camps have not had regular mobile clinic services. Health services such as routine immunizations and mass vaccination campaigns have resumed, led by the MoH in collaboration with NGOs.
All nutrition and health actors include basic health education on IYCF practices as part of their services, but SCI and Action Contre la Faim (ACF) are the sole actors to implement specific IYCF activities. For SCI, these include mother-to-mother support groups, health education/ behaviour change communication sessions, cooking demonstrations, one-to-one counselling, and problem solving sessions and Infant Feeding in Emergency kit distributions.
1.1.6 IYCF practices
As highlighted in Infant and Young Child feeding practices CARE guidelines (January 2010), more than 9 million children under 5 years of age die each year globally. 70% of these deaths occur in the first year of life, with malnutrition identified as the major cause. IYCF practices directly impact nutritional status and therefore the survival of children under 2 years of age.13IYCF activities are an essential part of any nutrition program, especially in a humanitarian crisis when IYCF practices may be affected.
Prior to SCI’s 2013 Knowledge, Attitudes and Practice (KAP) survey, some information on IYCF practices existed from SCI’s nutrition program, however, there was limited formal IYCF data available. SCI’s 2012 SMART survey for Sittwe and the 2012 RNA’s for Sittwe and Pauktaw IDP camps provided the following overview: in Sittwe 35% of caretakers reported having experienced infant feeding problems at the start of the crisis in July 2012, with 27% citing reduced milk production. 24% responded that between 10 and 25% of the children in their camps were infant formula dependents. According to the December 2012 SMART survey, exclusive breastfeeding (EBF) rates amongst 0-6 month infants was at 13.3% in urban Sittwe and 6.2% in rural Sittwe. Timely breastfeeding initiation occurred in 61.6% of rural infants and 51.1% of urban infants. At 24 months, 35.5% of the urban and 26.5% of the rural Sittwe infants were still receiving breast milk. Timely complimentary feeding had occurred for 21.2% of urban infants, whilst in only 12.8% for rural ones.
Rapid assessment during 2012 in Pauktaw, 34% of IDP camp infants had received EBF, and continued breastfeeding was currently being followed by 86.2% of cases. The Infant and Child Feeding Index score, a composite indicator of breastfeeding, dietary diversity and meal frequency rates, stood at 10.9%. This indicates differing issues across the target populations, but also a general concern for the inadequacy of current IYCF practices.
SCI’s KAP Survey conducted at the end of Dec 2013 revealed high rates of exclusive breastfeeding under 6 months (67% in Sittwe Urban, 80% in Sittwe Rural, 68% in Pauktaw). Timely initiation of breastfeeding occurred in 60% of infants in Sittwe Urban, 78% of infants in Sittwe Rural, and just 37% of infants in Pauktaw. Timely complementary feeding occurred in 79% of infants in Sittwe Urban, 82% of infants in Sittwe Rural, and 63% of infants in Pauktaw. Finally, 65% of children 6-23 months in Sittwe Urban, 62% in Sittwe Rural, and 46% in Pauktaw met the minimum dietary diversity requirements. Though these results seem to indicate that a majority of caregivers practice best IYCF behaviors, especially in Sittwe Urban and Sittwe Rural areas, these results must be viewed cautiously in light of the drastic difference from SMART and RNA results conducted just one year before.
For a national comparison, the 2009-2010 MICS highlighted that 75.8% of Myanmar mothers initiate breastfeeding within one hour of birth, and that timely initiation increases with a mother’s level of education and wealth, as well as in the urban setting. 23.6% of children are exclusively breastfed, with slightly higher prevalence rates in rural than in urban areas. Exclusive breastfeeding rates range from 1.3%
13 Infant and Young Child Feeding Practices: Collecting and Using Data: A Step-by- Step Guide. Cooperative for Assistance and Relief Everywhere, Inc. (CARE). 2010

11
in Rakhine to 40.6% in Kachin. By age 12-15 months 91% children are still breastfed, reducing to 65.4% at age 20-23 months. Continued breastfeeding of children aged 20-23 months is more common in rural areas than in urban areas, and is least common among mothers with higher education or considerable wealth. 80.9% of children aged 6-9 months receive breast milk and solid or semi-solid foods. Due to low levels of EBF, only 41% of children aged 0-11 months are adequately fed. This pattern was observed across both urban and rural settings14.
In order to determine current IYCF practices and ANS/PNS behaviors in Sittwe and Pauktaw IDP camps, and compare progress to previous years, SCI conducted the KAP and Barrier Analysis assessments from 9th May- 15th June 2015.
1.2 Survey Objectives
Main Objective
To assess trends in IYCF practices for children aged 0 to 23 months living in IDP camps in Sittwe and Pauktaw Townships, Rakhine State, Myanmar.
Specific Objectives
To measure interim IYCF indicators for children aged 0 to 23 months.
To assess progress of IYCF indicators compared to 2013.
To assess caregivers’ perception of current SCI nutrition interventions and their knowledge of IYCF practices.
To determine doers and non-doers of key IYCF behaviors for the Barrier Analysis.
To make recommendations for nutrition programming based on findings.
2. Methodology
Data collection took place from 9 May to 27 May 2015 in IDP camps in Sittwe urban and rural sites and Pauktaw. CARE’S KAP guide and WHO IYCF guidelines were used as the basis for this survey1516.
2.1 Sampling Method
Simple random sampling was chosen based on the availability of up-to-date under 2 population data from SCI’s nutrition program. These lists were updated in April 2015. This method was also chosen to ensure minimal sampling bias.
2.2 Sample Size
Three strata were identified, based on contextual homogeneity: Sittwe Urban, Sittwe Rural, and Pauktaw. The strata were defined based on factors such as access to food, healthcare, livelihoods, water & sanitation, population type & their health beliefs and practices, as well as duration of exposure to SCI’s IYCF programming so far.
14 MNPED, MoH, UNICEF. 2010. Multiple Indicator Cluster Survey 2009-2010 15 Infant and Young Child Feeding Practices: Collecting and Using Data: A Step-by- Step Guide. Cooperative for Assistance and Relief Everywhere, Inc. (CARE). 2010. 16 Indicators for assessing infant and young child feeding practices. World Health Organization. 2010.

12
The sample size calculation was based on seven IYCF core indicators and the hypothesized differences from the 2013 KAP. The ‘power’ was established at the standard 20% as per the CARE KAP calculator, and ‘design effect’ was 1 (as the method used was simple random sampling). Precision was adjusted to 10% (within the recommended range) to maintain a feasible sample size. The resulting sample size was multiplied by four to take account of the four 6-month age ranges covered between 0-23 months. Finally, 10% was added for non-response. The final sample sizes determined for each strata were:
Sittwe Urban: exhaustive
Sittwe Rural: 776
Pauktaw: 620
2.3 Sampling Procedure: Selecting Children
The 0-23 month old child, hereafter referred to as ‘child’, was classed as the primary sampling unit. All living children were part of the sample for this assessment; no child was excluded from the survey unless he/she had reached 24 months on the day of the interview.
The unit selection was completed using simple random sampling: all children in the population lists were given a unique number, and STATA software was used to generate random number tables taking into account the respective stratum’s sample size.
The mother or primary caretaker of all selected children was interviewed to collect data on IYCF practices, ANS/PNS, and program knowledge and perceptions.
Special Cases
Absence of child: when the child was absent, the existence of the child as well as his/ her age was confirmed by the family, and the interview was carried out with the mother.
Child passed away: If the child was dead, no interview was held, the child was not included as part of the sample, and the child was not replaced.
Absence of mother: in case the mother was not living with the child anymore, the primary caretaker (sister, grandmother, aunt, etc.) was selected as the respondent. If no caretaker was present, the team returned to the house later during the day or the next day. If still no caretaker was found, the child was recorded in the non-response category. The child was not replaced.
Refusal: in case of refusal from the parents to perform the interview, the child was recorded in the non-response category. The child was not replaced.
Absence of household: when a house was empty and neighbours confirmed that the family slept in the house the previous night and would come back (house not abandoned), the team returned there at the end of the day or the following day. When the household was still absent at the second visit, the child was recorded as absent. The child was not replaced.
Transfer: Recent population movement from one camp to another occurred between the listing/ sampling time and the day of the interview. Since the rainy season was approaching, some families moved to other areas to pass this season or to search for job opportunities. If a family moved within the intervention area, the child was still part of the survey and his/her mother was interviewed. If the family had moved outside of the intervention area, the child was not considered as part of the sample. The child was not replaced.
Age uncertainty: in case a caretaker was unsure of the exact date of birth of the child, the 15th of the month was used. If a child completed 24 months of age on the day of the interview, the child was not considered as part of the sample and the caretaker was not interviewed. The child was not replaced.

13
Disability: children with disabilities were eligible and included in this survey.
2.4 Programme Goals & Indicators
The SCI nutrition project’s aim is to promote optimal IYCF through:
- Early initiation (within one hour of birth) of exclusive breastfeeding; - Exclusive breastfeeding for the first six months of life; - Timely, nutritionally adequate and safe complementary foods after 6 complete months; - Continued breastfeeding for up to two years of age or beyond.
The program also aims to improve the access and use of antenatal and postnatal services by pregnant and lactating women. Knowledge, attitudes, and practice of these key behaviours were assessed during the survey. Analysis covered the whole target population and included both mothers/caretakers who participated in SCI program activities and mothers/caretakers who have not participated in program activities.
IYCF Baseline Indicators: Definitions and Formulas
1. Timely initiation of breastfeeding (children 0-23 months): Proportion of children 0-23 months who were put to the breast within the first hour of birth.
Number of children 0-23 months who were put to the breast within the first hour of birth
Total number of children 0-23 months
2. Exclusive breastfeeding under 6 months: Proportion of infants 0-5 months of age who were fed exclusively with breast milk in the past 24 hours (no other liquids, not even water, with the exception of drops or syrup consisting of vitamins, mineral supplements or medicines).
This definition follows the WHO 2001 recommendation17.
Number of infants 0-5 months who received breast milk in the past 24 hours and did not receive any other foods or liquids in the past 24 hours
Total number of infant 0-5 months old
3. Timely complementary feeding: Percent of infants 6-9 months of age who receive breast milk and a solid or semi-solid food in the previous 24 hours. Solid, Semi-solid, and soft foods are defined as mushy or solid foods, not fluids. They should be included after 6 completed months.
Number of infants 6-9 months who breastfed in the past 24 hours and who also received at least one food in the past 24 hours
Total number of infant 6-9 months
4. Introduction of solid, semi-solid or soft foods: Proportion of infants 6-8 months who receive solid, semi-solid, or soft foods.
17 WHO (2001): The optimal duration of exclusive breastfeeding. Report of an Expert Consultation.

14
Number of infant 6-8 months who received at least one food in the past 24 hours
Total number of infant 6-8 months
5. Continued breastfeeding at 1 year: Proportion of children 12-15 months old who are fed breast milk.
Number of children 12-15 months who received breast milk in the past 24 hours
Total number of children 12-15 months
This report also considers an alternative indicator suggested by WHO: continued breastfeeding at 2 years of age (when children are 20-23 months), calculated using the methodology above.
6. Minimum dietary diversity: Proportion of children 6-23 months who received food from 4 or more food groups in the past 24 hours. The 7 food groups used to calculate this indicator are:
1) Grain, roots tubers 2) Legumes and nuts 3) Dairy products (milk, yoghurt or cheese) 4) Flesh foods (meat, fish, poultry, or liver/organ meats) 5) Eggs 6) Vitamin A rich fruits and vegetable 7) Other fruits and vegetables.
Number of children 6-23 months who received food from 4 or more
of the 7 food groups in the past 24 hours
Total number of children 6-23 months
7. Minimum meal frequency: Proportion of breastfed and non-breastfed children 6-23 months of age who receive solid, semi-solid or soft foods the minimum number of times or more.
The expected number of meals depends on whether or not the child is breastfed, leading to two calculations as follows:
- If children are breastfed: 2 times meal/snacks for 6-8 months, 3 times for 9-23 months. - If they are not breastfed: 4 times for 6-23 months.
Number of children 6-23 months who received solid, semi-solid or soft foods
the minimum number of times or more during the previous day
Total number of children 6-23 months
8. Minimum acceptable diet: Proportion of children 6-23 months of age who receive a minimum acceptable diet (apart from breast milk). Calculation performed separately for breastfed and non-breastfed children.
Number of children 6-23 months who had at least the minimum dietary diversity
and minimum meal frequency in the past 24 hours
Total number of children 6-23 months

15
9. Consumption of iron-rich or iron-fortified foods: Proportion of children 6-23 months old who receive an iron rich or iron-fortified food that is specially designed for infants and young children or that is fortified in the home.
Number of children 6-23 months who received at least one iron-rich or iron-fortified food
Total number of children 6-23 months
10. Bottle feeding: Proportion of children 0-23 months who were fed with a bottle during the previous day.
Number of children 0-23 months who were fed with a bottle during the previous 24 hours
Total number of children 0-23 months
2.5 Questionnaire
The survey questionnaire is included in Annex 2. It includes IYCF principles, SCI program perception, SCI program participation, and ANS/PNS. Since WASH surveys were being conducted at the same time, WASH questions were not included to avoid duplication and survey fatigue.
This KAP survey covered households with children under 2 currently living in IDP camps. The results therefore cannot be extrapolated to the entire population, or to host communities.
2.6 Training and Supervision A total of 17 enumerators (10 local and 7 relocatable) were recruited. The enumerators had varying levels of experience. Training for the KAP survey and Barrier Analysis occurred over 5 days, and consisted of both theoretical and practical components. Topics covered by the training included:
Introduction to SCI and SCI’s nutrition programs in Rakhine
Overview of methodology and objectives
Data collection process
Questionnaire review and practice
Assessment tools (event calendar, visual aids)
Research ethics
Respondent management
Interview techniques
Data quality
Practical sessions included role playing and two half days of field practice on non-selected children in Thet Kay Pyin camp in Sittwe rural area. Enumerators that required further practice were paired with experienced enumerators during the first two days of data collection for additional practice and supervision. Enumerators were given feedback and notes on a daily basis.
After training, it was determined that relocatable enumerators would conduct the barrier analysis to allow for more uniformity in the way questions were asked. (Please see Annex 1 for more details on the Barrier Analysis.)
The KAP surveys were done individually by enumerators, and supervised by the Nutrition Consultant and Project Coordinator to ensure quality. The Nutrition Consultant and Project Coordinator checked questionnaires daily, clarifying any issues with enumerators and following up with respondents if necessary.

16
During data collection, it was discovered that some children had completed 24 months of age (confirmed by vaccination card and/or event calendar) and some families had moved out of SCI’s area of responsibility. As described in special cases, these children were not included in the sample and not replaced. This caused the final sample to be slightly lower than anticipated. However, since the sample was still sufficiently large enough to conduct the analysis, it was decided not to resample.
2.7 Data Entry and Analysis
The data entry team entered the data from 16 May – 18 June using Microsoft Excel. Data cleaning was conducted by the Nutrition Consultant and Database Officer. Corrections were done by the data entry team and checked again by the Nutrition Consultant and Database Officer.
Data cleaning was performed according to the CARE guidelines, and consisted of:
1. Finding cases with missing data or individuals who should not be in the dataset 2. Visually scanning data to make sure they are clean 3. Range checks 4. Consistency checks
Data analysis was conducted using STATA version 11. Data was disaggregated by sex and age whenever possible and chi squared tests were conducted to explore statistical linkages between parameters and across years.

17
3. Results and Discussion
3.1 Sample characteristics
Sample characteristics per stratum can be found in the table below. The sex ratios for under 2 children in each sample are within normal range18. Almost all respondents were female (98% Sittwe Urban, 96% Sittwe Rural, 97% Pauktaw), ranging in age from 15-68 in Sittwe Urban, 16-60 in Sittwe Rural, and 16-55 in Pauktaw. Household size averaged 5.6 members (range 3-14) in Sittwe Urban, 5.8 members (range 2-18) in Sittwe Rural, and 5.5 members (range 2-12) in Pauktaw.
Table 1: Sample non-response rate and sex ratio per stratum
Completed Non-response rate
Sex ratio boys/girls URBAN Sittwe 137 8% 0.83
RURAL Sittwe 632 9% 0.97 Pauktaw 501 9% 1.07
3.2 Infant and young child feeding
The table below summarizes the ten key IYCF indicators in terms of their estimated baseline prevalence, the program targets, as well as the prevalence rate found in this survey.
Table 2: Summary findings on IYCF CARE indicators19
Sample Indicator 2013 Baseline prevalence
Target endline prevalence
RESULTS (2015)
URBAN Sittwe Timely initiation of breastfeeding 60% 70% 70%
Exclusive breastfeeding under 6 months 67% 80% 82%
Timely complementary feeding 79% 87% 85%
Introduction of solid, semi-solid or soft foods 76% 85% 84%
Continued breastfeeding at 1 year 100% 100% 96%
Minimum dietary diversity 65% 75% 71%
Minimum meal frequency 76% 85% 74%
Minimum acceptable diet 56% 70% 54%
Consumption of iron-rich or iron-fortified foods 81% 90% 75%
Bottle feeding 10% 4% 8%
RURAL Sittwe Timely initiation of breastfeeding 78% 88% 58%***
Exclusive breastfeeding under 6 months 80% 90% 45%***
Timely complementary feeding 82% 92% 81%
Introduction of solid, semi-solid or soft foods 81% 91% 78%
Continued breastfeeding at 1 year 96% 99% 97%
Minimum dietary diversity 72% 85% 53%**
Minimum meal frequency 80% 90% 75%
Minimum acceptable diet 54% 70% 46%***
Consumption of iron-rich or iron-fortified foods 78% 88% 66%***
Bottle feeding 6% 2% 5%
RURAL Pauktaw
Timely initiation of breastfeeding 37% 52% 70%*** (((p-p (p-(p Exclusive breastfeeding under 6 months 68% 81% 73%
Timely complementary feeding 63% 75% 72%
18 Sex ratio normal range: [0.8-1.2] 19 *denotes significance at p=0.05, ** denotes significance at p=.01, *** denotes significance at p=.001

18
Introduction of solid, semi-solid or soft foods 61% 73% 70%
Continued breastfeeding at 1 year 81% 90% 97%***
Minimum dietary diversity 46% 61% 57%***
Minimum meal frequency 60% 74% 80%***
Minimum acceptable diet 41% 60% 53%***
Consumption of iron-rich or iron-fortified foods 78% 90% 79%
Bottle feeding 21% 10% 11%***
3.2.1 Breastfeeding practices
3.2.1.1 Initiation of breastfeeding
To ensure optimal infant nutrition and decrease neo-natal mortality by up to 22%, international recommendations are to start initiating breastfeeding within the first hour of life.
Table 3: Timely initiation of breastfeeding among children aged 0-23 months
Yes No N n % n % URBAN Sittwe 137 76 70% 41 30% RURAL Sittwe 632 366 58% 266 42% Pauktaw 495 346 70% 149 30%
The current practice is good in Sittwe Urban site, with 70% of children 0-23 months put to the breast within one hour of birth, an improvement (though not statistically significant) from 2013 when the same indicator was 60%. In Sittwe Rural, this indicator is 58%, significantly lower than 2013 when it was 78% (p<0.001). In Pauktaw, 70% of children 0-23 months were put to the breast within one hour of birth, a significant improvement (p<0.001) from 2013, when this indicator was 37%. For mothers who did not initiate breastfeeding within 1 hour of birth, 59% in Sittwe Urban, 85% in Sittwe Rural, and 84% in Pauktaw put their child to the breast between 1-2 hours after birth.
Of the mothers and caregivers who initiated breastfeeding within one hour of birth, 90% in Sittwe Urban, 89% in Sittwe Rural, and 92% in Pauktaw cited early initiation is good for their child as the primary reason. Other reasons mentioned include the child was hungry or crying (4% Sittwe Urban, 1% Sittwe Rural, 2% Pauktaw), and for the baby to be healthy/improve child’s intellectual development (8% Sittwe Rural, 5% Pauktaw). When asked who decided to initiate breastfeeding, caregivers mostly cited themselves (64% Sittwe Urban, 67% Sittwe Rural, and 64% Pauktaw). Other individuals who influenced the caregivers’ behaviour include Traditional Birth Attendants (TBAs) (2% Sittwe Urban, 12% Sittwe Rural, 20% Pauktaw), counsellors (4% Sittwe Urban, 13% Sittwe Rural, 10% Pauktaw), mother or mother in law (7% Sittwe Urban, 2% Sittwe Rural, 3% Pauktaw), husband (0.3% Sittwe Rural, 1% Pauktaw), and medical professional (21% Sittwe Urban, 4% Sittwe Rural, 1% Pauktaw).
For women who did not initiate breastfeeding within one hour of birth, the main reasons mentioned for initiating at the time they did were early initiation is good for the child (67% Sittwe Urban, 60% Sittwe Rural, 66% Pauktaw), for the baby to be healthy/improve the child’s intellectual development (23% Sittwe Rural, 15% Pauktaw), baby was hungry or crying (8% Sittwe Urban, 1% Sittwe Rural), mother was ill and could not breastfeed (6% Sittwe Urban, 5% Sittwe Rural, 8% Pauktaw), and breastfeeding difficulties (4% Sittwe Rural, 2% Pauktaw). Though mothers who did not initiate breastfeeding within one hour of birth know the benefits of early initiation of breastfeeding (good for the child), they are unable to carry out the best practice. Future adjustments to the program can focus on supporting mothers and caregivers to practice the best behaviour, and TBAs, CHWs, and BFCs should be encouraged to be present when a pregnant woman is giving birth to ensure that a volunteer is present to assist with the first feed of breastmilk. When asked who decided to initiate breastfeeding, caregivers responded similarly to those who initiated breastfeeding immediately: themselves (58% Sittwe Urban, 63% Sittwe Rural, 55% Pauktaw), TBA (10% Sittwe Rural, 19% Pauktaw), counsellors (3% Sittwe Urban, 11% Sittwe Rural, 23%

19
Pauktaw), mother or mother in law (6% Sittwe Urban, 7% Sittwe Rural, 7% Pauktaw), and medical professionals (28% Sittwe Urban, 7% Sittwe Rural, 1% Pauktaw).
3.2.1.2 Exclusive breastfeeding
Table 4: Exclusive breastfeeding rate among children aged 0-5 months
Yes No N n % n % URBAN Sittwe 34 28 82% 6 18% RURAL Sittwe 97 44 45% 53 55% Pauktaw 74 54 73% 20 27%
The exclusive breastfeeding rate in Sittwe Urban is 82%, an increase (not significant) from 2013 when it was 67%. In Sittwe Rural, the EBF rate is 45%, significantly lower than 2013, when it was 80% (p<0.001). The EBF rate in Pauktaw (73%) is similar to the rate from 2013 (68%) (no statistical difference). The most common item given to children who were not exclusively breastfed was water.
The difference between 2013 and 2015 measurements of exclusive breastfeeding in Sittwe Rural site must be interpreted cautiously, as the 2013 figure differs drastically from the EBF rate gathered during the 2012 SMART Survey (6%). Though the SMART survey utilizes a different methodology, it does not seem plausible that the 2013 rate could have improved so much from 2012. Additionally, the indicator from 2013 may be biased since SCI’s camp based volunteers and staff were used to collect data instead of independent enumerators.
The overall lack of improvement from 2013 may be a result of practice yet reflecting knowledge. There are still some beliefs about breastmilk not being sufficient, exclusive breastfeeding when the baby is ill, and baby being thirsty that need to be overcome. Another factor that may contribute to insignificant change in exclusive breastfeeding is confusion around the baby’s date of birth. The majority of birthdates in this survey came from the caregiver (52% Sittwe Urban, 85% Sittwe Rural, and 87% Pauktaw) rather than from a birth or vaccination card. Without precise knowledge of the child’s date of birth, it will be difficult for caregivers to know exactly when it is appropriate to introduce other liquids and complementary foods into a child’s diet.
3.2.1.3 Introduction of fluids
The exclusive breastfeeding result is confirmed by the recall question that asks when the caregiver started giving the child drinks other than breastmilk – 70% of caregivers in Sittwe Urban, 63% of caregivers in Sittwe Rural, and 73% of caregivers in Pauktaw reported giving their child drinks other than breastmilk after the child reached 6 months of age. Caregivers introducing liquids within the first day of life were low: 4% (n=6) in Sittwe Urban, 5% (n=33) in Sittwe Rural, and 2% (n=12) in Pauktaw. In Sittwe Rural and Pauktaw, these are significant differences from 2013, when the rate was 15% in Sittwe Rural and 31% in Pauktaw (p<0.001).
The main reason cited for giving the child drinks other than breastmilk before 6 months include it is better for my baby (19% Sittwe Urban, 32% Sittwe Rural, 36% Pauktaw), mother’s milk production is insufficient (22% Sittwe Urban, 18% Sittwe Rural, 15% Pauktaw), baby was thirsty (16% Sittwe Urban, 24% Sittwe Rural, 17% Pauktaw), baby was sick (9% Sittwe Urban, 11% Sittwe Rural, 19% Pauktaw), mother had breastfeeding difficulties or was sick (16% Sittwe Urban, 1% Sittwe Rural, 5% Pauktaw), and baby had to drink something else before breastfeeding (6% Sittwe Urban, 4% Sittwe Rural, 2% Pauktaw). These responses are visualized in Figure 1.
In comparison, caregivers who gave their children other liquids after 6 months also cited it is better for my baby, my baby was thirsty, and mother’s milk is insufficient as the main responses. However, hardly any caregivers in this category (<1.5% in each area) cited baby was sick as a reason to introduce other liquids.

20
With exclusive breastfeeding, it seems like the messages of WHY children should be exclusively breastfed are not yet reaching the mothers (as evidenced by the reasons cited for introducing other liquids before 6 months). Exclusive breastfeeding messages should focus on importance of breastmilk for a sick baby and consequence of feeding liquids before 6 months to dispel beliefs that it’s better for the baby.
Figure 1: Main reason for introducing non-breastmilk liquids before 6 months
When caregivers did give their child drinks other than breastmilk (whether before or after 6 months), the majority recalled first giving plain water (78% Sittwe Urban, 87% Sittwe Rural, 90% Pauktaw). Other items mentioned included sugar water/glucose/honey (6% Sittwe Urban, 15% Sittwe Rural, 18% Pauktaw), powdered or fresh animal milk (12% Sittwe Urban, 5% Sittwe Rural, 3% Pauktaw), infant formula (5% Sittwe Urban, 4% Sittwe Rural, 1% Pauktaw), and other liquids/foods (36% Sittwe Urban, 41% Sittwe Rural, 40% Pauktaw) such as cooked rice, broth, tea, rice, anti-flatulent, bread, and WFP rations.
The main person who decided to introduce fluids was the mother/caregiver (64% Sittwe Urban, 74% Sittwe Rural, 72% Pauktaw), TBA (0% Sittwe Urban, 4% Sittwe Rural, 9% Pauktaw), counsellor (4% Sittwe Urban, 10% Sittwe Rural, 9% Pauktaw), mother or mother-in-law (11% Sittwe Urban, 6% Sittwe Rural, 4% Pauktaw), husband (2% Sittwe Urban, 1% Sittwe Rural, 1% Pauktaw) and medical professional (18% Sittwe Urban, 6% Sittwe Rural, 4% Pauktaw). These values are similar to 2013 values in that mothers/caregivers are the primary decision makers when it comes to feeding of non-breastmilk liquids and the husband plays a very minor role. However, influence of the mother/mother-in-law has decreased from 2013, when it was 16% in Sittwe Rural and 14% in Pauktaw, and the influence of Breastfeeding Counsellors has increased from 2013, when it was 0% in Sittwe Urban, 3% in Sittwe Rural, and 0% in Pauktaw. Similarly to the indicator on initiation of breastfeeding, nurses and medical professionals were more influential in urban areas whereas TBAs and volunteers were more influential in rural areas. These responses are visualized in Figure 2.
Figure 2: Main person who decided to initiate feeding non-breastmilk liquids to the child
36%
15%
17%
19%
5%
2%
6%
32%
18%
24%
11%
1%
4%
10%
19%
22%
16%
9%
16%
6%
13%
0% 5% 10% 15% 20% 25% 30% 35% 40%
It is better for my baby
Mother's milk is insufficient
Baby was thirsty
Baby was sick
Mother had breastfeeding difficulties/was ill
Baby must drink something before breastfeeding
Other
Main reason for Introducing Non-Breastmilk Liquids before 6 months
Sittwe Urban Sittwe Rural Pauktaw

21
72%
9%
9%
4%
1%
4%
74%
4%
10%
6%
1%
6%
64%
0%
4%
11%
2%
18%
0% 10% 20% 30% 40% 50% 60% 70% 80%
Mother/caregiver
TBA
Counsellor
Mother or mother-in-law
Husband
Medical professional
Main person who decided to initiate non-breastmilk liquids
Sittwe Urban Sittwe Rural Pauktaw

22
3.2.1.4 Continued breastfeeding
Continued breastfeeding at one year was very high across all areas, with 96% of children in Sittwe Urban, 97% of children in Sittwe Rural, and 97% of children in Pauktaw still being breastfed at 12-15 months. In Pauktaw, this is a statistically significant improvement from 2013, when the rate was 81% (p<.001).
Continued breastfeeding at two years (measured among children 20-23 months) drops to 88% in Sittwe Urban, 84% in Sittwe Rural, and 78% in Pauktaw. There is no statistically significant difference from 2013.
The high rates of continued breastfeeding in Sittwe Rural and Pauktaw sites may be supported by Muslim beliefs, which encourage boys to be breastfed until 2 years of age and girls to be breastfed until 2.5 years of age.
Table 5: Continued breastfeeding rate among children aged 12-15 months
Yes No N n % n % URBAN Sittwe 23 22 96% 1 4% RURAL Sittwe 87 84 97% 3 3% Pauktaw 74 72 97% 2 3%
Table 6: Continued Breastfeeding rate among children aged 20-23 months
Yes No N n % n % URBAN Sittwe 24 21 88% 3 12% RURAL Sittwe 101 85 84% 16 16% Pauktaw 82 64 78% 18 22%
3.2.1.5 Bottle feeding
Bottle feeding can pose a serious risk to infant health, especially in camp environments where access to water and clean sanitation is not always guaranteed. The bottle feeding rate for children aged 0-23 months is 8% in Sittwe Urban, 5% in Sittwe Rural, and 11% in Pauktaw. In Pauktaw, this indicator is significantly lower compared to 2013, when it was 21% (p<0.001).
In Sittwe Rural, bottle feeding is significantly associated with age (p=.002). Ten percent of children in the 6-11 month age group bottle feed; in comparison, the bottle feeding rate in each of the other age groups is less than 4%.
Table 7: Bottle feeding rate among children aged 0-23 months
Yes No N n % n % URBAN Sittwe 136 11 8% 125 92% RURAL Sittwe 631 34 5% 597 95% Pauktaw 499 55 11% 444 89%
3.2.2 Complementary feeding
An overview of the diet of the surveyed children in the last 24 hours (see figure 3 below) presents trends in feeding practices. The patterns vary slightly between samples. In Sittwe Urban, children are exclusively breastfed at birth. At 2-3 months, some liquids are introduced prematurely but by 8-9 months, all children

23
receive both breastmilk and complementary foods. In Sittwe Rural, non-breastmilk liquids are introduced at a very early age, sometimes even as early as 0-1 months. A small portion of caregivers feed complementary foods to their children early, when they are between 2-5 months of age, while other caregivers continue a breastmilk and liquid diet for their children until 15 months. In Pauktaw, children between 0-1 months are exclusively breastfed, but some other liquids and foods are introduced beginning at 2-3 months. At 6-7 months, the majority of children have begun complementing breastmilk with soft foods, but like Sittwe Rural site, a small percentage of caregivers keep their children on liquid diets until one year of age.
Figure 3: 24-hour recall diet summary of children aged 0 – 23 months
0%
20%
40%
60%
80%
100%
0-1 2-3 4-5 6-7 8-9 10-11 12-13 14-15 16-17 18-19 20-21 22-23
Age (months)
SITTWE URBAN (n=137)
Exclusive breastfeeding Breastmilk + other liquids
Breastmilk + complementary foods Complementary foods
0%
20%
40%
60%
80%
100%
0-1 2-3 4-5 6-7 8-9 10-11 12-13 14-15 16-17 18-19 20-21 22-23
Age (months)
SITTWE RURAL (n=632)
Exclusive breastfeeding Breastmilk + other liquids
Breastmilk + complementary foods Complementary foods

24
3.2.2.1 Timely complementary feeding and introduction of solid, semi-solid or soft food
The percentage of infants 6-9 months receiving complementary food is 85% in Sittwe Urban, 81% in Sittwe Rural, and 72% in Pauktaw. There is no statistically significant difference from 2013.
In Sittwe Urban, 64% of caregivers reporting introducing soft foods at 6 months, 17% introducing at 7 months, 6% introducing at 8 months, and 1% introducing at 9 months. In Sittwe Rural, 71% of caregivers reported introducing soft foods at 6 months, 14% introducing at 7 months, 2% introducing at 8 months, and 1% introducing at 9 months. In Pauktaw, 72% of caregivers reported introducing soft foods at 6 months, 16% introducing at 7 months, 4% introducing at 8 months, and 1% introducing at 9 months.
Thirteen percent of caregivers in Sittwe Urban, 8% of caregivers in Sittwe Rural, and 2% of caregivers in Pauktaw reported introducing soft foods to their child before 6 months. Comparing the data for introduction of solid, semi-solid or soft foods and introduction of non-breastmilk liquids, we see that the introduction of liquids constitutes a larger risk to infants under 6 months of age rather than feeding of soft foods.
Table 8: Timely complementary feeding rate among children aged 6-9 months
Yes No N N % n % URBAN Sittwe 26 22 85% 4 15% RURAL Sittwe 138 112 81% 26 19% Pauktaw 94 68 72% 26 28%
Proportion of children aged 6-8 months receiving solid, semi-solid or soft food in the past 24 hours demonstrated a similar trend as the timely complementary feeding indicator, with 84% of children 6-8 months in Sittwe Urban, 78% of children in Sittwe Rural, and 70% in Pauktaw receiving solid, semi-solid, or soft foods during the previous day.
Table 9: Introduction of solid, semi-sold, soft foods among children aged 6-8 months
0%
20%
40%
60%
80%
100%
0-1 2-3 4-5 6-7 8-9 10-11 12-13 14-15 16-17 18-19 20-21 22-23
Age (months)
PAUKTAW (n=501)
Exclusive breastfeeding Breastmilk + other liquids
Breastmilk + complementary foods Complementary foods

25
Yes No N n % n % URBAN Sittwe 19 16 84% 3 16% RURAL Sittwe 95 74 78% 21 22% Pauktaw 81 57 70% 24 30%
3.2.2.2 Minimum dietary diversity, meal frequency and acceptable diet
The results below highlight that 71% of children aged 6-23 months in Sittwe Urban, 53% of children aged 6-23 months in Sittwe Rural, and 57% of children aged 6-23 months in Pauktaw received a sufficiently diverse diet to cover their nutritional needs. In Sittwe Rural, this is a significant decrease from 2013, when 62% of children 6-23 met dietary diversity (p=.005). In Pauktaw, this is a significant improvement from 2013, when just 46% met the minimum dietary diversity (p<.001).
Table 10: Minimum dietary diversity rate among children aged 6-23 months
Yes No N n % N % URBAN Sittwe 99 70 71% 29 29% RURAL Sittwe 503 267 53% 236 47% Pauktaw 396 225 57% 171 43%
There are several developments that may help to explain the decrease in minimum dietary diversity in Sittwe Rural site. Firstly, there are now fewer donors and fewer distributions taking place in the camps, which translates into fewer food options and fewer resalable goods for IDPs. In 2013, IDPs in Sittwe Rural were able to diversify their diets through distributions of eggs, dried fish, and ready-made foods or by selling non-food items they did not need, but now that distributions have decreased, caretakers no longer have the same resources available to them. Additionally, about half of the children receiving rations are not eating the entire portion. Those who do not use the rations for themselves are selling them. Though we do not know what the income gained from selling rations is used for, it is possible that it is used for items other than food.
In Pauktaw, we do not see the same decrease in minimum dietary diversity that we see in Sittwe Rural because from the beginning Pauktaw had fewer donors than Sittwe Rural due to challenges in access. The differences in remoteness and available resources make it difficult to compare these heterogeneous populations.
In Sittwe Urban and Sittwe Rural, the dietary diversity indicator is associated with child’s age (p<.001). In the 6-11 month age range, 42% of children in Sittwe Urban and 41% of children in Sittwe Rural meet the minimum dietary diversity requirement. In the 12-17 month range, this figure jumps to 89% in Sittwe Urban and 57% in Sittwe Rural. Finally, in the 18-23 month range, 82% of children in Sittwe Urban and 64% of children in Sittwe Rural consumed food from at least four groups the previous day. These results suggest that while all children 6-23 months of age would benefit from additional support for improving dietary diversity, children in the 6-11 month range are especially vulnerable and may require further attention.
The figures below show percentages by number of food groups consumed. A small percentage of children (less than 4% in each area) who had begun complementary feeding ate from 0 food groups during the previous day. This was due to illness or consumption of sweet sugary foods that did not fall into one of the 7 categories calculated in the dietary diversity indicator.
Figure 4: Number of food groups consumed by children aged 6-23 months

26
The figures below summarise the types of foods eaten by children 6-23 months old according to location and food group. In all three samples, the almost all children consumed items from the ‘grains, roots, tubers’ group. This can be explained by the facts that rice is a local staple, as well as that particularly the rural camp populations continue to rely on rice-based food rations as their main dietary intake. In all three samples the next most commonly consumed food groups were ‘vitamin A-rich fruit and vegetables’, followed by ‘flesh foods’. Sittwe Rural had the lowest level of flesh food consumption, at 55% compared to 64% in Sittwe Urban and 71% in Pauktaw. In all three areas, the least commonly consumed food groups were dairy products, legumes and nuts, and eggs; however, egg consumption in Sittwe Urban area (52%) almost doubles egg consumption in Sittwe Rural and Pauktaw sites.
According to the Cost of Diet survey in Pauktaw Village conducted by the Tat Lan Program, none of the wealth groups could afford a nutritious diet and essential non-food expenditures at the same time20. Conditions are even more challenging in the IDP camps, so dietary diversity messages must be sensitive of value.
Figure 5: Food consumption per food group of children aged 6-23 months
20 Cost of Diet Assessment in Rakhine, Myanmar. Save the Children.
0 food groups
4%1 food group
5% 2 food groups
9%
3 food groups
11%
4+ food groups
71%
SITTWE URBAN (n=99)0 food groups
1%
1 food group
6%
2 food groups
12%
3 food groups
28%
4+ food groups
53%
SITTWE RURAL (n=503)
0 food groups
2%1 food group
7%2 food groups
7%
3 food groups
28%
4+ food groups
57%
PAUKTAW (n=396)

27
In addition to knowing what the children are eating, it is also important to know how frequently they are feeding. The minimum meal frequency for children aged 6-23 months was reached by 74% of children in Sittwe Urban, similar to 2013 when it was 76%. In Sittwe Rural, 75% of children aged 6-23 months reached the minimum meal frequency. This figure is not significantly different from 2013, when it was 80%. The minimum meal frequency for children aged 6-23 month was reached by 80% of children in Pauktaw, a significant improvement from 2013, when the minimum frequency was reached by 60% of children (p<0.001).
Minimum meal frequency between children who are breastfed and children who are not breastfed differ significantly in both Sittwe Rural (p=.002) and Pauktaw (p=.005), with 100% of breastfed children in both locations meeting the minimum daily frequency and 74% of non-breastfed children in Sittwe Rural and 79% of non-breastfed children in Pauktaw meeting the daily requirement.
Table 11: Minimum meal frequency rate among children 6-23 months
Yes No N n % N % URBAN Sittwe 103 76 74% 27 26% RURAL Sittwe 535 401 75% 134 25% Pauktaw 427 342 80% 85 20%
The minimum acceptable diet is a composite indicator of dietary diversity and meal frequency. In Sittwe Urban site, 54% of children 6-23 months met the minimum acceptable diet, similar to 56% in 2013. This differs significantly between children 6-11 months and children 12-17 months (p=.036), suggesting that meal frequency and dietary diversity among children 6-11 months can be a key target area for intervention.
In Sittwe Rural site, 46% of children 6-23 months met the minimum acceptable diet, significantly lower than 2013, when the indicator was 54% (p=.009). This difference is due to the decrease in the minimum dietary diversity indicator explained in the previous section.
In Pauktaw, 52% of children 6-23 months met the minimum acceptable diet. This is a significant improvement from 2013, when 41% of children met the same requirement (p<0.001).
93
2518
64
52
84
62
95
2227
55
28
85
39
94
2027
71
25
87
47
0
10
20
30
40
50
60
70
80
90
100%
of
child
ren
6-2
3 m
on
ths
Food group
SittweUrban
Sittwe Rural
28
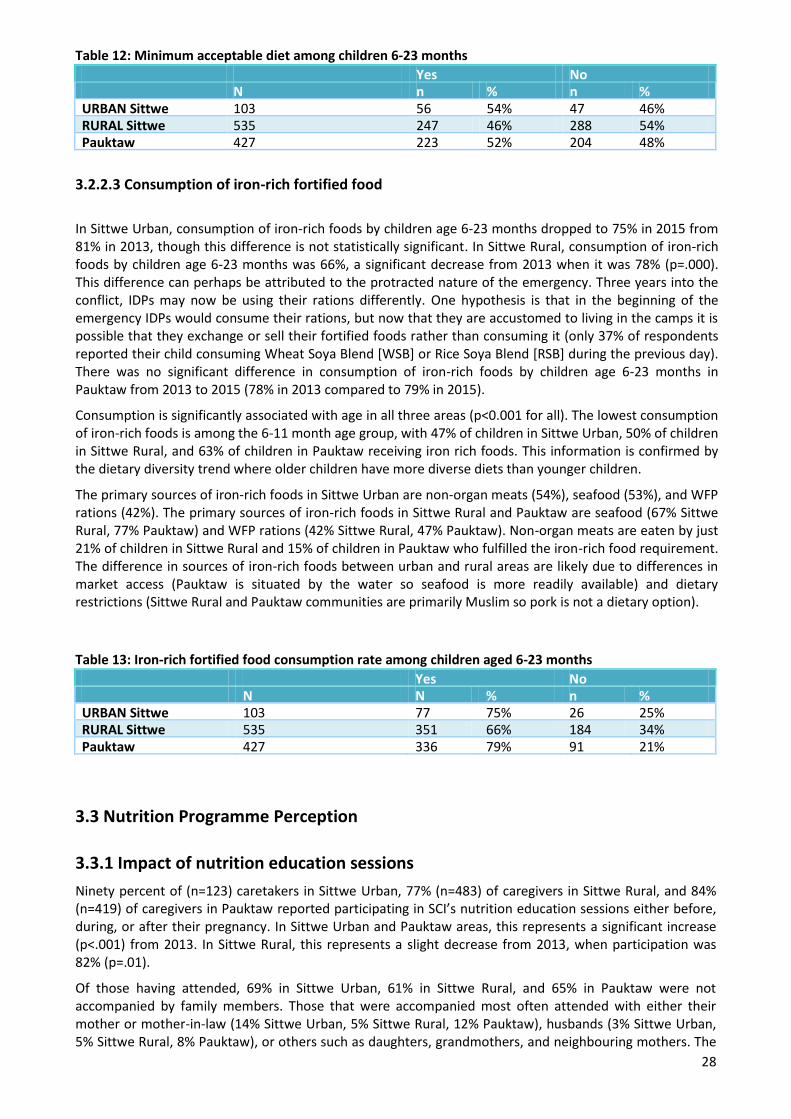
Table 12: Minimum acceptable diet among children 6-23 months
Yes No N n % n % URBAN Sittwe 103 56 54% 47 46% RURAL Sittwe 535 247 46% 288 54% Pauktaw 427 223 52% 204 48%
3.2.2.3 Consumption of iron-rich fortified food
In Sittwe Urban, consumption of iron-rich foods by children age 6-23 months dropped to 75% in 2015 from 81% in 2013, though this difference is not statistically significant. In Sittwe Rural, consumption of iron-rich foods by children age 6-23 months was 66%, a significant decrease from 2013 when it was 78% (p=.000). This difference can perhaps be attributed to the protracted nature of the emergency. Three years into the conflict, IDPs may now be using their rations differently. One hypothesis is that in the beginning of the emergency IDPs would consume their rations, but now that they are accustomed to living in the camps it is possible that they exchange or sell their fortified foods rather than consuming it (only 37% of respondents reported their child consuming Wheat Soya Blend [WSB] or Rice Soya Blend [RSB] during the previous day). There was no significant difference in consumption of iron-rich foods by children age 6-23 months in Pauktaw from 2013 to 2015 (78% in 2013 compared to 79% in 2015).
Consumption is significantly associated with age in all three areas (p<0.001 for all). The lowest consumption of iron-rich foods is among the 6-11 month age group, with 47% of children in Sittwe Urban, 50% of children in Sittwe Rural, and 63% of children in Pauktaw receiving iron rich foods. This information is confirmed by the dietary diversity trend where older children have more diverse diets than younger children.
The primary sources of iron-rich foods in Sittwe Urban are non-organ meats (54%), seafood (53%), and WFP rations (42%). The primary sources of iron-rich foods in Sittwe Rural and Pauktaw are seafood (67% Sittwe Rural, 77% Pauktaw) and WFP rations (42% Sittwe Rural, 47% Pauktaw). Non-organ meats are eaten by just 21% of children in Sittwe Rural and 15% of children in Pauktaw who fulfilled the iron-rich food requirement. The difference in sources of iron-rich foods between urban and rural areas are likely due to differences in market access (Pauktaw is situated by the water so seafood is more readily available) and dietary restrictions (Sittwe Rural and Pauktaw communities are primarily Muslim so pork is not a dietary option).
Table 13: Iron-rich fortified food consumption rate among children aged 6-23 months
Yes No N N % n % URBAN Sittwe 103 77 75% 26 25% RURAL Sittwe 535 351 66% 184 34% Pauktaw 427 336 79% 91 21%
3.3 Nutrition Programme Perception
3.3.1 Impact of nutrition education sessions
Ninety percent of (n=123) caretakers in Sittwe Urban, 77% (n=483) of caregivers in Sittwe Rural, and 84% (n=419) of caregivers in Pauktaw reported participating in SCI’s nutrition education sessions either before, during, or after their pregnancy. In Sittwe Urban and Pauktaw areas, this represents a significant increase (p<.001) from 2013. In Sittwe Rural, this represents a slight decrease from 2013, when participation was 82% (p=.01).
Of those having attended, 69% in Sittwe Urban, 61% in Sittwe Rural, and 65% in Pauktaw were not accompanied by family members. Those that were accompanied most often attended with either their mother or mother-in-law (14% Sittwe Urban, 5% Sittwe Rural, 12% Pauktaw), husbands (3% Sittwe Urban, 5% Sittwe Rural, 8% Pauktaw), or others such as daughters, grandmothers, and neighbouring mothers. The

29
overwhelmingly female responses suggest the presence of a strong support network of women in the community.
Family participation in peer group sessions was similar to family participation in individual health education sessions. When caregivers were asked if any family members participated in SCI’s peer group discussions, 67% in Sittwe Urban, 72% in Sittwe Rural, and 66% in Pauktaw said no one; 19% in Sittwe Urban, 12% in Sittwe Rural, and 17% in Pauktaw said mother or mother-in-law; 7% in Sittwe Urban, 9% in Sittwe Rural, and 8% in Pauktaw named their husband; and 7% in Sittwe Urban, 6% in Sittwe Rural, and 6% in Pauktaw cited other family members such as brothers, sisters, and sisters-in-law.
When asked if attending health education sessions changed the way caregivers feed their children, 89% of caregivers in Sittwe Urban, 93% in Sittwe Rural, and 95% in Pauktaw answered yes. These figures are all significantly improved from 2013, when rates were 51% in Sittwe Urban, 87% in Sittwe Rural, and 61% in Pauktaw (p<0.001 for all locations). The figure below details the specific IYCF changes in each sample. Like in 2013, improvement in knowledge of complementary feeding is the most common change reported, followed by giving the newborn colostrum and extending continued breastfeeding.
The reasons cited for initiating these changes are overwhelmingly attributed to the mother learning new/good things during health education sessions (94% Sittwe Urban, 94% Sittwe Rural, and 97% Pauktaw). Those who did not initiate any changes cited tradition (46% Sittwe Urban, 24% Sittwe Rural, 33% Pauktaw), forgetting what was said in the sessions (0% Sittwe Urban, 3% Sittwe Rural, 14% Pauktaw), inability to afford change (15% Sittwe Urban, 32% Sittwe Rural, 10% Pauktaw), and lack of understanding (0% Sittwe Urban, 11% Sittwe Rural, 10% Pauktaw) as reasons.
Figure 6: Reported nutrition education session impact on IYCF practices

30
Colostrum given14%
Exclusive breastfeeding extended
10%
Continued breastfeeding
extended21%
Less breastfeeding difficulties
5%
Knowledge on complementary feeding
39%
Meal frequency improved
5%
Other6%
SITTWE URBAN (n=106)
Colostrum given23%
Exclusive breastfeeding extended
5%
Continued breastfeeding
extended16%
Less breastfeeding difficulties
4%
Knowledge on
complementary feeding
41%
Meal frequency improved
6%
Other5%
SITTWE RURAL (n=522)

31
Eighty five percent of caregivers in Sittwe Urban, 93% in Sittwe Rural, and 85% in Pauktaw said they changed their habits during pregnancy by eating better, working less, or a combination of the two. Caregivers overwhelmingly cited learning new/good things as the primary motivation for changing pregnancy habits (89% all three locations).
For the small percentage of women who did not change their habits, the most common reasons cited were obligation to follow traditions (42% Sittwe Urban, 24% Sittwe Rural, 24% Pauktaw), unable to afford new behaviors (5% Sittwe Urban, 21% Sittwe Rural, 18% Pauktaw), the belief that new behaviors were not better than traditions (0% Sittwe Urban, 2% Sittwe Rural, 12% Pauktaw), lack of understanding of the sessions (32% Sittwe Urban, 14% Sittwe Rural, 6% Pauktaw), and unable to remember what was taught in the session (0% Sittwe Urban, 2% Sittwe Rural, 12% Pauktaw).
3.3.2 Support for breastfeeding difficulties
Breastfeeding difficulties were reported by 15% of caretakers in Urban Sittwe, 10% in Rural Sittwe, and 10% in Pauktaw. In both Sittwe Rural and Pauktaw, this figure is a significant reduction from 2013, when 24% of caretakers in Sittwe Rural and 32% of caretakers in Pauktaw experienced breastfeeding difficulties (p<0.001).
In Sittwe Urban, problems were resolved via support from family (32%, n=6), support from medical staff (21%, n=4), support from Breastfeeding Counsellors (BFC) (11%, n=2), and support from TBA or Community Health Workers (CHW) (11%, n=2). Eleven percent (n=2) of caretakers reported continuing difficulties. In Sittwe Rural, difficulties were overcome through support from BFCs (16%, n=10), support from medical staff (13%, n=8), support from TBA or CHW (11%, n=7), and support from family (5%, n=3). Four caretakers reported resolving breastfeeding difficulties with condensed milk, cow milk, milk powder, or snacks. Thirty percent (n=19) of caregivers reported continuing difficulties. In Pauktaw, difficulties were resolved with the support of TBAs or CHWs (29%, n=14), support from BFCs (19%, n=9), support from family members (8%, n=4), and support from medical staff (2%, n=1). Nineteen percent (n=9) of women reported continuing difficulties.
Zero cases in Sittwe Urban, 6% (n=4) in Sittwe Rural, and 8% (n=4) in Pauktaw reported stopping breastfeeding as a result of the difficulties.
In all three areas, this is a shift from 2013, when family support was the primary source for resolving breastfeeding issues. Two years later, TBAs, CHWs, and BFCs (SCI’s camp based volunteers) now are the primary providers of breastfeeding support. Support from medical personnel is limited in Sittwe Rural and Pauktaw sites due to difficulties in access.
Colostrum given25%
Exclusive breastfeeding extended
4%
Continued breastfeeding
extended15%
Less breastfeeding difficulties
2%
Knowledge on
complementary feeding
39%
Meal frequency improved
10%
Other5%
PAUKTAW (n=429)

32
3.3.3 Caretaker knowledge of IYCF principles
Whilst behavior change is not automatic once knowledge is acquired, it nevertheless forms an important part of IYCF programming. In order to ensure that this foundation exists before implementing further behaviour change activities, caretakers’ knowledge of the four core IYCF practices was assessed. In all three areas, knowledge of at least 3 principles was high and significantly surpassed 2013 values (65% in Sittwe Urban, 83% in Sittwe Rural, and 36% in Pauktaw) and the program target of 80%. In Sittwe Urban, 94% of caregivers knew at least 3 principles. In Sittwe Rural, knowledge of three out of the four main IYCF principles was also measured at 94%. Finally, in Pauktaw, 95% of caregivers were able to name at least three IYCF principles. Knowledge of when to initiate timely complementary feeding (90% Sittwe Urban, 89% Sittwe Rural, 86% Pauktaw) is slightly lower than knowledge of the other IYCF principles, though still high compared to 2013 values and program targets.
Figure 7: Caregiver knowledge of IYCF principles
3.4 Antenatal/Postnatal Support
This survey included a section to assess maternal behaviour during pregnancy as a child’s critical ‘first 1000 days’ of life include the pregnancy time period. SCI’s IYCF programming is complemented by an ANS component, in recognition of the importance of this time period and to address gaps in ANS services.
3.4.1 ANC visits
Two types of pregnancy follow-up visits were recognised in this survey. The definition of an ‘ANC visit’ was once conducted by a doctor/ nurse/ midwife/ auxiliary midwife, and included any or several of the following services: micronutrient supplementation, vaccination, health education, child positioning, blood tests for disease check, blood pressure monitoring, and delivery kit distribution. A ‘TBA check-up’ was conducted by a TBA, and included any or several of the following: child positioning, traditional health education, relaxation, back massage /foot massage. Visits that were only for a pregnancy test or for the Government’s Special Supplemental Nutrition Program for Women, Infants, and Children were not included.
95 95
90
9394
9594
89
94 94
96
94
86
97
95
75
80
85
90
95
100
Initiation ofbreastfeeding
Exclusivebreastfeeding
Initiation ofcomplementary
feeding
Continuedbreastfeeding
Knowledge of atleast 3 principles
% c
areg
iver
s an
swer
ing
corr
ectl
y
Sittwe Urban Sittwe Rural Pauktaw

33
Using these definitions, the survey found that almost all caretakers received at least one pregnancy check-up. There were no caretakers in Urban Sittwe who received no pregnancy follow-up visits, compared with 2% in Sittwe Rural, and 6% in Pauktaw. In Sittwe Rural, the main reasons for not seeking an ANC visit were the mother felt well (53%), women are not allowed to go outside the house (20%), no time/no money (13%), and no clinic because of ethnic conflict (7%). In Pauktaw, the main reasons were the mother felt well (58%), too far/not safe to go (16%), and women are not allowed to go outside the house (10%). One respondent in Sittwe Urban had a TBA check-up instead of an ANC visit. In Sittwe Rural, 7% of caretakers had a TBA check-up instead of an ANC visit and in Pauktaw, this figure is 25%.
In terms of timing for pregnancy follow-up visits, in Urban Sittwe 61% of women sought care in the first trimester and 31% sought care in the second trimester. In Sittwe Rural 39% sought care in the first trimester and 33% in the second trimester. In Pauktaw, 26% sought care in the first trimester and 32% sought care in the second trimester. Both Sittwe Rural and Pauktaw exhibit improvement from 2013, when only 18% sought care in the first trimester and 19% sought care in the second trimester (p<0.001).
In Sittwe Urban, 28% of caregivers received at least three pregnancy visits, and 70% of women received four or more visits. In Sittwe Rural, 50% of women received at least 3 visits and 22% received four or more visits. In Pauktaw, 41% of respondents reported at least 3 visits and 33% at least 4 visits.
The figures below highlight the motivating factors behind seeking a check-up visit. Across all samples, the main reasons cited were to check the mother’s and/or baby’s health. In Sittwe Urban, responses are weighted towards checking the baby’s health, whereas in Sittwe Rural and Pauktaw, the responses are weighted towards the mother’s health.
In Sittwe Urban, 100% of women had been treated by trained healthcare staff (doctor, nurse, or midwife). In Sittwe Rural, 70% of women were most frequently treated by a trained healthcare professional, and in Pauktaw, 27% were treated by a trained healthcare professional. There is a significant improvement from 2013 in the percentage of women treated by trained healthcare staff in Sittwe Rural (40% compared to 70%, p<0.001) and Pauktaw (18% compared to 27%, p<0.001). Both quantity and quality of antenatal visits have improved in Sittwe Rural and Pauktaw. Women are getting check-ups more frequently, and seeking care from trained healthcare professionals rather than TBAs.
Table 14. Person conducting pregnancy follow-up visit
Type URBAN SITTWE
RURAL SITTWE
PAUKTAW n % n % n % Doctor 93 69% 239 39% 31 7% Nurse 34 25% 180 29% 88 19% Midwife/ auxiliary midwife 7 5% 12 2% 8 2% Traditional Birth Attendant 0 0% 184 30% 337 73% Total responses 134 615 464
Figure 8: Reasons for attending a pregnancy check-up

34
Mother's health31%
Baby's health48%
Ask questions5%
Service was available
5%Mother & child's health10%
Other1%
SITTWE URBAN (n=134)

35
Mother's health51%Baby's health
28%
Ask questions11%
Service was available
2%
Mother & child's health
6% Other2%
SITTWE RURAL (n=615)
Mother's health47%
Baby's health33%
Ask questions11%
Service was available
2%
Mother & child's health
7%
PAUKTAW (n=468)

3.4.2 Supplementation during pregnancy
The table below details the supplements mothers received during pregnancy. Supplementation coverage for vitamins, minerals, and deworming is greatly improved from 2013 (almost two-fold in Sittwe Rural and almost four-fold in Pauktaw) and pregnant women are also now better covered by rice soya blend (RSB) distributions in Sittwe Urban and Pauktaw areas. Eighty-one percent of women receiving RSB rations in Sittwe Urban, 79% of women in Sittwe Rural, and 94% of women in Pauktaw consumed some or all of rations. Taken in conjunction with reasons for seeking antenatal care, this suggests that mothers’ health is a priority during pregnancy.
Table 15. Supplementation during pregnancy
Type URBAN SITTWE RURAL SITTWE PAUKTAW
n % n % n % Mineral & Vitamin tablets 124 93% 556 88% 442 88% Vitamin A and/or Iron 128 96% 571 90% 441 88% Vitamin B1 124 94% 519 82% 422 85% Deworming tablet 112 85% 400 63% 306 61% Extra ration of blended food 78 57% 311 49% 338 68%
3.4.3 Delivery assistance
Consistent with the results from 2013, home deliveries are more common in rural areas (96% Sittwe Rural, 98% Pauktaw), whereas hospital deliveries are the preferred method for caregivers in urban Sittwe (74%). The high percentage of home deliveries in Sittwe Rural and Pauktaw is not surprising given the challenges in accessing hospitals. Often, only emergency cases are referred, and there is also some aversion in the community for going to the hospital (due to stigmas about women leaving the house, challenges of accessing the hospital, etc.).
In nearly all deliveries, there was someone present to help the mother. In Sittwe Urban, deliveries were commonly assisted by medical professionals (78% of deliveries assisted by a doctor or nurse). In Sittwe Rural and Pauktaw, delivery assistance falls heavily to TBAs – in Sittwe Rural they assist in 96% of deliveries and in in Pauktaw, they assisted in 99% (all but 6 cases out of 500).
Figure 9: Delivery assistance
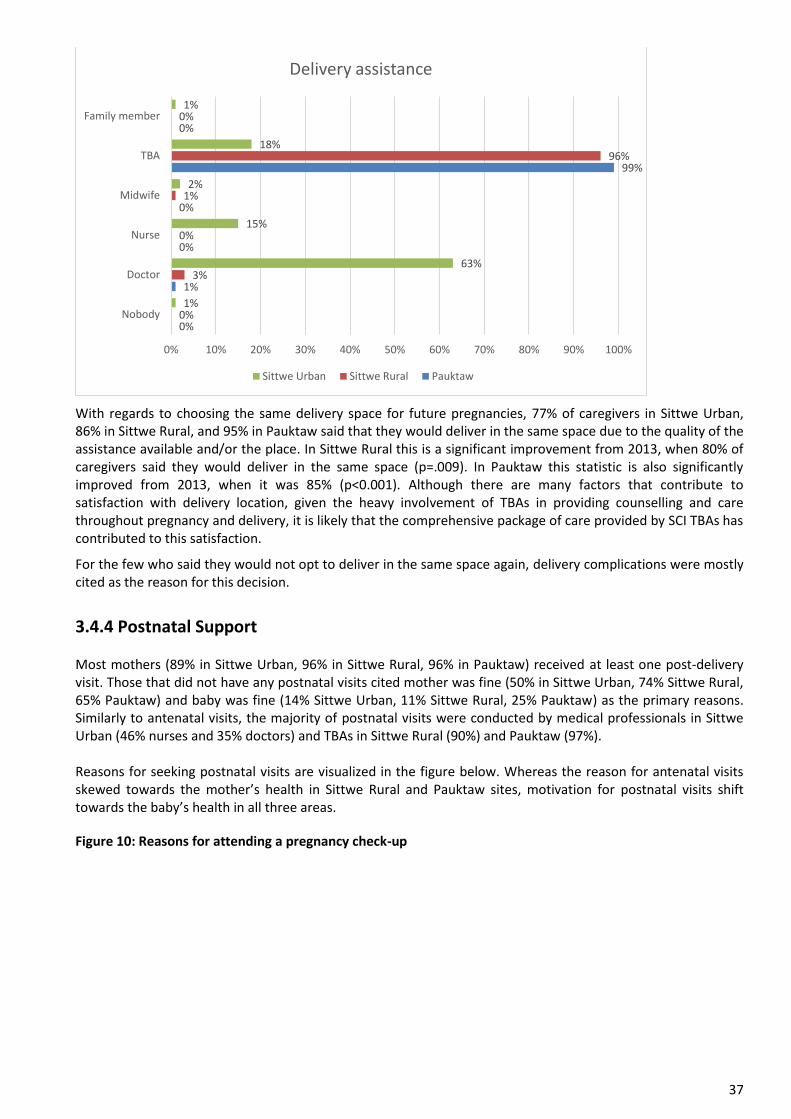
37
With regards to choosing the same delivery space for future pregnancies, 77% of caregivers in Sittwe Urban, 86% in Sittwe Rural, and 95% in Pauktaw said that they would deliver in the same space due to the quality of the assistance available and/or the place. In Sittwe Rural this is a significant improvement from 2013, when 80% of caregivers said they would deliver in the same space (p=.009). In Pauktaw this statistic is also significantly improved from 2013, when it was 85% (p<0.001). Although there are many factors that contribute to satisfaction with delivery location, given the heavy involvement of TBAs in providing counselling and care throughout pregnancy and delivery, it is likely that the comprehensive package of care provided by SCI TBAs has contributed to this satisfaction.
For the few who said they would not opt to deliver in the same space again, delivery complications were mostly cited as the reason for this decision.
3.4.4 Postnatal Support Most mothers (89% in Sittwe Urban, 96% in Sittwe Rural, 96% in Pauktaw) received at least one post-delivery visit. Those that did not have any postnatal visits cited mother was fine (50% in Sittwe Urban, 74% Sittwe Rural, 65% Pauktaw) and baby was fine (14% Sittwe Urban, 11% Sittwe Rural, 25% Pauktaw) as the primary reasons. Similarly to antenatal visits, the majority of postnatal visits were conducted by medical professionals in Sittwe Urban (46% nurses and 35% doctors) and TBAs in Sittwe Rural (90%) and Pauktaw (97%). Reasons for seeking postnatal visits are visualized in the figure below. Whereas the reason for antenatal visits skewed towards the mother’s health in Sittwe Rural and Pauktaw sites, motivation for postnatal visits shift towards the baby’s health in all three areas.
Figure 10: Reasons for attending a pregnancy check-up
0%
1%
0%
0%
99%
0%
0%
3%
0%
1%
96%
0%
1%
63%
15%
2%
18%
1%
0% 10% 20% 30% 40% 50% 60% 70% 80% 90% 100%
Nobody
Doctor
Nurse
Midwife
TBA
Family member
Delivery assistance
Sittwe Urban Sittwe Rural Pauktaw

38
Mother's health20%
Baby's health66%
Ask questions5%
Service was available
3%
Mother & child's health
4%
Other2%
SITTWE URBAN (n=122)
Mother's health25%
Baby's health61%
Ask questions4%
Service was available
1%
Mother & child's health
7%
Other2%
SITTWE RURAL (n=598)
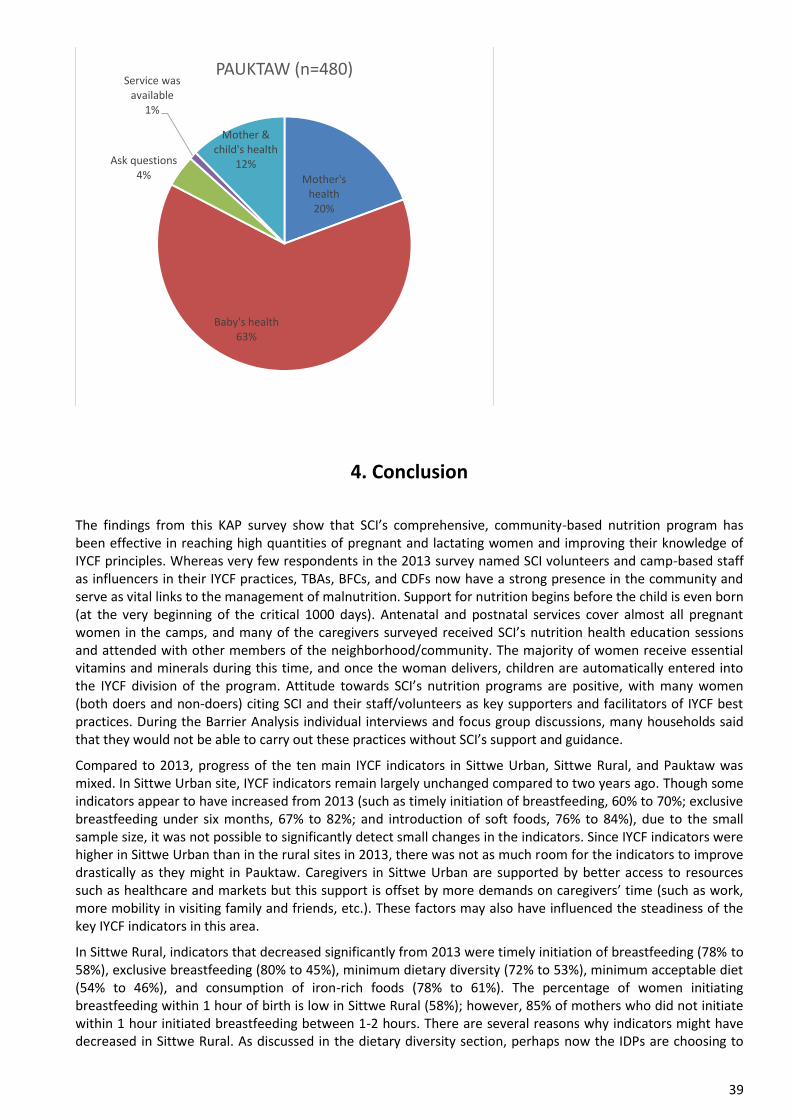
39
4. Conclusion
The findings from this KAP survey show that SCI’s comprehensive, community-based nutrition program has been effective in reaching high quantities of pregnant and lactating women and improving their knowledge of IYCF principles. Whereas very few respondents in the 2013 survey named SCI volunteers and camp-based staff as influencers in their IYCF practices, TBAs, BFCs, and CDFs now have a strong presence in the community and serve as vital links to the management of malnutrition. Support for nutrition begins before the child is even born (at the very beginning of the critical 1000 days). Antenatal and postnatal services cover almost all pregnant women in the camps, and many of the caregivers surveyed received SCI’s nutrition health education sessions and attended with other members of the neighborhood/community. The majority of women receive essential vitamins and minerals during this time, and once the woman delivers, children are automatically entered into the IYCF division of the program. Attitude towards SCI’s nutrition programs are positive, with many women (both doers and non-doers) citing SCI and their staff/volunteers as key supporters and facilitators of IYCF best practices. During the Barrier Analysis individual interviews and focus group discussions, many households said that they would not be able to carry out these practices without SCI’s support and guidance.
Compared to 2013, progress of the ten main IYCF indicators in Sittwe Urban, Sittwe Rural, and Pauktaw was mixed. In Sittwe Urban site, IYCF indicators remain largely unchanged compared to two years ago. Though some indicators appear to have increased from 2013 (such as timely initiation of breastfeeding, 60% to 70%; exclusive breastfeeding under six months, 67% to 82%; and introduction of soft foods, 76% to 84%), due to the small sample size, it was not possible to significantly detect small changes in the indicators. Since IYCF indicators were higher in Sittwe Urban than in the rural sites in 2013, there was not as much room for the indicators to improve drastically as they might in Pauktaw. Caregivers in Sittwe Urban are supported by better access to resources such as healthcare and markets but this support is offset by more demands on caregivers’ time (such as work, more mobility in visiting family and friends, etc.). These factors may also have influenced the steadiness of the key IYCF indicators in this area.
In Sittwe Rural, indicators that decreased significantly from 2013 were timely initiation of breastfeeding (78% to 58%), exclusive breastfeeding (80% to 45%), minimum dietary diversity (72% to 53%), minimum acceptable diet (54% to 46%), and consumption of iron-rich foods (78% to 61%). The percentage of women initiating breastfeeding within 1 hour of birth is low in Sittwe Rural (58%); however, 85% of mothers who did not initiate within 1 hour initiated breastfeeding between 1-2 hours. There are several reasons why indicators might have decreased in Sittwe Rural. As discussed in the dietary diversity section, perhaps now the IDPs are choosing to
Mother's health20%
Baby's health63%
Ask questions4%
Service was available
1%
Mother & child's health
12%
PAUKTAW (n=480)

40
use their rations in a different way than in the past. Additionally, movement is more common among the Sittwe Rural population than the Pauktaw population, so it’s possible that messages are not being reinforced the same way that they would be among a population that is more fixed.
In Pauktaw, indicators that improved significantly from 2013 include timely initiation of breastfeeding (37% to 70%), continued breastfeeding at 1 year (81% to 97%), minimum dietary diversity (46% to 57%), minimum meal frequency (60% to 80%), minimum acceptable diet (41% to 53%), and bottle feeding (21% to 11%). The drastic improvement in Pauktaw from 2013 (when just 37% of mothers initiated breastfeeding in a timely manner) suggests the health education sessions for pregnant women and close monitoring and support from TBAs at birth have had a positive effect on infant feeding practices (where there is very limited medical support). The overall improvement in IYCF indicators is commendable given Pauktaw’s operating challenges. Though many indicators started off lower than Sittwe Rural indicators in 2013, they have now caught or surpassed IYCF indicators in Sittwe Rural. It is a bit unexpected that exclusive breastfeeding rates in Pauktaw are higher than rates in Sittwe Rural site. Generally, living conditions in Pauktaw are more challenging than conditions in Sittwe Rural due to remoteness and issues of access. However, perhaps the lack of access to healthcare, livelihood, and markets has influenced the high rate of exclusive breastfeeding in Pauktaw. Mothers do not have the resources to feed their children anything else and may have no other choice but to exclusively breastfeed their children. Special attention should be paid to this population—now that the big gains have been made, it may be more difficult to convince the remaining non-doers to change their behaviours.
Overall, these results show that many caregivers have achieved knowledge of best IYCF practices, which is the first step towards behaviour change. However, there remains a demonstrable gap between knowledge and practice, and caregivers need to be supported in internalizing these messages and initiating the rest of the behaviour change process.
5. Recommendations
5.1 IYCF Practices
Shift program focus from knowledge to practice of key IYCF behaviours, particularly exclusive breastfeeding for children under 6 months, timely complementary feeding, minimum dietary diversity, and consumption of iron-rich foods. This might be implemented in the form of supportive supervision and more household visits by BFCs, Community Development Facilitators (CDFs), and other SCI staff.
o In health education sessions, mother-to-mother support group meetings, and peer education sessions, focus on demonstrations and role playing to reinforce the transfer of knowledge that has occurred/is already occurring.
o Conduct home observations around mealtimes (preparation and feeding) to ensure that best practices are being followed with regards to dietary diversity, food hygiene, hand washing, and interactive feeding.
o Utilize strong community presence and SCI data on birthdates to provide targeted support to caregivers of children at critical ages:
In rural areas, continue to encourage close monitoring and follow up of births by TBAs and BFCs to continue positive trend in early initiation of breastfeeding. Focus on improving understanding of “immediate” to shift women from the 1-2 hour category into the 0-1 hour category. This also presents an opportunity to counsel on breastfeeding and set the foundation for exclusive breastfeeding.
In Sittwe Urban camps, strengthen relationships with healthcare staff to ensure unified messaging around initiation of breastfeeding and exclusive breastfeeding for new mothers
At six months, BFCs can remind mothers to begin complementary feeding; reminders should be accompanied and followed up by home visits during mealtime.
Between 6-11 months, BFCs can conduct home visits to support caregivers in providing a diet that meets the minimum dietary diversity, minimum meal frequency, and iron requirements.
Mobilize more experienced mothers to mentor new mothers and help reinforce messages given by BFCs.

41
o Hold regular review meetings around supportive supervision visits with staff and volunteers to identify new IYCF issues, brainstorm solutions, and share successes.
o Continue to monitor IYCF indicators regularly to note patterns and changes in practice. Sensitized women initiating changes in IYCF practices should be followed up with to ensure that changes are practiced long-term.
Focus on activities to improve minimum dietary diversity in all samples.
o Conduct a market assessment to identify key foods available during each season that can be procured cheaply to diversify children’s diets.
o Tailor cooking demonstrations each season to the locally available foods, focusing especially on underrepresented food groups such as dairy products, eggs, legumes and nuts, other fruits and vegetables, and iron-rich foods.
o Collaborate with Food Security and Livelihood actors to strengthen nutrition messages and reduce practical barriers to increasing dietary diversity.
Incorporate Trials of Improved Practices (TIPs) Methodology to work with the community to find feasible solutions to infant and young child feeding challenges, especially for dietary diversity.
Carefully monitor BMS violations to help women achieve exclusive breastfeeding for children under 6 months.
5.2 Nutrition Communications
Target key behavioural determinants identified through the Barrier Analysis, such as self-efficacy, cue to action, and positive and negative attributes (See Annex 1 for more details).
Continue to mobilize camp based volunteers and staff such as TBAs and BFCs in the transfer of knowledge.
Whenever possible, interactive simulations and demonstrations should be incorporated into health education sessions to ensure that caregivers can go beyond reciting best behaviours to practicing them.
Use the educational video developed as another avenue for reaching beneficiaries; organize discussions/feedback around screenings to engage community members outside of mother to mother support groups and peer groups.
Even though mothers are the primary decision makers when it comes to infant and young child feeding, it is still relevant to target mothers, mothers-in-law, and husbands as they were cited as influential people during the Barrier Analysis.
5.3 Learning and Improvement
Strengthen monitoring & evaluation systems and feedback loops to ensure constant learning, analysis of program impact, and quality improvement.
Conduct WHO’s IYCF assessment in 2 years to monitor changes in practice.
At report time, the nutrition program was undergoing several changes, including reduction of camp based staff and volunteers (BFCs and CDFs) and replacement of U Yin Thar camp with Ohn Daw Chay camp in Sittwe Rural site. In light of these coverage and resource changes, it is important to ensure that program operations continue smoothly to ensure that the gains made in nutrition indicators over the past two years are not lost. At the same time, this transition period represents an opportunity to provide refresher trainings to retained staff and adjust program activities to better target vulnerable children and households.

42
Annex 1. Barrier Analysis
1. Introduction
Following the KAP survey, a Barrier Analysis was conducted to further explore the facilitators and barriers to key IYCF behaviors. Based on results from previous KAP and SMART surveys, four key IYCF behaviors were identified for further investigation:
1. Exclusive breastfeeding under 6 months 2. Timely complementary feeding 3. Bottle feeding (Pauktaw only) 4. Minimum dietary diversity
2. Objectives
Main Objective
To determine barriers and facilitators to key IYCF behaviors for children aged 0-23 months living in IDP camps in Sittwe Rural and Pauktaw Townships, Rakhine State, Myanmar.
Specific Objectives
To assess eight determinants of behaviour change as it relates to IYCF practices.
To obtain additional qualitative information on IYCF practices and beliefs.
To adapt program activities to better target key IYCF behaviors.
3. Methodology
Food for the Hungry’s Barrier Analysis Facilitator’s Guide (first and second editions) were used as the basis for this survey21,22. Both individual interviews and focus group discussions were used. The questionnaires were based on eight determinants of behaviour change, derived from the Health Belief Model and the Theory of Reasoned Action:
1. Perceived susceptibility (Could my child become malnourished?) 2. Perceived severity (Is malnutrition a serious problem?) 3. Perceived action efficacy (Does the preventative action work?) 4. Perceived social acceptability (Do friends/family/neighbours approve of the promoted action?) 5. Perceived self-efficacy (Is it easy to do?) 6. Cues for action (Can caregivers remember to do it?) 7. Perception of divine will (Does God/religion approve of the promoted action?) 8. Positive and negative attributes of the preventive action (What are the advantages and disadvantages
of the promoted action?)
Data collection took place from 20 May to 28 May and 9 June to 15 June 2015 in IDP camps in Sittwe rural and Pauktaw areas. The first session included individual interviews and the second session consisted of focus group discussions.
21 Barrier Analysis Facilitator’s Guide: A Tool for Improving Behavior Change Communication in Child Survival and Community Development Programs. Food for the Hungry. 2004. 22 A Practical Guide to Conducting Doer/Non-doer and Barrier Analysis Surveys. Food for the Hungry. 2013.

43
3.1 Sampling Unit The KAP survey, conducted from 9 May to 27 May 2015, was used to purposefully identify respondents for the Barrier Analysis. The KAP survey identified doers (those who practiced the good behavior) and non-doers (those who did not practice the good behavior) for the four behaviors of interest in Sittwe Rural and Pauktaw areas. Sittwe Urban was not included in the Barrier Analysis because the population of under 2 children was too small to yield enough doers and non-doers for each behavior.
For dietary diversity, doers and non-doers were selected based on counselling messages and the local culture, which focuses on 3 main food groups rather than 7. These groups consisted of:
1. Rice, wheat, roots, carbohydrates 2. Vegetables and fruits 3. Meats and beans
In order to avoid confusion, questions in both the focus group discussions and individual interviews ask about the 3 main groups that caregivers are familiar with rather than the international standard of minimum 4 food groups.
3.2 Sample Size While the CORE Group guide recommends individual interviews with 45 doers and 45 non-doers for each behavior, this was not feasible for the SCI nutrition program due to budget, time, and human resource constraints. Instead, non-doers were targeted in all Pauktaw camps and larger Sittwe Rural camps. A similar number of doers were identified for participation. As many individual interviews as possible were completed during eight days. After the individual interviews were complete, remaining numbers of doers and non-doers in each camp were assessed to identify participants for focus group discussions. Each focus group discussion contained 5-10 participants.
The sample sizes obtained for each behavior and location at the conclusion of data collection are shown in the table below.
Table 1: Sample sizes for barrier analysis individual interviews and focus group discussions
Exclusive Breastfeeding
Timely Complementary
Feeding
Minimum Dietary Diversity
Bottle Feeding
D ND D ND D ND D ND
Sittwe Rural: Individual
29 29 32 14 55 43 - -
Sittwe Rural: FGD
2 2 - - 1 1 - -
Pauktaw: Individual
24 12 20 19 43 31 27 27
Pauktaw:
FGD - - - - 1 1 2 2
3.3 Questionnaire The Barrier Analysis survey questionnaires are included in Annex 3. Questions addressing eight main determinants of behavior change are included. There was some difficulty in conveying the meaning of the questions (especially hypothetical ones) to the caretakers. Based on field testing and feedback from enumerators, some questions were asked as close ended questions and simplified for understanding.
3.4 Training and Supervision Seven re-locatable enumerators were selected to conduct the Barrier Analysis individual interviews. Training was conducted in conjunction with KAP Survey training and included qualitative research theory, interviewing techniques, questionnaire review and practice, and one half-day of field practice. Enumerators also received a

44
one day refresher training prior to beginning Barrier Analysis data collection, where changes to the questionnaire were reviewed and field practice was conducted with respondents from Sittwe Urban camps. Enumerators were supervised by SCI staff daily during data collection.
One project coordinator (PC) and two project assistants (PAs) were selected to conduct the Barrier Analysis focus group discussions. One day of training was held and covered Barrier Analysis objectives, questionnaire review, FGD techniques, and practice sessions. The PC and PAs were supervised during data collection by the Nutrition Consultant. Each person took turns facilitating and note-taking.
3.5 Data Cleaning and Analysis Barrier Analysis individual interview data was reviewed daily by the Nutrition Consultant and Project Coordinator for inconsistencies and missing information. This was clarified with the enumerators and respondents the same day. The data entry team entered all data using Microsoft Excel after data collection was complete.
After each focus group discussion, the facilitator and note-takers reviewed their notes and designated one person to type the notes using Microsoft Word for the session. These notes were further reviewed by the Nutrition Consultant for clarifications.
Barrier Analysis individual interview data analysis was conducted using Microsoft Excel and Food for the Hungry’s Barrier Analysis spreadsheet to identify significant differences in responses and odds ratios between the doer and non-doer groups for each behavior. Due to the limited sample size, p-value threshold was increased from 0.05 to 0.10 for detecting statistically significant differences between doers and non-doers. The results from the focus group discussions were used qualitatively to confirm or give further detail to the results emerging from the individual interviews.
4. Results
While the focus group discussions were initially intended to confirm the results from the individual interviews, the responses from FGDs between doers and non-doers were quite similar. This may have been due to group dynamics and the ability to discuss responses or agree with someone else’s response. However, in spite of the similarities between doers and non-doers, the focus group discussions were valuable in providing additional detail to the responses generated by the individual interviews. These details are presented along with the relevant results below.
4.1 Exclusive Breastfeeding In Sittwe Rural site, doers are 10.2 times more likely to name advice from BFCs as a facilitator for exclusive breastfeeding (p=0.000). Doers are also 3.3 times more likely to cite no difficulties in practicing the behavior (p=.090), while non-doers are more likely to have breastfeeding difficulties (p=0.020). Both doers and non-doers named similar advantages and disadvantages to practicing exclusive breastfeeding, but doers were 7 times more likely to name physical growth and mental development as an advantage. Non-doers are more likely to have low belief that they can do the behavior with existing knowledge and resources (low self-efficacy) (p=.085). Doers are 3.3 times more likely to say it’s very easy to remember to practice the behavior (p=0.094), indicating that perhaps more cues to action would be helpful to encourage non-doers to change their practices. One of the main barriers that arose from the focus group discussions in Sittwe Rural was illness. If the mother is ill, she is unable to sufficiently breastfeed the child, causing her to initiate feeding of liquids and soft foods.
In Pauktaw, non-doers are more likely to cite regular breastfeeding with no side effects as something that makes it easier to practice exclusive breastfeeding (p=0.011). Doers are 8.3 times more likely than non-doers to perceive giving a child drinks other than breastmilk or food before six months as a serious problem (p=0.009). As in Sittwe Rural area, non-doers have lower self-efficacy than doers (p=0.040) and doers are 7 times more likely to say it’s very easy to remember to practice the behavior (p=0.014).
4.2 Timely Complementary Feeding In Sittwe Rural area, doers are 3.6 times more likely than non-doers to mention physical growth and mental development as an advantage of timely complementary feeding (p=0.056) and 5.4 times more likely to mention

45
thinness/weakness as a consequence of not practicing timely complementary feeding (p=0.015). Additionally, mothers/mothers-in-law of doers are almost 6 times more likely than mothers/mothers-in-law of non-doers to support this behavior (p=0.078).
In Pauktaw, the only significant difference between doers and non-doers is their mention of disadvantages—doers are more likely to mention “nothing” as a disadvantage of timely complementary feeding (p=0.014).
4.3 Dietary Diversity In Sittwe Rural, doers were 2 times as likely as non-doers to name good nutrition for their child as a consequence of feeding the three main foods (p=0.098). Doers were also more likely to say that feeding a diverse diet to their child is more economic (referring to long term savings because the child will not need to seek medical care or go to the hospital) (p=.071). In terms of people who support or oppose the behavior, doers were three times more likely to cite peer group members as important people who approve (p=.027). Finally, perceived action efficacy—the belief that feeding a child food from the three main groups each day will prevent malnutrition—was 5.5 times higher among doers than non-doers (p=0.095).
In Pauktaw, non-doers were almost three times more likely to say it’s slightly difficult to remember to feed the child foods from the three main groups each day (p=0.029). Non-doers were also more likely to name debt as a difficulty to practicing the behavior (p=0.074) and financial difficulties as a disadvantage (p=0.047). When asked what difficulties or disadvantages are associated with feeding a child food from the three main groups each day, doers were 2.5-3 times more likely to cite nothing (p=0.097 for difficulties, p=0.033 for disadvantages). When asked about advantages, doers were 7 times more likely than non-doers to name the long-term economic advantage of feeding a child a diverse diet (p=0.046).
In both the individual interviews and focus group discussions, responses for this behavior were closely related to income and livelihood. The majority of respondents in both categories said they fed their child foods from the three main groups only when they had the money and could afford it. Caregivers were dependent on their husbands’ wages, but a few families were also able to use earnings from their brothers or brothers-in-law. This is especially challenging for women with no husbands or husbands who are unable to work. Those women rely entirely on WFP distributions. In Sittwe Rural many respondents voiced the desire to grow food near their shelters, but cited challenges from thieves as an obstacle. In Pauktaw respondents were more concerned about freedom of movement, the ability to go fishing more frequently, and animal husbandry.
4.4 Bottle Feeding For the bottle feeding behavior, caregivers who did not feed liquids to their child with a bottle were considered doers because they practiced the good behavior. Conversely, caregivers who did bottle feed their child the previous day were considered non-doers.
In Pauktaw, doers were almost 3 times more likely than non-doers to name health education sessions as facilitators for not bottle feeding their children (p=0.083). They were also 4.4 times more likely to name needing help to feed the child as disadvantages of practicing the good behavior (p=0.012). Non-doers had higher self-efficacy, and were almost three times more likely than doers to believe they can practice feeding their children without using bottles (p=0.083).
During the focus group discussions, caregivers stressed that having another caretaker to help with the child would make it easier to feed liquids to the child with a cup or spoon. Additional difficulties were cited when the mother needs to work and there is no one at home to take care of the child, or if those at home don’t know how to properly feed the child. In several focus group discussions (both doers and non-doers), mothers suggested teaching older children and other relatives how to properly feed the younger children, and the other mothers agreed that would be a good idea. They also said knowledge sharing in mother-to-mother support groups was important and that their family members encouraged them to listen to what the BFCs say because they believe BFCs know how to take good care of children.
5. Discussion
Overall, the key determinants separating doers and non-doers are self-efficacy, cues for action, and positive and negative attributes of the action (Table 2).

46
Table 2: Key determinants influencing IYCF practices
IYCF Practice Sittwe Rural Pauktaw
Exclusive Breastfeeding Self-efficacy Positive and negative attributes of the action Cues to action
Self-efficacy Perceived severity Cues to action
Timely Complementary Feeding
Positive and negative attributes of the action Perceived social acceptability
Positive and negative attributes of the action
Dietary Diversity Positive and negative attributes of the action Perceived social acceptability Perceived action efficacy
Positive and negative attributes of the action Cues to action Self-efficacy
Bottle Feeding N/A Self-efficacy Positive and negative attributes of the action
Self-efficacy
Self-efficacy is a significant behavioral determinant for exclusive breastfeeding in both Sittwe Rural and Pauktaw, and for dietary diversity and bottle feeding in Pauktaw. In Sittwe Rural, advice from BFCs increased caregivers’ self-efficacy, or belief that they could practice the recommended behavior. As we might expect, breastfeeding difficulties decreased caregivers’ self-efficacy. Additionally, non-doers did not believe they could practice exclusive breastfeeding with their existing knowledge and resources.
In Pauktaw, the absence of breastfeeding difficulties was cited as something that increased self-efficacy for exclusive breastfeeding. The presence of debt decreased caregivers’ ability to feed the child foods from the three main groups.
For bottle feeding, health education sessions made it easier for caregivers to follow the recommended practice. However, when caregivers were asked if they believe they can follow the best practice given their current resources and knowledge non-doers were more likely to respond yes. This result may be linked to the significant difference in recognition of disadvantages by doers and non-doers. Though non-doers had higher self-efficacy, they also may have been less aware of the real difficulties and challenges involved in feeding their child without using a bottle.
Given that counselling and health education sessions are a positive influence for caregivers and difficulties play a significant role in decreasing caregivers’ self-efficacy, perhaps BFCs and counselling sessions may be used to try to reduce the difficulties faced by caregivers. Since SCI already has problem-solving sessions built into its program, these sessions can potentially be extended to caregivers and done more frequently to help resolve issues as they arise.
Cues for action
In both Sittwe Rural and Pauktaw, doers are more likely than non-doers to say it’s very easy to remember to exclusively breastfeed children under 6 months. In reference to dietary diversity in Pauktaw, non-doers were more likely than doers to say it’s slightly difficult to remember to feed the child foods from the three main groups each day. These caregivers would benefit from additional reminders and reinforcement of the messages they learn during health education sessions and mother to mother support group meetings.
Positive and negative attributes of the action
This determinant was significant for almost all behaviors and areas. Overall, it seems that doers are more aware of advantages of practicing a behavior, and face no disadvantages. For instance, doers are more likely to name advantages such as physical growth and mental development (as a result of exclusive breastfeeding and timely complementary feeding), good nutrition (as a result of dietary diversity), and economic savings (as a result of dietary diversity). For timely complementary feeding and dietary diversity in Pauktaw, doers were more likely to

47
mention “nothing” as a disadvantage. With regards to bottle feeding, doers were more likely to name needing help to feed the child as a disadvantage of the behavior; however, they choose to follow the best practice in spite of this disadvantage, or perhaps only realized this disadvantage when they tried to follow the best practice.
These results suggest that compared to non-doers, doers have a deeper understanding of the advantages of the recommended action. They are able to fully understand the implications of the action, whereas non-doers may only understand the positive and negative attributes at a superficial level.
Perceived social acceptability
For the most part, perceived social acceptability did not differ between doers and non-doers. Perceived social acceptability was significant only in Sittwe Rural for timely complementary feeding and dietary diversity. For timely complementary feeding, approval of mothers/mothers-in-law was important and for dietary diversity, the approval of peer group members was significant for doers to practice the good behavior. This suggests that though other people in the family may influence the behavior, ultimately it’s other behavioral determinants that are responsible for the difference between doers and non-doers.
The KAP survey suggests that women are the primary decision makers when it comes to IYCF even though they are not the primary decision makers in the family according to local customs and SCI staff experience. The Barrier Analysis found influential people for both doers and non-doers to be mothers/mothers-in-law, husbands, and BFCs. BFCs were most often named as the person whose support/approval mattered the most, suggesting that BFCs play a key role in introducing IYCF concepts and helping families to adhere to best practices:
“At first they did not know about how to feed the three main food groups to their children and what it was. They never heard about this. The BFC and other persons who attended MtMSG and Peer Group meetings told people who could not attend about these feedings. Therefore, they supported [the feeding].” – Sin Tet Maw camp, Dietary Diversity FGD.
“BFC gave knowledge to [the husband]. When he [understood] and accepted it, he also supported his wife to feed regularly.” – Sin Tet Maw camp, Dietary Diversity FGD.
“The approval of Breast Feeding Counselors is the most important because they always have regular home visiting, HE Promotion to the mothers.” – Maw Ti Nyar camp, Dietary Diversity FGD.
“The BFC asked to them what they think and what knowledge they have. And if mothers [give
the wrong] answer, the BFC told them the correct answers.” – Dar Paing, Exclusive Breastfeeding FGD.
“All mothers said BFC’s counseling is the most important because they believe BFCs know how to
take of care the child more than other people.” – Khaung Doke Khar, Exclusive Breastfeeding FGD.
Very few people were named as expressing disapproval for the key IYCF practices, suggesting that social acceptability (or at least familiarity) with IYCF behaviors in the community is high. However, this may also be a result of respondents not being willing to share who disapproves of certain behaviors. Since the shelters are in close proximity to each other with minimal sound barriers, perhaps respondents did not feel comfortable naming people who did not support IYCF practices.
Given this information, it is important to maintain the high level of interaction between BFCs and lactating women, as well as the high level of social acceptance for IYCF practices through peer group sessions. There is also opportunity to take the peer group sessions one step further by teaching peer group members how to appropriately feed children under 2 in order to alleviate some of the pressure from the mothers if they are busy or working.
Perceived action efficacy and perceived severity
In Sittwe Rural, doers and non-doers differ significantly on the efficacy of feeding a child food from the three main groups each day to prevent malnutrition – non-doers are less likely to believe dietary diversity prevents malnutrition. The perceived severity determinant was only significant for the exclusive breastfeeding behavior

48
in Pauktaw. In this context, non-doers not recognize that giving a child food or drinks other than breast milk is a serious problem.
For both of these determinants, respondents know that not practicing the recommended behavior could lead to negative consequences such as malnutrition, diarrhea, and illness; however, they do not perceive these effects to be serious or the behavior to be effective in preventing malnutrition. This represents an opportunity to provide evidence for dietary diversity in preventing malnutrition in Sittwe Rural and targeted messaging about the serious consequences of not practicing exclusive breastfeeding in Pauktaw. These messages should be connected to real-life examples in order to help non-doers connect the theoretical effects with reality.
Perceived susceptibility and perception of divine will
These two behavioral determinants did not significantly differ between doers and non-doers. Almost all caregivers answered that their child could become malnourished, and that their religion supports the promoted behaviors. This is in line with anecdotal information from program staff, which indicate that some beneficiaries believe it is God’s will that NGOs are working in the IDP camps. Wives of religious leaders who have children under 2 years of age participate in SCI’s nutrition programming like other lactating women. Mothers responded during FGD discussions that “if the mother can care well [for the child] and feed [them] food, they will get praise [from God]” (Maw Ti Nyar camp, Dietary Diversity FGD). They also shared that “religious leaders said, ‘if the mother feeds the child their breast milk, the mother will get merit. The mother should feed breastmilk up to two years of age if the child is boy, and up to two years and six months if the child is girl’” (Dar Paing camp, Exclusive Breastfeeding FGD).
6. Recommendations
Table 3 provides programmatic recommendations for each behavioral determinant that was found significant during the Barrier Analysis.
Table 3: Program recommendations based on significant determinants
Behavioral Determinant Recommendations
Self-efficacy
Involve older children and other family members in learning appropriate feeding techniques. Since mothers are the primary decision makers when it comes to infant and young child feeding, mobilize mothers to take the lead in teaching their family members these techniques.
Integrate breastfeeding support with monthly MUAC screenings. These monthly screenings represent good opportunities to check in with mothers about any breastfeeding or other IYCF difficulties faced, and to reinforce IYCF messages.
Establish referral process with MtMSGs and Peer Groups to help identify mothers with breastfeeding difficulties.
Incorporate more role-playing and demonstrations to ensure understanding and application of IYCF best practices
Cues to action More home visits by BFCs and CDFs during mealtimes and at critical ages such as right after birth and 6 months to ensure that exclusive breastfeeding, timely complementary feeding, and dietary diversity are followed.
Mobilize BFCs and MtMSGs as part of a support/reminder system in which mothers help each other remember when it’s time for their children to begin complementary feeding, how to achieve dietary diversity, etc. For example, in Myanmar culture, a common greeting is to ask someone if they’ve eaten yet.

49
Perhaps mothers can be encouraged to also ask each other if their children have eaten yet, and if so to ask what their children have eaten.
Positive and negative attributes of the action
Include more messaging highlighting child’s physical and mental development as benefits of best IYCF practices
Include more messaging about the negative consequences of not following recommended IYCF practices. Invite mothers to give testimonials.
Perceived social acceptability Involve older children and other family members in learning appropriate feeding techniques.
Continue to involve other family members in peer group sessions.
Perceived severity Include more messaging about the negative consequences of not following recommended IYCF practices. Invite mothers to give testimonials.
Perceived action efficacy Ask women who previously had a malnourished child but were able to successfully prevent malnutrition with her next child by following IYCF best practices (especially dietary diversity) give testimonials to MtMSGs and Peer Groups. These women can also be chosen to mentor new mothers.
In addition to the recommendations presented in the table, SCI’s nutrition program would also benefit from the following activities to provide monitoring and clarity to the difficulties faced by caregivers:
Hold regular focus group discussions or feedback sessions (separately) with lactating women, BFCs, and CDFs to learn more about the challenges encountered by these women and suggest solutions to addressing these issues.
Pursue other avenues for exploring disadvantages/difficulties to practicing the recommended behaviours since it appears caregivers were a bit reluctant to vocalize these challenges. Perhaps BFCs can serve as entry points into learning more since they seem to be trusted members of the community. Supervisors can also incorporate discussions of difficulties encountered into their monitoring visits.
Be aware of household composition, paying particular attention to female headed households. These are vulnerable households that may need additional support to meet minimum dietary diversity requirements.