knowledge, attitudes and practices survey on children … · knowledge, attitudes and practices...
TRANSCRIPT
Knowledge, Attitudes and Practices survey on children and climate change 2011.
2
CONTENT
SUMMARY ........................................................................................................................ 3
INTRODUCTION ............................................................................................................. 6
2.1. AIM AND METHODOLOGY OF THE RESEARCH ................................................. 7
SURVEY RESULTS – PRIMARY SCHOOLS ............................................................. 10
3.1. DEMOGRAPHIC CHARACTERISTICS OF THE RESPONDENTS ............. 11
3.2. GLOBAL WARMING AND ITS EFFECTS ....................................................... 11
SURVEY RESULTS – SECONDARY SCHOOLS ........................................................ 23
4.1. DEMOGRAPHIC CHARACTERISTICS OF RESPONDENTS ...................... 24
4.2. GLOBAL WARMING AND ITS EFFECTS ....................................................... 24
CONCLUSION ................................................................................................................ 36

Knowledge, Attitudes and Practices survey on children and climate change 2011.
3
Part 1 SUMMARY
Knowledge, Attitudes and Practices survey on children and climate change 2011.
4
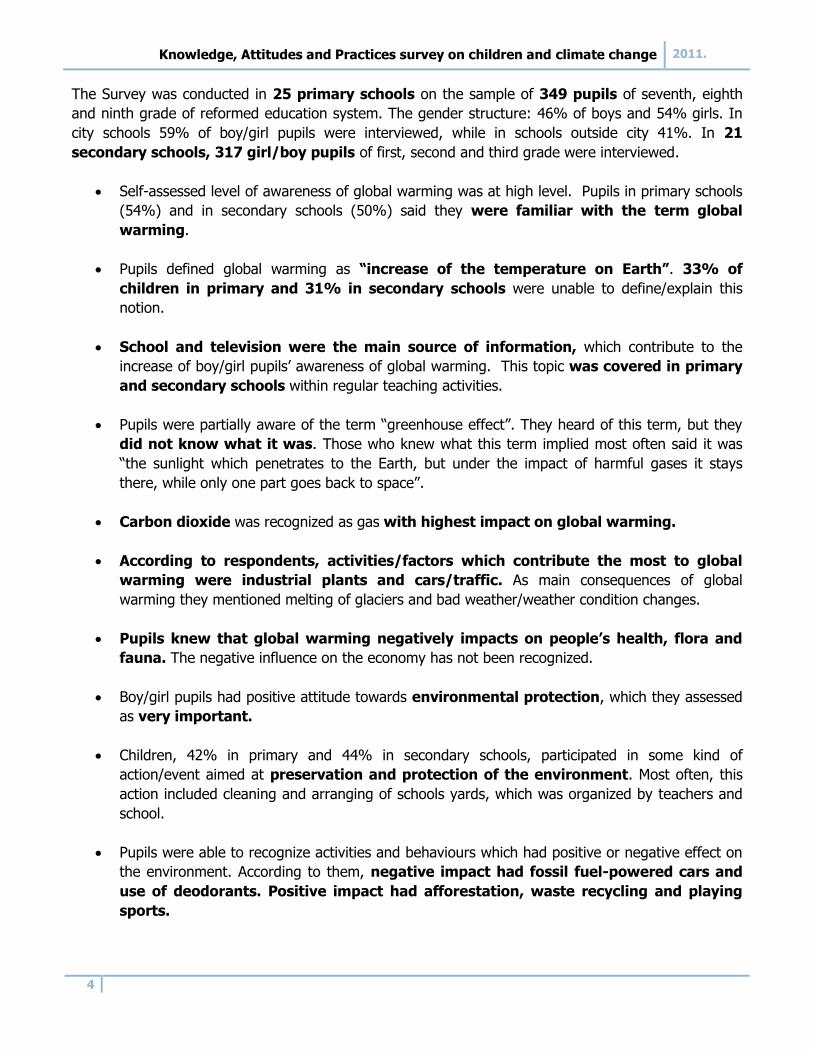
The Survey was conducted in 25 primary schools on the sample of 349 pupils of seventh, eighth
and ninth grade of reformed education system. The gender structure: 46% of boys and 54% girls. In
city schools 59% of boy/girl pupils were interviewed, while in schools outside city 41%. In 21
secondary schools, 317 girl/boy pupils of first, second and third grade were interviewed.
Self-assessed level of awareness of global warming was at high level. Pupils in primary schools
(54%) and in secondary schools (50%) said they were familiar with the term global
warming.
Pupils defined global warming as “increase of the temperature on Earth”. 33% of
children in primary and 31% in secondary schools were unable to define/explain this
notion.
School and television were the main source of information, which contribute to the
increase of boy/girl pupils‟ awareness of global warming. This topic was covered in primary
and secondary schools within regular teaching activities.
Pupils were partially aware of the term “greenhouse effect”. They heard of this term, but they
did not know what it was. Those who knew what this term implied most often said it was
“the sunlight which penetrates to the Earth, but under the impact of harmful gases it stays
there, while only one part goes back to space”.
Carbon dioxide was recognized as gas with highest impact on global warming.
According to respondents, activities/factors which contribute the most to global
warming were industrial plants and cars/traffic. As main consequences of global
warming they mentioned melting of glaciers and bad weather/weather condition changes.
Pupils knew that global warming negatively impacts on people’s health, flora and
fauna. The negative influence on the economy has not been recognized.
Boy/girl pupils had positive attitude towards environmental protection, which they assessed
as very important.
Children, 42% in primary and 44% in secondary schools, participated in some kind of
action/event aimed at preservation and protection of the environment. Most often, this
action included cleaning and arranging of schools yards, which was organized by teachers and
school.
Pupils were able to recognize activities and behaviours which had positive or negative effect on
the environment. According to them, negative impact had fossil fuel-powered cars and
use of deodorants. Positive impact had afforestation, waste recycling and playing
sports.
Knowledge, Attitudes and Practices survey on children and climate change 2011.
5
Boy/girl pupils applied some of measures aimed at environmental protection in their
home/school.
High level of readiness among respondents to point to people around them
(friends/family) how they can contribute to the reduction of harmful gas emissions is
evident.
Interviewed boy/girl pupils said that the behave on environmentally-friendly manner in
everyday life. However, by everyday activities it is possible to contribute to reduction of harmful
gas emmission causing the global warming.
Children in primary and secondary schools show readiness to undertake activities that will
contribute to environment protection and/or reduction of harmful gas emissions in
the future period.
Boy/girl pupils recognized global warming as a very serious problem for the world and the
Europe. For Montenegro and region it is a serious problem too.
Global warming is an interesting topic to learn and talk about. Majority of interviewed
pupils in primary schools (67%) has subject that covers global warming, while this percentage
in secondary schools is considerably lower (31%).
Pupils showed a significant level of interest in getting more information on causes and
effects of global warming.
The most suitable way of acquiring new knowledge and information is through
subject in school, internet and television.
Knowledge, Attitudes and Practices survey on children and climate change 2011.
6
Part 2 INTRODUCTION
Knowledge, Attitudes and Practices survey on children and climate change 2011.
7
2.1. AIM AND METHODOLOGY OF THE RESEARCH
Children behavior, awareness and attitudes on climate change is based on carrying out the public
opinion poll, which for the needs of UNICEF and UNDP in Montenegro, was conducted by the company
CEED Consulting.
With the purpose of getting insight into the level of children‟s awareness of the given topics, the
quantitative research was carried out („face-to-face‟ interviews), which included pupils in primary and
secondary schools. The starting basis for creation of representative sample1 were data from the
Ministry of Education and Sports.
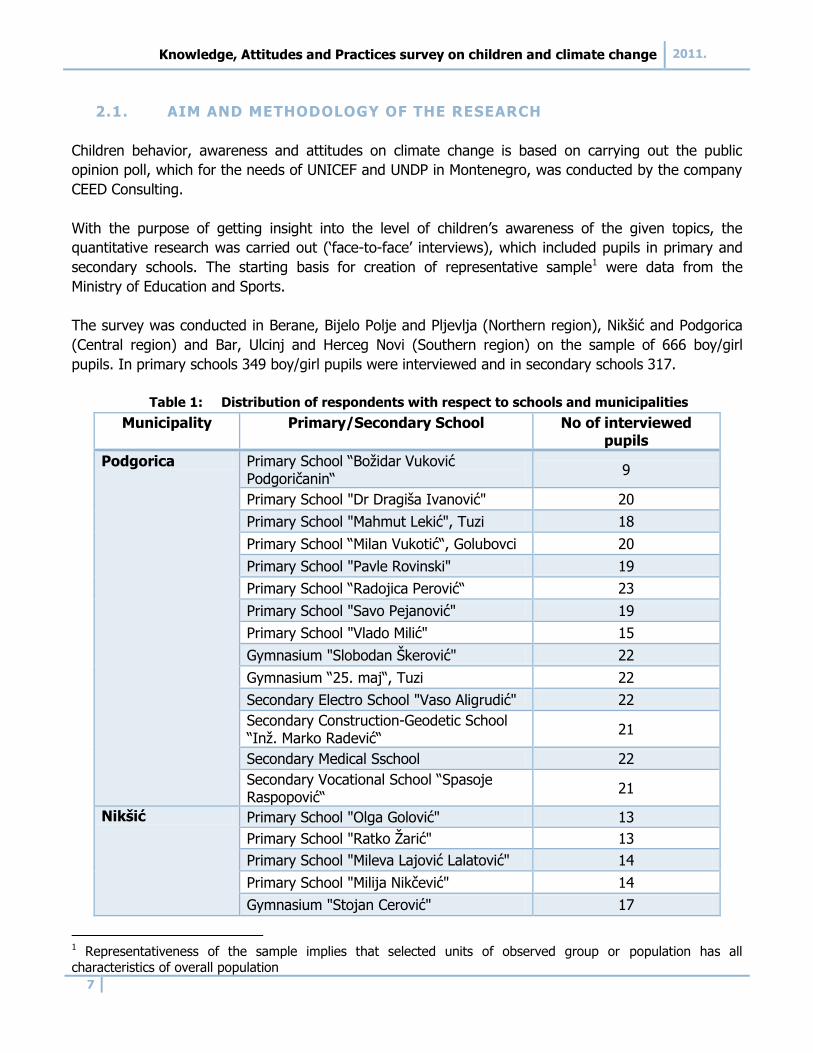
The survey was conducted in Berane, Bijelo Polje and Pljevlja (Northern region), Nikšić and Podgorica
(Central region) and Bar, Ulcinj and Herceg Novi (Southern region) on the sample of 666 boy/girl
pupils. In primary schools 349 boy/girl pupils were interviewed and in secondary schools 317.
Table 1: Distribution of respondents with respect to schools and municipalities
Municipality Primary/Secondary School No of interviewed pupils
Podgorica Primary School “Boţidar Vuković Podgoričanin“
9
Primary School "Dr Dragiša Ivanović" 20
Primary School "Mahmut Lekić", Tuzi 18
Primary School “Milan Vukotić“, Golubovci 20
Primary School "Pavle Rovinski" 19
Primary School “Radojica Perović“ 23
Primary School "Savo Pejanović" 19
Primary School "Vlado Milić" 15
Gymnasium "Slobodan Škerović" 22
Gymnasium “25. maj“, Tuzi 22
Secondary Electro School "Vaso Aligrudić" 22
Secondary Construction-Geodetic School “Inţ. Marko Radević“
21
Secondary Medical Sschool 22
Secondary Vocational School “Spasoje Raspopović“
21
Nikšić Primary School "Olga Golović" 13
Primary School "Ratko Ţarić" 13
Primary School "Mileva Lajović Lalatović" 14
Primary School "Milija Nikčević" 14
Gymnasium "Stojan Cerović" 17
1 Representativeness of the sample implies that selected units of observed group or population has all characteristics of overall population
Knowledge, Attitudes and Practices survey on children and climate change 2011.
8
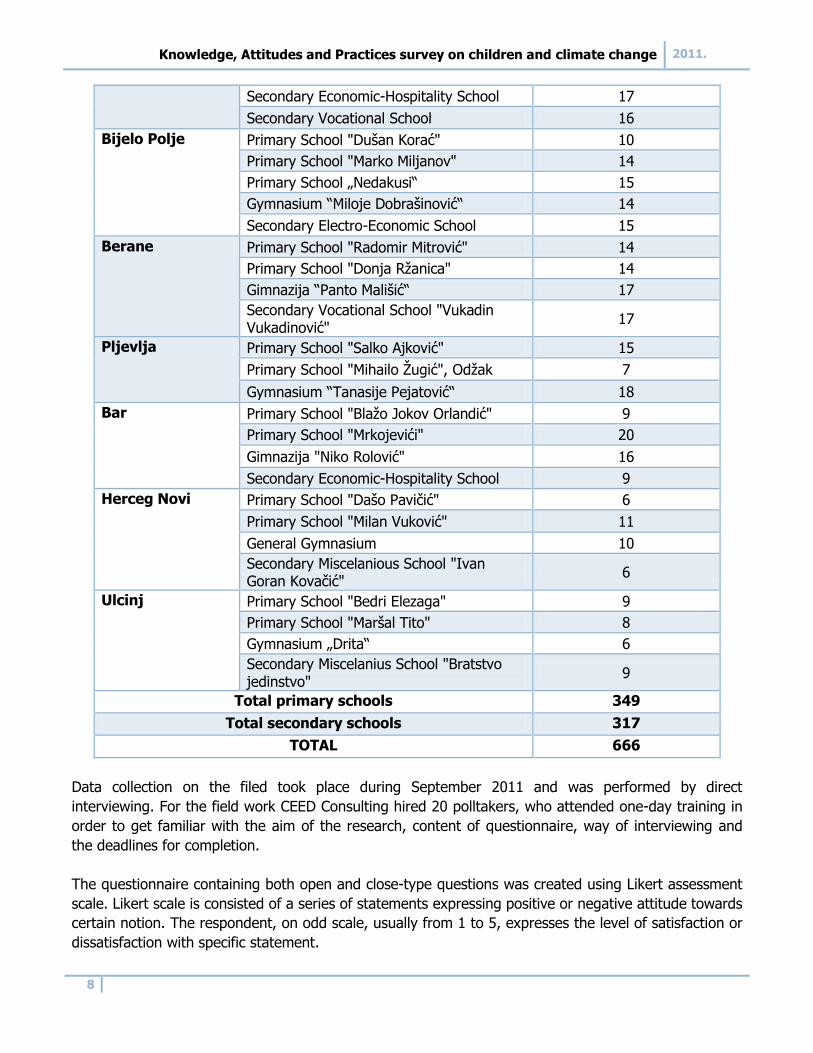
Secondary Economic-Hospitality School 17
Secondary Vocational School 16
Bijelo Polje Primary School "Dušan Korać" 10
Primary School "Marko Miljanov" 14
Primary School „Nedakusi“ 15
Gymnasium “Miloje Dobrašinović“ 14
Secondary Electro-Economic School 15
Berane Primary School "Radomir Mitrović" 14
Primary School "Donja Rţanica" 14
Gimnazija “Panto Mališić“ 17
Secondary Vocational School "Vukadin Vukadinović"
17
Pljevlja Primary School "Salko Ajković" 15
Primary School "Mihailo Ţugić", Odţak 7
Gymnasium “Tanasije Pejatović“ 18
Bar Primary School "Blaţo Jokov Orlandić" 9
Primary School "Mrkojevići" 20
Gimnazija "Niko Rolović" 16
Secondary Economic-Hospitality School 9
Herceg Novi Primary School "Dašo Pavičić" 6
Primary School "Milan Vuković" 11
General Gymnasium 10
Secondary Miscelanious School "Ivan Goran Kovačić"
6
Ulcinj Primary School "Bedri Elezaga" 9
Primary School "Maršal Tito" 8
Gymnasium „Drita“ 6
Secondary Miscelanius School "Bratstvo jedinstvo"
9
Total primary schools 349
Total secondary schools 317
TOTAL 666
Data collection on the filed took place during September 2011 and was performed by direct
interviewing. For the field work CEED Consulting hired 20 polltakers, who attended one-day training in
order to get familiar with the aim of the research, content of questionnaire, way of interviewing and
the deadlines for completion.
The questionnaire containing both open and close-type questions was created using Likert assessment
scale. Likert scale is consisted of a series of statements expressing positive or negative attitude towards
certain notion. The respondent, on odd scale, usually from 1 to 5, expresses the level of satisfaction or
dissatisfaction with specific statement.
Knowledge, Attitudes and Practices survey on children and climate change 2011.
9
Repondents were guaranteed anonymity, which contributed to obtaining as honest and accurate
answers as possible. Data entry was done in Microsoft Excel, while data processing with necessary
logical controls was performed in SPSS software (Statistical package for social sciences used for data
processing and analysis).
In accordance with the goals of the project, CEED analyst team carried out data analysis and in
accordance with the results prpared conclusions. Taking into account the way the sample has been
created, its representativeness as well as the prepared methodology, CEED believes that the presented
results may be treated as valid indicators of children behavior, awareness and attitude on global
warming and climate change.

Knowledge, Attitudes and Practices survey on children and climate change 2011.
10
Part 3 SURVEY RESULTS – PRIMARY SCHOOLS
Knowledge, Attitudes and Practices survey on children and climate change 2011.
11
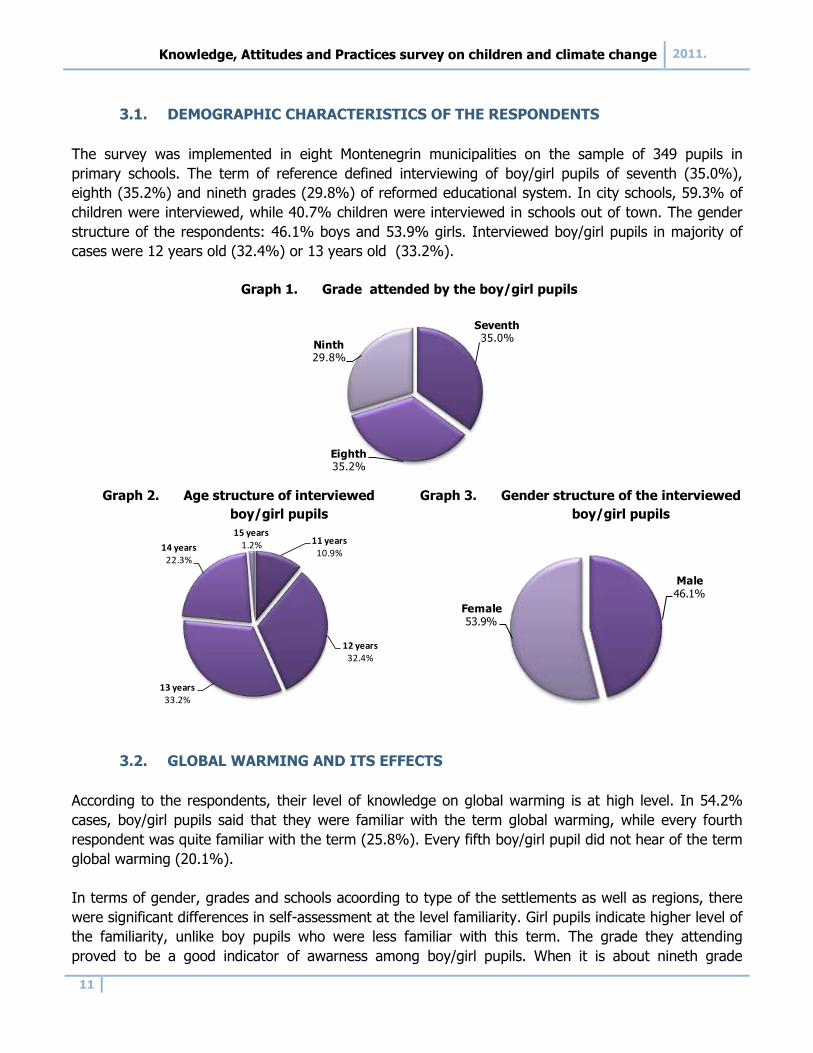
3.1. DEMOGRAPHIC CHARACTERISTICS OF THE RESPONDENTS
The survey was implemented in eight Montenegrin municipalities on the sample of 349 pupils in
primary schools. The term of reference defined interviewing of boy/girl pupils of seventh (35.0%),
eighth (35.2%) and nineth grades (29.8%) of reformed educational system. In city schools, 59.3% of
children were interviewed, while 40.7% children were interviewed in schools out of town. The gender
structure of the respondents: 46.1% boys and 53.9% girls. Interviewed boy/girl pupils in majority of
cases were 12 years old (32.4%) or 13 years old (33.2%).
Graph 1. Grade attended by the boy/girl pupils
Graph 2. Age structure of interviewed
boy/girl pupils
Graph 3. Gender structure of the interviewed
boy/girl pupils
3.2. GLOBAL WARMING AND ITS EFFECTS
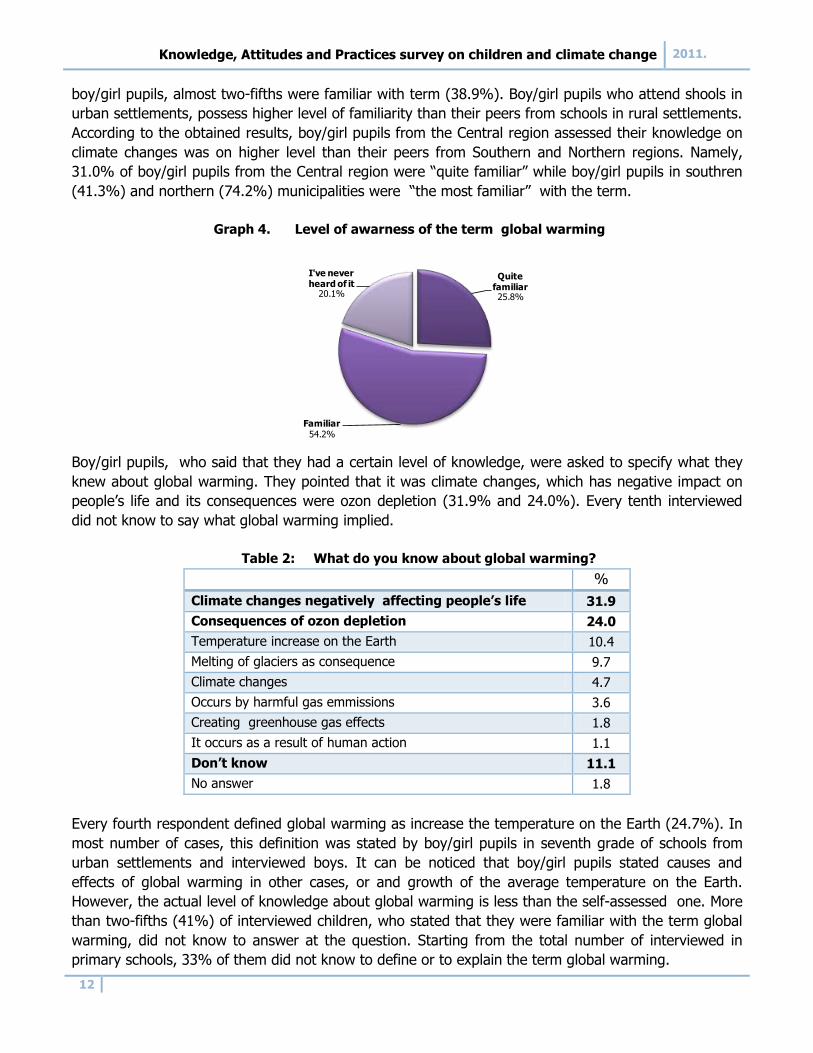
According to the respondents, their level of knowledge on global warming is at high level. In 54.2%
cases, boy/girl pupils said that they were familiar with the term global warming, while every fourth
respondent was quite familiar with the term (25.8%). Every fifth boy/girl pupil did not hear of the term
global warming (20.1%).
In terms of gender, grades and schools acoording to type of the settlements as well as regions, there
were significant differences in self-assessment at the level familiarity. Girl pupils indicate higher level of
the familiarity, unlike boy pupils who were less familiar with this term. The grade they attending
proved to be a good indicator of awarness among boy/girl pupils. When it is about nineth grade
Seventh35.0%
Eighth 35.2%
Ninth29.8%
11 years10.9%
12 years32.4%
13 years33.2%
14 years22.3%
15 years 1.2%
Male46.1%
Female53.9%
Knowledge, Attitudes and Practices survey on children and climate change 2011.
12
boy/girl pupils, almost two-fifths were familiar with term (38.9%). Boy/girl pupils who attend shools in
urban settlements, possess higher level of familiarity than their peers from schools in rural settlements.
According to the obtained results, boy/girl pupils from the Central region assessed their knowledge on
climate changes was on higher level than their peers from Southern and Northern regions. Namely,
31.0% of boy/girl pupils from the Central region were “quite familiar” while boy/girl pupils in southren
(41.3%) and northern (74.2%) municipalities were “the most familiar” with the term.
Graph 4. Level of awarness of the term global warming
Boy/girl pupils, who said that they had a certain level of knowledge, were asked to specify what they
knew about global warming. They pointed that it was climate changes, which has negative impact on
people‟s life and its consequences were ozon depletion (31.9% and 24.0%). Every tenth interviewed
did not know to say what global warming implied.
Table 2: What do you know about global warming?
%
Climate changes negatively affecting people’s life 31.9
Consequences of ozon depletion 24.0
Temperature increase on the Earth 10.4
Melting of glaciers as consequence 9.7
Climate changes 4.7
Occurs by harmful gas emmissions 3.6
Creating greenhouse gas effects 1.8
It occurs as a result of human action 1.1
Don’t know 11.1
No answer 1.8
Every fourth respondent defined global warming as increase the temperature on the Earth (24.7%). In
most number of cases, this definition was stated by boy/girl pupils in seventh grade of schools from
urban settlements and interviewed boys. It can be noticed that boy/girl pupils stated causes and
effects of global warming in other cases, or and growth of the average temperature on the Earth.
However, the actual level of knowledge about global warming is less than the self-assessed one. More
than two-fifths (41%) of interviewed children, who stated that they were familiar with the term global
warming, did not know to answer at the question. Starting from the total number of interviewed in
primary schools, 33% of them did not know to define or to explain the term global warming.
Quite familiar25.8%
Familiar54.2%
I've never heard of it
20.1%
Knowledge, Attitudes and Practices survey on children and climate change 2011.
13
Box1: What is global warming?
“Global warming present changes in surface air temperature, emerging as the greenhouse effect caused by
emissions of greenhouse gases in the air.”
Source: ITD/GEMET 2000. http://glossari.eea.europa.eu
Table 3: How would you define global warming?
%
Increase the temperature on the Earth 24.7
Consequence of ozon depletion 13.6
Climate changes 11.5
Climate changes negatively affecting life on the Earth 7.9
Occurs by harmful gas emmissions 6.8
Melting of glaciers as consequence 3.6
Caused by human action 1.4
Ecological disaster 1.1
Creating the greenhouse gas effect 0.7
Some kind of energy 0.4
Good for people 0.4
No answer 21.9
Don’t know 19.1
The school and the media play an important role in education and raising level of awarness on global
warming. As survey results show, children obtain information about global warming primarily through
TV and in school (37.1% and 31.0%). Children in schools from urban settlements are mostly informed
in school, while in rural settlements, they are mostly informed through TV. In smaller percentage, they
stated the Internet as a source of information (Facebook, Twiter, etc.) or news programs (10.0% and
8.2%).
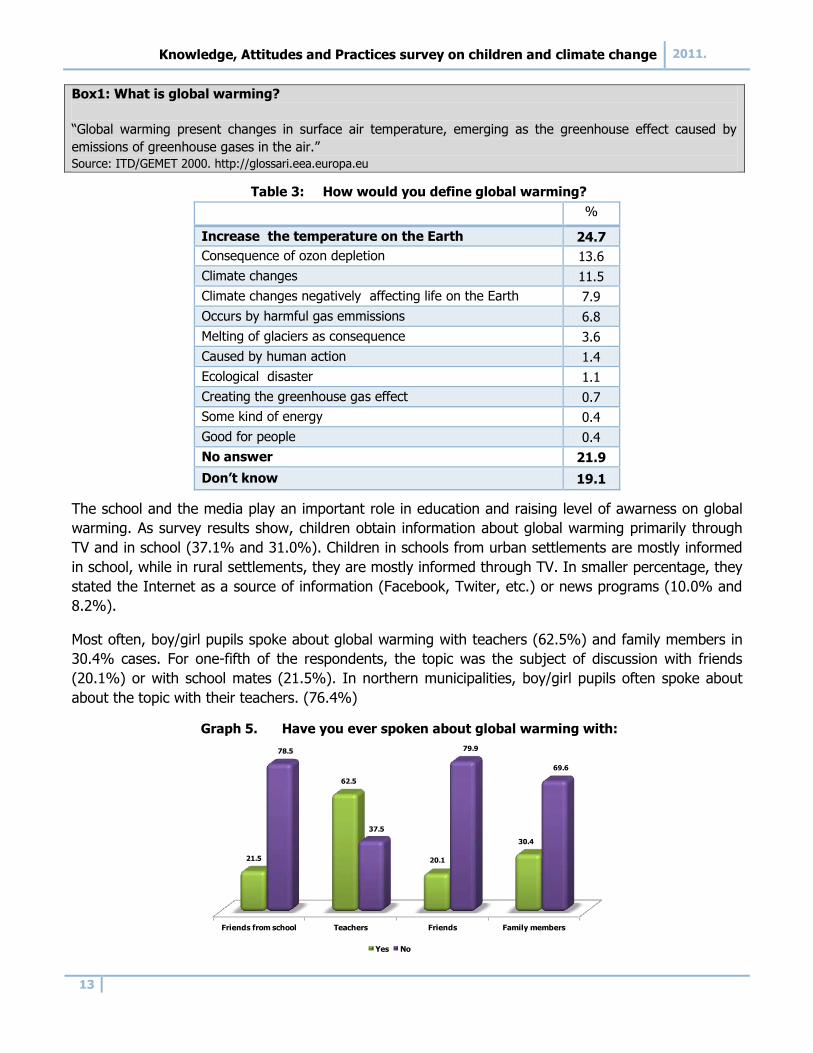
Most often, boy/girl pupils spoke about global warming with teachers (62.5%) and family members in
30.4% cases. For one-fifth of the respondents, the topic was the subject of discussion with friends
(20.1%) or with school mates (21.5%). In northern municipalities, boy/girl pupils often spoke about
about the topic with their teachers. (76.4%)
Graph 5. Have you ever spoken about global warming with:
Friends from school Teachers Friends Family members
21.5
62.5
20.1
30.4
78.5
37.5
79.9
69.6
Yes No
Knowledge, Attitudes and Practices survey on children and climate change 2011.
14
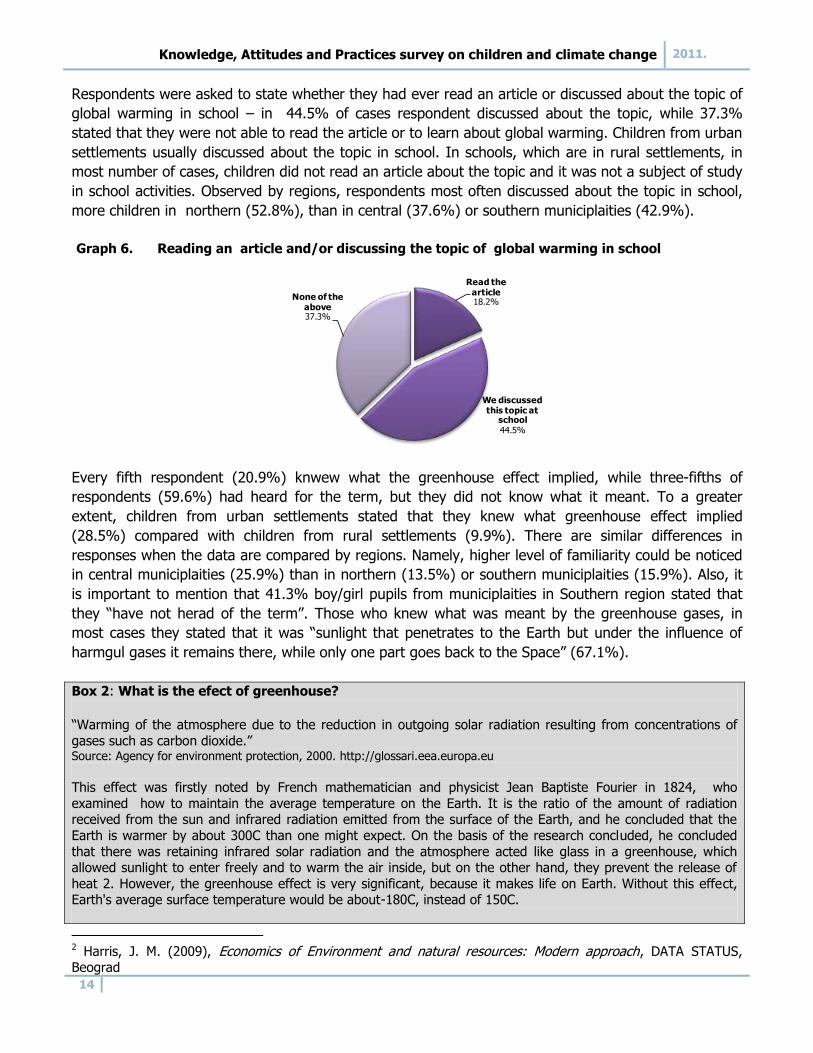
Respondents were asked to state whether they had ever read an article or discussed about the topic of
global warming in school – in 44.5% of cases respondent discussed about the topic, while 37.3%
stated that they were not able to read the article or to learn about global warming. Children from urban
settlements usually discussed about the topic in school. In schools, which are in rural settlements, in
most number of cases, children did not read an article about the topic and it was not a subject of study
in school activities. Observed by regions, respondents most often discussed about the topic in school,
more children in northern (52.8%), than in central (37.6%) or southern municiplaities (42.9%).
Graph 6. Reading an article and/or discussing the topic of global warming in school
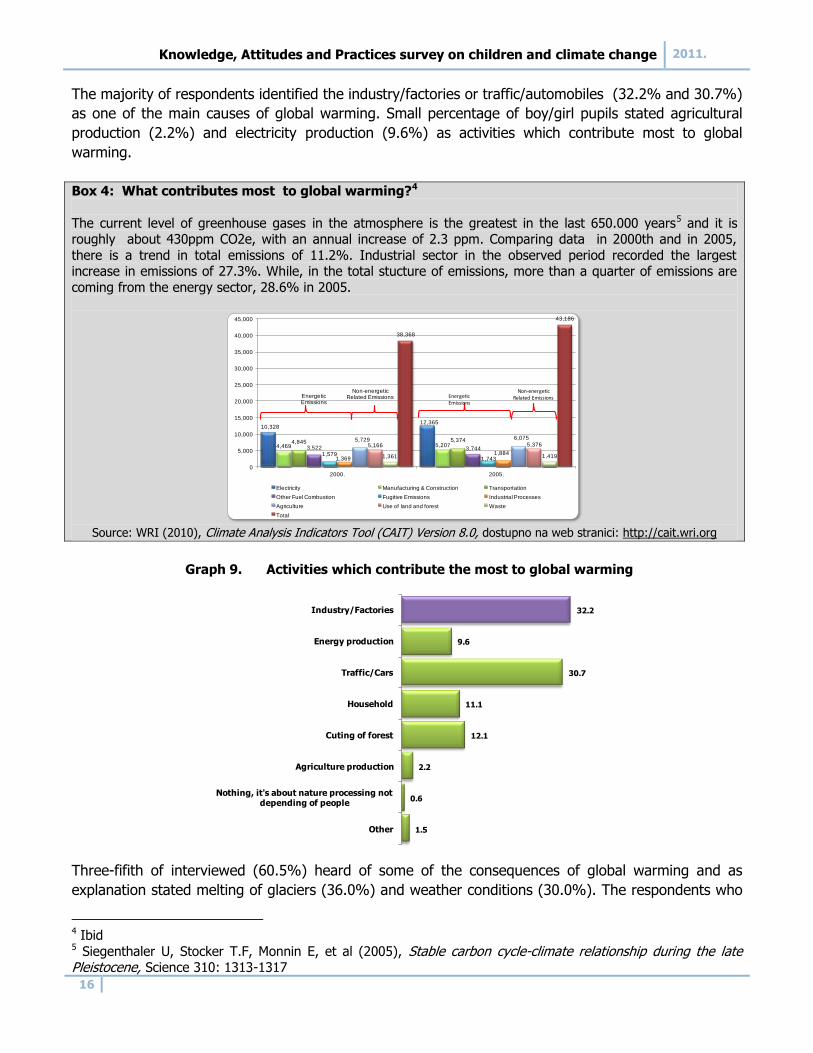
Every fifth respondent (20.9%) knwew what the greenhouse effect implied, while three-fifths of
respondents (59.6%) had heard for the term, but they did not know what it meant. To a greater
extent, children from urban settlements stated that they knew what greenhouse effect implied
(28.5%) compared with children from rural settlements (9.9%). There are similar differences in
responses when the data are compared by regions. Namely, higher level of familiarity could be noticed
in central municiplaities (25.9%) than in northern (13.5%) or southern municiplaities (15.9%). Also, it
is important to mention that 41.3% boy/girl pupils from municiplaities in Southern region stated that
they “have not herad of the term”. Those who knew what was meant by the greenhouse gases, in
most cases they stated that it was “sunlight that penetrates to the Earth but under the influence of
harmgul gases it remains there, while only one part goes back to the Space” (67.1%).
Box 2: What is the efect of greenhouse?
“Warming of the atmosphere due to the reduction in outgoing solar radiation resulting from concentrations of
gases such as carbon dioxide.” Source: Agency for environment protection, 2000. http://glossari.eea.europa.eu
This effect was firstly noted by French mathematician and physicist Jean Baptiste Fourier in 1824, who
examined how to maintain the average temperature on the Earth. It is the ratio of the amount of radiation received from the sun and infrared radiation emitted from the surface of the Earth, and he concluded that the
Earth is warmer by about 300C than one might expect. On the basis of the research concluded, he concluded
that there was retaining infrared solar radiation and the atmosphere acted like glass in a greenhouse, which allowed sunlight to enter freely and to warm the air inside, but on the other hand, they prevent the release of
heat 2. However, the greenhouse effect is very significant, because it makes life on Earth. Without this effect, Earth's average surface temperature would be about-180C, instead of 150C.
2 Harris, J. M. (2009), Economics of Environment and natural resources: Modern approach, DATA STATUS, Beograd
Read the article18.2%
We discussed this topic at
school44.5%
None of the above37.3%
Knowledge, Attitudes and Practices survey on children and climate change 2011.
15
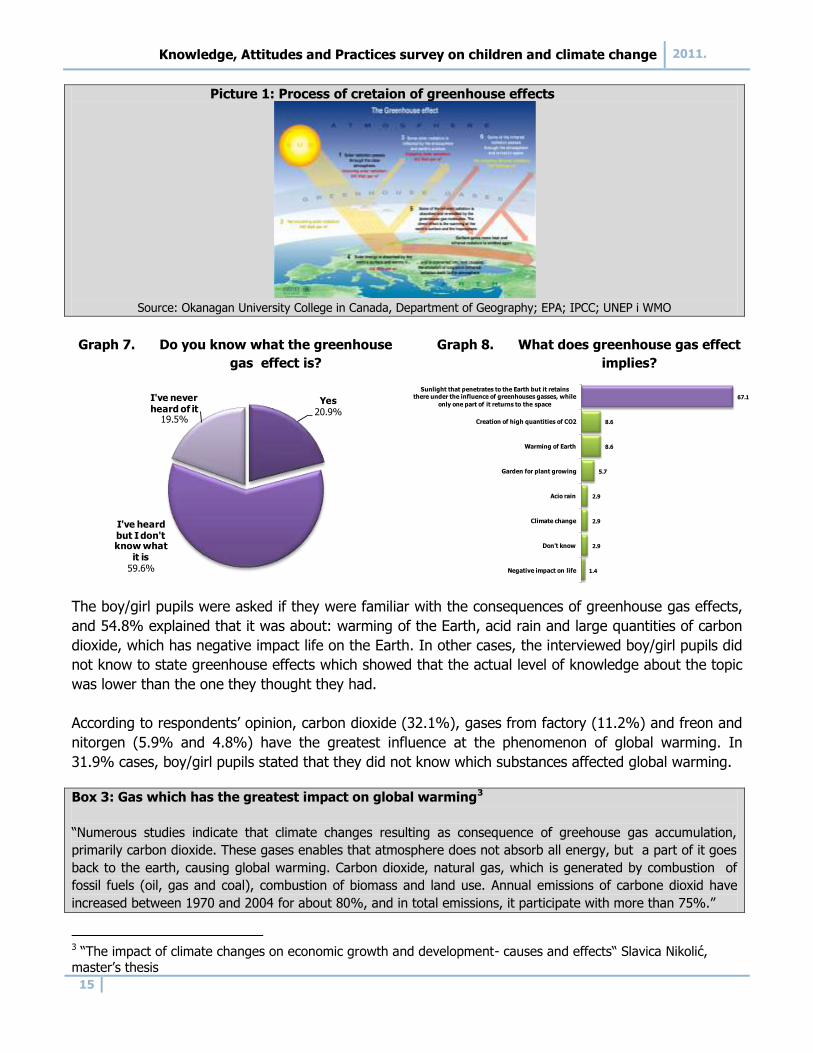
Picture 1: Process of cretaion of greenhouse effects
Source: Okanagan University College in Canada, Department of Geography; EPA; IPCC; UNEP i WMO
Graph 7. Do you know what the greenhouse
gas effect is?
Graph 8. What does greenhouse gas effect
implies?
The boy/girl pupils were asked if they were familiar with the consequences of greenhouse gas effects,
and 54.8% explained that it was about: warming of the Earth, acid rain and large quantities of carbon
dioxide, which has negative impact life on the Earth. In other cases, the interviewed boy/girl pupils did
not know to state greenhouse effects which showed that the actual level of knowledge about the topic
was lower than the one they thought they had.
According to respondents‟ opinion, carbon dioxide (32.1%), gases from factory (11.2%) and freon and
nitorgen (5.9% and 4.8%) have the greatest influence at the phenomenon of global warming. In
31.9% cases, boy/girl pupils stated that they did not know which substances affected global warming.
Box 3: Gas which has the greatest impact on global warming3
“Numerous studies indicate that climate changes resulting as consequence of greehouse gas accumulation,
primarily carbon dioxide. These gases enables that atmosphere does not absorb all energy, but a part of it goes
back to the earth, causing global warming. Carbon dioxide, natural gas, which is generated by combustion of
fossil fuels (oil, gas and coal), combustion of biomass and land use. Annual emissions of carbone dioxid have
increased between 1970 and 2004 for about 80%, and in total emissions, it participate with more than 75%.”
3 “The impact of climate changes on economic growth and development- causes and effects“ Slavica Nikolić, master‟s thesis
Yes 20.9%
I've heard but I don't know what
it is59.6%
I've never heard of it
19.5%
67.1
8.6
8.6
5.7
2.9
2.9
2.9
1.4
Sunlight that penetrates to the Earth but it retains there under the influence of greenhouses gasses, while
only one part of it returns to the space
Creation of high quantities of CO2
Warming of Earth
Garden for plant growing
Acio rain
Climate change
Don't know
Negative impact on life
Knowledge, Attitudes and Practices survey on children and climate change 2011.
16
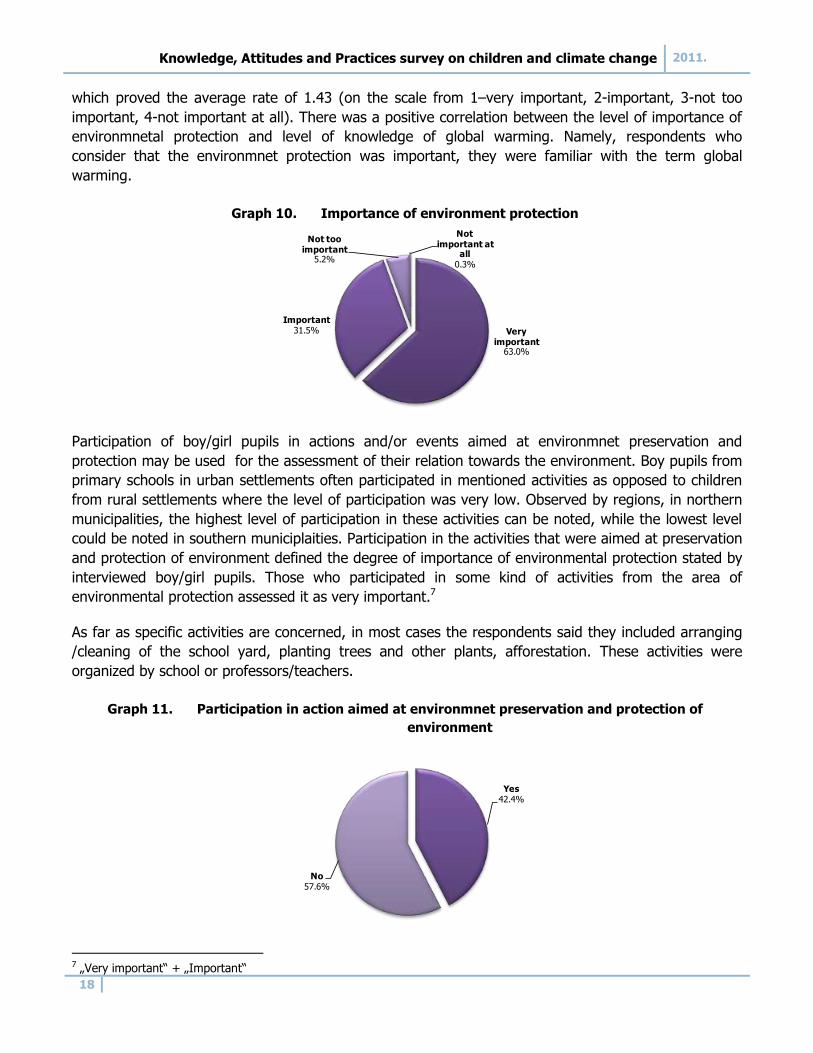
The majority of respondents identified the industry/factories or traffic/automobiles (32.2% and 30.7%)
as one of the main causes of global warming. Small percentage of boy/girl pupils stated agricultural
production (2.2%) and electricity production (9.6%) as activities which contribute most to global
warming.
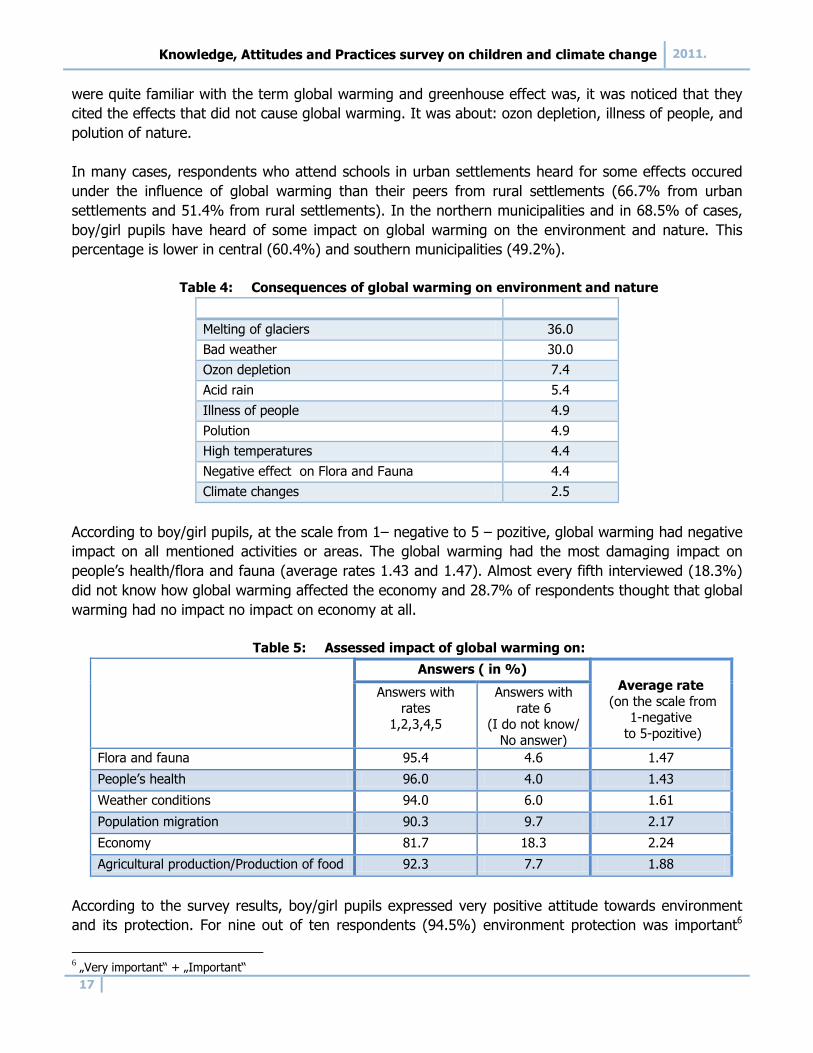
Box 4: What contributes most to global warming?4
The current level of greenhouse gases in the atmosphere is the greatest in the last 650.000 years5 and it is roughly about 430ppm CO2e, with an annual increase of 2.3 ppm. Comparing data in 2000th and in 2005,
there is a trend in total emissions of 11.2%. Industrial sector in the observed period recorded the largest increase in emissions of 27.3%. While, in the total stucture of emissions, more than a quarter of emissions are
coming from the energy sector, 28.6% in 2005.
Source: WRI (2010), Climate Analysis Indicators Tool (CAIT) Version 8.0, dostupno na web stranici: http://cait.wri.org
Graph 9. Activities which contribute the most to global warming
Three-fifith of interviewed (60.5%) heard of some of the consequences of global warming and as
explanation stated melting of glaciers (36.0%) and weather conditions (30.0%). The respondents who
4 Ibid 5 Siegenthaler U, Stocker T.F, Monnin E, et al (2005), Stable carbon cycle-climate relationship during the late Pleistocene, Science 310: 1313-1317
10,32812,365
4,469 5,2074,845 5,374
3,522 3,7441,579
1,7431,3691,884
5,729 6,075
5,166 5,376
1,361 1,419
38,368
43,186
0
5,000
10,000
15,000
20,000
25,000
30,000
35,000
40,000
45,000
2000. 2005.
Electricity Manufacturing & Construction Transportation
Other Fuel Combustion Fugitive Emissions Industrial Processes
Agriculture Use of land and forest Waste
Total
Energetic Emissions
Non-energetic Related Emissions Energetic
Emissions
Non-energetic Related Emissions
32.2
9.6
30.7
11.1
12.1
2.2
0.6
1.5
Industry/Factories
Energy production
Traffic/Cars
Household
Cuting of forest
Agriculture production
Nothing, it's about nature processing not depending of people
Other
Knowledge, Attitudes and Practices survey on children and climate change 2011.
17
were quite familiar with the term global warming and greenhouse effect was, it was noticed that they
cited the effects that did not cause global warming. It was about: ozon depletion, illness of people, and
polution of nature.
In many cases, respondents who attend schools in urban settlements heard for some effects occured
under the influence of global warming than their peers from rural settlements (66.7% from urban
settlements and 51.4% from rural settlements). In the northern municipalities and in 68.5% of cases,
boy/girl pupils have heard of some impact on global warming on the environment and nature. This
percentage is lower in central (60.4%) and southern municipalities (49.2%).
Table 4: Consequences of global warming on environment and nature
Melting of glaciers 36.0
Bad weather 30.0
Ozon depletion 7.4
Acid rain 5.4
Illness of people 4.9
Polution 4.9
High temperatures 4.4
Negative effect on Flora and Fauna 4.4
Climate changes 2.5
According to boy/girl pupils, at the scale from 1– negative to 5 – pozitive, global warming had negative
impact on all mentioned activities or areas. The global warming had the most damaging impact on
people‟s health/flora and fauna (average rates 1.43 and 1.47). Almost every fifth interviewed (18.3%)
did not know how global warming affected the economy and 28.7% of respondents thought that global
warming had no impact no impact on economy at all.
Table 5: Assessed impact of global warming on:
Answers ( in %)
Average rate
(on the scale from 1-negative
to 5-pozitive)
Answers with
rates 1,2,3,4,5
Answers with
rate 6 (I do not know/
No answer)
Flora and fauna 95.4 4.6 1.47
People‟s health 96.0 4.0 1.43
Weather conditions 94.0 6.0 1.61
Population migration 90.3 9.7 2.17
Economy 81.7 18.3 2.24
Agricultural production/Production of food 92.3 7.7 1.88
According to the survey results, boy/girl pupils expressed very positive attitude towards environment
and its protection. For nine out of ten respondents (94.5%) environment protection was important6
6 „Very important“ + „Important“
Knowledge, Attitudes and Practices survey on children and climate change 2011.
18
which proved the average rate of 1.43 (on the scale from 1–very important, 2-important, 3-not too
important, 4-not important at all). There was a positive correlation between the level of importance of
environmnetal protection and level of knowledge of global warming. Namely, respondents who
consider that the environmnet protection was important, they were familiar with the term global
warming.
Graph 10. Importance of environment protection
Participation of boy/girl pupils in actions and/or events aimed at environmnet preservation and
protection may be used for the assessment of their relation towards the environment. Boy pupils from
primary schools in urban settlements often participated in mentioned activities as opposed to children
from rural settlements where the level of participation was very low. Observed by regions, in northern
municipalities, the highest level of participation in these activities can be noted, while the lowest level
could be noted in southern municiplaities. Participation in the activities that were aimed at preservation
and protection of environment defined the degree of importance of environmental protection stated by
interviewed boy/girl pupils. Those who participated in some kind of activities from the area of
environmental protection assessed it as very important.7
As far as specific activities are concerned, in most cases the respondents said they included arranging
/cleaning of the school yard, planting trees and other plants, afforestation. These activities were
organized by school or professors/teachers.
Graph 11. Participation in action aimed at environmnet preservation and protection of
environment
7 „Very important“ + „Important“
Very important
63.0%
Important31.5%
Not too important
5.2%
Not important at
all0.3%
Yes42.4%
No57.6%
Knowledge, Attitudes and Practices survey on children and climate change 2011.
19
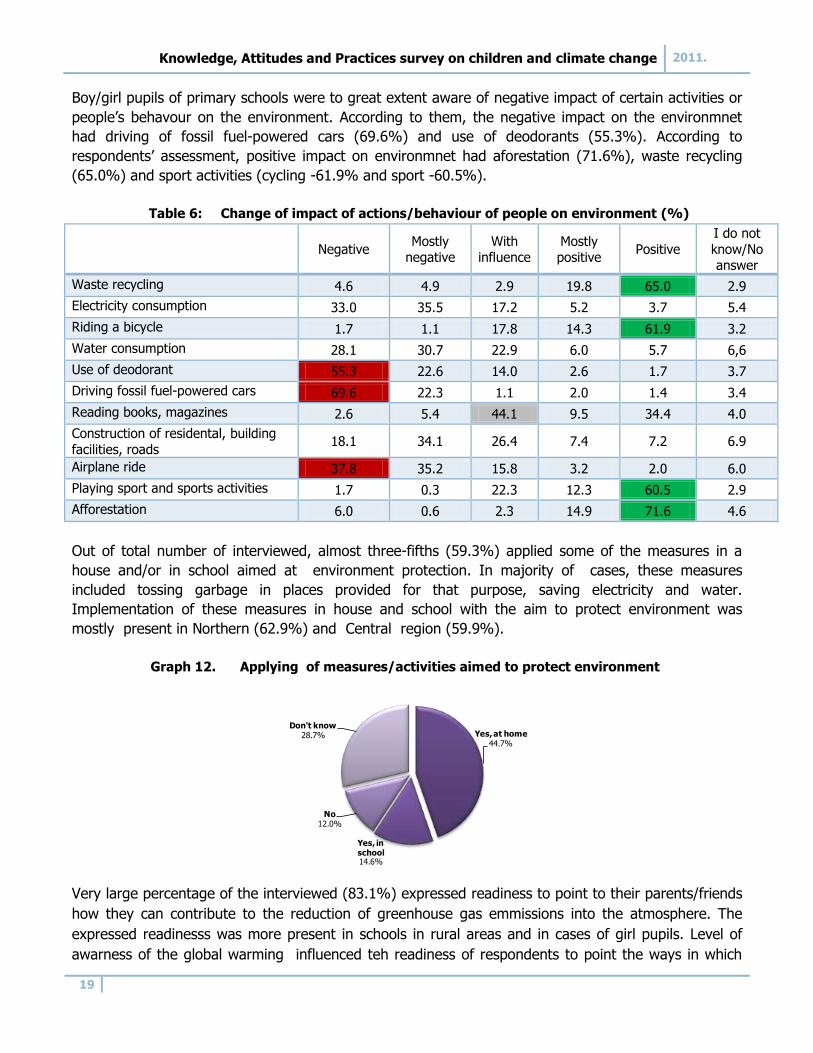
Boy/girl pupils of primary schools were to great extent aware of negative impact of certain activities or
people‟s behavour on the environment. According to them, the negative impact on the environmnet
had driving of fossil fuel-powered cars (69.6%) and use of deodorants (55.3%). According to
respondents‟ assessment, positive impact on environmnet had aforestation (71.6%), waste recycling
(65.0%) and sport activities (cycling -61.9% and sport -60.5%).
Table 6: Change of impact of actions/behaviour of people on environment (%)
Negative Mostly
negative With
influence Mostly positive
Positive
I do not
know/No answer
Waste recycling 4.6 4.9 2.9 19.8 65.0 2.9
Electricity consumption 33.0 35.5 17.2 5.2 3.7 5.4
Riding a bicycle 1.7 1.1 17.8 14.3 61.9 3.2
Water consumption 28.1 30.7 22.9 6.0 5.7 6,6
Use of deodorant 55.3 22.6 14.0 2.6 1.7 3.7
Driving fossil fuel-powered cars 69.6 22.3 1.1 2.0 1.4 3.4
Reading books, magazines 2.6 5.4 44.1 9.5 34.4 4.0
Construction of residental, building
facilities, roads 18.1 34.1 26.4 7.4 7.2 6.9
Airplane ride 37.8 35.2 15.8 3.2 2.0 6.0
Playing sport and sports activities 1.7 0.3 22.3 12.3 60.5 2.9
Afforestation 6.0 0.6 2.3 14.9 71.6 4.6
Out of total number of interviewed, almost three-fifths (59.3%) applied some of the measures in a
house and/or in school aimed at environment protection. In majority of cases, these measures
included tossing garbage in places provided for that purpose, saving electricity and water.
Implementation of these measures in house and school with the aim to protect environment was
mostly present in Northern (62.9%) and Central region (59.9%).
Graph 12. Applying of measures/activities aimed to protect environment
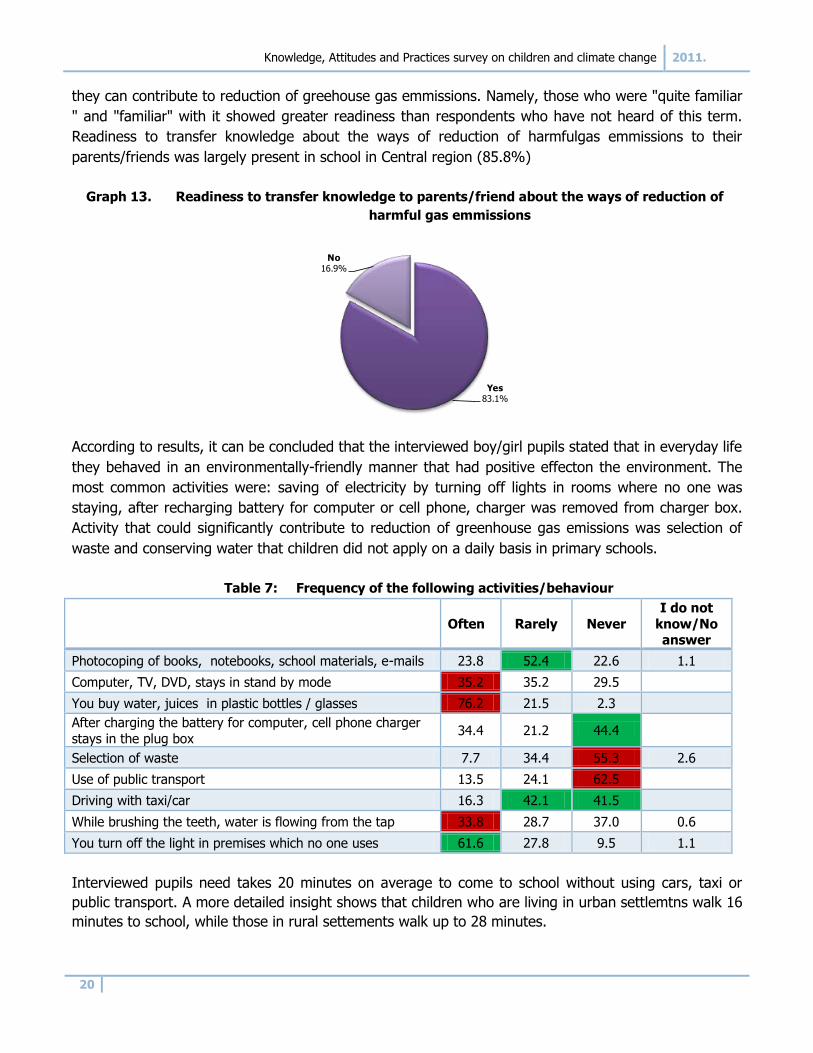
Very large percentage of the interviewed (83.1%) expressed readiness to point to their parents/friends
how they can contribute to the reduction of greenhouse gas emmissions into the atmosphere. The
expressed readinesss was more present in schools in rural areas and in cases of girl pupils. Level of
awarness of the global warming influenced teh readiness of respondents to point the ways in which
Yes, at home44.7%
Yes, in school14.6%
No12.0%
Don't know28.7%
Knowledge, Attitudes and Practices survey on children and climate change 2011.
20
they can contribute to reduction of greehouse gas emmissions. Namely, those who were "quite familiar
" and "familiar" with it showed greater readiness than respondents who have not heard of this term.
Readiness to transfer knowledge about the ways of reduction of harmfulgas emmissions to their
parents/friends was largely present in school in Central region (85.8%)
Graph 13. Readiness to transfer knowledge to parents/friend about the ways of reduction of
harmful gas emmissions
According to results, it can be concluded that the interviewed boy/girl pupils stated that in everyday life
they behaved in an environmentally-friendly manner that had positive effecton the environment. The
most common activities were: saving of electricity by turning off lights in rooms where no one was
staying, after recharging battery for computer or cell phone, charger was removed from charger box.
Activity that could significantly contribute to reduction of greenhouse gas emissions was selection of
waste and conserving water that children did not apply on a daily basis in primary schools.
Table 7: Frequency of the following activities/behaviour
Often Rarely Never
I do not
know/No answer
Photocoping of books, notebooks, school materials, e-mails 23.8 52.4 22.6 1.1
Computer, TV, DVD, stays in stand by mode 35.2 35.2 29.5
You buy water, juices in plastic bottles / glasses 76.2 21.5 2.3
After charging the battery for computer, cell phone charger
stays in the plug box 34.4 21.2 44.4
Selection of waste 7.7 34.4 55.3 2.6
Use of public transport 13.5 24.1 62.5
Driving with taxi/car 16.3 42.1 41.5
While brushing the teeth, water is flowing from the tap 33.8 28.7 37.0 0.6
You turn off the light in premises which no one uses 61.6 27.8 9.5 1.1
Interviewed pupils need takes 20 minutes on average to come to school without using cars, taxi or
public transport. A more detailed insight shows that children who are living in urban settlemtns walk 16
minutes to school, while those in rural settements walk up to 28 minutes.
Yes83.1%
No16.9%
Knowledge, Attitudes and Practices survey on children and climate change 2011.
21
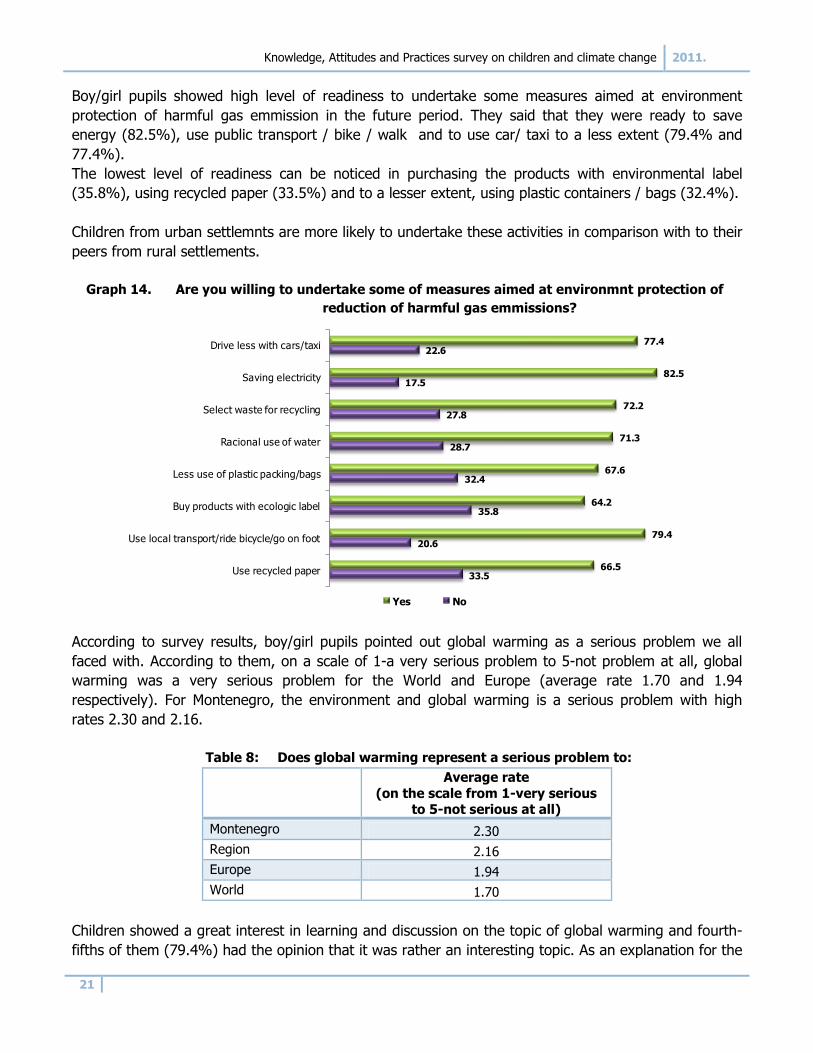
Boy/girl pupils showed high level of readiness to undertake some measures aimed at environment
protection of harmful gas emmission in the future period. They said that they were ready to save
energy (82.5%), use public transport / bike / walk and to use car/ taxi to a less extent (79.4% and
77.4%).
The lowest level of readiness can be noticed in purchasing the products with environmental label
(35.8%), using recycled paper (33.5%) and to a lesser extent, using plastic containers / bags (32.4%).
Children from urban settlemnts are more likely to undertake these activities in comparison with to their
peers from rural settlements.
Graph 14. Are you willing to undertake some of measures aimed at environmnt protection of
reduction of harmful gas emmissions?
According to survey results, boy/girl pupils pointed out global warming as a serious problem we all
faced with. According to them, on a scale of 1-a very serious problem to 5-not problem at all, global
warming was a very serious problem for the World and Europe (average rate 1.70 and 1.94
respectively). For Montenegro, the environment and global warming is a serious problem with high
rates 2.30 and 2.16.
Table 8: Does global warming represent a serious problem to:
Average rate
(on the scale from 1-very serious to 5-not serious at all)
Montenegro 2.30
Region 2.16
Europe 1.94
World 1.70
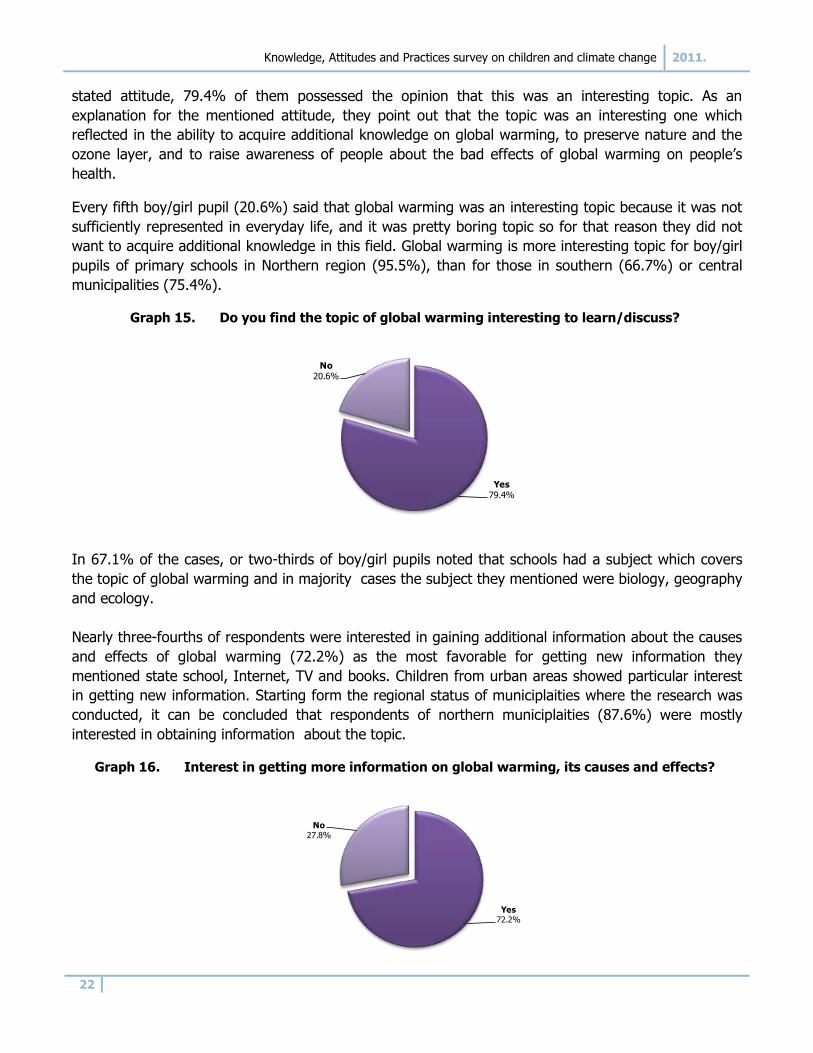
Children showed a great interest in learning and discussion on the topic of global warming and fourth-
fifths of them (79.4%) had the opinion that it was rather an interesting topic. As an explanation for the
77.4
82.5
72.2
71.3
67.6
64.2
79.4
66.5
22.6
17.5
27.8
28.7
32.4
35.8
20.6
33.5
Drive less with cars/taxi
Saving electricity
Select waste for recycling
Racional use of water
Less use of plastic packing/bags
Buy products with ecologic label
Use local transport/ride bicycle/go on foot
Use recycled paper
Yes No
Knowledge, Attitudes and Practices survey on children and climate change 2011.
22
stated attitude, 79.4% of them possessed the opinion that this was an interesting topic. As an
explanation for the mentioned attitude, they point out that the topic was an interesting one which
reflected in the ability to acquire additional knowledge on global warming, to preserve nature and the
ozone layer, and to raise awareness of people about the bad effects of global warming on people‟s
health.
Every fifth boy/girl pupil (20.6%) said that global warming was an interesting topic because it was not
sufficiently represented in everyday life, and it was pretty boring topic so for that reason they did not
want to acquire additional knowledge in this field. Global warming is more interesting topic for boy/girl
pupils of primary schools in Northern region (95.5%), than for those in southern (66.7%) or central
municipalities (75.4%).
Graph 15. Do you find the topic of global warming interesting to learn/discuss?
In 67.1% of the cases, or two-thirds of boy/girl pupils noted that schools had a subject which covers
the topic of global warming and in majority cases the subject they mentioned were biology, geography
and ecology.
Nearly three-fourths of respondents were interested in gaining additional information about the causes
and effects of global warming (72.2%) as the most favorable for getting new information they
mentioned state school, Internet, TV and books. Children from urban areas showed particular interest
in getting new information. Starting form the regional status of municiplaities where the research was
conducted, it can be concluded that respondents of northern municiplaities (87.6%) were mostly
interested in obtaining information about the topic.
Graph 16. Interest in getting more information on global warming, its causes and effects?
Yes79.4%
No20.6%
Yes72.2%
No27.8%
Knowledge, Attitudes and Practices survey on children and climate change 2011.
23
Part 4 SURVEY RESULTS – SECONDARY SCHOOLS
Knowledge, Attitudes and Practices survey on children and climate change 2011.
24
4.1. DEMOGRAPHIC CHARACTERISTICS OF RESPONDENTS
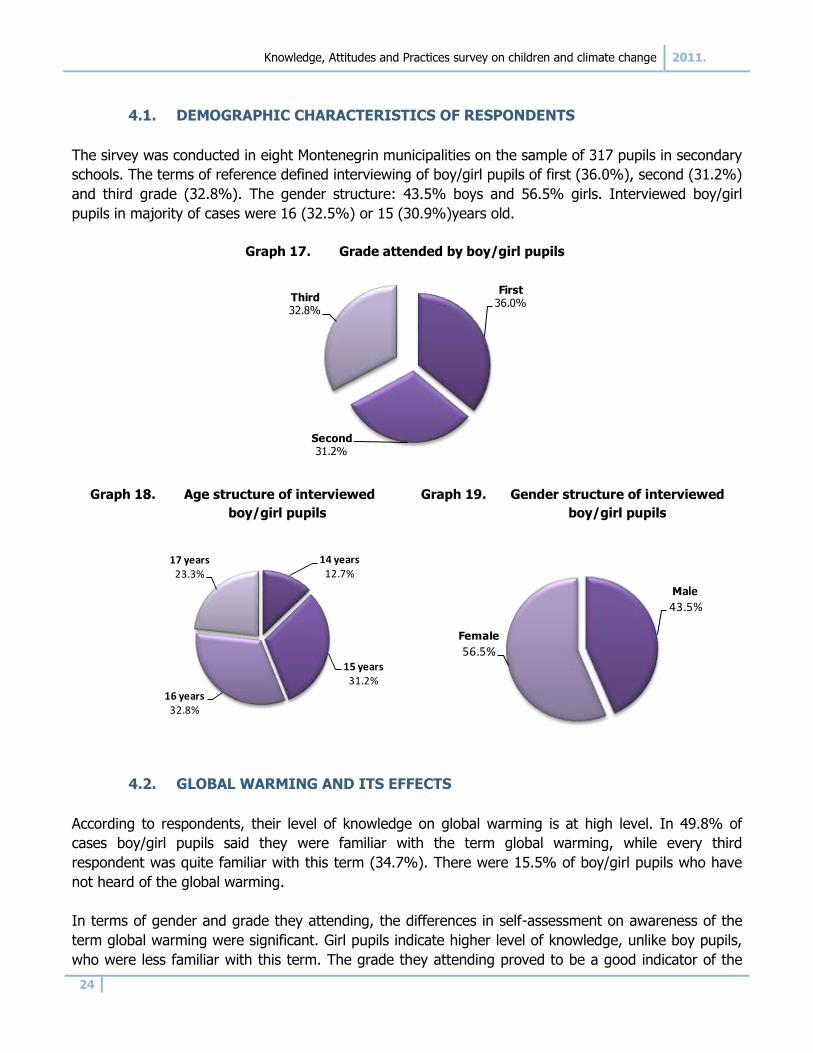
The sirvey was conducted in eight Montenegrin municipalities on the sample of 317 pupils in secondary
schools. The terms of reference defined interviewing of boy/girl pupils of first (36.0%), second (31.2%)
and third grade (32.8%). The gender structure: 43.5% boys and 56.5% girls. Interviewed boy/girl
pupils in majority of cases were 16 (32.5%) or 15 (30.9%)years old.
Graph 17. Grade attended by boy/girl pupils
Graph 18. Age structure of interviewed
boy/girl pupils
Graph 19. Gender structure of interviewed
boy/girl pupils
4.2. GLOBAL WARMING AND ITS EFFECTS
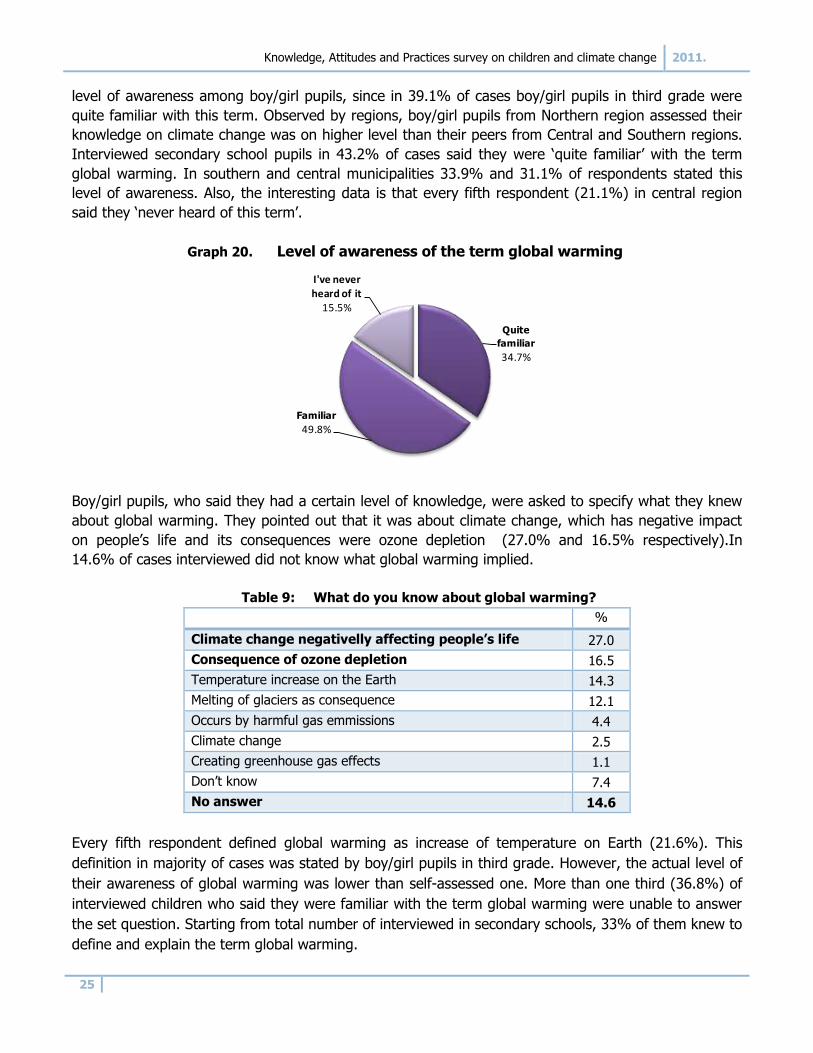
According to respondents, their level of knowledge on global warming is at high level. In 49.8% of
cases boy/girl pupils said they were familiar with the term global warming, while every third
respondent was quite familiar with this term (34.7%). There were 15.5% of boy/girl pupils who have
not heard of the global warming.
In terms of gender and grade they attending, the differences in self-assessment on awareness of the
term global warming were significant. Girl pupils indicate higher level of knowledge, unlike boy pupils,
who were less familiar with this term. The grade they attending proved to be a good indicator of the
First36.0%
Second31.2%
Third32.8%
14 years12.7%
15 years31.2%
16 years32.8%
17 years23.3%
Male43.5%
Female
56.5%
Knowledge, Attitudes and Practices survey on children and climate change 2011.
25
level of awareness among boy/girl pupils, since in 39.1% of cases boy/girl pupils in third grade were
quite familiar with this term. Observed by regions, boy/girl pupils from Northern region assessed their
knowledge on climate change was on higher level than their peers from Central and Southern regions.
Interviewed secondary school pupils in 43.2% of cases said they were „quite familiar‟ with the term
global warming. In southern and central municipalities 33.9% and 31.1% of respondents stated this
level of awareness. Also, the interesting data is that every fifth respondent (21.1%) in central region
said they „never heard of this term‟.
Graph 20. Level of awareness of the term global warming
Boy/girl pupils, who said they had a certain level of knowledge, were asked to specify what they knew
about global warming. They pointed out that it was about climate change, which has negative impact
on people‟s life and its consequences were ozone depletion (27.0% and 16.5% respectively).In
14.6% of cases interviewed did not know what global warming implied.
Table 9: What do you know about global warming?
%
Climate change negativelly affecting people’s life 27.0
Consequence of ozone depletion 16.5
Temperature increase on the Earth 14.3
Melting of glaciers as consequence 12.1
Occurs by harmful gas emmissions 4.4
Climate change 2.5
Creating greenhouse gas effects 1.1
Don‟t know 7.4
No answer 14.6
Every fifth respondent defined global warming as increase of temperature on Earth (21.6%). This
definition in majority of cases was stated by boy/girl pupils in third grade. However, the actual level of
their awareness of global warming was lower than self-assessed one. More than one third (36.8%) of
interviewed children who said they were familiar with the term global warming were unable to answer
the set question. Starting from total number of interviewed in secondary schools, 33% of them knew to
define and explain the term global warming.
Quite
familiar
34.7%
Familiar
49.8%
I've never heard of it
15.5%
Knowledge, Attitudes and Practices survey on children and climate change 2011.
26
Box1: What is global warming?
“Global warming present changes in surface air temperature, emerging as the greenhouse effect caused by
emissions of greenhouse gases in the air.”
Source: ITD/GEMET 2000. http://glossari.eea.europa.eu
Table 10: How would you define global warming?
%
Increase of temperature on Earth 21.6
Consequence of ozone depletion 10.2
Climayte change negativelly affecting people‟s life on Earth 10.8
Has melting of glaciers as consequence 8.5
Climate change 5.8
harmful gas emmissions 3.2
Occured by people‟s action 2.9
Creating greenhouse gas effects 0.3
No answer 18.4
Don’t know 18.4
The school and the media play an important role in education and raising the level of awarenes on
global warming. As survey results show, children obtain information about global warming primarily
through TV and in school (28.6% and 26.2% respectively). In smaller percentage Internet was stated
as a source of information (14,2%),as well as newspapers ands informative broadcasts (9.1 %
respectively).
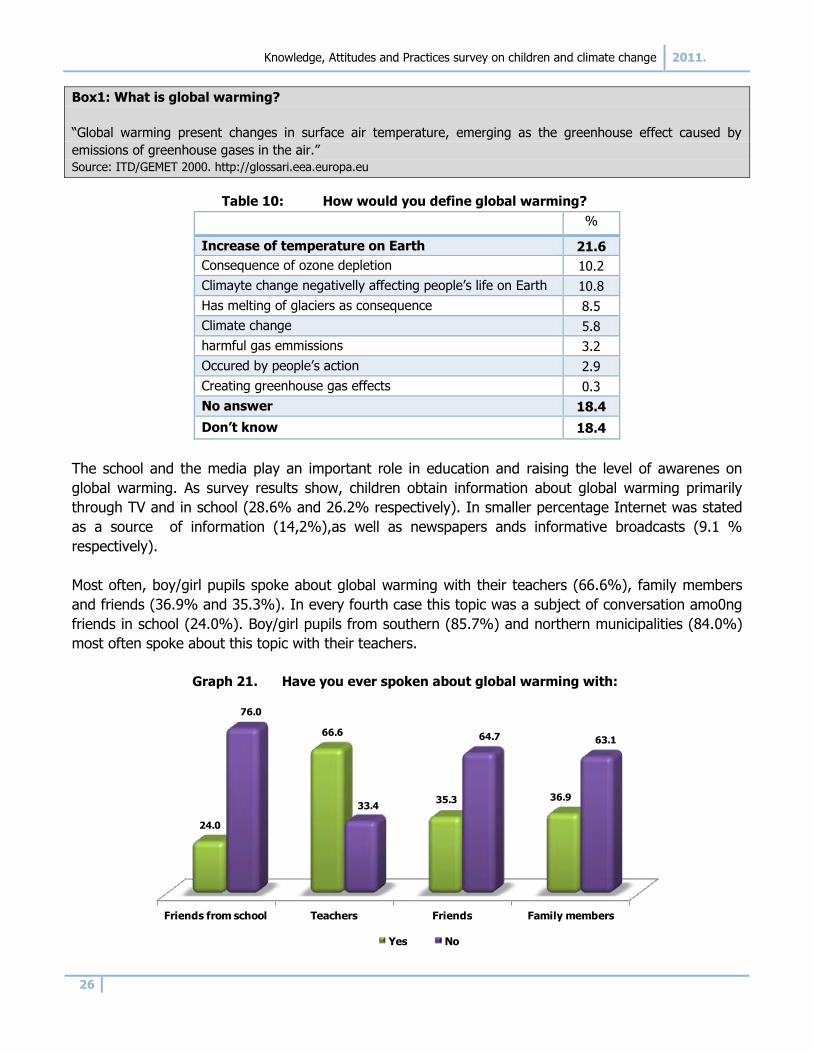
Most often, boy/girl pupils spoke about global warming with their teachers (66.6%), family members
and friends (36.9% and 35.3%). In every fourth case this topic was a subject of conversation amo0ng
friends in school (24.0%). Boy/girl pupils from southern (85.7%) and northern municipalities (84.0%)
most often spoke about this topic with their teachers.
Graph 21. Have you ever spoken about global warming with:
Friends from school Teachers Friends Family members
24.0
66.6
35.3 36.9
76.0
33.4
64.7 63.1
Yes No
Knowledge, Attitudes and Practices survey on children and climate change 2011.
27
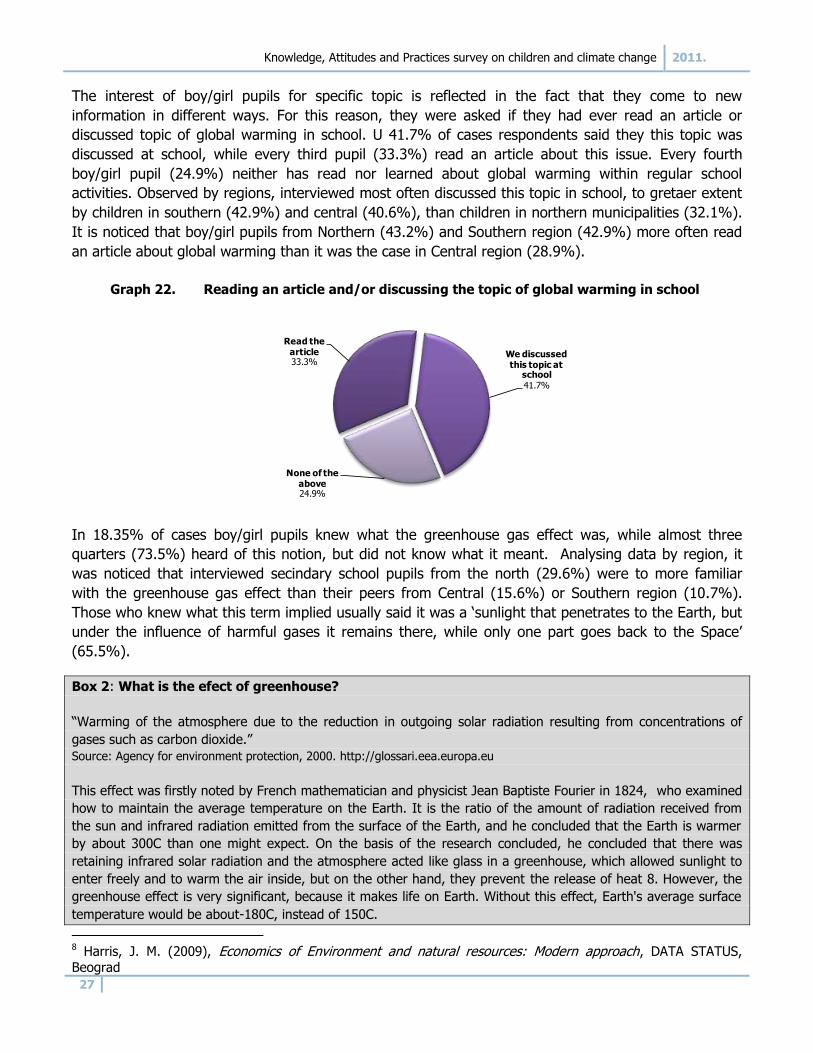
The interest of boy/girl pupils for specific topic is reflected in the fact that they come to new
information in different ways. For this reason, they were asked if they had ever read an article or
discussed topic of global warming in school. U 41.7% of cases respondents said they this topic was
discussed at school, while every third pupil (33.3%) read an article about this issue. Every fourth
boy/girl pupil (24.9%) neither has read nor learned about global warming within regular school
activities. Observed by regions, interviewed most often discussed this topic in school, to gretaer extent
by children in southern (42.9%) and central (40.6%), than children in northern municipalities (32.1%).
It is noticed that boy/girl pupils from Northern (43.2%) and Southern region (42.9%) more often read
an article about global warming than it was the case in Central region (28.9%).
Graph 22. Reading an article and/or discussing the topic of global warming in school
In 18.35% of cases boy/girl pupils knew what the greenhouse gas effect was, while almost three
quarters (73.5%) heard of this notion, but did not know what it meant. Analysing data by region, it
was noticed that interviewed secindary school pupils from the north (29.6%) were to more familiar
with the greenhouse gas effect than their peers from Central (15.6%) or Southern region (10.7%).
Those who knew what this term implied usually said it was a „sunlight that penetrates to the Earth, but
under the influence of harmful gases it remains there, while only one part goes back to the Space‟
(65.5%).
Box 2: What is the efect of greenhouse?
“Warming of the atmosphere due to the reduction in outgoing solar radiation resulting from concentrations of
gases such as carbon dioxide.”
Source: Agency for environment protection, 2000. http://glossari.eea.europa.eu
This effect was firstly noted by French mathematician and physicist Jean Baptiste Fourier in 1824, who examined
how to maintain the average temperature on the Earth. It is the ratio of the amount of radiation received from
the sun and infrared radiation emitted from the surface of the Earth, and he concluded that the Earth is warmer
by about 300C than one might expect. On the basis of the research concluded, he concluded that there was
retaining infrared solar radiation and the atmosphere acted like glass in a greenhouse, which allowed sunlight to
enter freely and to warm the air inside, but on the other hand, they prevent the release of heat 8. However, the
greenhouse effect is very significant, because it makes life on Earth. Without this effect, Earth's average surface
temperature would be about-180C, instead of 150C.
8 Harris, J. M. (2009), Economics of Environment and natural resources: Modern approach, DATA STATUS, Beograd
Read the article33.3%
We discussed this topic at
school41.7%
None of the above24.9%
Knowledge, Attitudes and Practices survey on children and climate change 2011.
28
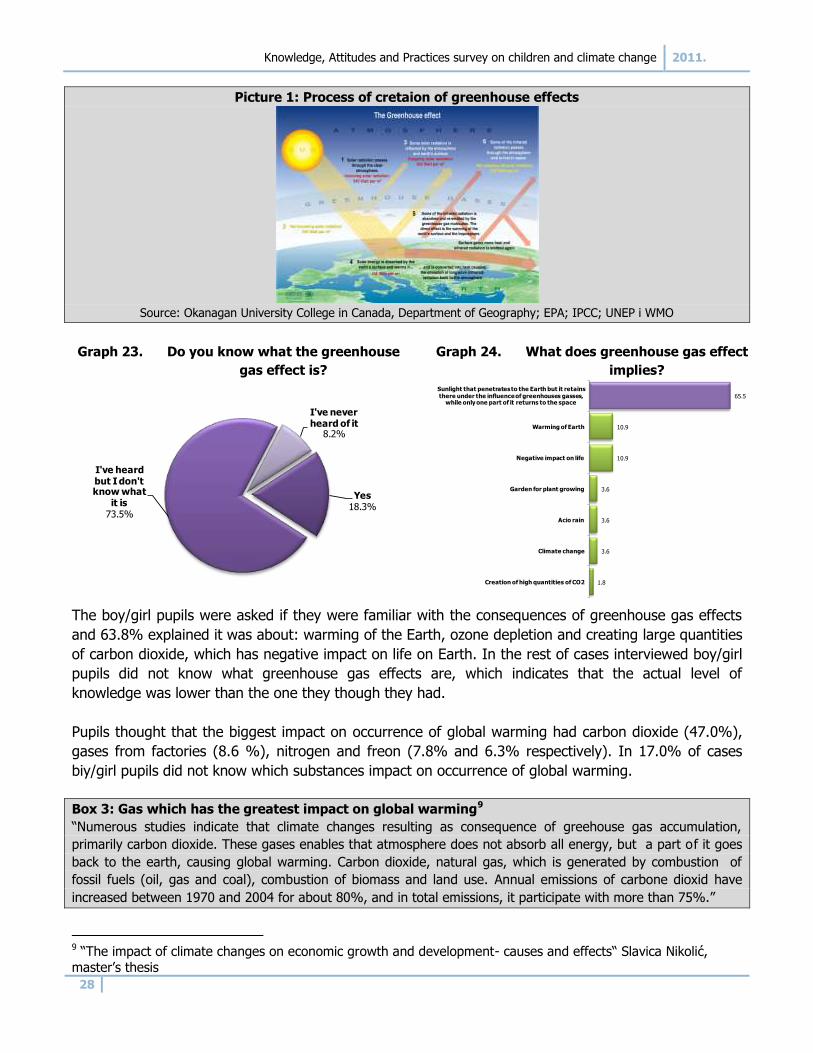
Picture 1: Process of cretaion of greenhouse effects
Source: Okanagan University College in Canada, Department of Geography; EPA; IPCC; UNEP i WMO
Graph 23. Do you know what the greenhouse
gas effect is?
Graph 24. What does greenhouse gas effect
implies?
The boy/girl pupils were asked if they were familiar with the consequences of greenhouse gas effects
and 63.8% explained it was about: warming of the Earth, ozone depletion and creating large quantities
of carbon dioxide, which has negative impact on life on Earth. In the rest of cases interviewed boy/girl
pupils did not know what greenhouse gas effects are, which indicates that the actual level of
knowledge was lower than the one they though they had.
Pupils thought that the biggest impact on occurrence of global warming had carbon dioxide (47.0%),
gases from factories (8.6 %), nitrogen and freon (7.8% and 6.3% respectively). In 17.0% of cases
biy/girl pupils did not know which substances impact on occurrence of global warming.
Box 3: Gas which has the greatest impact on global warming9
“Numerous studies indicate that climate changes resulting as consequence of greehouse gas accumulation,
primarily carbon dioxide. These gases enables that atmosphere does not absorb all energy, but a part of it goes
back to the earth, causing global warming. Carbon dioxide, natural gas, which is generated by combustion of
fossil fuels (oil, gas and coal), combustion of biomass and land use. Annual emissions of carbone dioxid have
increased between 1970 and 2004 for about 80%, and in total emissions, it participate with more than 75%.”
9 “The impact of climate changes on economic growth and development- causes and effects“ Slavica Nikolić, master‟s thesis
Yes 18.3%
I've heard but I don't know what
it is73.5%
I've never heard of it
8.2%
65.5
10.9
10.9
3.6
3.6
3.6
1.8
Sunlight that penetrates to the Earth but it retains there under the influence of greenhouses gasses,
while only one part of it returns to the space
Warming of Earth
Negative impact on life
Garden for plant growing
Acio rain
Climate change
Creation of high quantities of CO2
Knowledge, Attitudes and Practices survey on children and climate change 2011.
29
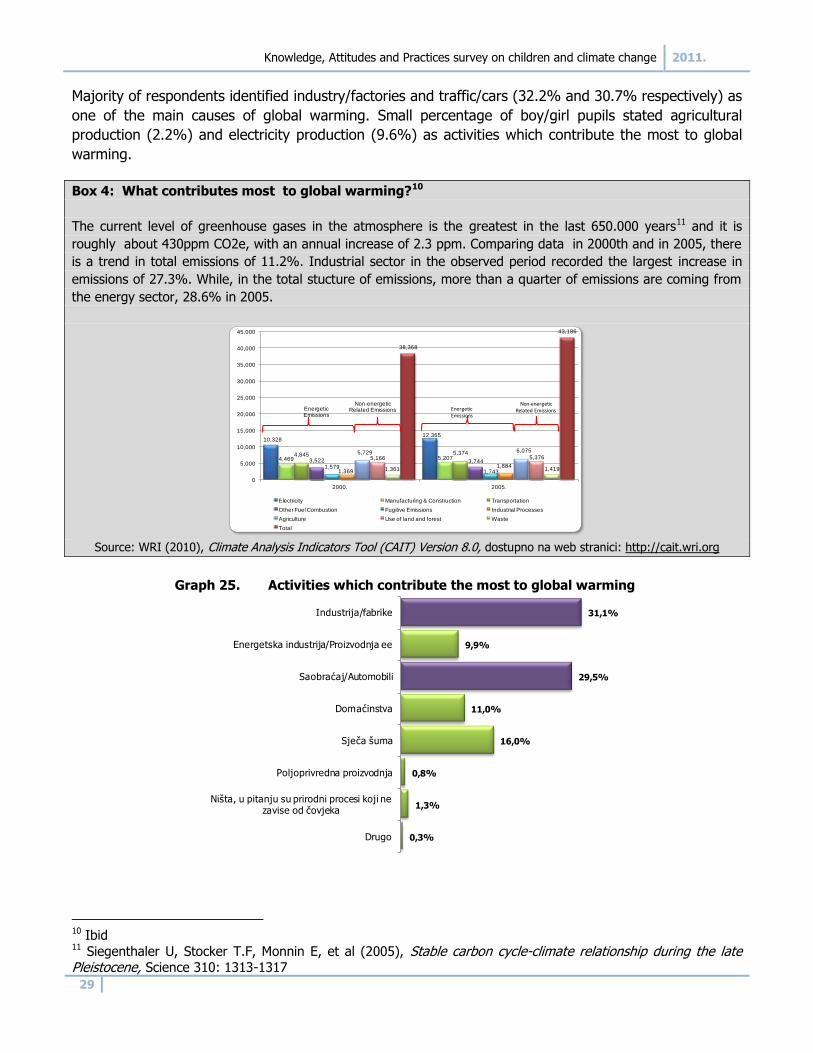
Majority of respondents identified industry/factories and traffic/cars (32.2% and 30.7% respectively) as
one of the main causes of global warming. Small percentage of boy/girl pupils stated agricultural
production (2.2%) and electricity production (9.6%) as activities which contribute the most to global
warming.
Box 4: What contributes most to global warming?10
The current level of greenhouse gases in the atmosphere is the greatest in the last 650.000 years11 and it is
roughly about 430ppm CO2e, with an annual increase of 2.3 ppm. Comparing data in 2000th and in 2005, there
is a trend in total emissions of 11.2%. Industrial sector in the observed period recorded the largest increase in
emissions of 27.3%. While, in the total stucture of emissions, more than a quarter of emissions are coming from
the energy sector, 28.6% in 2005.
Source: WRI (2010), Climate Analysis Indicators Tool (CAIT) Version 8.0, dostupno na web stranici: http://cait.wri.org
Graph 25. Activities which contribute the most to global warming
10 Ibid 11 Siegenthaler U, Stocker T.F, Monnin E, et al (2005), Stable carbon cycle-climate relationship during the late Pleistocene, Science 310: 1313-1317
10,32812,365
4,469 5,2074,845 5,374
3,522 3,7441,579
1,7431,3691,884
5,729 6,075
5,166 5,376
1,361 1,419
38,368
43,186
0
5,000
10,000
15,000
20,000
25,000
30,000
35,000
40,000
45,000
2000. 2005.
Electricity Manufacturing & Construction Transportation
Other Fuel Combustion Fugitive Emissions Industrial Processes
Agriculture Use of land and forest Waste
Total
Energetic Emissions
Non-energetic Related Emissions Energetic
Emissions
Non-energetic Related Emissions
31,1%
9,9%
29,5%
11,0%
16,0%
0,8%
1,3%
0,3%
Industrija/fabrike
Energetska industrija/Proizvodnja ee
Saobraćaj/Automobili
Domaćinstva
Sječa šuma
Poljoprivredna proizvodnja
Ništa, u pitanju su prirodni procesi koji ne zavise od čovjeka
Drugo
Knowledge, Attitudes and Practices survey on children and climate change 2011.
30
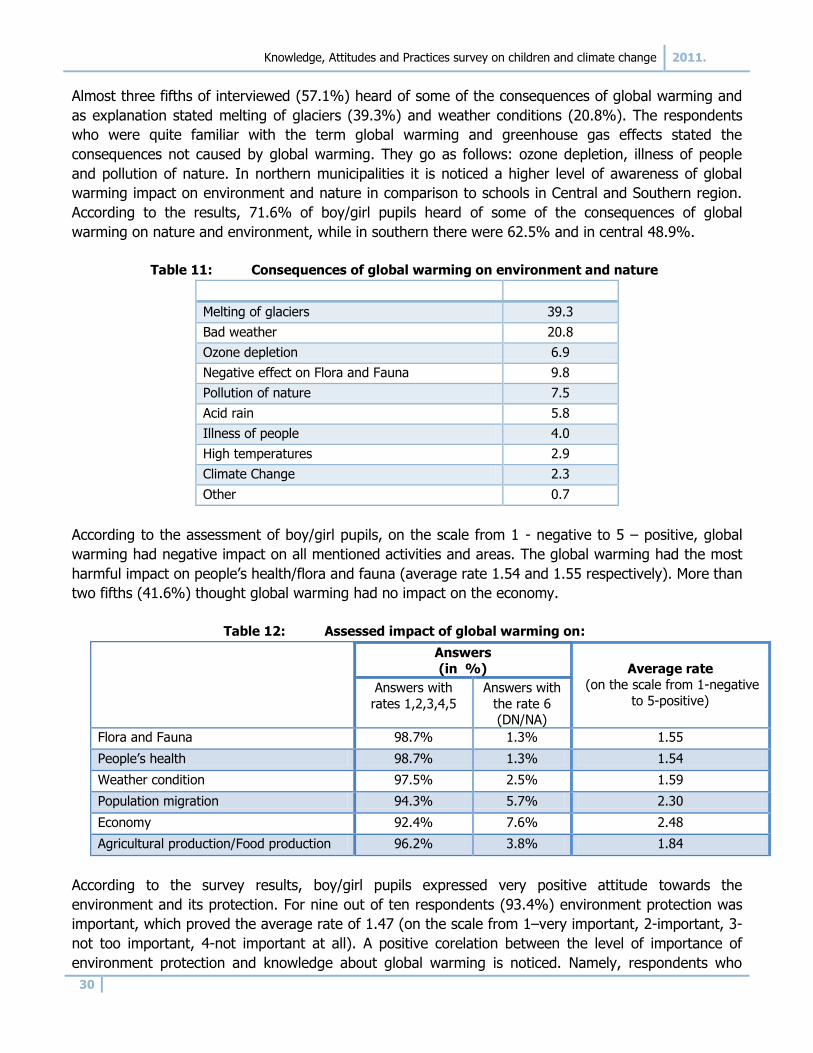
Almost three fifths of interviewed (57.1%) heard of some of the consequences of global warming and
as explanation stated melting of glaciers (39.3%) and weather conditions (20.8%). The respondents
who were quite familiar with the term global warming and greenhouse gas effects stated the
consequences not caused by global warming. They go as follows: ozone depletion, illness of people
and pollution of nature. In northern municipalities it is noticed a higher level of awareness of global
warming impact on environment and nature in comparison to schools in Central and Southern region.
According to the results, 71.6% of boy/girl pupils heard of some of the consequences of global
warming on nature and environment, while in southern there were 62.5% and in central 48.9%.
Table 11: Consequences of global warming on environment and nature
Melting of glaciers 39.3
Bad weather 20.8
Ozone depletion 6.9
Negative effect on Flora and Fauna 9.8
Pollution of nature 7.5
Acid rain 5.8
Illness of people 4.0
High temperatures 2.9
Climate Change 2.3
Other 0.7
According to the assessment of boy/girl pupils, on the scale from 1 - negative to 5 – positive, global
warming had negative impact on all mentioned activities and areas. The global warming had the most
harmful impact on people‟s health/flora and fauna (average rate 1.54 and 1.55 respectively). More than
two fifths (41.6%) thought global warming had no impact on the economy.
Table 12: Assessed impact of global warming on:
Answers
(in %)
Average rate (on the scale from 1-negative
to 5-positive) Answers with
rates 1,2,3,4,5
Answers with
the rate 6 (DN/NA)
Flora and Fauna 98.7% 1.3% 1.55
People‟s health 98.7% 1.3% 1.54
Weather condition 97.5% 2.5% 1.59
Population migration 94.3% 5.7% 2.30
Economy 92.4% 7.6% 2.48
Agricultural production/Food production 96.2% 3.8% 1.84
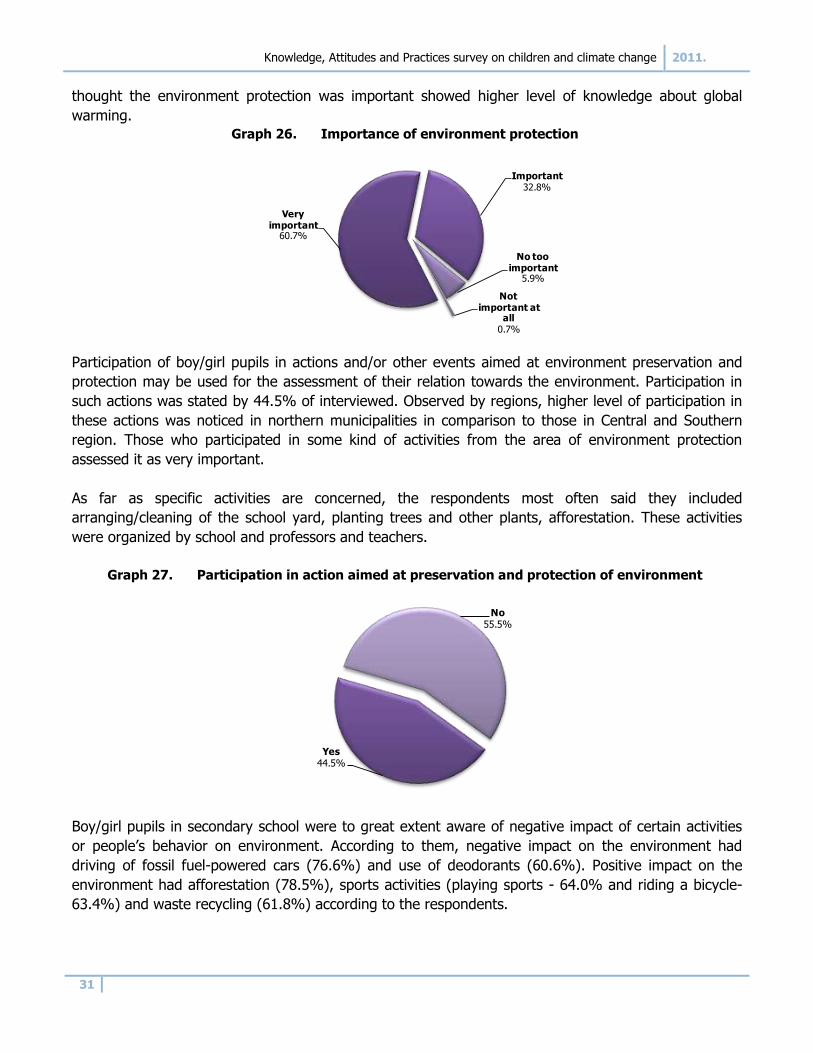
According to the survey results, boy/girl pupils expressed very positive attitude towards the
environment and its protection. For nine out of ten respondents (93.4%) environment protection was
important, which proved the average rate of 1.47 (on the scale from 1–very important, 2-important, 3-
not too important, 4-not important at all). A positive corelation between the level of importance of
environment protection and knowledge about global warming is noticed. Namely, respondents who
Knowledge, Attitudes and Practices survey on children and climate change 2011.
31
thought the environment protection was important showed higher level of knowledge about global
warming.
Graph 26. Importance of environment protection
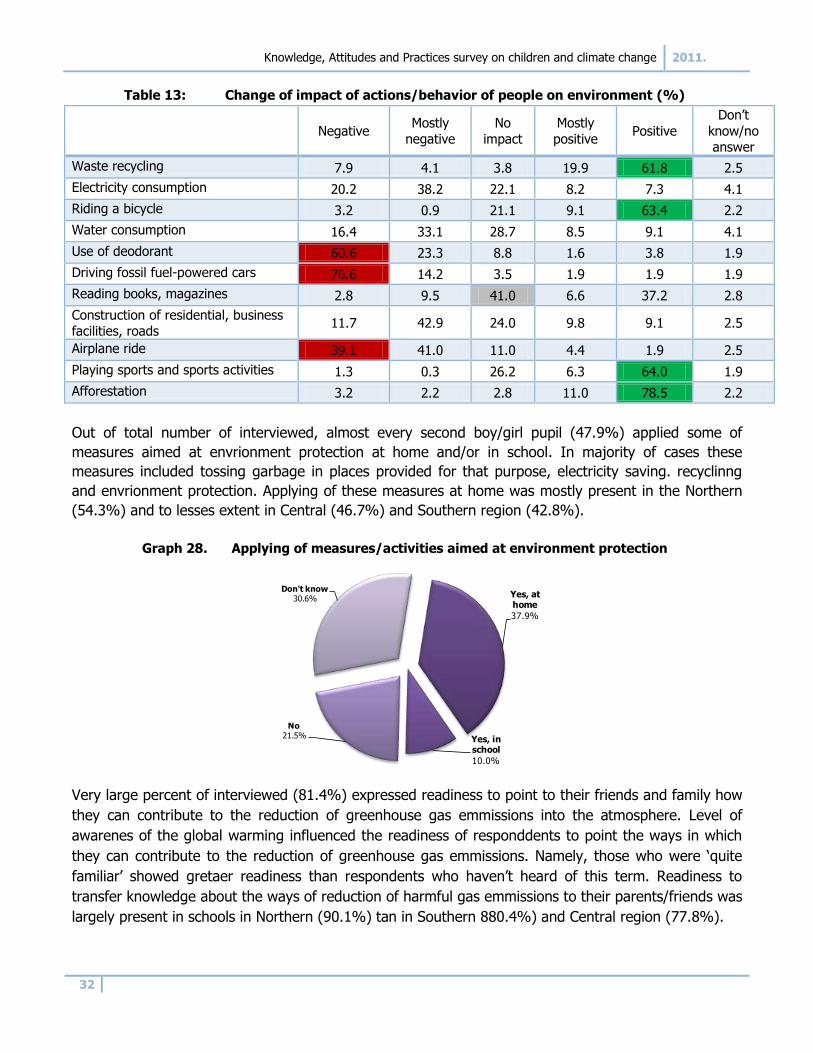
Participation of boy/girl pupils in actions and/or other events aimed at environment preservation and
protection may be used for the assessment of their relation towards the environment. Participation in
such actions was stated by 44.5% of interviewed. Observed by regions, higher level of participation in
these actions was noticed in northern municipalities in comparison to those in Central and Southern
region. Those who participated in some kind of activities from the area of environment protection
assessed it as very important.
As far as specific activities are concerned, the respondents most often said they included
arranging/cleaning of the school yard, planting trees and other plants, afforestation. These activities
were organized by school and professors and teachers.
Graph 27. Participation in action aimed at preservation and protection of environment
Boy/girl pupils in secondary school were to great extent aware of negative impact of certain activities
or people‟s behavior on environment. According to them, negative impact on the environment had
driving of fossil fuel-powered cars (76.6%) and use of deodorants (60.6%). Positive impact on the
environment had afforestation (78.5%), sports activities (playing sports - 64.0% and riding a bicycle-
63.4%) and waste recycling (61.8%) according to the respondents.
Very important
60.7%
Important32.8%
No too important
5.9%
Not important at
all0.7%
Yes44.5%
No55.5%
Knowledge, Attitudes and Practices survey on children and climate change 2011.
32
Table 13: Change of impact of actions/behavior of people on environment (%)
Negative Mostly
negative
No
impact
Mostly
positive Positive
Don‟t
know/no answer
Waste recycling 7.9 4.1 3.8 19.9 61.8 2.5
Electricity consumption 20.2 38.2 22.1 8.2 7.3 4.1
Riding a bicycle 3.2 0.9 21.1 9.1 63.4 2.2
Water consumption 16.4 33.1 28.7 8.5 9.1 4.1
Use of deodorant 60.6 23.3 8.8 1.6 3.8 1.9
Driving fossil fuel-powered cars 76.6 14.2 3.5 1.9 1.9 1.9
Reading books, magazines 2.8 9.5 41.0 6.6 37.2 2.8
Construction of residential, business facilities, roads
11.7 42.9 24.0 9.8 9.1 2.5
Airplane ride 39.1 41.0 11.0 4.4 1.9 2.5
Playing sports and sports activities 1.3 0.3 26.2 6.3 64.0 1.9
Afforestation 3.2 2.2 2.8 11.0 78.5 2.2
Out of total number of interviewed, almost every second boy/girl pupil (47.9%) applied some of
measures aimed at envrionment protection at home and/or in school. In majority of cases these
measures included tossing garbage in places provided for that purpose, electricity saving. recyclinng
and envrionment protection. Applying of these measures at home was mostly present in the Northern
(54.3%) and to lesses extent in Central (46.7%) and Southern region (42.8%).
Graph 28. Applying of measures/activities aimed at environment protection
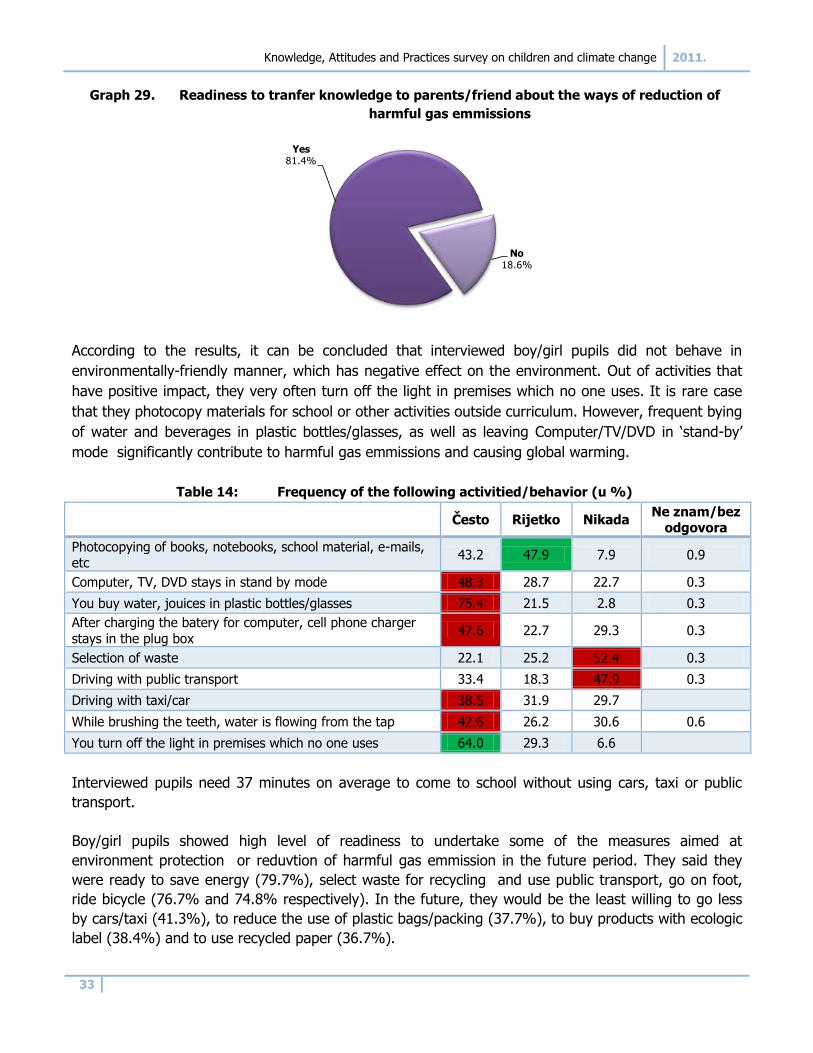
Very large percent of interviewed (81.4%) expressed readiness to point to their friends and family how
they can contribute to the reduction of greenhouse gas emmissions into the atmosphere. Level of
awarenes of the global warming influenced the readiness of responddents to point the ways in which
they can contribute to the reduction of greenhouse gas emmissions. Namely, those who were „quite
familiar‟ showed gretaer readiness than respondents who haven‟t heard of this term. Readiness to
transfer knowledge about the ways of reduction of harmful gas emmissions to their parents/friends was
largely present in schools in Northern (90.1%) tan in Southern 880.4%) and Central region (77.8%).
Yes, athome
37.9%
Yes, inschool
10.0%
No21.5%
Don't know30.6%
Knowledge, Attitudes and Practices survey on children and climate change 2011.
33
Graph 29. Readiness to tranfer knowledge to parents/friend about the ways of reduction of
harmful gas emmissions
According to the results, it can be concluded that interviewed boy/girl pupils did not behave in
environmentally-friendly manner, which has negative effect on the environment. Out of activities that
have positive impact, they very often turn off the light in premises which no one uses. It is rare case
that they photocopy materials for school or other activities outside curriculum. However, frequent bying
of water and beverages in plastic bottles/glasses, as well as leaving Computer/TV/DVD in „stand-by‟
mode significantly contribute to harmful gas emmissions and causing global warming.
Table 14: Frequency of the following activitied/behavior (u %)
Često Rijetko Nikada
Ne znam/bez odgovora
Photocopying of books, notebooks, school material, e-mails, etc
43.2 47.9 7.9 0.9
Computer, TV, DVD stays in stand by mode 48.3 28.7 22.7 0.3
You buy water, jouices in plastic bottles/glasses 75.4 21.5 2.8 0.3
After charging the batery for computer, cell phone charger
stays in the plug box 47.6 22.7 29.3 0.3
Selection of waste 22.1 25.2 52.4 0.3
Driving with public transport 33.4 18.3 47.9 0.3
Driving with taxi/car 38.5 31.9 29.7
While brushing the teeth, water is flowing from the tap 42.6 26.2 30.6 0.6
You turn off the light in premises which no one uses 64.0 29.3 6.6
Interviewed pupils need 37 minutes on average to come to school without using cars, taxi or public
transport.
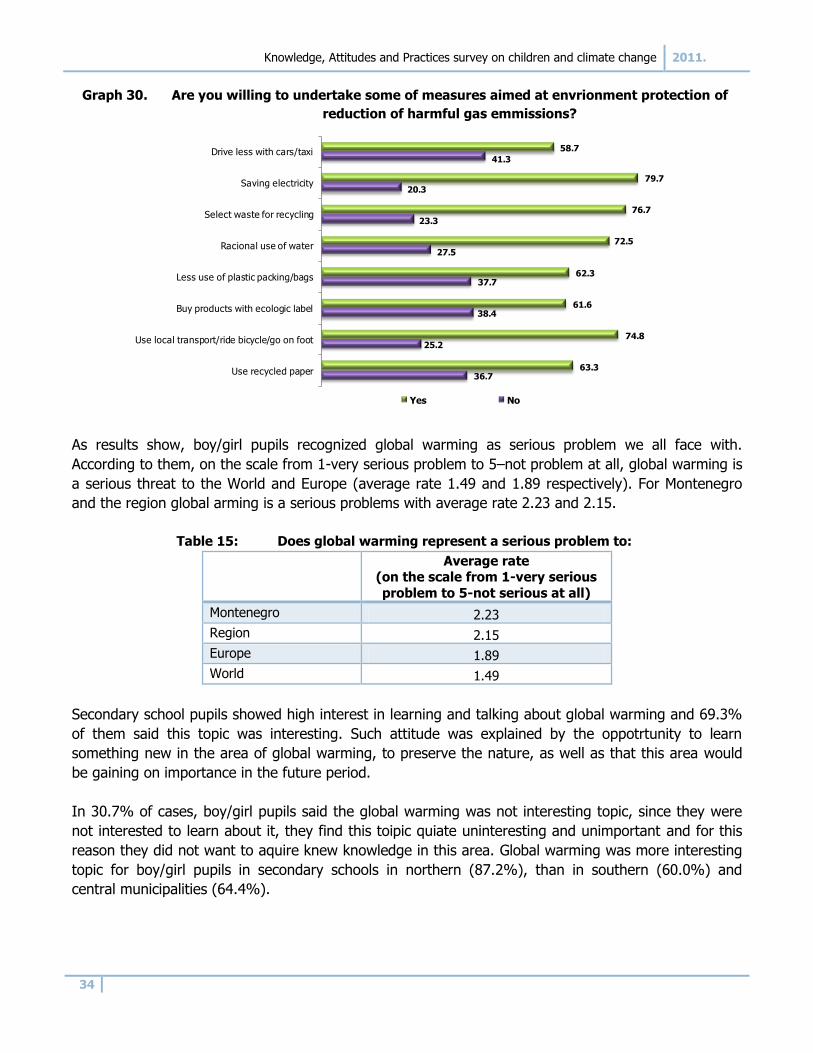
Boy/girl pupils showed high level of readiness to undertake some of the measures aimed at
environment protection or reduvtion of harmful gas emmission in the future period. They said they
were ready to save energy (79.7%), select waste for recycling and use public transport, go on foot,
ride bicycle (76.7% and 74.8% respectively). In the future, they would be the least willing to go less
by cars/taxi (41.3%), to reduce the use of plastic bags/packing (37.7%), to buy products with ecologic
label (38.4%) and to use recycled paper (36.7%).
Yes81.4%
No18.6%
Knowledge, Attitudes and Practices survey on children and climate change 2011.
34
Graph 30. Are you willing to undertake some of measures aimed at envrionment protection of
reduction of harmful gas emmissions?
As results show, boy/girl pupils recognized global warming as serious problem we all face with.
According to them, on the scale from 1-very serious problem to 5–not problem at all, global warming is
a serious threat to the World and Europe (average rate 1.49 and 1.89 respectively). For Montenegro
and the region global arming is a serious problems with average rate 2.23 and 2.15.
Table 15: Does global warming represent a serious problem to:
Average rate (on the scale from 1-very serious
problem to 5-not serious at all)
Montenegro 2.23
Region 2.15
Europe 1.89
World 1.49
Secondary school pupils showed high interest in learning and talking about global warming and 69.3%
of them said this topic was interesting. Such attitude was explained by the oppotrtunity to learn
something new in the area of global warming, to preserve the nature, as well as that this area would
be gaining on importance in the future period.
In 30.7% of cases, boy/girl pupils said the global warming was not interesting topic, since they were
not interested to learn about it, they find this toipic quiate uninteresting and unimportant and for this
reason they did not want to aquire knew knowledge in this area. Global warming was more interesting
topic for boy/girl pupils in secondary schools in northern (87.2%), than in southern (60.0%) and
central municipalities (64.4%).
58.7
79.7
76.7
72.5
62.3
61.6
74.8
63.3
41.3
20.3
23.3
27.5
37.7
38.4
25.2
36.7
Drive less with cars/taxi
Saving electricity
Select waste for recycling
Racional use of water
Less use of plastic packing/bags
Buy products with ecologic label
Use local transport/ride bicycle/go on foot
Use recycled paper
Yes No
Knowledge, Attitudes and Practices survey on children and climate change 2011.
35
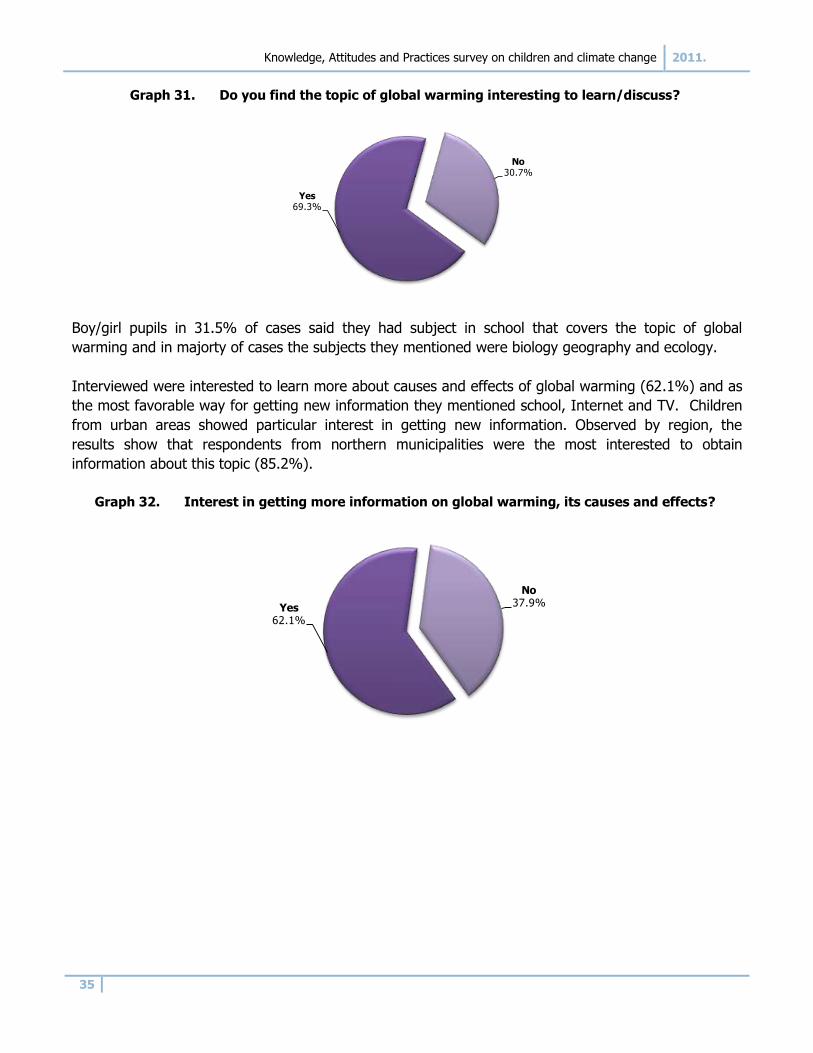
Graph 31. Do you find the topic of global warming interesting to learn/discuss?
Boy/girl pupils in 31.5% of cases said they had subject in school that covers the topic of global
warming and in majorty of cases the subjects they mentioned were biology geography and ecology.
Interviewed were interested to learn more about causes and effects of global warming (62.1%) and as
the most favorable way for getting new information they mentioned school, Internet and TV. Children
from urban areas showed particular interest in getting new information. Observed by region, the
results show that respondents from northern municipalities were the most interested to obtain
information about this topic (85.2%).
Graph 32. Interest in getting more information on global warming, its causes and effects?
Yes69.3%
No30.7%
Yes62.1%
No37.9%
Knowledge, Attitudes and Practices survey on children and climate change 2011.
36
Part 5 CONCLUSION
Knowledge, Attitudes and Practices survey on children and climate change 2011.
37
Based on the obtained results, it can be concluded that boy/girl pupils of primary and secondary
schools12 have a certain degree of knowledge about global warming or climate change and their
impacts. However, the actual level of knowledge is lower than self-estimated one. Since this is a
phenomenon that has, and it is very likely to have a more pronounced impact on almost all aspects of
human activity, it is necessary the following:
• To work on further education and awareness of boy/girl pupils, with special emphasis on
children from rural settlements or the entire population. The problem can be solved effectively
only if it is understood properly. Taking the various long-term educational campaigns
and programs would result in the desired changes, from the socially acceptable attitudes to
socially acceptable behaviour and real actions.
The introduction of subjects within the existing subjects with more attention to this
topic, by organizing lectures, workshops and seminars on global warming, climate
changes, renewable energy and energy efficiency will inform boy/girl pupils and allow them to
acquire additional knowledge. Special attention is paid to organizing mentioned actions areas
through direct involvement of boy/girl students based on empirical techniques and practical
examples which will enable them to develop awareness of the importance and effects that could
be achieved by their application.
At the individual level it is necessary to take appropriate measures that will result in a
reduction of demand for products that pollute the environment. First of all, this is
referred to raising awareness and informing boy/girl pupils on how their everyday choices/
behaviour in consumption influence the occurrence of global warming/climate change. By
purchasing products and services with environmental label, children, as consumers, can
contribute to further promotion of ecological behaviour.
12 The respondents were boy/girl pupils from seventh, eighth and ninth classes of reformed system, while in secondary schools, the respondents were boy/girl pupils from first, second and third class.