knowledge management on air quality - clean air...
TRANSCRIPT
Knowledge Management on Air Quality
Case Studies
Knowledge Management on Air Quality
Case Studies
© 2010 Asian Development Bank and Clean Air Initiative for Asian Cities Center (CAI–Asia Center)
All rights reserved. Published 2010.
ISBN 978-92-9092-Publication Stock No. RPT102406
Asian Development Bank and CAI–Asia Center.Knowledge management on air quality: Case studies.
Mandaluyong City, Philippines: Asian Development Bank and CAI–Asia Center, 2010.
1. Knowledge management. 2. Air pollution. 3. Climate change. 4. Transport. 5. Indonesia. 6. Nepal. 7. Thailand. 8. Philippines. 9. Sri Lanka.I. Asian Development Bank. II. CAI–Asia Center.
This report was prepared by the CAI–Asia Center under the RDTA 6510: Capturing and Transferring Air Quality Management Knowledge in Asia (“KnowledgeAir”), with financial support from the Asian Development Bank (ADB) through the Japan Special Fund.
The views expressed in this publication are those of CAI–Asia Center staff, consultants, and management, and do not necessarily reflect the views of ADB or the Board of Trustees of ADB or the CAI–Asia Center. Neither ADB nor the CAI–Asia Center guarantees the accuracy of the data included in this publication and/or accepts responsibility for any consequence of their use.
By making any designation of or reference to a particular territory or geographic area in this document, the authors, ADB, and the CAI–Asia Center do not intend to make any judgments as to the legal or other status of any territory or area.
ADB and the CAI–Asia Center encourage printing or copying information exclusively for personal and noncommercial use with proper acknowledgment of ADB and the CAI–Asia Center. Users are restricted from reselling, redistributing, or creating derivative works for commercial purposes without the express, written consent of ADB and the CAI–Asia Center.
Note:In this report, “$” refers to US dollars.
Asian Development Bank6 ADB Avenue, Mandaluyong City1550 Metro Manila, PhilippinesTel +63 2 632 4444Fax +63 2 636 2444www.adb.org
CAI–Asia CenterUnit 3504-5, Robinsons–Equitable TowerADB Avenue, Pasig City1605 Metro Manila, PhilippinesTel +63 2 395 2843Fax +63 2 395 [email protected]
For orders, contactDepartment of External RelationsFax: +63 2 636 2648
iiiContents
List of Tables, Figures, and Boxes ivAcknowledgments viiAbbreviations viiiForeword ixExecutive Summary xThe Role of Information and Communication Technology in Policy Development 1
Policy Development, Knowledge Management, and Information and Communication Technology 1
Introduction to Policy Development 1Developments in Knowledge Management on Air Quality Management
and Related Issues 3Developments in Knowledge Management and Information
and Communication Technology 5Clean Air Portal 9
What is the Clean Air Portal? 9Structure of the Clean Air Portal 10Content Management System and Roles 11Portal Features 11
Communities of Practice on the Clean Air Portal 21Air Quality and Co-Benefits Community of Practice 21Sustainable Transport Community of Practice 21Energy Community of Practice 21Other Discussion Groups 21Community of Practice Features 25
Using Information and Communication Technology to Strengthen Policy Development 29Websites 31E-mails 33Communities of Practice 33Webinars 36
Policy Case Studies 38Subregional Case Study: Clean Air Scorecard for Bangkok, Thailand; Jakarta, Indonesia;
and Manila, Philippines 38Challenges in Reducing Air Pollution and Greenhouse Gas Emissions 38Clean Air Scorecard 38Clean Air Scorecard Application at the Subregional Level 47Clean Air Scorecard Application for Bangkok 50Clean Air Scorecard for Jakarta 59Clean Air Scorecard for Manila 70
National Case Study: Stationary Source Emission Standards in Sri Lanka 79Challenges in Managing Emissions from Stationary Sources 81Development of Emission Standards for Stationary Sources 83Results of Review of Sri Lanka Draft Standards 90
Local Case Study: Environmentally Sustainable Transport for Kathmandu, Nepal 94Challenges with Transport and the Environment in the Kathmandu Valley 95
Environmentally Sustainable Transport 96Results of Inputs to the Environmentally Sustainable Transport Strategy 100
Please see appendixes in CD file.

ivList of Tables, Figures, and Boxes
TablesTable 1 Classification of Policy Instruments 1Table 2 User Groups of Clean Air, Sustainable Transport, and Clean Energy in Asia 9Table 3 Content Types for the Three User Groups 12Table 4 Examples of Topics and Discussion Groups that Exist within
Communities of Practice 24Table 5 Summary of Community of Practice Roles and Permissions 26Table 6 Estimated Cost Comparison for Face-to-Face Seminar vs. Webinar
for Sri Lanka Policy Case Study 37Table 7 Summary of Some Common Environment Assessment
and Benchmarking Tools 39Table 8 Categories of Cities Based on Score Bands 40Table 9 Score Bands for the Clean Air Scorecard 43Table 10 World Health Organization Guidelines and Interim Targets 43Table 11 Category and Score-Banding for Air Pollution and Health Index 44Table 12 Comparison of Indicators Covered by Previous Assessments
and Clean Air Scorecard 46Table 13 Air Quality Management Results for Bangkok, Jakarta, and Manila, 2006 49Table 14 Summary of Clean Air Scorecard Results for Bangkok, Jakarta, and Manila 49Table 15 Agencies Involved in Air Quality Management in Bangkok 57Table 16 Recommendations for Bangkok 59Table 17 Jakarta versus Indonesia National Ambient Air Quality Standards
and World Health Organization Guidelines 68Table 18 Recommendations for Jakarta 69Table 19 Philippine National Ambient Air Quality Guideline Values
versus World Health Organization Guidelines 74Table 20 Recommendations for Manila 78Table 21 Pollutants Concentrations in Kandy, 7–13 July 2010 81Table 22 Stakeholder Comments and Recommendations Generated
from the Various Forums of the 2010 Proposed Stationary Emission Standards in Sri Lanka 91
Table 23 Discussion Topics and Guide Questions on Environmentally Sustainable Transport in Kathmandu Valley 104
Table 24 Overview of Legislation Related to Environmentally Sustainable Transport in Nepal 104
Table 25 Government Agencies Relevant to the Development of an Environmentally Sustainable Transport Strategy and Action Plan for Kathmandu and Nepal 105
Table 26 Recommendations for Nepal’s Environmentally Sustainable Tranport Strategy and Action Plan 107
FiguresFigure 1 The RAPID Framework: Context, Evidence, and Links 3Figure 2 Clean Air Portal 10Figure 3 How the Portal Interacts with Contributors and the Target Audience 11
v
List of Tables, Figures, and Boxes
Figure 4 Information Classified by Type on Clean Air Portal 13Figure 5 Information Selection by Country on Clean Air Portal 14Figure 6 Information Selection by City on Clean Air Portal 15Figure 7 Information Selection by Topic on Clean Air Portal 16Figure 8 Projects and Programs Listed Alphabetically and Classified
by Country and City on Clean Air Portal 17Figure 9 Introductions to Indoor Air Quality Written with the Partnership
for Clean Indoor Air 17Figure 10 RSS Feeds from External Sources on the Clean Air Portal 18Figure 11 RSS Feeds on New Links on the Clean Air Portal 18Figure 12 Annual Air Quality Monitoring Data for Beijing 19Figure 13 Home Page of Clean Air at Mega-Events 20Figure 14 Online Petition for the Anti-Smoke Belching on EDSA Campaign 20Figure 15 Air Quality and Co-Benefits Community of Practice 22Figure 16 Sustainable Transport Community of Practice 23Figure 17 Communities Section of the Clean Air Portal 24Figure 18 Users Select Their Settings When Registering for Communities of Practice 25Figure 19 Community of Practice Discussions Tagged by Topic 27Figure 20 Community of Practice Link to Attached Files 27Figure 21 List of Members of the Sustainable Transport Community of Practice 28Figure 22 Creation of a New Discussion Topic under a Community of Practice 28Figure 23 Level of Interactivity and Level of Experience 32Figure 24 Overall Structure of the Clean Air Scorecard 42Figure 25 Subindices and Indicators for Clean Air Management Capacity Index 45Figure 26 Subindices and Indicators for Clean Air Policies and Actions Index 45Figure 27 Snapshot of Clean Air Scorecard Report Page 48Figure 28 Clean Air Score Summary for Bangkok, 2010 52Figure 29 Air Pollution and Health Index Score for Bangkok 53Figure 30 Trends of Ambient and Roadside PM10 Concentrations in Bangkok 53Figure 31 Trends of Ambient and Roadside Sulfur Dioxide Concentrations in Bangkok 54Figure 32 Trends of Ambient and Roadside Nitrogen Dioxide Concentrations in Bangkok 54Figure 33 Clean Air Management Capacity Index Score for Bangkok 55Figure 34 Clean Air Policies and Actions Index Score for Bangkok 58Figure 35 Clean Air Score Summary for Jakarta, 2010 61Figure 36 Air Pollution and Health Index Score for Jakarta 62Figure 37 Indonesia Environmental Quality Index 63Figure 38 Trend of Annual PM10 Concentrations in Jakarta 64Figure 39 Trend of Annual Sulfur Dioxide Concentrations in Jakarta 65Figure 40 Trend of Annual Nitrogen Dioxide Concentrations in Jakarta 65Figure 41 Clean Air Management Capacity Index Score for Jakarta 66Figure 42 Clean Policies and Action Index Score for Jakarta 67Figure 43 Clean Air Score Summary for Manila, 2010 72Figure 44 Air Pollution and Health Index Score for Manila 73Figure 45 PM10 Annual Mean Levels at the Philippine Nuclear Research Institute
Sampling Sites, 2002–2008 74Figure 46 PM2.5 Annual Mean Levels at the Philippine Nuclear Research Institute
Sampling Sites 2002–2008 75Figure 47 Clean Air Management Capacity Index Score for Manila 75Figure 48 Clean Air Policies and Actions Index Score for Manila 77Figure 49 Sri Lanka District Map 79Figure 50 Annual Averages of PM10 at Colombo Fort Ambient AIr Quality
Monitoring Station, 1998–2009 80
vi
List
of T
able
s, F
igur
es, a
nd B
oxes
vi
Figure 51 Recorded Maximum 1-Hour Average PM10 Concentration Dailyin Kandy, 7–13 July 2010 81
Figure 52 Steps in Developing the 2010 Proposed Stationary Source Emission Standards 86Figure 53 Power Plant Emissions from 2003 to 2008 and Sulfur Content
of Industrial Fuel 87Figure 54 Three-Tier Approach to Stationary Source Emission Standards 88Figure 55 PM10 Concentration in Kathmandu Valley, 2002–2007 95Figure 56 Twelve Thematic Areas of an Environmentally Sustainable Transport Strategy 97Figure 57 Bus Rapid Transit Systems in Asia and the Pacific 100Figure 58 Emission Standards for New Light-Duty Vehicles 102Figure 59 Current and Proposed Sulfur Levels in Diesel in Asia, the European Union,
and the United States 103
BoxesBox 1 Forms of Networks and Communities of Practice 7Box 2 The Six Functions of Networks and Communities of Practice 8Box 3 Supporting Networks: 10 Principles 30Box 4 Gaps in Previous Air Quality Management Assessments 41Box 5 Bangkok Declaration for 2010 98Box 6 ADB Kathmandu Urban Sustainable Transport Project 99
viiAcknowledgments
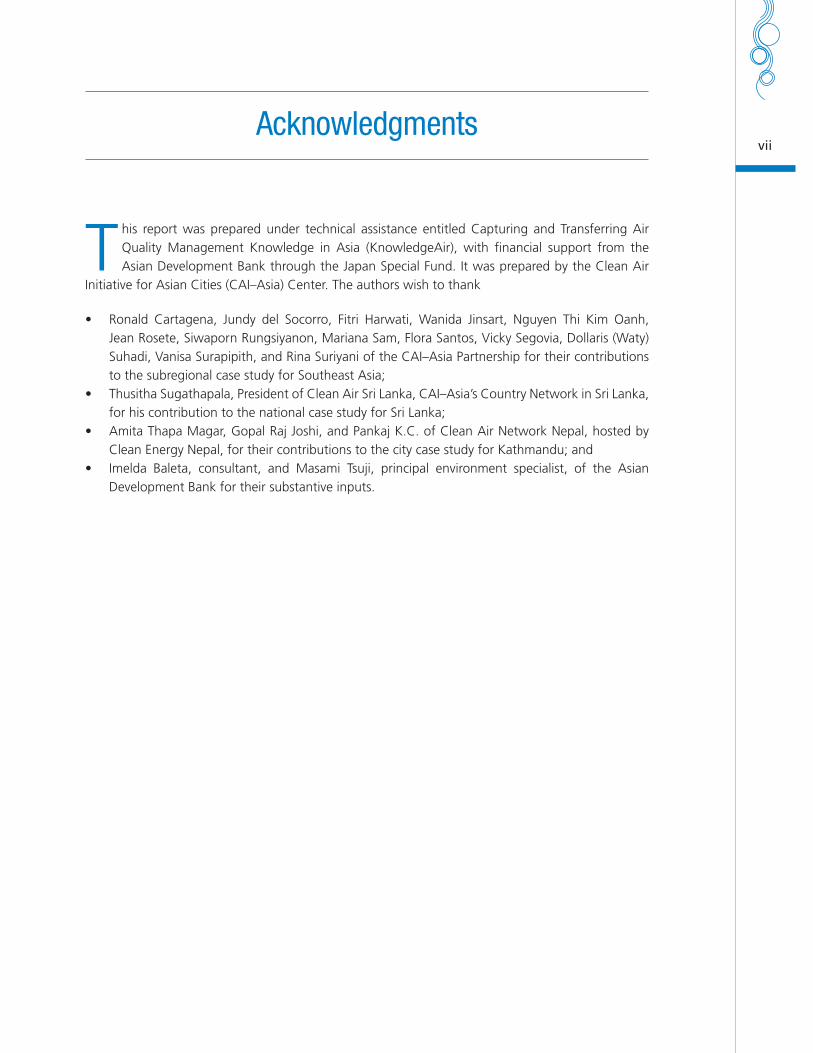
This report was prepared under technical assistance entitled Capturing and Transferring Air Quality Management Knowledge in Asia (KnowledgeAir), with financial support from the Asian Development Bank through the Japan Special Fund. It was prepared by the Clean Air
Initiative for Asian Cities (CAI–Asia) Center. The authors wish to thank
Ronald Cartagena, Jundy del Socorro, Fitri Harwati, Wanida Jinsart, Nguyen Thi Kim Oanh, Jean Rosete, Siwaporn Rungsiyanon, Mariana Sam, Flora Santos, Vicky Segovia, Dollaris (Waty) Suhadi, Vanisa Surapipith, and Rina Suriyani of the CAI–Asia Partnership for their contributions to the subregional case study for Southeast Asia; Thusitha Sugathapala, President of Clean Air Sri Lanka, CAI–Asia’s Country Network in Sri Lanka, for his contribution to the national case study for Sri Lanka; Amita Thapa Magar, Gopal Raj Joshi, and Pankaj K.C. of Clean Air Network Nepal, hosted by Clean Energy Nepal, for their contributions to the city case study for Kathmandu; and Imelda Baleta, consultant, and Masami Tsuji, principal environment specialist, of the Asian Development Bank for their substantive inputs.
viiiAbbreviations
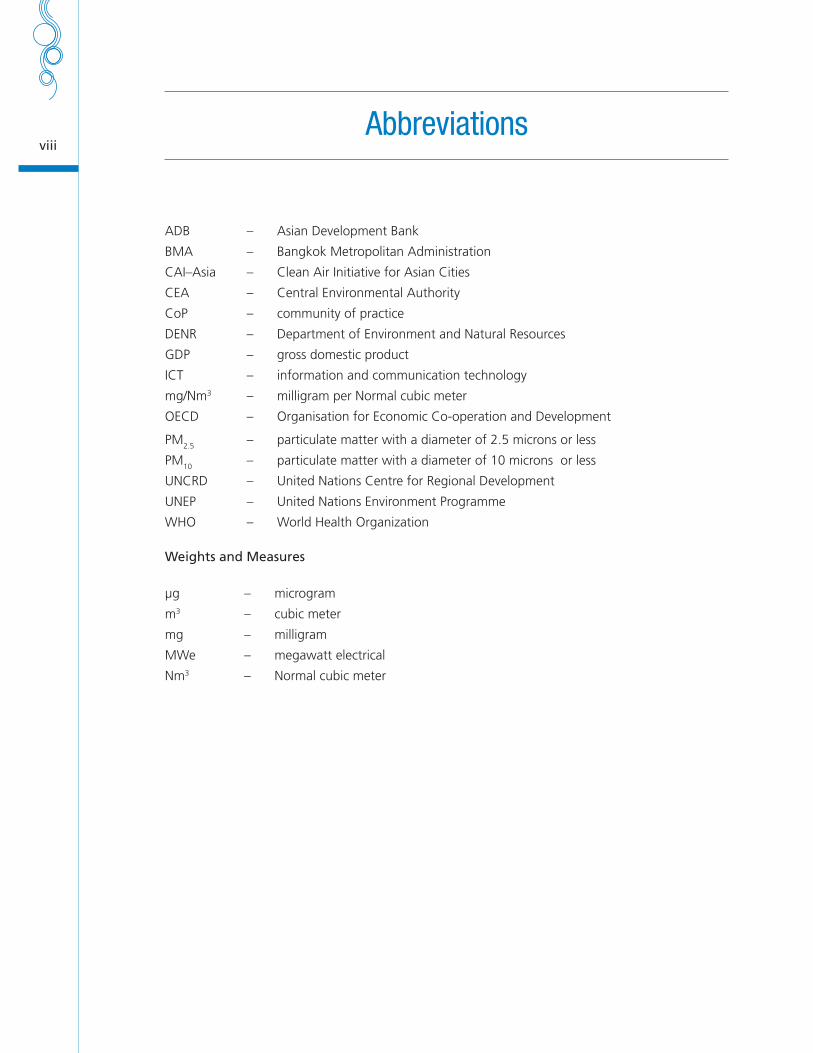
ADB – Asian Development Bank
BMA – Bangkok Metropolitan Administration
CAI–Asia – Clean Air Initiative for Asian Cities
CEA – Central Environmental Authority
CoP – community of practice
DENR – Department of Environment and Natural Resources
GDP – gross domestic product
ICT – information and communication technology
mg/Nm3 – milligram per Normal cubic meter
OECD – Organisation for Economic Co-operation and Development
PM2.5 – particulate matter with a diameter of 2.5 microns or less
PM10 – particulate matter with a diameter of 10 microns or less
UNCRD – United Nations Centre for Regional Development
UNEP – United Nations Environment Programme
WHO – World Health Organization
Weights and Measures
μg – microgram
m3 – cubic meter
mg – milligram
MWe – megawatt electrical
Nm3 – Normal cubic meter
ixForeword
Throughout Asia and the Pacific, addressing the challenge of air pollution has significantly evolved over the past few decades. It has transformed from a singular focus on air quality monitoring to air quality management in various sectors as well as co-benefits with climate
change mitigation. The Clean Air Initiative for Asian Cities (CAI–Asia) Center has played an integral role as a knowledge hub in this process.
About a decade ago, in 2001, when CAI–Asia was established by the Asian Development Bank (ADB), the United States Agency for International Development, and the World Bank to promote better air quality in the region, there were less than 50 documents available on air quality manage-ment on a static website. Today, the CAI–Asia Center hosts the Clean Air Portal, which has 5,000 pages of knowledge resources related to air quality.
This is the first report on applying the Clean Air Scorecard, a comprehensive, balanced tool for understanding urban air quality conditions throughout the region. This report also describes how information and communication technology—through the development of the Clean Air Portal and various communities of practice—serve as beneficial tools in facilitating the policy development process for cleaner air. It presents the results of three case studies anchored on the platform of the Clean Air Portal: (i) the Clean Air Scorecard for Bangkok, Thailand; Jakarta, Indonesia; and Manila, Philippines; (ii) stationary source emission standards in Sri Lanka; and (iii) environmentally sustainable transport in Kathmandu, Nepal. These studies serve as useful examples for policy makers in encour-aging them to improve air quality management.
It is expected that the findings and recommendations for each case study will provide valuable lessons and inputs for other countries in the region. ADB is delighted to hear about positive per- formance in air quality management by its developing member countries, and more importantly, about the identification of concerns that countries in the region should begin to address.
ADB is grateful for the support of the Japan Special Fund for the financing of the case studies.
I hope that this report will be of general interest, as clean air is everybody’s business. I look forward to further development of the Clean Air Scorecard to report on air quality in the cities of Asia and the Pacific.
Nessim J. Ahmad Director, Environment and Safeguards Division Regional and Sustainable Development Department concurrently Practice Leader (Environment) Asian Development Bank
xExecutive Summary
Although governments should select and develop the right policies, the limiting factor in poli-cy development has often been knowledge. Information often does not reach policy makers at the right time nor in the form that they need. However, information and communication
technology (ICT) can support policy development by improving participation in the policy process, shortening the time frame for consultation, increasing transparency, maximizing stakeholder own-ership and awareness, and providing opportunities to transfer policy-making responsibilities to a younger generation of policy makers.
For this reason, the Clean Air Initiative for Asian Cities (CAI –Asia) Center implemented research and development technical assistance known as KnowledgeAir, with financial support from the Asian Development Bank (ADB) through the Japan Special Fund (JSF). This technical assistance aims to ensure that policy makers and the stakeholders who influence their decisions can access and use knowledge more effectively to further policy development activities regarding air quality manage-ment and related issues, including health, climate change, clean energy, and sustainable transport.
As part of the technical assistance, a website, the Clean Air Portal, and two embedded communi-ties of practice (COPs) on air quality and co-benefits, and on sustainable transport were established to provide an effective forum for stakeholders to share knowledge and good practices in air quality and greenhouse gas management. Further, three case studies were conducted on how ICT, particu-larly the Clean Air Portal and the two CoPs, can effectively contribute to building capacity of policy makers and strengthening the policy development processes.
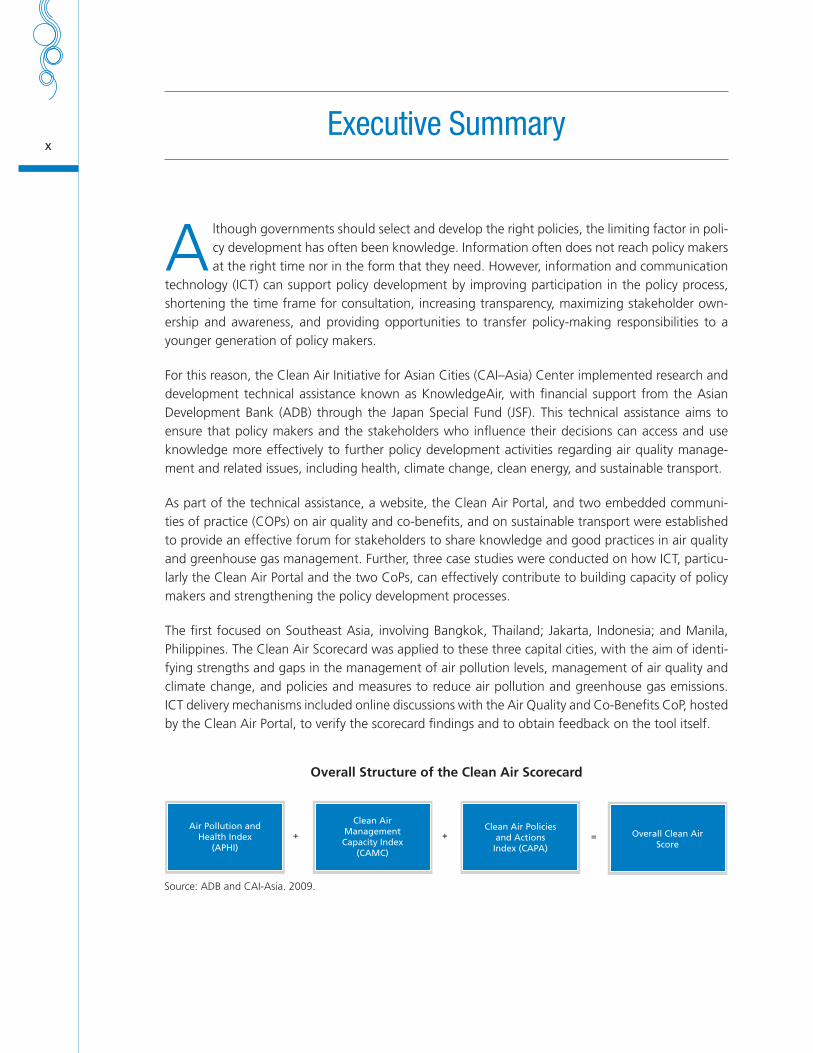
The first focused on Southeast Asia, involving Bangkok, Thailand; Jakarta, Indonesia; and Manila, Philippines. The Clean Air Scorecard was applied to these three capital cities, with the aim of identi-fying strengths and gaps in the management of air pollution levels, management of air quality and climate change, and policies and measures to reduce air pollution and greenhouse gas emissions. ICT delivery mechanisms included online discussions with the Air Quality and Co-Benefits CoP, hosted by the Clean Air Portal, to verify the scorecard findings and to obtain feedback on the tool itself.
Overall Structure of the Clean Air Scorecard
Air Pollution and Health Index
(APHI)+
Clean AirManagementCapacity Index
(CAMC)
+Clean Air Policies
and ActionsIndex (CAPA)
= Overall Clean AirScore
Source: ADB and CAI-Asia. 2009.
xi
Executive Summ
ary
The indices of the scorecard are as follows.
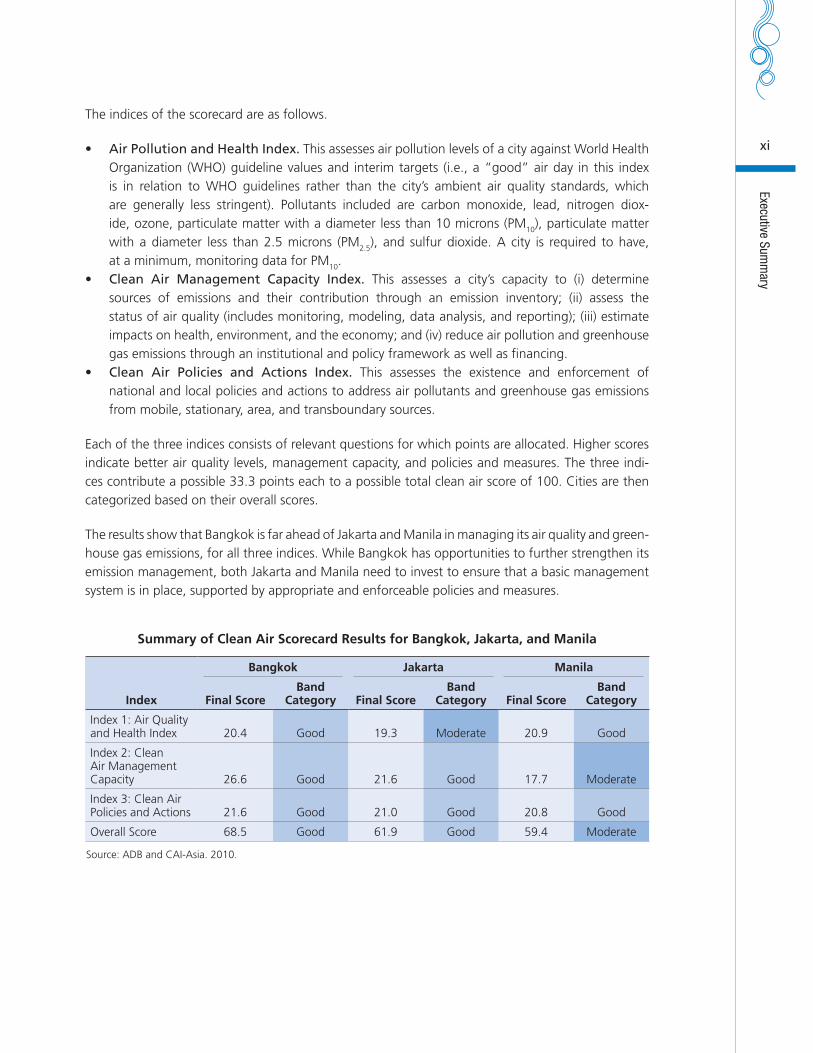
Air Pollution and Health Index. This assesses air pollution levels of a city against World Health Organization (WHO) guideline values and interim targets (i.e., a “good” air day in this index is in relation to WHO guidelines rather than the city’s ambient air quality standards, which are generally less stringent). Pollutants included are carbon monoxide, lead, nitrogen diox-ide, ozone, particulate matter with a diameter less than 10 microns (PM10), particulate matter with a diameter less than 2.5 microns (PM2.5), and sulfur dioxide. A city is required to have, at a minimum, monitoring data for PM10.Clean Air Management Capacity Index. This assesses a city’s capacity to (i) determine sources of emissions and their contribution through an emission inventory; (ii) assess the status of air quality (includes monitoring, modeling, data analysis, and reporting); (iii) estimate impacts on health, environment, and the economy; and (iv) reduce air pollution and greenhouse gas emissions through an institutional and policy framework as well as financing.Clean Air Policies and Actions Index. This assesses the existence and enforcement of national and local policies and actions to address air pollutants and greenhouse gas emissions from mobile, stationary, area, and transboundary sources.
Each of the three indices consists of relevant questions for which points are allocated. Higher scores indicate better air quality levels, management capacity, and policies and measures. The three indi-ces contribute a possible 33.3 points each to a possible total clean air score of 100. Cities are then categorized based on their overall scores.
The results show that Bangkok is far ahead of Jakarta and Manila in managing its air quality and green-house gas emissions, for all three indices. While Bangkok has opportunities to further strengthen its emission management, both Jakarta and Manila need to invest to ensure that a basic management system is in place, supported by appropriate and enforceable policies and measures.
Summary of Clean Air Scorecard Results for Bangkok, Jakarta, and Manila
Index
Bangkok Jakarta Manila
Final ScoreBand
Category Final ScoreBand
Category Final ScoreBand
Category
Index 1: Air Quality and Health Index 20.4 Good 19.3 Moderate 20.9 Good
Index 2: Clean Air Management Capacity 26.6 Good 21.6 Good 17.7 Moderate
Index 3: Clean Air Policies and Actions 21.6 Good 21.0 Good 20.8 Good
Overall Score 68.5 Good 61.9 Good 59.4 Moderate
Source: ADB and CAI-Asia. 2010.
xii
Exec
utiv
e Su
mm
ary
To contribute to better emission management and to improve information exchange and coopera-tion, the three cities should focus on the following areas of improvement:
All three cities should focus on PM10, because this is currently the pollutant with the lowest score for all cities.The monitoring of air quality levels and emissions needs to be strengthened across the three cities. Manila should install monitoring systems, covering the entire metro area and including all criteria pollutants. Jakarta has a monitoring system, but quality assurance and control processes should be improved. Bangkok’s system is very good but should advance to the next level by add-ing toxic air pollutants. Further, emission inventories in all three cities focus on land transport but fail to include water and air transport. Finally, although impact assessments are conducted in Bangkok, those on agriculture are absent. Both Jakarta and Manila need to invest in more cur-rent health impact assessments, which are virtually absent.Specific clean air acts for the Philippines and Indonesia—which are over 10 years old—need to be reviewed. Thailand has embedded air quality management in sector policies, but there is an opportunity to integrate it further in case a climate change act is developed. Further, all three countries have policies covering the main sources of air pollution; however, for energy and industry, these tend to be more focused on traditional command-and-control approaches and should be supplemented with more incentives for energy efficiency. For transport, improvements to fuel quality and vehicle emission standards are progressing slowly, and so far only Thailand has proposed fuel economy standards. Notably, policies that promote clean tech-nologies are very limited for all sources, and given the emphasis of the climate change talks on technology transfer, this is truly a missed opportunity.
A national case study was also conducted for Sri Lanka to review proposed emission standards for stationary sources. For this, Sri Lanka’s main challenge is its lack of legally enforceable emission stan-dards; thus, there is no systematic monitoring of emissions from stationary sources. Recognizing the need for legally enforceable standards, the Central Environmental Authority (CEA) commissioned a study to review the current emissions, and prepared proposed standards that are sound, locally acceptable, and suitable to the Sri Lankan context.
In cooperation with Clean Air Sri Lanka, the proposed standards were reviewed by stakeholders from government, academic institutions, private sector, and civil society, through online discussions with the Air Quality and Co-Benefits CoP. A webinar was also held with experts from the Air and Waste Management Association to provide recommendations for strengthening the standards based on international experience.
The following comments and recommendations will be submitted to CEA to help finalize the standards:
the need for (i) a clean air act to be drafted to provide this framework, (ii) an emission inventory to identify the major sources of air pollution, and (iii) air quality modeling to ensure that the stationary source emission standards contribute to attaining ambient air quality standards;
xiii
Executive Summ
ary
the appropriateness to the Sri Lankan context of the (i) approach that the standards take (e.g., the three-tier approach and the use of concentration-based standards), (ii) control strat-egies employed in the standards (e.g., stack height requirements and maximum emissions), and (iii) measurement protocols;concerns regarding proper enforcement and implementation, including how to address resource limitations; andsupplementary measures (e.g., improving fuel quality) necessary to manage emissions from stationary sources of air pollution.
Finally, a local policy case study was conducted for Nepal’s capital city, Kathmandu, to provide inputs to the development of an environmentally sustainable transport strategy and action plan. Such a plan is needed because the development of the Kathmandu Valley has gone largely unplanned, resulting in an unsustainable transport sector with severe traffic congestion and accidents, insufficient public transport, and air pollution and greenhouse gas emissions that affect human health and contribute to climate change.
In cooperation with Clean Air Network Nepal, the case study was carried out, starting with a lit-erature review on environmentally sustainable transport development and identification of relevant policies and government agencies. This was followed by a facilitated online discussion under the Sustainable Transport CoP with participants from various ministries, the city government, nongovern-ment organizations, and the private sector. The discussions focused on (i) Kathmandu’s transport sys-tem, air quality, and the need for environmentally sustainable transport; (ii) the most important issues that need to be addressed; and (iii) recommendations for the strategy and action plan. A webinar was also held, hosted by the CAI–Asia Center, Clean Air Network Nepal, and Winrock International.
The following transport issues were considered most important, and should be given priority by the government:
inappropriate taxation policies for and lack of awareness of the use and promotion of electric vehicles, heavy dependence of the transport sector on fossil fuels,alarming increase in the number of private vehicles,congestion of the road network,inadequate public transport system,weak enforcement of existing policies,lack of integration of land use planning with transport planning,weak vehicle parking system and management of street vendors, andneglect of nonmotorized transport.
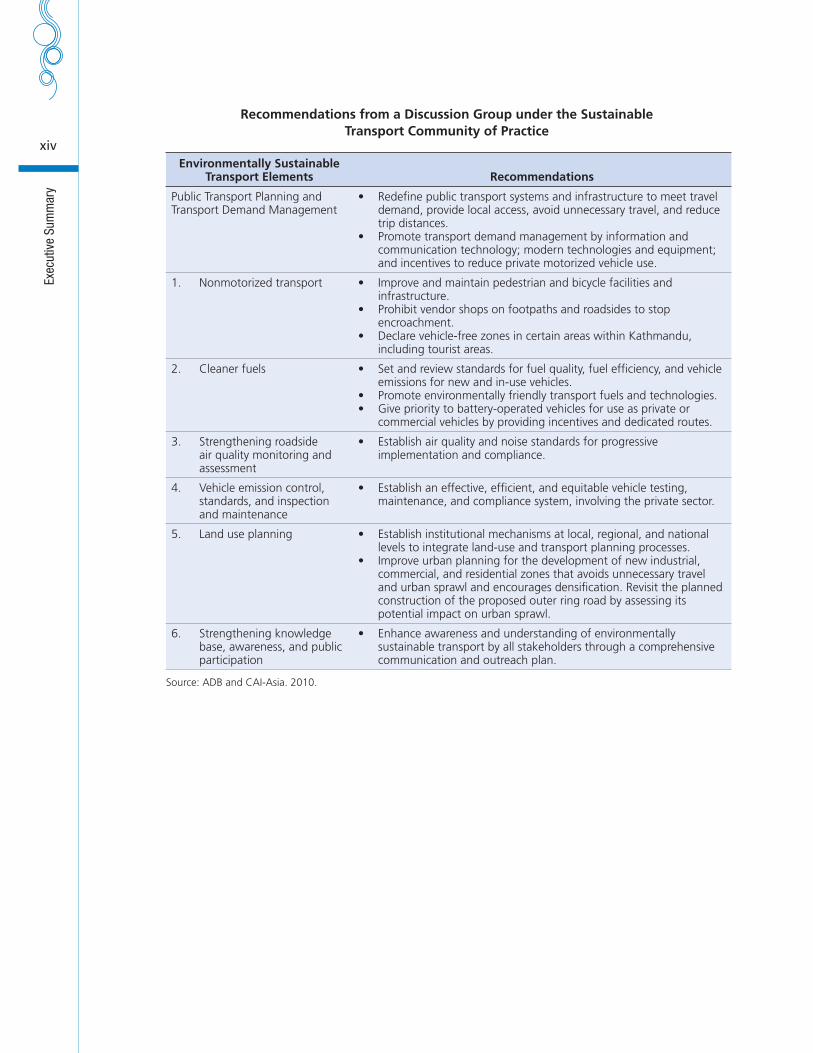
To guide the strategy and action plan for Nepal and Kathmandu, a vision for environmentally sus-tainable transport was drafted. Further, participants of the discussion group under the Sustainable Transport CoP made the following recommendations for the environmentally sustainable transport strategy and action plan for the elements most relevant to reducing air pollution and greenhouse gas emissions.
xiv
Exec
utiv
e Su
mm
ary
Recommendations from a Discussion Group under the Sustainable Transport Community of Practice
Environmentally Sustainable Transport Elements Recommendations
Public Transport Planning and Transport Demand Management
Redefine public transport systems and infrastructure to meet travel demand, provide local access, avoid unnecessary travel, and reduce trip distances. Promote transport demand management by information and communication technology; modern technologies and equipment; and incentives to reduce private motorized vehicle use.
1. Nonmotorized transport Improve and maintain pedestrian and bicycle facilities and infrastructure.Prohibit vendor shops on footpaths and roadsides to stop encroachment.Declare vehicle-free zones in certain areas within Kathmandu, including tourist areas.
2. Cleaner fuels Set and review standards for fuel quality, fuel efficiency, and vehicle emissions for new and in-use vehicles. Promote environmentally friendly transport fuels and technologies.Give priority to battery-operated vehicles for use as private or commercial vehicles by providing incentives and dedicated routes.
3. Strengthening roadside air quality monitoring and assessment
Establish air quality and noise standards for progressive implementation and compliance.
4. Vehicle emission control, standards, and inspection and maintenance
Establish an effective, efficient, and equitable vehicle testing, maintenance, and compliance system, involving the private sector.
5. Land use planning Establish institutional mechanisms at local, regional, and national levels to integrate land-use and transport planning processes. Improve urban planning for the development of new industrial, commercial, and residential zones that avoids unnecessary travel and urban sprawl and encourages densification. Revisit the planned construction of the proposed outer ring road by assessing its potential impact on urban sprawl.
6. Strengthening knowledge base, awareness, and public participation
Enhance awareness and understanding of environmentally sustainable transport by all stakeholders through a comprehensive communication and outreach plan.
Source: ADB and CAI-Asia. 2010.
1The Role of Information
and Communication Technology in Policy Development
Policy Development, Knowledge Management, and Information and Communication Technology
Introduction to Policy Development
Policies can be defined as all public interventions aiming to improve politi-cal, environmental, and economic con-
ditions of a country, through adequate pricing, institutional-setting regulations, and economic
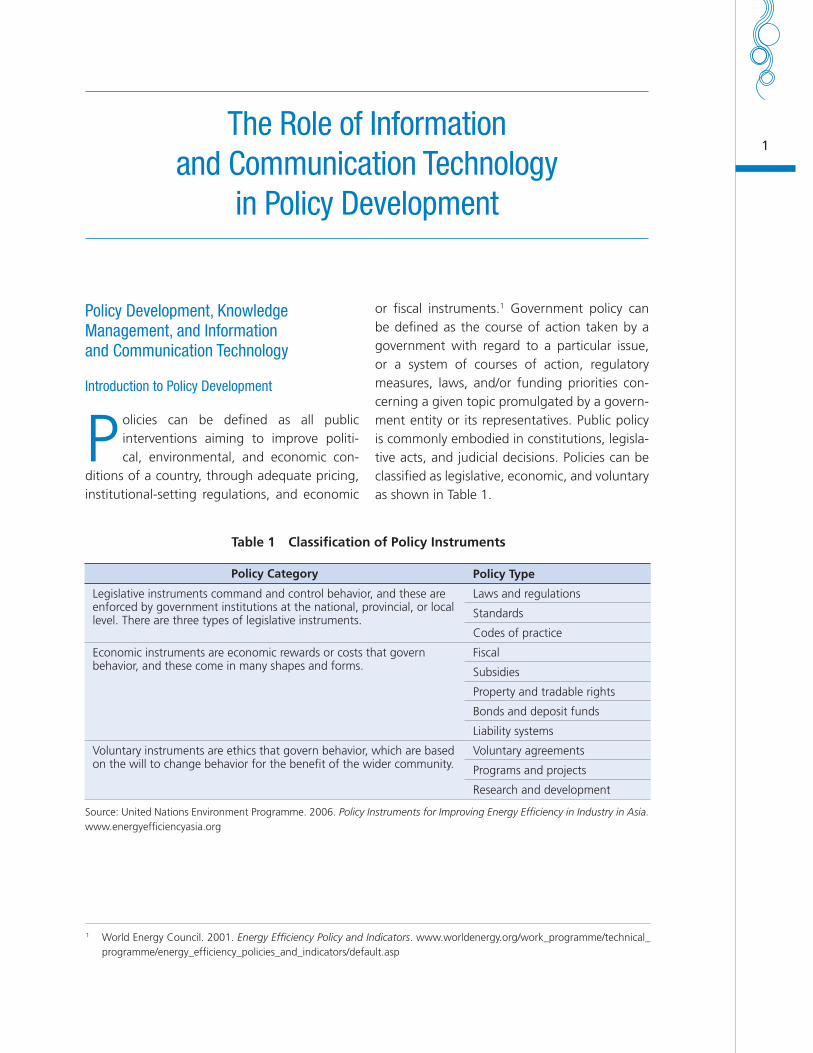
or fiscal instruments.1 Government policy can be defined as the course of action taken by a government with regard to a particular issue, or a system of courses of action, regulatory measures, laws, and/or funding priorities con-cerning a given topic promulgated by a govern-ment entity or its representatives. Public policy is commonly embodied in constitutions, legisla-tive acts, and judicial decisions. Policies can be classified as legislative, economic, and voluntary as shown in Table 1.
Table 1 Classification of Policy Instruments
Policy Category Policy Type
Legislative instruments command and control behavior, and these are enforced by government institutions at the national, provincial, or local level. There are three types of legislative instruments.
Laws and regulations
Standards
Codes of practice
Economic instruments are economic rewards or costs that govern behavior, and these come in many shapes and forms.
Fiscal
Subsidies
Property and tradable rights
Bonds and deposit funds
Liability systems
Voluntary instruments are ethics that govern behavior, which are based on the will to change behavior for the benefit of the wider community.
Voluntary agreements
Programs and projects
Research and development
Source: United Nations Environment Programme. 2006. Policy Instruments for Improving Energy Efficiency in Industry in Asia. www.energyefficiencyasia.org
1 World Energy Council. 2001. Energy Efficiency Policy and Indicators. www.worldenergy.org/work_programme/technical_programme/energy_efficiency_policies_and_indicators/default.asp
2
Know
ledg
e M
anag
emen
t on
Air Q
ualit
y: C
ase
Stud
ies
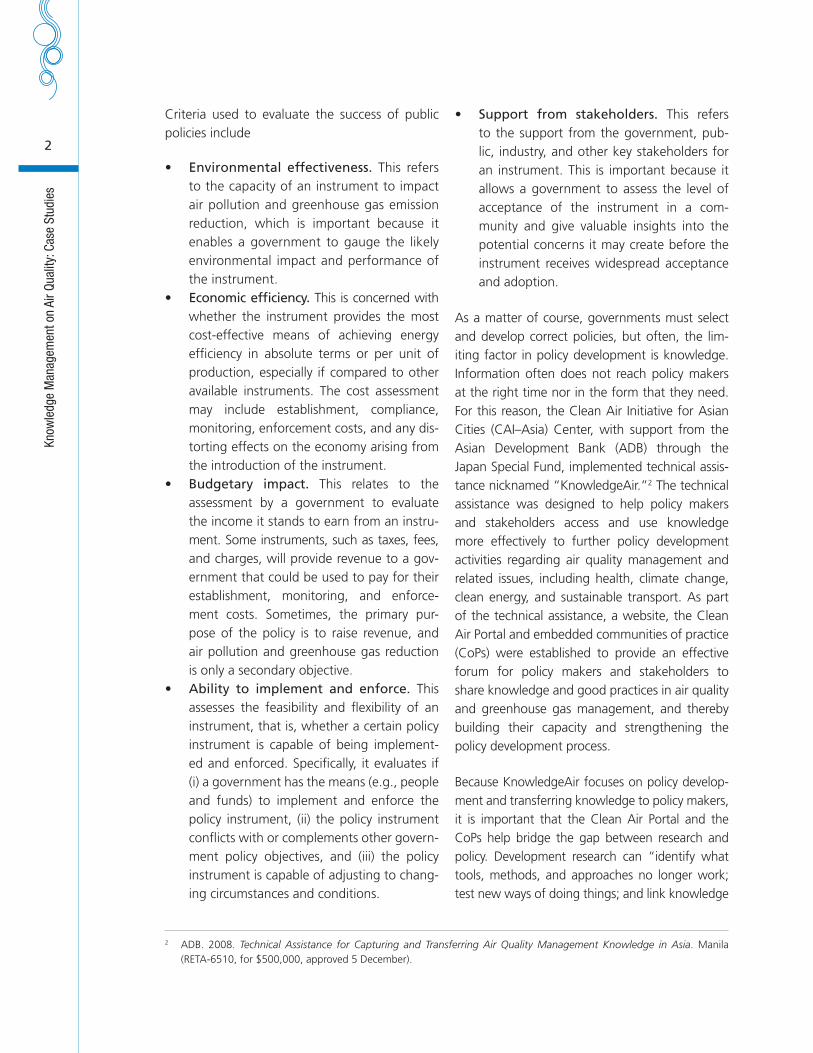
Criteria used to evaluate the success of public policies include
Environmental effectiveness. This refers to the capacity of an instrument to impact air pollution and greenhouse gas emission reduction, which is important because it enables a government to gauge the likely environmental impact and performance of the instrument. Economic efficiency. This is concerned with whether the instrument provides the most cost-effective means of achieving energy efficiency in absolute terms or per unit of production, especially if compared to other available instruments. The cost assessment may include establishment, compliance, monitoring, enforcement costs, and any dis-torting effects on the economy arising from the introduction of the instrument. Budgetary impact. This relates to the assessment by a government to evaluate the income it stands to earn from an instru-ment. Some instruments, such as taxes, fees, and charges, will provide revenue to a gov-ernment that could be used to pay for their establishment, monitoring, and enforce-ment costs. Sometimes, the primary pur-pose of the policy is to raise revenue, and air pollu tion and greenhouse gas reduction is only a secondary objective. Ability to implement and enforce. This assesses the feasibility and flexibility of an instrument, that is, whether a certain policy instrument is capable of being implement-ed and enforced. Specifically, it evaluates if (i) a government has the means (e.g., people and funds) to implement and enforce the policy instrument, (ii) the policy instrument conflicts with or complements other govern-ment policy objectives, and (iii) the policy instrument is capable of adjusting to chang-ing circumstances and conditions.
Support from stakeholders. This refers to the support from the government, pub-lic, industry, and other key stakeholders for an instrument. This is important because it allows a government to assess the level of acceptance of the instrument in a com-munity and give valuable insights into the potential concerns it may cre ate before the instrument receives wide spread acceptance and adoption.
As a matter of course, governments must select and develop correct policies, but often, the lim-iting factor in policy development is knowledge. Information often does not reach policy makers at the right time nor in the form that they need. For this reason, the Clean Air Initiative for Asian Cities (CAI–Asia) Center, with support from the Asian Development Bank (ADB) through the Japan Special Fund, implemented technical assis-tance nicknamed “KnowledgeAir.”2 The technical assistance was designed to help policy makers and stakeholders access and use knowledge more effectively to further policy development activities regarding air quality management and related issues, including health, climate change, clean energy, and sustainable transport. As part of the technical assistance, a website, the Clean Air Portal and embedded communities of practice (CoPs) were established to provide an effective forum for policy makers and stakeholders to share knowledge and good practices in air quality and greenhouse gas management, and thereby building their capacity and strengthening the policy development process.
Because KnowledgeAir focuses on policy develop-ment and transferring knowledge to policy makers, it is important that the Clean Air Portal and the CoPs help bridge the gap between research and policy. Development research can “identify what tools, methods, and approaches no longer work; test new ways of doing things; and link knowledge
2 ADB. 2008. Technical Assistance for Capturing and Transferring Air Quality Management Knowledge in Asia. Manila (RETA-6510, for $500,000, approved 5 December).
3
The Role of Information and Com
munication Technology in Policy Developm
ent
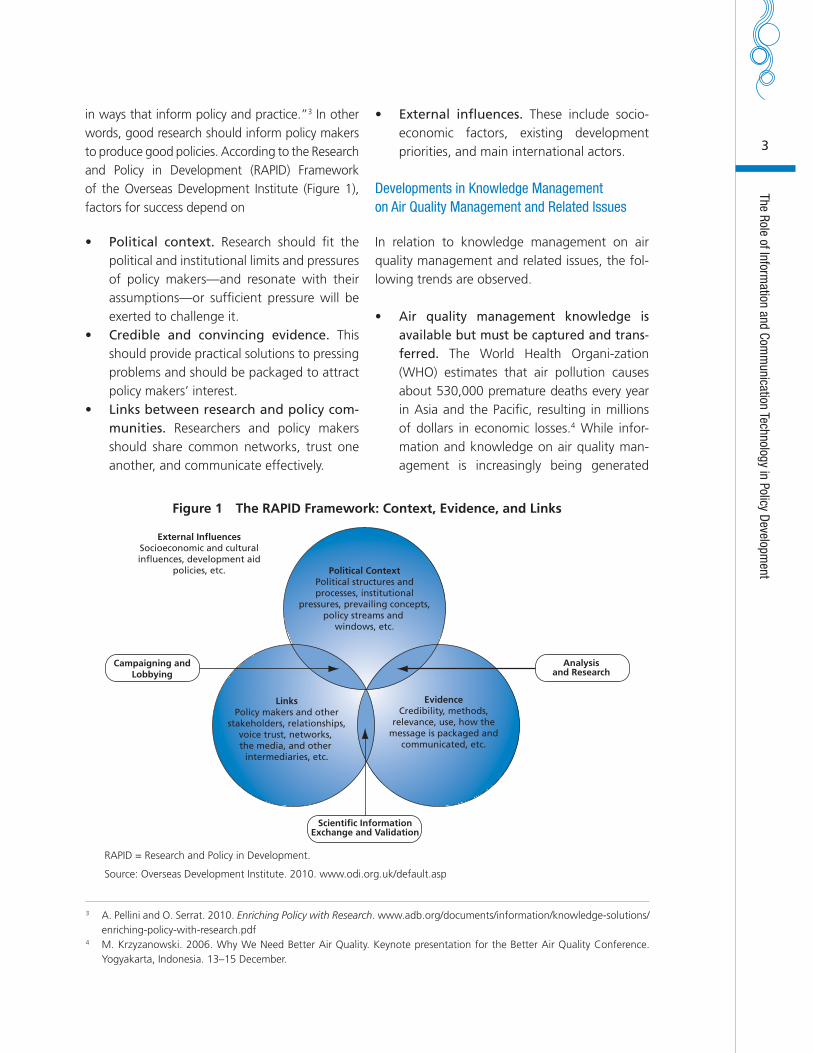
in ways that inform policy and practice.”3 In other words, good research should inform policy makers to produce good policies. According to the Research and Policy in Development (RAPID) Framework of the Overseas Development Institute (Figure 1), factors for success depend on
Political context. Research should fit the political and institutional limits and pressures of policy makers—and resonate with their assumptions—or sufficient pressure will be exerted to challenge it.Credible and convincing evidence. This should provide practical solutions to pressing problems and should be packaged to attract policy makers’ interest.Links between research and policy com-munities. Researchers and policy makers should share common networks, trust one another, and communicate effectively.
External influences. These include socio-economic factors, existing development priorities, and main international actors.
Developments in Knowledge Management on Air Quality Management and Related Issues
In relation to knowledge management on air quality management and related issues, the fol-lowing trends are observed.
Air quality management knowledge is available but must be captured and trans-ferred. The World Health Organi-zation (WHO) estimates that air pollution causes about 530,000 premature deaths every year in Asia and the Pacific, resulting in millions of dollars in economic loss es.4 While infor-mation and knowledge on air quality man-agement is increasingly being generated
3 A. Pellini and O. Serrat. 2010. Enriching Policy with Research. www.adb.org/documents/information/knowledge-solutions/enriching-policy-with-research.pdf
4 M. Krzyzanowski. 2006. Why We Need Better Air Quality. Keynote presentation for the Better Air Quality Conference. Yogyakarta, Indonesia. 13–15 December.
Figure 1 The RAPID Framework: Context, Evidence, and Links
RAPID = Research and Policy in Development.
Source: Overseas Development Institute. 2010. www.odi.org.uk/default.asp
Campaigning andLobbying
External InfluencesSocioeconomic and culturalinfluences, development aid
policies, etc.
Analysisand Research
Scientific InformationExchange and Validation
Political ContextPolitical structures andprocesses, institutional
pressures, prevailing concepts,policy streams and
windows, etc.
LinksPolicy makers and other
stakeholders, relationships,voice trust, networks, the media, and other
intermediaries, etc.
EvidenceCredibility, methods,
relevance, use, how themessage is packaged and
communicated, etc.
4
Know
ledg
e M
anag
emen
t on
Air Q
ualit
y: C
ase
Stud
ies
in the region to address this problem, the capture and transfer of this knowledge to policy makers often do not occur, resulting in investment decisions that are not always based on sound science and internation-al best practices. Thus, there is a need to improve knowledge transfer and knowl-edge sharing on air quality management in the region.5
Knowledge management mechanisms must be used to build capacity. Air qual-ity levels in Asian cities have either been improving slightly or have remained sta-ble over the last decade, notwithstand-ing the continued growth in the urban population, energy use, greenhouse gas emissions, and motorization. So far, prog-ress in air quality management is usually the result of the application of across- the-board policy measures that have been tried and tested in many other countries. Further, the decisions that Asian cities make in the next few years relating to urban planning and transport systems will lock them in for several decades to come, with major impacts on carbon dioxide emis-sions, which accounts for 65%–75% of urban air pollution in Asian cities. Research by the CAI–Asia Center suggests that car-bon dioxide emissions from road trans-port will increase 7.75% per year, from 203 million tons in 2005 to 905 million tons by 2025.6 For policy makers and other stake-holders in Asian cities to make progress in air quality management and sustainable urban transport, they will need to (i) build capacity to develop and implement locally designed strategies, and (ii) have better access to international and regional experts.
As such, KnowledgeAir included the means to facilitate web-learning (e.g., webinars) as well as CoPs to provide better access to experts.Discussions of various air quality partner-ships, forums, and other groups must be streamlined. The increased level of regional and international discussions on air quality and related areas has led to the creation of numerous partnerships, forums, and net-works. Due to the sheer number of these groups, it is becoming increasingly difficult to see the larger context and avoid duplication of these groups. The establishment of a CoP mechanism would contribute to better align-ment of existing forums on air quality and related areas.Air quality is expanding with the cli-mate change agenda, thus requir-ing improved coordination. Knowledge man agement on clean air and related is-sues requires an integrated approach. Air pollutants and greenhouse gas emissions come from a range of sources, includ-ing transport, energy, industry, and bio-mass burning. The impacts are huge and varied, such as those on public health, damage to crops, corrosion of buildings, and reduced tourism. Thus, solutions to address air pollution and greenhouse gas emissions and to make cities more livable are often complex and do not always fall neatly into specific sectors. For example, efforts to reduce emissions from traffic may require reducing the number of vehicles on the road but also chang-ing the way new business and residential districts are designed to maximize public transport and pedestrian access. Further,
5 “Technological development and knowledge management activities should pool regional know-how, with [ADB] as a platform for knowledge sharing, rather than as a primary source of knowledge.” Excerpt from Eminent Persons Group. 2007. Toward a New Asian Development Bank in a New Asia: Report of the Eminent Persons Group to the President of the Asian Development Bank. Manila: ADB.
6 S. Gota and B. Fabian. 2009. Emissions from India’s Intercity and Intracity Road Transport. May. Pasig City: CAI–Asia Center.
5
The Role of Information and Com
munication Technology in Policy Developm
ent
addressing clean air and related issues requires the involvement of a range of stake-holder groups. Coordination is especially important when applying the co-benefits approach to air quality management and climate change mitigation.7 Ongoing cli-mate change negotiations are focused on the post-Kyoto regime in 2012. The Intergovernmental Panel on Climate Change continues to emphasize links to air quality, especially with recent scientific research on the impact of black carbon and ozone. The creation of nationally appropriate mitiga-tion actions will play a key role for air quality but must be translated to practical policies and on-the-ground measures. Achieving this requires active discussion, continuous interaction, and knowledge sharing. These negotiations show the urgency of ad-dressing climate change in the next decades; thus, efficient, fast exchange of informa-tion is more critical than ever. Websites, CoPs, discussion groups, and other online mechanisms must accom modate the grow-ing links between air quality and climate change.
Developments in Knowledge Management and Information and Communication Technology
ICT is the “combination of technological appli-cations of informatics in society with informa-tion technology.”8 It can be used to “promote strategy development, enhance management techniques, strengthen collaboration, advance knowledge sharing and learning, and improve knowledge capture and storage.”8
Evolution of Information and Communication TechnologyICT has rapidly altered the way people generate data, share information, manage knowledge,
and network with others. The internet was first invented in 1969 as a project of the United States Department of Defense, but it was only after the introduction of the World Wide Web by Tim Berners-Lee in the early 1990s did the web became widely accessible to the public. With innovations in network technology, new software applications, and the exponential growth of the internet, virtual communities also began to proliferate, such as listservs, discus-sion forums, and online chat rooms. At the time, however, bandwidth and computing power was limited. Information was stored and dissemi-nated in static form, similar to traditional paper-based publishing models (which the term “web page” makes clear). The transmission of infor-mation and knowledge was, for the most part, a one-way street.
With the second phase of the development of internet-based technologies, referred to by some as “Web 2.0,” the focus shifted to infor-mation sharing and user collaboration. Web 2.0 revolves around the paradigm of the web as a community platform. Instead of web pages, people look for web services. Web 2.0 is also characterized by the availability of affordable high bandwidth networks, wireless commu-nications (Wi-Fi), and powerful consumer- oriented computers, allowing rich media content to be incorporated into web pages. Facebook, Google Apps, Twitter, Wikipedia, and YouTube are just some of the more popular examples of web-based collaborative platforms that allow users not only to consume but also to produce information.
Improvements in mobile communications in the last decade have also made a significant impact on how knowledge is shared. Analog cell phones in the 1980s and early 1990s gave way to digital cell phones relatively quickly.
7 Measures to address the problem of air quality have co-benefits to climate change mitigation and adaptation.8 O. Serrat. 2010. Leveraging Knowledge with ICT. www.adb.org/documents/presentations/knowledge-management-and-
learning/leveraging-knowledge-with-ICT.pdf
6
Know
ledg
e M
anag
emen
t on
Air Q
ualit
y: C
ase
Stud
ies
Today’s “smartphones,” like the Android, BlackBerry, and iPhone, have picked up the pace, with new models entering the market often every quarter. These smartphones and other mobile devices allow people to stay in touch at all times. While the increased level of mobile internet access has made it more chal-lenging to track exactly how many users there are at any given time, some experts predict that mobile internet users will overtake desk-top users by 2015.9 Furthermore, although internet penetration in Asia (21.5%) is behind that of North America (77.4%), the growth in the number of users increased six-fold in Asia from 2000 to 2010.10
Commercial software licenses can be prohibi-tively expensive for institutions based in develop-ing countries. Open-source software, however, provides a cost-effective way to obtain access to ICT tools and resources.11 For example, open-source content management systems such as Drupal, Joomla, and TYPO3 (available free of charge) allow governments and nongovern-ment organizations with limited ICT budgets to develop and maintain their own websites with-out having to pay expensive licensing fees.12
People are also becoming more sophisticated in their communication with each other. E-mail is being supplemented by social networking websites like Facebook and Twitter, and the printed word is being enhanced by photo and video content through media sharing sites like
9 M. Meeker, S. Devitt, and L. Wu. 2010. Internet Trends. Presentation at the Morgan Stanley CM Summit, New York, 7–8 June.
10 Internet World Stats. www.internetworldstats.com/stats.htm11 Open-source software means that the program code is publicly available. It is generally distributed free of charge, and
programmers are allowed either to modify the source code or to develop extensions to the code. This is in contrast to the proprietary model, which denotes that the software is licensed and copy protected.
12 There is an ongoing debate over the future of open-source platforms and the relevance of the web as a whole versus the growing popularity of proprietary mobile software applications (“apps”). This debate is outside the scope of this report.
13 J. Howe. 2006. The Rise of Crowdsourcing. Wired. June. www.wired.com/wired/archive/14.06/crowds.html14 Definition of “knowledge management” by The Gartner Group. www.garter.com. Quoted in W. Newman. 2010.
Knowledge Management Research and End-User Work Environments. http://archive.ifla.org/IV/ifla65/papers/057-84e.htm15 ADB. 2008. Strategy 2020: The Long-Term Strategic Framework of the Asian Development Bank. Manila.
Flickr and YouTube. Therefore, a listserv and a noninteractive website are no longer adequate in keeping stakeholders engaged.
Furthermore, the growing trend of “crowd sourcing” means that more and more data and information are becoming decentralized. Knowledge is no longer always sourced from a limited number of institutions—but from many individual contributions—to create a meaningful and relevant big-picture view.13
Continuing Importance of Knowledge ManagementKnowledge management
promotes an integrated approach to the creating, capturing, retrieving, shar-ing, and evaluating of an enterprise’s information assets. These assets include structured databases, textual informa-tion such as policy and procedure docu-ments, and most importantly, the tacit knowledge and expertise resident in individual’s heads.14
However, knowledge management can also apply to a community of practitioners working in separate organizations but sharing a common interest or goal within their respective field of expertise.
ADB recognizes knowledge solutions as one of the five drivers of change in Strategy 2020.15 In particular, it identifies the need to strengthen external knowledge partnerships
7
The Role of Information and Com
munication Technology in Policy Developm
ent
and empower CoPs as two of the four pil-lars that support its knowledge management action plan for 2009–2011.16 This involves the need to strengthen ties within and outside of the region.
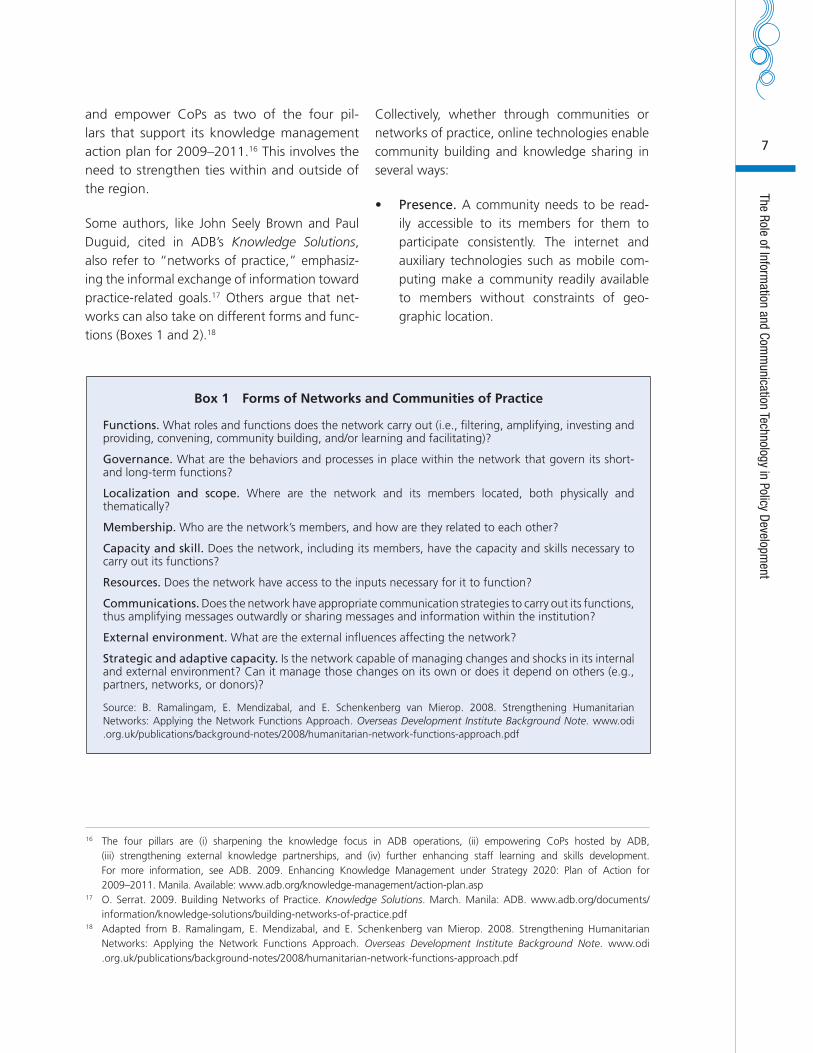
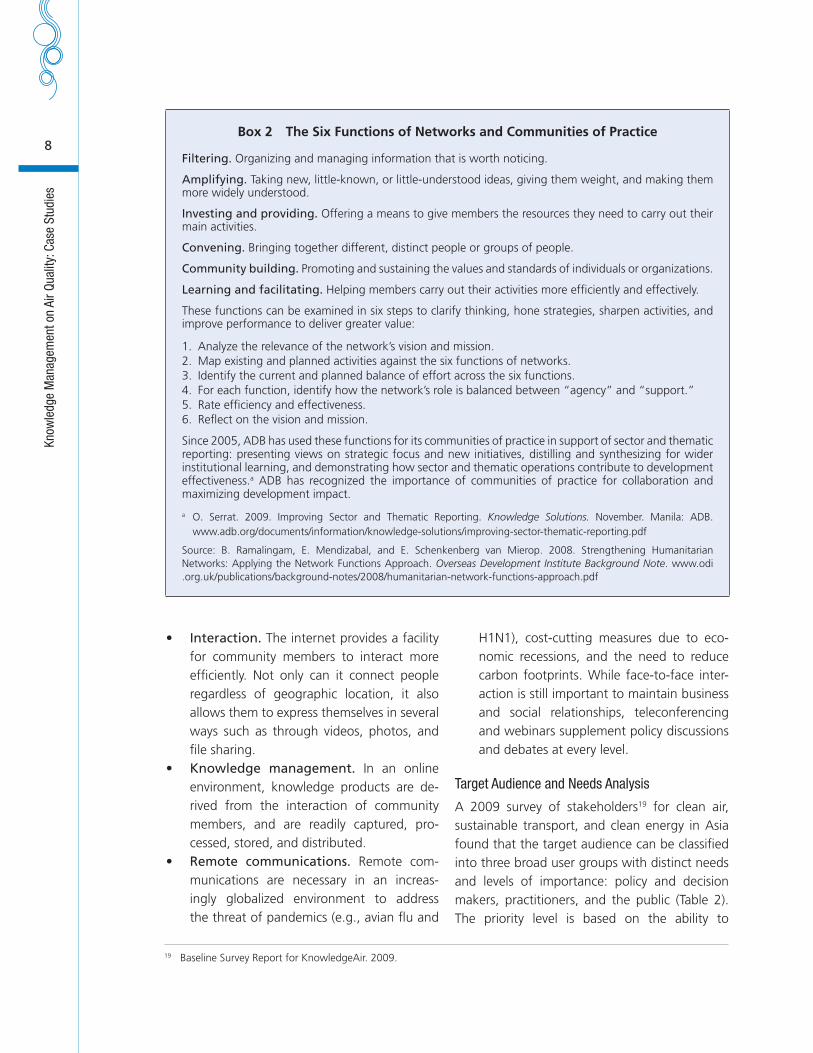
Some authors, like John Seely Brown and Paul Duguid, cited in ADB’s Knowledge Solutions, also refer to “networks of practice,” emphasiz-ing the informal exchange of information toward practice-related goals.17 Others argue that net-works can also take on different forms and func-tions (Boxes 1 and 2).18
16 The four pillars are (i) sharpening the knowledge focus in ADB operations, (ii) empowering CoPs hosted by ADB, (iii) strengthening external knowledge partnerships, and (iv) further enhancing staff learning and skills development. For more information, see ADB. 2009. Enhancing Knowledge Management under Strategy 2020: Plan of Action for 2009–2011. Manila. Available: www.adb.org/knowledge-management/action-plan.asp
17 O. Serrat. 2009. Building Networks of Practice. Knowledge Solutions. March. Manila: ADB. www.adb.org/documents/information/knowledge-solutions/building-networks-of-practice.pdf
18 Adapted from B. Ramalingam, E. Mendizabal, and E. Schenkenberg van Mierop. 2008. Strengthening Humanitarian Networks: Applying the Network Functions Approach. Overseas Development Institute Background Note. www.odi.org.uk/publications/background-notes/2008/humanitarian-network-functions-approach.pdf
Collectively, whether through communities or networks of practice, online technologies enable community building and knowledge sharing in several ways:
Presence. A community needs to be read-ily accessible to its members for them to participate consistently. The internet and auxiliary technologies such as mobile com-puting make a community readily available to members without constraints of geo-graphic location.
Box 1 Forms of Networks and Communities of Practice
Functions. What roles and functions does the network carry out (i.e., filtering, amplifying, investing and providing, convening, community building, and/or learning and facilitating)?
Governance. What are the behaviors and processes in place within the network that govern its short- and long-term functions?
Localization and scope. Where are the network and its members located, both physically and thematically?
Membership. Who are the network’s members, and how are they related to each other?
Capacity and skill. Does the network, including its members, have the capacity and skills necessary to carry out its functions?
Resources. Does the network have access to the inputs necessary for it to function?
Communications. Does the network have appropriate communication strategies to carry out its functions, thus amplifying messages outwardly or sharing messages and information within the institution?
External environment. What are the external influences affecting the network?
Strategic and adaptive capacity. Is the network capable of managing changes and shocks in its internal and external environment? Can it manage those changes on its own or does it depend on others (e.g., partners, networks, or donors)?
Source: B. Ramalingam, E. Mendizabal, and E. Schenkenberg van Mierop. 2008. Strengthening Humanitarian Networks: Applying the Network Functions Approach. Overseas Development Institute Background Note. www.odi.org.uk/publications/background-notes/2008/humanitarian-network-functions-approach.pdf
8
Know
ledg
e M
anag
emen
t on
Air Q
ualit
y: C
ase
Stud
ies
Interaction. The internet provides a facility for community members to interact more efficiently. Not only can it connect people regardless of geographic location, it also allows them to express themselves in several ways such as through videos, photos, and file sharing.Knowledge management. In an online environment, knowledge products are de-rived from the interaction of commu nity members, and are readily captured, pro-cessed, stored, and distributed.Remote communications. Remote com-munications are necessary in an increas-ingly globalized environment to address the threat of pandemics (e.g., avian flu and
19 Baseline Survey Report for KnowledgeAir. 2009.
H1N1), cost-cutting measures due to eco-nomic recessions, and the need to reduce carbon footprints. While face-to-face inter-action is still important to maintain business and social relationships, teleconferencing and webinars supplement policy discussions and debates at every level.
Target Audience and Needs Analysis
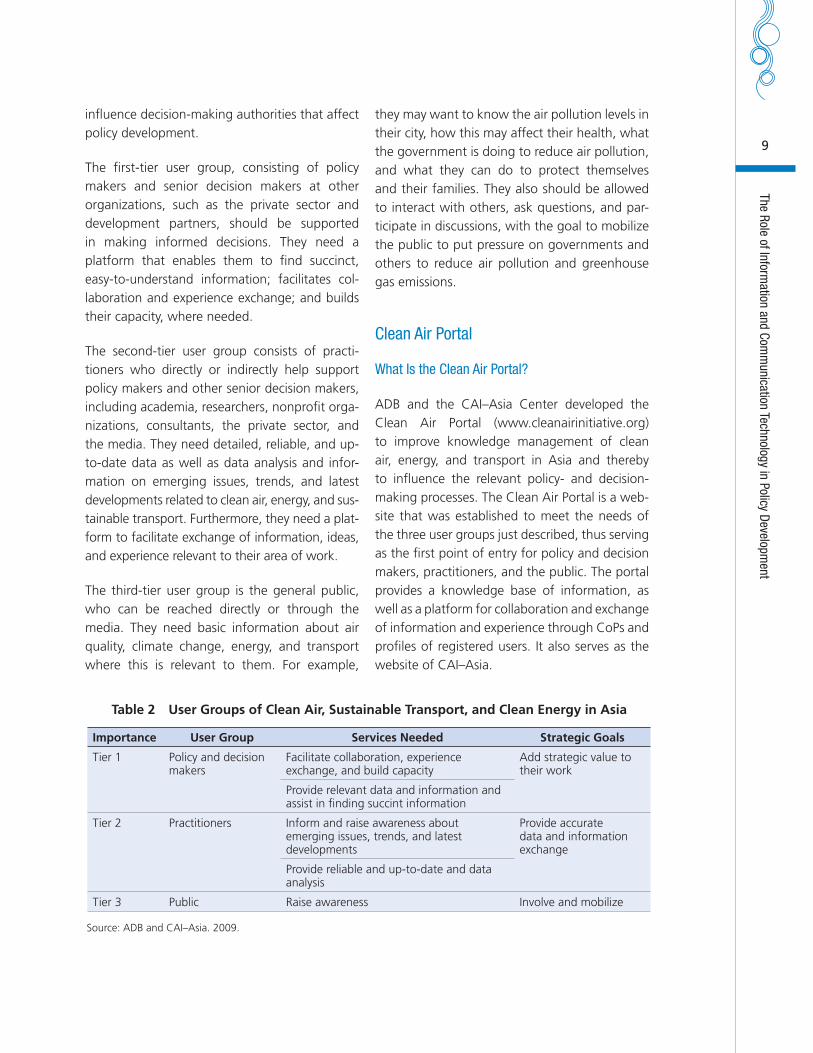
A 2009 survey of stakeholders19 for clean air, sustainable transport, and clean energy in Asia found that the target audience can be classified into three broad user groups with distinct needs and levels of importance: policy and decision makers, practitioners, and the public (Table 2). The priority level is based on the ability to
Box 2 The Six Functions of Networks and Communities of Practice
Filtering. Organizing and managing information that is worth noticing.
Amplifying. Taking new, little-known, or little-understood ideas, giving them weight, and making them more widely understood.
Investing and providing. Offering a means to give members the resources they need to carry out their main activities.
Convening. Bringing together different, distinct people or groups of people.
Community building. Promoting and sustaining the values and standards of individuals or organizations.
Learning and facilitating. Helping members carry out their activities more efficiently and effectively.
These functions can be examined in six steps to clarify thinking, hone strategies, sharpen activities, and improve performance to deliver greater value:
1. Analyze the relevance of the network’s vision and mission.2. Map existing and planned activities against the six functions of networks.3. Identify the current and planned balance of effort across the six functions.4. For each function, identify how the network’s role is balanced between “agency” and “support.”5. Rate efficiency and effectiveness.6. Reflect on the vision and mission.
Since 2005, ADB has used these functions for its communities of practice in support of sector and thematic reporting: presenting views on strategic focus and new initiatives, distilling and synthesizing for wider institutional learning, and demonstrating how sector and thematic operations contribute to development effectiveness.a ADB has recognized the importance of communities of practice for collaboration and maximizing development impact.
a O. Serrat. 2009. Improving Sector and Thematic Reporting. Knowledge Solutions. November. Manila: ADB. www.adb.org/documents/information/knowledge-solutions/improving-sector-thematic-reporting.pdf
Source: B. Ramalingam, E. Mendizabal, and E. Schenkenberg van Mierop. 2008. Strengthening Humanitarian Networks: Applying the Network Functions Approach. Overseas Development Institute Background Note. www.odi.org.uk/publications/background-notes/2008/humanitarian-network-functions-approach.pdf
9
The Role of Information and Com
munication Technology in Policy Developm
ent
Table 2 User Groups of Clean Air, Sustainable Transport, and Clean Energy in Asia
Importance User Group Services Needed Strategic Goals
Tier 1 Policy and decision makers
Facilitate collaboration, experience exchange, and build capacity
Add strategic value to their work
Provide relevant data and information and assist in finding succint information
Tier 2 Practitioners Inform and raise awareness about emerging issues, trends, and latest developments
Provide accurate data and information exchange
Provide reliable and up-to-date and data analysis
Tier 3 Public Raise awareness Involve and mobilize
Source: ADB and CAI–Asia. 2009.
influence decision-making authorities that affect policy development.
The first-tier user group, consisting of policy makers and senior decision makers at other organizations, such as the private sector and development partners, should be supported in making informed decisions. They need a platform that enables them to find succinct, easy-to-understand information; facilitates col-laboration and experience exchange; and buildstheir capacity, where needed.
The second-tier user group consists of practi-tioners who directly or indirectly help support policy makers and other senior decision makers, including academia, researchers, nonprofit orga-nizations, consultants, the private sector, and the media. They need detailed, reliable, and up-to-date data as well as data analysis and infor-mation on emerging issues, trends, and latest developments related to clean air, energy, and sus-tainable transport. Furthermore, they need a plat-form to facilitate exchange of information, ideas, and experience relevant to their area of work.
The third-tier user group is the general public, who can be reached directly or through the media. They need basic information about air quality, climate change, energy, and transport where this is relevant to them. For example,
they may want to know the air pollution levels in their city, how this may affect their health, what the government is doing to reduce air pollution, and what they can do to protect themselves and their families. They also should be allowed to interact with others, ask questions, and par-ticipate in discussions, with the goal to mobilize the public to put pressure on governments and others to reduce air pollution and greenhouse gas emissions.
Clean Air Portal
What Is the Clean Air Portal?
ADB and the CAI–Asia Center developed the Clean Air Portal (www.cleanairinitiative.org) to improve knowledge management of clean air, energy, and transport in Asia and thereby to influence the relevant policy- and decision- making processes. The Clean Air Portal is a web-site that was established to meet the needs of the three user groups just described, thus serving as the first point of entry for policy and decision makers, practitioners, and the public. The portal provides a knowledge base of information, as well as a platform for collaboration and exchange of information and experience through CoPs and profiles of registered users. It also serves as the website of CAI–Asia.
10
Know
ledg
e M
anag
emen
t on
Air Q
ualit
y: C
ase
Stud
ies
The portal integrates the CitiesACT database (citiesact.org), which was also established by the CAI–Asia Center and the Global Atmospheric Pollution Forum, to share data and information on air quality, climate change and energy, and trans-port. With the launch of the Clean Air Portal in February 2010, the CitiesACT database, which is accessible from the Clean Air Portal, is being modi-fied to store only data and indicators; organization profiles, project profiles, and other information will be kept on the main Clean Air Portal. The portal’s banner uses the same design as the CitiesACT database, which shows a livable city with clean air, sustainable transport, and a stable climate, and where walking trumps other modes of transport.
Structure of the Clean Air Portal
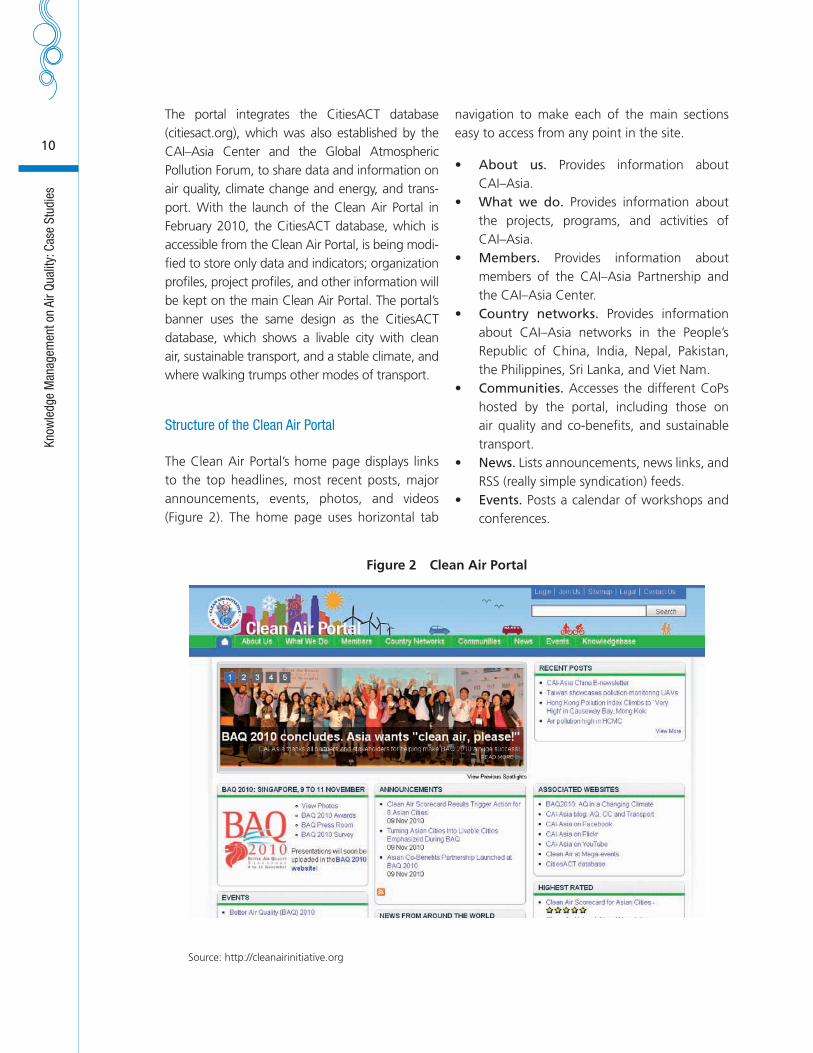
The Clean Air Portal’s home page displays links to the top headlines, most recent posts, major announcements, events, photos, and videos (Figure 2). The home page uses horizontal tab
navigation to make each of the main sections easy to access from any point in the site.
About us. Provides information about CAI–Asia.What we do. Provides information about the projects, programs, and activities of CAI–Asia.Members. Provides information about members of the CAI–Asia Partnership and the CAI–Asia Center.Country networks. Provides information about CAI–Asia networks in the People’s Republic of China, India, Nepal, Pakistan, the Philippines, Sri Lanka, and Viet Nam.Communities. Accesses the different CoPs hosted by the portal, including those on air quality and co-benefits, and sustainable transport.News. Lists announcements, news links, and RSS (really simple syndication) feeds.Events. Posts a calendar of workshops and conferences.
Source: http://cleanairinitiative.org
Figure 2 Clean Air Portal
11
The Role of Information and Com
munication Technology in Policy Developm
ent
Knowledge base. Serves as a virtual library of articles, reports, organization profiles, projects, programs, and training courses related to air quality, climate change, energy, and sustainable transport. It also provides access to the CitiesACT database.
Content Management System and Roles
The portal uses Drupal, an open-source content management system. Drupal has a sophisticated role-based permissions model that makes it easy for registered users to create and edit web pages in real time. These roles include
Administrator. Has full access and control over the entire portal.Editor. Can create and edit content for the portal.Member. Can submit limited content (e.g., links, photos, and videos) without the ability to edit.
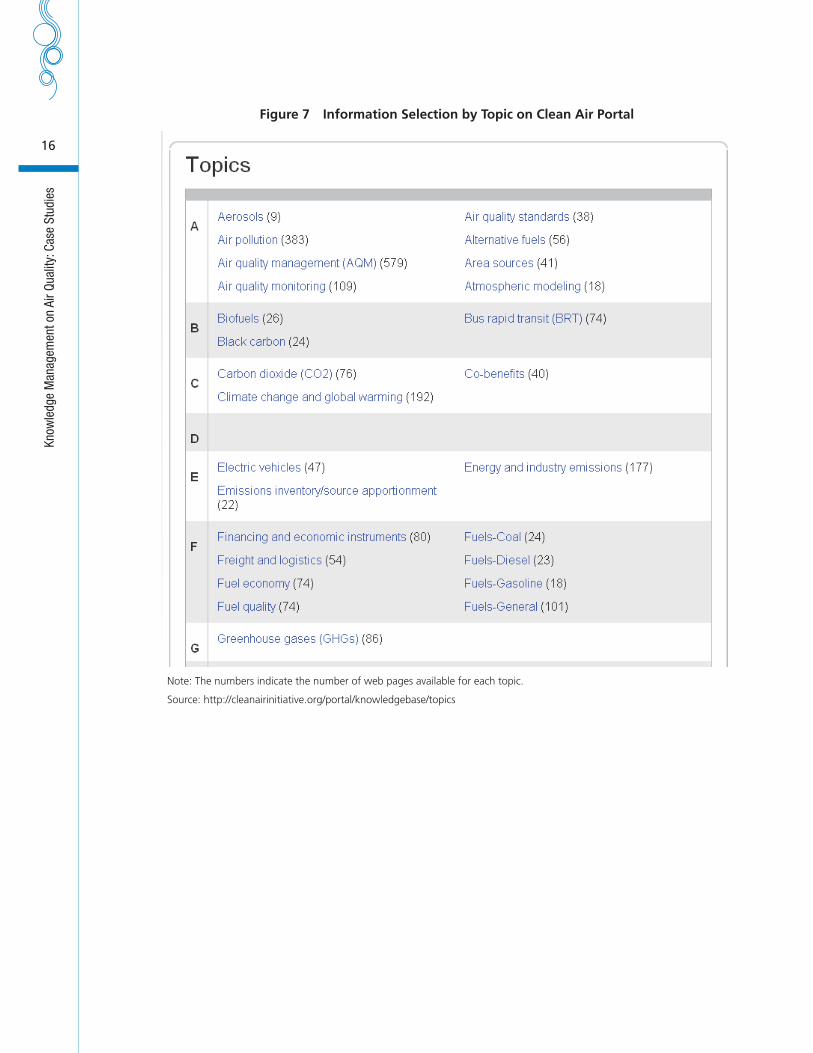
Drupal allows content to be “tagged” according to predefined taxonomies so that information can be accessed in multiple ways, for example, by country, city, topic, or content type.
Portal Features
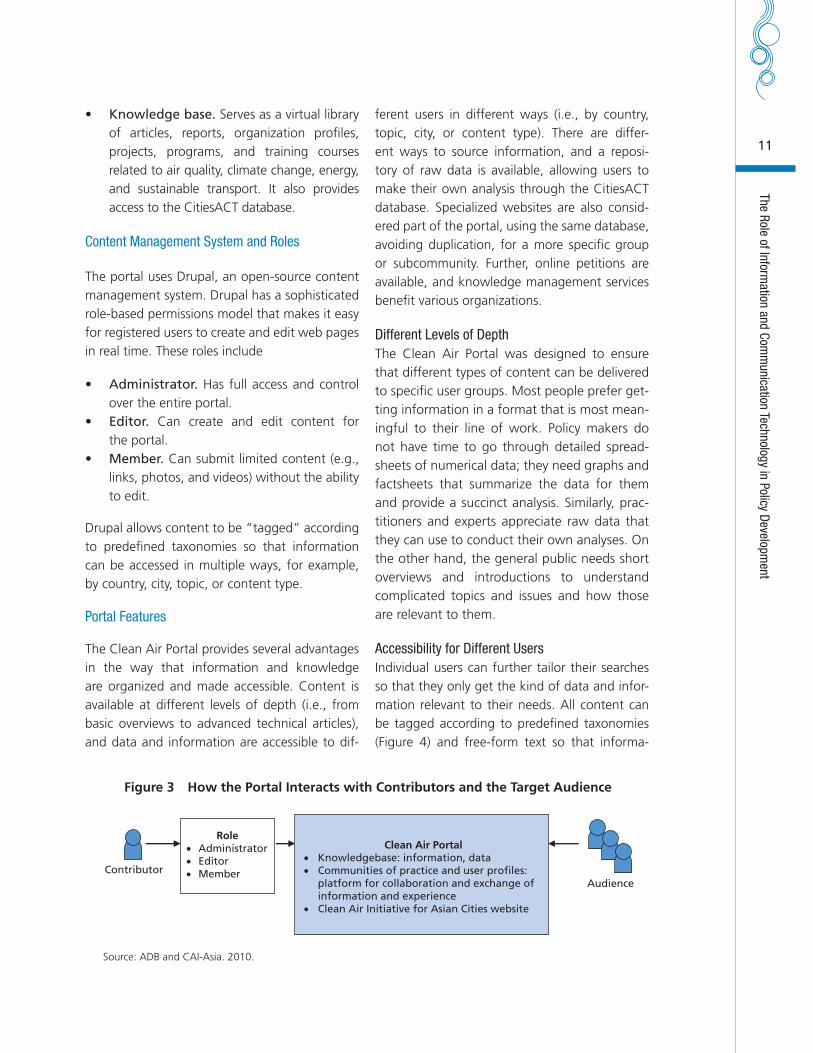
The Clean Air Portal provides several advantages in the way that information and knowledge are organized and made accessible. Content is available at different levels of depth (i.e., from basic overviews to advanced technical articles), and data and information are accessible to dif-
Contributor Audience
Clean Air Portal�� Knowledgebase: information, data�� Communities of practice and user profiles: platform for collaboration and exchange of information and experience� Clean Air Initiative for Asian Cities website
Role� Administrator� Editor� Member
Figure 3 How the Portal Interacts with Contributors and the Target Audience
Source: ADB and CAI-Asia. 2010.
ferent users in different ways (i.e., by country, topic, city, or content type). There are differ-ent ways to source information, and a reposi-tory of raw data is available, allowing users to make their own analysis through the CitiesACT database. Specialized websites are also consid-ered part of the portal, using the same database, avoiding duplication, for a more specific group or subcommunity. Further, online petitions are available, and knowledge management services benefit various organizations.
Different Levels of DepthThe Clean Air Portal was designed to ensure that different types of content can be delivered to specific user groups. Most people prefer get-ting information in a format that is most mean-ingful to their line of work. Policy makers do not have time to go through detailed spread-sheets of numerical data; they need graphs and factsheets that summarize the data for them and provide a succinct analysis. Similarly, prac-titioners and experts appreciate raw data that they can use to conduct their own analyses. On the other hand, the general public needs short overviews and introductions to understand complicated topics and issues and how those are relevant to them.
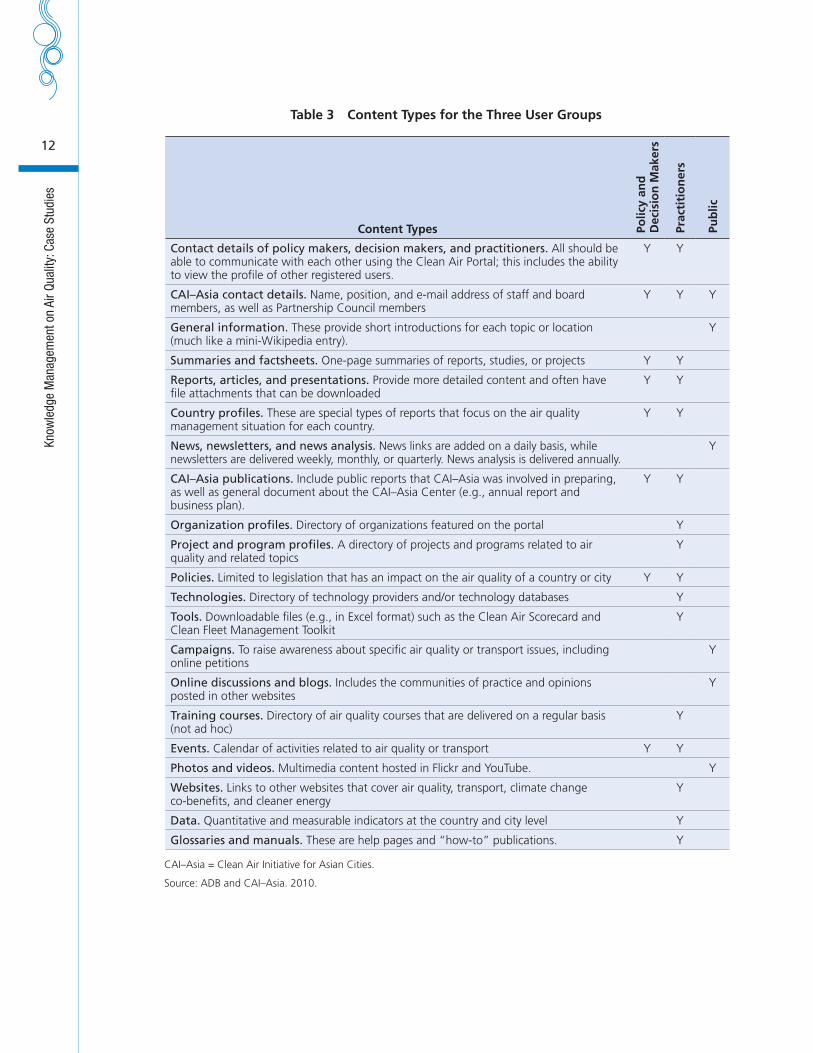
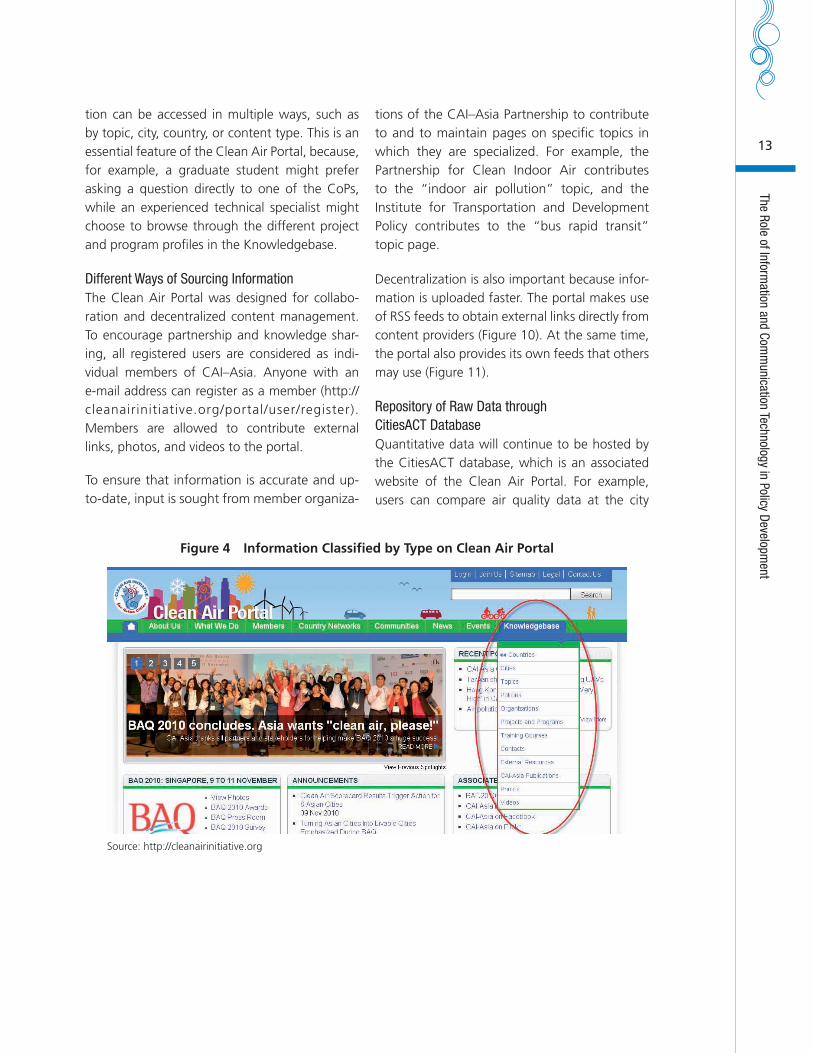
Accessibility for Different UsersIndividual users can further tailor their searches so that they only get the kind of data and infor-mation relevant to their needs. All content can be tagged according to predefined taxonomies (Figure 4) and free-form text so that informa-
12
Know
ledg
e M
anag
emen
t on
Air Q
ualit
y: C
ase
Stud
ies
Content Types Polic
y an
d
Dec
isio
n M
aker
s
Prac
titi
on
ers
Pub
lic
Contact details of policy makers, decision makers, and practitioners. All should be able to communicate with each other using the Clean Air Portal; this includes the ability to view the profile of other registered users.
Y Y
CAI–Asia contact details. Name, position, and e-mail address of staff and board members, as well as Partnership Council members
Y Y Y
General information. These provide short introductions for each topic or location (much like a mini-Wikipedia entry).
Y
Summaries and factsheets. One-page summaries of reports, studies, or projects Y Y
Reports, articles, and presentations. Provide more detailed content and often have file attachments that can be downloaded
Y Y
Country profiles. These are special types of reports that focus on the air quality management situation for each country.
Y Y
News, newsletters, and news analysis. News links are added on a daily basis, while newsletters are delivered weekly, monthly, or quarterly. News analysis is delivered annually.
Y
CAI–Asia publications. Include public reports that CAI–Asia was involved in preparing, as well as general document about the CAI–Asia Center (e.g., annual report and business plan).
Y Y
Organization profiles. Directory of organizations featured on the portal Y
Project and program profiles. A directory of projects and programs related to air quality and related topics
Y
Policies. Limited to legislation that has an impact on the air quality of a country or city Y Y
Technologies. Directory of technology providers and/or technology databases Y
Tools. Downloadable files (e.g., in Excel format) such as the Clean Air Scorecard and Clean Fleet Management Toolkit
Y
Campaigns. To raise awareness about specific air quality or transport issues, including online petitions
Y
Online discussions and blogs. Includes the communities of practice and opinions posted in other websites
Y
Training courses. Directory of air quality courses that are delivered on a regular basis (not ad hoc)
Y
Events. Calendar of activities related to air quality or transport Y Y
Photos and videos. Multimedia content hosted in Flickr and YouTube. Y
Websites. Links to other websites that cover air quality, transport, climate change co-benefits, and cleaner energy
Y
Data. Quantitative and measurable indicators at the country and city level Y
Glossaries and manuals. These are help pages and “how-to” publications. Y
Table 3 Content Types for the Three User Groups
CAI–Asia = Clean Air Initiative for Asian Cities.
Source: ADB and CAI–Asia. 2010.
13
The Role of Information and Com
munication Technology in Policy Developm
ent
tion can be accessed in multiple ways, such as by topic, city, country, or content type. This is an essential feature of the Clean Air Portal, because, for example, a graduate student might prefer asking a question directly to one of the CoPs, while an experienced technical specialist might choose to browse through the different project and program profiles in the Knowledgebase.
Different Ways of Sourcing InformationThe Clean Air Portal was designed for collabo-ration and decentralized content management. To encourage partnership and knowledge shar-ing, all registered users are considered as indi-vidual members of CAI–Asia. Anyone with an e-mail address can register as a member (http:// cleanairinitiative.org/portal/user/register). Members are allowed to contribute external links, photos, and videos to the portal.
To ensure that information is accurate and up-to-date, input is sought from member organiza-
tions of the CAI–Asia Partnership to contribute to and to maintain pages on specific topics in which they are specialized. For example, the Partnership for Clean Indoor Air contributes to the “indoor air pollution” topic, and the Institute for Transportation and Development Policy contributes to the “bus rapid transit” topic page.
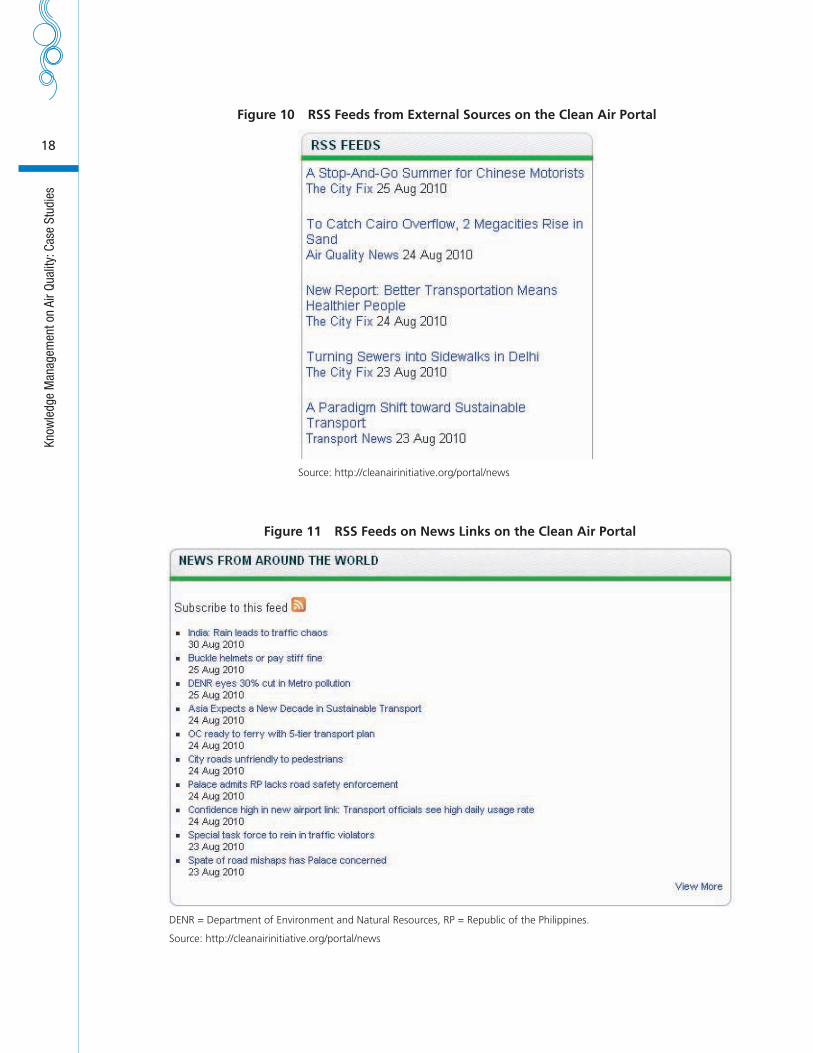
Decentralization is also important because infor-mation is uploaded faster. The portal makes use of RSS feeds to obtain external links directly from content providers (Figure 10). At the same time, the portal also provides its own feeds that others may use (Figure 11).
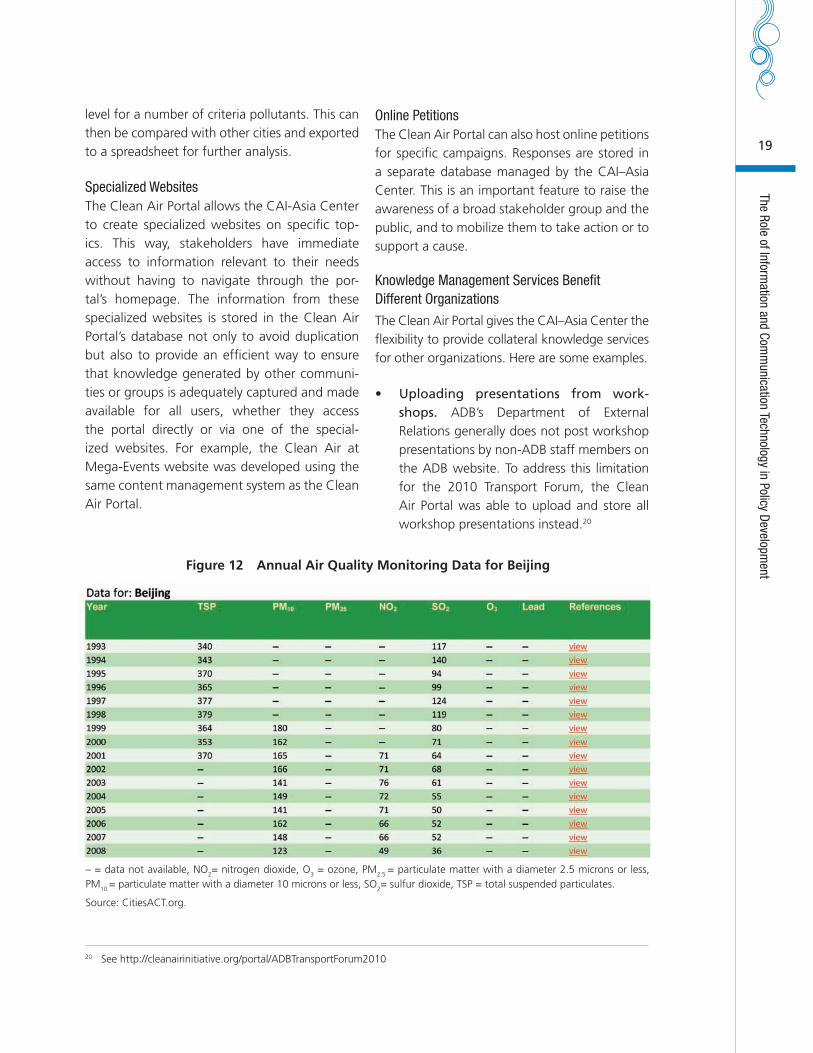
Repository of Raw Data through CitiesACT DatabaseQuantitative data will continue to be hosted by the CitiesACT database, which is an associated website of the Clean Air Portal. For example, users can compare air quality data at the city
Figure 4 Information Classified by Type on Clean Air Portal
Source: http://cleanairinitiative.org
14
Know
ledg
e M
anag
emen
t on
Air Q
ualit
y: C
ase
Stud
ies
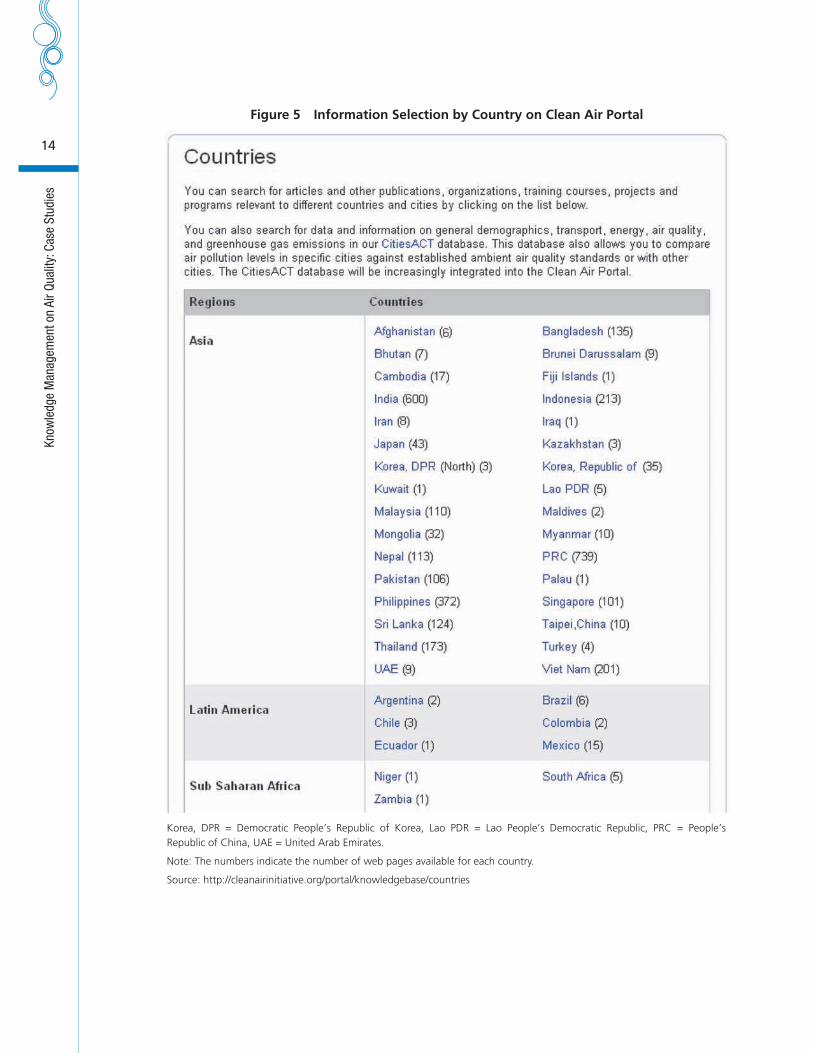
Figure 5 Information Selection by Country on Clean Air Portal
Korea, DPR = Democratic People’s Republic of Korea, Lao PDR = Lao People’s Democratic Republic, PRC = People’s Republic of China, UAE = United Arab Emirates.
Note: The numbers indicate the number of web pages available for each country.
Source: http://cleanairinitiative.org/portal/knowledgebase/countries

15
The Role of Information and Com
munication Technology in Policy Developm
ent
Figure 6 Information Selection by City on Clean Air Portal
PRC = People’s Republic of China.
Note: The numbers indicate the number of web pages available for each city.
Source: http://cleanairinitiative.org/portal/knowledgebase/cities
16
Know
ledg
e M
anag
emen
t on
Air Q
ualit
y: C
ase
Stud
ies
Note: The numbers indicate the number of web pages available for each topic.
Source: http://cleanairinitiative.org/portal/knowledgebase/topics
Figure 7 Information Selection by Topic on Clean Air Portal
17
The Role of Information and Com
munication Technology in Policy Developm
ent
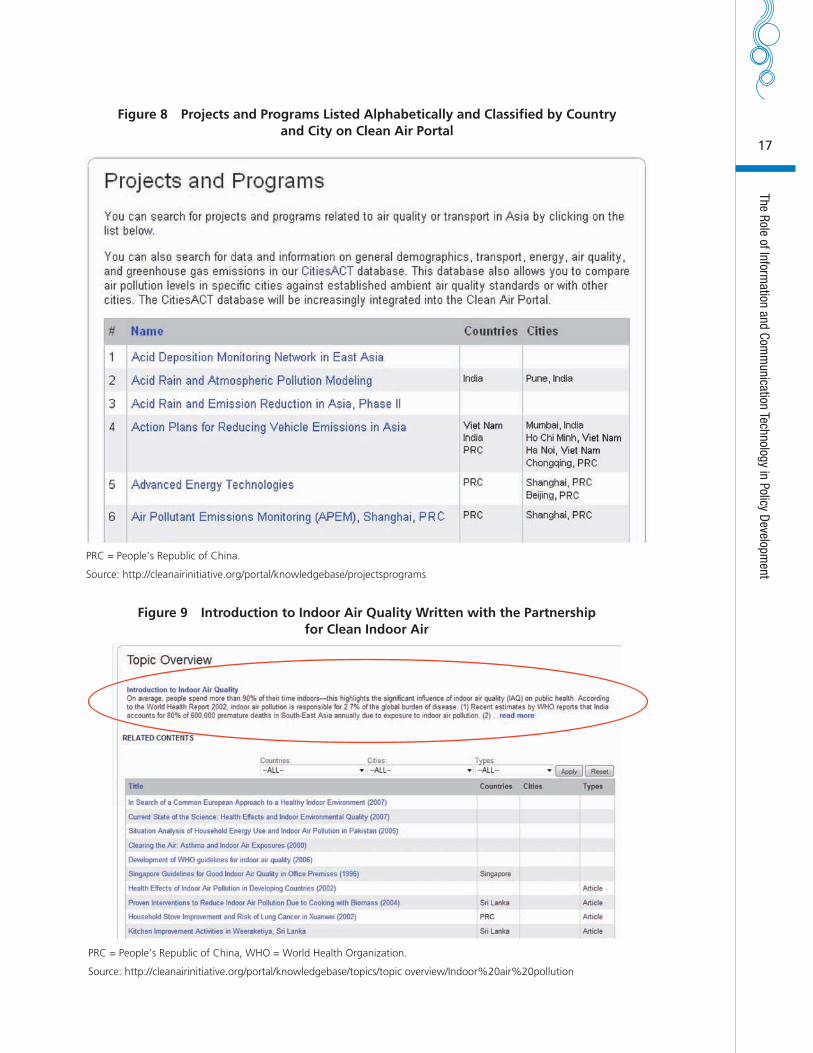
Figure 8 Projects and Programs Listed Alphabetically and Classified by Country and City on Clean Air Portal
PRC = People’s Republic of China.
Source: http://cleanairinitiative.org/portal/knowledgebase/projectsprograms
Figure 9 Introduction to Indoor Air Quality Written with the Partnership for Clean Indoor Air
PRC = People’s Republic of China, WHO = World Health Organization.
Source: http://cleanairinitiative.org/portal/knowledgebase/topics/topic overview/Indoor%20air%20pollution
18
Know
ledg
e M
anag
emen
t on
Air Q
ualit
y: C
ase
Stud
ies
Figure 10 RSS Feeds from External Sources on the Clean Air Portal
Source: http://cleanairinitiative.org/portal/news
Figure 11 RSS Feeds on News Links on the Clean Air Portal
DENR = Department of Environment and Natural Resources, RP = Republic of the Philippines.
Source: http://cleanairinitiative.org/portal/news
19
The Role of Information and Com
munication Technology in Policy Developm
ent
level for a number of criteria pollutants. This can then be compared with other cities and exported to a spreadsheet for further analysis.
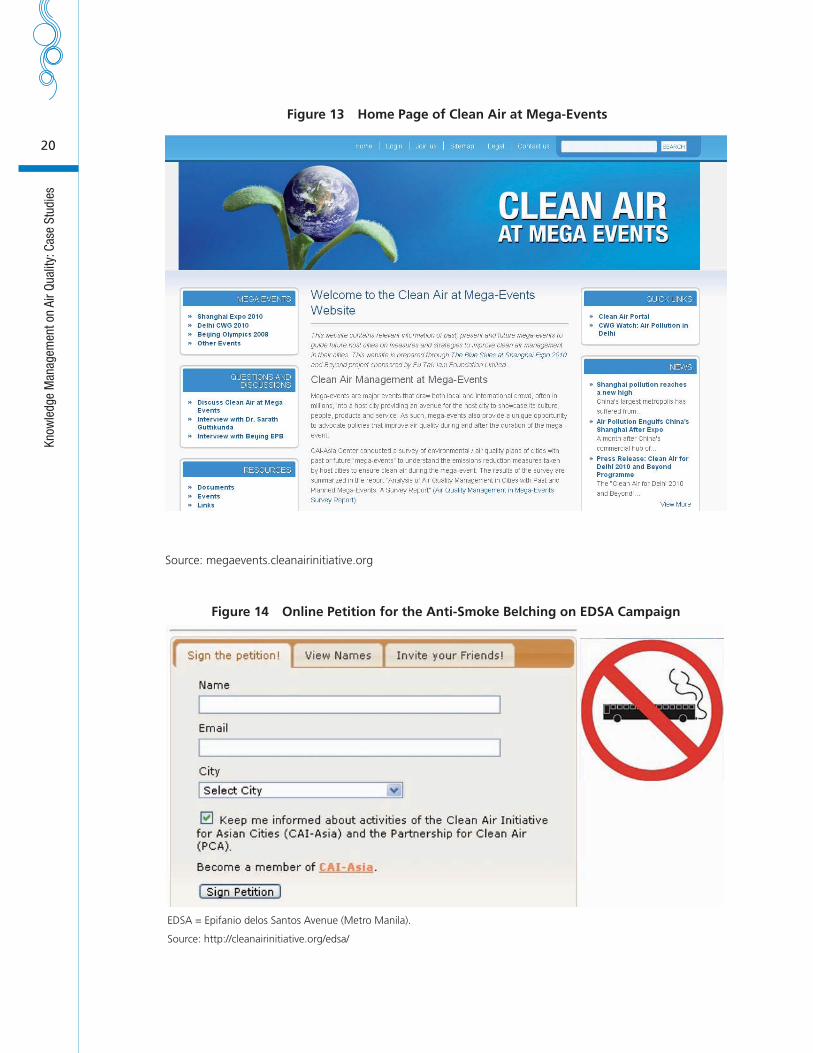
Specialized Websites The Clean Air Portal allows the CAI-Asia Center to create specialized websites on specific top-ics. This way, stakeholders have immediate access to information relevant to their needs without having to navigate through the por-tal’s homepage. The information from these specialized websites is stored in the Clean Air Portal’s database not only to avoid duplication but also to provide an efficient way to ensure that knowledge generated by other communi-ties or groups is adequately captured and made available for all users, whether they access the portal directly or via one of the special-ized websites. For example, the Clean Air at Mega-Events website was developed using the same content management system as the Clean Air Portal.
Figure 12 Annual Air Quality Monitoring Data for Beijing
– = data not available, NO2= nitrogen dioxide, O3 = ozone, PM2.5 = particulate matter with a diameter 2.5 microns or less, PM10 = particulate matter with a diameter 10 microns or less, SO2= sulfur dioxide, TSP = total suspended particulates.
Source: CitiesACT.org.
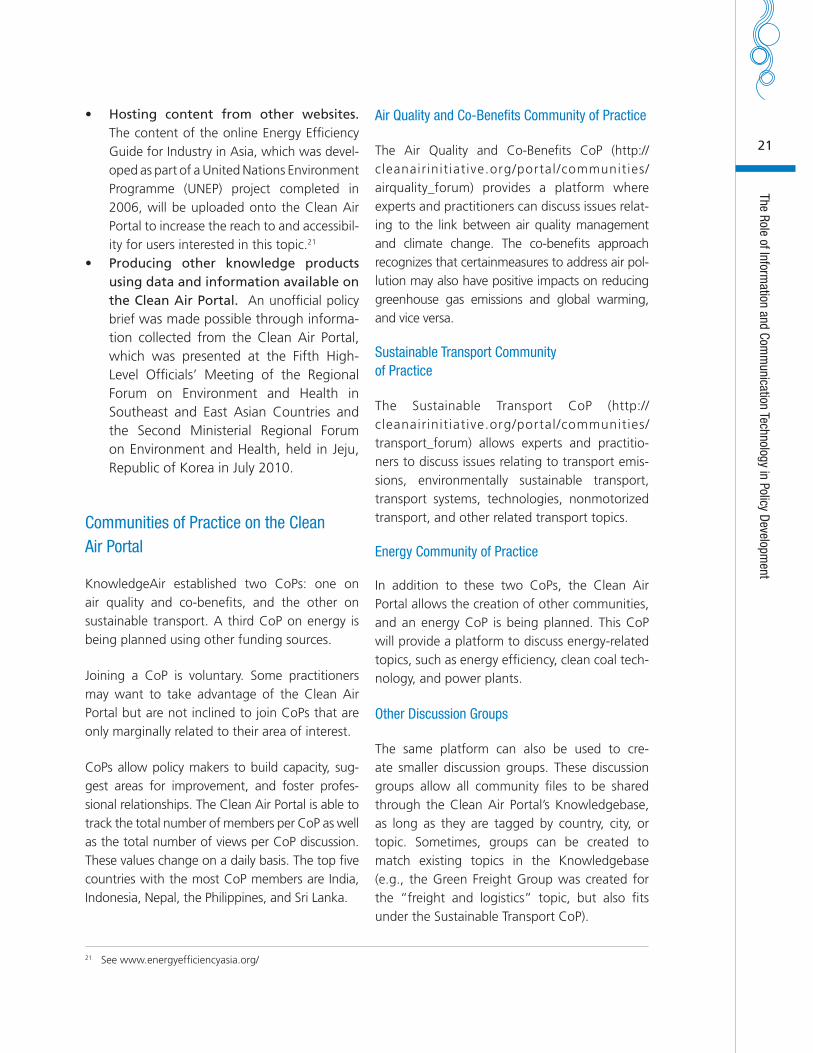
Online PetitionsThe Clean Air Portal can also host online petitions for specific campaigns. Responses are stored in a separate database managed by the CAI–Asia Center. This is an important feature to raise the awareness of a broad stakeholder group and the public, and to mobilize them to take action or to support a cause.
Knowledge Management Services Benefit Different Organizations
The Clean Air Portal gives the CAI–Asia Center the flexibility to provide collateral knowledge services for other organizations. Here are some examples.
Uploading presentations from work-shops. ADB’s Department of External Relations generally does not post workshop presentations by non-ADB staff members on the ADB website. To address this limitation for the 2010 Transport Forum, the Clean Air Portal was able to upload and store all workshop presentations instead.20
20 See http://cleanairinitiative.org/portal/ADBTransportForum2010
20
Know
ledg
e M
anag
emen
t on
Air Q
ualit
y: C
ase
Stud
ies
Figure 13 Home Page of Clean Air at Mega-Events
Source: megaevents.cleanairinitiative.org
Figure 14 Online Petition for the Anti-Smoke Belching on EDSA Campaign
EDSA = Epifanio delos Santos Avenue (Metro Manila).
Source: http://cleanairinitiative.org/edsa/
21
The Role of Information and Com
munication Technology in Policy Developm
ent
Hosting content from other websites. The content of the online Energy Efficiency Guide for Industry in Asia, which was devel-oped as part of a United Nations Environment Programme (UNEP) project completed in 2006, will be uploaded onto the Clean Air Portal to increase the reach to and accessibil-ity for users interested in this topic.21
Producing other knowledge products using data and information available on the Clean Air Portal. An unofficial policy brief was made possible through informa-tion collected from the Clean Air Portal, which was presented at the Fifth High-Level Officials’ Meeting of the Regional Forum on Environment and Health in Southeast and East Asian Countries and the Second Ministerial Regional Forum on Environment and Health, held in Jeju, Republic of Korea in July 2010.
Communities of Practice on the Clean Air Portal
KnowledgeAir established two CoPs: one on air quality and co-benefits, and the other on sustainable transport. A third CoP on energy is being planned using other funding sources.
Joining a CoP is voluntary. Some practitioners may want to take advantage of the Clean Air Portal but are not inclined to join CoPs that are only marginally related to their area of interest.
CoPs allow policy makers to build capacity, sug-gest areas for improvement, and foster profes-sional relationships. The Clean Air Portal is able to track the total number of members per CoP as well as the total number of views per CoP discussion. These values change on a daily basis. The top five countries with the most CoP members are India, Indonesia, Nepal, the Philippines, and Sri Lanka.
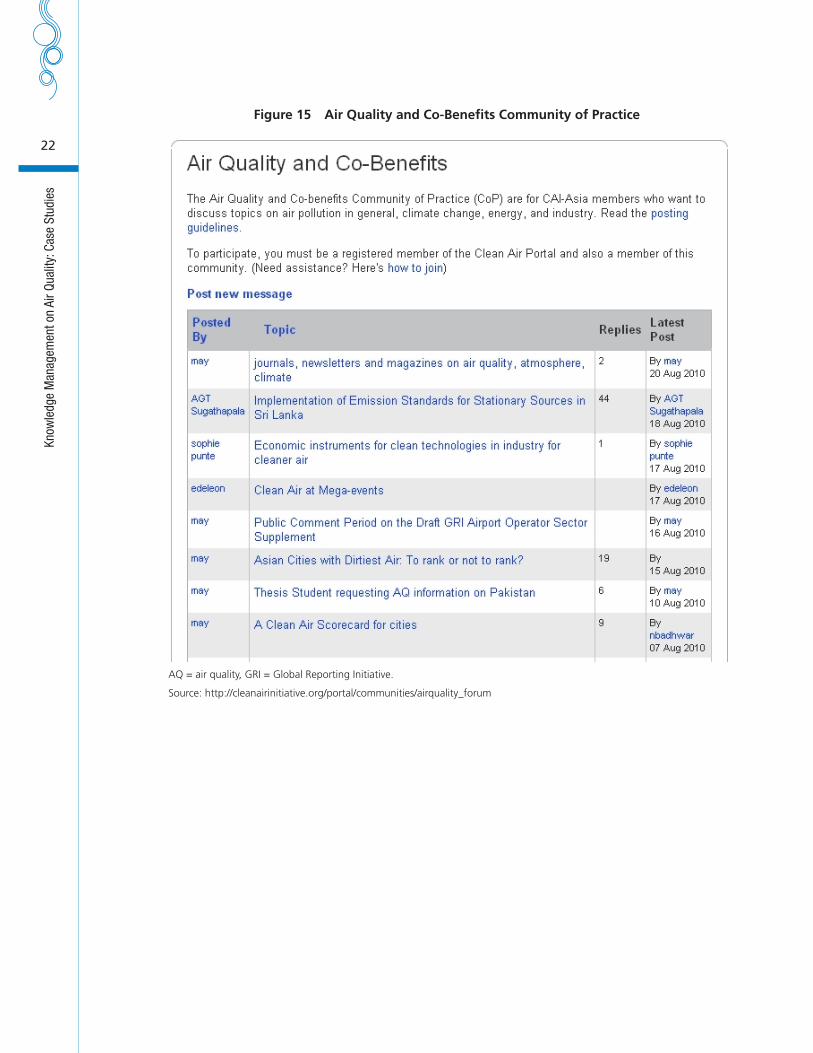
Air Quality and Co-Benefits Community of Practice
The Air Quality and Co-Benefits CoP (http:// c leanair init iat ive.org/portal/communit ies/ airquality_forum) provides a platform where ex perts and practitioners can discuss issues relat-ing to the link between air quality management and climate change. The co-benefits approach recognizes that certainmeasures to address air pol-lution may also have positive impacts on reducing greenhouse gas emissions and global warming, and vice versa.
Sustainable Transport Community of Practice
The Sustainable Transport CoP (http:// cleanairinitiative.org/portal/communities/transport _forum) allows experts and practitio-ners to discuss issues relating to transport emis-sions, environmentally sustainable transport, transport systems, technologies, nonmotorized transport, and other related transport topics.
Energy Community of Practice
In addition to these two CoPs, the Clean Air Portal allows the creation of other communities, and an energy CoP is being planned. This CoP will provide a platform to discuss energy-related topics, such as energy efficiency, clean coal tech-nology, and power plants.
Other Discussion Groups
The same platform can also be used to cre-ate smaller discussion groups. These discussion groups allow all community files to be shared through the Clean Air Portal’s Knowledgebase, as long as they are tagged by country, city, or topic. Sometimes, groups can be created to match existing topics in the Knowledgebase (e.g., the Green Freight Group was created for the “freight and logistics” topic, but also fits under the Sustainable Transport CoP).
21 See www.energyefficiencyasia.org/
22
Know
ledg
e M
anag
emen
t on
Air Q
ualit
y: C
ase
Stud
ies
AQ = air quality, GRI = Global Reporting Initiative.
Source: http://cleanairinitiative.org/portal/communities/airquality_forum
Figure 15 Air Quality and Co-Benefits Community of Practice
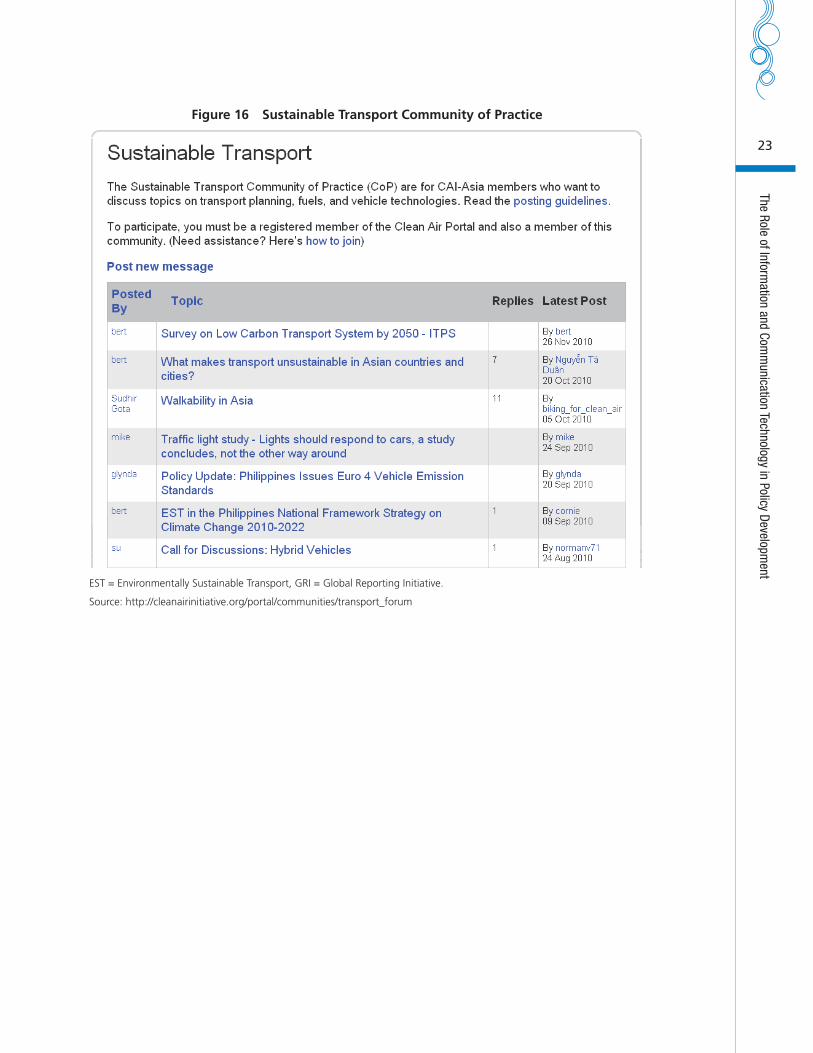
23
The Role of Information and Com
munication Technology in Policy Developm
ent
Figure 16 Sustainable Transport Community of Practice
EST = Environmentally Sustainable Transport, GRI = Global Reporting Initiative.
Source: http://cleanairinitiative.org/portal/communities/transport_forum
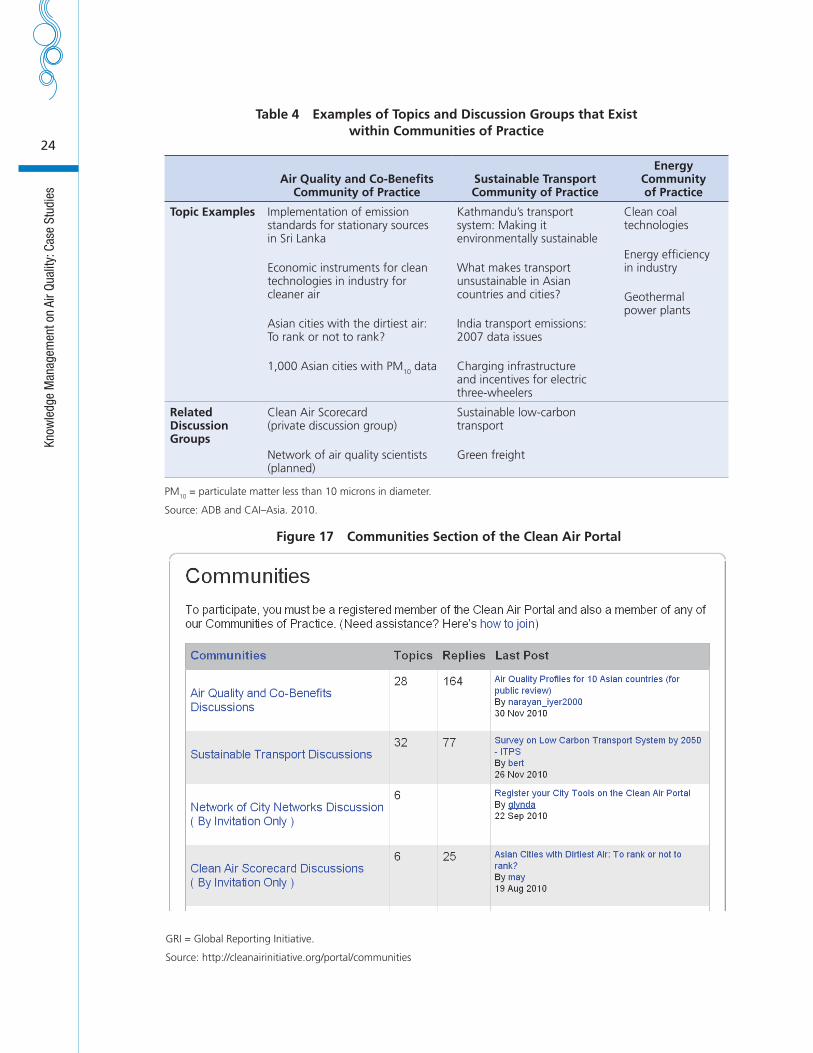
24
Know
ledg
e M
anag
emen
t on
Air Q
ualit
y: C
ase
Stud
ies
Table 4 Examples of Topics and Discussion Groups that Exist within Communities of Practice
Air Quality and Co-Benefits Community of Practice
Sustainable Transport Community of Practice
Energy Community of Practice
Topic Examples Implementation of emission standards for stationary sources in Sri Lanka
Economic instruments for clean technologies in industry for cleaner air
Asian cities with the dirtiest air: To rank or not to rank?
1,000 Asian cities with PM10 data
Kathmandu’s transport system: Making it environmentally sustainable
What makes transport unsustainable in Asian countries and cities?
India transport emissions: 2007 data issues
Charging infrastructure and incentives for electric three-wheelers
Clean coal technologies
Energy efficiency in industry
Geothermal power plants
Related Discussion Groups
Clean Air Scorecard (private discussion group)
Network of air quality scientists (planned)
Sustainable low-carbon transport
Green freight
PM10 = particulate matter less than 10 microns in diameter.
Source: ADB and CAI–Asia. 2010.
Figure 17 Communities Section of the Clean Air Portal
GRI = Global Reporting Initiative.
Source: http://cleanairinitiative.org/portal/communities
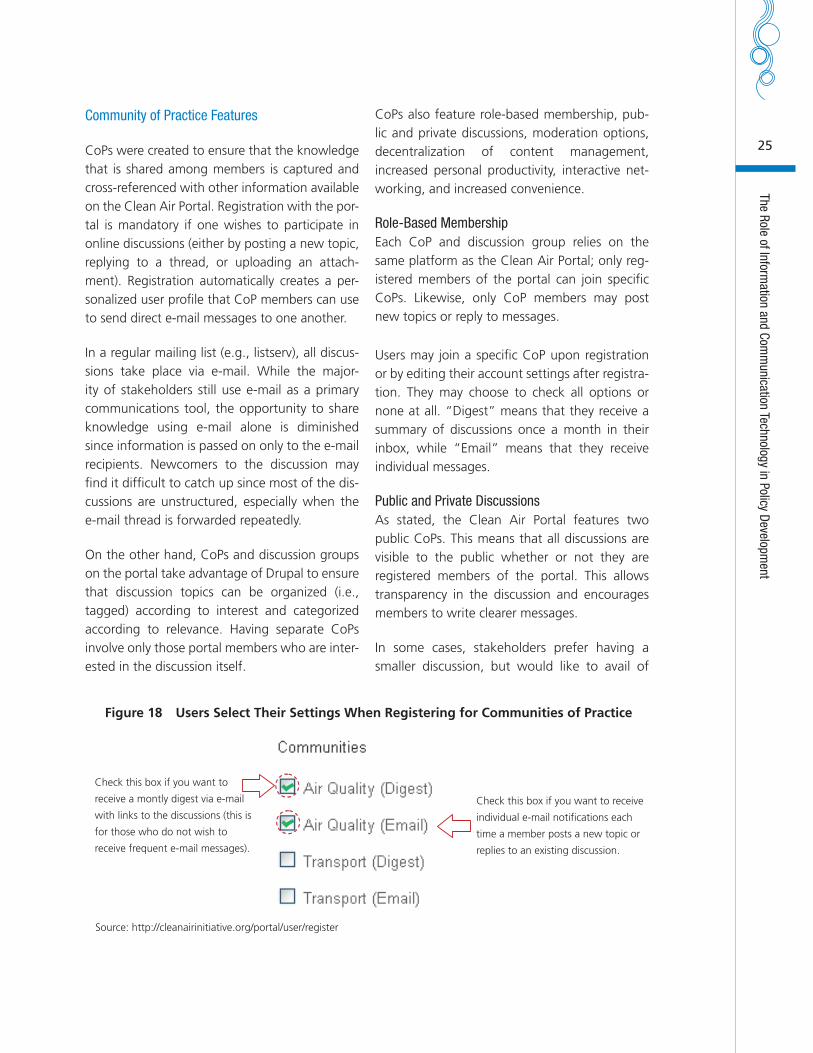
25
The Role of Information and Com
munication Technology in Policy Developm
ent
Community of Practice Features
CoPs were created to ensure that the knowledge that is shared among members is captured and cross-referenced with other information available on the Clean Air Portal. Registration with the por-tal is mandatory if one wishes to participate in online discussions (either by posting a new topic, replying to a thread, or uploading an attach-ment). Registration automatically creates a per-sonalized user profile that CoP members can use to send direct e-mail messages to one another.
In a regular mailing list (e.g., listserv), all discus-sions take place via e-mail. While the major-ity of stakeholders still use e-mail as a primary communications tool, the opportunity to share knowledge using e-mail alone is diminished since information is passed on only to the e-mail recipients. Newcomers to the discussion may find it difficult to catch up since most of the dis-cussions are unstructured, especially when the e-mail thread is forwarded repeatedly.
On the other hand, CoPs and discussion groups on the portal take advantage of Drupal to ensure that discussion topics can be organized (i.e., tagged) according to interest and categorized according to relevance. Having separate CoPs involve only those portal members who are inter-ested in the discussion itself.
Check this box if you want to
receive a montly digest via e-mail
with links to the discussions (this is
for those who do not wish to
receive frequent e-mail messages).
Check this box if you want to receive
individual e-mail notifications each
time a member posts a new topic or
replies to an existing discussion.
Figure 18 Users Select Their Settings When Registering for Communities of Practice
Source: http://cleanairinitiative.org/portal/user/register
CoPs also feature role-based membership, pub-lic and private discussions, moderation options, decentralization of content management, increased personal productivity, interactive net-working, and increased convenience.
Role-Based MembershipEach CoP and discussion group relies on the same platform as the Clean Air Portal; only reg-istered members of the portal can join specific CoPs. Likewise, only CoP members may post new topics or reply to messages.
Users may join a specific CoP upon registration or by editing their account settings after registra-tion. They may choose to check all options or none at all. “Digest” means that they receive a summary of discussions once a month in their inbox, while “Email” means that they receive individual messages.
Public and Private DiscussionsAs stated, the Clean Air Portal features two public CoPs. This means that all discussions are visible to the public whether or not they are registered members of the portal. This allows transparency in the discussion and encourages members to write clearer messages.
In some cases, stakeholders prefer having a smaller discussion, but would like to avail of
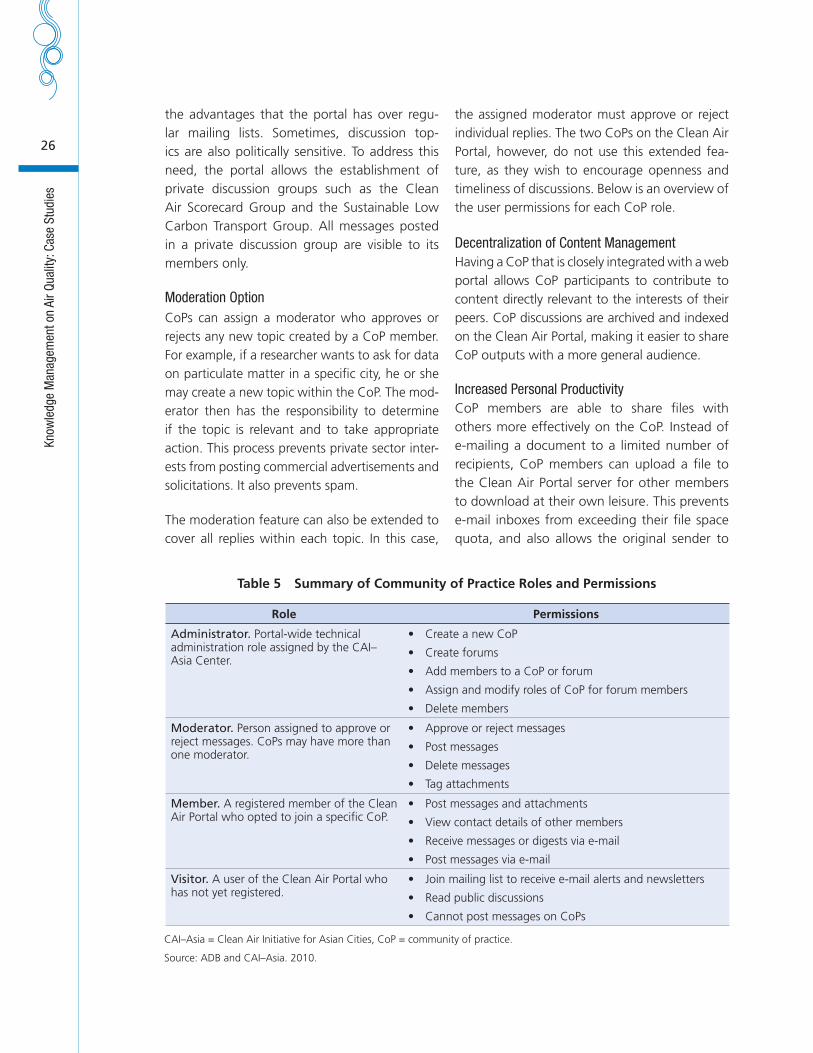
26
Know
ledg
e M
anag
emen
t on
Air Q
ualit
y: C
ase
Stud
ies
the advantages that the portal has over regu-lar mailing lists. Sometimes, discussion top-ics are also politically sensitive. To address this need, the portal allows the establishment of private discussion groups such as the Clean Air Scorecard Group and the Sustainable Low Carbon Transport Group. All messages posted in a private discussion group are visible to its members only.
Moderation OptionCoPs can assign a moderator who approves or rejects any new topic created by a CoP member. For example, if a researcher wants to ask for data on particulate matter in a specific city, he or she may create a new topic within the CoP. The mod-erator then has the responsibility to determine if the topic is relevant and to take appropriate action. This process prevents private sector inter-ests from posting commercial advertisements and solicitations. It also prevents spam.
The moderation feature can also be extended to cover all replies within each topic. In this case,
the assigned moderator must approve or reject individual replies. The two CoPs on the Clean Air Portal, however, do not use this extended fea-ture, as they wish to encourage openness and timeliness of discussions. Below is an overview of the user permissions for each CoP role.
Decentralization of Content ManagementHaving a CoP that is closely integrated with a web portal allows CoP participants to contribute to content directly relevant to the interests of their peers. CoP discussions are archived and indexed on the Clean Air Portal, making it easier to share CoP outputs with a more general audience.
Increased Personal ProductivityCoP members are able to share files with others more effectively on the CoP. Instead of e-mailing a document to a limited number of recipients, CoP members can upload a file to the Clean Air Portal server for other members to download at their own leisure. This prevents e-mail inboxes from exceeding their file space quota, and also allows the original sender to
Table 5 Summary of Community of Practice Roles and Permissions
Role Permissions
Administrator. Portal-wide technical administration role assigned by the CAI–Asia Center.
Moderator. Person assigned to approve or reject messages. CoPs may have more than one moderator.
Member. A registered member of the Clean Air Portal who opted to join a specific CoP.
Visitor. A user of the Clean Air Portal who has not yet registered.
CAI–Asia = Clean Air Initiative for Asian Cities, CoP = community of practice.
Source: ADB and CAI–Asia. 2010.
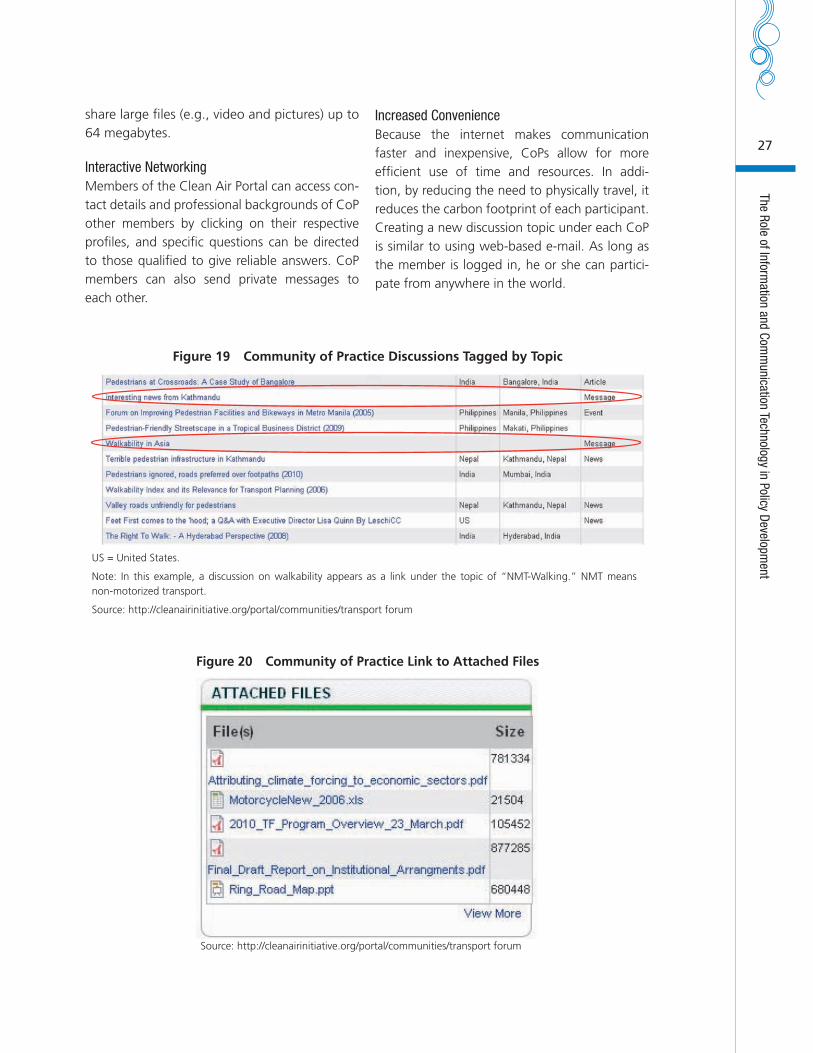
27
The Role of Information and Com
munication Technology in Policy Developm
ent
share large files (e.g., video and pictures) up to 64 megabytes.
Interactive NetworkingMembers of the Clean Air Portal can access con-tact details and professional backgrounds of CoP other members by clicking on their respective profiles, and specific questions can be directed to those qualified to give reliable answers. CoP members can also send private messages to each other.
Increased ConvenienceBecause the internet makes communication faster and inexpensive, CoPs allow for more efficient use of time and resources. In addi-tion, by reducing the need to physically travel, it reduces the carbon footprint of each participant. Creating a new discussion topic under each CoP is similar to using web-based e-mail. As long as the member is logged in, he or she can partici-pate from anywhere in the world.
Figure 19 Community of Practice Discussions Tagged by Topic
US = United States.
Note: In this example, a discussion on walkability appears as a link under the topic of “NMT-Walking.” NMT means non-motorized transport.
Source: http://cleanairinitiative.org/portal/communities/transport forum
Figure 20 Community of Practice Link to Attached Files
Source: http://cleanairinitiative.org/portal/communities/transport forum

28
Know
ledg
e M
anag
emen
t on
Air Q
ualit
y: C
ase
Stud
ies
Figure 21 List of Members of the Sustainable Transport Community of Practice
Source: http://cleanairinitiative.org/portal/communities/transport forum
Figure 22 Creation of a New Discussion Topic under a Community of Practice
Source: http://cleanairinitiative.org/portal/node/add/transport_forum? edit[taxonomy][7]=468

29
The Role of Information and Com
munication Technology in Policy Developm
ent
Using Information and Communication Technology to Strengthen Policy Development
KnowledgeAir raises several important implica-tions and recommendations that ICT has on the policy formulation and development process.
Improved participation in the policy pro-cess. The increased interaction and involve-ment of stakeholders gives them an oppor-tunity to be heard and thus to shape the final policy draft. Therefore, ICT should be institu-tionalized so that policies intend ed for public consultation or dissemination are uploaded onto a government website, in addition to print publi cation in a news paper or gazette.Shorter time frame for consultation. Stakeholder consultation is typical of a dem-ocratic process, but inherent inefficiencies in soliciting comments when consultation is done through face-to-face meetings can slow down policy formulation and develop-ment. By the time comments are solicited, it is often too late to make substantive changes to the draft policy. Therefore, ICT tools should be used whenever possible to allow for a quicker turnaround time for stakeholders to share their opinions. Increased transparency. ICT opens up the policy-making process, resulting in a greater level of trust, credibility, and support from stakeholders. While this is certainly possible (and necessary) in face-to-face consultation, ICT allows more people to be involved. A conference room may comfortably hold a dozen people, while conference halls may hold hundreds; yet a website can attract thousands, and over time, millions of view-ers. More webinars in the region should be organized so that this medium can gradually be mainstreamed. Policy makers should be encouraged to participate in public CoPs so
that the general public can be made aware of the process.
Opportunities for learning. ICT pres-ents policy makers and other stakehold-ers with the means to learn about new ideas and tools, especially in the context of strategic alliances—“cooperative agree-ments between two or more organizations” or more accurately, “a voluntary, formal arrangement between two or more parties to poll resources to achieve a common set of objectives that meet critical needs while remaining independent entities.”22 ICT appli-cations break down the cost and institutional barriers that may otherwise prevent the sharing of information among parties. Thus, learning materials should be kept online and free to download; mutual (rather than one-sided) learning opportunities should be fostered, keeping in mind the asymmetries that exist among organizations (i.e., if one organization is larger or possesses more knowledge); and e-learning modules, webi-nars, and online discussion forums should be used to encourage a culture of continuous learning and sharing among policy makers.
Strengthened links with other networks. ICT provides opportunities for policy makers to work with external stakeholders, bypass-ing rigid and formal bureaucratic structures. However, little has been written about how these networks can be used for strategic development, management, capacity build-ing, and ways to evaluate performance. Box 3 contains 10 principles of supporting networks, and some keys to success that networks need (footnote 17).
Tools for monitoring and evaluation. Online communities can benefit from feedback, and ICT can help apply tools that evaluate their effectiveness and effi-ciency. A number of tools were summa-rized in an ADB Knowledge Solutions
22 O. Serrat. 2009. Learning in Strategic Alliances. Knowledge Solutions. September. Manila: ADB. www.adb.org/documents/information/knowledge-solutions/learning-in-strategic-alliances.pdf

30
Know
ledg
e M
anag
emen
t on
Air Q
ualit
y: C
ase
Stud
ies
paper, which is available online.23 There-fore, criteria, indicators, and metrics should be implemented to assess the purpose,
performance, and future directions of the specific community or network of prac-tice as it applies to policy development.
Box 3 Supporting Networks: 10 Principles
1. Networks are complex. There are no templates for success, and one should expect setbacks.
2. Work with networks to agree on their functional balance and support that balance.
3. Interventions to develop a network cannot be conceptualized as projects driven by a logical framework; other approaches such as outcome mapping can provide a better alternative.
4. Support networks to function as networks with and through their members rather than to deliver specific services that could be delivered by their members or other types of organizations.
5. Do not treat networks as traditional nongovernment or civil society organizations, and do not allow funds to undermine community-building functions.
6. When networks carry out a funding role, ensure that they have the necessary skills and that other functions are not affected.
7. Network support time frames should consider the different stages of network development.
8. Appropriate support for the network and its members is needed to develop the right competencies and skills to collaborate.
9. A culture of knowledge and learning is a cornerstone of network development.
10. Sustainability should be judged against the need of the members of the network.
Some Keys to Success
Clear governance agreements. Networks need clear governance agreements to set objectives, identify functions, define membership structures, make decisions, and resolve conflicts.
Strength in numbers. The larger the numbers involved, the greater the political weight that will be given to networks.
Representativeness. Representativeness is one key source of legitimacy and thereby influence.
Quality of evidence. The quality of knowledge products and services affects both the credibility and legitimacy of arguments.
Packaging of evidence. Good packaging of knowledge products is central to effective communication.
Persistence. Influence often requires sustained pressure over a long period.
Membership of key individuals. The membership of influential figures in the policy arena will strengthen networks.
Making use of informal links. Informal links are critical to achieving many network objectives.
Complementing official structures. By their nature, networks add most value when they complement, rather than duplicate, official structures.
Good use of information and communication technology and other networking opportunities. Information and communication technology is opening up great potential for knowledge networking.
Sources: E. Mendizabal. 2008. Supporting Networks: Ten Principles. Overseas Development Institute Opinion. www.odi.org.uk/publications/opinions/105-enrique-mendizabal-supporting-networks.pdf; and J. Court and E. Mendizabal. 2005. Networks and Policy Influence in International Development. Euforic E-Newsletter. www.euforic.org/docs/200505241513335135.pdf
23 Footnote 17.
31
The Role of Information and Com
munication Technology in Policy Developm
ent
SWOT24 analysis, results-based manage-ment, logical framework analysis, out-come mapping,and appreciative inquiry are some techniques available for monitor-ing and evaluation.
Stakeholder ownership and awareness. Because ICT involves more people in policy formulation, there is a greater chance that the policy can be implemented. A sense of ownership will at least make it accept-able to the general public. Similarly, ICT allows issues to be discussed and debated in the public arena, raising awareness of the issues at stake, the challenges faced, and the menu of solutions available. Social networking sites, like Facebook, also give added publicity to proposed legislation, ordinances, action plans, or campaigns. ICT should be used to promote specific policies and actions, but the delivery mechanism must be carefully selected. Too much e-mail is considered spam, and uploading every campaign onto a single website may dilute other equally important activities. There is no-one-size-fits-all approach, yet the medium must fit the message.
Transfer of policy-making respon-sibilities. Perhaps the most important opportunity that ICT brings to policy development is that a new generation of policy makers can more actively par-ticipate in the policy development pro-cess along with senior policy makers. Senior policy and decision makers also have greater flexibility in delegating tasks to more junior staff members, such as browsing the web for information on poli-cies elsewhere or participating in CoPs. The transfer of knowledge and responsibilities to future policy makers should be supported. A learning culture within and among institu-tions should be encouraged by allowing the
introduction of new technologies to force policy makers and their staff to constantly innovate and improve their own work meth-ods. Constant skills improvement during policy formulation and development may require a learning curve, but the efficiency gains presented by ICT will save more time
and effort in the long term.
However, the way in which ICT influences policy making depends on the ICT delivery mechanisms that are used to share data, information, and knowledge. Four of the most popular mecha-nisms are (i) websites (e.g., the Clean Air Portal), (ii) e-mails, (iii) CoPs, and (iv) webinars, with each delivery mechanism providing increasing levels of interactivity. By conducting the three policy case studies (described in Part II of this report), the CAI–Asia Center found that the choice of technology by policy makers and stakeholders is directly proportional to their level of ICT knowledge and expertise. This is represented by Figure 23. In reality, there are inconsistencies (e.g., some users might find it easier to use e-mail than to surf certain websites).
Websites
The first ICT delivery mechanism is the internet, specifically the web. Policy makers and subject-matter specialists are increasingly using websites to do research, validate data, conduct surveys, and disseminate findings. Many have e-mail accounts that are web-based. For example, in implement-ing the Clean Air Scorecard to three Southeast Asian cities, online research helped validate some of the assumptions and datasets used.
The level of interactivity that many websites can provide users is much higher than the expertise needed to search for and/or upload content, and for this reason, the Clean Air Portal was devel-oped to provide repository of knowledge to
24 Strengths, weakness, opportunities, threats.
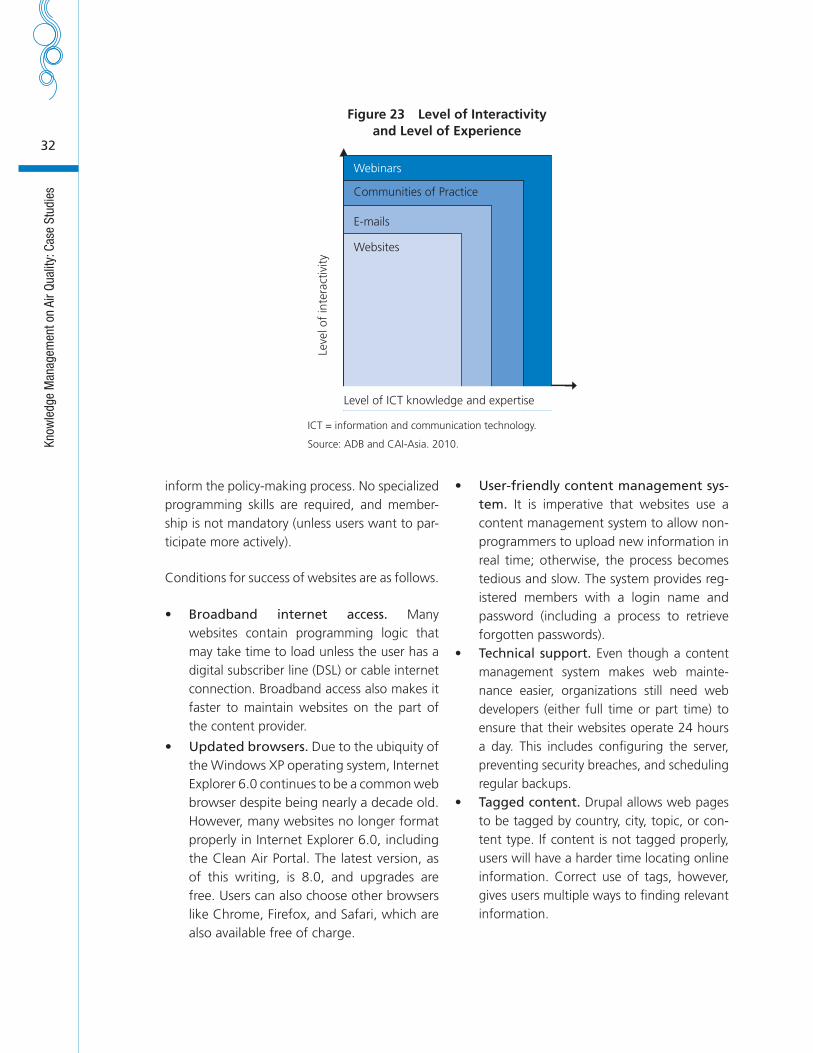
32
Know
ledg
e M
anag
emen
t on
Air Q
ualit
y: C
ase
Stud
ies
Figure 23 Level of Interactivity and Level of Experience
Leve
l of
inte
ract
ivity
Websites
E-mails
Communities of Practice
Webinars
Level of ICT knowledge and expertise
ICT = information and communication technology.
Source: ADB and CAI-Asia. 2010.
inform the policy-making process. No specialized programming skills are required, and member-ship is not mandatory (unless users want to par-ticipate more actively).
Conditions for success of websites are as follows.
Broadband internet access. Many websites contain programming logic that may take time to load unless the user has a digital subscriber line (DSL) or cable internet connection. Broadband access also makes it faster to maintain websites on the part of the content provider.
Updated browsers. Due to the ubiquity of the Windows XP operating system, Internet Explorer 6.0 continues to be a common web browser despite being nearly a decade old. However, many websites no longer format properly in Internet Explorer 6.0, including the Clean Air Portal. The latest version, as of this writing, is 8.0, and upgrades are free. Users can also choose other browsers like Chrome, Firefox, and Safari, which are also available free of charge.
User-friendly content management sys-tem. It is imperative that websites use a content management system to allow non-programmers to upload new information in real time; otherwise, the process becomes tedious and slow. The system provides reg-istered members with a login name and password (including a process to retrieve forgotten passwords).Technical support. Even though a content management system makes web mainte-nance easier, organizations still need web developers (either full time or part time) to ensure that their websites operate 24 hours a day. This includes configuring the server, preventing security breaches, and scheduling regular backups.Tagged content. Drupal allows web pages to be tagged by country, city, topic, or con-tent type. If content is not tagged properly, users will have a harder time locating online information. Correct use of tags, however, gives users multiple ways to finding relevant information.
33
The Role of Information and Com
munication Technology in Policy Developm
ent
E-Mails
The second ICT delivery mechanism is e-mail. As
everyone is well aware, e-mail has dramatically
changed how people communicate. E-mail
makes policy drafts easy to receive, comment
upon, and forward to colleagues and stake-
holders. All policy makers have an e-mail address
(e.g., work e-mail or web-based e-mail like
Yahoo! or Gmail). A growing number access
e-mail through BlackBerrys or other smartphones,
allowing the possibility of direct and immediate
communication. In the vast majority of cases,
e-mail is the primary medium of communication
among policy makers, so much so that it is
difficult to introduce them to more sophisticated
ICT mechanisms like CoPs and webinars. At
the same time, however, e-mail makes it easier
to announce and promote these other delivery
mechanisms. For example, the CAI–Asia listserv,
which still has over 1,000 members, has standard
text automatically appended at the beginning of
each message to encourage members to register
at the Clean Air Portal.
Conditions for success of the use of e-mails are as follows.
Relevant subject lines. Reading e-mail can be very time-consuming, so it helps the recipient if subject lines are short and rele-vant. Sometimes, it is a good idea to retain subject lines to keep discussions together in a single “conversation,” which is how Gmail categorizes e-mail threads.Spam filters. E-mail addresses are almost impossible to keep private, allowing the pos-
sibility for unscrupulous online mar keters to harvest e-mail addresses, add them to their mailing lists, and send out unsolicited e-mails. Policy makers should take advan-tage of spam filters to prevent them from receiving unwanted e-mail. Many web-based e-mail accounts have built-in spam filters.Deletion of long threads before forward-ing to others. Because e-mail makes it so simple to forward discussions to colleagues, it often becomes difficult to read through very long discussion threads. Policy makers, especially, often do not have the time to read through a long thread history. Senders should make sure to delete those sections that are no longer relevant to the discussion. Furthermore, deleting the older threads pre-vents e-mail addresses of earlier recipients from being exposed to potential spammers.
Clearing inboxes. When an inbox is full (i.e., exceeds the e-mail quota), all future e-mails to that address will bounce. Policy makers need to be responsible for keeping their inboxes clutter-free.
Communities of Practice
The third ICT delivery mechanism is CoPs. The term “communities of practice” was first popu-larized in 1991 by Jean Lave and Etienne Wenger in their paper “Situated Learning: Legitimate Peripheral Participation.” Wenger would later define CoPs as “groups of people who share a concern or a passion for something they do and learn how to do it better as they interact regularly.”
Not all communities and networks can be called a CoP. According to Wenger, three characteristics are crucial:25
25 E. Wenger. 2006. Communities of Practice: A Brief Introduction. www.ewenger.com/theory/communities_of_practice_intro.htm

34
Know
ledg
e M
anag
emen
t on
Air Q
ualit
y: C
ase
Stud
ies
Domain. A CoP is not merely a club of friends or a network of connections between people. It has an identity defined by a shared domain of interest. Membership therefore implies a commitment to the domain, and therefore a shared competence that distin-guishes members from other people. Community. In pursuing their interest in their domain, members engage in joint activities and discussions, help each other, and share information. They build relation-ships that enable them to learn from each other. A website in itself is not a CoP. Practice. A CoP is not merely a community of interest, such as people who like certain kinds of movies. Members of a CoP are prac-titioners. They develop a shared repertoire of resources—experiences, stories, tools, ways of addressing recurring problems—in short, a shared practice. This takes time and sus-tained interaction.
ADB expanded Wenger’s definition to six: struc-ture, domain, community, mandate, motivation, and practice.26
Structure. This is the balance of formal and informal relationships. Hierarchy is not an important element to CoPs. Most CoPs cross-link organizational units and organizations.Domain. This is the definition of the area of shared inquiry (thematic orientation) and of the key issues that relate to it.Community. These are the relationships among active members and the sense of belonging that these give them.Mandate. This is the priority that manage-ment ascribes to the CoP, with resource implications. It defines the thematic focus and the expected results. It opens the space for self-commitment by members.Motivation. This is the personal interest and priority that members assign to the CoP in their daily work.
Practice. This is the body of information and knowledge, e.g., methods, stories, cases, tools, documents, and associated know-how. Each member has a practice in the domain, which other members recognize.
An online community is a group of people that share a common interest and use various internet-enabled media such as e-mail news-letters, newsgroups, web forums, and other applications; and communicate and interact pri-marily through for social, professional, or educa-tional purposes. Online communities represent a broad range of subject areas from people inter-ested in gardening and programmers develop-ing public domain software, to environmental and political lobbyists. Online communities have also become a supplemental form of communi-cation and collaboration for groups who interact offline in real time. Regardless of the diversity, a common feature of all online communities is the facility for members to communicate and share information through an interactive forum. The method of interaction is largely based on the needs of the users and the specific purpose of the community.
CoPs, on the other hand, are a specific kind of community—they are focused on a specific knowl-edge domain or discipline, with a membership of credible experts and practitioners. Most online communities focus on the social interaction, but CoPs are more goal-oriented. These members share knowledge and information, learn from each other, and usually work toward a defined purpose (e.g., research, policy making, technol-ogy development). The mission and expected results of each CoP vary depending on the group’s domain, process, or practice. However, they all provide a venue for interaction that shares com-mon value-contributing characteristics.
Unlike e-mail, CoPs allow more visible and transparent policy discussions to take place.
26 O. Serrat. 2009. Cultivating the Communities of Practice Hosted by ADB. www.adb.org/Documents/Presentations/Cultivating-CoPs.pdf

35
The Role of Information and Com
munication Technology in Policy Developm
ent
CoPs allow issues to be raised by people who are traditionally not associated with the policy-making process, such as newly established non-government organizations, competing private sector firms, the media, or people no longer associated with the policy-making process. For example, a recently retired government offi-cial from the Philippines was willing to share her knowledge on air quality and greenhouse gas management in Manila, which was made easier because there are less restrictions or sensi-tivities to worry about. This gives a more dynamic and open sharing of experiences. Discussions are free, documents can be uploaded and shared, and CoPs can co-exist with other discussion forums.
CoPs permit comments to be given early enough in the policy-making process, increas-ing the likelihood that these comments will be considered in the final version of the policy. It is estimated that the time frame for soliciting and receiving comments is three times faster via online CoP discussion than by traditional face-to-face public consultations (e.g., 1 month versus 3 months). Online CoPs also give interna-tional observers an opportunity to share experi-ences without having to travel overseas.
Online CoPs do not replace face-to-face meet-ings, nor are they intended to. On the con-trary, online CoP discussions have created a demand for subsequent face-to-face interaction. For example, a member of the Air Quality and Co-Benefits CoP, who happened to be an engi-neer with the Institution of Engineers, Sri Lanka, was actively involved with the discussions on sta-tionary source regulation. Then, he invited the CoP facilitator to deliver a public lecture on pro-posed emission standards for stationary sources.
Conditions for success of CoPs for policy devel-opment support are as follows.
Facilitated discussions. Experience from the three policy case studies in the next part has shown that CoP policy discussions are
only effective if there is a person assigned to facilitate the discussion. The facilitator is responsible for providing a background to the issue, posting guide questions, and summarizing discussions. The facilitator is also responsible for encouraging the stake-holder community to join the particular CoP. Often, the facilitator will repost e-mail messages that were sent to other online forums and listservs.
Private discussion groups. There are cases when a smaller working group is necessary for policy development. These discussion groups can either be public or private, but KnowledgeAir found that the demand for private discussion groups is more common than public groups. The reason is that some people will communicate more openly if the discussion is not shared with the general public. This was the case with government representatives who took part in the Clean Air Scorecard application to their capital cities.
Framing discussions in a broader con-text. CoP discussions can become a chaotic affair if facilitators do not keep discussions on topic. More importantly, however, is the need to relate how discussions fit into the overall policy-making process. Then, CoP members can see the immediate impact that the discussion will have, and be encouraged to share their ideas more often.
Active members. The success and sus-tainability of CoPs depend on how active and committed the participants are. While 100% active participation is ideal, it is sufficient that a CoP can encourage a core group of members, with different points of view, to discuss and share information regularly. As long as discussions are ongo-ing, less active members might decide to participate at some point.
Adequate funding. While setting up an online CoP is relatively inexpensive, main-taining one requires funding. Depending on how long the members plan to keep a CoP
36
Know
ledg
e M
anag
emen
t on
Air Q
ualit
y: C
ase
Stud
ies
running, sufficient budget needs to be allo-cated to pay for server and technical support for at least several years.
ADB has also identified a number of specific fac-tors that characterize successful CoPs: strategic relevance; direct relevance to actual work; experts involved as members; relevant activities, with the right rhythm and mix; governance (i.e., there are clear roles and expectations); a dedi-cated, passionate, skillful, and well-respected coordinator; a consistent attitude to sharing and collaboration; a desire to participate; an organi-zational environment that supports participation; an appropriate medium of communication that adds value and helps deliver work programs; members encouraged to participate; communi-cation, trust, rapport, and a true sense of com-munity fostered through longevity; and a mea-surement mechanism to ensure success.27
Webinars
The fourth ICT delivery mechanism is the webi-nar; it is also the most interactive technology tested under the policy case studies. Webinars are like seminars except that the speaker delivers the presentation entirely online to a remote audi-ence using special software, like GoToWebinar (www.gotowebinar.com). Interaction is a two-way process, just like in a face-to-face seminar, and voice communication is fully supported via voice over internet protocol (VoIP) or telephone. Speakers have full control over the delivery of their PowerPoint presentation, and questions and answers are fully documented in writing via chat. The entire session can also be recorded and played back for the benefit of policy makers who were not able to attend the live session. Webinars are especially useful in cases where a draft policy document is being reviewed, as changes can be made to the document in real time, in full view of all the participants.
The most compelling reason to hold a webi-nar, however, is the tremendous cost savings compared to an international seminar or work-shop. Even if one assumes that the venue is free and meals are covered, the only variable cost of holding a webinar is the webinar software (Table 6).
Conditions for success of webinars are as follows.
Broadband internet access. Webinars re-quire a fast, reliable internet connection to work effectively. The software itself uses Java (a cross-platform programming lan-guage), and this requires installing a special plug-in, which is not an issue if the internet connection is good. Because broadband ac-cess is still limited in many developing Asian cities, it is recommended that participants physically gather themselves in a common room (e.g., conference room) with a com-puter, speaker, broadband internet access, and an LCD projector. Participants with a fast internet connection, however, can still choose to join webinars from the privacy of their homes.Training for facilitators. Conducting a webinar for an audience gathered in one room will require a facilitator. Although the software is intuitive and easy to use, there is still a learning curve for those who have never participated in a webinar before. Training for the facilitators is important in the days preceding the actual webinar ses-sion. It also ensures that the software is properly installed and tested.Audio without video. Experience has shown that bandwidth limitations prevent webinars from seamlessly delivering video and audio together. Even in North America, where residential broadband penetra-tion rates are quite high, video quality can suffer when PowerPoint presentation files
27 O. Serrat. 2008. Building Communities of Practice. Knowledge Solutions. October. Manila: ADB. www.adb.org/documents/information/knowledge-solutions/building-communities-practice.pdf
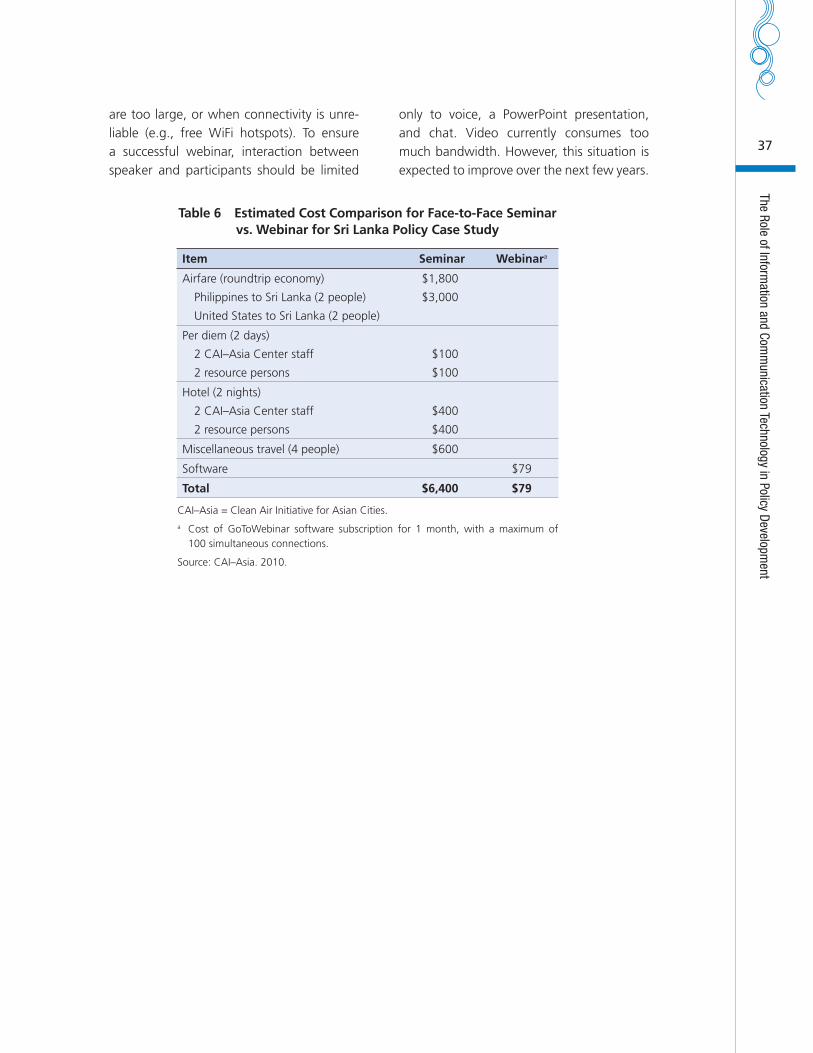
37
The Role of Information and Com
munication Technology in Policy Developm
ent
only to voice, a PowerPoint presentation, and chat. Video currently consumes too much bandwidth. However, this situation is expected to improve over the next few years.
are too large, or when connectivity is unre-liable (e.g., free WiFi hotspots). To ensure a successful webinar, interaction between speaker and participants should be limited
Item Seminar Webinara
Airfare (roundtrip economy)
Philippines to Sri Lanka (2 people)
United States to Sri Lanka (2 people)
$1,800
$3,000
Per diem (2 days)
2 CAI–Asia Center staff
2 resource persons
$100
$100
Hotel (2 nights)
2 CAI–Asia Center staff
2 resource persons
$400
$400
Miscellaneous travel (4 people) $600
Software $79
Total $6,400 $79
Table 6 Estimated Cost Comparison for Face-to-Face Seminar vs. Webinar for Sri Lanka Policy Case Study
CAI–Asia = Clean Air Initiative for Asian Cities.a Cost of GoToWebinar software subscription for 1 month, with a maximum of
100 simultaneous connections.
Source: CAI–Asia. 2010.
38Policy Case Studies
Subregional Case Study: Clean Air Scorecard for Bangkok, Thailand; Jakarta, Indonesia; and Manila, Philippines
This section presents the results of a sub-regional case study that was conducted for Southeast Asia, involving Bangkok,
Thailand; Jakarta, Indonesia; and Manila, Philippines. As part of the case study, the Clean Air Scorecard was applied to these three capital cities to identify strengths and gaps in air pollu-tion levels, management of air quality and climate change, and policies and measures to reduce air pollution and greenhouse gas emissions.
Challenges in Reducing Air Pollution and Greenhouse Gas Emissions
Rapidly developing cities in Asia are often at the center of economic, political, and sometimes cultural and educational activities of a country. Their uncontrolled population and motorization growth, however, has led to air pollution con-cerns, among other environmental and social challenges. This, in turn, impacts their livability and prospect for global business. In Hong Kong, China, for instance, a considerable number of residents and expatriates have either left or are considering leaving the city because of poor air quality.28
A challenge to addressing air pollution in these cities is territorial jurisdiction. Many now have urban centers sprawling outward, creating new
urbanized districts and even new cities that fur-ther contribute to the air pollution. With the onset of climate change issues in recent years, there has also increasing global pressure for Asian cities to reduce their greenhouse gas emissions on top of addressing local air pollution issues. In addition, reducing short-lived pollutants like ozone and black carbon provide immediate cli-mate benefits, and their combined climate forc-ing may outweigh that of carbon dioxide over the next decades.
Rather than addressing each issue separately, cities have the opportunity to integrate air quality management and climate change mitigation efforts, given that air pollutants and greenhouse gases are generally emitted from same sources. As such, policy or techno-logical solutions often overlap. A co-benefits approach to these two issues can maximize benefits and potentially reduce costs compared to treating air pollutants and greenhouse gases in isolation.
A rapidly urbanizing city should always assess the state of its air quality and determine the most effective measures available to reduce emissions of air pollutants and greenhouse gases. Objective assessments are important in policy making, as these determine needed policies and also assist in evaluating the effectiveness of measures. If cities within a country or a region make use of similar assessment methods and tools, this will also create a platform for exchange of learning and experience among them.
28 M&C. 2010. One Third of Parents Consider Leaving Hong Kong over Air Pollution. 6 May. www.monstersandcritics.com/news/health/news/article_1553637.php/One-third-of-parents-consider-leaving-Hong-Kong-over-air-pollution; and Channel News Asia. 2009. 1 in 5 Considering Leaving Hong Kong due to Pollution, According to Survey. 5 January. www .channelnewsasia.com/stories/afp_asiapacific/view/400365/1/.html
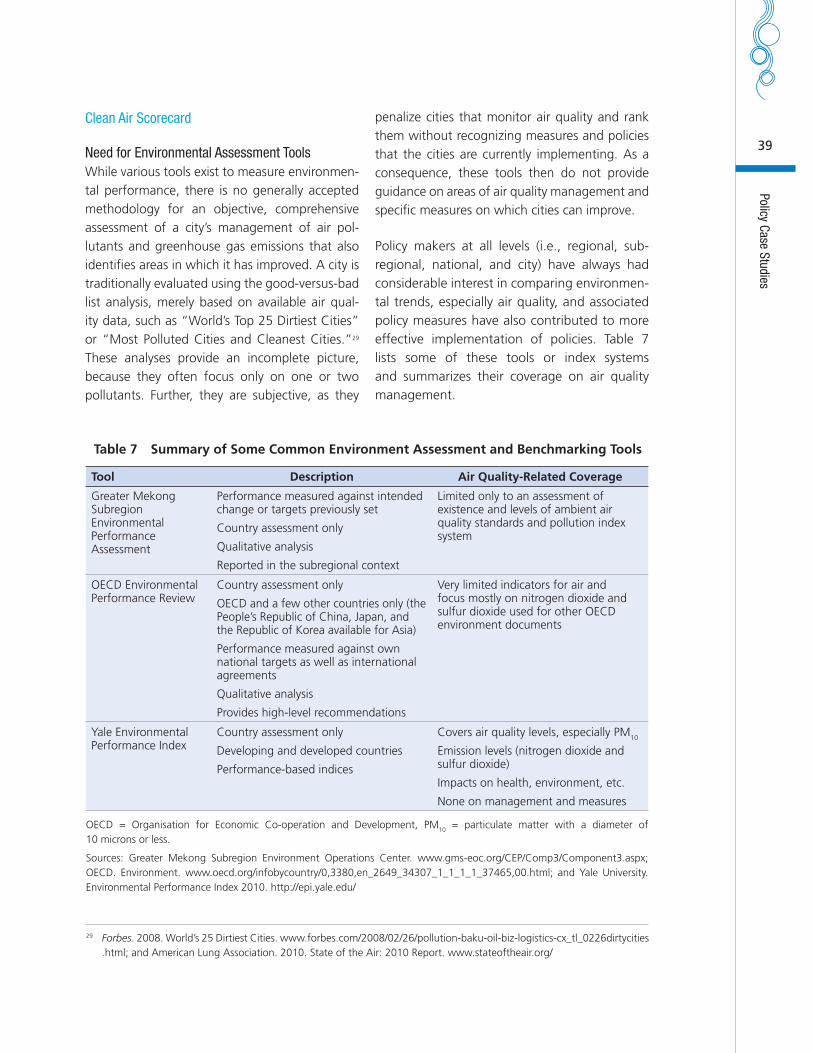
39
Policy Case Studies
Clean Air Scorecard
Need for Environmental Assessment ToolsWhile various tools exist to measure environmen-tal performance, there is no generally accepted methodology for an objective, comprehensive assessment of a city’s management of air pol-lutants and greenhouse gas emissions that also identifies areas in which it has improved. A city is traditionally evaluated using the good-versus-bad list analysis, merely based on available air qual-ity data, such as “World’s Top 25 Dirtiest Cities” or “Most Polluted Cities and Cleanest Cities.”29
These analyses provide an incomplete picture, because they often focus only on one or two pollutants. Further, they are subjective, as they
penalize cities that monitor air quality and rank them without recognizing measures and policies that the cities are currently implementing. As a consequence, these tools then do not provide guidance on areas of air quality management and specific measures on which cities can improve.
Policy makers at all levels (i.e., regional, sub-regional, national, and city) have always had considerable interest in comparing environmen-tal trends, especially air quality, and associated policy measures have also contributed to more effective implementation of policies. Table 7 lists some of these tools or index systems and summarizes their coverage on air quality management.
Table 7 Summary of Some Common Environment Assessment and Benchmarking Tools
Tool Description Air Quality-Related Coverage
Greater Mekong Subregion Environmental Performance Assessment
Performance measured against intended change or targets previously set
Country assessment only
Qualitative analysis
Reported in the subregional context
Limited only to an assessment of existence and levels of ambient air quality standards and pollution index system
OECD Environmental Performance Review
Country assessment only
OECD and a few other countries only (the People’s Republic of China, Japan, and the Republic of Korea available for Asia)
Performance measured against own national targets as well as international agreements
Qualitative analysis
Provides high-level recommendations
Very limited indicators for air and focus mostly on nitrogen dioxide and sulfur dioxide used for other OECD environment documents
Yale Environmental Performance Index
Country assessment only
Developing and developed countries
Performance-based indices
Covers air quality levels, especially PM10
Emission levels (nitrogen dioxide and sulfur dioxide)
Impacts on health, environment, etc.
None on management and measures
OECD = Organisation for Economic Co-operation and Development, PM10 = particulate matter with a diameter of 10 microns or less.
Sources: Greater Mekong Subregion Environment Operations Center. www.gms-eoc.org/CEP/Comp3/Component3.aspx; OECD. Environment. www.oecd.org/infobycountry/0,3380,en_2649_34307_1_1_1_1_37465,00.html; and Yale University. Environmental Performance Index 2010. http://epi.yale.edu/
29 Forbes. 2008. World’s 25 Dirtiest Cities. www.forbes.com/2008/02/26/pollution-baku-oil-biz-logistics-cx_tl_0226dirtycities.html; and American Lung Association. 2010. State of the Air: 2010 Report. www.stateoftheair.org/
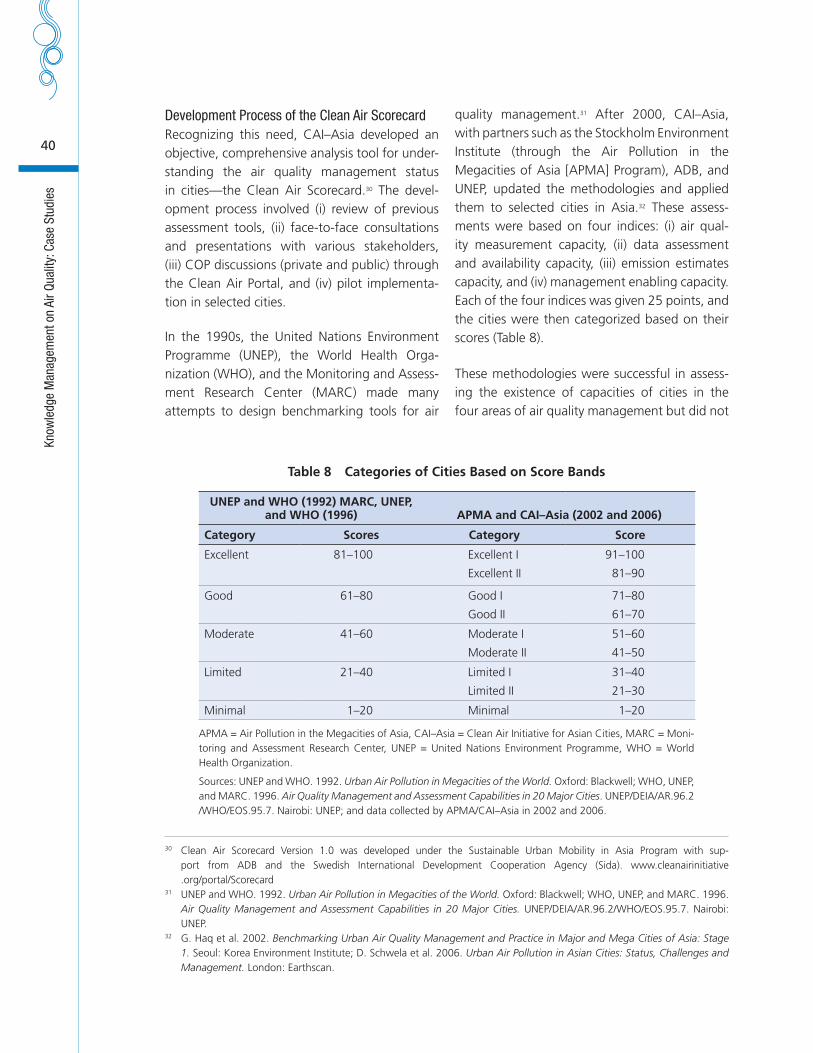
40
Know
ledg
e M
anag
emen
t on
Air Q
ualit
y: C
ase
Stud
ies
Development Process of the Clean Air ScorecardRecognizing this need, CAI–Asia developed an objective, comprehensive analysis tool for under-standing the air quality management status in cities—the Clean Air Scorecard.30 The devel-opment process involved (i) review of previous assessment tools, (ii) face-to-face consultations and presentations with various stakeholders, (iii) COP discussions (private and public) through the Clean Air Portal, and (iv) pilot implementa-tion in selected cities.
In the 1990s, the United Nations Environment Programme (UNEP), the World Health Orga-nization (WHO), and the Monitoring and Assess-ment Research Center (MARC) made many attempts to design benchmarking tools for air
quality management.31 After 2000, CAI–Asia, with partners such as the Stockholm Environment Institute (through the Air Pollution in the Megacities of Asia [APMA] Program), ADB, and UNEP, updated the methodologies and applied them to selected cities in Asia.32 These assess-ments were based on four indices: (i) air qual-ity measurement capacity, (ii) data assessment and availability capacity, (iii) emission estimates capacity, and (iv) management enabling capacity. Each of the four indices was given 25 points, and the cities were then categorized based on their scores (Table 8).
These methodologies were successful in assess-ing the existence of capacities of cities in the four areas of air quality management but did not
Table 8 Categories of Cities Based on Score Bands
UNEP and WHO (1992) MARC, UNEP, and WHO (1996)
APMA and CAI–Asia (2002 and 2006)
Category Scores Category Score
Excellent 81–100 Excellent I
Excellent II
91–100
81–90
Good 61–80 Good I
Good II
71–80
61–70
Moderate 41–60 Moderate I
Moderate II
51–60
41–50
Limited 21–40 Limited I
Limited II
31–40
21–30
Minimal 1–20 Minimal 1–20
APMA = Air Pollution in the Megacities of Asia, CAI–Asia = Clean Air Initiative for Asian Cities, MARC = Moni-toring and Assessment Research Center, UNEP = United Nations Environment Programme, WHO = World Health Organization.
Sources: UNEP and WHO. 1992. Urban Air Pollution in Megacities of the World. Oxford: Blackwell; WHO, UNEP, and MARC. 1996. Air Quality Management and Assessment Capabilities in 20 Major Cities. UNEP/DEIA/AR.96.2/WHO/EOS.95.7. Nairobi: UNEP; and data collected by APMA/CAI–Asia in 2002 and 2006.
30 Clean Air Scorecard Version 1.0 was developed under the Sustainable Urban Mobility in Asia Program with sup-port from ADB and the Swedish International Development Cooperation Agency (Sida). www.cleanairinitiative .org/portal/Scorecard
31 UNEP and WHO. 1992. Urban Air Pollution in Megacities of the World. Oxford: Blackwell; WHO, UNEP, and MARC. 1996. Air Quality Management and Assessment Capabilities in 20 Major Cities. UNEP/DEIA/AR.96.2/WHO/EOS.95.7. Nairobi: UNEP.
32 G. Haq et al. 2002. Benchmarking Urban Air Quality Management and Practice in Major and Mega Cities of Asia: Stage 1. Seoul: Korea Environment Institute; D. Schwela et al. 2006. Urban Air Pollution in Asian Cities: Status, Challenges and Management. London: Earthscan.
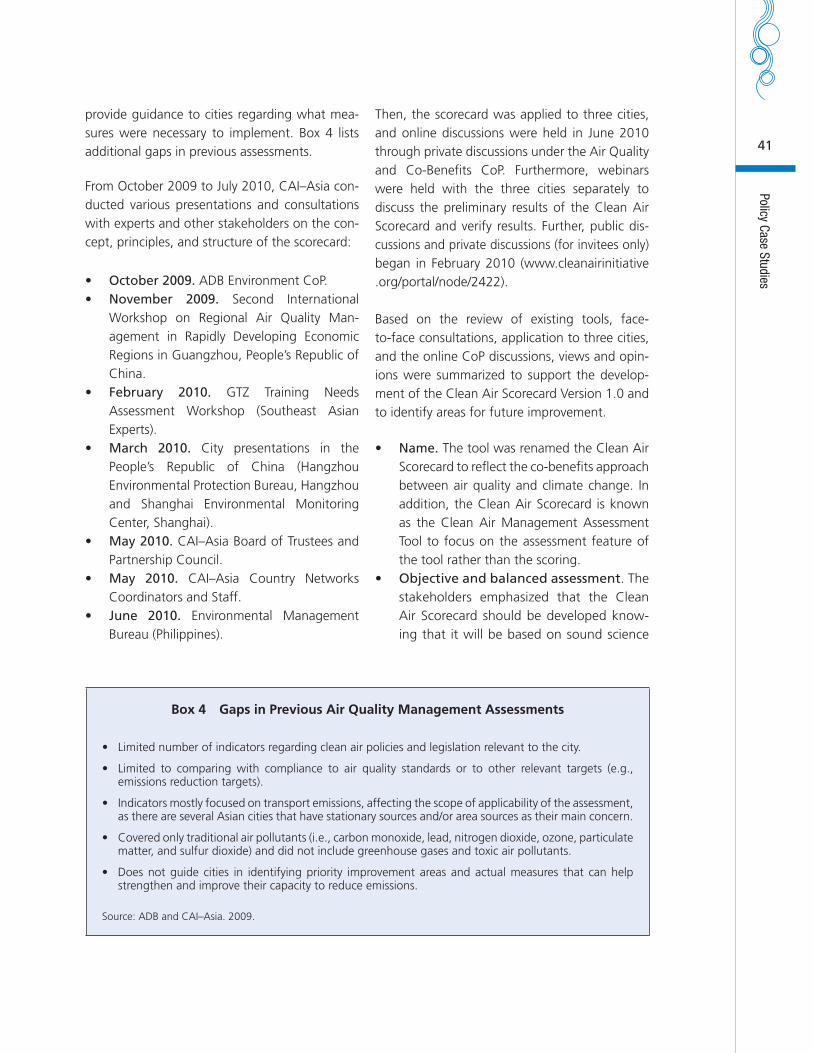
41
Policy Case Studies
provide guidance to cities regarding what mea- sures were necessary to implement. Box 4 lists additional gaps in previous assessments.
From October 2009 to July 2010, CAI–Asia con-ducted various presentations and consultations with experts and other stakeholders on the con-cept, principles, and structure of the scorecard:
October 2009. ADB Environment CoP.November 2009. Second International Workshop on Regional Air Quality Man-agement in Rapidly Developing Economic Regions in Guangzhou, People’s Republic of China.February 2010. GTZ Training Needs Assessment Workshop (Southeast Asian Experts).March 2010. City presentations in the People’s Republic of China (Hangzhou Environmental Protection Bureau, Hangzhou and Shanghai Environmental Monitoring Center, Shanghai).May 2010. CAI–Asia Board of Trustees and Partnership Council.May 2010. CAI–Asia Country Networks Coordinators and Staff.June 2010. Environmental Management Bureau (Philippines).
Then, the scorecard was applied to three cities, and online discussions were held in June 2010 through private discussions under the Air Quality and Co-Benefits CoP. Furthermore, webinars were held with the three cities separately to discuss the preliminary results of the Clean Air Scorecard and verify results. Further, public dis-cussions and private discussions (for invitees only) began in February 2010 (www.cleanairinitiative .org/portal/node/2422).
Based on the review of existing tools, face- to-face consultations, application to three cities, and the online CoP discussions, views and opin-ions were summarized to support the develop-ment of the Clean Air Scorecard Version 1.0 and to identify areas for future improvement.
Name. The tool was renamed the Clean Air Scorecard to reflect the co-benefits approach between air quality and climate change. In addition, the Clean Air Scorecard is known as the Clean Air Management Assessment Tool to focus on the assessment feature of the tool rather than the scoring. Objective and balanced assessment. The stakeholders emphasized that the Clean Air Scorecard should be developed know-ing that it will be based on sound science
Box 4 Gaps in Previous Air Quality Management Assessments
emissions reduction targets).
as there are several Asian cities that have stationary sources and/or area sources as their main concern.
matter, and sulfur dioxide) and did not include greenhouse gases and toxic air pollutants.
strengthen and improve their capacity to reduce emissions.
Source: ADB and CAI–Asia. 2009.
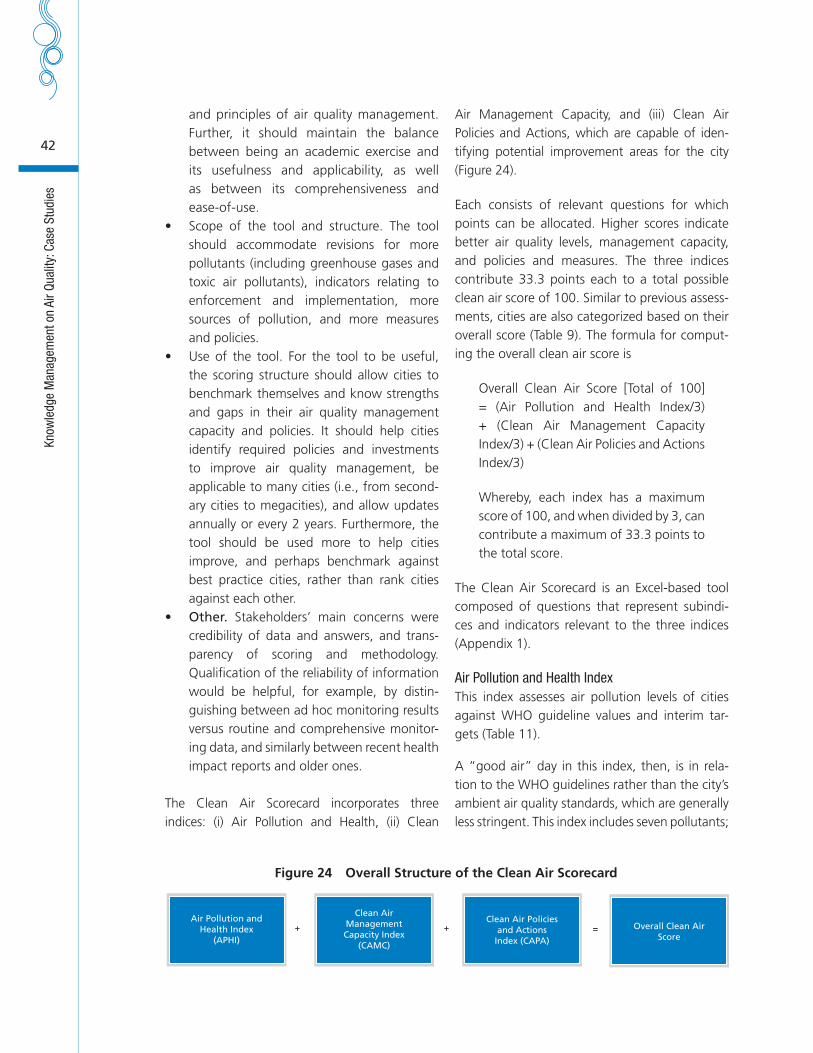
42
Know
ledg
e M
anag
emen
t on
Air Q
ualit
y: C
ase
Stud
ies
and principles of air quality management. Further, it should maintain the balance between being an academic exercise and its usefulness and applicability, as well as between its comprehensiveness and ease-of-use. Scope of the tool and structure. The tool should accommodate revisions for more pollutants (including greenhouse gases and toxic air pollutants), indicators relating to enforcement and implementation, more sources of pollution, and more measures and policies.Use of the tool. For the tool to be useful, the scoring structure should allow cities to benchmark themselves and know strengths and gaps in their air quality management capacity and policies. It should help cities identify required policies and investments to improve air quality management, be applicable to many cities (i.e., from second-ary cities to megacities), and allow updates annually or every 2 years. Furthermore, the tool should be used more to help cities improve, and perhaps benchmark against best practice cities, rather than rank cities against each other. Other. Stakeholders’ main concerns were credibility of data and answers, and trans-parency of scoring and methodology. Qualification of the reliability of information would be helpful, for example, by distin-guishing between ad hoc monitoring results versus routine and comprehensive monitor-ing data, and similarly between recent health impact reports and older ones.
The Clean Air Scorecard incorporates three indices: (i) Air Pollution and Health, (ii) Clean
Air Management Capacity, and (iii) Clean Air Policies and Actions, which are capable of iden-tifying potential improvement areas for the city (Figure 24).
Each consists of relevant questions for which points can be allocated. Higher scores indicate better air quality levels, management capacity, and policies and measures. The three indices contribute 33.3 points each to a total possible clean air score of 100. Similar to previous assess-ments, cities are also categorized based on their overall score (Table 9). The formula for comput-ing the overall clean air score is
Overall Clean Air Score [Total of 100] = (Air Pollution and Health Index/3) + (Clean Air Management Capacity Index/3) + (Clean Air Policies and Actions Index/3)
Whereby, each index has a maximum score of 100, and when divided by 3, can contribute a maximum of 33.3 points to the total score.
The Clean Air Scorecard is an Excel-based tool composed of questions that represent subindi-ces and indicators relevant to the three indices (Appendix 1).
Air Pollution and Health IndexThis index assesses air pollution levels of cities against WHO guideline values and interim tar-gets (Table 11).
A “good air” day in this index, then, is in rela-tion to the WHO guidelines rather than the city’s ambient air quality standards, which are generally less stringent. This index includes seven pollutants;
Figure 24 Overall Structure of the Clean Air Scorecard
Air Pollution and Health Index
(APHI)+
Clean AirManagementCapacity Index
(CAMC)
+Clean Air Policies
and ActionsIndex (CAPA)
= Overall Clean AirScore
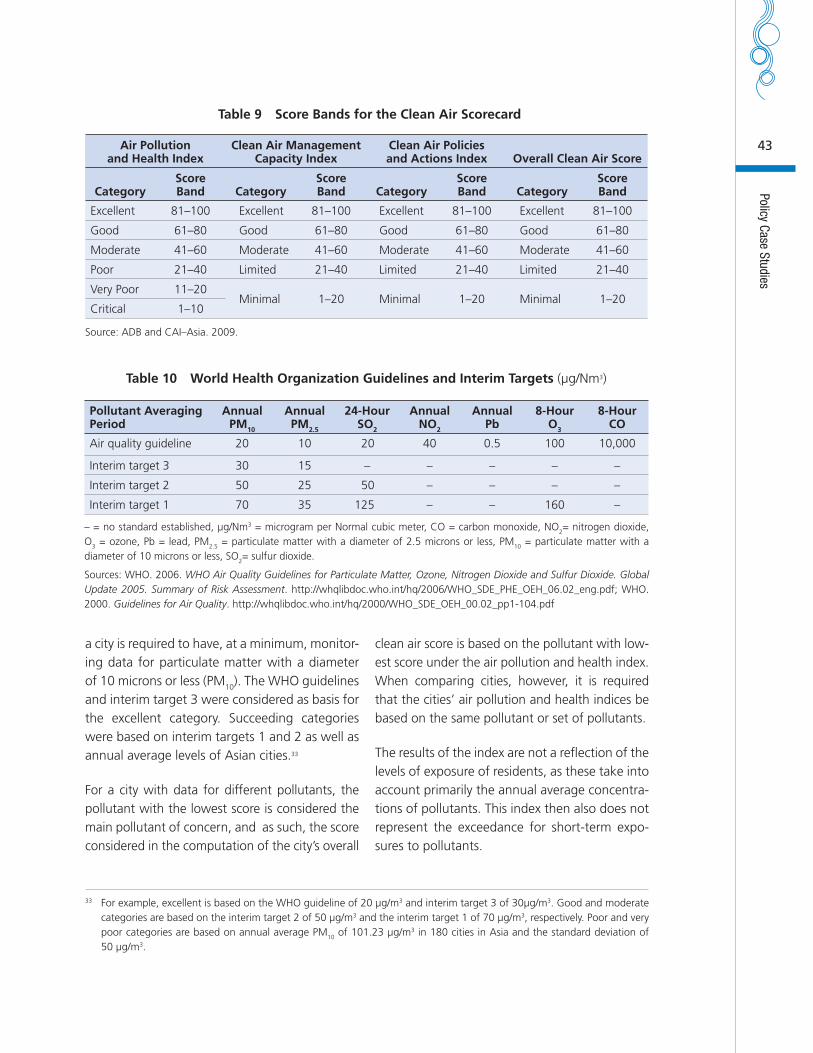
43
Policy Case Studies
a city is required to have, at a minimum, monitor-ing data for particulate matter with a diameter of 10 microns or less (PM10). The WHO guidelines and interim target 3 were considered as basis for the excellent category. Succeeding categories were based on interim targets 1 and 2 as well as annual average levels of Asian cities.33
For a city with data for different pollutants, the pollutant with the lowest score is considered the main pollutant of concern, and as such, the score considered in the computation of the city’s overall
Table 9 Score Bands for the Clean Air Scorecard
Air Pollution and Health Index
Clean Air Management Capacity Index
Clean Air Policies and Actions Index Overall Clean Air Score
CategoryScore Band Category
Score Band Category
Score Band Category
Score Band
Excellent 81–100 Excellent 81–100 Excellent 81–100 Excellent 81–100
Good 61–80 Good 61–80 Good 61–80 Good 61–80
Moderate 41–60 Moderate 41–60 Moderate 41–60 Moderate 41–60
Poor 21–40 Limited 21–40 Limited 21–40 Limited 21–40
Very Poor 11–20Minimal 1–20 Minimal 1–20 Minimal 1–20
Critical 1–10
Source: ADB and CAI–Asia. 2009.
clean air score is based on the pollutant with low-est score under the air pollution and health index. When comparing cities, however, it is required that the cities’ air pollution and health indices be based on the same pollutant or set of pollutants.
The results of the index are not a reflection of the levels of exposure of residents, as these take into account primarily the annual average concentra-tions of pollutants. This index then also does not represent the exceedance for short-term expo-sures to pollutants.
33 For example, excellent is based on the WHO guideline of 20 μg/m3 and interim target 3 of 30μg/m3. Good and moderate categories are based on the interim target 2 of 50 μg/m3 and the interim target 1 of 70 μg/m3, respectively. Poor and very poor categories are based on annual average PM10 of 101.23 μg/m3 in 180 cities in Asia and the standard deviation of 50 μg/m3.
Table 10 World Health Organization Guidelines and Interim Targets (μg/Nm3)
Pollutant Averaging Period
Annual PM10
Annual PM2.5
24-Hour SO2
Annual NO2
Annual Pb
8-Hour O3
8-Hour CO
Air quality guideline 20 10 20 40 0.5 100 10,000
Interim target 3 30 15 – – – – –
Interim target 2 50 25 50 – – – –
Interim target 1 70 35 125 – – 160 –
– = no standard established, μg/Nm3 = microgram per Normal cubic meter, CO = carbon monoxide, NO2= nitrogen dioxide, O3 = ozone, Pb = lead, PM2.5 = particulate matter with a diameter of 2.5 microns or less, PM10 = particulate matter with a diameter of 10 microns or less, SO2= sulfur dioxide.
Sources: WHO. 2006. WHO Air Quality Guidelines for Particulate Matter, Ozone, Nitrogen Dioxide and Sulfur Dioxide. Global Update 2005. Summary of Risk Assessment. http://whqlibdoc.who.int/hq/2006/WHO_SDE_PHE_OEH_06.02_eng.pdf; WHO. 2000. Guidelines for Air Quality. http://whqlibdoc.who.int/hq/2000/WHO_SDE_OEH_00.02_pp1-104.pdf
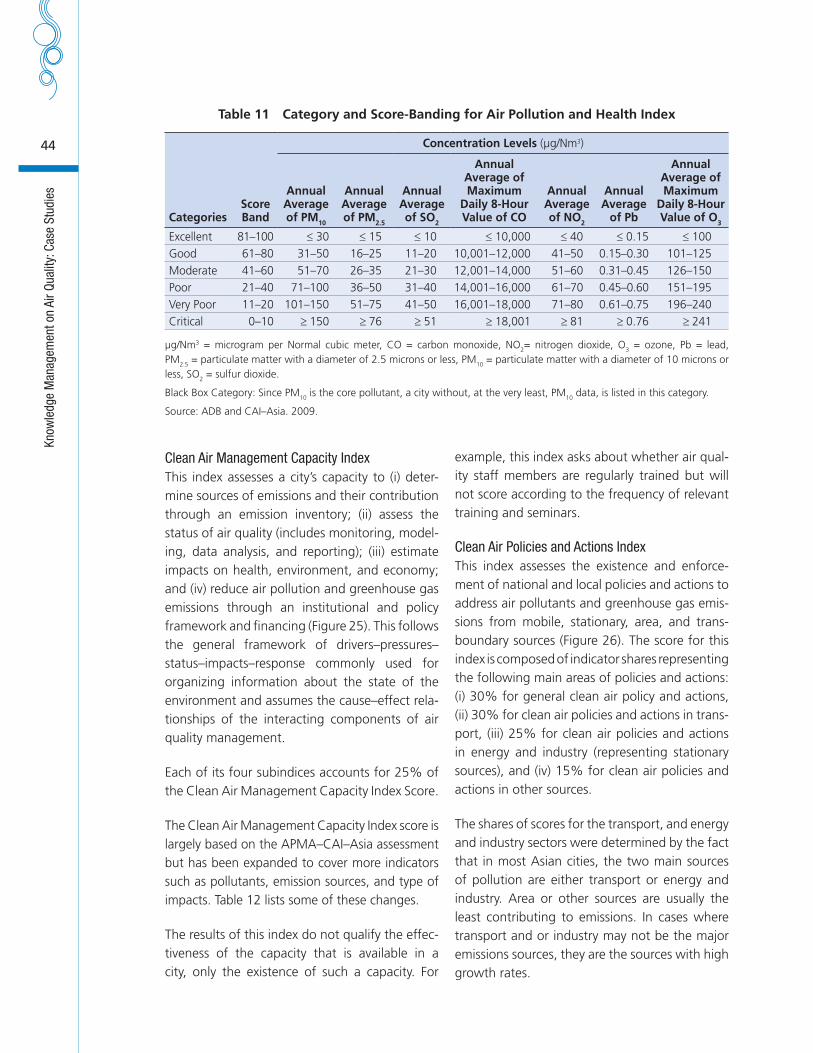
44
Know
ledg
e M
anag
emen
t on
Air Q
ualit
y: C
ase
Stud
ies
CategoriesScore Band
Concentration Levels (μg/Nm3)
Annual Average of PM10
Annual Average of PM2.5
Annual Average of SO2
Annual Average of Maximum
Daily 8-Hour Value of CO
Annual Average of NO2
Annual Average
of Pb
Annual Average of Maximum
Daily 8-Hour Value of O3
Excellent 81–100 � 30 � 15 � 10 � 10,000 � 40 � 0.15 � 100Good 61–80 31–50 16–25 11–20 10,001–12,000 41–50 0.15–0.30 101–125Moderate 41–60 51–70 26–35 21–30 12,001–14,000 51–60 0.31–0.45 126–150Poor 21–40 71–100 36–50 31–40 14,001–16,000 61–70 0.45–0.60 151–195Very Poor 11–20 101–150 51–75 41–50 16,001–18,000 71–80 0.61–0.75 196–240Critical 0–10 ��150 ��76 ��51 ��18,001 ��81 ��0.76 ��241
Table 11 Category and Score-Banding for Air Pollution and Health Index
μg/Nm3 = microgram per Normal cubic meter, CO = carbon monoxide, NO2= nitrogen dioxide, O3 = ozone, Pb = lead, PM2.5 = particulate matter with a diameter of 2.5 microns or less, PM10 = particulate matter with a diameter of 10 microns or less, SO2 = sulfur dioxide.
Black Box Category: Since PM10 is the core pollutant, a city without, at the very least, PM10 data, is listed in this category.
Source: ADB and CAI–Asia. 2009.
Clean Air Management Capacity IndexThis index assesses a city’s capacity to (i) deter-mine sources of emissions and their contribution through an emission inventory; (ii) assess the status of air quality (includes monitoring, model-ing, data analysis, and reporting); (iii) estimate impacts on health, environment, and economy; and (iv) reduce air pollution and greenhouse gas emissions through an institutional and policy framework and financing (Figure 25). This follows the general framework of drivers–pressures–status–impacts–response commonly used for organizing information about the state of the environment and assumes the cause–effect rela-tionships of the interacting components of air quality management.
Each of its four subindices accounts for 25% of the Clean Air Management Capacity Index Score.
The Clean Air Management Capacity Index score is largely based on the APMA–CAI–Asia assessment but has been expanded to cover more indicators such as pollutants, emission sources, and type of impacts. Table 12 lists some of these changes.
The results of this index do not qualify the effec-tiveness of the capacity that is available in a city, only the existence of such a capacity. For
example, this index asks about whether air qual-ity staff members are regularly trained but will not score according to the frequency of relevant training and seminars.
Clean Air Policies and Actions IndexThis index assesses the existence and enforce-ment of national and local policies and actions to address air pollutants and greenhouse gas emis-sions from mobile, stationary, area, and trans-boundary sources (Figure 26). The score for this index is composed of indicator shares representing the following main areas of policies and actions: (i) 30% for general clean air policy and actions, (ii) 30% for clean air policies and actions in trans-port, (iii) 25% for clean air policies and actions in energy and industry (representing stationary sources), and (iv) 15% for clean air policies and actions in other sources.
The shares of scores for the transport, and energy and industry sectors were determined by the fact that in most Asian cities, the two main sources of pollution are either transport or energy and industry. Area or other sources are usually the least contributing to emissions. In cases where transport and or industry may not be the major emissions sources, they are the sources with high growth rates.
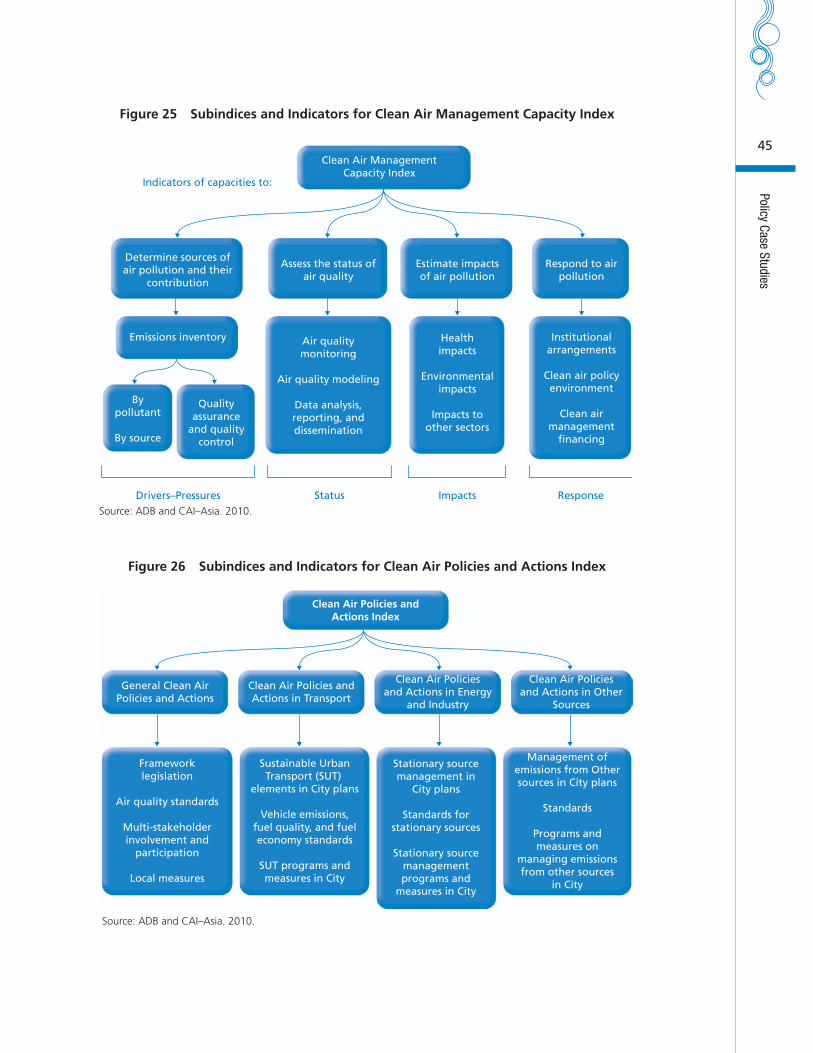
45
Policy Case Studies
Figure 25 Subindices and Indicators for Clean Air Management Capacity Index
Indicators of capacities to:
Clean Air ManagementCapacity Index
Drivers–Pressures Status Impacts Response
Determine sources ofair pollution and their
contribution
Emissions inventory
Bypollutant
By source
Qualityassurance
and qualitycontrol
Air qualitymonitoring
Air quality modeling
Data analysis,reporting, anddissemination
Healthimpacts
Environmentalimpacts
Impacts toother sectors
Institutionalarrangements
Clean air policyenvironment
Clean airmanagement
financing
Assess the status ofair quality
Estimate impactsof air pollution
Respond to airpollution
Source: ADB and CAI–Asia. 2010.
Clean Air Policies andActions Index
General Clean AirPolicies and Actions
Frameworklegislation
Air quality standards
Multi-stakeholderinvolvement and
participation
Local measures
Sustainable UrbanTransport (SUT)
elements in City plans
Vehicle emissions,fuel quality, and fueleconomy standards
SUT programs andmeasures in City
Stationary sourcemanagement in
City plans
Standards forstationary sources
Stationary sourcemanagementprograms and
measures in City
Management ofemissions from Othersources in City plans
Standards
Programs andmeasures on
managing emissionsfrom other sources
in City
Clean Air Policies andActions in Transport
Clean Air Policiesand Actions in Energy
and Industry
Clean Air Policiesand Actions in Other
Sources
Figure 26 Subindices and Indicators for Clean Air Policies and Actions Index
Source: ADB and CAI–Asia. 2010.

46
Know
ledg
e M
anag
emen
t on
Air Q
ualit
y: C
ase
Stud
ies
Previous Assessmentsa Clean Air Scorecard
Pollutants Covered
Particulate matter
SO2 = sulfur dioxide
NO2 = nitrogen dioxide
CO = carbon monoxide
Pb = lead
O3 = ozone
Hydrocarbons
Criteria pollutants such as PM2.5 = particulate matter with a diameter of 2.5 microns or lessPM10 = particulate matter with a diameter of 10 microns or lessSO2 = sulfur dioxideNOx and/or NO2 = nitrogen oxide and/or nitrogen dioxidePb = leadO3 = ozone CO = carbon monoxide
Toxics and other pollutants such as As = arsenicCd = cadmiumCr = chromiumHg = mercuryNi = nickelF = fluorideVOCs = volatile organic compounds (e.g., benzene)PAHs = polycyclic aromatic hydrocarbons (e.g., benzopyrene)Dioxins, furans
Greenhouse gases such as CO2 = carbon dioxideCH4 = methaneN2O = nitrous oxide
Emission Sources
Domestic emissions
Commercial emissions
Power-generating facilities emissions
Industrial emissions
Motor vehicles (cars, motorcycles, heavy-duty vehicles, buses)
Other (e.g., ships and aircraft)
Land transport emissions (includes railway)Water transport emissions Air transport emissionsEmissions from power-generating facilitiesIndustrial emissions
products
coke
Residential emissionsCommercial emissionsEmissions from community, social and personal services
Table 12 Comparison of Indicators Covered by Previous Assessments and Clean Air Scorecard
continued on next page
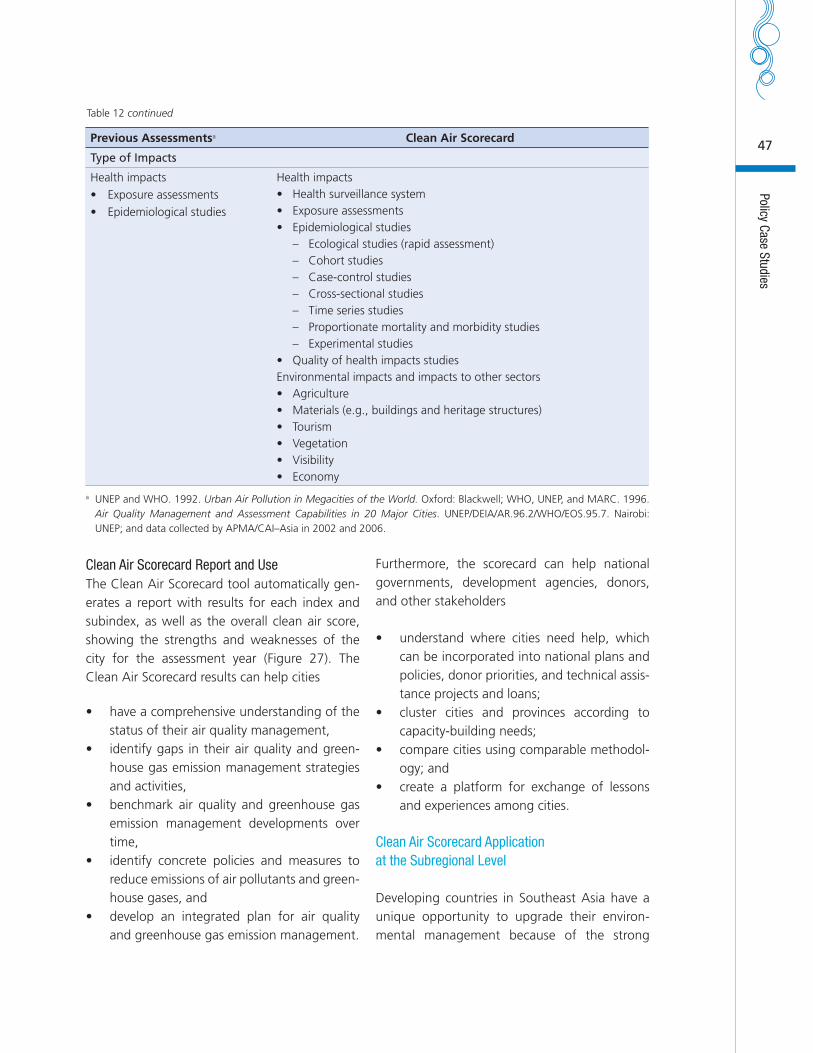
47
Policy Case Studies
Previous Assessmentsa Clean Air Scorecard
Type of Impacts
Health impacts Health impacts
– Ecological studies (rapid assessment)– Cohort studies– Case-control studies– Cross-sectional studies– Time series studies– Proportionate mortality and morbidity studies– Experimental studies
Environmental impacts and impacts to other sectors
Table 12 continued
Clean Air Scorecard Report and UseThe Clean Air Scorecard tool automatically gen-erates a report with results for each index and subindex, as well as the overall clean air score, showing the strengths and weaknesses of the city for the assessment year (Figure 27). The Clean Air Scorecard results can help cities
have a comprehensive understanding of the status of their air quality management,identify gaps in their air quality and green-house gas emission management strategies and activities,benchmark air quality and greenhouse gas emission management developments over time,identify concrete policies and measures to reduce emissions of air pollutants and green-house gases, anddevelop an integrated plan for air quality and greenhouse gas emission management.
a UNEP and WHO. 1992. Urban Air Pollution in Megacities of the World. Oxford: Blackwell; WHO, UNEP, and MARC. 1996. Air Quality Management and Assessment Capabilities in 20 Major Cities. UNEP/DEIA/AR.96.2/WHO/EOS.95.7. Nairobi: UNEP; and data collected by APMA/CAI–Asia in 2002 and 2006.
Furthermore, the scorecard can help national governments, development agencies, donors, and other stakeholders
understand where cities need help, which can be incorporated into national plans and policies, donor priorities, and technical assis-tance projects and loans;cluster cities and provinces according to capacity-building needs;compare cities using comparable methodol-ogy; andcreate a platform for exchange of lessons and experiences among cities.
Clean Air Scorecard Application at the Subregional Level
Developing countries in Southeast Asia have a unique opportunity to upgrade their environ-mental management because of the strong
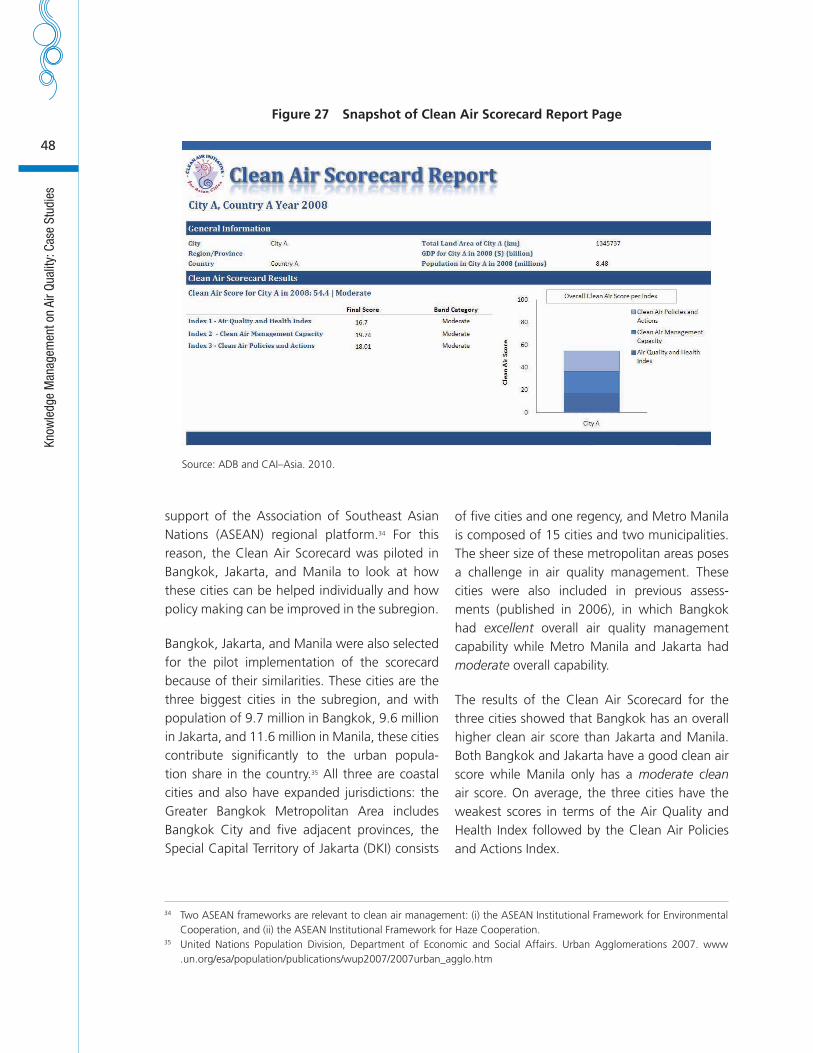
48
Know
ledg
e M
anag
emen
t on
Air Q
ualit
y: C
ase
Stud
ies
support of the Association of Southeast Asian Nations (ASEAN) regional platform.34 For this reason, the Clean Air Scorecard was piloted in Bangkok, Jakarta, and Manila to look at how these cities can be helped individually and how policy making can be improved in the subregion.
Bangkok, Jakarta, and Manila were also selected for the pilot implementation of the scorecard because of their similarities. These cities are the three biggest cities in the subregion, and with population of 9.7 million in Bangkok, 9.6 million in Jakarta, and 11.6 million in Manila, these cities contribute significantly to the urban popula-tion share in the country.35 All three are coastal cities and also have expanded jurisdictions: the Greater Bangkok Metropolitan Area includes Bangkok City and five adjacent provinces, the Special Capital Territory of Jakarta (DKI) consists
of five cities and one regency, and Metro Manila is composed of 15 cities and two municipalities. The sheer size of these metropolitan areas poses a challenge in air quality management. These cities were also included in previous assess-ments (published in 2006), in which Bangkok had excellent overall air quality management capability while Metro Manila and Jakarta had moderate overall capability.
The results of the Clean Air Scorecard for the three cities showed that Bangkok has an overall higher clean air score than Jakarta and Manila. Both Bangkok and Jakarta have a good clean air score while Manila only has a moderate clean air score. On average, the three cities have the weakest scores in terms of the Air Quality and Health Index followed by the Clean Air Policies and Actions Index.
Figure 27 Snapshot of Clean Air Scorecard Report Page
Source: ADB and CAI–Asia. 2010.
34 Two ASEAN frameworks are relevant to clean air management: (i) the ASEAN Institutional Framework for Environmental Cooperation, and (ii) the ASEAN Institutional Framework for Haze Cooperation.
35 United Nations Population Division, Department of Economic and Social Affairs. Urban Agglomerations 2007. www.un.org/esa/population/publications/wup2007/2007urban_agglo.htm
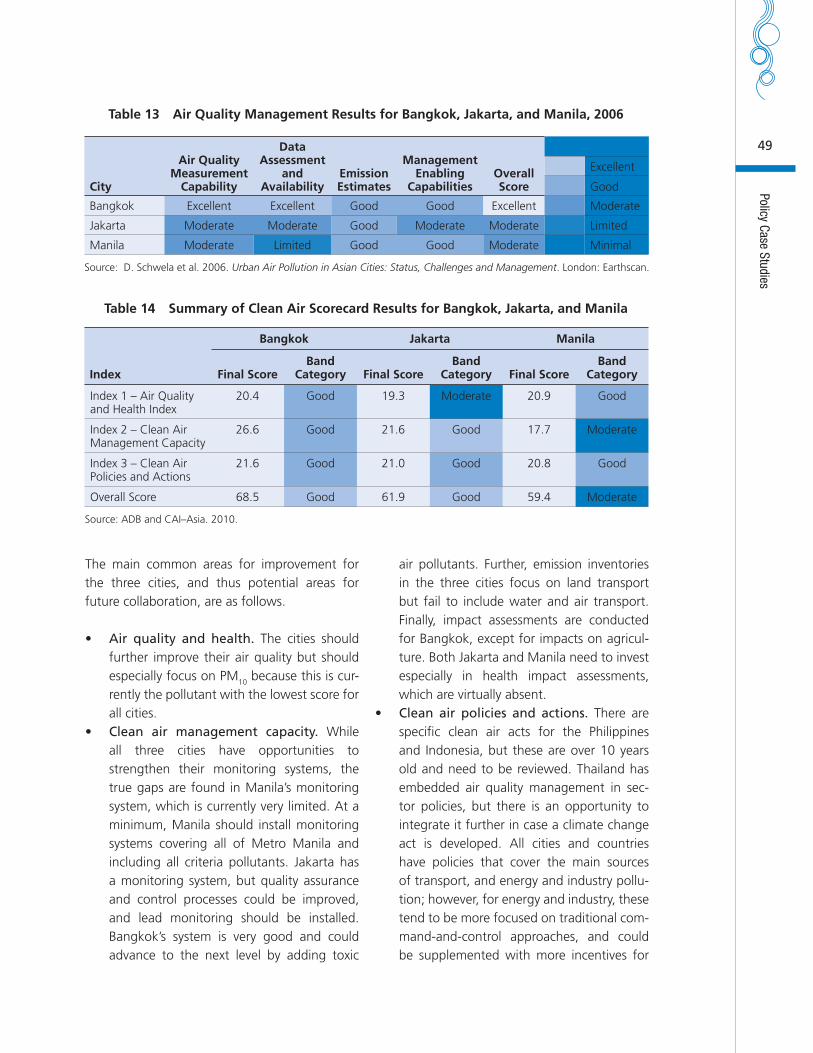
49
Policy Case Studies
The main common areas for improvement for the three cities, and thus potential areas for future collaboration, are as follows.
Air quality and health. The cities should further improve their air quality but should especially focus on PM10 because this is cur-rently the pollutant with the lowest score for all cities.Clean air management capacity. While all three cities have opportunities to strengthen their monitoring systems, the true gaps are found in Manila’s monitoring system, which is currently very limited. At a minimum, Manila should install monitoring systems covering all of Metro Manila and including all criteria pollutants. Jakarta has a monitoring system, but quality assurance and control processes could be improved, and lead monitoring should be installed. Bangkok’s system is very good and could advance to the next level by adding toxic
air pollutants. Further, emission inventories in the three cities focus on land transport but fail to include water and air transport. Finally, impact assessments are conducted for Bangkok, except for impacts on agricul-ture. Both Jakarta and Manila need to invest especially in health impact assessments, which are virtually absent.Clean air policies and actions. There are specific clean air acts for the Philippines and Indonesia, but these are over 10 years old and need to be reviewed. Thailand has embedded air quality management in sec-tor policies, but there is an opportunity to integrate it further in case a climate change act is developed. All cities and countries have policies that cover the main sources of transport, and energy and industry pollu-tion; however, for energy and industry, these tend to be more focused on traditional com-mand-and-control approaches, and could be supplemented with more incentives for
Table 13 Air Quality Management Results for Bangkok, Jakarta, and Manila, 2006
City
Air Quality Measurement
Capability
Data Assessment
and Availability
Emission Estimates
Management Enabling
CapabilitiesOverall Score
Excellent
Good
Bangkok Excellent Excellent Good Good Excellent Moderate
Jakarta Moderate Moderate Good Moderate Moderate Limited
Manila Moderate Limited Good Good Moderate Minimal
Source: D. Schwela et al. 2006. Urban Air Pollution in Asian Cities: Status, Challenges and Management. London: Earthscan.
Table 14 Summary of Clean Air Scorecard Results for Bangkok, Jakarta, and Manila
Index
Bangkok Jakarta Manila
Final ScoreBand
Category Final ScoreBand
Category Final ScoreBand
Category
Index 1 – Air Quality and Health Index
20.4 Good 19.3 Moderate 20.9 Good
Index 2 – Clean Air Management Capacity
26.6 Good 21.6 Good 17.7 Moderate
Index 3 – Clean Air Policies and Actions
21.6 Good 21.0 Good 20.8 Good
Overall Score 68.5 Good 61.9 Good 59.4 Moderate
Source: ADB and CAI–Asia. 2010.
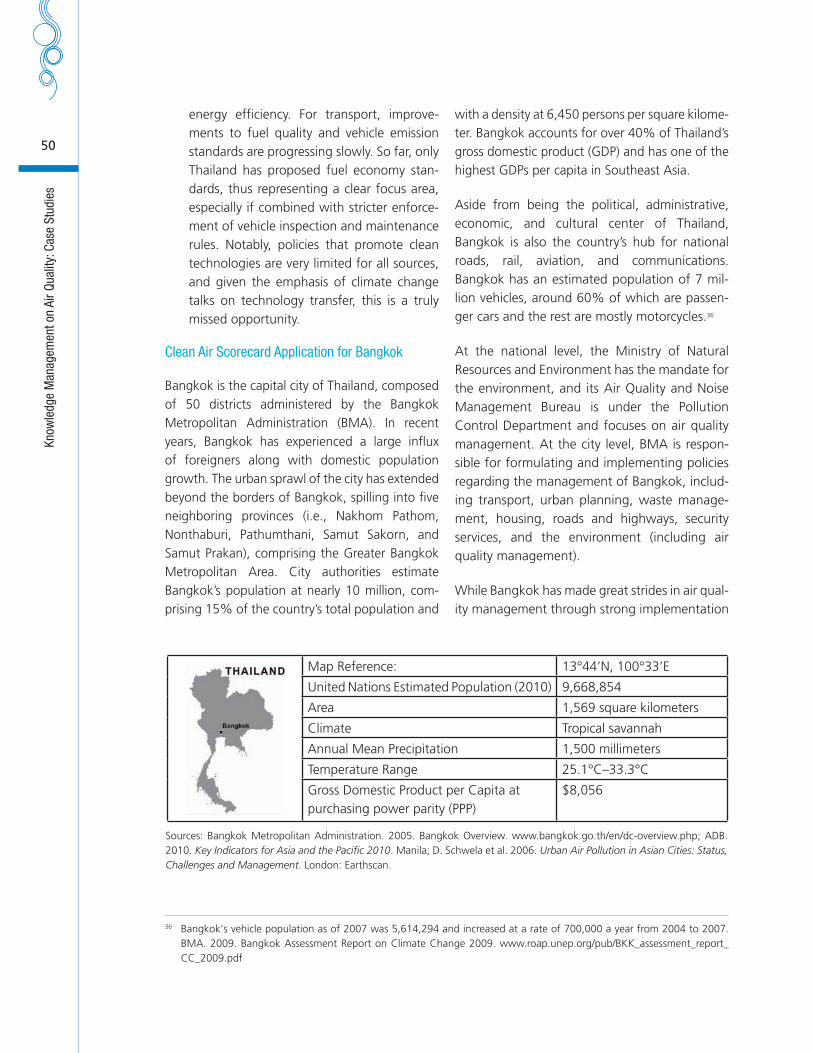
50
Know
ledg
e M
anag
emen
t on
Air Q
ualit
y: C
ase
Stud
ies
energy efficiency. For transport, improve-ments to fuel quality and vehicle emission standards are progressing slowly. So far, only Thailand has proposed fuel economy stan-dards, thus representing a clear focus area, especially if combined with stricter enforce-ment of vehicle inspection and maintenance rules. Notably, policies that promote clean technologies are very limited for all sources, and given the emphasis of climate change talks on technology transfer, this is a truly missed opportunity.
Clean Air Scorecard Application for Bangkok
Bangkok is the capital city of Thailand, composed of 50 districts administered by the Bangkok Metropolitan Administration (BMA). In recent years, Bangkok has experienced a large influx of foreigners along with domestic population growth. The urban sprawl of the city has extended beyond the borders of Bangkok, spilling into five neighboring provinces (i.e., Nakhom Pathom, Nonthaburi, Pathumthani, Samut Sakorn, and Samut Prakan), comprising the Greater Bangkok Metropolitan Area. City authorities estimate Bangkok’s population at nearly 10 million, com-prising 15% of the country’s total population and
with a density at 6,450 persons per square kilome-ter. Bangkok accounts for over 40% of Thailand’s gross domestic product (GDP) and has one of the highest GDPs per capita in Southeast Asia.
Aside from being the political, administrative, economic, and cultural center of Thailand, Bangkok is also the country’s hub for national roads, rail, aviation, and communications. Bangkok has an estimated population of 7 mil-lion vehicles, around 60% of which are passen-ger cars and the rest are mostly motorcycles.36
At the national level, the Ministry of Natural Resources and Environment has the mandate for the environment, and its Air Quality and Noise Management Bureau is under the Pollution Control Department and focuses on air quality management. At the city level, BMA is respon-sible for formulating and implementing policies regarding the management of Bangkok, includ-ing transport, urban planning, waste manage-ment, housing, roads and highways, security services, and the environment (including air quality management).
While Bangkok has made great strides in air qual-ity management through strong implementation
36 Bangkok's vehicle population as of 2007 was 5,614,294 and increased at a rate of 700,000 a year from 2004 to 2007. BMA. 2009. Bangkok Assessment Report on Climate Change 2009. www.roap.unep.org/pub/BKK_assessment_report_CC_2009.pdf
Map Reference: 13°44’N, 100°33’E
United Nations Estimated Population (2010) 9,668,854
Area 1,569 square kilometers
Climate Tropical savannah
Annual Mean Precipitation 1,500 millimeters
Temperature Range 25.1°C–33.3°C
Gross Domestic Product per Capita at purchasing power parity (PPP)
$8,056
Sources: Bangkok Metropolitan Administration. 2005. Bangkok Overview. www.bangkok.go.th/en/dc-overview.php; ADB. 2010. Key Indicators for Asia and the Pacific 2010. Manila; D. Schwela et al. 2006. Urban Air Pollution in Asian Cities: Status, Challenges and Management. London: Earthscan.

51
Policy Case Studies
of air pollution reduction programs including proactive vehicle emission control activities, there is still more work to be done. Particulates remain a significant pollutant in Bangkok. In 2008, the annual average of PM10 was about 45 μg per cubic meter (m3) from seven stations.37 The Air Quality and Noise Management Division of the Pollution Control Department is now looking to expand current policies to monitor and address additional air pollutants (i.e., particulate matter with a diameter of 2.5 microns or less [PM2.5] and volatile organic compounds) and other sources (i.e., biomass). In May 2007, BMA initi-ated its own action plan to reduce greenhouse gas emissions in the city.38 While this is separate from its air quality action, it builds on existing measures for air quality management.
Bangkok can benefit from undertaking an updated air quality management assessment to have a comprehensive understanding of its current status based on its recent activities. It can also help the city identify other areas that it still needs to reinforce and improve. Further, Bangkok can also share its best practices with other cities within the country and in the region.
Overall Clean Air ScoreThe partially verified clean air score of Bangkok in 2010 is 68.5, which represents a good category of clean air management (Figure 28). Among the three indices, Bangkok scored highest in its capacity to manage air quality and scored lowest in the Air Pollution and Health Index (see Appendix B for detailed results for Bangkok).
Air Pollution and Health IndexFor the Air Pollution and Health Index, Bangkok had air quality data available for carbon mon-
oxide, nitrogen dioxide, ozone, PM2.5, PM10, and sulfur dioxide for 2008. The Air Pollution and Health Index score of 20.4 is based on PM10 as the city’s main pollutant of concern. According to the same index, the concentrations of PM2.5, ozone, and carbon monoxide in 2008 were excel-lent. The Air Pollution and Health Index scores for PM10, sulfur dioxide, and nitrogen dioxide were categorized as good (Figure 29).
It is surprising that data for lead was not readily available for Bangkok, even though it is moni-tored. While lead levels in the ambient air may have fallen when leaded gasoline was phased out almost 2 decades ago, it is still relevant to moni-tor this pollutant to assess its other sources. Lead monitoring is also very important as it is known to affect the cognitive development of young children. Thailand was one of the earliest coun-tries in Asia to start (1984) and complete (1996) in the phaseout of leaded gasoline in Asia, almost at the same time as the United States.39
To put these scores in historic perspective, the trend of air quality levels of Bangkok is provided in Figure 30 to Figure 32. From these graphs, Bangkok’s air pollution has reduced significantly for PM10 but has stabilized only for nitrogen dioxide and sulfur dioxide. PM10, however, has continuously exceeded WHO guidelines by at least 200%. Nitrogen dioxide and sulfur dioxide levels are within WHO guidelines.
Clean Air Management Capacity IndexBangkok’s Clean Air Management Capacity Index score is also considered good (26.6 points out of a total of 33.3). The scores for its four subindices are very similar and highest for the city’s capacity to assess the status of air quality (i.e., air quality
37 Data from seven monitoring stations in Bang Khunthien, Din Daeng, Huai Khwang, Intrapituk, Klong Chan, Lad Phrao, Thai Meteorological Department (Bangna), and Yannawa. Air Quality and Noise Information System. http://aqnis.pcd .go.th/
38 CAI–Asia Center. 2009. Thailand Country Profile; and ASEAN and GTZ. Clean Air for Smaller Cities in the ASEAN Region. www.citiesforcleanair.org/
39 ADB. 2003. Reducing Vehicles Emissions in Asia. Manila.
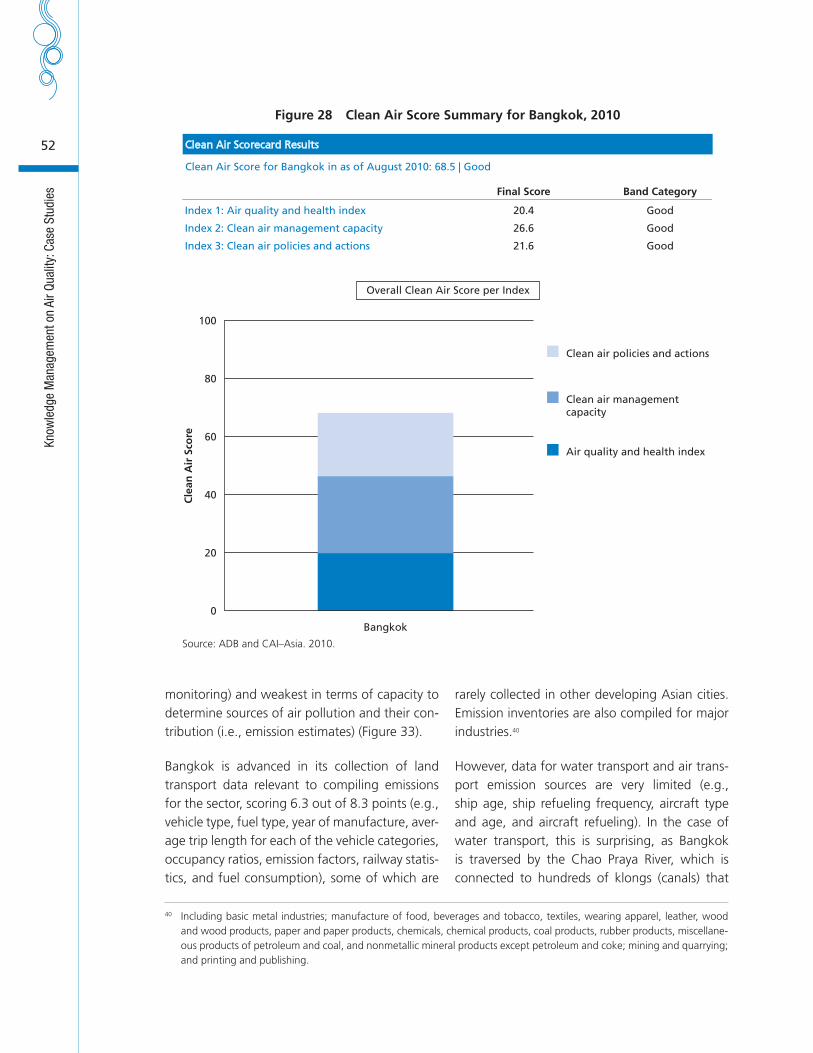
52
Know
ledg
e M
anag
emen
t on
Air Q
ualit
y: C
ase
Stud
ies
monitoring) and weakest in terms of capacity to determine sources of air pollution and their con-tribution (i.e., emission estimates) (Figure 33).
Bangkok is advanced in its collection of land transport data relevant to compiling emissions for the sector, scoring 6.3 out of 8.3 points (e.g., vehicle type, fuel type, year of manufacture, aver-age trip length for each of the vehicle categories, occupancy ratios, emission factors, railway statis-tics, and fuel consumption), some of which are
rarely collected in other developing Asian cities. Emission inventories are also compiled for major industries.40
However, data for water transport and air trans-port emission sources are very limited (e.g., ship age, ship refueling frequency, aircraft type and age, and aircraft refueling). In the case of water transport, this is surprising, as Bangkok is traversed by the Chao Praya River, which is connected to hundreds of klongs (canals) that
Figure 28 Clean Air Score Summary for Bangkok, 2010
Bangkok
Clean air policies and actions
Clean air managementcapacity
Air quality and health index
0
20
40
60
80
100
Cle
an A
ir S
core
Overall Clean Air Score per Index
Clean Air Scorecard Results
Clean Air Score for Bangkok in as of August 2010: 68.5 | Good
Band Category
Good
Index 2: Clean air management capacity Good
Index 3: Clean air policies and actions Good
Final Score
20.4
26.6
21.6
Index 1: Air quality and health index
Source: ADB and CAI–Asia. 2010.
40 Including basic metal industries; manufacture of food, beverages and tobacco, textiles, wearing apparel, leather, wood and wood products, paper and paper products, chemicals, chemical products, coal products, rubber products, miscellane-ous products of petroleum and coal, and nonmetallic mineral products except petroleum and coke; mining and quarrying; and printing and publishing.
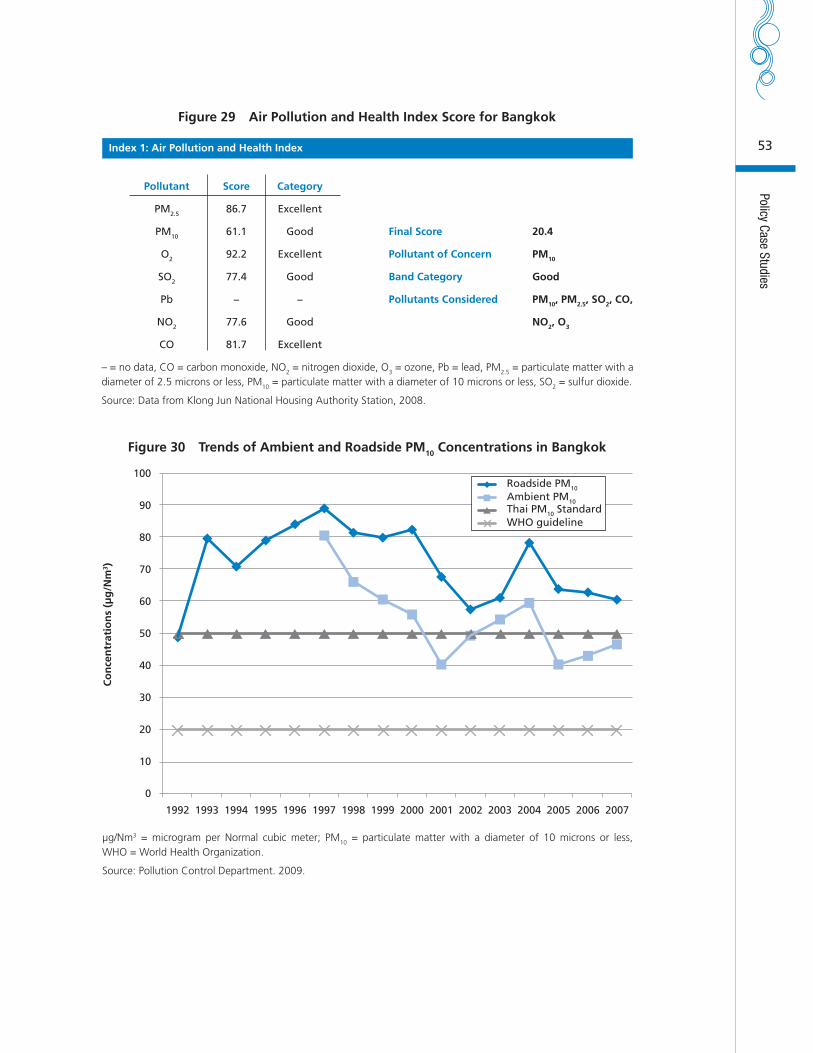
53
Policy Case Studies
0
199719961995199419931992 1998 1999 2000 2001 2002 2003 2004 2005 2006 2007
10
20
Co
nce
ntr
atio
ns
(μg
/Nm
3 )
30
40
50
60
70
80
90
100
Ambient PM10Thai PM10 Standard
Roadside PM10
WHO guideline
Figure 30 Trends of Ambient and Roadside PM10 Concentrations in Bangkok
μg/Nm3 = microgram per Normal cubic meter; PM10 = particulate matter with a diameter of 10 microns or less, WHO = World Health Organization.
Source: Pollution Control Department. 2009.
Figure 29 Air Pollution and Health Index Score for Bangkok
– = no data, CO = carbon monoxide, NO2 = nitrogen dioxide, O3 = ozone, Pb = lead, PM2.5 = particulate matter with a diameter of 2.5 microns or less, PM10 = particulate matter with a diameter of 10 microns or less, SO2 = sulfur dioxide.
Source: Data from Klong Jun National Housing Authority Station, 2008.
Index 1: Air Pollution and Health Index
Pollutant
PM2.5
PM10
O2
SO2
Pb
NO2
CO
Score
86.7
61.1
92.2
77.4
−
77.6
81.7
Category
Excellent
Good
Excellent
Good
−
Good
Excellent
Final Score 20.4
Pollutant of Concern PM10
Band Category Good
Pollutants Considered PM10, PM2.5, SO2, CO,
NO2, O3
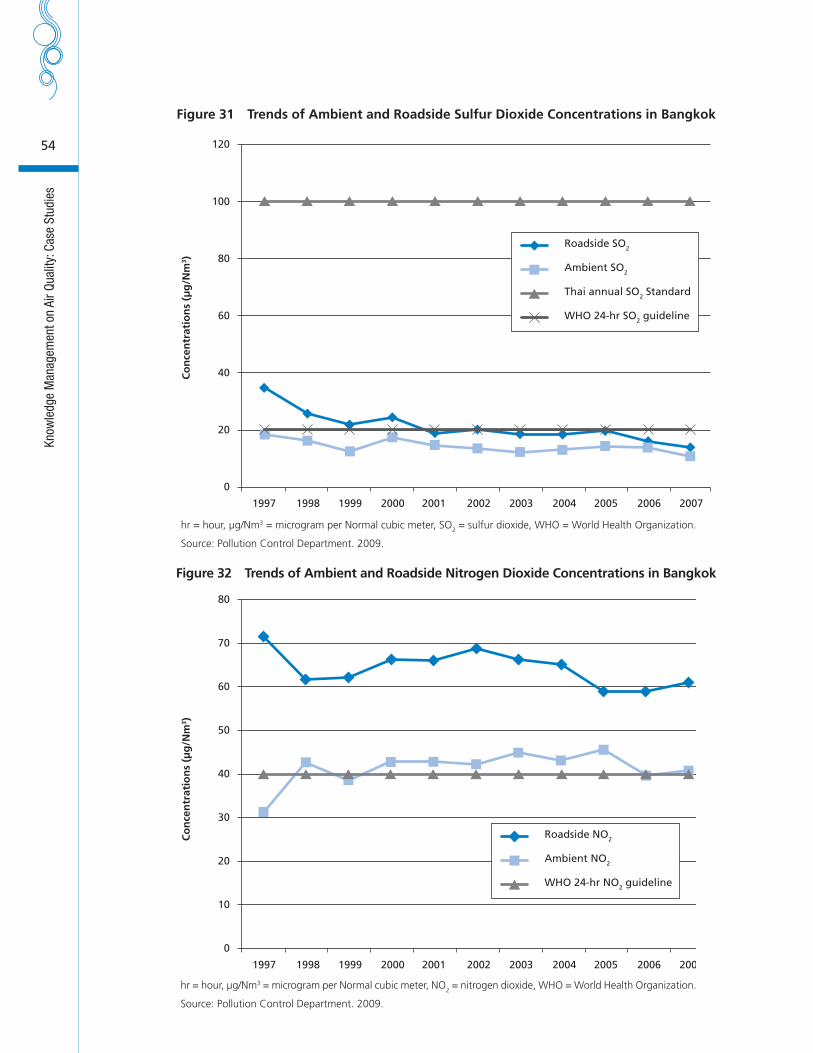
54
Know
ledg
e M
anag
emen
t on
Air Q
ualit
y: C
ase
Stud
ies
0
1997 1998 1999 2000 2001 2002 2003 2004 2005 2006 2007
20
Co
nce
ntr
atio
ns
(μg
/Nm
3 )
40
60
80
100
120
Roadside SO2
Ambient SO2
Thai annual SO2 Standard
WHO 24-hr SO2 guideline
Figure 31 Trends of Ambient and Roadside Sulfur Dioxide Concentrations in Bangkok
hr = hour, μg/Nm3 = microgram per Normal cubic meter, SO2 = sulfur dioxide, WHO = World Health Organization.
Source: Pollution Control Department. 2009.
Figure 32 Trends of Ambient and Roadside Nitrogen Dioxide Concentrations in Bangkok
0
1997 1998 1999 2000 2001 2002 2003 2004 2005 2006 200
10
20
Co
nce
ntr
atio
ns
(μg
/Nm
3 )
30
40
50
60
70
80
Roadside NO2
Ambient NO2
WHO 24-hr NO2 guideline
hr = hour, μg/Nm3 = microgram per Normal cubic meter, NO2 = nitrogen dioxide, WHO = World Health Organization.
Source: Pollution Control Department. 2009.
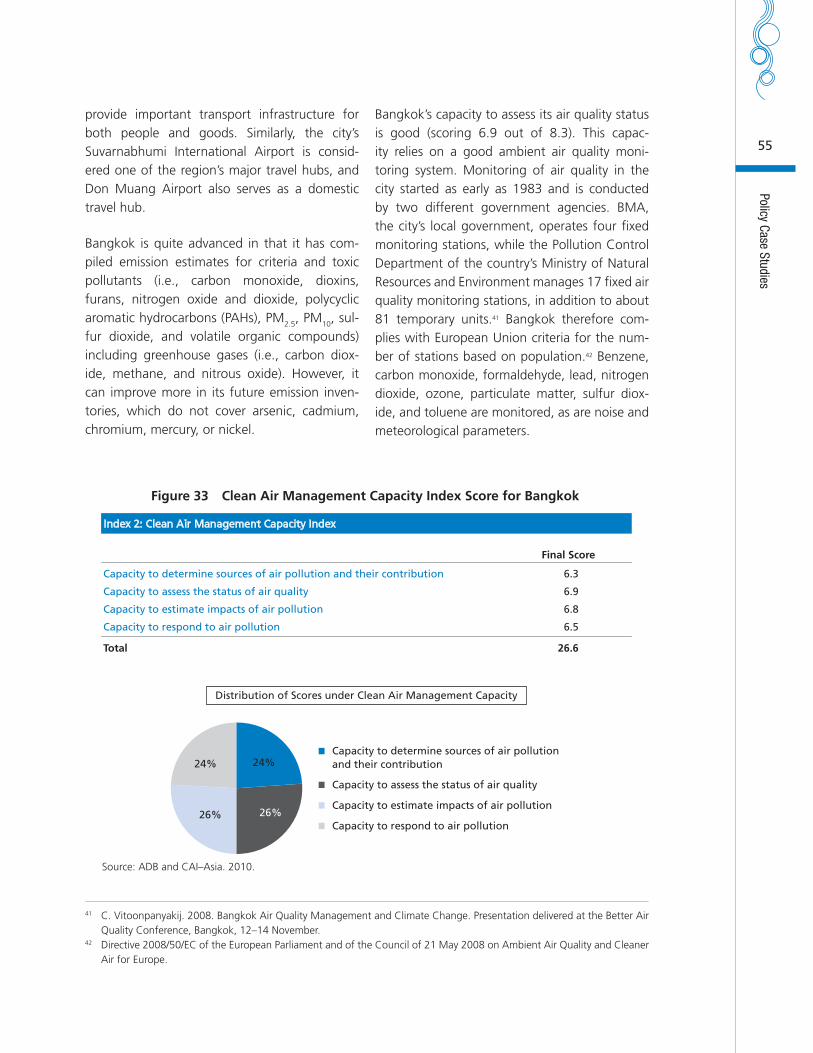
55
Policy Case Studies
provide important transport infrastructure for both people and goods. Similarly, the city’s Suvarnabhumi International Airport is consid-ered one of the region’s major travel hubs, and Don Muang Airport also serves as a domestic travel hub.
Bangkok is quite advanced in that it has com-piled emission estimates for criteria and toxic pollutants (i.e., carbon monoxide, dioxins, furans, nitrogen oxide and dioxide, polycyclic aromatic hydrocarbons (PAHs), PM2.5, PM10, sul-fur dioxide, and volatile organic compounds) including greenhouse gases (i.e., carbon diox-ide, methane, and nitrous oxide). However, it can improve more in its future emission inven-tories, which do not cover arsenic, cadmium, chromium, mercury, or nickel.
Bangkok’s capacity to assess its air quality status is good (scoring 6.9 out of 8.3). This capac-ity relies on a good ambient air quality moni-toring system. Monitoring of air quality in the city started as early as 1983 and is conducted by two different government agencies. BMA, the city’s local government, operates four fixed monitoring stations, while the Pollution Control Department of the country’s Ministry of Natural Resources and Environment manages 17 fixed air quality monitoring stations, in addition to about 81 temporary units.41 Bangkok therefore com-plies with European Union criteria for the num-ber of stations based on population.42 Benzene, carbon monoxide, formaldehyde, lead, nitrogen dioxide, ozone, particulate matter, sulfur diox-ide, and toluene are monitored, as are noise and meteorological parameters.
41 C. Vitoonpanyakij. 2008. Bangkok Air Quality Management and Climate Change. Presentation delivered at the Better Air Quality Conference, Bangkok, 12–14 November.
42 Directive 2008/50/EC of the European Parliament and of the Council of 21 May 2008 on Ambient Air Quality and Cleaner Air for Europe.
Figure 33 Clean Air Management Capacity Index Score for Bangkok
Index 2: Clean Air Management Capacity Index
Final Score
6.3
Capacity to assess the status of air quality 6.9
Capacity to estimate impacts of air pollution 6.8
Capacity to respond to air pollution 6.5
Total 26.6
Capacity to determine sources of air pollution and their contribution
24%
26%26%
24%Capacity to determine sources of air pollution and their contribution
Capacity to assess the status of air quality
Capacity to estimate impacts of air pollution
Capacity to respond to air pollution
Distribution of Scores under Clean Air Management Capacity
Source: ADB and CAI–Asia. 2010.
56
Know
ledg
e M
anag
emen
t on
Air Q
ualit
y: C
ase
Stud
ies
Bangkok also employs a range of dispersion modeling tools to aid in air quality management, from simple box models to more complex types (e.g., chemical mass balance models, Eulerian dispersion models, Gaussian dispersion models, hybrid statistical models, and Lagrangian dis-persion models). The modeling capacity even allows the city to use geographic information system (GIS) mapping to identify spatial distribu-tion of pollution as well as to conduct air quality forecasting.43
Air quality monitoring results in Bangkok are maximized by disseminating them through various media including newspapers (e.g., the Bangkok Post), websites (e.g., www.pcd.go.th, www.aqnis.pcd.go.th, www.thaisnews.com), television, and radio (Department of Public Radio FM 92.5 MHz). An air quality index was established to easily explain air quality to the public, and Bangkok also issues air quality warnings during air pollu-tion episodes.44
Bangkok also has strong capacity to estimate the impacts of air pollution on public health (scoring 6.8 out of 8.3); the economy; and other vulner-able sectors such as materials (i.e., buildings and heritage structures), tourism, vegetation, and even visibility. In terms of health impacts, expo-sure assessments and epidemiological studies are also conducted in Bangkok. Various studies on this area, covering different designs of expo-sure and epidemiological studies (including cross-sectional, panel design, time series, and case-control types) have been published in peer-reviewed journals.45
Air quality management in Bangkok is not the work of one single organization. At the national level, the Air Quality and Noise Management Division of the Pollution Control Department,
based in Bangkok, looks after the air quality issues of the country, including Bangkok. At the province and city levels, BMA’s Department of Environment is responsible. These two offices employ no less than 70 people working on air quality management (excluding technical con-sultants and contractors involved in air quality monitoring). These staff members also receive regular training on air quality management and relevant topics. Table 16 lists the different orga-nizations involved in managing mobile emissions in Bangkok.
Another important management enabling capacity in Bangkok is the existence of a review system for policies in which multiple stakehold-ers from industry, the private sector, specialized technical and scientific organizations, the media, nongovernment organizations, and communities can also be involved.
In terms of financing, a budget for air quality management is earmarked for Bangkok to cover activities, which include air quality monitoring, control measures for transport, control measures for industry, control measures for other sources, enforcement of legislation, staff training and capacity building, and evaluation of effectiveness of legislation and policies. The budget, however, does not cover conduct of emission inventories nor of health impact assessments. This budget is obtained from various financing sources (e.g., central and local governments, grants, and loans).
Clean Air Policies and Actions IndexBangkok has a good score for the Clean Air Policies and Actions Index, (scoring 21.5 out of 33.3). The index shows that Bangkok has a strong general policy framework, followed by policies and actions to address transport emissions. The
43 For Bangkok, a 24-hour air quality forecast is available at www.pcd.go.th/AirQuality/bangkok/Graph/createFc.cfm
44 Air Quality Monitoring. http://infofile.pcd.go.th/air/AQI.pdf45 The Health Effects Institute compiles some of these studies in the Public Health and Air Pollution in Asia: Science Access
on the Net database. www.healtheffects.org/Asia/papasan-summaries.htm#thailand
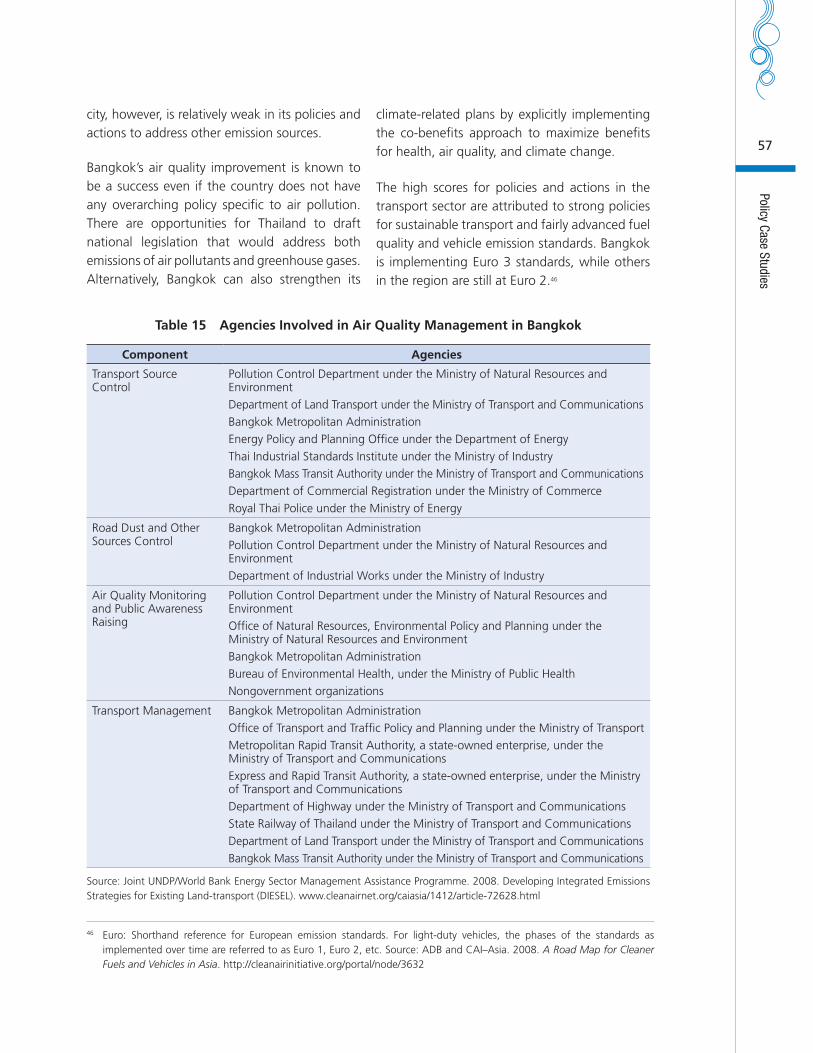
57
Policy Case Studies
city, however, is relatively weak in its policies and actions to address other emission sources.
Bangkok’s air quality improvement is known to be a success even if the country does not have any overarching policy specific to air pollution. There are opportunities for Thailand to draft national legislation that would address both emissions of air pollutants and greenhouse gases. Alternatively, Bangkok can also strengthen its
climate-related plans by explicitly implementing the co-benefits approach to maximize benefits for health, air quality, and climate change.
The high scores for policies and actions in the transport sector are attributed to strong policies for sustainable transport and fairly advanced fuel quality and vehicle emission standards. Bangkok is implementing Euro 3 standards, while others in the region are still at Euro 2.46
Component Agencies
Transport Source Control
Pollution Control Department under the Ministry of Natural Resources and EnvironmentDepartment of Land Transport under the Ministry of Transport and CommunicationsBangkok Metropolitan Administration Energy Policy and Planning Office under the Department of EnergyThai Industrial Standards Institute under the Ministry of IndustryBangkok Mass Transit Authority under the Ministry of Transport and CommunicationsDepartment of Commercial Registration under the Ministry of CommerceRoyal Thai Police under the Ministry of Energy
Road Dust and Other Sources Control
Bangkok Metropolitan AdministrationPollution Control Department under the Ministry of Natural Resources and EnvironmentDepartment of Industrial Works under the Ministry of Industry
Air Quality Monitoring and Public Awareness Raising
Pollution Control Department under the Ministry of Natural Resources and EnvironmentOffice of Natural Resources, Environmental Policy and Planning under the Ministry of Natural Resources and EnvironmentBangkok Metropolitan AdministrationBureau of Environmental Health, under the Ministry of Public Health Nongovernment organizations
Transport Management Bangkok Metropolitan Administration Office of Transport and Traffic Policy and Planning under the Ministry of TransportMetropolitan Rapid Transit Authority, a state-owned enterprise, under the Ministry of Transport and Communications Express and Rapid Transit Authority, a state-owned enterprise, under the Ministry of Transport and Communications Department of Highway under the Ministry of Transport and Communications State Railway of Thailand under the Ministry of Transport and Communications Department of Land Transport under the Ministry of Transport and Communications Bangkok Mass Transit Authority under the Ministry of Transport and Communications
Table 15 Agencies Involved in Air Quality Management in Bangkok
Source: Joint UNDP/World Bank Energy Sector Management Assistance Programme. 2008. Developing Integrated Emissions Strategies for Existing Land-transport (DIESEL). www.cleanairnet.org/caiasia/1412/article-72628.html
46 Euro: Shorthand reference for European emission standards. For light-duty vehicles, the phases of the standards as implemented over time are referred to as Euro 1, Euro 2, etc. Source: ADB and CAI–Asia. 2008. A Road Map for Cleaner Fuels and Vehicles in Asia. http://cleanairinitiative.org/portal/node/3632

58
Know
ledg
e M
anag
emen
t on
Air Q
ualit
y: C
ase
Stud
ies
Implementing fuel economy standards are very important, because Bangkok is fast becoming the biggest car market in Southeast Asia due to both domestic and international demand. Japanese car manufacturers have been moving their production demands to Thailand because of competitive exchange rates as well as the government’s strong support for the industry.47
The policies and actions of Bangkok to manage emissions from energy and industry can be char-acterized by good permitting, strong compliance monitoring, and comprehensive penalty systems. Bangkok generally has good permitting pro-grams and measures for stationary sources (e.g., environmental impact assessment requirements) but has some weakness in terms of technology transfer, including reference documents for best available technologies.
In terms of compliance monitoring, Bangkok is quite sophisticated. It has already initiated con-tinuous emission monitoring that is directly linked with the Pollution Control Department database, on top of common measures such as mandatory monitoring and inspection by the government, self-monitoring, and compliance monitoring by industry or establishments.
The penalty systems in place are also compre-hensive in Bangkok, because the city implements a fine system, permit and license suspension, license termination, temporary or permanent closure, and blacklisting of industries. Bangkok has limited energy efficiency and conservation programs and measures, which only include pro-motion activities and tax incentives. No manda-tory audits are implemented nor is the reporting of energy consumption to the government.
47 L. Lin. 2010. Nissan's Waiting List Swells in Bangkok as Car Demand Surges. Bloomberg. 7 July. www.bloomberg.com/news/2010-07-06/nissan-s-waiting-list-swells-in-bangkok-as-demand-overwhelms- car-factories.html
Index 3: Clean Air Policies and Actions Index
Final Score
7.0
Indicators of clean air policies and actions in transport sector 6.6
Indicators of clean air policies and actions in energy and industry 4.6
Indicators of clean air policies and actions for other sources 3.3
Total 21.5
Indicators of general policies and actions in air quality
Indicators of general policies and actions in airquality
Indicators of clean air policies and actions intransport sector
Indicators of clean air policies and actions inenergy and industry
Indicators of clean air policies and actions forother sources
Distribution of Scores under Clean Air Policies and Actions Index
33%
31%
21%
15%
Figure 34 Clean Air Policies and Actions Index Score for Bangkok
Source: ADB and CAI–Asia. 2010.
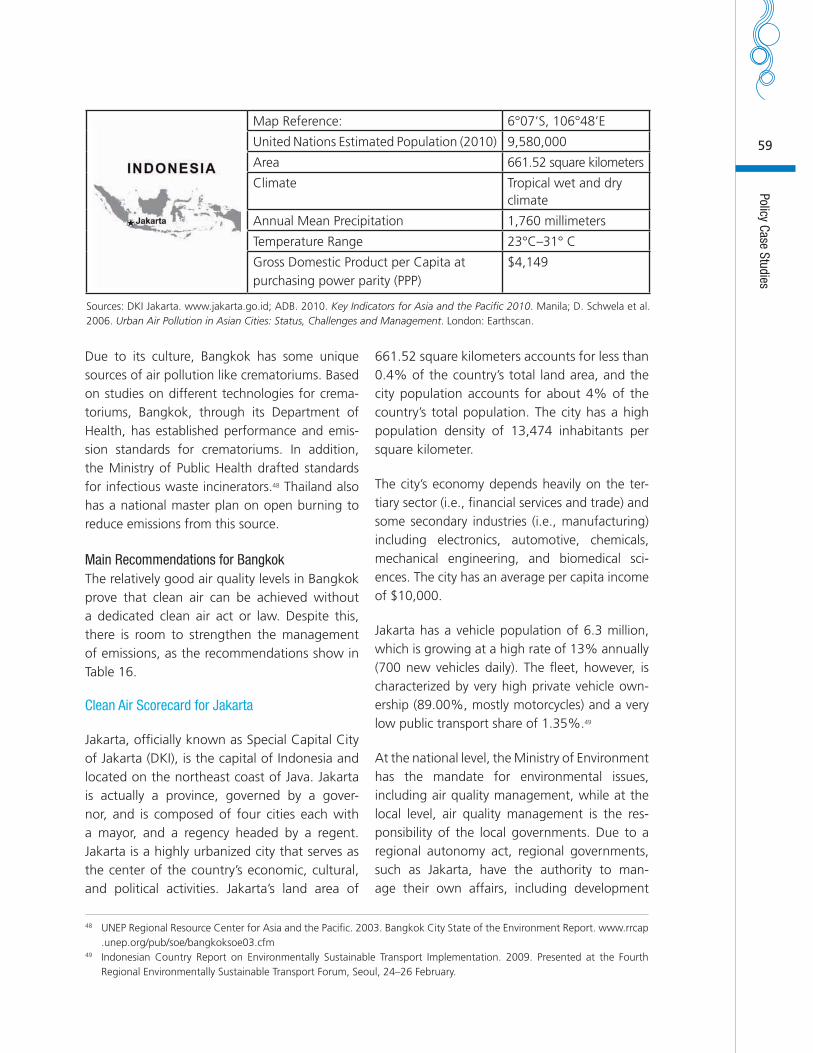
59
Policy Case Studies
Due to its culture, Bangkok has some unique sources of air pollution like crematoriums. Based on studies on different technologies for crema-toriums, Bangkok, through its Department of Health, has established performance and emis-sion standards for crematoriums. In addition, the Ministry of Public Health drafted standards for infectious waste incinerators.48 Thailand also has a national master plan on open burning to reduce emissions from this source.
Main Recommendations for BangkokThe relatively good air quality levels in Bangkok prove that clean air can be achieved without a dedicated clean air act or law. Despite this, there is room to strengthen the management of emissions, as the recommendations show in Table 16.
Clean Air Scorecard for Jakarta
Jakarta, officially known as Special Capital City of Jakarta (DKI), is the capital of Indonesia and located on the northeast coast of Java. Jakarta is actually a province, governed by a gover-nor, and is composed of four cities each with a mayor, and a regency headed by a regent. Jakarta is a highly urbanized city that serves as the center of the country’s economic, cultural, and political activities. Jakarta’s land area of
661.52 square kilometers accounts for less than 0.4% of the country’s total land area, and the city population accounts for about 4% of the country’s total population. The city has a high population density of 13,474 inhabitants per square kilometer.
The city’s economy depends heavily on the ter-tiary sector (i.e., financial services and trade) and some secondary industries (i.e., manufacturing) including electronics, automotive, chemicals, mechanical engineering, and biomedical sci-ences. The city has an average per capita income of $10,000.
Jakarta has a vehicle population of 6.3 million, which is growing at a high rate of 13% annually (700 new vehicles daily). The fleet, however, is characterized by very high private vehicle own-ership (89.00%, mostly motorcycles) and a very low public transport share of 1.35%.49
At the national level, the Ministry of Environment has the mandate for environmental issues, including air quality management, while at the local level, air quality management is the res-ponsibility of the local governments. Due to a regional autonomy act, regional governments, such as Jakarta, have the authority to man-age their own affairs, including development
48 UNEP Regional Resource Center for Asia and the Pacific. 2003. Bangkok City State of the Environment Report. www.rrcap.unep.org/pub/soe/bangkoksoe03.cfm
49 Indonesian Country Report on Environmentally Sustainable Transport Implementation. 2009. Presented at the Fourth Regional Environmentally Sustainable Transport Forum, Seoul, 24–26 February.
Map Reference: 6°07’S, 106°48’E
United Nations Estimated Population (2010) 9,580,000
Area 661.52 square kilometers
Climate Tropical wet and dry climate
Annual Mean Precipitation 1,760 millimeters
Temperature Range 23°C–31° C
Gross Domestic Product per Capita at purchasing power parity (PPP)
$4,149
Sources: DKI Jakarta. www.jakarta.go.id; ADB. 2010. Key Indicators for Asia and the Pacific 2010. Manila; D. Schwela et al. 2006. Urban Air Pollution in Asian Cities: Status, Challenges and Management. London: Earthscan.
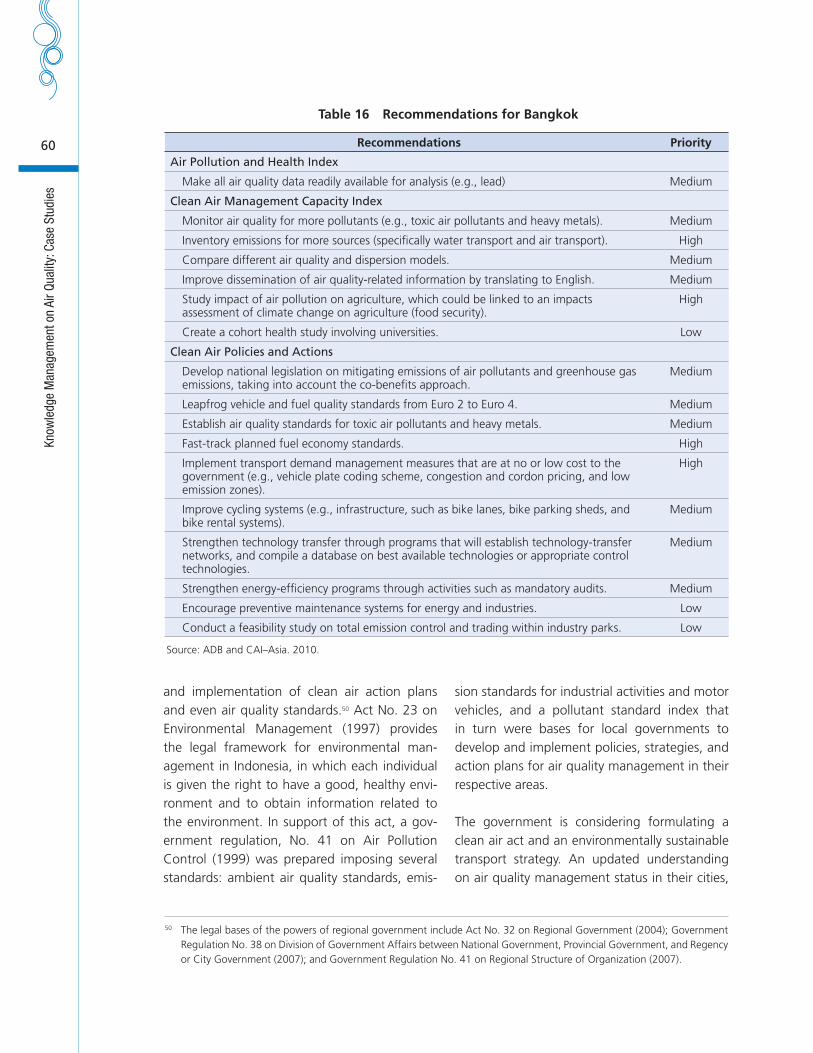
60
Know
ledg
e M
anag
emen
t on
Air Q
ualit
y: C
ase
Stud
ies
Table 16 Recommendations for Bangkok
Recommendations Priority
Air Pollution and Health Index
Make all air quality data readily available for analysis (e.g., lead) Medium
Clean Air Management Capacity Index
Monitor air quality for more pollutants (e.g., toxic air pollutants and heavy metals). Medium
Inventory emissions for more sources (specifically water transport and air transport). High
Compare different air quality and dispersion models. Medium
Improve dissemination of air quality-related information by translating to English. Medium
Study impact of air pollution on agriculture, which could be linked to an impacts assessment of climate change on agriculture (food security).
High
Create a cohort health study involving universities. Low
Clean Air Policies and Actions
Develop national legislation on mitigating emissions of air pollutants and greenhouse gas emissions, taking into account the co-benefits approach.
Medium
Leapfrog vehicle and fuel quality standards from Euro 2 to Euro 4. Medium
Establish air quality standards for toxic air pollutants and heavy metals. Medium
Fast-track planned fuel economy standards. High
Implement transport demand management measures that are at no or low cost to the government (e.g., vehicle plate coding scheme, congestion and cordon pricing, and low emission zones).
High
Improve cycling systems (e.g., infrastructure, such as bike lanes, bike parking sheds, and bike rental systems).
Medium
Strengthen technology transfer through programs that will establish technology-transfer networks, and compile a database on best available technologies or appropriate control technologies.
Medium
Strengthen energy-efficiency programs through activities such as mandatory audits. Medium
Encourage preventive maintenance systems for energy and industries. Low
Conduct a feasibility study on total emission control and trading within industry parks. Low
Source: ADB and CAI–Asia. 2010.
50 The legal bases of the powers of regional government include Act No. 32 on Regional Government (2004); Government Regulation No. 38 on Division of Government Affairs between National Government, Provincial Government, and Regency or City Government (2007); and Government Regulation No. 41 on Regional Structure of Organization (2007).
and implementation of clean air action plans and even air quality standards.50 Act No. 23 on Environmental Management (1997) provides the legal framework for environmental man-agement in Indonesia, in which each individual is given the right to have a good, healthy envi-ronment and to obtain information related to the environment. In support of this act, a gov-ernment regulation, No. 41 on Air Pollution Control (1999) was prepared imposing several standards: ambient air quality standards, emis-
sion standards for industrial activities and motor vehicles, and a pollutant standard index that in turn were bases for local governments to develop and implement policies, strategies, and action plans for air quality management in their respective areas.
The government is considering formulating a clean air act and an environmentally sustainable transport strategy. An updated understanding on air quality management status in their cities,
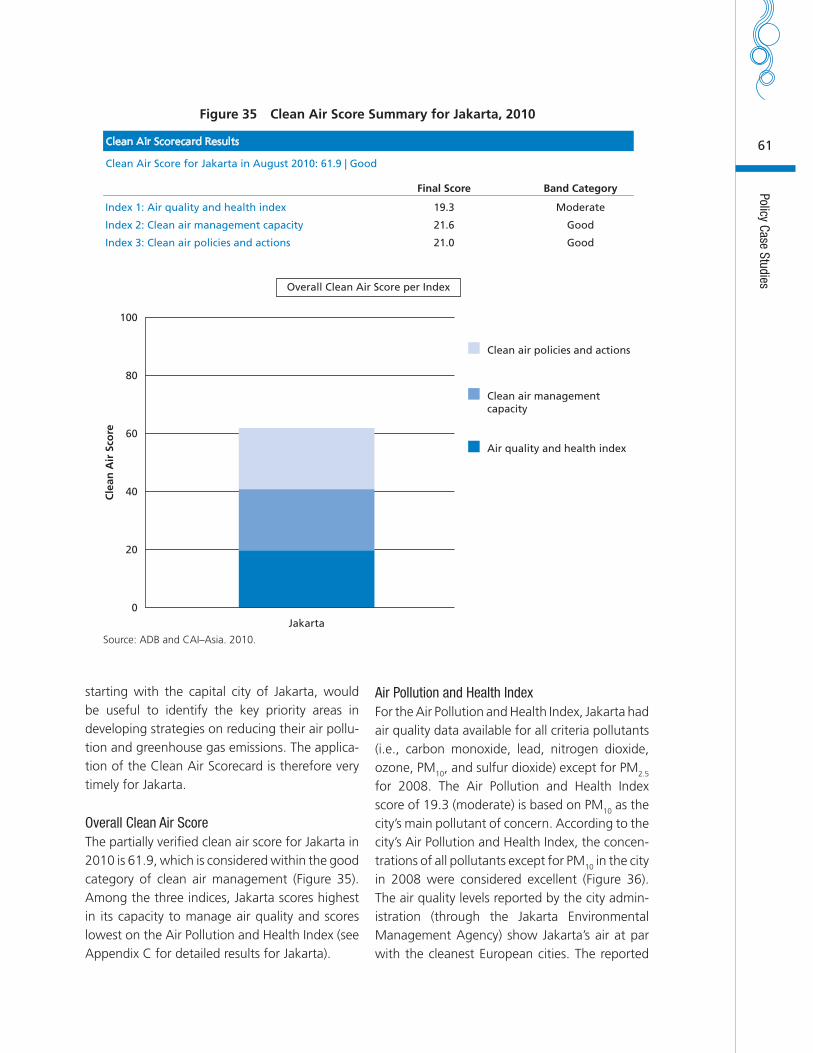
61
Policy Case Studies
Jakarta
Clean air policies and actions
Clean air managementcapacity
Air quality and health index
0
20
40
60
80
100
Cle
an A
ir S
core
Overall Clean Air Score per Index
Clean Air Scorecard Results
Clean Air Score for Jakarta in August 2010: 61.9 | Good
Band Category
Moderate
Index 2: Clean air management capacity Good
Index 3: Clean air policies and actions Good
Final Score
19.3
21.6
21.0
Index 1: Air quality and health index
Figure 35 Clean Air Score Summary for Jakarta, 2010
Source: ADB and CAI–Asia. 2010.
starting with the capital city of Jakarta, would be useful to identify the key priority areas in developing strategies on reducing their air pollu-tion and greenhouse gas emissions. The applica-tion of the Clean Air Scorecard is therefore very timely for Jakarta.
Overall Clean Air ScoreThe partially verified clean air score for Jakarta in 2010 is 61.9, which is considered within the good category of clean air management (Figure 35). Among the three indices, Jakarta scores highest in its capacity to manage air quality and scores lowest on the Air Pollution and Health Index (see Appendix C for detailed results for Jakarta).
Air Pollution and Health IndexFor the Air Pollution and Health Index, Jakarta had air quality data available for all criteria pollutants (i.e., carbon monoxide, lead, nitrogen dioxide, ozone, PM10, and sulfur dioxide) except for PM2.5
for 2008. The Air Pollution and Health Index score of 19.3 (moderate) is based on PM10 as the city’s main pollutant of concern. According to the city’s Air Pollution and Health Index, the concen-trations of all pollutants except for PM10 in the city in 2008 were considered excellent (Figure 36). The air quality levels reported by the city admin-istration (through the Jakarta Environmental Management Agency) show Jakarta’s air at par with the cleanest European cities. The reported

62
Know
ledg
e M
anag
emen
t on
Air Q
ualit
y: C
ase
Stud
ies
air quality results have spurred criticisms from environmentalists and air quality stakeholders.51
An Environmental Quality Index report of the Ministry of Environment conducted in 2010 also showed good marks on air quality in almost every province.52
Figure 38 to Figure 40 provide the trend of air quality in Jakarta from 2000 to 2008. These charts show marked improvements in air quality levels for most pollutants (e.g., PM10 and nitrogen dioxide) but not for sulfur dioxide, a trend that is contrary to those seen the other Asian cities.53
Clean Air Management Capacity IndexThe Clean Air Management Capacity Index score for Jakarta is also considered good (21.6 points out of 33.3). The detailed scores show that Jakarta ranks high in terms of management capacity but ranks low in determining sources of emissions and their contribution and in estimat-ing impacts of air pollution (Figure 41).
Jakarta is one of the few cities in Indonesia that has conducted emission inventories. Emission inventories in Jakarta (1992, 1997, and 2003) showed that transport was a main source of carbon monoxide, hydrocarbons, and nitrogen oxide while industry was the main contributor for sulfur dioxide. Transport also showed an increas-ing share in contribution and demonstrated its greatest share in the 2003 inventory.
The emission inventories in Jakarta, however, were limited in terms of coverage, both by pol-lutant and by source. They only examined criteria pollutants and did not include lead or PM2.5. The inventories also did not include some mobile sources, such as water and air transport, and also missed other sources, such as residential and commercial establishments. On a positive note, because of Indonesia’s known high contribu-tion to greenhouse gas emissions, emission esti-mates were undertaken for these. Law No. 32 on Environment Protection and Management (2009) requires the Ministry of Environment to
51 A. Primanita. 2010. Critics Aren't Swallowing City's Boasts of Improved Air Quality. Jakarta Globe. 10 April. www.thejakartaglobe.com/city/critics-arent-swallowing-citys-boasts-of-improved-air-quality/368663
52 A. Simamora. 2010. Java Ranks Last in National Environmental Survey. Jakarta Post. 8 July. www.thejakartapost.com/news/2010/06/08/java-ranks-last-national-environment-survey.html
53 CAI–Asia. 2010. Air Quality in Asia: Status and Trends, 2010. Pasig City.
Index 1: Air Pollution and Health Index
Pollutant
PM2.5
PM10
O3
SO2
Pb
NO2
CO
Score
–
19.3
29.8
28.5
32.8
28.8
33.3
Category
–
Moderate
Excellent
Excellent
Excellent
Excellent
Excellent
Final Score 19.3
Pollutant of Concern PM10
Band Category Moderate
Pollutants Considered PM10, SO2, CO, NO2,
Pb, O3
Figure 36 Air Pollution and Health Index Score for Jakarta
– = no data, CO = carbon monoxide, NO2 = nitrogen dioxide, O3 = ozone, Pb = lead, PM2.5 = particulate matter with a diameter of 2.5 microns or less, PM10 = particulate matter with a diameter of 10 microns or less, SO2 = sulfur dioxide.
Source: ADB and CAI–Asia. 2010.
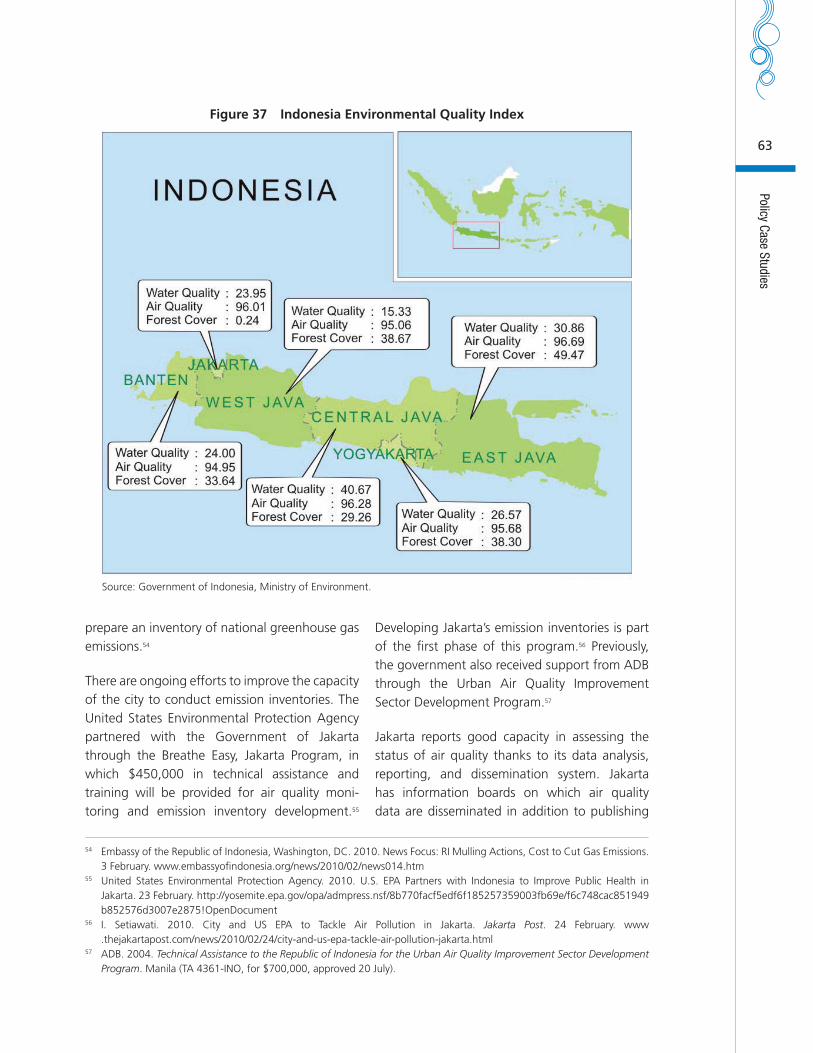
63
Policy Case Studies
54 Embassy of the Republic of Indonesia, Washington, DC. 2010. News Focus: RI Mulling Actions, Cost to Cut Gas Emissions. 3 February. www.embassyofindonesia.org/news/2010/02/news014.htm
55 United States Environmental Protection Agency. 2010. U.S. EPA Partners with Indonesia to Improve Public Health in Jakarta. 23 February. http://yosemite.epa.gov/opa/admpress.nsf/8b770facf5edf6f185257359003fb69e/f6c748cac851949b852576d3007e2875!OpenDocument
56 I. Setiawati. 2010. City and US EPA to Tackle Air Pollution in Jakarta. Jakarta Post. 24 February. www.thejakartapost.com/news/2010/02/24/city-and-us-epa-tackle-air-pollution-jakarta.html
57 ADB. 2004. Technical Assistance to the Republic of Indonesia for the Urban Air Quality Improvement Sector Development Program. Manila (TA 4361-INO, for $700,000, approved 20 July).
Figure 37 Indonesia Environmental Quality Index
Source: Government of Indonesia, Ministry of Environment.
prepare an inventory of national greenhouse gas emissions.54
There are ongoing efforts to improve the capacity of the city to conduct emission inventories. The United States Environmental Protection Agency partnered with the Government of Jakarta through the Breathe Easy, Jakarta Program, in which $450,000 in technical assistance and training will be provided for air quality moni-toring and emission inventory development.55
Developing Jakarta’s emission inventories is part of the first phase of this program.56 Previously, the government also received support from ADB through the Urban Air Quality Improvement Sector Development Program.57
Jakarta reports good capacity in assessing the status of air quality thanks to its data analysis, reporting, and dissemination system. Jakarta has information boards on which air quality data are disseminated in addition to publishing
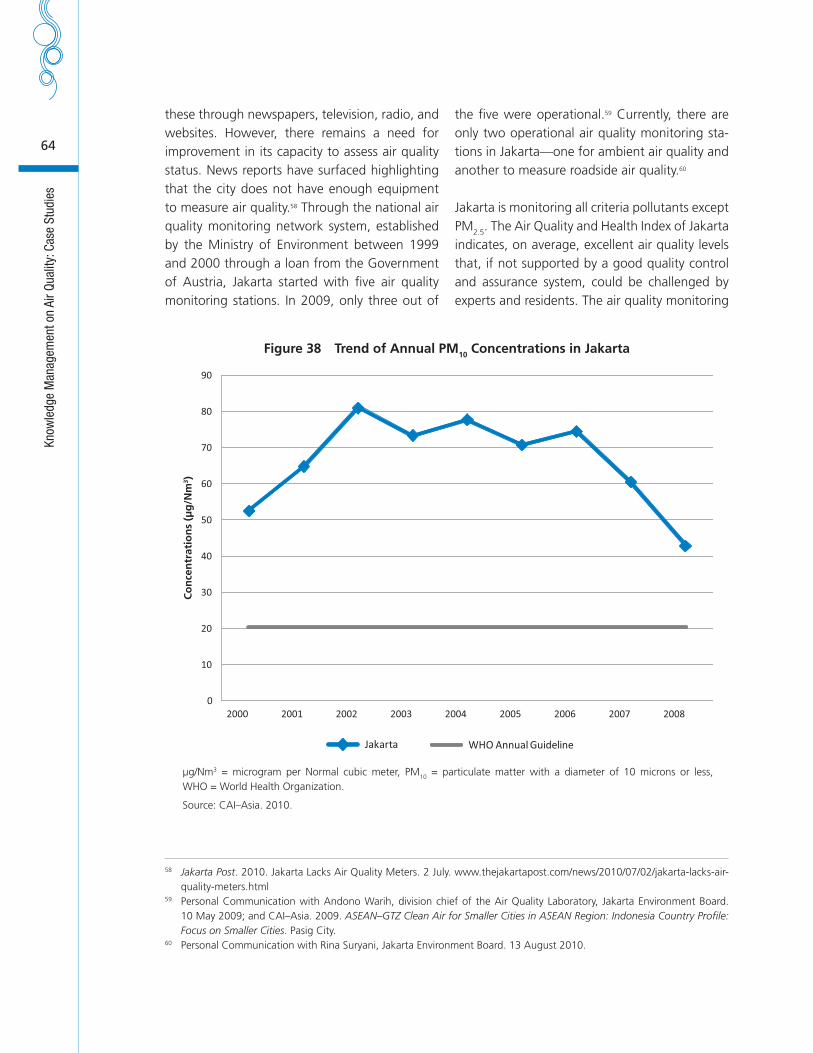
64
Know
ledg
e M
anag
emen
t on
Air Q
ualit
y: C
ase
Stud
ies
these through newspapers, television, radio, and websites. However, there remains a need for improvement in its capacity to assess air quality status. News reports have surfaced highlighting that the city does not have enough equipment to measure air quality.58 Through the national air quality monitoring network system, established by the Ministry of Environment between 1999 and 2000 through a loan from the Government of Austria, Jakarta started with five air quality monitoring stations. In 2009, only three out of
the five were operational.59 Currently, there are only two operational air quality monitoring sta-tions in Jakarta—one for ambient air quality and another to measure roadside air quality.60
Jakarta is monitoring all criteria pollutants except PM2.5. The Air Quality and Health Index of Jakarta indicates, on average, excellent air quality levels that, if not supported by a good quality control and assurance system, could be challenged by experts and residents. The air quality monitoring
Figure 38 Trend of Annual PM10 Concentrations in Jakarta
0
10
20
30
40
50
60
70
80
90
2000 2001 2002 2003 2004 2005 2006 2007 2008
Co
nce
ntr
atio
ns
(μg
/Nm
3 )
WHO Annual GuidelineJakarta
μg/Nm3 = microgram per Normal cubic meter, PM10 = particulate matter with a diameter of 10 microns or less, WHO = World Health Organization.
Source: CAI–Asia. 2010.
58 Jakarta Post. 2010. Jakarta Lacks Air Quality Meters. 2 July. www.thejakartapost.com/news/2010/07/02/jakarta-lacks-air-quality-meters.html
59 Personal Communication with Andono Warih, division chief of the Air Quality Laboratory, Jakarta Environment Board. 10 May 2009; and CAI–Asia. 2009. ASEAN–GTZ Clean Air for Smaller Cities in ASEAN Region: Indonesia Country Profile: Focus on Smaller Cities. Pasig City.
60 Personal Communication with Rina Suryani, Jakarta Environment Board. 13 August 2010.
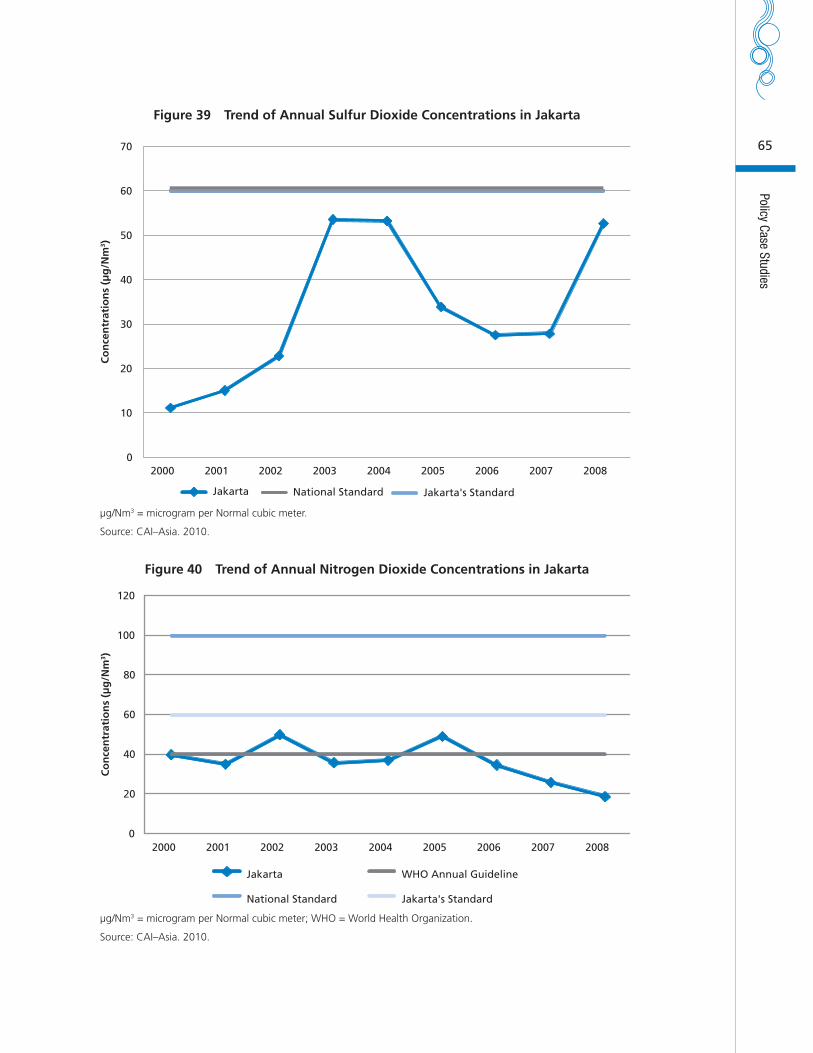
65
Policy Case Studies
0
10
20
30
40
50
60
70
2000 2001 2002 2003 2004 2005 2006 2007 2008
Co
nce
ntr
atio
ns
(μg
/Nm
3 )
Jakarta National Standard Jakarta's Standard
Figure 39 Trend of Annual Sulfur Dioxide Concentrations in Jakarta
μg/Nm3 = microgram per Normal cubic meter.
Source: CAI–Asia. 2010.
20
0
40
60
80
100
120
2000 2001 2002 2003 2004 2005 2006 2007 2008
Co
nce
ntr
atio
ns
(μg
/Nm
3 )
Jakarta WHO Annual Guideline
National Standard Jakarta's Standard
Figure 40 Trend of Annual Nitrogen Dioxide Concentrations in Jakarta
μg/Nm3 = microgram per Normal cubic meter; WHO = World Health Organization.
Source: CAI–Asia. 2010.
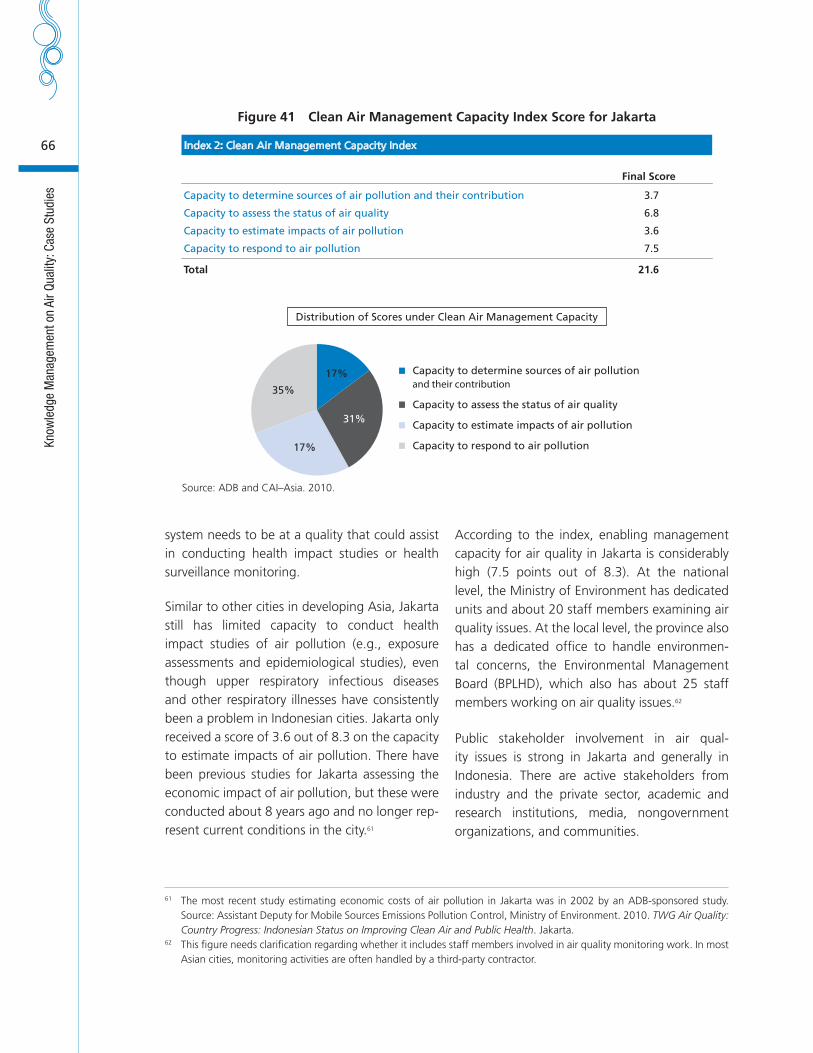
66
Know
ledg
e M
anag
emen
t on
Air Q
ualit
y: C
ase
Stud
ies
system needs to be at a quality that could assist in conducting health impact studies or health surveillance monitoring.
Similar to other cities in developing Asia, Jakarta still has limited capacity to conduct health impact studies of air pollution (e.g., exposure assessments and epidemiological studies), even though upper respiratory infectious diseases and other respiratory illnesses have consistently been a problem in Indonesian cities. Jakarta only received a score of 3.6 out of 8.3 on the capacity to estimate impacts of air pollution. There have been previous studies for Jakarta assessing the economic impact of air pollution, but these were conducted about 8 years ago and no longer rep-resent current conditions in the city.61
According to the index, enabling management capacity for air quality in Jakarta is considerably high (7.5 points out of 8.3). At the national level, the Ministry of Environment has dedicated units and about 20 staff members examining air quality issues. At the local level, the province also has a dedicated office to handle environmen-tal concerns, the Environmental Management Board (BPLHD), which also has about 25 staff members working on air quality issues.62
Public stakeholder involvement in air qual-ity issues is strong in Jakarta and generally in Indonesia. There are active stakeholders from industry and the private sector, academic and research institutions, media, nongovernment organizations, and communities.
Index 2: Clean Air Management Capacity Index
Final Score
3.7
Capacity to assess the status of air quality 6.8
Capacity to estimate impacts of air pollution 3.6
Capacity to respond to air pollution 7.5
Total 21.6
Capacity to determine sources of air pollution and their contribution
Capacity to determine sources of air pollution and their contribution
Capacity to assess the status of air quality
Capacity to estimate impacts of air pollution
Capacity to respond to air pollution
Distribution of Scores under Clean Air Management Capacity
17%
17%
35%
31%
Figure 41 Clean Air Management Capacity Index Score for Jakarta
Source: ADB and CAI–Asia. 2010.
61 The most recent study estimating economic costs of air pollution in Jakarta was in 2002 by an ADB-sponsored study. Source: Assistant Deputy for Mobile Sources Emissions Pollution Control, Ministry of Environment. 2010. TWG Air Quality: Country Progress: Indonesian Status on Improving Clean Air and Public Health. Jakarta.
62 This figure needs clarification regarding whether it includes staff members involved in air quality monitoring work. In most Asian cities, monitoring activities are often handled by a third-party contractor.
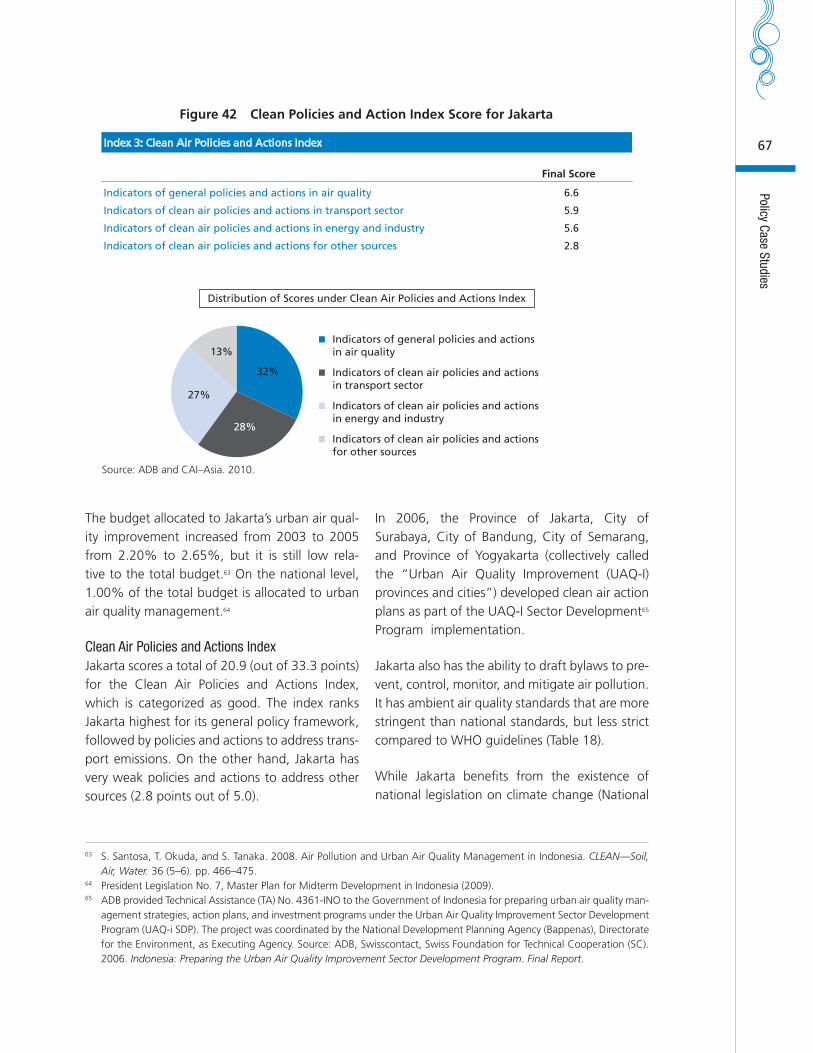
67
Policy Case Studies
The budget allocated to Jakarta’s urban air qual-ity improvement increased from 2003 to 2005 from 2.20% to 2.65%, but it is still low rela-tive to the total budget.63 On the national level, 1.00% of the total budget is allocated to urban air quality management.64
Clean Air Policies and Actions IndexJakarta scores a total of 20.9 (out of 33.3 points) for the Clean Air Policies and Actions Index, which is categorized as good. The index ranks Jakarta highest for its general policy framework, followed by policies and actions to address trans-port emissions. On the other hand, Jakarta has very weak policies and actions to address other sources (2.8 points out of 5.0).
63 S. Santosa, T. Okuda, and S. Tanaka. 2008. Air Pollution and Urban Air Quality Management in Indonesia. CLEAN—Soil, Air, Water. 36 (5–6). pp. 466–475.
64 President Legislation No. 7, Master Plan for Midterm Development in Indonesia (2009).65 ADB provided Technical Assistance (TA) No. 4361-INO to the Government of Indonesia for preparing urban air quality man-
agement strategies, action plans, and investment programs under the Urban Air Quality Improvement Sector Development Program (UAQ-i SDP). The project was coordinated by the National Development Planning Agency (Bappenas), Directorate for the Environment, as Executing Agency. Source: ADB, Swisscontact, Swiss Foundation for Technical Cooperation (SC). 2006. Indonesia: Preparing the Urban Air Quality Improvement Sector Development Program. Final Report.
In 2006, the Province of Jakarta, City of Surabaya, City of Bandung, City of Semarang, and Province of Yogyakarta (collectively called the “Urban Air Quality Improvement (UAQ-I) provinces and cities”) developed clean air action plans as part of the UAQ-I Sector Development65
Program implementation.
Jakarta also has the ability to draft bylaws to pre-vent, control, monitor, and mitigate air pollution. It has ambient air quality standards that are more stringent than national standards, but less strict compared to WHO guidelines (Table 18).
While Jakarta benefits from the existence of national legislation on climate change (National
Figure 42 Clean Policies and Action Index Score for Jakarta
Index 3: Clean Air Policies and Actions Index
Final Score
6.6
Indicators of clean air policies and actions in transport sector 5.9
Indicators of clean air policies and actions in energy and industry 5.6
Indicators of clean air policies and actions for other sources 2.8
Indicators of general policies and actions in air quality
Indicators of general policies and actionsin air quality
Indicators of clean air policies and actionsin transport sector
Indicators of clean air policies and actionsin energy and industry
Indicators of clean air policies and actionsfor other sources
Distribution of Scores under Clean Air Policies and Actions Index
32%
27%
13%
28%
Source: ADB and CAI–Asia. 2010.
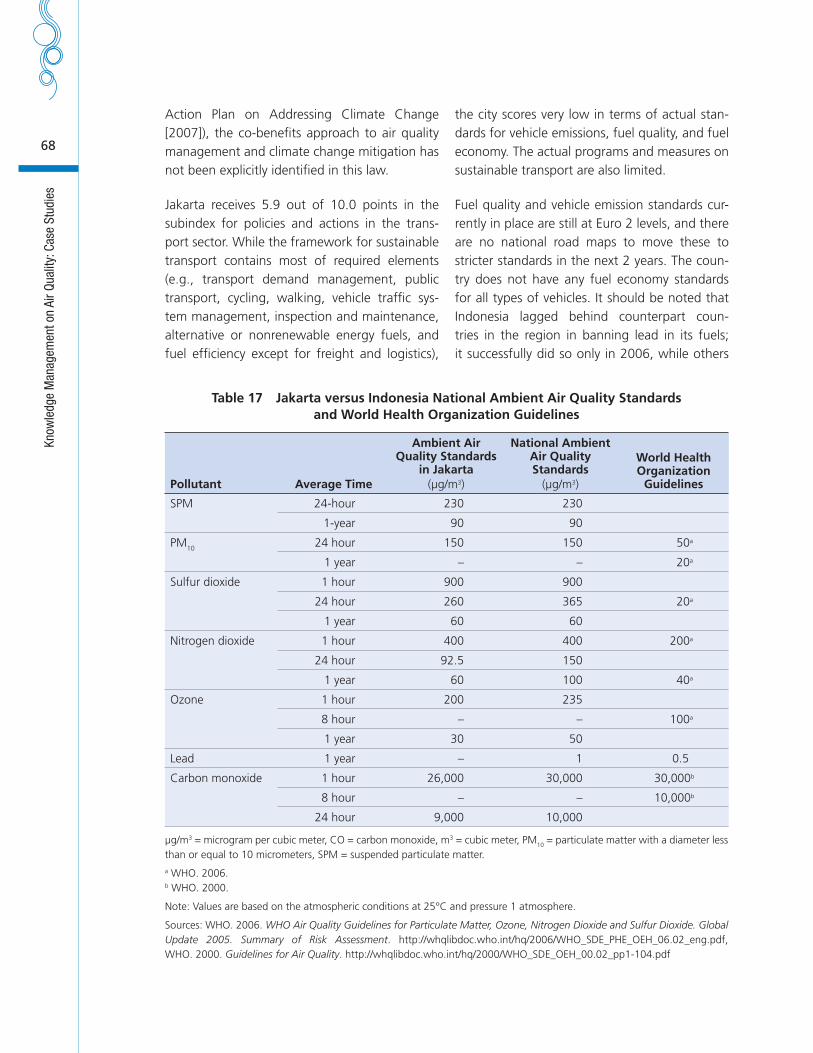
68
Know
ledg
e M
anag
emen
t on
Air Q
ualit
y: C
ase
Stud
ies
Action Plan on Addressing Climate Change [2007]), the co-benefits approach to air quality management and climate change mitigation has not been explicitly identified in this law.
Jakarta receives 5.9 out of 10.0 points in the subindex for policies and actions in the trans-port sector. While the framework for sustainable transport contains most of required elements (e.g., transport demand management, public transport, cycling, walking, vehicle traffic sys-tem management, inspection and maintenance, alternative or nonrenewable energy fuels, and fuel efficiency except for freight and logistics),
the city scores very low in terms of actual stan-dards for vehicle emissions, fuel quality, and fuel economy. The actual programs and measures on sustainable transport are also limited.
Fuel quality and vehicle emission standards cur-rently in place are still at Euro 2 levels, and there are no national road maps to move these to stricter standards in the next 2 years. The coun-try does not have any fuel economy standards for all types of vehicles. It should be noted that Indonesia lagged behind counterpart coun-tries in the region in banning lead in its fuels; it successfully did so only in 2006, while others
Table 17 Jakarta versus Indonesia National Ambient Air Quality Standards and World Health Organization Guidelines
Pollutant Average Time
Ambient Air Quality Standards
in Jakarta (μg/m3)
National Ambient Air Quality Standards
(μg/m3)
World Health Organization
Guidelines
SPM 24-hour 230 230
1-year 90 90
PM10 24 hour 150 150 50a
1 year – – 20a
Sulfur dioxide 1 hour 900 900
24 hour 260 365 20a
1 year 60 60
Nitrogen dioxide 1 hour 400 400 200a
24 hour 92.5 150
1 year 60 100 40a
Ozone 1 hour 200 235
8 hour – – 100a
1 year 30 50
Lead 1 year – 1 0.5
Carbon monoxide 1 hour 26,000 30,000 30,000b
8 hour – – 10,000b
24 hour 9,000 10,000
μg/m3 = microgram per cubic meter, CO = carbon monoxide, m3 = cubic meter, PM10 = particulate matter with a diameter less than or equal to 10 micrometers, SPM = suspended particulate matter.a WHO. 2006.b WHO. 2000.
Note: Values are based on the atmospheric conditions at 25°C and pressure 1 atmosphere.
Sources: WHO. 2006. WHO Air Quality Guidelines for Particulate Matter, Ozone, Nitrogen Dioxide and Sulfur Dioxide. Global Update 2005. Summary of Risk Assessment. http://whqlibdoc.who.int/hq/2006/WHO_SDE_PHE_OEH_06.02_eng.pdf, WHO. 2000. Guidelines for Air Quality. http://whqlibdoc.who.int/hq/2000/WHO_SDE_OEH_00.02_pp1-104.pdf

69
Policy Case Studies
completely phased out the harmful additive as early as 2000.
In Jakarta, there are also some bylaws from the governor pertaining to traffic and transport (e.g., Province of Jakarta Bylaw No. 12 concerning Traffic and Transportation [2003] and Governor Decree No. 84 concerning Macro Transportation Plan for 2007, 2010, and 2020 [2004]). These enable the city to further promote its bus rapid transit and feeder system; rail-based transport system (i.e., train, mass rapid transit, monorail, and light rail train); river transport; and the intro-duction of travel demand management mea-sures such as traffic and parking restrictions.
Another innovative measure in Jakarta is the Transjakarta Bus Rapid Transit System, with 8 cor-ridors of 120 kilometers, serviced by 335 com-
pressed natural gas buses and 91 diesel buses. Jakarta is also implementing schemes limiting use of certain roads for vehicles with less than three passengers.
The policies and actions for Jakarta to man-age emissions from energy and industry receive 5.6 points out of a total of 8.3 points. The gen-eral framework to manage emissions is available, as this covers most elements such as permitting, compliance monitoring, energy efficiency, sit-ing, and industry prioritization. Emission stan-dards also exist for different industries such as power-generating facilities; food, beverage, and tobacco manufacturing; incinerators; and steel smelters. The measures to control emissions from industries, however, are still fairly traditional and based on a command-and-control approach, as there are no technology-transfer networks to
Table 18 Recommendations for Jakarta
Recommendations Priority
Air Pollution and Health Index
Start monitoring PM2.5. High
Clean Air Management Capacity Index
Improve air quality monitoring system by adding more stations. High
Improve quality control and assurance systems for air quality monitoring. High
Improve emission inventory by covering additional sources such as water and air transport. Medium
Strengthen capacity to estimate impacts of air pollution (include impacts on agriculture and heritage structures).
Medium
Clean Air Policies and Actions
Review air pollution-control regulation to prepare for drafting of more comprehensive clean air act.
Medium
Explore opportunities for co-benefits approach within the National Climate Change Action Plan.
High
Develop road map for fuel quality and vehicle emission standards to move from Euro 2 to more stringent standards.
Medium
Develop technology-transfer networks that will both look at addressing air pollutants and greenhouse gas emissions.
Medium
Create a tax incentive mechanism for energy efficiency in industry. Medium
Continue initiated efforts on the development of an environmentally sustainable transport strategy.
High
Create voluntary programs and tax incentives for energy-efficient or alternative vehicles. Medium
PM2.5 = particulate matter with a diameter of 2.5 microns or less.
Source: ADB and CAI–Asia. 2010.
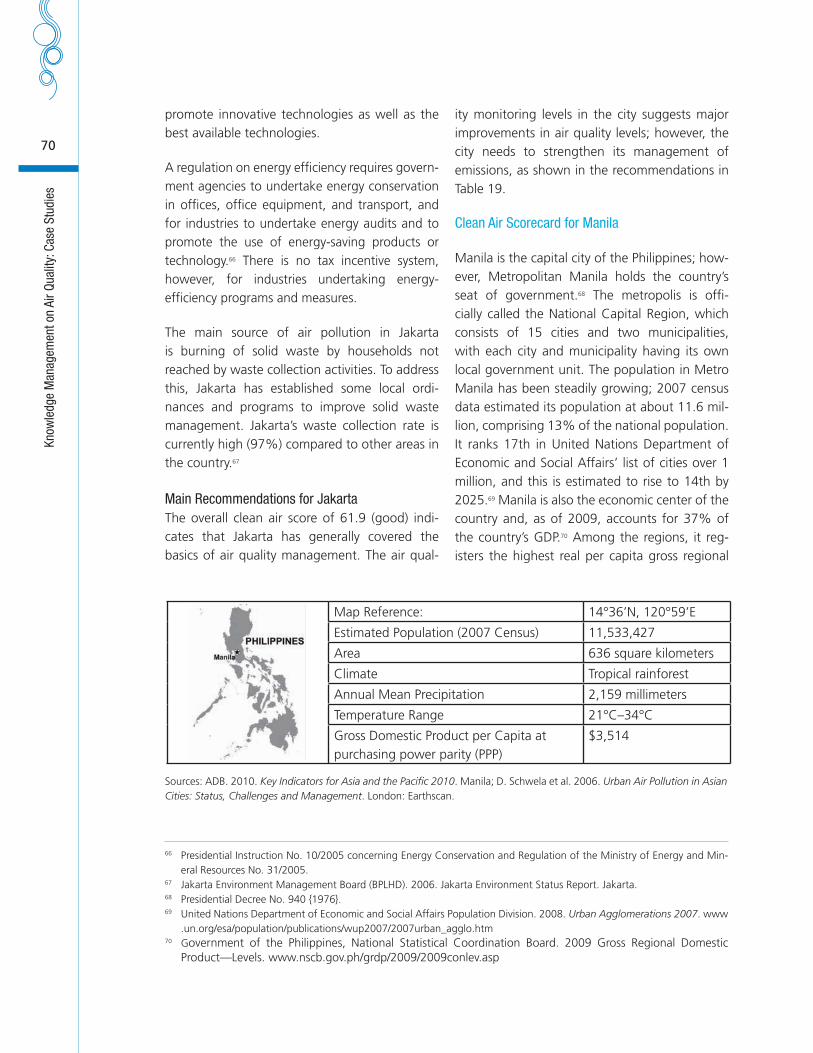
70
Know
ledg
e M
anag
emen
t on
Air Q
ualit
y: C
ase
Stud
ies
promote innovative technologies as well as the best available technologies.
A regulation on energy efficiency requires govern-ment agencies to undertake energy conservation in offices, office equipment, and transport, and for industries to undertake energy audits and to promote the use of energy-saving products or technology.66 There is no tax incentive system, however, for industries undertaking energy- efficiency programs and measures.
The main source of air pollution in Jakarta is burning of solid waste by households not reached by waste collection activities. To address this, Jakarta has established some local ordi-nances and programs to improve solid waste management. Jakarta’s waste collection rate is currently high (97%) compared to other areas in the country.67
Main Recommendations for JakartaThe overall clean air score of 61.9 (good) indi-cates that Jakarta has generally covered the basics of air quality management. The air qual-
ity monitoring levels in the city suggests major improvements in air quality levels; however, the city needs to strengthen its management of emissions, as shown in the recommendations in Table 19.
Clean Air Scorecard for Manila
Manila is the capital city of the Philippines; how-ever, Metropolitan Manila holds the country’s seat of government.68 The metropolis is offi-cially called the National Capital Region, which consists of 15 cities and two municipalities, with each city and municipality having its own local government unit. The population in Metro Manila has been steadily growing; 2007 census data estimated its population at about 11.6 mil-lion, comprising 13% of the national population. It ranks 17th in United Nations Department of Economic and Social Affairs’ list of cities over 1 million, and this is estimated to rise to 14th by 2025.69 Manila is also the economic center of the country and, as of 2009, accounts for 37% of the country’s GDP.70 Among the regions, it reg-isters the highest real per capita gross regional
66 Presidential Instruction No. 10/2005 concerning Energy Conservation and Regulation of the Ministry of Energy and Min-eral Resources No. 31/2005.
67 Jakarta Environment Management Board (BPLHD). 2006. Jakarta Environment Status Report. Jakarta.68 Presidential Decree No. 940 {1976}.69 United Nations Department of Economic and Social Affairs Population Division. 2008. Urban Agglomerations 2007. www
.un.org/esa/population/publications/wup2007/2007urban_agglo.htm70 Government of the Philippines, National Statistical Coordination Board. 2009 Gross Regional Domestic
Product—Levels. www.nscb.gov.ph/grdp/2009/2009conlev.asp
Map Reference: 14°36’N, 120°59’E
Estimated Population (2007 Census) 11,533,427
Area 636 square kilometers
Climate Tropical rainforest
Annual Mean Precipitation 2,159 millimeters
Temperature Range 21°C–34°C
Gross Domestic Product per Capita at purchasing power parity (PPP)
$3,514
Sources: ADB. 2010. Key Indicators for Asia and the Pacific 2010. Manila; D. Schwela et al. 2006. Urban Air Pollution in Asian Cities: Status, Challenges and Management. London: Earthscan.
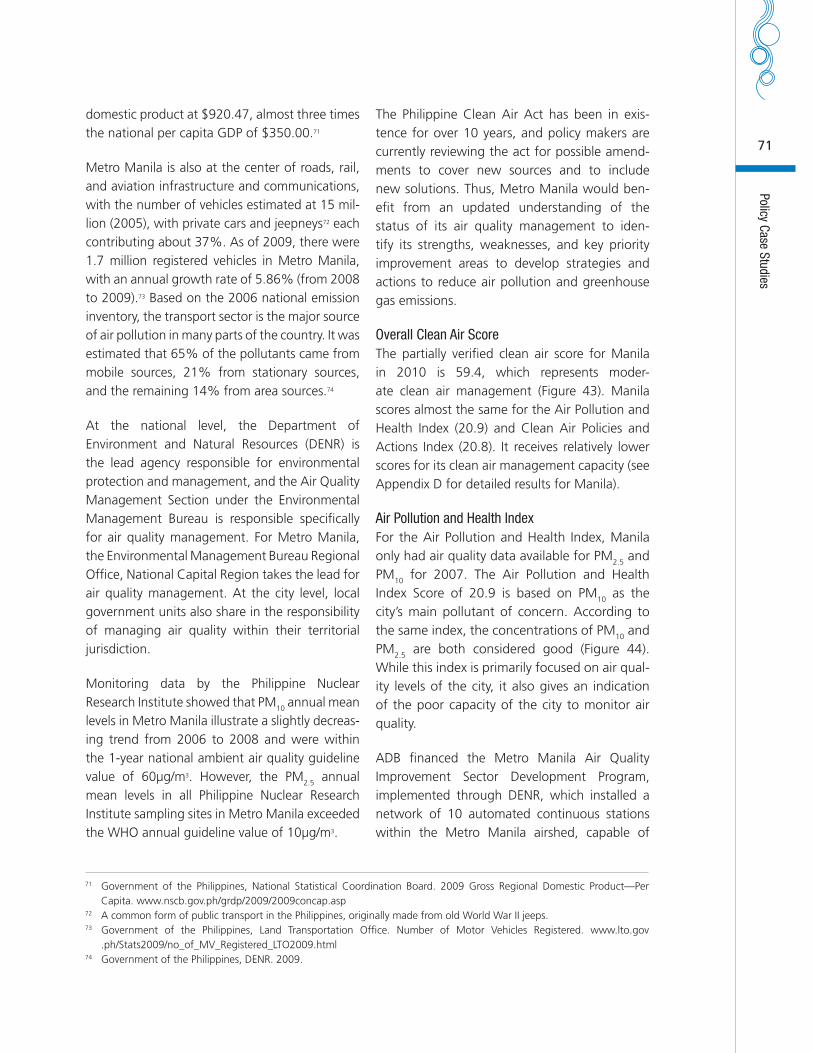
71
Policy Case Studies
domestic product at $920.47, almost three times the national per capita GDP of $350.00.71
Metro Manila is also at the center of roads, rail, and aviation infrastructure and communications, with the number of vehicles estimated at 15 mil-lion (2005), with private cars and jeepneys72 each contributing about 37%. As of 2009, there were 1.7 million registered vehicles in Metro Manila, with an annual growth rate of 5.86% (from 2008 to 2009).73 Based on the 2006 national emission inventory, the transport sector is the major source of air pollution in many parts of the country. It was estimated that 65% of the pollutants came from mobile sources, 21% from stationary sources, and the remaining 14% from area sources.74
At the national level, the Department of Environment and Natural Resources (DENR) is the lead agency responsible for environmental protection and management, and the Air Quality Management Section under the Environmental Management Bureau is responsible specifically for air quality management. For Metro Manila, the Environmental Management Bureau Regional Office, National Capital Region takes the lead for air quality management. At the city level, local government units also share in the responsibility of managing air quality within their territorial jurisdiction.
Monitoring data by the Philippine Nuclear Research Institute showed that PM10 annual mean levels in Metro Manila illustrate a slightly decreas-ing trend from 2006 to 2008 and were within the 1-year national ambient air quality guideline value of 60μg/m3. However, the PM2.5 annual mean levels in all Philippine Nuclear Research Institute sampling sites in Metro Manila exceeded the WHO annual guideline value of 10μg/m3.
The Philippine Clean Air Act has been in exis-tence for over 10 years, and policy makers are currently reviewing the act for possible amend-ments to cover new sources and to include new solutions. Thus, Metro Manila would ben-efit from an updated understanding of the status of its air quality management to iden-tify its strengths, weaknesses, and key priority improvement areas to develop strategies and actions to reduce air pollution and greenhouse gas emissions.
Overall Clean Air ScoreThe partially verified clean air score for Manila in 2010 is 59.4, which represents moder-ate clean air management (Figure 43). Manila scores almost the same for the Air Pollution and Health Index (20.9) and Clean Air Policies and Actions Index (20.8). It receives relatively lower scores for its clean air management capacity (see Appendix D for detailed results for Manila).
Air Pollution and Health IndexFor the Air Pollution and Health Index, Manila only had air quality data available for PM2.5 and PM10 for 2007. The Air Pollution and Health Index Score of 20.9 is based on PM10 as the city’s main pollutant of concern. According to the same index, the concentrations of PM10 and PM2.5 are both considered good (Figure 44). While this index is primarily focused on air qual-ity levels of the city, it also gives an indication of the poor capacity of the city to monitor air quality.
ADB financed the Metro Manila Air Quality Improvement Sector Development Program, implemented through DENR, which installed a network of 10 automated continuous stations within the Metro Manila airshed, capable of
71 Government of the Philippines, National Statistical Coordination Board. 2009 Gross Regional Domestic Product—Per Capita. www.nscb.gov.ph/grdp/2009/2009concap.asp
72 A common form of public transport in the Philippines, originally made from old World War II jeeps.73 Government of the Philippines, Land Transportation Office. Number of Motor Vehicles Registered. www.lto.gov
.ph/Stats2009/no_of_MV_Registered_LTO2009.html74 Government of the Philippines, DENR. 2009.
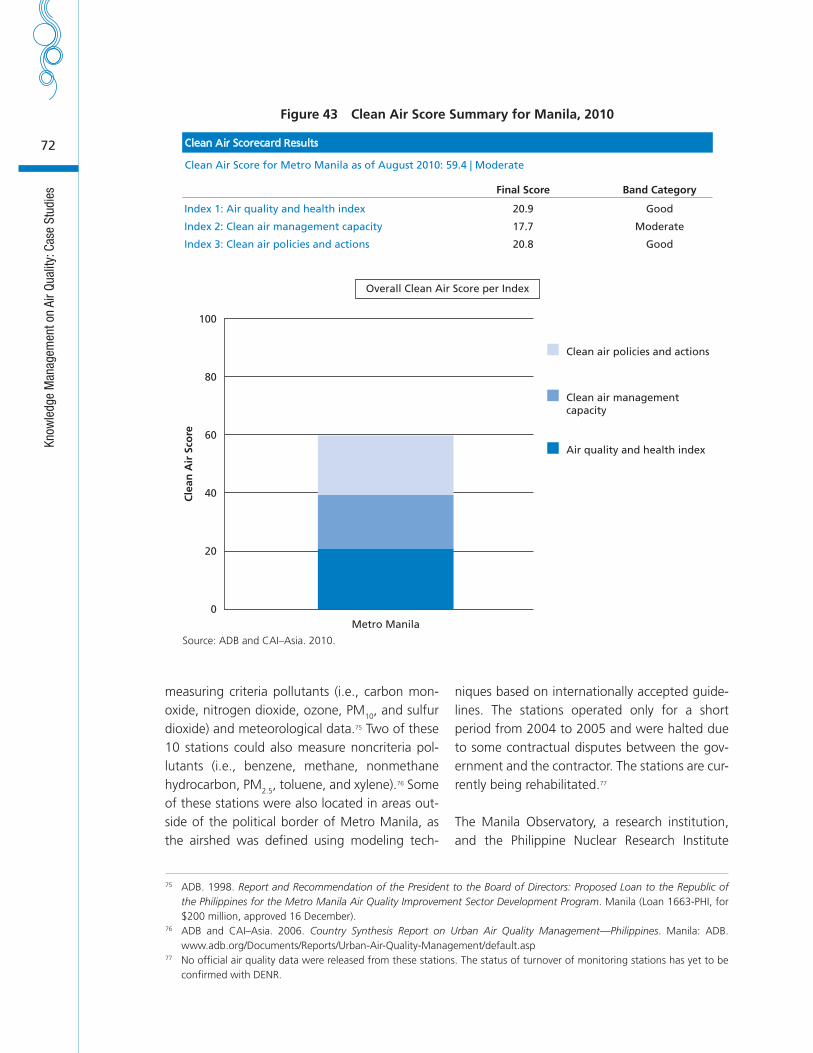
72
Know
ledg
e M
anag
emen
t on
Air Q
ualit
y: C
ase
Stud
ies
75 ADB. 1998. Report and Recommendation of the President to the Board of Directors: Proposed Loan to the Republic of the Philippines for the Metro Manila Air Quality Improvement Sector Development Program. Manila (Loan 1663-PHI, for $200 million, approved 16 December).
76 ADB and CAI–Asia. 2006. Country Synthesis Report on Urban Air Quality Management—Philippines. Manila: ADB. www.adb.org/Documents/Reports/Urban-Air-Quality-Management/default.asp
77 No official air quality data were released from these stations. The status of turnover of monitoring stations has yet to be confirmed with DENR.
Metro Manila
Clean air policies and actions
Clean air managementcapacity
Air quality and health index
0
20
40
60
80
100
Cle
an A
ir S
core
Overall Clean Air Score per Index
Clean Air Scorecard Results
Clean Air Score for Metro Manila as of August 2010: 59.4 | Moderate
Band Category
Good
Index 2: Clean air management capacity Moderate
Index 3: Clean air policies and actions Good
Final Score
20.9
17.7
20.8
Index 1: Air quality and health index
Figure 43 Clean Air Score Summary for Manila, 2010
Source: ADB and CAI–Asia. 2010.
niques based on internationally accepted guide-lines. The stations operated only for a short period from 2004 to 2005 and were halted due to some contractual disputes between the gov-ernment and the contractor. The stations are cur-rently being rehabilitated.77
The Manila Observatory, a research institution, and the Philippine Nuclear Research Institute
measuring criteria pollutants (i.e., carbon mon-oxide, nitrogen dioxide, ozone, PM10, and sulfur dioxide) and meteorological data.75 Two of these 10 stations could also measure noncriteria pol-lutants (i.e., benzene, methane, nonmethane hydrocarbon, PM2.5, toluene, and xylene).76 Some of these stations were also located in areas out-side of the political border of Metro Manila, as the airshed was defined using modeling tech-

73
Policy Case Studies
of the Department of Science and Technology also monitor air quality. The Philippine Nuclear Research Institute monitors PM10 and PM2.5 using the Gent sampler at three sites in Metro Manila. Air quality monitoring by the Manila Observatory covers PM10 and PM2.5 but only on a project basis. DENR moni-tors concentrations of total suspended particulates in 10 locations in Metro Manila. However, the current number of moni-toring stations for PM10 and PM2.5 does not meet European Union criteria for number of air quality monitoring stations according to population size and density.
Figure 45 to Figure 47 show that PM10 levels are generally in compliance with national ambient air quality standards. There are no PM2.5 stan-dards. Both PM10 and PM2.5 levels in Manila, however, consistently exceeded WHO guidelines for 2002–2008 (Table 19).
Of the 17 cities and municipalities in Metro Manila, only Makati City has conducted its own air quality monitoring but only for a limited period.
Clean Air Management Capacity IndexManila’s Clean Air Management Capacity Index score is categorized as moderate (17.7 points out
of 33.3) (Figure 47). The detailed scores per sub-index show that there is a significant imbalance of capacities to manage air quality in Manila.
Emission inventories for Metro Manila are com-piled with the national emission inventory. The inventory is prepared every 3 years by the Environmental Management Bureau and not by city authorities. It usually only covers crite-ria pollutants (i.e., carbon monoxide, dioxins, furans, nitrogen oxide and dioxide, PM2.5, PM10, sulfur dioxide, and volatile organic compounds) but may also include greenhouse gases on an ad-hoc basis. The emission sources covered are land transport, stationary sources, and area sources, and do not include emissions from water transport and air transport.
As explained earlier, the capacity of Metro Manila to monitor air quality is very weak (2.5 points out of a total 8.3). Detailed scores for the subindices show that existing instrumenta-tion is not enough (according to pollutants cov-ered and number of stations) and that capacity for analysis, reporting, and dissemination is also very weak. Results of air quality monitoring in Manila are only shared with the public through annual reports on the DENR website and upon
– = no data, μg/Nm3 = microgram per Normal cubic meter, CO = carbon monoxide, NO2 = nitrogen dioxide, O3 = ozone, Pb = lead, PM2.5 = particulate matter with a diameter of 2.5 microns or less, PM10 = particulate matter with a diameter of 10 microns or less, SO2 = sulfur dioxide.
Source: ADB and CAI–Asia. 2010.
Figure 44 Air Pollution and Health Index Score for Manila
Index 1 – Air Pollution and Health Index
Pollutant
PM2.5
PM10
O3
SO2
Pb
NO2
CO
Score
22.8
20.9
−
−
−
−
−
Category
Good
Good
−
−
−
−
−
Final Score
Pollutant of Concern
Band Category
Pollutants Considered PM10, PM2.5
20.9
PM10
Good
PM10, PM2.5
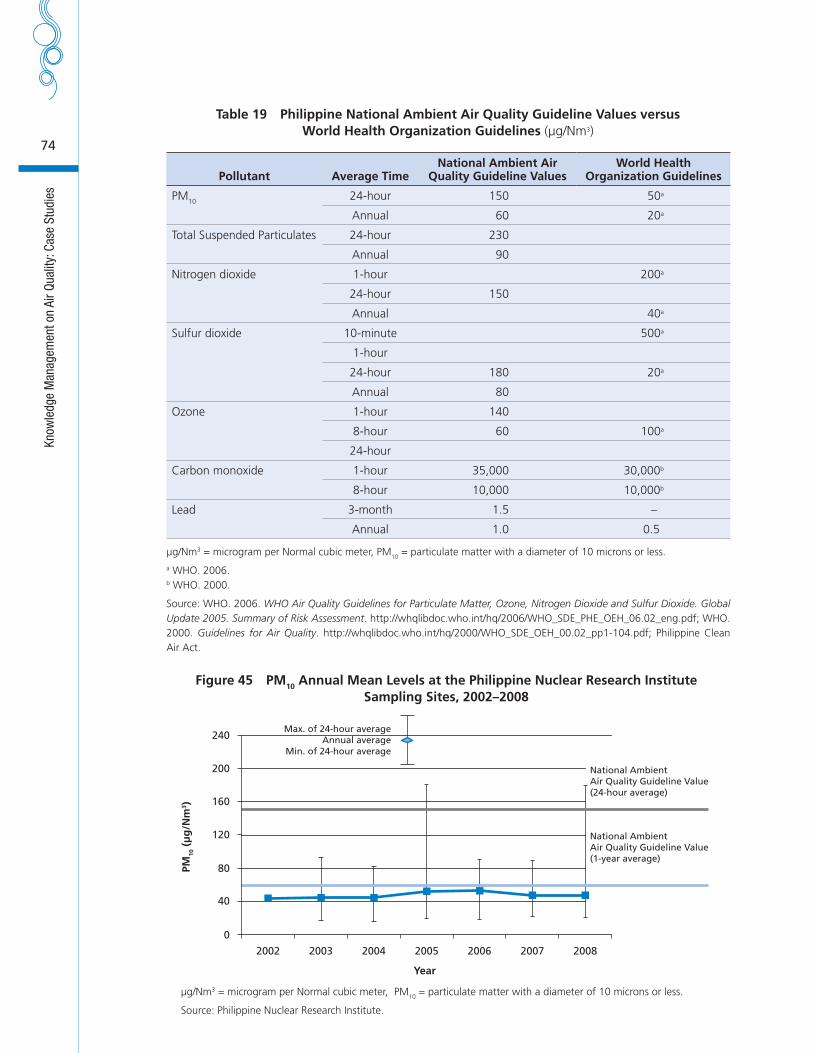
74
Know
ledg
e M
anag
emen
t on
Air Q
ualit
y: C
ase
Stud
ies
Figure 45 PM10 Annual Mean Levels at the Philippine Nuclear Research Institute Sampling Sites, 2002–2008
0
2002 2003 2004 2005
Year
Max. of 24-hour averageAnnual average
Min. of 24-hour average
National AmbientAir Quality Guideline Value(24-hour average)
National AmbientAir Quality Guideline Value(1-year average)
2006 2007 2008
40
80PM10
(μ
g/N
m3 )
120
160
200
240
μg/Nm3 = microgram per Normal cubic meter, PM10 = particulate matter with a diameter of 10 microns or less.
Source: Philippine Nuclear Research Institute.
Table 19 Philippine National Ambient Air Quality Guideline Values versus World Health Organization Guidelines (μg/Nm3)
Pollutant Average TimeNational Ambient Air
Quality Guideline ValuesWorld Health
Organization Guidelines
PM10 24-hour 150 50a
Annual 60 20a
Total Suspended Particulates 24-hour 230
Annual 90
Nitrogen dioxide 1-hour 200a
24-hour 150
Annual 40a
Sulfur dioxide 10-minute 500a
1-hour
24-hour 180 20a
Annual 80
Ozone 1-hour 140
8-hour 60 100a
24-hour
Carbon monoxide 1-hour 35,000 30,000b
8-hour 10,000 10,000b
Lead 3-month 1.5 –
Annual 1.0 0.5
μg/Nm3 = microgram per Normal cubic meter, PM10 = particulate matter with a diameter of 10 microns or less.a WHO. 2006.b WHO. 2000.
Source: WHO. 2006. WHO Air Quality Guidelines for Particulate Matter, Ozone, Nitrogen Dioxide and Sulfur Dioxide. Global Update 2005. Summary of Risk Assessment. http://whqlibdoc.who.int/hq/2006/WHO_SDE_PHE_OEH_06.02_eng.pdf; WHO. 2000. Guidelines for Air Quality. http://whqlibdoc.who.int/hq/2000/WHO_SDE_OEH_00.02_pp1-104.pdf; Philippine Clean Air Act.
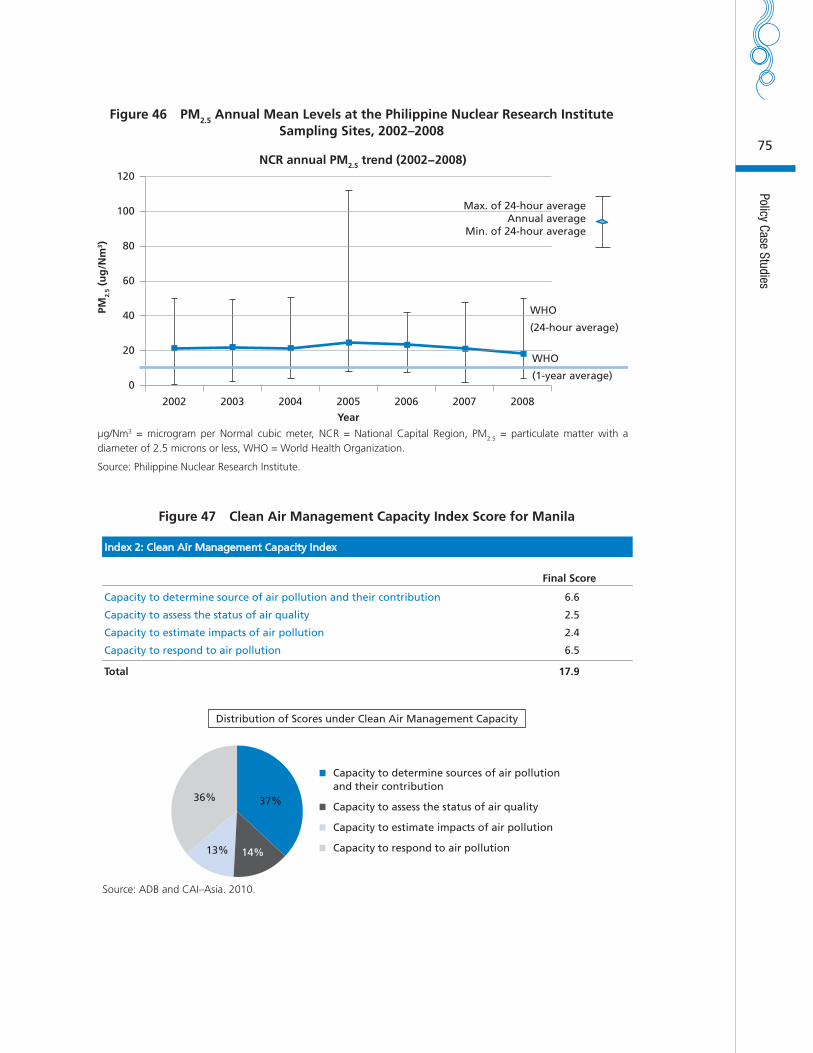
75
Policy Case Studies
Figure 46 PM2.5 Annual Mean Levels at the Philippine Nuclear Research Institute Sampling Sites, 2002–2008
0
20
40
60
80
100
120
2002 2003 2004 2005 2006 2007 2008
PM2.
5 (u
g/N
m3 )
Year
NCR annual PM2.5 trend (2002−2008)
WHO
(1-year average)
WHO
(24-hour average)
Max. of 24-hour averageAnnual average
Min. of 24-hour average
μg/Nm3 = microgram per Normal cubic meter, NCR = National Capital Region, PM2.5 = particulate matter with a diameter of 2.5 microns or less, WHO = World Health Organization.
Source: Philippine Nuclear Research Institute.
Figure 47 Clean Air Management Capacity Index Score for Manila
Index 2: Clean Air Management Capacity Index
Final Score
6.6
Capacity to assess the status of air quality 2.5
Capacity to estimate impacts of air pollution 2.4
Capacity to respond to air pollution 6.5
Total 17.9
Capacity to determine source of air pollution and their contribution
Capacity to determine sources of air pollution and their contribution
Capacity to assess the status of air quality
Capacity to estimate impacts of air pollution
Capacity to respond to air pollution
Distribution of Scores under Clean Air Management Capacity
37%36%
13% 14%
Source: ADB and CAI–Asia. 2010.
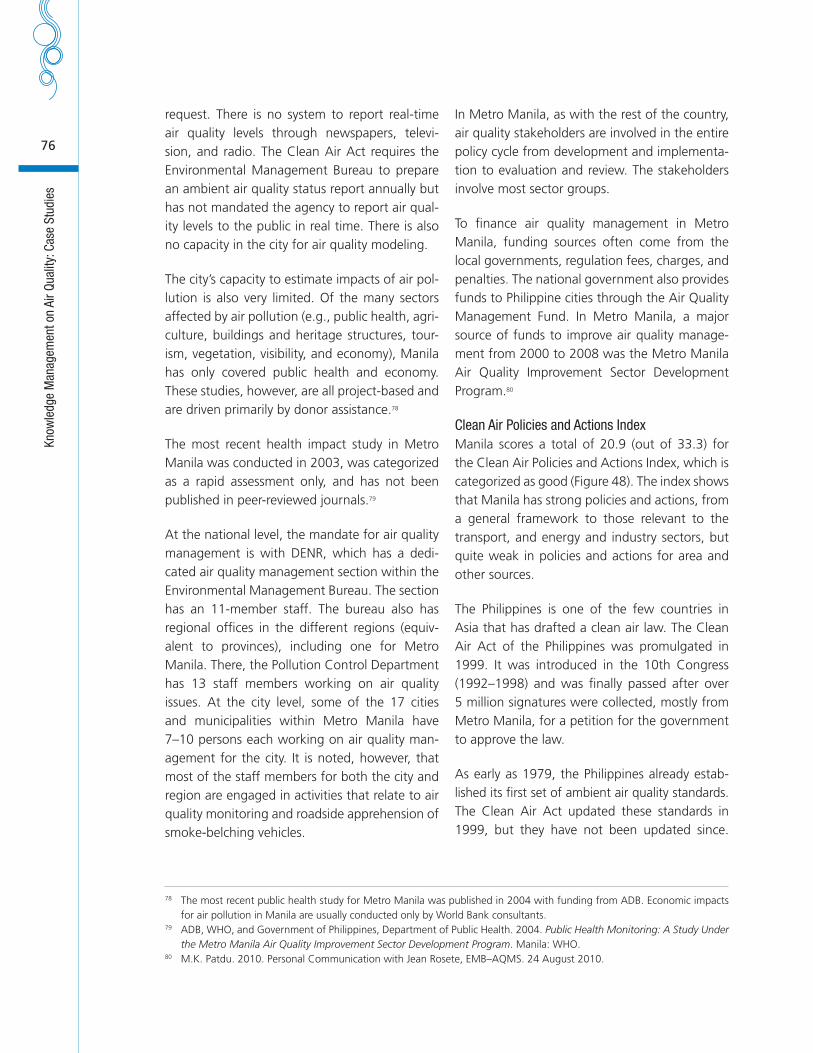
76
Know
ledg
e M
anag
emen
t on
Air Q
ualit
y: C
ase
Stud
ies
request. There is no system to report real-time air quality levels through newspapers, televi-sion, and radio. The Clean Air Act requires the Environmental Management Bureau to prepare an ambient air quality status report annually but has not mandated the agency to report air qual-ity levels to the public in real time. There is also no capacity in the city for air quality modeling.
The city’s capacity to estimate impacts of air pol-lution is also very limited. Of the many sectors affected by air pollution (e.g., public health, agri-culture, buildings and heritage structures, tour-ism, vegetation, visibility, and economy), Manila has only covered public health and economy. These studies, however, are all project-based and are driven primarily by donor assistance.78
The most recent health impact study in Metro Manila was conducted in 2003, was categorized as a rapid assessment only, and has not been published in peer-reviewed journals.79
At the national level, the mandate for air quality management is with DENR, which has a dedi-cated air quality management section within the Environmental Management Bureau. The section has an 11-member staff. The bureau also has regional offices in the different regions (equiv-alent to provinces), including one for Metro Manila. There, the Pollution Control Department has 13 staff members working on air quality issues. At the city level, some of the 17 cities and municipalities within Metro Manila have 7–10 persons each working on air quality man-agement for the city. It is noted, however, that most of the staff members for both the city and region are engaged in activities that relate to air quality monitoring and roadside apprehension of smoke-belching vehicles.
In Metro Manila, as with the rest of the country, air quality stakeholders are involved in the entire policy cycle from development and implementa-tion to evaluation and review. The stakeholders involve most sector groups.
To finance air quality management in Metro Manila, funding sources often come from the local governments, regulation fees, charges, and penalties. The national government also provides funds to Philippine cities through the Air Quality Management Fund. In Metro Manila, a major source of funds to improve air quality manage-ment from 2000 to 2008 was the Metro Manila Air Quality Improvement Sector Development Program.80
Clean Air Policies and Actions IndexManila scores a total of 20.9 (out of 33.3) for the Clean Air Policies and Actions Index, which is categorized as good (Figure 48). The index shows that Manila has strong policies and actions, from a general framework to those relevant to the transport, and energy and industry sectors, but quite weak in policies and actions for area and other sources.
The Philippines is one of the few countries in Asia that has drafted a clean air law. The Clean Air Act of the Philippines was promulgated in 1999. It was introduced in the 10th Congress (1992–1998) and was finally passed after over 5 million signatures were collected, mostly from Metro Manila, for a petition for the government to approve the law.
As early as 1979, the Philippines already estab-lished its first set of ambient air quality standards. The Clean Air Act updated these standards in 1999, but they have not been updated since.
78 The most recent public health study for Metro Manila was published in 2004 with funding from ADB. Economic impacts for air pollution in Manila are usually conducted only by World Bank consultants.
79 ADB, WHO, and Government of Philippines, Department of Public Health. 2004. Public Health Monitoring: A Study Under the Metro Manila Air Quality Improvement Sector Development Program. Manila: WHO.
80 M.K. Patdu. 2010. Personal Communication with Jean Rosete, EMB–AQMS. 24 August 2010.
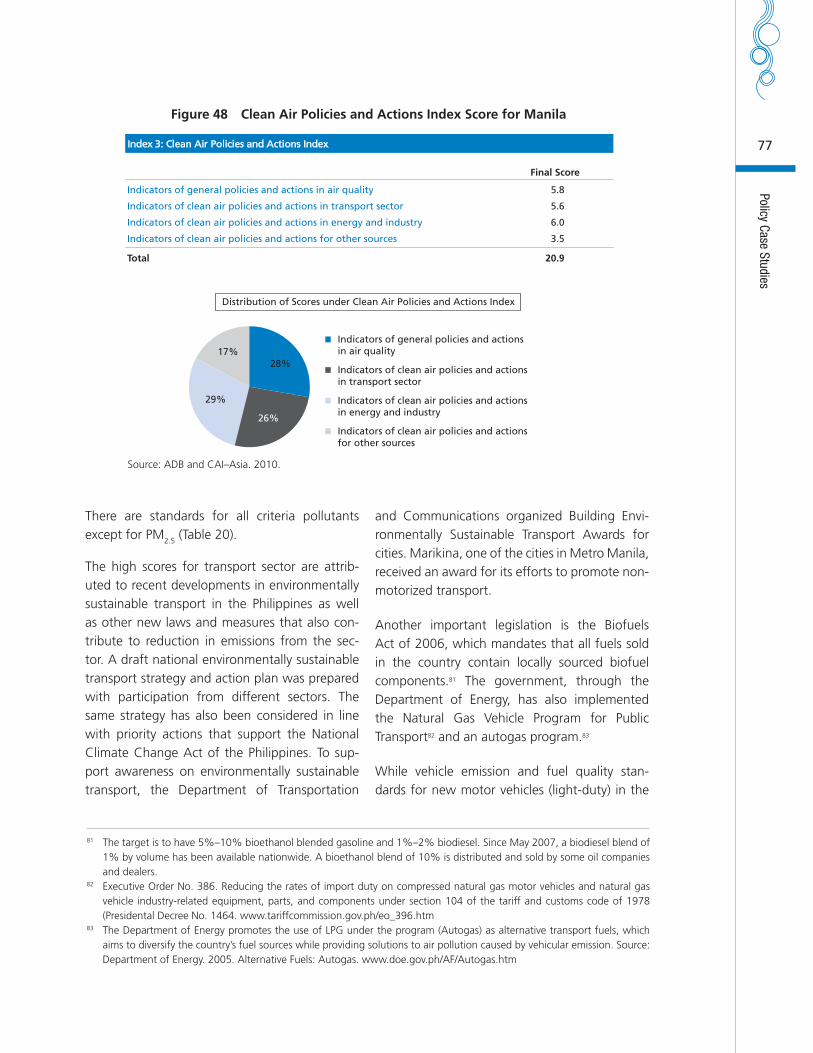
77
Policy Case Studies
There are standards for all criteria pollutants except for PM2.5 (Table 20).
The high scores for transport sector are attrib-uted to recent developments in environmentally sustainable transport in the Philippines as well as other new laws and measures that also con-tribute to reduction in emissions from the sec-tor. A draft national environmentally sustainable transport strategy and action plan was prepared with participation from different sectors. The same strategy has also been considered in line with priority actions that support the National Climate Change Act of the Philippines. To sup-port awareness on environmentally sustainable transport, the Department of Transportation
and Communications organized Building Envi-ronmentally Sustainable Transport Awards for cities. Marikina, one of the cities in Metro Manila, received an award for its efforts to promote non-motorized transport.
Another important legislation is the Biofuels Act of 2006, which mandates that all fuels sold in the country contain locally sourced biofuel components.81 The government, through the Department of Energy, has also implemented the Natural Gas Vehicle Program for Public Transport82 and an autogas program.83
While vehicle emission and fuel quality stan-dards for new motor vehicles (light-duty) in the
81 The target is to have 5%–10% bioethanol blended gasoline and 1%–2% biodiesel. Since May 2007, a biodiesel blend of 1% by volume has been available nationwide. A bioethanol blend of 10% is distributed and sold by some oil companies and dealers.
82 Executive Order No. 386. Reducing the rates of import duty on compressed natural gas motor vehicles and natural gas vehicle industry-related equipment, parts, and components under section 104 of the tariff and customs code of 1978 (Presidental Decree No. 1464. www.tariffcommission.gov.ph/eo_396.htm
83 The Department of Energy promotes the use of LPG under the program (Autogas) as alternative transport fuels, which aims to diversify the country’s fuel sources while providing solutions to air pollution caused by vehicular emission. Source: Department of Energy. 2005. Alternative Fuels: Autogas. www.doe.gov.ph/AF/Autogas.htm
Figure 48 Clean Air Policies and Actions Index Score for Manila
Index 3: Clean Air Policies and Actions Index
Final Score
5.8
Indicators of clean air policies and actions in transport sector 5.6
Indicators of clean air policies and actions in energy and industry 6.0
Indicators of clean air policies and actions for other sources 3.5
Total 20.9
Indicators of general policies and actions in air quality
Distribution of Scores under Clean Air Policies and Actions Index
Indicators of general policies and actionsin air quality
Indicators of clean air policies and actionsin transport sector
Indicators of clean air policies and actionsin energy and industry
Indicators of clean air policies and actionsfor other sources
28%
29%
17%
26%
Source: ADB and CAI–Asia. 2010.
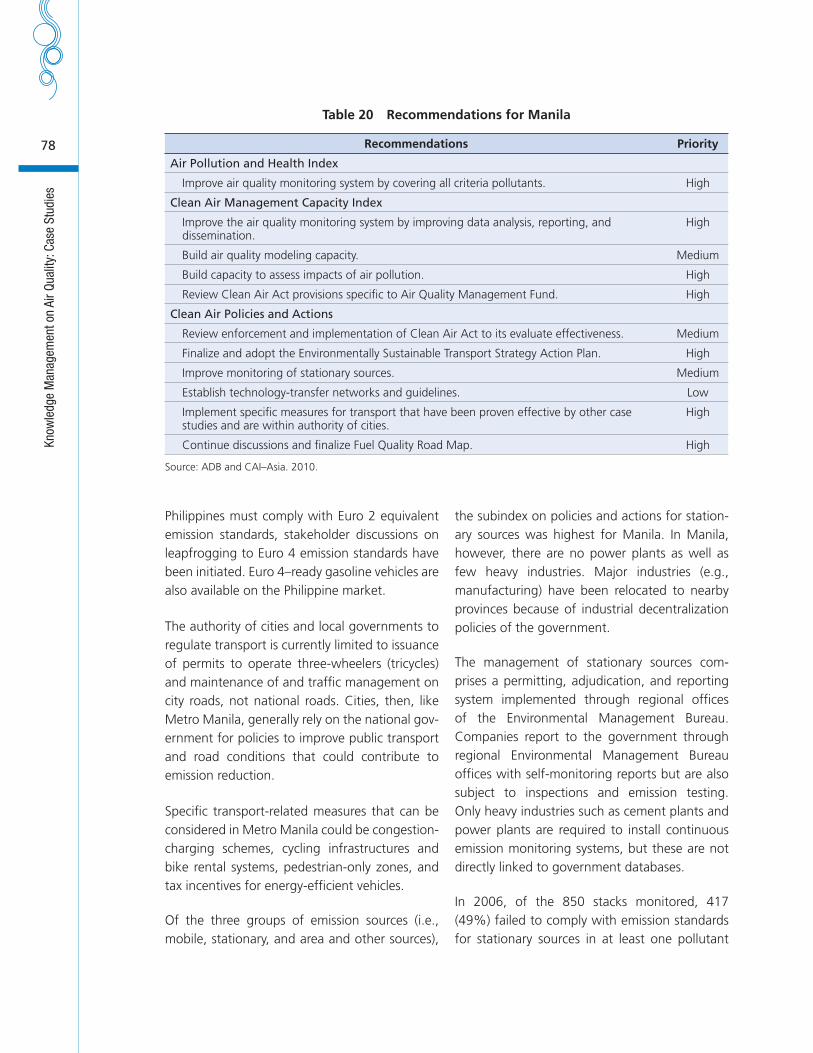
78
Know
ledg
e M
anag
emen
t on
Air Q
ualit
y: C
ase
Stud
ies
Philippines must comply with Euro 2 equivalent emission standards, stakeholder discussions on leapfrogging to Euro 4 emission standards have been initiated. Euro 4–ready gasoline vehicles are also available on the Philippine market.
The authority of cities and local governments to regulate transport is currently limited to issuance of permits to operate three-wheelers (tricycles) and maintenance of and traffic management on city roads, not national roads. Cities, then, like Metro Manila, generally rely on the national gov-ernment for policies to improve public transport and road conditions that could contribute to emission reduction.
Specific transport-related measures that can be considered in Metro Manila could be congestion-charging schemes, cycling infrastructures and bike rental systems, pedestrian-only zones, and tax incentives for energy-efficient vehicles.
Of the three groups of emission sources (i.e., mobile, stationary, and area and other sources),
the subindex on policies and actions for station-ary sources was highest for Manila. In Manila, however, there are no power plants as well as few heavy industries. Major industries (e.g., manufacturing) have been relocated to nearby provinces because of industrial decentralization policies of the government.
The management of stationary sources com-prises a permitting, adjudication, and reporting system implemented through regional offices of the Environmental Management Bureau. Companies report to the government through regional Environmental Management Bureau offices with self-monitoring reports but are also subject to inspections and emission testing. Only heavy industries such as cement plants and power plants are required to install continuous emission monitoring systems, but these are not directly linked to government databases.
In 2006, of the 850 stacks monitored, 417 (49%) failed to comply with emission standards for stationary sources in at least one pollutant
Table 20 Recommendations for Manila
Recommendations Priority
Air Pollution and Health Index
Improve air quality monitoring system by covering all criteria pollutants. High
Clean Air Management Capacity Index
Improve the air quality monitoring system by improving data analysis, reporting, and dissemination.
High
Build air quality modeling capacity. Medium
Build capacity to assess impacts of air pollution. High
Review Clean Air Act provisions specific to Air Quality Management Fund. High
Clean Air Policies and Actions
Review enforcement and implementation of Clean Air Act to its evaluate effectiveness. Medium
Finalize and adopt the Environmentally Sustainable Transport Strategy Action Plan. High
Improve monitoring of stationary sources. Medium
Establish technology-transfer networks and guidelines. Low
Implement specific measures for transport that have been proven effective by other case studies and are within authority of cities.
High
Continue discussions and finalize Fuel Quality Road Map. High
Source: ADB and CAI–Asia. 2010.
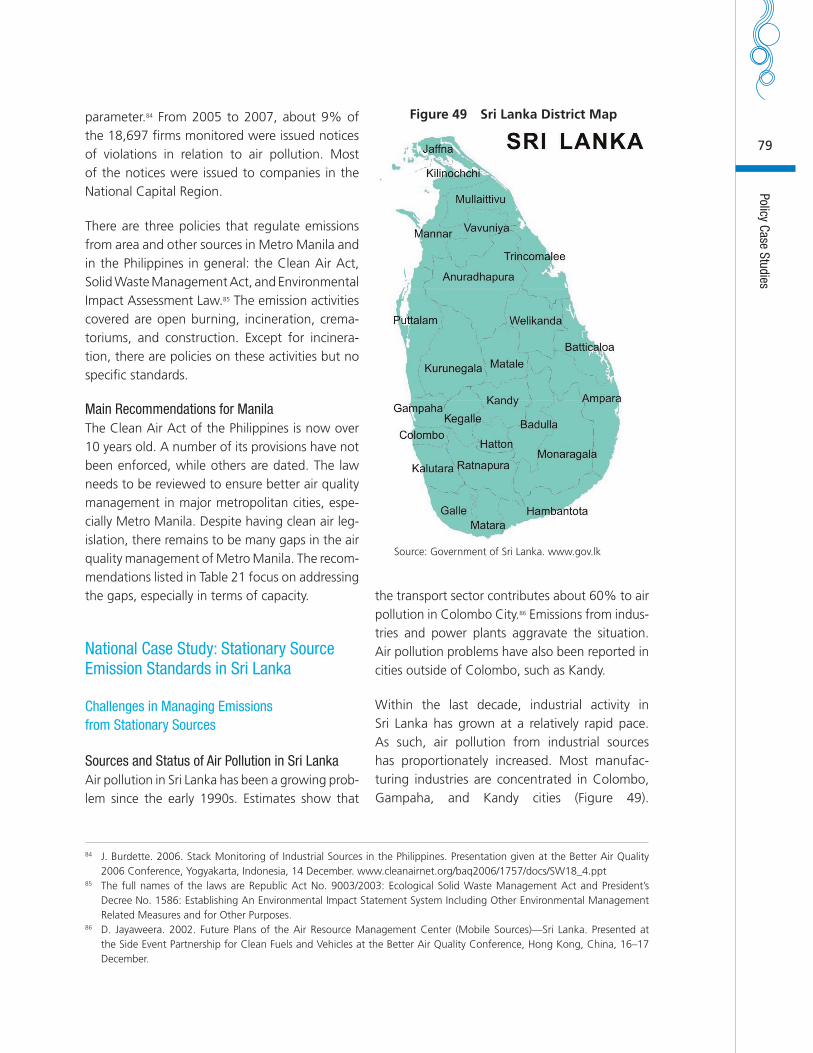
79
Policy Case Studies
parameter.84 From 2005 to 2007, about 9% of the 18,697 firms monitored were issued notices of violations in relation to air pollution. Most of the notices were issued to companies in the National Capital Region.
There are three policies that regulate emissions from area and other sources in Metro Manila and in the Philippines in general: the Clean Air Act, Solid Waste Management Act, and Environmental Impact Assessment Law.85 The emission activities covered are open burning, incineration, crema-toriums, and construction. Except for incinera-tion, there are policies on these activities but no specific standards.
Main Recommendations for ManilaThe Clean Air Act of the Philippines is now over 10 years old. A number of its provisions have not been enforced, while others are dated. The law needs to be reviewed to ensure better air quality management in major metropolitan cities, espe-cially Metro Manila. Despite having clean air leg-islation, there remains to be many gaps in the air quality management of Metro Manila. The recom-mendations listed in Table 21 focus on addressing the gaps, especially in terms of capacity.
National Case Study: Stationary Source Emission Standards in Sri Lanka
Challenges in Managing Emissions from Stationary Sources
Sources and Status of Air Pollution in Sri LankaAir pollution in Sri Lanka has been a growing prob-lem since the early 1990s. Estimates show that
the transport sector contributes about 60% to air pollution in Colombo City.86 Emissions from indus-tries and power plants aggravate the situation. Air pollution problems have also been reported in cities outside of Colombo, such as Kandy.
Within the last decade, industrial activity in Sri Lanka has grown at a relatively rapid pace. As such, air pollution from industrial sources has proportionately increased. Most manufac-turing industries are concentrated in Colombo, Gampaha, and Kandy cities (Figure 49).
84 J. Burdette. 2006. Stack Monitoring of Industrial Sources in the Philippines. Presentation given at the Better Air Quality 2006 Conference, Yogyakarta, Indonesia, 14 December. www.cleanairnet.org/baq2006/1757/docs/SW18_4.ppt
85 The full names of the laws are Republic Act No. 9003/2003: Ecological Solid Waste Management Act and President’s Decree No. 1586: Establishing An Environmental Impact Statement System Including Other Environmental Management Related Measures and for Other Purposes.
86 D. Jayaweera. 2002. Future Plans of the Air Resource Management Center (Mobile Sources)—Sri Lanka. Presented at the Side Event Partnership for Clean Fuels and Vehicles at the Better Air Quality Conference, Hong Kong, China, 16–17 December.
Figure 49 Sri Lanka District Map
Source: Government of Sri Lanka. www.gov.lk
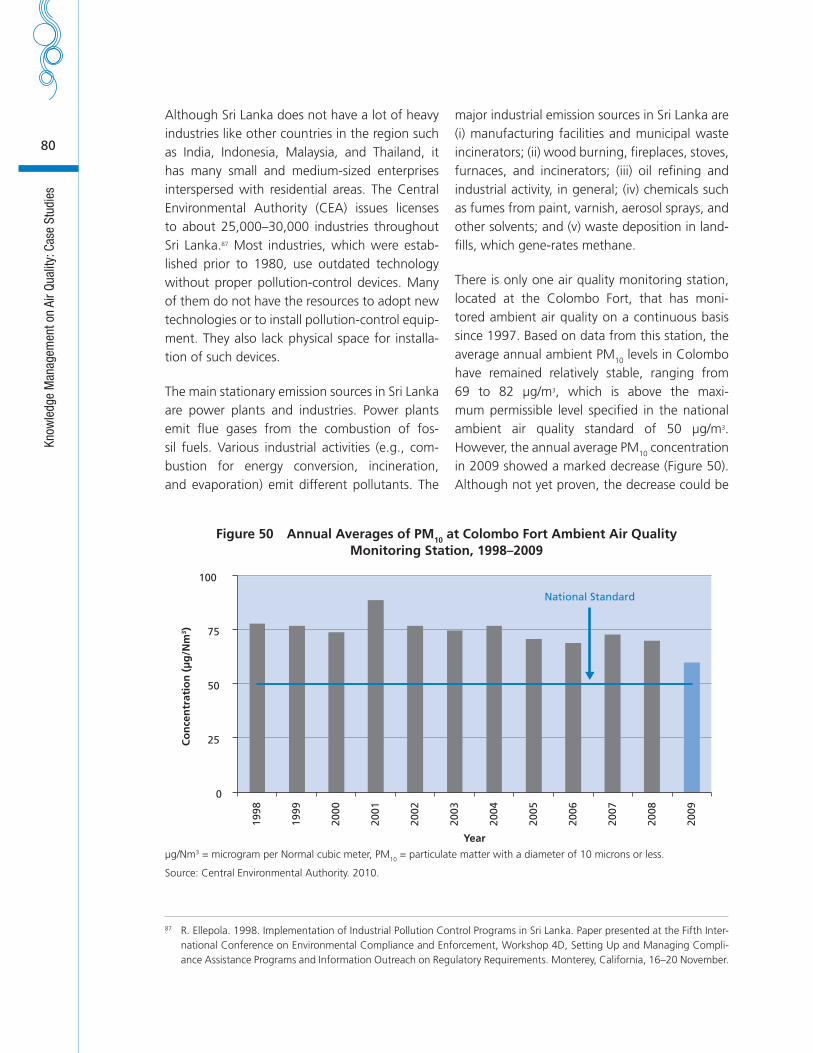
80
Know
ledg
e M
anag
emen
t on
Air Q
ualit
y: C
ase
Stud
ies
Although Sri Lanka does not have a lot of heavy industries like other countries in the region such as India, Indonesia, Malaysia, and Thailand, it has many small and medium-sized enterprises interspersed with residential areas. The Central Environmental Authority (CEA) issues licenses to about 25,000–30,000 industries throughout Sri Lanka.87 Most industries, which were estab-lished prior to 1980, use outdated technology without proper pollution-control devices. Many of them do not have the resources to adopt new technologies or to install pollution-control equip-ment. They also lack physical space for installa-tion of such devices.
The main stationary emission sources in Sri Lanka are power plants and industries. Power plants emit flue gases from the combustion of fos-sil fuels. Various industrial activities (e.g., com-bustion for energy conversion, incineration, and evaporation) emit different pollutants. The
major industrial emission sources in Sri Lanka are (i) manufacturing facilities and municipal waste incinerators; (ii) wood burning, fireplaces, stoves, furnaces, and incinerators; (iii) oil refining and industrial activity, in general; (iv) chemicals such as fumes from paint, varnish, aerosol sprays, and other solvents; and (v) waste deposition in land-fills, which gene-rates methane.
There is only one air quality monitoring station, located at the Colombo Fort, that has moni-tored ambient air quality on a continuous basis since 1997. Based on data from this station, the average annual ambient PM10 levels in Colombo have remained relatively stable, ranging from 69 to 82 μg/m3, which is above the maxi-mum permissible level specified in the national ambient air quality standard of 50 μg/m3. However, the annual average PM10 concentration in 2009 showed a marked decrease (Figure 50). Although not yet proven, the decrease could be
87 R. Ellepola. 1998. Implementation of Industrial Pollution Control Programs in Sri Lanka. Paper presented at the Fifth Inter-national Conference on Environmental Compliance and Enforcement, Workshop 4D, Setting Up and Managing Compli-ance Assistance Programs and Information Outreach on Regulatory Requirements. Monterey, California, 16–20 November.
Figure 50 Annual Averages of PM10 at Colombo Fort Ambient Air Quality Monitoring Station, 1998–2009
0
25
50
75
100
1998
1999
2000
2001
2002
2003
2004
2005
2006
2007
2008
2009
Co
nce
ntr
atio
n (
μg
/Nm
3 )
Year
National Standard
μg/Nm3 = microgram per Normal cubic meter, PM10 = particulate matter with a diameter of 10 microns or less.
Source: Central Environmental Authority. 2010.
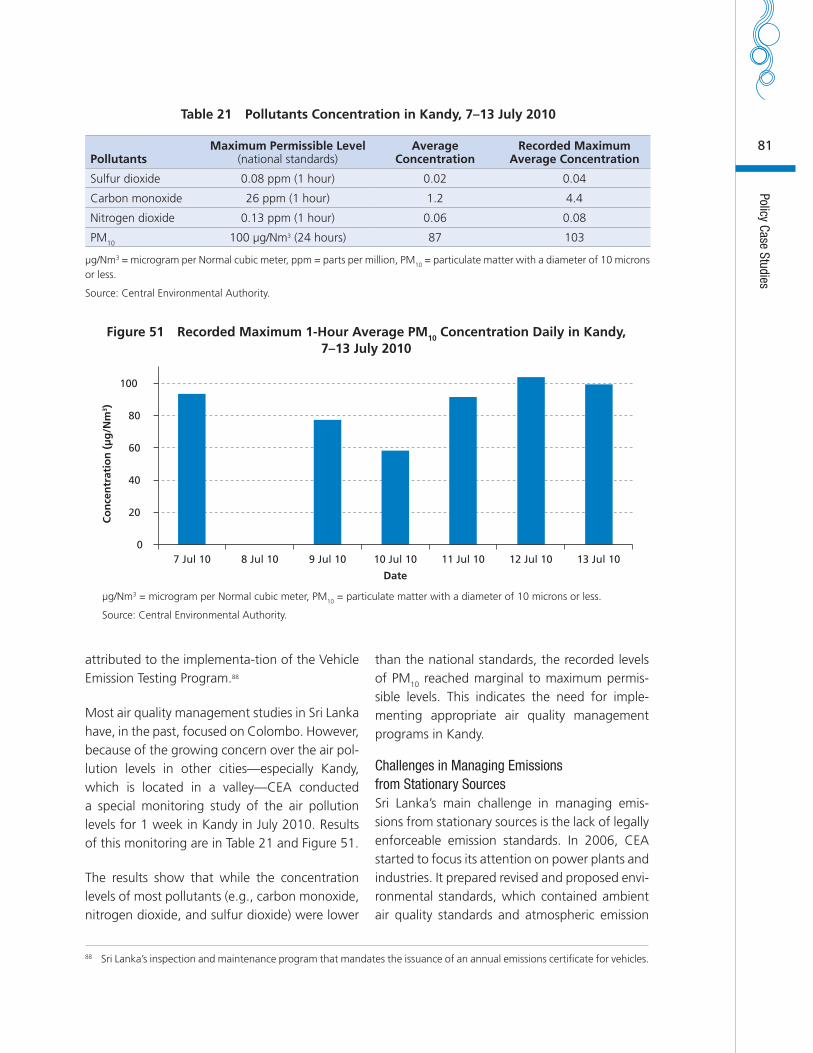
81
Policy Case Studies
attributed to the implementa-tion of the Vehicle Emission Testing Program.88
Most air quality management studies in Sri Lanka have, in the past, focused on Colombo. However, because of the growing concern over the air pol-lution levels in other cities—especially Kandy, which is located in a valley—CEA conducted a special monitoring study of the air pollution levels for 1 week in Kandy in July 2010. Results of this monitoring are in Table 21 and Figure 51.
The results show that while the concentration levels of most pollutants (e.g., carbon monoxide, nitrogen dioxide, and sulfur dioxide) were lower
than the national standards, the recorded levels of PM10 reached marginal to maximum permis-sible levels. This indicates the need for imple-menting appropriate air quality management programs in Kandy.
Challenges in Managing Emissions from Stationary SourcesSri Lanka’s main challenge in managing emis-sions from stationary sources is the lack of legally enforceable emission standards. In 2006, CEA started to focus its attention on power plants and industries. It prepared revised and proposed envi-ronmental standards, which contained ambient air quality standards and atmospheric emission
88 Sri Lanka’s inspection and maintenance program that mandates the issuance of an annual emissions certificate for vehicles.
Table 21 Pollutants Concentration in Kandy, 7–13 July 2010
PollutantsMaximum Permissible Level
(national standards)Average
ConcentrationRecorded Maximum
Average Concentration
Sulfur dioxide 0.08 ppm (1 hour) 0.02 0.04
Carbon monoxide 26 ppm (1 hour) 1.2 4.4
Nitrogen dioxide 0.13 ppm (1 hour) 0.06 0.08
PM10 100 μg/Nm3 (24 hours) 87 103
μg/Nm3 = microgram per Normal cubic meter, ppm = parts per million, PM10 = particulate matter with a diameter of 10 microns or less.
Source: Central Environmental Authority.
Figure 51 Recorded Maximum 1-Hour Average PM10 Concentration Daily in Kandy,7–13 July 2010
0
20
40
60
80
100
7 Jul 10 8 Jul 10 9 Jul 10 10 Jul 10 11 Jul 10 12 Jul 10 13 Jul 10
Co
nce
ntr
atio
n (
μg
/Nm
3 )
Date
μg/Nm3 = microgram per Normal cubic meter, PM10 = particulate matter with a diameter of 10 microns or less.
Source: Central Environmental Authority.
82
Know
ledg
e M
anag
emen
t on
Air Q
ualit
y: C
ase
Stud
ies
standards for stationary sources. Industries and CEA still consider these proposed standards as general guidelines. However, being in draft form, they are without any legal status, and being guidelines, CEA cannot enforce them. While the National Environmental Act No. 47 (1980) states that it is mandatory to comply with emission reg-ulations for stationary sources to obtain an envi-ronmental protection license, since the emission regulations for stationary sources are not yet in place, very few industries voluntarily try to meet these guidelines.
For stationary sources emission standards to be mandatory and legally enforceable, CEA needs to finalize the standards and have these approved by the minister of Environment and Natural Resources and gazetted as a regula-tion under the National Environmental Act. Yet Sri Lanka faces challenges in the adoption of stationary sources emission standards such as limited technical capacity, lack of information on regional and worldwide best practices, lack of active stakeholder involvement, and lack of baseline emission data.
Limited technical capacity. Technical advice on the development of suitable standards for Sri Lanka is needed from local and international experts. Suitable standards denote that they are achievable by Sri Lankan industries through pro-cess improvements or incorporation of best avail-able, cost-effective technologies, considering the country’s level of economic development. This also requires that the standards can be effec-tively enforced and that their compliance to be effectively monitored. Both the government and industries require training, the former for proper implementation of the standards and the latter for proper compliance with the standards. The areas identified by stakeholders where technical advice and training are needed are
development, implementation, and moni-toring of fugitive emission standards (includ-ing measurement techniques) especially for open lime kilns, metal crushes, and con-struction sites;review of methodologies including the basis of stack height-based emission regulations and the appropriateness of this approach; measurement, monitoring, and control of volatile organic compounds;use of load-based emission standards;89 appropriateness of including penalties for the number of exceedances of the stationary source emission standards;quality modeling and pollutant dispersion; andsource apportionment.
Lack of information on regional and world-wide best practices. While there are many exam-ples in Asia and the Pacific and other regions of emission regulation for stationary sources, there is limited information on which measures actu-ally work and what factors contribute to their successful implementation. CEA needs informa-tion on examples of successful stationary source control measures.
Limited active involvement of stakeholders. As with any new and proposed regulations, involving stakeholders at an early stage of devel-opment of the stationary source emission stan-dards increases the likelihood of stakeholder acceptance. In the present case, CEA decided to obtain public comments. In addition to the public consultations in the Air Quality and Co-Benefits CoP in July and August 2010, CEA plans to advertise the request for public opinion in the newspapers. Since the text of the new 2010 proposed standards will not be published in the newspaper, hard copies will be made avail-able at CEA and other relevant organizations for
89 Note that the proposed emission standards are based on concentrations only, and the total amount of emissions are not considered directly.
83
Policy Case Studies
the public. As of September 2010, CEA has not finalized the 2010 proposed standards; there-fore, stakeholders have ample opportunity to participate in their final development.
Lack of baseline emission data. One of the major difficulties in deriving locally acceptable emission standards for stationary sources is the lack of sufficient baseline emission data. The lack of local emission data and emission inven-tory could lead to questions on the basis of the emission limits specified in the standards. The development of an emission inventory is a key element in an air quality management program.
Development of Emission Standards for Stationary Sources
Overall Institutional and Policy Framework for Air Quality ManagementUnlike several countries in the region, Sri Lanka does not have a clean air act. It was only in early 2010 that the Ministry of Environment and Natural Resources expressed keen inter-est in drafting such an act. However, to date, no specific activity has been developed to ini-tiate the drafting process. To fill this gap, the Cabinet approved a strategy and action plan called the Clean Air 2000 Action Plan in 1993. This identifies the activities for effective air qual-ity management and clarifies the roles of institu-tions responsible for urban air pollution control, including policy making, air quality monitoring, enforcing laws, ensuring regulatory compliance, and undertaking research and development on air pollution-control technologies.
The action plan has been updated a number of times, and the present version is Clean Air 2015: Action Plan for Air Quality Management. The Air Resource Management Center of the Ministry of Environment and Natural Resources formulated this action plan with the vision of reducing air pollution-related diseases by main-taining air quality at desirable levels through minimizing emissions of harmful air pollutants.
The development and enforcement of emission standards for different sources of air pollution (including stationary or industrial sources) are among its key strategies. Its main objectives are to
develop and establish a national multistake-holder platform for formulation and coor-dination of all air quality improvement and management programs;ensure source identification, quantifica-tion, monitoring, and reduction of harmful air pollutants through implementation of identified programs in association with all stakeholders;formulate and implement an appropriate regulatory framework for ensuring effective air quality management;undertake research and development and capacity-building programs for air quality management;establish links with subregional, regional, and global air quality management initiatives;create public awareness on air pollution, its impacts, and actions taken to address related issues; andensure adequate financial resources through formal and innovative financing mechanisms for air quality management.
The National Environmental Act No. 47 (amended by Act No. 56 [1988] and Act No. 53 [2000]) remains the main legislation on environ-mental protection and management in Sri Lanka. Environmental standards for emissions from wastewater, noise, air quality, and vibration are covered in the section on environmental quality. At present, the only air quality-related environ-mental standards that have been gazetted (i.e., approved by the minister of environment and natural resources) are ambient air quality stan-dards, vehicle emission standards, and fuel qual-ity standards.
The objectives of the National Environmental Act include the (i) protection, management, and
84
Know
ledg
e M
anag
emen
t on
Air Q
ualit
y: C
ase
Stud
ies
enhancement of the environment; (ii) regulation, maintenance, and control of the quality of the environment; and (iii) prevention, abatement, and control of pollution, and matters connected therewith or incidental thereto. The Ministry of Environment and Natural Resources is the main institution for policy formulation and decision making on environmental protection and man-agement in Sri Lanka.
In accordance with the act, CEA was established in 1981 as an agency under the Ministry of Environment and Natural Resources. Since then, CEA has been instrumental in developing the necessary standards relevant for air quality man-agement in Sri Lanka. CEA powers, functions, and duties are to
set up and implement specific standards, norms, and criteria to protect and maintain the quality of the environment;coordinate and implement all regulatory activities related to the discharge of waste and pollutants into the environment;regulate, maintain, and control the volumes, types, and effect of waste discharge, emis-sions, disposal, or other sources of pollution, which are of danger or potential danger to the quality of the environment;conduct environmental education and awareness;undertake investigation and inspections to ensure compliance and investigate com-plaints relating to noncompliance; conduct, promote, and coordinate research in relation to any aspect of the environmen-tal degradation or the prevention thereof, and to develop criteria for the protection and improvement of the environment; andundertake environmental management and assessments of new projects.
CEA is also mandated to implement the three main regulatory provisions related to industrial pol-lution control: (i) environment protection license procedure, (ii) environmental standards for
emissions, and (iii) environment impact assess-ments. The environment protection license pro-cedure is required for all the waste-generating industries and processes, whether they are low polluting or high polluting in nature. There are 138 activities that require a license that were published in Gazette Extraordinary No. 1533/16 (2008), including electrical power-generating utilities and industrial processes, and this stipu-lates the standards and criteria under which an activity is allowed to discharge its waste, includ-ing air emissions. The environmental impact assessment is applicable for development proj-ects that are likely to have significant impacts on the environment. Projects that need to secure approval are listed in Gazette Extraordinary No. 772/22 (1993). In the absence of gazetted stationary source emission standards, the 2006 proposed standards are used by CEA as general guidelines when issuing environmental impact assessment approvals and subsequent licenses.
Development of Proposed Emission Standards for Stationary SourcesThe 2006 proposed standards covered power plants and several industrial processes and plants. A recent study commissioned by CEA described the 2006 proposed standards (Appendix D) as follows:
The proposed atmospheric emission standards for stationary sources in Sri Lanka comprise two parts. Part 1 consists of a set of general atmospheric emission standards for a number of substances, and Part 2 presents an exhaustive list of source-specific atmospheric emission standards for new or modified stationary sources … In Part 1, the pollutants considered include smoke, soot and dust from combustion sources and eight types of harmful substances (HAPs). The standards are specified in terms of mg/m3 (except for smoke for which opacity is used to measure the concentration). The source
85
Policy Case Studies
specific atmospheric emission standards presented in Part 2 of the proposal has 29 source categories, some of which are sub-divided further into a number of classes based on source size, process, technology, etc.
The pollutants covered in the pro-posed standards include TSP, SO2, NO2, Smoke, CO, VOC, and a few other chemicals such as HCl, Fluorides, Metal, etc. The standards also specify monitoring requirements in each source and pollutant. Emission standards mainly specify limiting values for the concentrations and, in a few cases, a minimum height for the stack.
However, recognizing the need for legally enforceable standards,90 CEA commissioned the Sri Lanka Energy Managers Association in April 2010 to review current emissions from differ-ent industry groups; and recommend emission standards for stationary sources that are sound, locally acceptable, and suitable to the Sri Lankan context. These 2010 proposed standards, when approved by the minister of environment and natural resources, will become legally enforce-able and replace the 2006 proposed standards.
Developing the 2010 proposed standards involves several steps (Figure 52) including reviews and/or studies of local industry emission data, issues relevant to stationary source emissions (e.g., fuel characteristics, mitigation measures, regional best practices), and future expected develop-ments in industry.
Using Local Emission Inventories for Realistic Emission StandardsStudying past and present local emission invento-ries is important for setting up realistic emission standards and for better air quality management and modeling. Emission records for different sources such as 243 boilers, 62 standby genera-tors, 17 thermic fluid heaters, 13 incinerators, and 5 power plants were collected. Data collected for at least a 3-year period included capacity; fuel type; fuel consumption; combustion efficiency; thermal efficiency; and concentrations of carbon dioxide, carbon monoxide, ozone, nitrogen diox-ide, and sulfur dioxide in the flue gas.
The case of power plants illustrates the use of local emission data in setting emission limits. Based on 8 years of sulfur oxide emission data for one 100-megawatts electrical (MWe) power plant, it can be concluded that 3,500 milligrams (mg) per normal91 cubic meter (Nm3) of sulfur oxide is achievable. According to the study, sulfur dioxide emission in combustion is most likely due to sulfur in the fuel; for example, sulfur content in furnace oil of 3.5% (which is the level of sulfur in fuels produced by the Ceylon Petroleum Corporation) would result in sulfur dioxide emission concentration of about 6,090 mg/Nm3. For 2% sulfur content, the sul-fur dioxide emission concentration would be about 3,480 mg/Nm3. For this reason, it was proposed that the emission limit for an oil-fired thermal power plant of capacity above 25 MWe up to 100 MWe would have to comply with an emission limit for sulfur oxide of 3,500 mg/Nm3 (Figure 53).92
90 The existing emission standards were believed to be developed by only considering standards in other countries (includ-ing those of the Environmental Protection Agency), and there were concerns on their validity and applicability to the Sri Lankan situation. In particular, local emission data and fuel quality levels seem to have not been taken into account.
91 “Normal” means that the volume is measured at the normal temperature and pressure conditions. In Sri Lanka, the normal temperature recommended is 0°C.
92 It must be noted that while technologies like flue as desulfurization are available, most power plants in Sri Lanka do not use these emission control technologies. Once the 2010 proposed standards are fully implemented, more stringent standards may be introduced depending on the development of the industry.
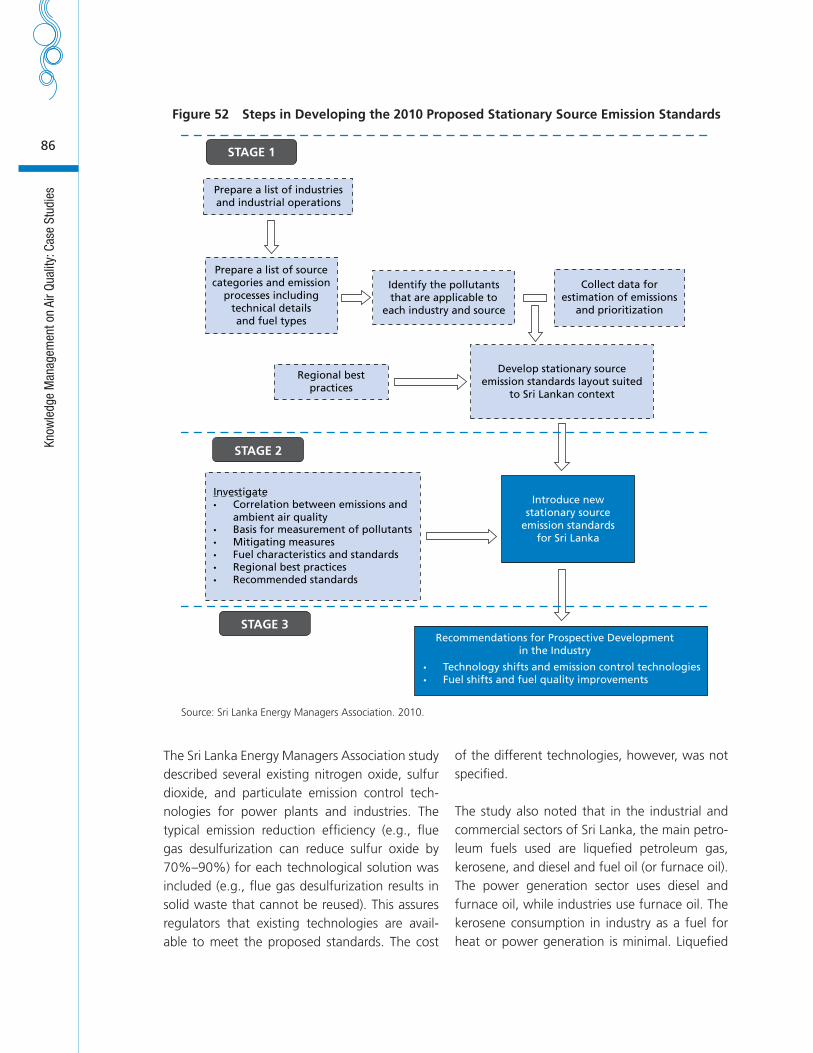
86
Know
ledg
e M
anag
emen
t on
Air Q
ualit
y: C
ase
Stud
ies
Figure 52 Steps in Developing the 2010 Proposed Stationary Source Emission Standards
Recommendations for Prospective Developmentin the Industry
Technology shifts and emission control technologies Fuel shifts and fuel quality improvements
Introduce newstationary source
emission standardsfor Sri Lanka
Investigate Correlation between emissions and
ambient air quality Basis for measurement of pollutants Mitigating measures Fuel characteristics and standards
Regional best practices Recommended standards
Prepare a list of industriesand industrial operations
Collect data forestimation of emissions
and prioritization
Identify the pollutantsthat are applicable to
each industry and source
Prepare a list of sourcecategories and emission
processes includingtechnical detailsand fuel types
Regional bestpractices
Develop stationary sourceemission standards layout suited
to Sri Lankan context
STAGE 1
STAGE 2
STAGE 3
Source: Sri Lanka Energy Managers Association. 2010.
The Sri Lanka Energy Managers Association study described several existing nitrogen oxide, sulfur dioxide, and particulate emission control tech-nologies for power plants and industries. The typical emission reduction efficiency (e.g., flue gas desulfurization can reduce sulfur oxide by 70%–90%) for each technological solution was included (e.g., flue gas desulfurization results in solid waste that cannot be reused). This assures regulators that existing technologies are avail-able to meet the proposed standards. The cost
of the different technologies, however, was not specified.
The study also noted that in the industrial and commercial sectors of Sri Lanka, the main petro-leum fuels used are liquefied petroleum gas, kerosene, and diesel and fuel oil (or furnace oil). The power generation sector uses diesel and furnace oil, while industries use furnace oil. The kerosene consumption in industry as a fuel for heat or power generation is minimal. Liquefied
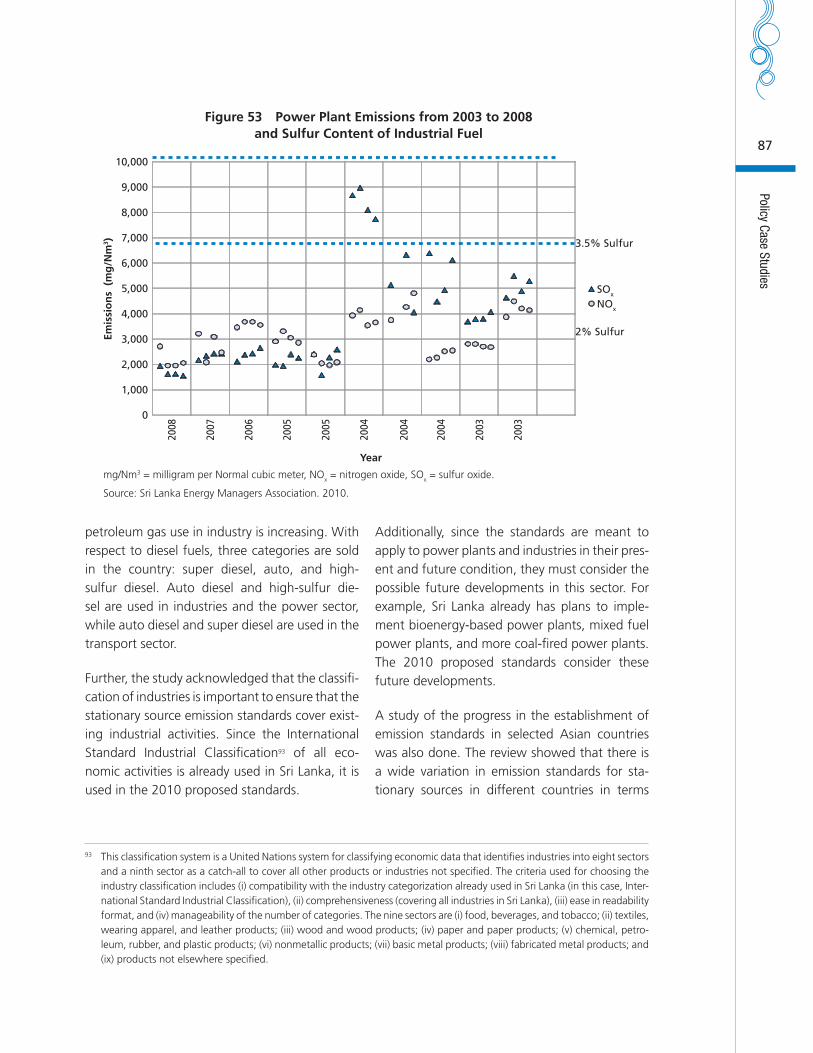
87
Policy Case Studies
petroleum gas use in industry is increasing. With respect to diesel fuels, three categories are sold in the country: super diesel, auto, and high- sulfur diesel. Auto diesel and high-sulfur die-sel are used in industries and the power sector, while auto diesel and super diesel are used in the transport sector.
Further, the study acknowledged that the classifi-cation of industries is important to ensure that the stationary source emission standards cover exist-ing industrial activities. Since the International Standard Industrial Classification93 of all eco-nomic activities is already used in Sri Lanka, it is used in the 2010 proposed standards.
Additionally, since the standards are meant to apply to power plants and industries in their pres-ent and future condition, they must consider the possible future developments in this sector. For example, Sri Lanka already has plans to imple-ment bioenergy-based power plants, mixed fuel power plants, and more coal-fired power plants. The 2010 proposed standards consider these future developments.
A study of the progress in the establishment of emission standards in selected Asian countries was also done. The review showed that there is a wide variation in emission standards for sta-tionary sources in different countries in terms
93 This classification system is a United Nations system for classifying economic data that identifies industries into eight sectors and a ninth sector as a catch-all to cover all other products or industries not specified. The criteria used for choosing the industry classification includes (i) compatibility with the industry categorization already used in Sri Lanka (in this case, Inter-national Standard Industrial Classification), (ii) comprehensiveness (covering all industries in Sri Lanka), (iii) ease in readability format, and (iv) manageability of the number of categories. The nine sectors are (i) food, beverages, and tobacco; (ii) textiles, wearing apparel, and leather products; (iii) wood and wood products; (iv) paper and paper products; (v) chemical, petro-leum, rubber, and plastic products; (vi) nonmetallic products; (vii) basic metal products; (viii) fabricated metal products; and (ix) products not elsewhere specified.
Figure 53 Power Plant Emissions from 2003 to 2008 and Sulfur Content of Industrial Fuel
0
1,000
2008
2007
2006
2005
2005
2004
2004
2004
2003
2003
2,000
3,000
4,000
5,000
6,000
7,000
8,000
9,000
10,000
Emis
sio
ns
(m
g/N
m3 )
Year
SOx
NOx
2% Sulfur
3.5% Sulfur
mg/Nm3 = milligram per Normal cubic meter, NOx = nitrogen oxide, SOx = sulfur oxide.
Source: Sri Lanka Energy Managers Association. 2010.
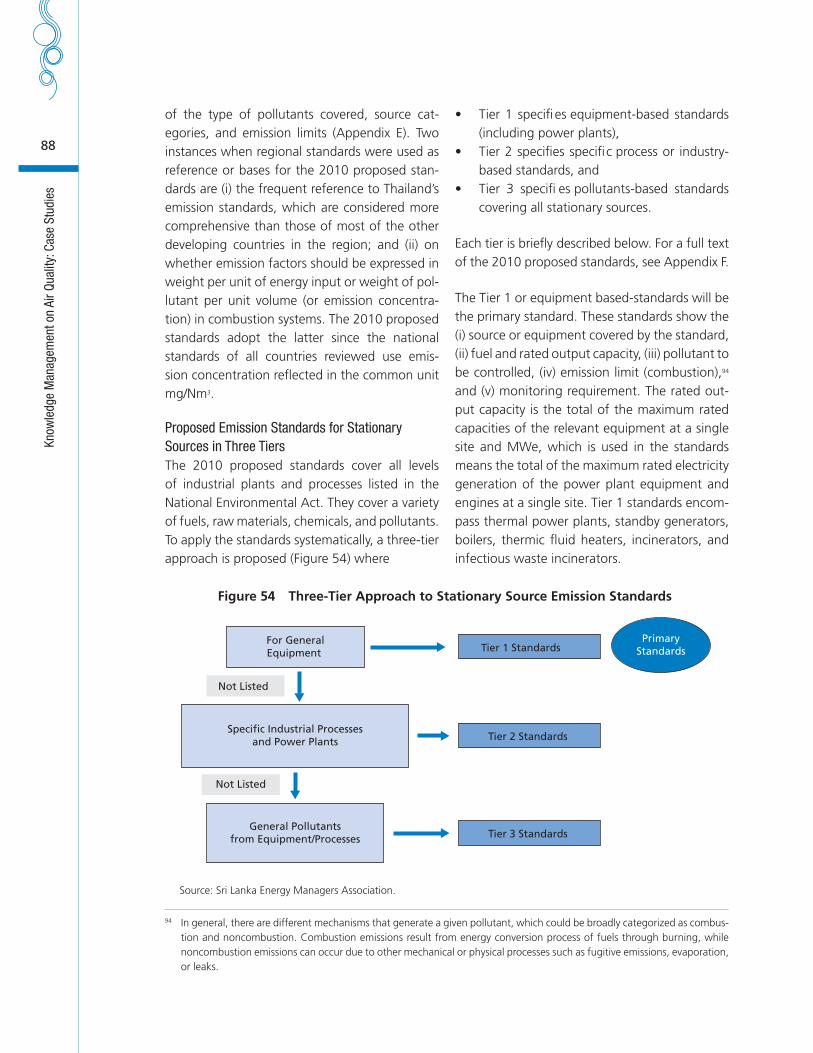
88
Know
ledg
e M
anag
emen
t on
Air Q
ualit
y: C
ase
Stud
ies
of the type of pollutants covered, source cat-egories, and emission limits (Appendix E). Two instances when regional standards were used as reference or bases for the 2010 proposed stan-dards are (i) the frequent reference to Thailand’s emission standards, which are considered more comprehensive than those of most of the other developing countries in the region; and (ii) on whether emission factors should be expressed in weight per unit of energy input or weight of pol-lutant per unit volume (or emission concentra-tion) in combustion systems. The 2010 proposed standards adopt the latter since the national standards of all countries reviewed use emis-sion concentration refl ected in the common unit mg/Nm3.
Proposed Emission Standards for Stationary Sources in Three TiersThe 2010 proposed standards cover all levels of industrial plants and processes listed in the National Environmental Act. They cover a variety of fuels, raw materials, chemicals, and pollutants. To apply the standards systematically, a three-tier approach is proposed (Figure 54) where
Tier 1 specifi es equipment-based standards (including power plants),Tier 2 specifi es specifi c process or industry-based standards, andTier 3 specifi es pollutants-based standards covering all stationary sources.
Each tier is briefl y described below. For a full text of the 2010 proposed standards, see Appendix F.
The Tier 1 or equipment based-standards will be the primary standard. These standards show the (i) source or equipment covered by the standard, (ii) fuel and rated output capacity, (iii) pollutant to be controlled, (iv) emission limit (combustion),94 and (v) monitoring requirement. The rated out-put capacity is the total of the maximum rated capacities of the relevant equipment at a single site and MWe, which is used in the standards means the total of the maximum rated electricity generation of the power plant equipment and engines at a single site. Tier 1 standards encom-pass thermal power plants, standby generators, boilers, thermic fl uid heaters, incinerators, and infectious waste incinerators.
94 In general, there are different mechanisms that generate a given pollutant, which could be broadly categorized as combus-tion and noncombustion. Combustion emissions result from energy conversion process of fuels through burning, while noncombustion emissions can occur due to other mechanical or physical processes such as fugitive emissions, evaporation, or leaks.
Figure 54 Three-Tier Approach to Stationary Source Emission Standards
PrimaryStandards
For GeneralEquipment
Not Listed
General Pollutantsfrom Equipment/Processes
Specific Industrial Processesand Power Plants
Tier 1 Standards
Not Listed
Tier 2 Standards
Tier 3 Standards
Source: Sri Lanka Energy Managers Association.
89
Policy Case Studies
Except for incinerators (including infectious waste incinerators), the control measure imposed includes maximum emission limits to specific pol-lutants, stack height specifications, or a combi-nation of both measures. In some instances, such as for thermal power plants below 25 MWe, uncontrolled emission levels based on fuel quality (presently 6,100 mg/Nm3 based on 3.5% sulfur content of fuel produced by the Ceylon Petrol-eum Corporation) are allowed for sulfur oxide.
Uncontrolled emission concentrations are entirely dependent on the sulfur concentration in the fuel. Because small power plants most likely have limited options and have to use the available fuel with 3.5% sulfur, they are allowed such uncontrolled emissions at 6,100 mg/Nm3. However, larger power plants are expected to use sulfur oxide control technology to keep the concentration levels within 870 mg/Nm3 (i.e., 0.5% sulfur in fuel).
Tier 2 or specific industry and process-based standards apply to any equipment or pollutant not listed in Tier 1. These standards state the (i) industry or process covered by the standard, (ii) pollutant to be controlled, (iii) emission limit (combustion), (iv) emission limit (noncombus-tion), and (v) monitoring requirement. Tier 2 stan-dards target these large-scale or high-emitting industries and processes:
portland cement plants,iron and steel industry,nitric acid production,sulfuric acid production,hydrochloric mineral acid production,petroleum refinery,bulk gasoline terminals,hot-mix asphalt facilities,hot dip-galvanizing plants,metal foundries,secondary metal smelters,phosphate fertilizer industry,coal preparation plant,kraft pulp mills,
lead-acid battery-manufacturing plants,lime-manufacturing plants,glass-manufacturing plants,phosphate rock plants,asbestos industries,rubber tire-manufacturing industry,polymer-manufacturing industry,synthetic organic chemical-manufacturing industry, andnonmetallic mineral-processing plants.
Tier 3 or specific pollutant-based standards cover any pollutant not listed in Tier 1 and Tier 2. Tier 3 standards target key pollutants, includ-ing hazardous pollutants. The standards state the (i) pollutant to be controlled, (ii) process and source, (iii) emission limit (combustion), (iv) emis-sion limit (noncombustion), and (v) monitoring requirement. The pollutants covered by Tier 3 are
particulate matter,smoke or dust,carbon monoxide,sulfur oxide,nitrogen oxide,chlorine and hydrogen chloride,flourides and hydrogen fluoride,hydrogen sulfide,cadmium and its compounds,lead and its compounds,antimony and its compounds,arsenic and its compounds,copper and its compounds,zinc and its compounds,mercury and its compounds,dust containing silica,dioxin and furan, andammonia.
Other important information about the 2010 proposed standards is as follows.
When more than one fuel type is used. In cases where the plant or equipment utilizes more than one type of fuel, the emission standards to be applied will be those corresponding to the
90
Know
ledg
e M
anag
emen
t on
Air Q
ualit
y: C
ase
Stud
ies
main fuel declared when the plant or equipment is commissioned. In the event of a permanent change in the primary fuel used after the plant or equipment is commissioned, CEA must be informed of this change.
Performance tests. Standard test methods and procedures (or equivalent or alternative methods approved by CEA) will be used for performance tests for parameters or pollut-ants. CEA will require that the tests are con-ducted within a specified time period and at a particular frequency. Tests will not be done at start-up, shutdown, or malfunctions to deter-mine compliance with the emission standards, as these events do not constitute representative conditions at which the facility or equipment operates. Each test consists of three samples using the standard test method; the arithmetic mean of the three results is used to determine compliance with the emission standard. A writ-ten report of the test results with information on the test procedure used will be submitted to CEA. The standard methods to be used for the performance tests for emission measure-ments can be found in the United States Code of Federal Regulation.
Monitoring. When the recommended emission standard specifies that continuous monitoring is needed, a continuous monitoring system capa-ble of sampling and conditioning (if applicable), analyzing, and providing a permanent record of emissions or process parameters is needed. Performance specifications for continuous emission monitoring systems are described in United States Code of Federal Regulation.95
Implementation strategy. The Sri Lanka Energy Managers Association recommended that an implementation strategy be developed cover-ing (i) awareness raising among stakeholders
through consultations on the 2010 proposed standards, (ii) capacity building of relevant CEA staff, (iii) acquisition of emission-measuring equipment, (iv) phased implementation of the standards, (v) establishment of an auditing and quality assurance procedure, and (vi) developing a legal framework with penalties in case of viola-tion of the standards.
Results of Review of Sri Lanka Draft Standards
ProcessClean Air Sri Lanka, with the CAI–Asia Center, undertook a policy case study to review the 2010 proposed standards for Sri Lanka. First, online discussions were facilitated through a discussion group under the Air Quality and Co-Benefits CoP in July and August 2010. The objective of the CoP was to secure comments and suggestions from stakeholders to formulate a sound, locally acceptable set of emission standards for station-ary sources in Sri Lanka. The CoP was facilitated by Dr. Thusitha Sugathapala, president of Clean Air Sri Lanka. Sixteen stakeholders (i.e., 7 from government, 6 from academe, 2 from private sector, 1 from a nongovernment organization) posted comments on the CoP. Then, a public lecture on the proposed standards was orga-nized in August 2010 by a CoP member for the Institution of Engineers, Sri Lanka because of the growing interest in the topic. Finally, a webinar on the topic was held in September 2010 with Dave Calkins and Miriam Lev-On of the Air and Waste Management Association as international resource persons.
Comments and RecommendationsThese forums resulted in the comments and recommendations summarized in Table 22. The recommendations were forwarded to CEA in September 2010 for consideration in its finaliza-tion of the regulations.
95 United States Environmental Protection Agency. Emissions Management Center. www.epa.gov/ttn/emc
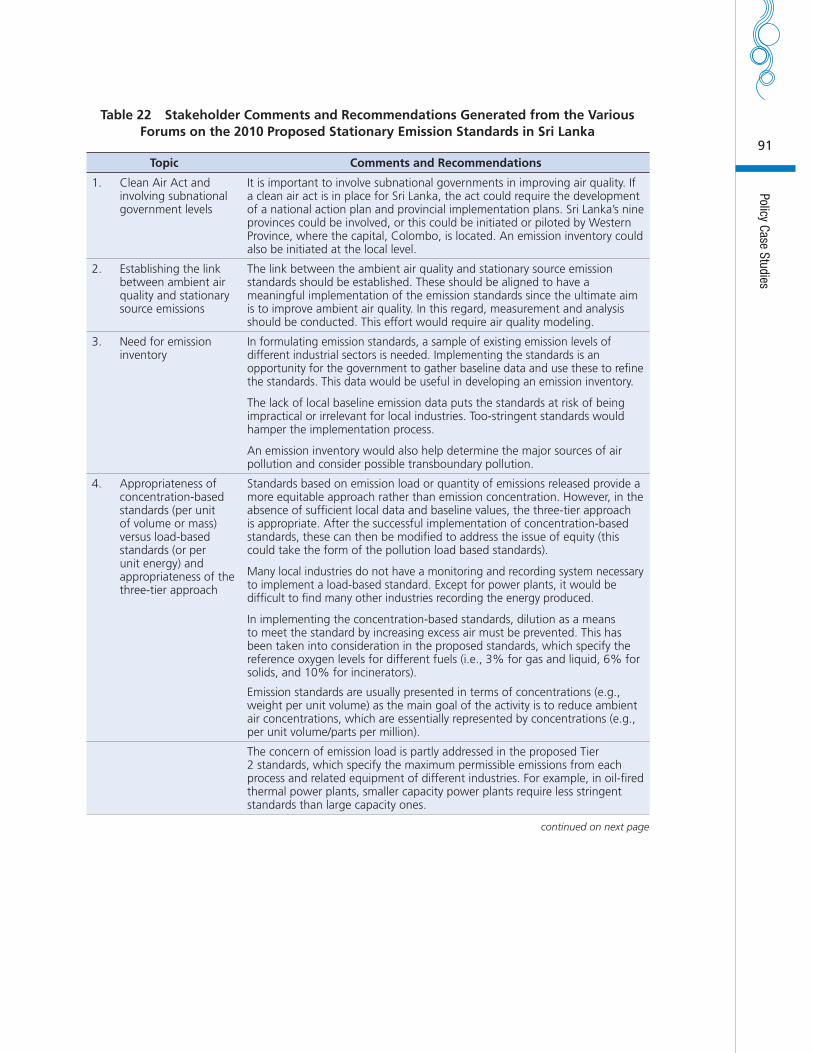
91
Policy Case Studies
Table 22 Stakeholder Comments and Recommendations Generated from the Various Forums on the 2010 Proposed Stationary Emission Standards in Sri Lanka
Topic Comments and Recommendations
1. Clean Air Act and involving subnational government levels
It is important to involve subnational governments in improving air quality. If a clean air act is in place for Sri Lanka, the act could require the development of a national action plan and provincial implementation plans. Sri Lanka’s nine provinces could be involved, or this could be initiated or piloted by Western Province, where the capital, Colombo, is located. An emission inventory could also be initiated at the local level.
2. Establishing the link between ambient air quality and stationary source emissions
The link between the ambient air quality and stationary source emission standards should be established. These should be aligned to have a meaningful implementation of the emission standards since the ultimate aim is to improve ambient air quality. In this regard, measurement and analysis should be conducted. This effort would require air quality modeling.
3. Need for emission inventory
In formulating emission standards, a sample of existing emission levels of different industrial sectors is needed. Implementing the standards is an opportunity for the government to gather baseline data and use these to refine the standards. This data would be useful in developing an emission inventory.
The lack of local baseline emission data puts the standards at risk of being impractical or irrelevant for local industries. Too-stringent standards would hamper the implementation process.
An emission inventory would also help determine the major sources of air pollution and consider possible transboundary pollution.
4. Appropriateness of concentration-based standards (per unit of volume or mass) versus load-based standards (or per unit energy) and appropriateness of the three-tier approach
Standards based on emission load or quantity of emissions released provide a more equitable approach rather than emission concentration. However, in the absence of sufficient local data and baseline values, the three-tier approach is appropriate. After the successful implementation of concentration-based standards, these can then be modified to address the issue of equity (this could take the form of the pollution load based standards).
Many local industries do not have a monitoring and recording system necessary to implement a load-based standard. Except for power plants, it would be difficult to find many other industries recording the energy produced.
In implementing the concentration-based standards, dilution as a means to meet the standard by increasing excess air must be prevented. This has been taken into consideration in the proposed standards, which specify the reference oxygen levels for different fuels (i.e., 3% for gas and liquid, 6% for solids, and 10% for incinerators).
Emission standards are usually presented in terms of concentrations (e.g., weight per unit volume) as the main goal of the activity is to reduce ambient air concentrations, which are essentially represented by concentrations (e.g., per unit volume/parts per million).
The concern of emission load is partly addressed in the proposed Tier 2 standards, which specify the maximum permissible emissions from each process and related equipment of different industries. For example, in oil-fired thermal power plants, smaller capacity power plants require less stringent standards than large capacity ones.
continued on next page
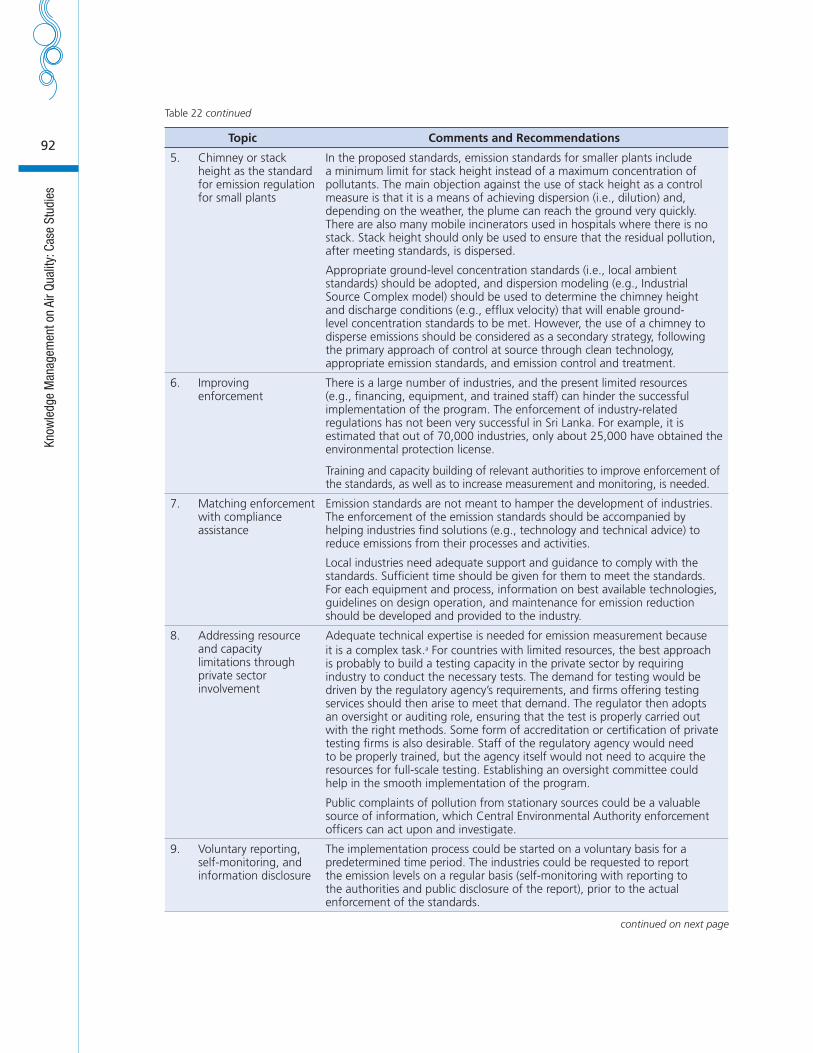
92
Know
ledg
e M
anag
emen
t on
Air Q
ualit
y: C
ase
Stud
ies
Table 22 continued
Topic Comments and Recommendations
5. Chimney or stack height as the standard for emission regulation for small plants
In the proposed standards, emission standards for smaller plants include a minimum limit for stack height instead of a maximum concentration of pollutants. The main objection against the use of stack height as a control measure is that it is a means of achieving dispersion (i.e., dilution) and, depending on the weather, the plume can reach the ground very quickly. There are also many mobile incinerators used in hospitals where there is no stack. Stack height should only be used to ensure that the residual pollution, after meeting standards, is dispersed.
Appropriate ground-level concentration standards (i.e., local ambient standards) should be adopted, and dispersion modeling (e.g., Industrial Source Complex model) should be used to determine the chimney height and discharge conditions (e.g., efflux velocity) that will enable ground-level concentration standards to be met. However, the use of a chimney to disperse emissions should be considered as a secondary strategy, following the primary approach of control at source through clean technology, appropriate emission standards, and emission control and treatment.
6. Improving enforcement
There is a large number of industries, and the present limited resources (e.g., financing, equipment, and trained staff) can hinder the successful implementation of the program. The enforcement of industry-related regulations has not been very successful in Sri Lanka. For example, it is estimated that out of 70,000 industries, only about 25,000 have obtained the environmental protection license.
Training and capacity building of relevant authorities to improve enforcement of the standards, as well as to increase measurement and monitoring, is needed.
7. Matching enforcement with compliance assistance
Emission standards are not meant to hamper the development of industries. The enforcement of the emission standards should be accompanied by helping industries find solutions (e.g., technology and technical advice) to reduce emissions from their processes and activities.
Local industries need adequate support and guidance to comply with the standards. Sufficient time should be given for them to meet the standards. For each equipment and process, information on best available technologies, guidelines on design operation, and maintenance for emission reduction should be developed and provided to the industry.
8. Addressing resource and capacity limitations through private sector involvement
Adequate technical expertise is needed for emission measurement because it is a complex task.a For countries with limited resources, the best approach is probably to build a testing capacity in the private sector by requiring industry to conduct the necessary tests. The demand for testing would be driven by the regulatory agency’s requirements, and firms offering testing services should then arise to meet that demand. The regulator then adopts an oversight or auditing role, ensuring that the test is properly carried out with the right methods. Some form of accreditation or certification of private testing firms is also desirable. Staff of the regulatory agency would need to be properly trained, but the agency itself would not need to acquire the resources for full-scale testing. Establishing an oversight committee could help in the smooth implementation of the program.
Public complaints of pollution from stationary sources could be a valuable source of information, which Central Environmental Authority enforcement officers can act upon and investigate.
9. Voluntary reporting, self-monitoring, and information disclosure
The implementation process could be started on a voluntary basis for a predetermined time period. The industries could be requested to report the emission levels on a regular basis (self-monitoring with reporting to the authorities and public disclosure of the report), prior to the actual enforcement of the standards.
continued on next page
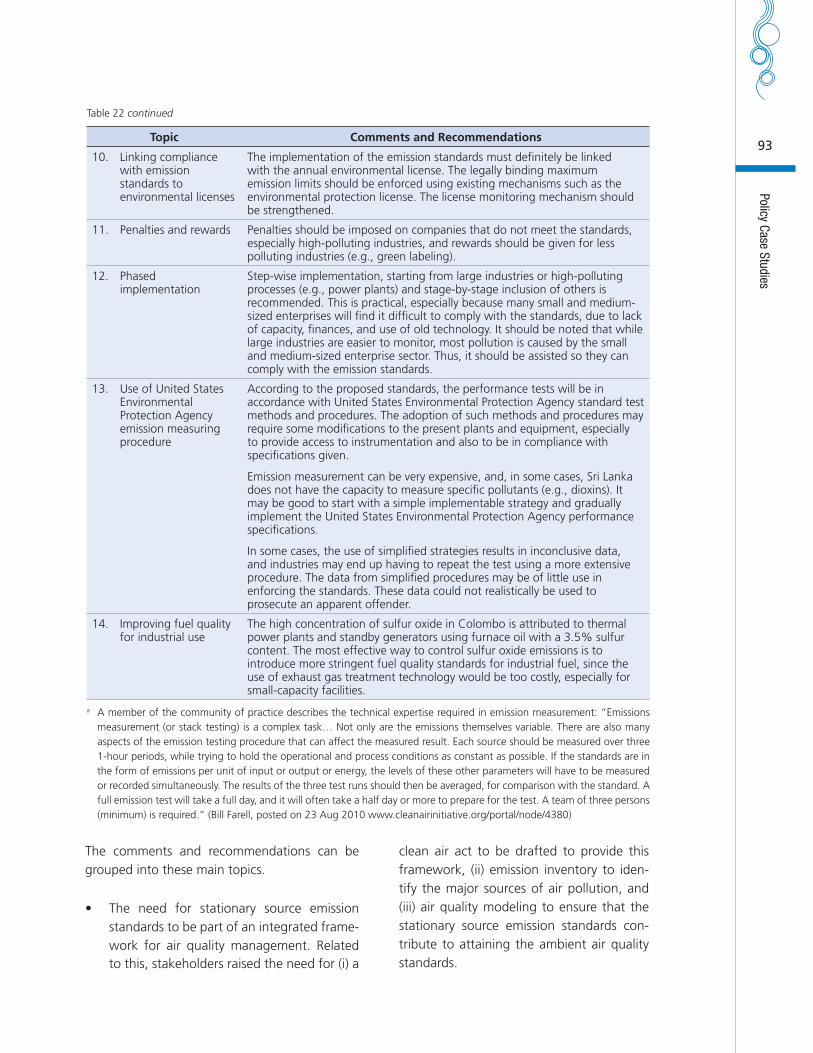
93
Policy Case Studies
Topic Comments and Recommendations
10. Linking compliance with emission standards to environmental licenses
The implementation of the emission standards must definitely be linked with the annual environmental license. The legally binding maximum emission limits should be enforced using existing mechanisms such as the environmental protection license. The license monitoring mechanism should be strengthened.
11. Penalties and rewards Penalties should be imposed on companies that do not meet the standards, especially high-polluting industries, and rewards should be given for less polluting industries (e.g., green labeling).
12. Phased implementation
Step-wise implementation, starting from large industries or high-polluting processes (e.g., power plants) and stage-by-stage inclusion of others is recommended. This is practical, especially because many small and medium-sized enterprises will find it difficult to comply with the standards, due to lack of capacity, finances, and use of old technology. It should be noted that while large industries are easier to monitor, most pollution is caused by the small and medium-sized enterprise sector. Thus, it should be assisted so they can comply with the emission standards.
13. Use of United States Environmental Protection Agency emission measuring procedure
According to the proposed standards, the performance tests will be in accordance with United States Environmental Protection Agency standard test methods and procedures. The adoption of such methods and procedures may require some modifications to the present plants and equipment, especially to provide access to instrumentation and also to be in compliance with specifications given.
Emission measurement can be very expensive, and, in some cases, Sri Lanka does not have the capacity to measure specific pollutants (e.g., dioxins). It may be good to start with a simple implementable strategy and gradually implement the United States Environmental Protection Agency performance specifications.
In some cases, the use of simplified strategies results in inconclusive data, and industries may end up having to repeat the test using a more extensive procedure. The data from simplified procedures may be of little use in enforcing the standards. These data could not realistically be used to prosecute an apparent offender.
14. Improving fuel quality for industrial use
The high concentration of sulfur oxide in Colombo is attributed to thermal power plants and standby generators using furnace oil with a 3.5% sulfur content. The most effective way to control sulfur oxide emissions is to introduce more stringent fuel quality standards for industrial fuel, since the use of exhaust gas treatment technology would be too costly, especially for small-capacity facilities.
Table 22 continued
a A member of the community of practice describes the technical expertise required in emission measurement: “Emissions measurement (or stack testing) is a complex task… Not only are the emissions themselves variable. There are also many aspects of the emission testing procedure that can affect the measured result. Each source should be measured over three 1-hour periods, while trying to hold the operational and process conditions as constant as possible. If the standards are in the form of emissions per unit of input or output or energy, the levels of these other parameters will have to be measured or recorded simultaneously. The results of the three test runs should then be averaged, for comparison with the standard. A full emission test will take a full day, and it will often take a half day or more to prepare for the test. A team of three persons (minimum) is required.” (Bill Farell, posted on 23 Aug 2010 www.cleanairinitiative.org/portal/node/4380)
The comments and recommendations can be grouped into these main topics.
The need for stationary source emission standards to be part of an integrated frame-work for air quality management. Related to this, stakeholders raised the need for (i) a
clean air act to be drafted to provide this framework, (ii) emission inventory to iden-tify the major sources of air pollution, and (iii) air quality modeling to ensure that the stationary source emission standards con-tribute to attaining the ambient air quality standards.
94
Know
ledg
e M
anag
emen
t on
Air Q
ualit
y: C
ase
Stud
ies
The appropriateness to the Sri Lankan con-text of the (i) approach that the standards take (e.g., three-tier approach and the use of concentration-based standards), (ii) con-trol strategies employed in the standards (e.g., stack height requirements and maxi-mum emissions), and (iii) measurement protocols.The concerns on proper enforcement and implementation, including how to address resource limitations.Supplementary measures (e.g., improving fuel quality) to manage emissions from sta-tionary sources of air pollution.
Next StepsTo move forward with the finalization of the 2010 proposed stationary source emission standards, the following next steps have been identified.
A report must be submitted to CEA with recommendations based on the following: (i) Clean Air Portal discussions; (ii) the pub-lic lecture at the Institution of Engineers, Sri Lanka; (iii) webinar; and (iv) review of the proposed standards by the international experts. CEA should also consider revising the proposed standards based on the comments and recommendations and/or incorporate these into the implementation strategy to be developed. Once the final recommendations are draft-ed, prior to gazetting, CEA must comply with the mandatory requirement of obtain-ing comments from the general public. It must advertise the final draft standards in newspapers and request the public to sub-mit their written comments within a speci-fied time period. Once the proposed standards are finalized, these must be composed in a specific for-mat as the National Environment (Stationary Sources Emission Standards) Regulation and submitted to the minister of environment
and natural resources for approval. Once approved, the document will be sent to the Legal Draftsman’s Department for rectifica-tion. The main function of this department is the drafting of legislation to facilitate the successful implementation of the program. The Legal Draftsman’s Department is also required to prepare legislation in both of the official languages, i.e., Sinhala and Tamil, as well as in English. Then the regulation is gazetted under the National Environment Act No. 47 (1980). The regulation would also indicate the date from which the standards become applicable and which industries would be covered in the event of a phased implementation. This process is estimated to take about 6 months.
Local Case Study: Environmentally Sustainable Transport for Kathmandu, Nepal
This section presents the results of a local case study that was conducted for Nepal’s capital city, Kathmandu, to provide inputs in the development of an environmentally sustain-able transport strategy and action plan for Kathmandu and Nepal. Since Nepal’s participa-tion in the United Nations Centre for Regional Development (UNCRD) Environmentally Sus-tain able Transport Forum in 2008, discussions have been conducted for UNCRD to help develop a strategy and action plan for envi-ronmentally sustainable transport. The CAI–Asia Center supported the development of an environmentally sustainable transport strategy for the Philippines and Indonesia with ADB and the Swedish International Development Cooperation Agency (Sida),96 and this experi-ence provided a good opportunity to help pre-pare for the development of another strategy and action plan through the Clean Air Network Nepal, a country network of CAI–Asia.
96 Clean Air Portal. Sustainable Urban Mobility in Asia. http://cleanairinitiative.org/portal/whatwedo/projects/SUMA
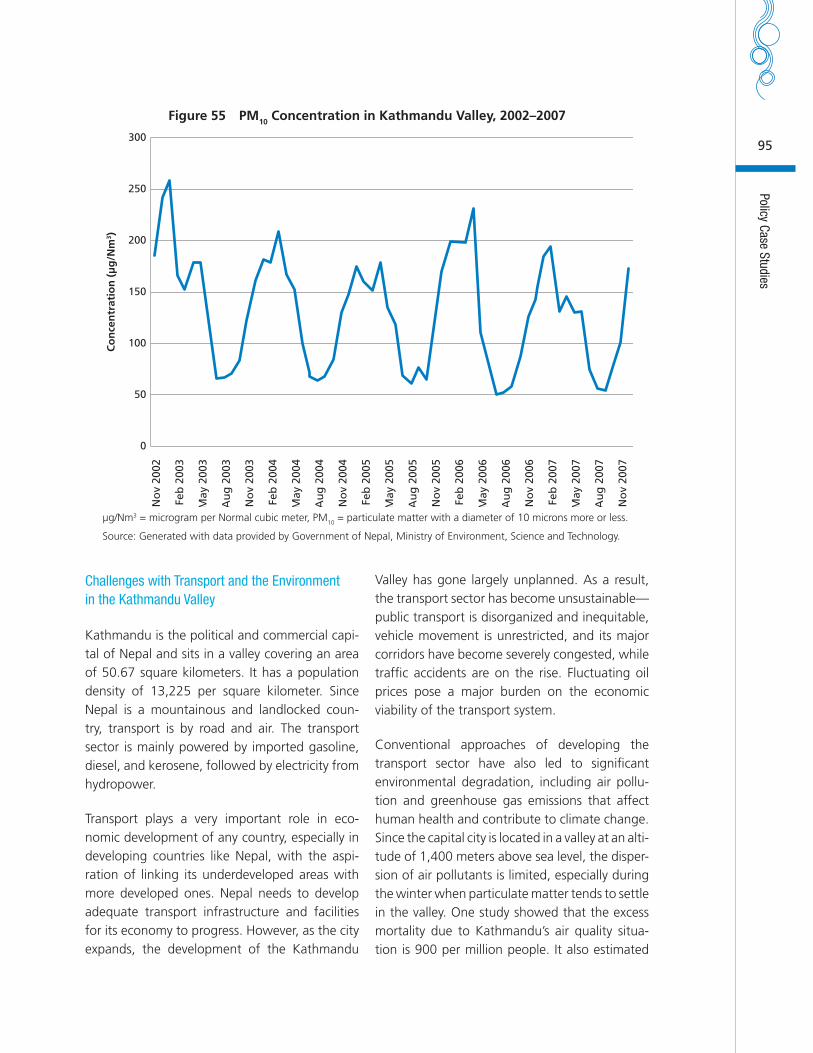
95
Policy Case Studies
Challenges with Transport and the Environment in the Kathmandu Valley
Kathmandu is the political and commercial capi-tal of Nepal and sits in a valley covering an area of 50.67 square kilometers. It has a population density of 13,225 per square kilometer. Since Nepal is a mountainous and landlocked coun-try, transport is by road and air. The transport sector is mainly powered by imported gasoline, diesel, and kerosene, followed by electricity from hydropower.
Transport plays a very important role in eco-nomic development of any country, especially in developing countries like Nepal, with the aspi-ration of linking its underdeveloped areas with more developed ones. Nepal needs to develop adequate transport infrastructure and facilities for its economy to progress. However, as the city expands, the development of the Kathmandu
Valley has gone largely unplanned. As a result, the transport sector has become unsustainable—public transport is disorganized and inequitable, vehicle movement is unrestricted, and its major corridors have become severely congested, while traffic accidents are on the rise. Fluctuating oil prices pose a major burden on the economic viability of the transport system.
Conventional approaches of developing the transport sector have also led to significant environmental degradation, including air pollu-tion and greenhouse gas emissions that affect human health and contribute to climate change. Since the capital city is located in a valley at an alti-tude of 1,400 meters above sea level, the disper-sion of air pollutants is limited, especially during the winter when particulate matter tends to settle in the valley. One study showed that the excess mortality due to Kathmandu’s air quality situa-tion is 900 per million people. It also estimated
Figure 55 PM10 Concentration in Kathmandu Valley, 2002–2007
300
250
200
150
100
50
0
No
v 20
02
Feb
200
3
May
200
3
Au
g 2
003
No
v 20
03
Feb
200
4
May
200
4
Au
g 2
004
No
v 20
04
Feb
200
5
May
200
5
Au
g 2
005
No
v 20
05
Feb
200
6
May
200
6
Au
g 2
006
No
v 20
06
Feb
200
7
May
200
7
Au
g 2
007
No
v 20
07
Co
nce
ntr
atio
n (
μg
/Nm
3 )
μg/Nm3 = microgram per Normal cubic meter, PM10 = particulate matter with a diameter of 10 microns more or less.
Source: Generated with data provided by Government of Nepal, Ministry of Environment, Science and Technology.
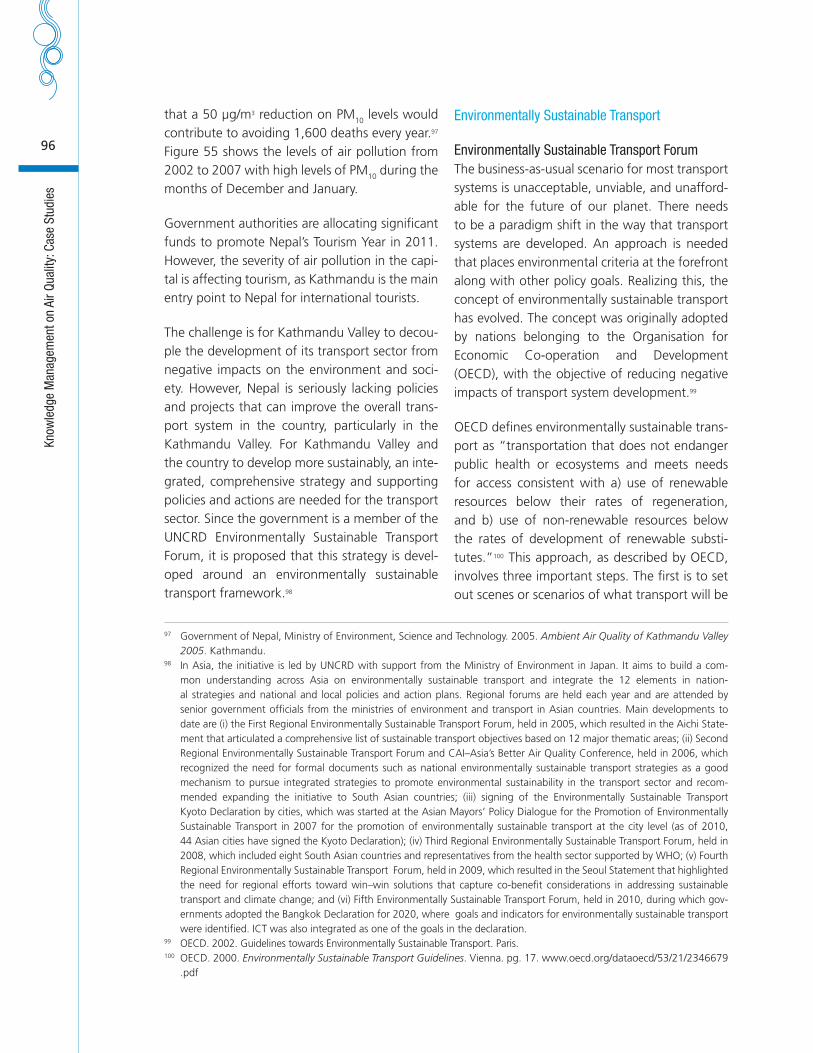
96
Know
ledg
e M
anag
emen
t on
Air Q
ualit
y: C
ase
Stud
ies
that a 50 μg/m3 reduction on PM10 levels would contribute to avoiding 1,600 deaths every year.97 Figure 55 shows the levels of air pollution from 2002 to 2007 with high levels of PM10 during the months of December and January.
Government authorities are allocating significant funds to promote Nepal’s Tourism Year in 2011. However, the severity of air pollution in the capi-tal is affecting tourism, as Kathmandu is the main entry point to Nepal for international tourists.
The challenge is for Kathmandu Valley to decou-ple the development of its transport sector from negative impacts on the environment and soci-ety. However, Nepal is seriously lacking policies and projects that can improve the overall trans-port system in the country, particularly in the Kathmandu Valley. For Kathmandu Valley and the country to develop more sustainably, an inte-grated, comprehensive strategy and supporting policies and actions are needed for the transport sector. Since the government is a member of the UNCRD Environmentally Sustainable Transport Forum, it is proposed that this strategy is devel-oped around an environmentally sustainable transport framework.98
Environmentally Sustainable Transport
Environmentally Sustainable Transport ForumThe business-as-usual scenario for most transport systems is unacceptable, unviable, and unafford-able for the future of our planet. There needs to be a paradigm shift in the way that transport systems are developed. An approach is needed that places environmental criteria at the forefront along with other policy goals. Realizing this, the concept of environmentally sustainable transport has evolved. The concept was originally adopted by nations belonging to the Organisation for Economic Co-operation and Development (OECD), with the objective of reducing negative impacts of transport system development.99
OECD defines environmentally sustainable trans-port as “transportation that does not endanger public health or ecosystems and meets needs for access consistent with a) use of renewable resources below their rates of regeneration, and b) use of non-renewable resources below the rates of development of renewable substi-tutes.”100 This approach, as described by OECD, involves three important steps. The first is to set out scenes or scenarios of what transport will be
97 Government of Nepal, Ministry of Environment, Science and Technology. 2005. Ambient Air Quality of Kathmandu Valley 2005. Kathmandu.
98 In Asia, the initiative is led by UNCRD with support from the Ministry of Environment in Japan. It aims to build a com-mon understanding across Asia on environmentally sustainable transport and integrate the 12 elements in nation-al strategies and national and local policies and action plans. Regional forums are held each year and are attended by senior government officials from the ministries of environment and transport in Asian countries. Main developments to date are (i) the First Regional Environmentally Sustainable Transport Forum, held in 2005, which resulted in the Aichi State-ment that articulated a comprehensive list of sustainable transport objectives based on 12 major thematic areas; (ii) Second Regional Environmentally Sustainable Transport Forum and CAI–Asia’s Better Air Quality Conference, held in 2006, which recognized the need for formal documents such as national environmentally sustainable transport strategies as a good mechanism to pursue integrated strategies to promote environmental sustainability in the transport sector and recom-mended expanding the initiative to South Asian countries; (iii) signing of the Environmentally Sustainable Transport Kyoto Declaration by cities, which was started at the Asian Mayors’ Policy Dialogue for the Promotion of Environmentally Sustainable Transport in 2007 for the promotion of environmentally sustainable transport at the city level (as of 2010, 44 Asian cities have signed the Kyoto Declaration); (iv) Third Regional Environmentally Sustainable Transport Forum, held in 2008, which included eight South Asian countries and representatives from the health sector supported by WHO; (v) Fourth Regional Environmentally Sustainable Transport Forum, held in 2009, which resulted in the Seoul Statement that highlighted the need for regional efforts toward win–win solutions that capture co-benefit considerations in addressing sustainable transport and climate change; and (vi) Fifth Environmentally Sustainable Transport Forum, held in 2010, during which gov-ernments adopted the Bangkok Declaration for 2020, where goals and indicators for environmentally sustainable transport were identified. ICT was also integrated as one of the goals in the declaration.
99 OECD. 2002. Guidelines towards Environmentally Sustainable Transport. Paris.100 OECD. 2000. Environmentally Sustainable Transport Guidelines. Vienna. pg. 17. www.oecd.org/dataoecd/53/21/2346679

97
Policy Case Studies
like when it is environmentally sustainable. The second is to characterize it in terms of quantifi-able targets for transport activities and environ-mental impacts of each unit of activity. The third is to engage in an exercise that works back from these future targets to determine what actions are required to ensure that targets are met.
UNCRD defines environmentally sustainable transport in more general terms, as “transport that meets the needs of the present without preventing future generation from meeting their needs.”101 The concept is thus centered on the transport system and activities that meet social, economic, and environmental objectives. Best practice measures and policies developed for 12 thematic areas (Figure 56) can help to trans-
form transport and the very urban structure of cities toward a more sustainable model. Through the development of environmentally and people friendly urban transport infrastructures, cities can reap the benefits of a more livable and pro-ductive urban space. Environmentally sustainable transport is also about prevention. It will clearly be less costly to prevent negative consequences of motorization rather than to try to retroactively mitigate the problems.
At the Fifth Environmentally Sustainable Trans-port Forum (BOAS), the Government of Nepal requested assistance from UNCRD to develop a national environmentally sustainable transport strategy and action plan to guide its transport and related policies and projects. This strategy would
101 UNCRD. 2010. Environmentally Sustainable Transport for Asian Cities: A Sourcebook. Nagoya.
Figure 56 12 Thematic Areas of an Environmentally Sustainable Transport Strategy
IntegratedEnvironmentally
SustainableTransportStrategy
Source: United Nations Centre for Regional Development (UNCRD). EST News. www.uncrd.or.jp/env/est
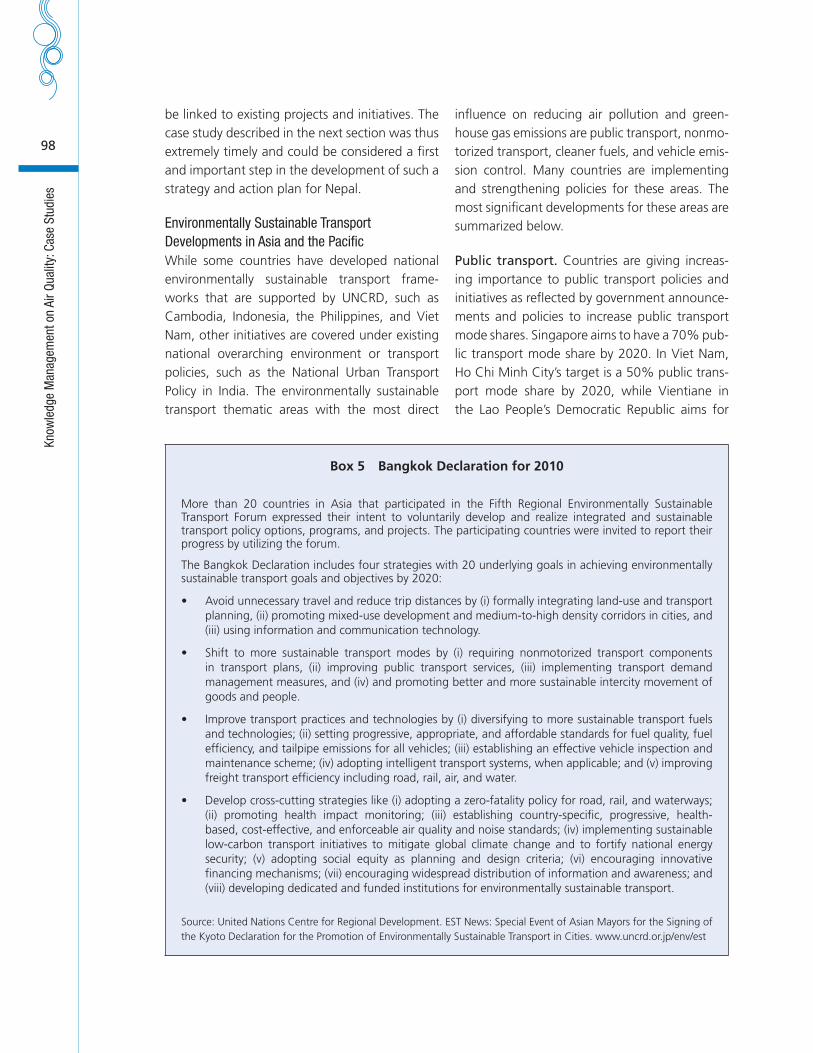
98
Know
ledg
e M
anag
emen
t on
Air Q
ualit
y: C
ase
Stud
ies
be linked to existing projects and initiatives. The case study described in the next section was thus extremely timely and could be considered a first and important step in the development of such a strategy and action plan for Nepal.
Environmentally Sustainable Transport Developments in Asia and the PacificWhile some countries have developed national environmentally sustainable transport frame-works that are supported by UNCRD, such as Cambodia, Indonesia, the Philippines, and Viet Nam, other initiatives are covered under existing national overarching environment or transport policies, such as the National Urban Transport Policy in India. The environmentally sustainable transport thematic areas with the most direct
influence on reducing air pollution and green-house gas emissions are public transport, nonmo-torized transport, cleaner fuels, and vehicle emis-sion control. Many countries are implementing and strengthening policies for these areas. The most significant developments for these areas are summarized below.
Public transport. Countries are giving increas-ing importance to public transport policies and initiatives as reflected by government announce-ments and policies to increase public transport mode shares. Singapore aims to have a 70% pub-lic transport mode share by 2020. In Viet Nam, Ho Chi Minh City’s target is a 50% public trans-port mode share by 2020, while Vientiane in the Lao People’s Democratic Republic aims for
Box 5 Bangkok Declaration for 2010
More than 20 countries in Asia that participated in the Fifth Regional Environmentally Sustainable Transport Forum expressed their intent to voluntarily develop and realize integrated and sustainable transport policy options, programs, and projects. The participating countries were invited to report their progress by utilizing the forum.
The Bangkok Declaration includes four strategies with 20 underlying goals in achieving environmentally sustainable transport goals and objectives by 2020:
Avoid unnecessary travel and reduce trip distances by (i) formally integrating land-use and transport planning, (ii) promoting mixed-use development and medium-to-high density corridors in cities, and (iii) using information and communication technology.
Shift to more sustainable transport modes by (i) requiring nonmotorized transport components in transport plans, (ii) improving public transport services, (iii) implementing transport demand management measures, and (iv) and promoting better and more sustainable intercity movement of goods and people.
Improve transport practices and technologies by (i) diversifying to more sustainable transport fuels and technologies; (ii) setting progressive, appropriate, and affordable standards for fuel quality, fuel efficiency, and tailpipe emissions for all vehicles; (iii) establishing an effective vehicle inspection and maintenance scheme; (iv) adopting intelligent transport systems, when applicable; and (v) improving freight transport efficiency including road, rail, air, and water.
Develop cross-cutting strategies like (i) adopting a zero-fatality policy for road, rail, and waterways; (ii) promoting health impact monitoring; (iii) establishing country-specific, progressive, health-based, cost-effective, and enforceable air quality and noise standards; (iv) implementing sustainable low-carbon transport initiatives to mitigate global climate change and to fortify national energy security; (v) adopting social equity as planning and design criteria; (vi) encouraging innovative financing mechanisms; (vii) encouraging widespread distribution of information and awareness; and (viii) developing dedicated and funded institutions for environmentally sustainable transport.
Source: United Nations Centre for Regional Development. EST News: Special Event of Asian Mayors for the Signing of the Kyoto Declaration for the Promotion of Environmentally Sustainable Transport in Cities. www.uncrd.or.jp/env/est
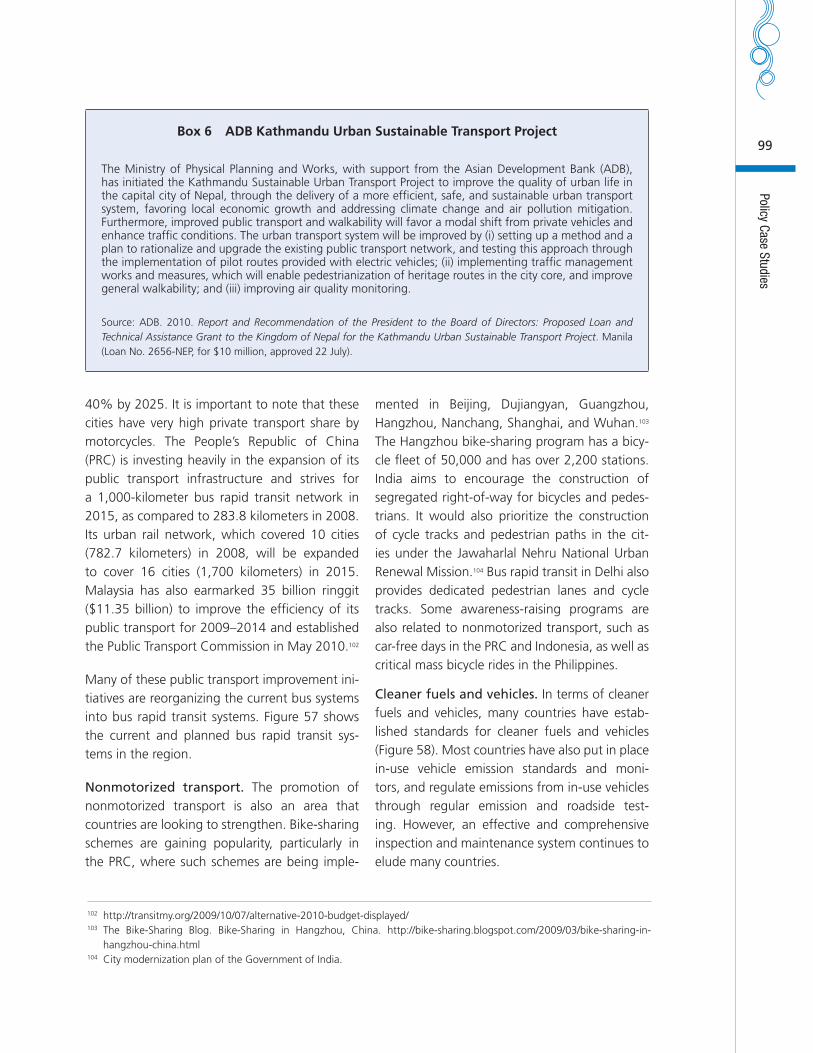
99
Policy Case Studies
40% by 2025. It is important to note that these cities have very high private transport share by motorcycles. The People’s Republic of China (PRC) is investing heavily in the expansion of its public transport infrastructure and strives for a 1,000-kilometer bus rapid transit network in 2015, as compared to 283.8 kilometers in 2008. Its urban rail network, which covered 10 cities (782.7 kilometers) in 2008, will be expanded to cover 16 cities (1,700 kilometers) in 2015. Malaysia has also earmarked 35 billion ringgit ($11.35 billion) to improve the efficiency of its public transport for 2009–2014 and established the Public Transport Commission in May 2010.102
Many of these public transport improvement ini-tiatives are reorganizing the current bus systems into bus rapid transit systems. Figure 57 shows the current and planned bus rapid transit sys-tems in the region.
Nonmotorized transport. The promotion of nonmotorized transport is also an area that countries are looking to strengthen. Bike-sharing schemes are gaining popularity, particularly in the PRC, where such schemes are being imple-
mented in Beijing, Dujiangyan, Guangzhou, Hangzhou, Nanchang, Shanghai, and Wuhan.103
The Hangzhou bike-sharing program has a bicy-cle fleet of 50,000 and has over 2,200 stations. India aims to encourage the construction of segregated right-of-way for bicycles and pedes-trians. It would also prioritize the construction of cycle tracks and pedestrian paths in the cit-ies under the Jawaharlal Nehru National Urban Renewal Mission.104 Bus rapid transit in Delhi also provides dedicated pedestrian lanes and cycle tracks. Some awareness-raising programs are also related to nonmotorized transport, such as car-free days in the PRC and Indonesia, as well as critical mass bicycle rides in the Philippines.
Cleaner fuels and vehicles. In terms of cleaner fuels and vehicles, many countries have estab-lished standards for cleaner fuels and vehicles (Figure 58). Most countries have also put in place in-use vehicle emission standards and moni-tors, and regulate emissions from in-use vehicles through regular emission and roadside test-ing. However, an effective and comprehensive inspection and maintenance system continues to elude many countries.
102 http://transitmy.org/2009/10/07/alternative-2010-budget-displayed/103 The Bike-Sharing Blog. Bike-Sharing in Hangzhou, China. http://bike-sharing.blogspot.com/2009/03/bike-sharing-in-
hangzhou-china.html104 City modernization plan of the Government of India.
Box 6 ADB Kathmandu Urban Sustainable Transport Project
The Ministry of Physical Planning and Works, with support from the Asian Development Bank (ADB), has initiated the Kathmandu Sustainable Urban Transport Project to improve the quality of urban life in the capital city of Nepal, through the delivery of a more efficient, safe, and sustainable urban transport system, favoring local economic growth and addressing climate change and air pollution mitigation. Furthermore, improved public transport and walkability will favor a modal shift from private vehicles and enhance traffic conditions. The urban transport system will be improved by (i) setting up a method and a plan to rationalize and upgrade the existing public transport network, and testing this approach through the implementation of pilot routes provided with electric vehicles; (ii) implementing traffic management works and measures, which will enable pedestrianization of heritage routes in the city core, and improve general walkability; and (iii) improving air quality monitoring.
Source: ADB. 2010. Report and Recommendation of the President to the Board of Directors: Proposed Loan and Technical Assistance Grant to the Kingdom of Nepal for the Kathmandu Urban Sustainable Transport Project. Manila (Loan No. 2656-NEP, for $10 million, approved 22 July).
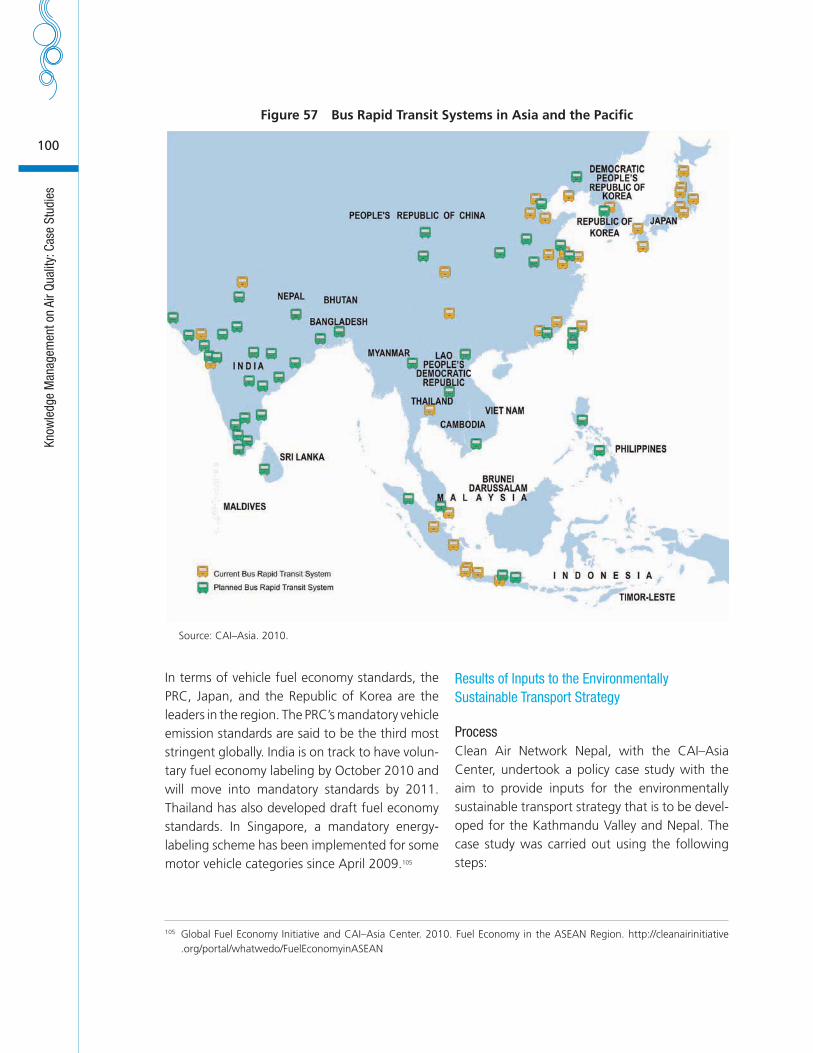
100
Know
ledg
e M
anag
emen
t on
Air Q
ualit
y: C
ase
Stud
ies
In terms of vehicle fuel economy standards, the PRC, Japan, and the Republic of Korea are the leaders in the region. The PRC’s mandatory vehicle emission standards are said to be the third most stringent globally. India is on track to have volun-tary fuel economy labeling by October 2010 and will move into mandatory standards by 2011. Thailand has also developed draft fuel economy standards. In Singapore, a mandatory energy-labeling scheme has been implemented for some motor vehicle categories since April 2009.105
Results of Inputs to the Environmentally Sustainable Transport Strategy
ProcessClean Air Network Nepal, with the CAI–Asia Center, undertook a policy case study with the aim to provide inputs for the environmentally sustainable transport strategy that is to be devel-oped for the Kathmandu Valley and Nepal. The case study was carried out using the following steps:
105 Global Fuel Economy Initiative and CAI–Asia Center. 2010. Fuel Economy in the ASEAN Region. http://cleanairinitiative.org/portal/whatwedo/FuelEconomyinASEAN
Figure 57 Bus Rapid Transit Systems in Asia and the Pacific
Source: CAI–Asia. 2010.
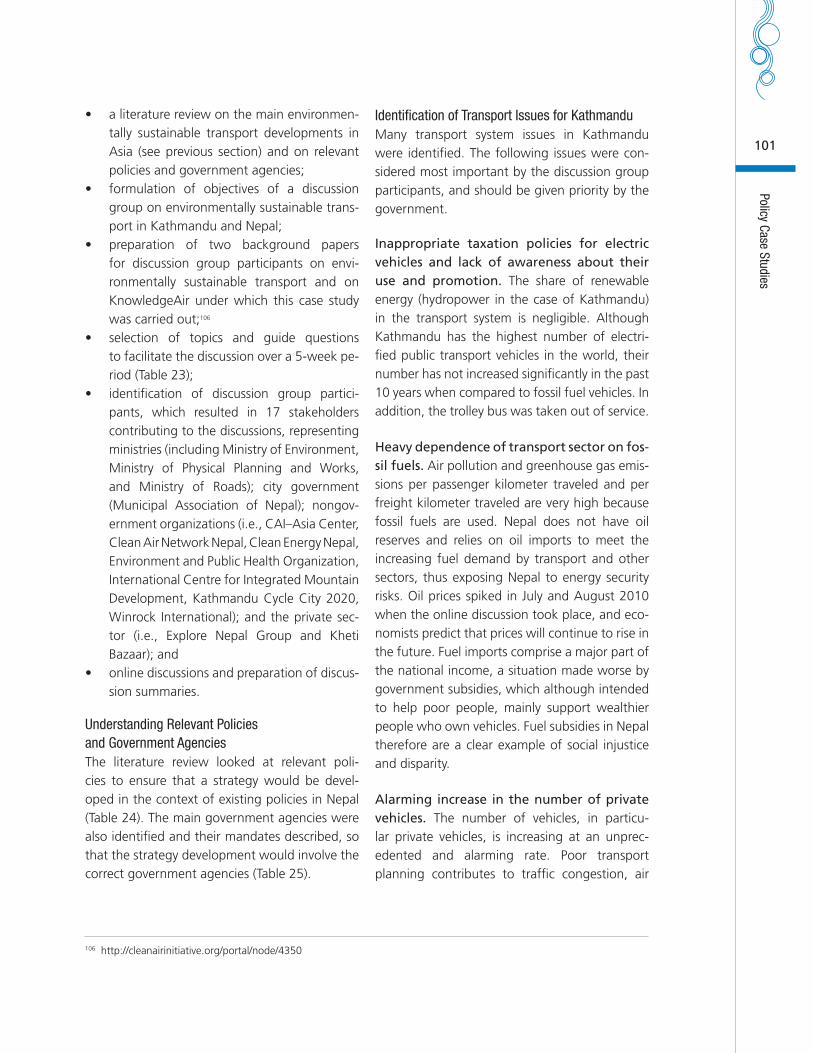
101
Policy Case Studies
a literature review on the main environmen-tally sustainable transport developments in Asia (see previous section) and on relevant policies and government agencies;formulation of objectives of a discussion group on environmentally sustainable trans-port in Kathmandu and Nepal;preparation of two background papers for discussion group participants on envi-ronmentally sustainable transport and on KnowledgeAir under which this case study was carried out;106
selection of topics and guide questions to facilitate the discussion over a 5-week pe-riod (Table 23);identification of discussion group partici-pants, which resulted in 17 stakeholders contributing to the discussions, representing ministries (including Ministry of Environment, Ministry of Physical Planning and Works, and Ministry of Roads); city government (Municipal Association of Nepal); nongov-ernment organizations (i.e., CAI–Asia Center, Clean Air Network Nepal, Clean Energy Nepal, Environment and Public Health Organization, International Centre for Integrated Mountain Development, Kathmandu Cycle City 2020, Winrock International); and the private sec-tor (i.e., Explore Nepal Group and Kheti Bazaar); andonline discussions and preparation of discus-sion summaries.
Understanding Relevant Policies and Government AgenciesThe literature review looked at relevant poli-cies to ensure that a strategy would be devel-oped in the context of existing policies in Nepal (Table 24). The main government agencies were also identified and their mandates described, so that the strategy development would involve the correct government agencies (Table 25).
Identification of Transport Issues for KathmanduMany transport system issues in Kathmandu were identified. The following issues were con-sidered most important by the discussion group participants, and should be given priority by the government.
Inappropriate taxation policies for electric vehicles and lack of awareness about their use and promotion. The share of renewable energy (hydropower in the case of Kathmandu) in the transport system is negligible. Although Kathmandu has the highest number of electri-fied public transport vehicles in the world, their number has not increased significantly in the past 10 years when compared to fossil fuel vehicles. In addition, the trolley bus was taken out of service.
Heavy dependence of transport sector on fos-sil fuels. Air pollution and greenhouse gas emis-sions per passenger kilometer traveled and per freight kilometer traveled are very high because fossil fuels are used. Nepal does not have oil reserves and relies on oil imports to meet the increasing fuel demand by transport and other sectors, thus exposing Nepal to energy security risks. Oil prices spiked in July and August 2010 when the online discussion took place, and eco-nomists predict that prices will continue to rise in the future. Fuel imports comprise a major part of the national income, a situation made worse by government subsidies, which although intended to help poor people, mainly support wealthier people who own vehicles. Fuel subsidies in Nepal therefore are a clear example of social injustice and disparity.
Alarming increase in the number of private vehicles. The number of vehicles, in particu-lar private vehicles, is increasing at an unprec-edented and alarming rate. Poor transport planning contributes to traffic congestion, air
106 http://cleanairinitiative.org/portal/node/4350
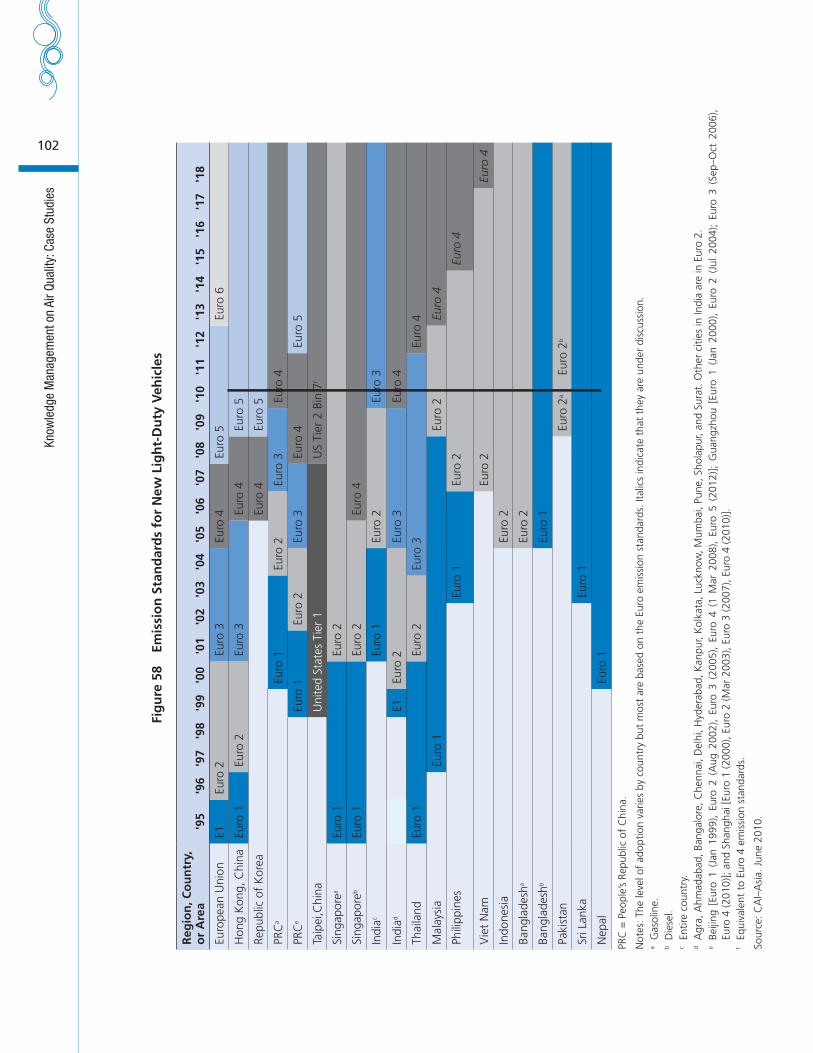
102
Know
ledg
e M
anag
emen
t on
Air Q
ualit
y: C
ase
Stud
ies
Fig
ure
58
Emis
sio
n S
tan
dar
ds
for
New
Lig
ht-
Du
ty V
ehic
les
PRC
= P
eopl
e’s
Repu
blic
of
Chi
na.
Not
es: T
he le
vel o
f ad
optio
n va
ries
by c
ount
ry b
ut m
ost
are
base
d on
the
Eur
o em
issi
on s
tand
ards
. Ita
lics
indi
cate
tha
t th
ey a
re u
nder
dis
cuss
ion.
a G
asol
ine.
b
Die
sel.
c En
tire
coun
try.
d A
gra,
Ahm
adab
ad, B
anga
lore
, Che
nnai
, Del
hi, H
yder
abad
, Kan
pur,
Kol
kata
, Luc
know
, Mum
bai,
Pune
, Sho
lapu
r, an
d Su
rat.
Oth
er c
ities
in In
dia
are
in E
uro
2.
e Be
ijing
[Eu
ro 1
(Ja
n 19
99),
Euro
2 (
Aug
200
2),
Euro
3 (
2005
), Eu
ro 4
(1
Mar
200
8),
Euro
5 (
2012
)]; G
uang
zhou
[Eu
ro 1
(Ja
n 20
00),
Euro
2 (
Jul
2004
); Eu
ro 3
(Se
p–O
ct 2
006)
, Eu
ro 4
(201
0)];
and
Shan
ghai
[Eur
o 1
(200
0), E
uro
2 (M
ar 2
003)
, Eur
o 3
(200
7), E
uro
4 (2
010)
]. f
Equi
vale
nt t
o Eu
ro 4
em
issi
on s
tand
ards
.
Sour
ce: C
AI–
Asi
a. J
une
2010
.
Reg
ion
, Co
un
try,
o
r A
rea
'95
'96
'97
'98
'99
'00
'01
'02
'03
'04
'05
'06
'07
'08
'09
'10
'11
'12
'13
'14
'15
'16
'17
'18
Euro
pean
Uni
onE1
Euro
2Eu
ro 3
Euro
4Eu
ro 5
Euro
6
Hon
g K
ong,
Chi
naEu
ro 1
Euro
2Eu
ro 3
Euro
4Eu
ro 5
Repu
blic
of
Kor
eaEu
ro 4
Euro
5
PRC
aEu
ro 1
Euro
2Eu
ro 3
Euro
4
PRC
eEu
ro 1
Euro
2Eu
ro 3
Euro
4Eu
ro 5
Taip
ei,C
hina
Uni
ted
Stat
es T
ier
1U
S Ti
er 2
Bin
7f
Sing
apor
eaEu
ro 1
Euro
2
Sing
apor
ebEu
ro 1
Euro
2Eu
ro 4
Indi
ac Eu
ro 1
Euro
2Eu
ro 3
Indi
adE1
Euro
2Eu
ro 3
Euro
4
Thai
land
Euro
1
Euro
2Eu
ro 3
Euro
4
Mal
aysi
aEu
ro 1
Euro
2Eu
ro 4
Phili
ppin
esEu
ro 1
Euro
2Eu
ro 4
Vie
t N
amEu
ro 2
Euro
4
Indo
nesi
aEu
ro 2
Bang
lade
sha
Euro
2
Bang
lade
shb
Euro
1
Paki
stan
Eu
ro 2
aEu
ro 2
b
Sri L
anka
Euro
1
Nep
alEu
ro 1
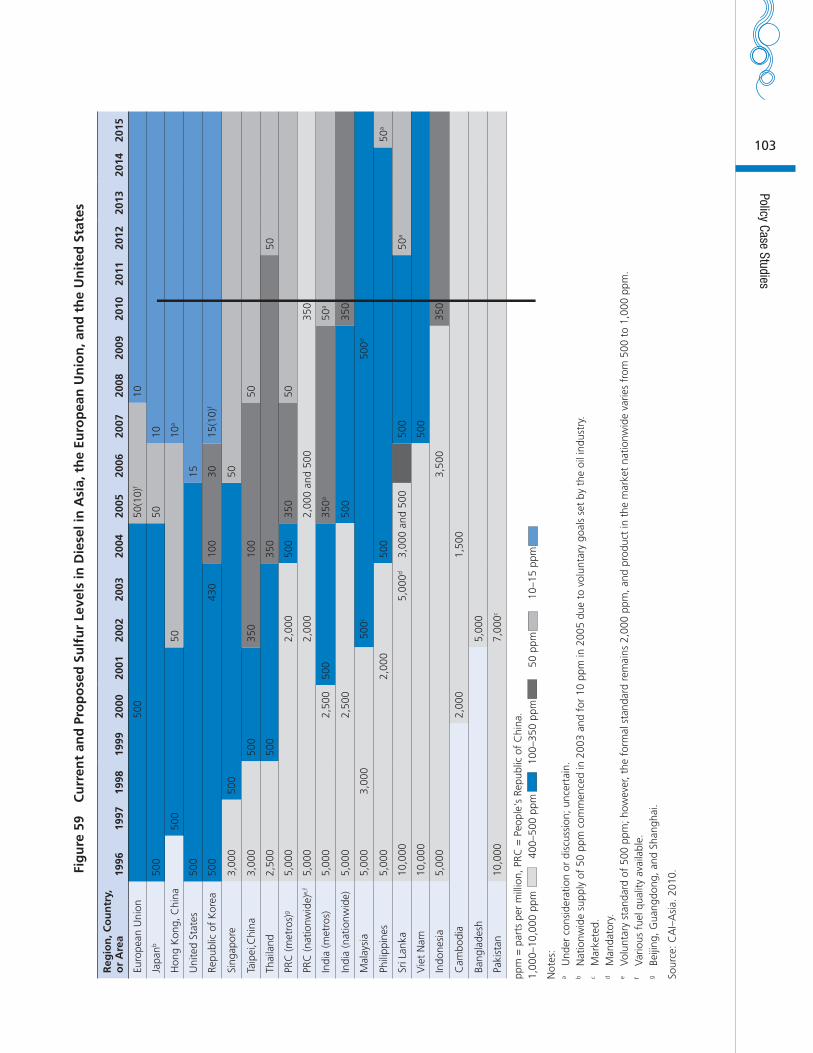
103
Policy Case Studies
Fig
ure
59
Cu
rren
t an
d P
rop
ose
d S
ulf
ur
Leve
ls in
Die
sel i
n A
sia,
th
e Eu
rop
ean
Un
ion
, an
d t
he
Un
ited
Sta
tes
Reg
ion
, Co
un
try,
o
r A
rea
1996
1997
1998
1999
2000
2001
2002
2003
2004
2005
2006
2007
2008
2009
2010
2011
2012
2013
2014
2015
Euro
pean
Uni
on50
050
(10)
f10
Japa
nb50
050
10
Hon
g K
ong,
Chi
na50
050
10a
Uni
ted
Stat
es50
015
Repu
blic
of
Kor
ea50
043
010
030
15(1
0)f
Sing
apor
e3,
000
500
50
Taip
ei,C
hina
3,00
050
035
010
050
Thai
land
2,50
050
035
050
PRC
(met
ros)
g5,
000
2,00
050
035
050
PRC
(nat
ionw
ide)
e,f
5,00
02,
000
2,00
0 an
d 50
035
0
Indi
a (m
etro
s)5,
000
2,50
050
035
0a50
a
Indi
a (n
atio
nwid
e)5,
000
2,50
050
035
0
Mal
aysi
a5,
000
3,00
0
500
c 50
0d
Phili
ppin
es5,
000
2,00
050
050
a
Sri L
anka
10,0
005,
000d
3,00
0 an
d 50
050
050
a
Vie
t N
am10
,000
500
Indo
nesi
a5,
000
3,50
035
0
Cam
bodi
a2,
000
1,50
0
Bang
lade
sh5,
000
Paki
stan
10
,000
7,00
0c
ppm
= p
arts
per
mill
ion,
PRC
= P
eopl
e's
Repu
blic
of
Chi
na.
1,00
0–10
,000
ppm
4
00–5
00 p
pm
100
–350
ppm
5
0 pp
m
10–
15 p
pm
Not
es:
a U
nder
con
side
ratio
n or
dis
cuss
ion;
unc
erta
in.
b N
atio
nwid
e su
pply
of
50 p
pm c
omm
ence
d in
200
3 an
d fo
r 10
ppm
in 2
005
due
to v
olun
tary
goa
ls s
et b
y th
e oi
l ind
ustr
y.c
Mar
kete
d.d
Man
dato
ry.
e Vo
lunt
ary
stan
dard
of
500
ppm
; how
ever
, the
for
mal
sta
ndar
d re
mai
ns 2
,000
ppm
, and
pro
duct
in t
he m
arke
t na
tionw
ide
varie
s fr
om 5
00 t
o 1,
000
ppm
.f
Vario
us f
uel q
ualit
y av
aila
ble.
g Be
ijing
, Gua
ngdo
ng, a
nd S
hang
hai.
Sour
ce: C
AI–
Asi
a. 2
010.
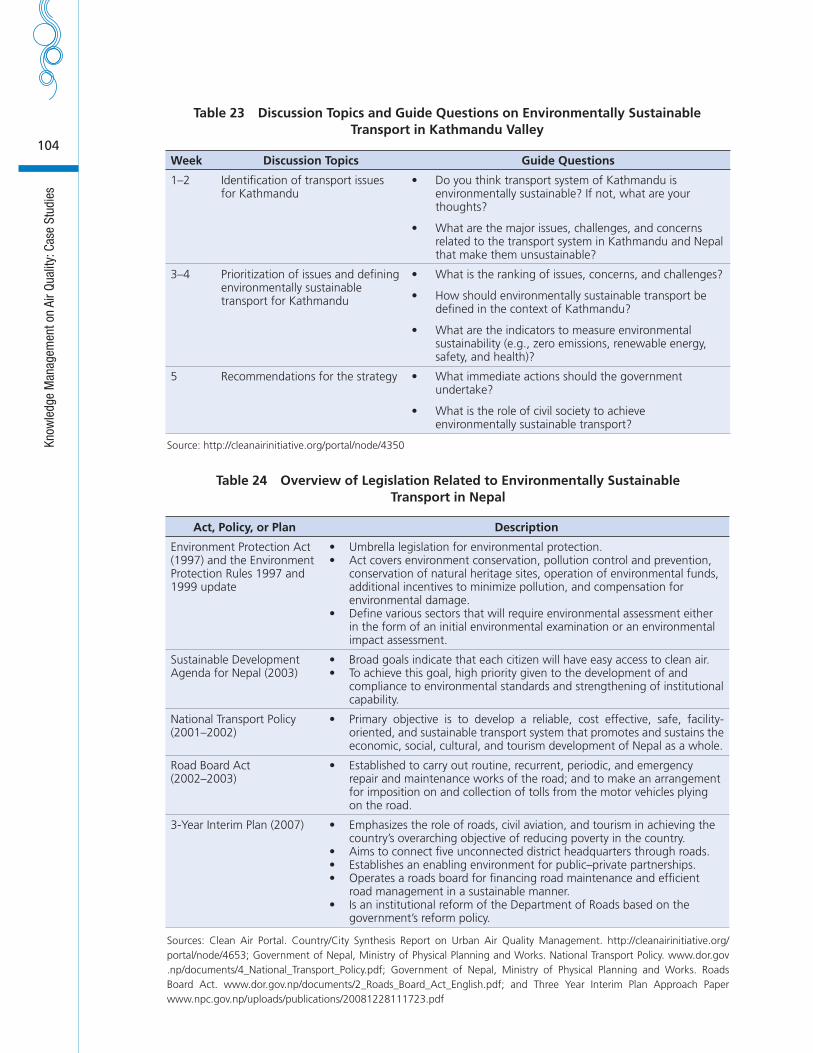
104
Know
ledg
e M
anag
emen
t on
Air Q
ualit
y: C
ase
Stud
ies
Table 24 Overview of Legislation Related to Environmentally Sustainable Transport in Nepal
Act, Policy, or Plan Description
Environment Protection Act (1997) and the Environment Protection Rules 1997 and 1999 update
Umbrella legislation for environmental protection.Act covers environment conservation, pollution control and prevention, conservation of natural heritage sites, operation of environmental funds, additional incentives to minimize pollution, and compensation for environmental damage.Define various sectors that will require environmental assessment either in the form of an initial environmental examination or an environmental impact assessment.
Sustainable Development Agenda for Nepal (2003)
Broad goals indicate that each citizen will have easy access to clean air.To achieve this goal, high priority given to the development of and compliance to environmental standards and strengthening of institutional capability.
National Transport Policy (2001–2002)
Primary objective is to develop a reliable, cost effective, safe, facility- oriented, and sustainable transport system that promotes and sustains the economic, social, cultural, and tourism development of Nepal as a whole.
Road Board Act (2002–2003)
Established to carry out routine, recurrent, periodic, and emergency repair and maintenance works of the road; and to make an arrangement for imposition on and collection of tolls from the motor vehicles plying on the road.
3-Year Interim Plan (2007) Emphasizes the role of roads, civil aviation, and tourism in achieving the country’s overarching objective of reducing poverty in the country.Aims to connect five unconnected district headquarters through roads.Establishes an enabling environment for public–private partnerships.Operates a roads board for financing road maintenance and efficient road management in a sustainable manner.Is an institutional reform of the Department of Roads based on the government’s reform policy.
Sources: Clean Air Portal. Country/City Synthesis Report on Urban Air Quality Management. http://cleanairinitiative.org/portal/node/4653; Government of Nepal, Ministry of Physical Planning and Works. National Transport Policy. www.dor.gov .np/documents/4_National_Transport_Policy.pdf; Government of Nepal, Ministry of Physical Planning and Works. Roads Board Act. www.dor.gov.np/documents/2_Roads_Board_Act_English.pdf; and Three Year Interim Plan Approach Paper www.npc.gov.np/uploads/publications/20081228111723.pdf
Table 23 Discussion Topics and Guide Questions on Environmentally Sustainable Transport in Kathmandu Valley
Week Discussion Topics Guide Questions
1–2 Identification of transport issues for Kathmandu
Do you think transport system of Kathmandu is environmentally sustainable? If not, what are your thoughts?
What are the major issues, challenges, and concerns related to the transport system in Kathmandu and Nepal that make them unsustainable?
3–4 Prioritization of issues and defining environmentally sustainable transport for Kathmandu
What is the ranking of issues, concerns, and challenges?
How should environmentally sustainable transport be defined in the context of Kathmandu?
What are the indicators to measure environmental sustainability (e.g., zero emissions, renewable energy, safety, and health)?
5 Recommendations for the strategy What immediate actions should the government undertake?
What is the role of civil society to achieve environmentally sustainable transport?
Source: http://cleanairinitiative.org/portal/node/4350
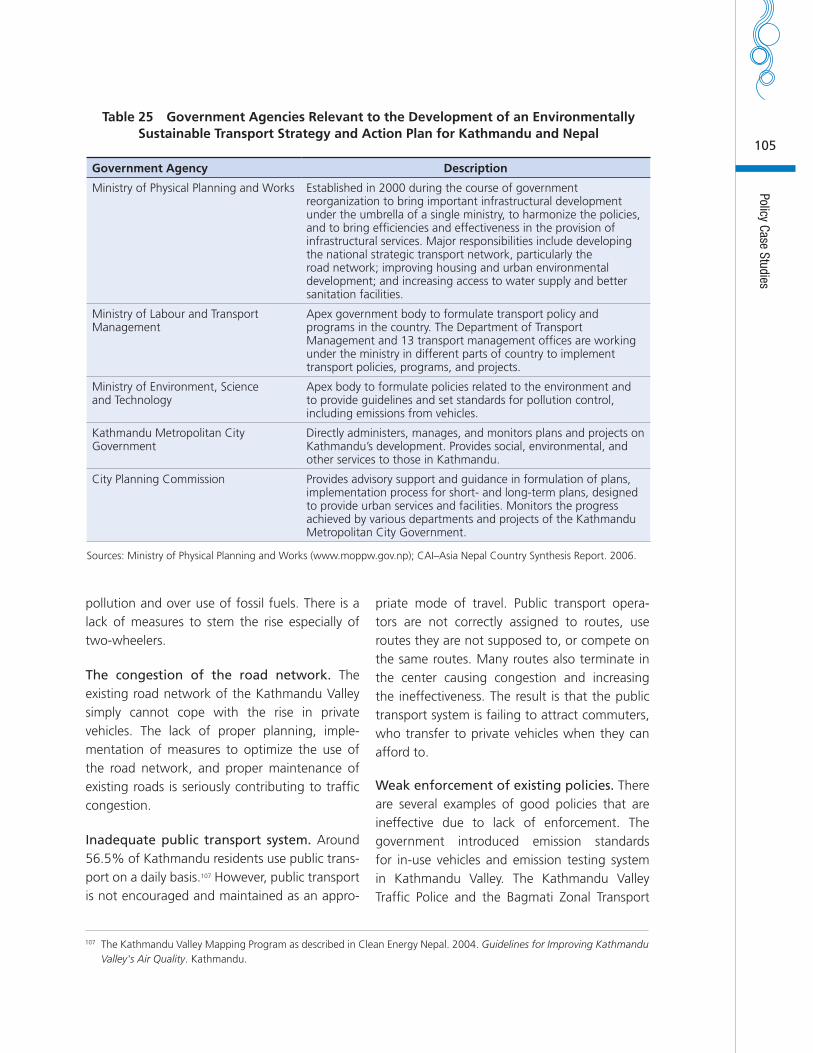
105
Policy Case Studies
Government Agency Description
Ministry of Physical Planning and Works Established in 2000 during the course of government reorganization to bring important infrastructural development under the umbrella of a single ministry, to harmonize the policies, and to bring efficiencies and effectiveness in the provision of infrastructural services. Major responsibilities include developing the national strategic transport network, particularly the road network; improving housing and urban environmental development; and increasing access to water supply and better sanitation facilities.
Ministry of Labour and Transport Management
Apex government body to formulate transport policy and programs in the country. The Department of Transport Management and 13 transport management offices are working under the ministry in different parts of country to implement transport policies, programs, and projects.
Ministry of Environment, Science and Technology
Apex body to formulate policies related to the environment and to provide guidelines and set standards for pollution control, including emissions from vehicles.
Kathmandu Metropolitan City Government
Directly administers, manages, and monitors plans and projects on Kathmandu’s development. Provides social, environmental, and other services to those in Kathmandu.
City Planning Commission Provides advisory support and guidance in formulation of plans, implementation process for short- and long-term plans, designed to provide urban services and facilities. Monitors the progress achieved by various departments and projects of the Kathmandu Metropolitan City Government.
Table 25 Government Agencies Relevant to the Development of an Environmentally Sustainable Transport Strategy and Action Plan for Kathmandu and Nepal
Sources: Ministry of Physical Planning and Works (www.moppw.gov.np); CAI–Asia Nepal Country Synthesis Report. 2006.
pollution and over use of fossil fuels. There is a lack of measures to stem the rise especially of two-wheelers.
The congestion of the road network. The existing road network of the Kathmandu Valley simply cannot cope with the rise in private vehicles. The lack of proper planning, imple-mentation of measures to optimize the use of the road network, and proper maintenance of existing roads is seriously contributing to traffic congestion.
Inadequate public transport system. Around 56.5% of Kathmandu residents use public trans-port on a daily basis.107 However, public transport is not encouraged and maintained as an appro-
priate mode of travel. Public transport opera-tors are not correctly assigned to routes, use routes they are not supposed to, or compete on the same routes. Many routes also terminate in the center causing congestion and increasing the ineffectiveness. The result is that the public transport system is failing to attract commuters, who transfer to private vehicles when they can afford to.
Weak enforcement of existing policies. There are several examples of good policies that are ineffective due to lack of enforcement. The government introduced emission standards for in-use vehicles and emission testing system in Kathmandu Valley. The Kathmandu Valley Traffic Police and the Bagmati Zonal Transport
107 The Kathmandu Valley Mapping Program as described in Clean Energy Nepal. 2004. Guidelines for Improving Kathmandu Valley's Air Quality. Kathmandu.
106
Know
ledg
e M
anag
emen
t on
Air Q
ualit
y: C
ase
Stud
ies
Management Office of Department of Traffic Management have been constantly monitoring the emission level of in-use and imported new vehicles. These agencies are providing green stickers to those vehicles, which pass the test. However, vehicle emission testing facilities are degraded, and there is a serious lack of man-power to run, monitor, and oversee these facili-ties. As a result, the effectiveness of the green sticker for vehicles is questionable. It is also very easy to obtain a driving license, making traffic management more difficult. Most basic traffic laws are not enforced, and violators are pun-ished randomly. Because the current system of traffic enforcement in Kathmandu is manual-based, whereby officers issue manually written tickets for offences that are not processed in a central database, tracking habitual offenders is extremely difficult. Furthermore, the air pollution in the valley is so critical that ambient air qual-ity standards should be revised and made stricter as well as fuel quality and vehicle emission stan-dards, including their enforcement. The lack of a national fuel economy policy or standards fur-ther enhances fuel use and this aggravates exist-ing problems.
Lack of integration of land use planning with transport planning. Land use planning and urban development planning have signifi-cant roles to play. One example is the construc-tion of an outer ring road in the valley, which the government supports in the belief that con-struction of more roads around the existing ring road may ease congestion. Instead, this outer ring road promotes further urban sprawl in the valley, when there already is a trend of people moving from the city to surrounding semi-urban areas, making the city less dense. This, in turn, will add to travel demand and require additional investments in the transport system and other services.
Weak vehicle parking system and manage-ment of street vendors. The system and rules governing vehicle parking are haphazard, espe-cially in the core areas of Kathmandu. Even where a nominal parking fee has to be paid (for which there is no transparent system and accountability), vehicles are parked on footpaths or are parked up to the middle of the main road. This problem is further magnified by unmanaged street vendors who are able to set up shop wher-ever they want. This especially affects pedestri-ans as parked cars and street vendors intrude on available walking space.
Neglect of nonmotorized transport. A related and very important issue is the neglect of nonmotorized transport, including walk-ing and cycling. These modes have not been explored as priority solutions for making Kathmandu’s urban transport system more sus-tainable. Proper light signals, zebra crossings and other crossing facilities, infrastructure for people with disabilities, and pedestrian access and connection routes to different transport modes, are completely ignored in the current transport system. The irony is that about 19% of Kathmandu residents are regular walkers, and therefore their safety and well-being should be of utmost priority.108
Recommendations for the Environmentally Sustainable Transport Strategy and Action Plan for NepalTo guide an environmentally sustainable trans-port strategy and action plan for Nepal and Kathmandu, a vision for environmentally sustain-able transport was drafted:
By 2020 and beyond, a safe, secure, affordable, efficient, and people and environment friendly transport system will be achieved to significantly reduce
108 Clean Energy Nepal and Clean Air Network Nepal. 2010. Assessment of Pedestrian Infrastructures and Services in Four Areas of Nepal. Kathmandu.
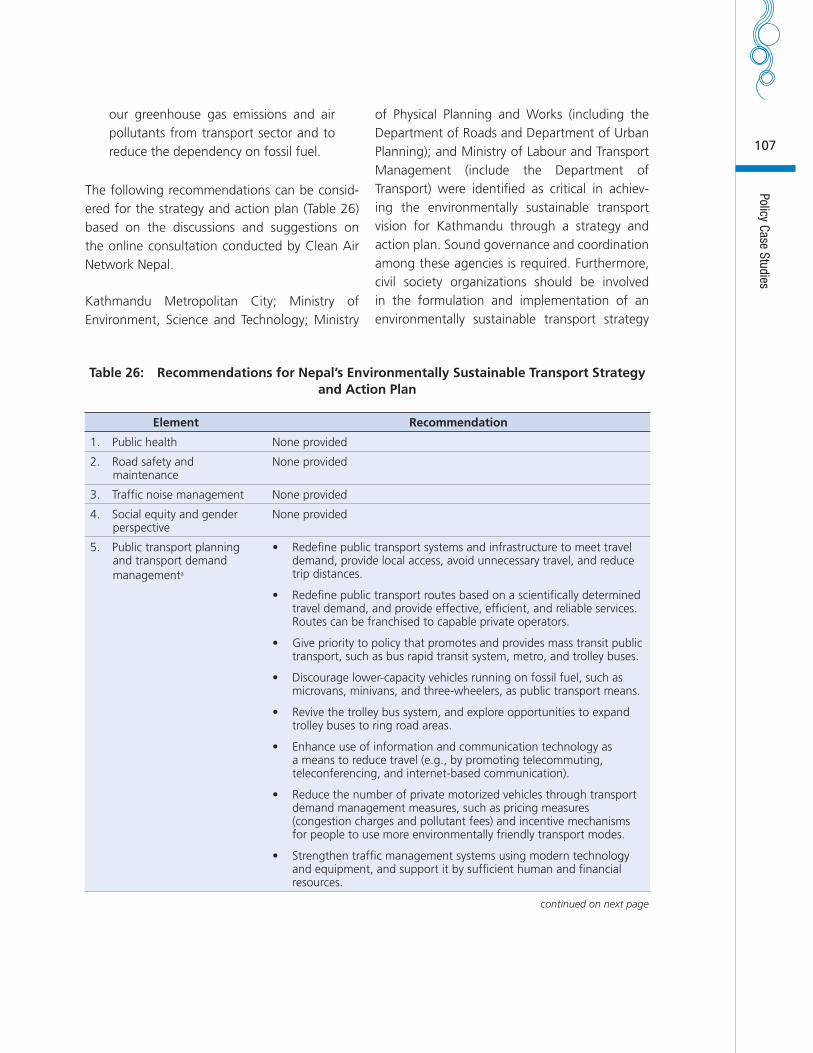
107
Policy Case Studies
our greenhouse gas emissions and air pollutants from transport sector and to reduce the dependency on fossil fuel.
The following recommendations can be consid-ered for the strategy and action plan (Table 26) based on the discussions and suggestions on the online consultation conducted by Clean Air Network Nepal.
Kathmandu Metropolitan City; Ministry of Environment, Science and Technology; Ministry
of Physical Planning and Works (including the Department of Roads and Department of Urban Planning); and Ministry of Labour and Transport Management (include the Department of Transport) were identified as critical in achiev-ing the environmentally sustainable transport vision for Kathmandu through a strategy and action plan. Sound governance and coordination among these agencies is required. Furthermore, civil society organizations should be involved in the formulation and implementation of an environmentally sustainable transport strategy
Element Recommendation
1. Public health None provided
2. Road safety and maintenance
None provided
3. Traffic noise management None provided
4. Social equity and gender perspective
None provided
5. Public transport planning and transport demand managementa
Redefine public transport systems and infrastructure to meet travel demand, provide local access, avoid unnecessary travel, and reduce trip distances.
Redefine public transport routes based on a scientifically determined travel demand, and provide effective, efficient, and reliable services. Routes can be franchised to capable private operators.
Give priority to policy that promotes and provides mass transit public transport, such as bus rapid transit system, metro, and trolley buses.
Discourage lower-capacity vehicles running on fossil fuel, such as microvans, minivans, and three-wheelers, as public transport means.
Revive the trolley bus system, and explore opportunities to expand trolley buses to ring road areas.
Enhance use of information and communication technology as a means to reduce travel (e.g., by promoting telecommuting, teleconferencing, and internet-based communication).
Reduce the number of private motorized vehicles through transport demand management measures, such as pricing measures (congestion charges and pollutant fees) and incentive mechanisms for people to use more environmentally friendly transport modes.
Strengthen traffic management systems using modern technology and equipment, and support it by sufficient human and financial resources.
Table 26: Recommendations for Nepal’s Environmentally Sustainable Transport Strategy and Action Plan
continued on next page
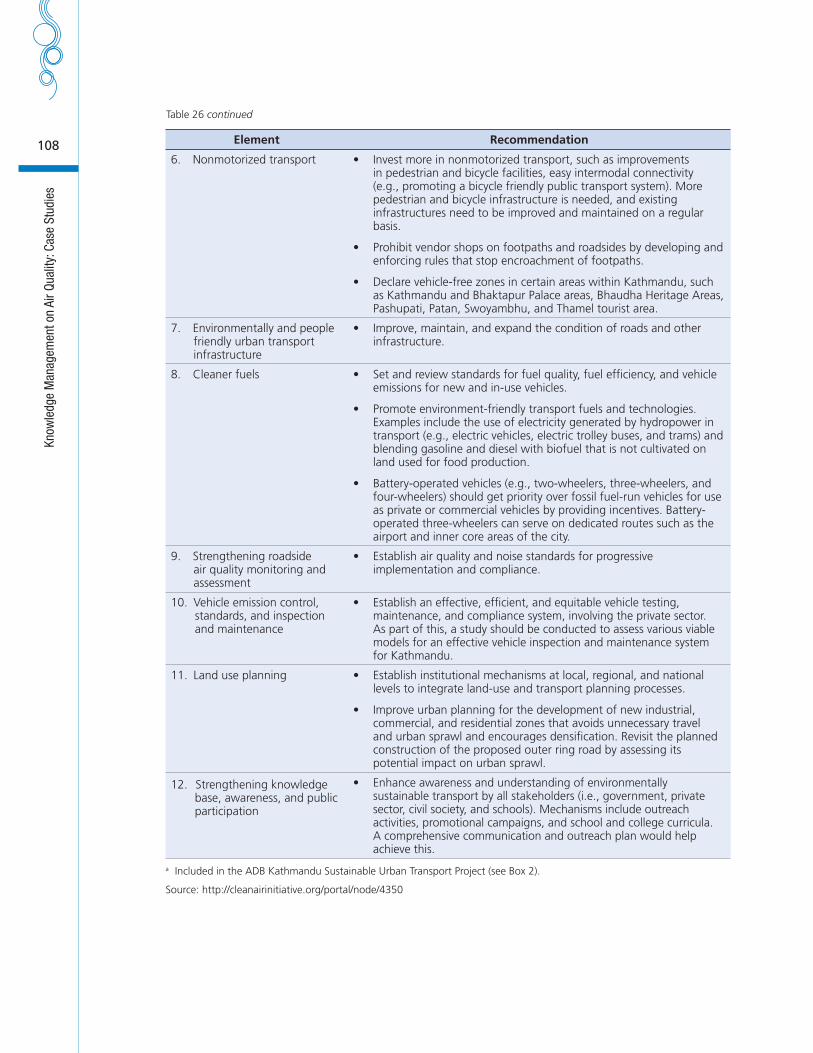
108
Know
ledg
e M
anag
emen
t on
Air Q
ualit
y: C
ase
Stud
ies
Table 26 continued
a Included in the ADB Kathmandu Sustainable Urban Transport Project (see Box 2).
Source: http://cleanairinitiative.org/portal/node/4350
Element Recommendation
6. Nonmotorized transport Invest more in nonmotorized transport, such as improvements in pedestrian and bicycle facilities, easy intermodal connectivity (e.g., promoting a bicycle friendly public transport system). More pedestrian and bicycle infrastructure is needed, and existing infrastructures need to be improved and maintained on a regular basis.
Prohibit vendor shops on footpaths and roadsides by developing and enforcing rules that stop encroachment of footpaths.
Declare vehicle-free zones in certain areas within Kathmandu, such as Kathmandu and Bhaktapur Palace areas, Bhaudha Heritage Areas, Pashupati, Patan, Swoyambhu, and Thamel tourist area.
7. Environmentally and people friendly urban transport infrastructure
Improve, maintain, and expand the condition of roads and other infrastructure.
8. Cleaner fuels Set and review standards for fuel quality, fuel efficiency, and vehicle emissions for new and in-use vehicles.
Promote environment-friendly transport fuels and technologies. Examples include the use of electricity generated by hydropower in transport (e.g., electric vehicles, electric trolley buses, and trams) and blending gasoline and diesel with biofuel that is not cultivated on land used for food production.
Battery-operated vehicles (e.g., two-wheelers, three-wheelers, and four-wheelers) should get priority over fossil fuel-run vehicles for use as private or commercial vehicles by providing incentives. Battery-operated three-wheelers can serve on dedicated routes such as the airport and inner core areas of the city.
9. Strengthening roadside air quality monitoring and assessment
Establish air quality and noise standards for progressive implementation and compliance.
10. Vehicle emission control, standards, and inspection and maintenance
Establish an effective, efficient, and equitable vehicle testing, maintenance, and compliance system, involving the private sector. As part of this, a study should be conducted to assess various viable models for an effective vehicle inspection and maintenance system for Kathmandu.
11. Land use planning Establish institutional mechanisms at local, regional, and national levels to integrate land-use and transport planning processes.
Improve urban planning for the development of new industrial, commercial, and residential zones that avoids unnecessary travel and urban sprawl and encourages densification. Revisit the planned construction of the proposed outer ring road by assessing its potential impact on urban sprawl.
12. Strengthening knowledge base, awareness, and public participation
Enhance awareness and understanding of environmentally sustainable transport by all stakeholders (i.e., government, private sector, civil society, and schools). Mechanisms include outreach activities, promotional campaigns, and school and college curricula. A comprehensive communication and outreach plan would help achieve this.
109
Policy Case Studies
and action plan in Nepal and Kathmandu. Their specific roles are to (i) sensitize and lobby with government agencies to integrate elements of environmentally sustainable transport in their plan and policies, (ii) work with government agencies to generate and share knowledge and skills on environmentally sustainable transport
elements, (iii) work as a watchdog to review government initiatives with an aim to provide constructive suggestions, and (iv) ensure public support and participation for formulation and successful implementation of a strategy through awareness- and capacity-building activities and programs.
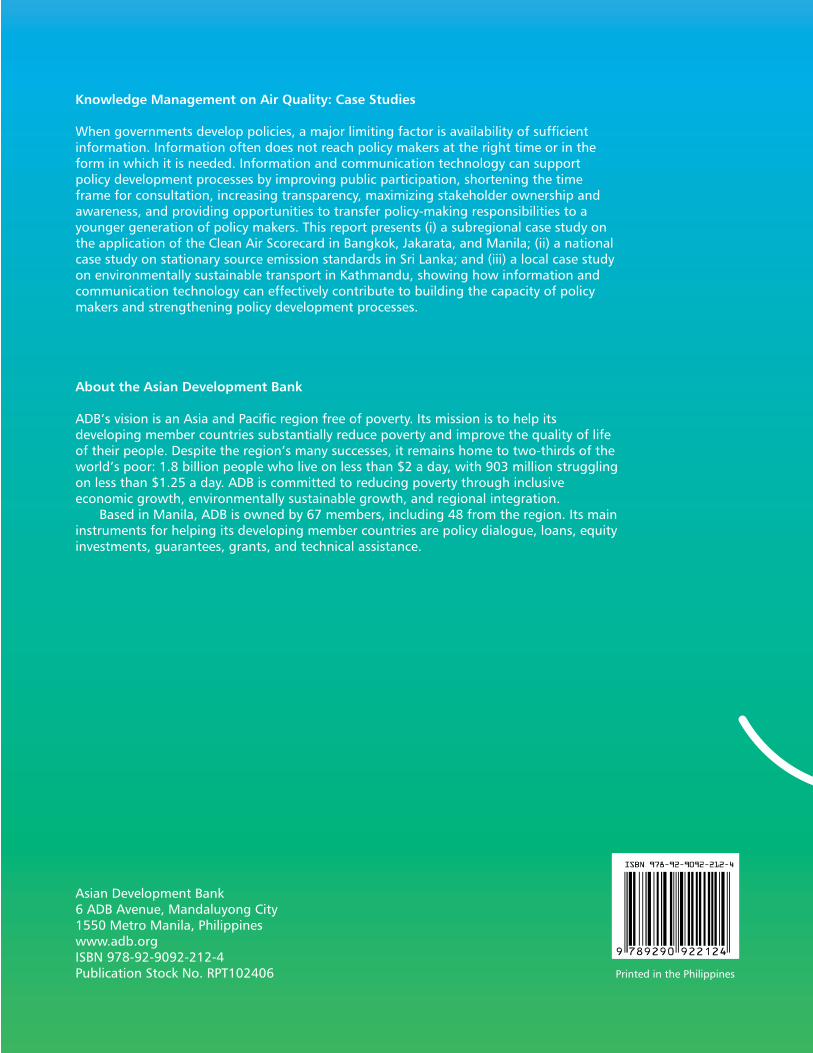
Knowledge Management on Air Quality: Case Studies
When governments develop policies, a major limiting factor is availability of sufficient information. Information often does not reach policy makers at the right time or in the form in which it is needed. Information and communication technology can support policy development processes by improving public participation, shortening the time frame for consultation, increasing transparency, maximizing stakeholder ownership and awareness, and providing opportunities to transfer policy-making responsibilities to a younger generation of policy makers. This report presents (i) a subregional case study on the application of the Clean Air Scorecard in Bangkok, Jakarata, and Manila; (ii) a national case study on stationary source emission standards in Sri Lanka; and (iii) a local case study on environmentally sustainable transport in Kathmandu, showing how information and communication technology can effectively contribute to building the capacity of policy makers and strengthening policy development processes.
About the Asian Development Bank
ADB’s vision is an Asia and Pacific region free of poverty. Its mission is to help its developing member countries substantially reduce poverty and improve the quality of life of their people. Despite the region’s many successes, it remains home to two-thirds of the world’s poor: 1.8 billion people who live on less than $2 a day, with 903 million struggling on less than $1.25 a day. ADB is committed to reducing poverty through inclusive economic growth, environmentally sustainable growth, and regional integration.
Based in Manila, ADB is owned by 67 members, including 48 from the region. Its main instruments for helping its developing member countries are policy dialogue, loans, equity investments, guarantees, grants, and technical assistance.
Asian Development Bank6 ADB Avenue, Mandaluyong City1550 Metro Manila, Philippineswww.adb.orgISBN 978-92-9092-����� Publication Stock No. RPT102406 Printed in the Philippines