korea efma version of paper 1
TRANSCRIPT

The impact of family ownership on firm value and earnings quality: Evidence from Korea
Yo Han An and Tony Naughton
School of Economics, Finance & Marketing, RMIT University, Melbourne, Victoria 3000, AUSTRALIA Tel +61 3 99255858 Fax +61 3 99255986
E-mail: [email protected] [email protected]
Keywords Family Ownership • Agency Problems • Firm Value • Earnings Quality
EFM Classification Numbers 110, 150, 200
2
The impact of family ownership on firm value and earnings quality: Evidence from Korea
Abstract
Korean listed firms exhibit some of the highest levels of family ownership in the world. This paper investigates how family ownership affects earnings quality and firm value of firms listed on the Korean Stock Exchange (KSE) in the post crisis period 2000 to 2005. Existing studies show that family ownership may either reduce or aggravate agency problems, suggesting that family ownership overlaps between Type I and Type II agency problems. These unique characteristics of family ownership may affect firm value and quality of earnings. We classify family ownership into three categories: family ownership, pure family ownership, and ownership-control disparity. We find family ownership and pure family ownership is positively associated with firm value and earnings quality. This result supports that family ownership mitigates agency problems, thereby improving firm value and earnings quality. We find there is a non-linear relation (reverse U-shape) between family ownership and firm value measured by Tobin’s Q. We do not find that high ownership-control disparity reduces firm value and earnings quality, despite consistency with expected sign.
Keywords Family Ownership • Agency Problems • Firm Value • Earnings Quality
EFM Classification Numbers 110, 150, 200

3
1. Introduction.
Schleifer and Vishny (1986) and La Porta, Lopez-de-Silanes, and Shleifer (1999) find that most
public firms have controlling shareholders who are generally families, the founders and their heirs,
and family ownership is common around the world even in the countries with well-developed
separation of ownership-management (e.g. U.S. and U.K). Publicly traded firms in more than half of
East Asian corporations are family controlled (La Porta et al. 1999) and 30% of the S&P 500 in the
U.S. is a family firm (Anderson and Reeb 2003).
The effect of family ownership on firm value and earnings quality is controversial and is explained
using two conflicting agency problems (Ali, Chen, and Radhakrishnan 2007): (1) Type I agency
problem, the classic owner-manager conflict and (2) Type II agency problem, conflicts between
controlling shareholders and non-controlling shareholders.
In the view of Type I agency problems, family owner have a strong monitoring incentive to keep their
wealth as long-term investors. Families can reduce agency problems between managers and owners
by placing one of their members in the position of manager (Anderson, Mansi, and Reeb 2003),
suggesting that families can better oversee managers and control managers’ opportunistic behaviors
than other shareholders. Since families are long-term investors and want to pass the firm on to
descendants, family ownership is stable and more able to maintain efficient investment strategies to
increase firm value (James 1999). Further, Anderson and Reeb (2003) find that family firms have
significantly better firm performance (measured by Tobin’s Q) and lower cost of debt than non-family
firms. It implies that family ownership has strong incentives to closely monitor manager and is likely
to have better information on the firm. Wang (2006) examines the impact of family ownership on
earnings quality. The result shows that family ownership is positively associated with higher earnings
4
quality (proxied by abnormal accruals, earnings response coefficients, and conservatism), suggesting
that family ownership has strong incentive to monitor management as long-term investors Ali et al.
(2007) test the relation between family ownership and earnings quality using the same sample but
different earnings quality measures with Wang’s (2006) study. Consistent with Wang’s (2006) study,
they support that family firms have higher earnings quality and better disclosure quality than non-
family firms. Thus, higher family ownership has incentive to produce higher firm value and earnings
quality.
However, in the view of Type II agency problem, as family shareholdings increase, family managers
become less constrained by disciplinary forces, and more entrenched, and thus higher family
ownership can provide lower firm value and quality of earnings. Mørck, Shleifer, and Vishny (1988)
argue that high level of insider shareholding could induce management entrenchment, thereby causing
a moral hazard and informative asymmetry between the insiders (controlling family) and outside
shareholders. Since founding families have stronger incentives to pass the firm to their heirs, founding
families view their firms as an asset to bequeath to family members or their descendents (Anderson et
al. 2003). Accordingly, in most family firms, family members serve as the firm’s CEO or key member
of management to maintain family control and transmit positions to their descendants so that family
shareholdings protect family managers from external influence. (Schlze, Lubatkin, Dino, and
Buchholtz 2001). In addition, controlling families are generally not willing to lose their control of the
firm (Gomez-Mejia, Nunez-Nickel, and Gutierrez 2001). Specifically, in East Asian emerging-market
countries, a substantial number of firms are owned and managed by controlling families (Claessens,
Djankov, and Lang 2000). Fan and Wong (2002) suggest that controlling family shareholders in East
Asian countries tend to take advantage of flexibility and discretion over accounting choice and auditor
selection to distort the firm’s true earnings performance. Ball, Robin, and Wu (2003) find that
earnings quality of four East Asian countries (Hong Kong, Singapore, Malaysia, and Thailand) is low
despite having common-law accounting regimes (e.g. IFRS and U.S.GAAP). They interpret that
5
controlling family ownership overrides incentives to report higher-quality earnings. Thus, higher
quality of earnings is determined by the incentives of financial statement preparers (controlling family
shareholders or family owner), not by legal/judicial or accounting regimes. As to Korean studies, Joh
(2003) and Baek, Kang, and Park (2004) investigate Korean firms during the Asian financial crisis in
1997/8 and find that firms with concentrated ownership by controlling-family shareholders
(Chaebols) had lower firm value than firms with less concentrated ownership. Accordingly, family
ownership is closely related to the Type II agency problem, thereby decreasing firm value and quality
of earnings.
This study investigates the relation between family ownership and firm value and earnings quality in
the post crisis period 2000 to 2005 using a sample of publicly listed firms on Korean Stock Exchange
(KSE). We propose two research questions: (1) In Korea, does family ownership mitigate or
exacerbate agency problems? and (2) How family ownership affect firm value and earnings quality?
The Korean data provides a unique feature which is suited to the two research questions. Almost
Korean firms have been dominated by controlling shareholders and their families. Although the
classical problem for many emerging countries is that families dominate most aspect of the firm,
Korean firms have a unique problem with these controlling families. Even though controlling families
own small fraction of shares, they control firms through pyramidal equity ownership using affiliated
firms. In 2002, families owned only about 8.62% of shares among the top 10 business groups1, but
they were still able to exercise control using affiliated firms. Prior studies in countries with dispersed
ownership (e.g. U.S. and U.K) test agency problems using managerial ownership. For instance,
Warfield, Wild, and Wild (1995) find that higher managerial ownership is positively associated with
earnings informativeness and negatively linked with discretionary accruals, suggesting that firms with
higher degrees of managerial ownership are expected to provide higher earnings quality. However,
1 Korean Stock Exchange (2003), Ownership by the Chairman of Major Big Groups in Korean
6
managerial ownership in the U.S. and U.K. usually means shares owned by professional management,
not by a family. Therefore, research results on managerial ownership in the countries with well-
developed separation of ownership-management (e.g. U.S. and U.K.) cannot be directly extended to
emerging-market countries where managerial ownership consists of shares owned by families and
their affiliated firms, not by professional management. In Korea, to the extent that managers are one
of families’ members or fully controlled by controlling family shareholders, agency problems between
managers and shareholders would be overlapped with Type I agency problem between owners and
managers and Type II agency problem between controlling shareholders and outside minority
shareholders. Ali et al. (2007) suggest that the extent to which family ownership may affect earnings
quality depends on whether the difference in Type I agency problems overrides the difference in Type
II agency problems or vice versa.
This study contributes to the literature in several ways. First, in terms of family ownership, we
measure family ownership three different ways: family ownership, pure family ownership, and
ownership-control disparity2. Jang, Kim, and Kim (2002) suggest that controlling family ownership
using pyramidal structure is the most common features of Korean firms. Previous Korean studies (Joh
2003; Kim and Yi 2006) show that a higher control-ownership disparity was prevalent in Korea,
thereby exacerbating agency problems and leading to low firm performance and earnings quality.
Thus, it is important to classify family ownership into pure family ownership and ownership-control
disparity because pure family ownership and ownership-control disparity can differently affect firm
value and earnings quality. Second, Bagnoli, Liu, and Watts (2007) suggest that accounting research
focuses on the effect of family ownership on earnings management (Wang 2006), while finance
research focuses on its effect on firm value (Choi, Park, and Yoo 2007). This study comprehensively
tests the effect of family ownership using both accounting (ROA and accruals quality) and finance
(Tobin’s Q).
2 La Porta et al. (2002) define the difference between control rights and cash flow rights

7
2. The Feature of Family Ownership in Korea
Most Korean firms are generally owned, controlled and managed by the family. According to
Claessens et al. (2000) 80.7% of firms in Korea are managed by the controlling family and 42.6% of
firms are controlled by pyramidal ownership structure. Controlling families also use cross-holdings of
affiliated firms to strengthen their control. The controlling shareholder, usually the founder and his/her
family, tends to play a dominant role in the decision-making in Korea (Lim and Kim 2005).
Controlling family shareholders control firms through a chain of ownership relation (pyramidal
ownership). La Porta et al. (1999) define a pyramid as a hierarchical chain by which a family controls
a firm and cross-shareholding as a structure through which a controlled firm owns shares in its
controlling shareholder or in the firms along that chain of control and is more common in countries
with poor investor protection, especially in East Asian countries (La Porta et al. 1999). This
ownership structure in Korea permits controlling families to have dominant power at all levels of
management, and makes it easier to expropriate outside shareholders. The IMF and the World Bank
note that dominant family control using affiliated firms was one of the primary causes of the financial
crisis in 1997, and the biggest obstacle in improving of corporate governance in Korea (Jang et. al
2002).
The business groups (so-called Chaebol)3 of Korea are controlled by families, and controlling
families have dominant management control power over the whole group despite their small fraction
of shareholding as low as 10% (Jung and Kwon 2002). This dominant family control is achieved
through the holdings of the family and affiliated firms. Although the owners of family firms including
chaebol possess ultimate authority in the firm decision-making, they are not burdened with any
responsibility for their management decision making. In addition, the controlling power of family
3 The Korea Fair Trade Commission defines a chaebol as a group of firms of which more than 30% of shares
are owned by the group’s controlling shareholders and its affiliated firms.
8
members with voting rights in excess of their cash flow rights provides controlling shareholders of
affiliated firms with more means and greater opportunities to expropriate firm resources for their
private gains. Thus, they have incentives to expropriate other investors in the firm by investing the
firm’s resources to maximize their welfare and to mange earnings in order to maintain their control
over the firm.
3. Theoretical Framework and Research Question
3.1. Conflicts between owner and manager (Type I Agency Problem)
The classic agency problem describes conflicts between owner and manager (Berle and Means
1932; Jensen and Meckling 1976). Berle and Means (1932) suggest that firm assets may be deployed
to benefit managers rather than shareholders when shareholders are too dispersed. As Jensen and
Meckling (1976) point out, agency costs of equity can arise when the interests of a firm’s managers
are not aligned with those of the firm’s shareholders. Grossman and Hart (1980) claim that
concentrated ownership helps solve the managerial agency problem proposed originally by Jensen and
Meckling (1976), because large blockholders have the power and incentive to discipline management
by holding undiversified and concentrated equity. Family ownership as a large blockholder has greater
incentives to monitor managers, thereby reducing opportunistic behaviors of management. In addition,
families are long-term investors (James 1999) and have better knowledge on their business operations
by serving as the firm’s management (Anderson and Reeb 2003). Therefore, family ownership plays
an important role in corporate governance (Anderson and Reeb 2003). Klein (2002) documents
evidence that strong corporate governance mitigates management’s opportunistic behavior, thereby
decreasing earnings management. Thus, under Type I agency problem, family ownership as a large
blockholder is expected to increase with firm value and earnings quality.
9
3.2. Conflicts of interests between controlling shareholders and outside minority shareholders (Type II Agency Problem)
Excessive concentration of managers or controlling shareholders ownership might result in firm
value reduction due to management entrenchment or increases in expropriation (Morck, Shleifer and
Vishny 1988).4 Shleifer and Vishny (1997) and La Porta et al. (1999) argue that family control is
common in most countries, and the fundamental agency problem is conflict between controlling
shareholders and outside investors since controlling shareholders who gain nearly full control of the
firm, prefer to use assets to generate private benefits of control that are not shared by minority
shareholders. La Porta et al. (1999) suggest that controlling shareholders can expropriate wealth by
seeking personal benefits at the expense of minority shareholders. Bebchuk, Kraakman, and Triantis
(2000) and Claessens, Djankov, Fan, and Lang (2002) argue that concentrated ownership creates the a
new agency problem because the interests of the controlling shareholders and the minority
shareholders are not perfectly aligned. Johnson, Boone, Breach, and Friedman (2000) also suggest
that controlling shareholders can move resources away for their private benefits, such as self-dealing,
and divert resources from one subsidiary in which they own less to firms in which they own more,
resulting in inefficient investment. The existence of controlling shareholders raise problems of
“tunneling”, which occurs when controlling shareholders expropriate the firm’s assets at the expense
of minority shareholders (Johnson, La Porta, Lopez-De-Silanes, and Sheleifer 2000). Due to
information asymmetry, controlling shareholders have incentives to mask firm performance if truthful
reporting increases the likelihood of outsider intervention, which in turn limits their ability to extract
private benefits from control. Thus, controlling family shareholders manage earnings to conceal their
asset diversion activities and are not willing to dilute their control of the firm. Thus, family ownership
as a controlling shareholder may use its controlling position in the firm to extract private benefits at
the expense of minority shareholders under Type II agency problem, suggesting that the proportion of
family ownership is expected to decrease firm value and earnings quality.
4 Morck, Shleifer and Vishny (1988) show that the positive effects of high ownership concentration (aligning
the interests of managers with those of shareholders) initially dominate but the negative effects (management
10
To summarize, family ownership is overlapped with Type I and Type II agency problems. Under Type
I agency problem, family ownership as a large blockholder plays role in monitoring firm’s
management, increasing quality of financial reporting, whereas under Type II agency problem, family
ownership as controlling shareholders controls firm’s management and extract private benefits at the
expense of outside shareholders, decreasing quality of financial reporting. Thus, family ownership
may affect firm value and earnings quality depends on whether Type I agency problem will override
Type II agency problem or vice versa. Overall, we propose two research questions: (1) In Korea, does
family ownership mitigate or exacerbate agency problems? and (2) How family ownership affect firm
value and earnings quality?
4. Methodology
4.1. Sample Selection and Data Collection
This study uses Korean firms listed on the Korean Stock Exchange (KSE) for 6 years (2000-
2005). However, Korean firms’ data are for the fiscal years 1999 to 2006 because the measurement of
accruals quality using Dechow and Dichev’s (2002) model requires previous and future cash flows
from operation (CFO) data. All financial institutions with two-digit Standard Industry Classification
(SIC) Code5 of 65, 66, and 67 (e.g., commercial banks, insurance firms, security brokerage firms) are
excluded because accounting methods and the format of financial statements differ to other industries
and are subject to different regulatory requirements.
Data in this study are obtained from three sources: The Korean Stock Exchange (KSE), firm’s
business report (equivalent to the US 10-K) and audit report, which are available for Data Analysis,
entrenchment) become more serious as the manager ownership increases to a high level.
5 SIC is a two -digit code classifying all industries into 20 major industry groups administered by the Korean National Statistical Office. The two-digit code designates each major industry group. This description is available on web source: http://www.nso.go.kr/eng2006/e06___0000/e06a__0000/e06a__0000.html.
11
Retrieval and Transfer System6 (DART; http://dart.fss.or.kr), developed by the Korean Financial
Supervisory Commission, OSIRIS7: Publicly listed companies worldwide provided by the Bureau van
Dijk Electronic Publishing (BvDEP), and the Korean Information Service (KIS) database8.
The sample firms in this study are consecutively listed on Korean Stock Exchange (KSE) from 1999
to 2006. At the first data collection stage, consecutive list status of sample firms is confirmed from
KSE web (http://kind.krx.co.kr) using KSE stock index code. At the second stage, ownership data are
all manually collected from business reports of each firm on DART system (http://dart.fss.or.kr)
provided by Korean Financial Supervisory Commission. Financial statements data and stock data are
obtained from OSIRIS and KIS database respectively. Finally, firm’s name on KSE is used to match
information among DART filings, OSIRIS, and KIS. Then, all extracted data were classified into SIC
code. The final sample consists of a total of 3054 firm-year observations over the six year period. The
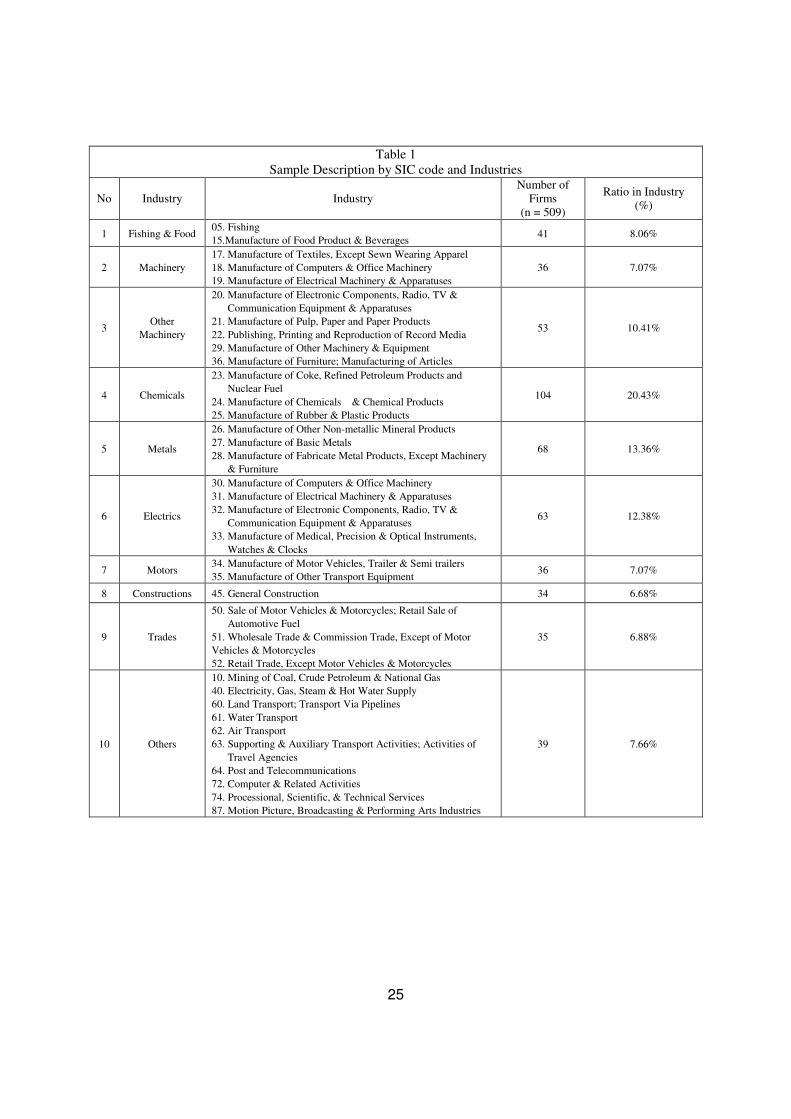
sample firms belong to 10 industry groups based on the Korean Standard Industry Classification (SIC).
[Insert Table 1]
4.2. Model Specification
We test the impact of family ownership on firm value and earnings quality using three different
types of family ownership variables: (1) family ownership (FAMILY), (2) pure family ownership
(PUREFAM), and (3) ownership-control disparity (WEDGE).
6 As a public database, Data Analysis, Retrieval and Transfer System (DART) is an electronic disclosure system
that mandatorily enforces firms to submit Business Reports (equivalent to the US 10-K) to Korean Financial Supervisory Commission (KFSC) within 90 days from the fiscal year-end, where it becomes publicly available to investors and other users online.
7 The financial statements information of Korean firms on OSIRIS is provided by the Korean Information Service (KIS).
8 KIS is a credit rating agency in Korea and provides corporate financial and ownership information on publicly traded firms as well as privately held firms. KIS also receives financial and ownership information of Korean firms from the Korea Financial Supervisory Board and checks the integrity of the data. It provides the most
12
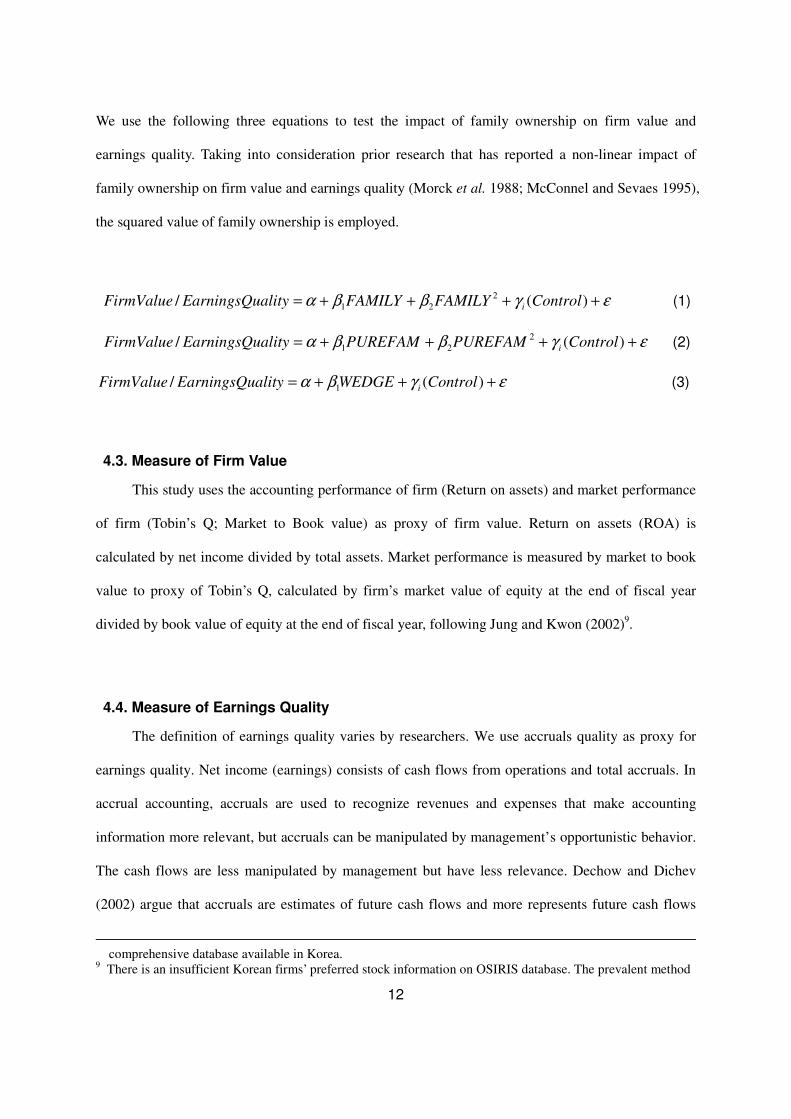
We use the following three equations to test the impact of family ownership on firm value and
earnings quality. Taking into consideration prior research that has reported a non-linear impact of
family ownership on firm value and earnings quality (Morck et al. 1988; McConnel and Sevaes 1995),
the squared value of family ownership is employed.
εγββα ++++= )(/ 2
21 ControlFAMILYFAMILYalityEarningsQuFirmValue i (1)
εγββα ++++= )(/ 2
21 ControlPUREFAMPUREFAMalityEarningsQuFirmValue i (2)
εγβα +++= )(/ 1 ControlWEDGEalityEarningsQuFirmValue i (3)
4.3. Measure of Firm Value
This study uses the accounting performance of firm (Return on assets) and market performance
of firm (Tobin’s Q; Market to Book value) as proxy of firm value. Return on assets (ROA) is
calculated by net income divided by total assets. Market performance is measured by market to book
value to proxy of Tobin’s Q, calculated by firm’s market value of equity at the end of fiscal year
divided by book value of equity at the end of fiscal year, following Jung and Kwon (2002)9.
4.4. Measure of Earnings Quality
The definition of earnings quality varies by researchers. We use accruals quality as proxy for
earnings quality. Net income (earnings) consists of cash flows from operations and total accruals. In
accrual accounting, accruals are used to recognize revenues and expenses that make accounting
information more relevant, but accruals can be manipulated by management’s opportunistic behavior.
The cash flows are less manipulated by management but have less relevance. Dechow and Dichev
(2002) argue that accruals are estimates of future cash flows and more represents future cash flows
comprehensive database available in Korea.
9 There is an insufficient Korean firms’ preferred stock information on OSIRIS database. The prevalent method
13
when accruals contain lower estimate error. Namely, accruals are recognized as a high quality when
accruals quickly convert into future cash flow.
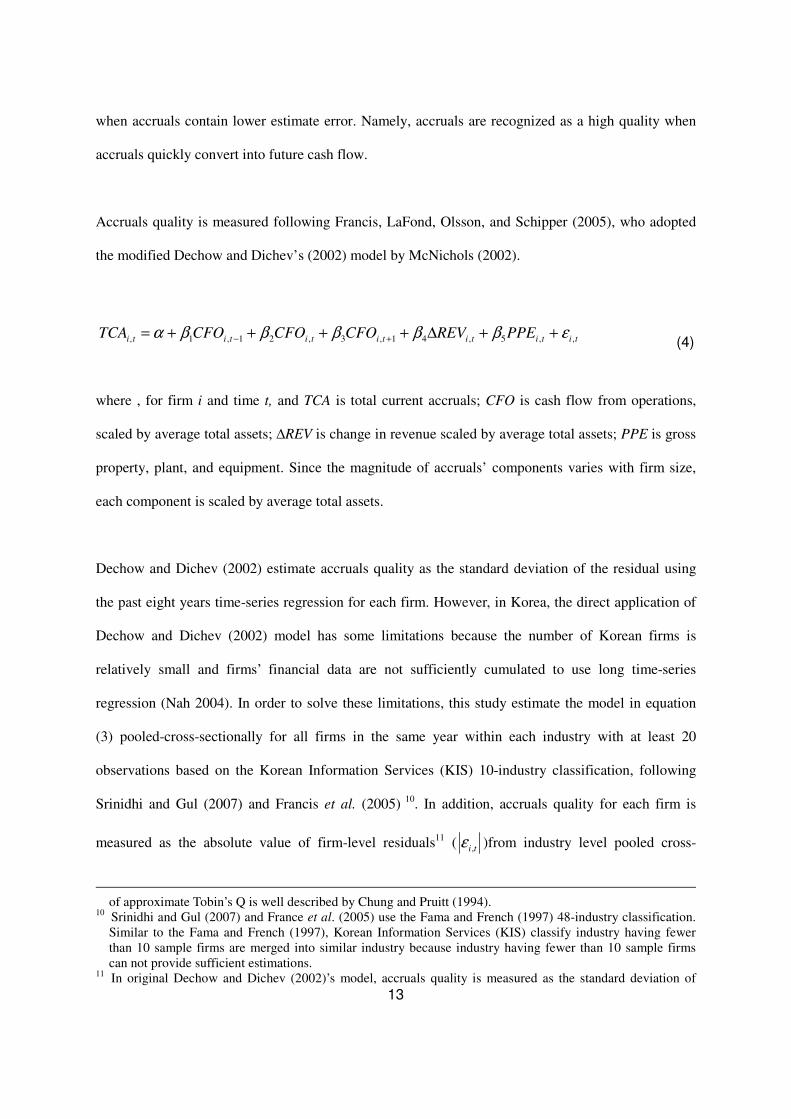
Accruals quality is measured following Francis, LaFond, Olsson, and Schipper (2005), who adopted
the modified Dechow and Dichev’s (2002) model by McNichols (2002).
tititititititi PPEREVCFOCFOCFOTCA ,,5,41,3,21,1, εβββββα ++∆++++= +− (4)
where , for firm i and time t, and TCA is total current accruals; CFO is cash flow from operations,
scaled by average total assets; ∆REV is change in revenue scaled by average total assets; PPE is gross
property, plant, and equipment. Since the magnitude of accruals’ components varies with firm size,
each component is scaled by average total assets.
Dechow and Dichev (2002) estimate accruals quality as the standard deviation of the residual using
the past eight years time-series regression for each firm. However, in Korea, the direct application of
Dechow and Dichev (2002) model has some limitations because the number of Korean firms is
relatively small and firms’ financial data are not sufficiently cumulated to use long time-series
regression (Nah 2004). In order to solve these limitations, this study estimate the model in equation
(3) pooled-cross-sectionally for all firms in the same year within each industry with at least 20
observations based on the Korean Information Services (KIS) 10-industry classification, following
Srinidhi and Gul (2007) and Francis et al. (2005) 10. In addition, accruals quality for each firm is
measured as the absolute value of firm-level residuals11 (ti,ε )from industry level pooled cross-
of approximate Tobin’s Q is well described by Chung and Pruitt (1994).
10 Srinidhi and Gul (2007) and France et al. (2005) use the Fama and French (1997) 48-industry classification. Similar to the Fama and French (1997), Korean Information Services (KIS) classify industry having fewer than 10 sample firms are merged into similar industry because industry having fewer than 10 sample firms can not provide sufficient estimations.
11 In original Dechow and Dichev (2002)’s model, accruals quality is measured as the standard deviation of
14
sectional regression of total current accruals on lagged current, and future cash flows plus the change
in REV and PPE.
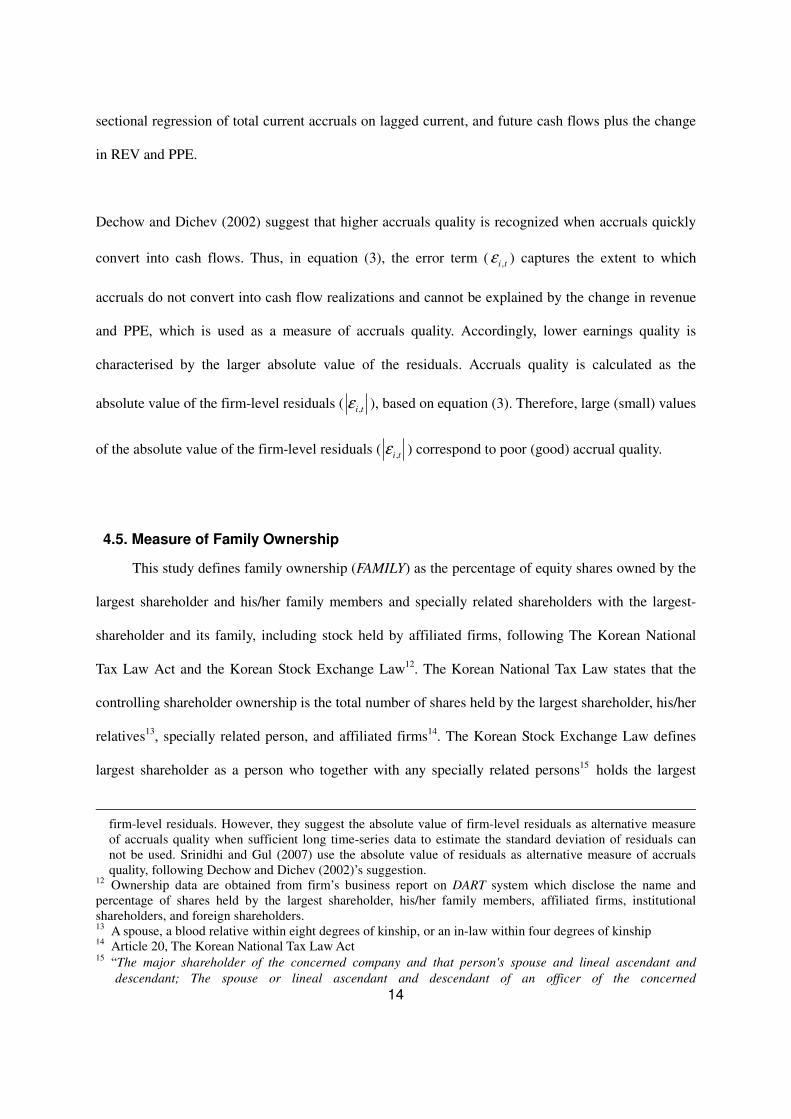
Dechow and Dichev (2002) suggest that higher accruals quality is recognized when accruals quickly
convert into cash flows. Thus, in equation (3), the error term ( ti ,ε ) captures the extent to which
accruals do not convert into cash flow realizations and cannot be explained by the change in revenue
and PPE, which is used as a measure of accruals quality. Accordingly, lower earnings quality is
characterised by the larger absolute value of the residuals. Accruals quality is calculated as the
absolute value of the firm-level residuals (ti,ε ), based on equation (3). Therefore, large (small) values
of the absolute value of the firm-level residuals (ti,ε ) correspond to poor (good) accrual quality.
4.5. Measure of Family Ownership
This study defines family ownership (FAMILY) as the percentage of equity shares owned by the
largest shareholder and his/her family members and specially related shareholders with the largest-
shareholder and its family, including stock held by affiliated firms, following The Korean National
Tax Law Act and the Korean Stock Exchange Law12. The Korean National Tax Law states that the
controlling shareholder ownership is the total number of shares held by the largest shareholder, his/her
relatives13, specially related person, and affiliated firms14. The Korean Stock Exchange Law defines
largest shareholder as a person who together with any specially related persons15 holds the largest
firm-level residuals. However, they suggest the absolute value of firm-level residuals as alternative measure of accruals quality when sufficient long time-series data to estimate the standard deviation of residuals can not be used. Srinidhi and Gul (2007) use the absolute value of residuals as alternative measure of accruals quality, following Dechow and Dichev (2002)’s suggestion.
12 Ownership data are obtained from firm’s business report on DART system which disclose the name and percentage of shares held by the largest shareholder, his/her family members, affiliated firms, institutional shareholders, and foreign shareholders. 13 A spouse, a blood relative within eight degrees of kinship, or an in-law within four degrees of kinship 14 Article 20, The Korean National Tax Law Act 15 “The major shareholder of the concerned company and that person's spouse and lineal ascendant and
descendant; The spouse or lineal ascendant and descendant of an officer of the concerned

15
number of stocks on the basis of the total number of stocks with voting rights of a firm16.
As a definition of family ownership, family ownership can be decomposed into pure family ownership
and affiliated firm’s ownership. Pure family ownership (PUREFAM) is defined as the percentage of
equity shares owned by the largest personal shareholder and his/her families, subtracting affiliated
firm’s ownership from family ownership. Following La Porta et al. (2002) and Fan and Wong (2002),
ownership-control disparity (WEDGE) is measured as the ratio between cash flow rights and voting
rights of the largest shareholder and his/her family [1- (cash flow rights/voting rights)]. The closer the
ratio is to one, the larger the disparity. Namely, if there is no affiliated ownership in firm, WEDGE is
set to zero. As continuous variables, the ratio ranges between zero and one.
4.6. Control Variables
Seven control variables that may affect firm value and earnings quality are foreign ownership,
business group dummy, size, leverage, sales growth ratio, capital asset investment ratio, and liquidity
ratio. Foreign ownership (FOREIGN) is percentage of equity shares held by all foreign shareholders
as of the end of the year, and calculated as the total number of shares held by foreign shareholders
divided by the total number of shares outstanding. Shleifer and Vishny (1986) argue that large outside
blockholders can effectively monitor management using enough voting control, thereby reducing
agency problems. In Korea, the potentially positive impact of foreign ownership as large outside
blockholders can mitigate family managerial opportunism. Thus, higher proportions of foreign
ownership induce firms to improve firm value and to decrease opportunistic managerial accounting
choices and decisions. To control for size effects, the natural logarithm of the book value of total
assets (SIZE) is included as a proxy for firm size. Firms with high leverage or negative net income
may have incentives to manage reported earnings due to their concerns over debt covenants or private
lending agreement violations (Dhaliwal, Lee and Farger 1991; DeFond and Jiambalvo 1994).
company.”(Article 54-5-(4), Korean Stock Exchange Law)
16 Article 54-5, Korean Stock Exchange Law
16
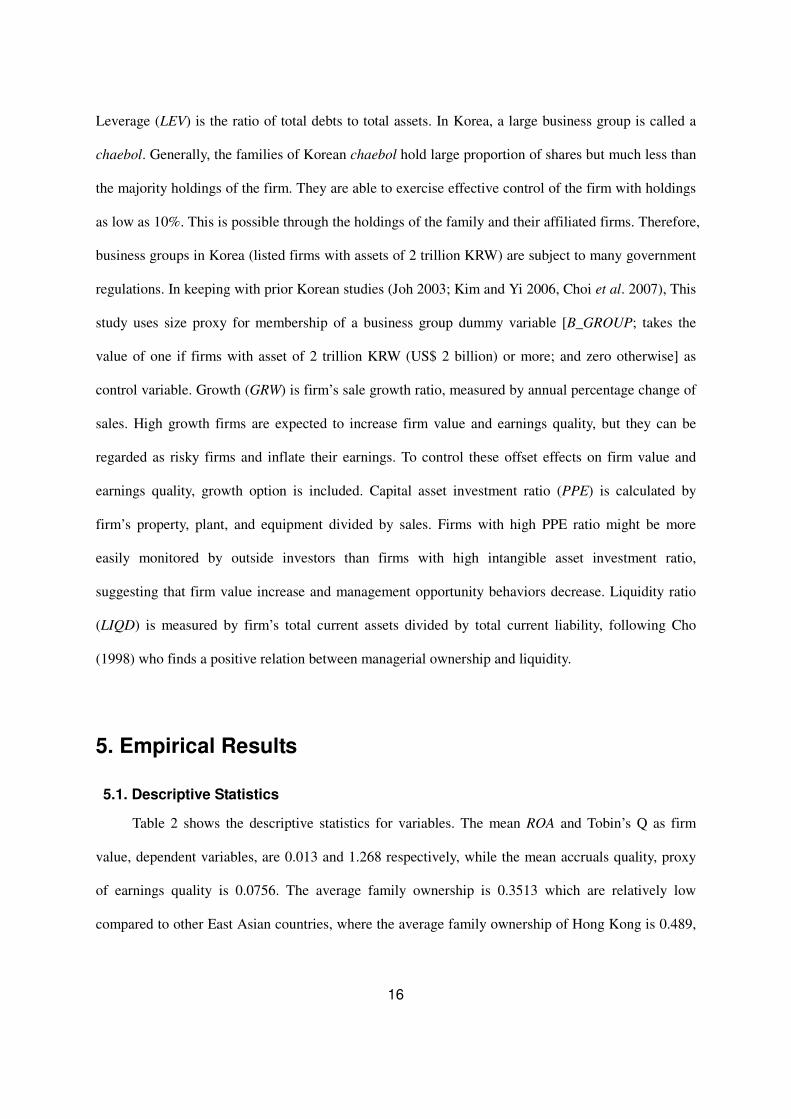
Leverage (LEV) is the ratio of total debts to total assets. In Korea, a large business group is called a
chaebol. Generally, the families of Korean chaebol hold large proportion of shares but much less than
the majority holdings of the firm. They are able to exercise effective control of the firm with holdings
as low as 10%. This is possible through the holdings of the family and their affiliated firms. Therefore,
business groups in Korea (listed firms with assets of 2 trillion KRW) are subject to many government
regulations. In keeping with prior Korean studies (Joh 2003; Kim and Yi 2006, Choi et al. 2007), This
study uses size proxy for membership of a business group dummy variable [B_GROUP; takes the
value of one if firms with asset of 2 trillion KRW (US$ 2 billion) or more; and zero otherwise] as
control variable. Growth (GRW) is firm’s sale growth ratio, measured by annual percentage change of
sales. High growth firms are expected to increase firm value and earnings quality, but they can be
regarded as risky firms and inflate their earnings. To control these offset effects on firm value and
earnings quality, growth option is included. Capital asset investment ratio (PPE) is calculated by
firm’s property, plant, and equipment divided by sales. Firms with high PPE ratio might be more
easily monitored by outside investors than firms with high intangible asset investment ratio,
suggesting that firm value increase and management opportunity behaviors decrease. Liquidity ratio
(LIQD) is measured by firm’s total current assets divided by total current liability, following Cho
(1998) who finds a positive relation between managerial ownership and liquidity.
5. Empirical Results
5.1. Descriptive Statistics
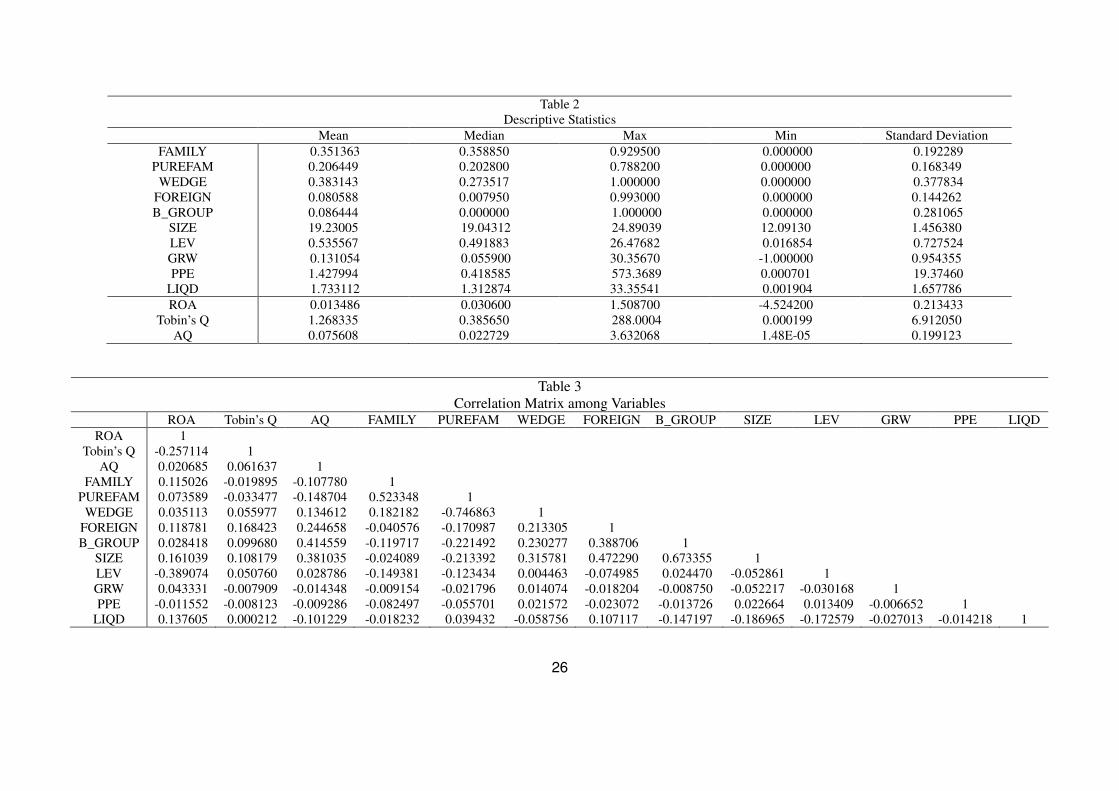
Table 2 shows the descriptive statistics for variables. The mean ROA and Tobin’s Q as firm
value, dependent variables, are 0.013 and 1.268 respectively, while the mean accruals quality, proxy
of earnings quality is 0.0756. The average family ownership is 0.3513 which are relatively low
compared to other East Asian countries, where the average family ownership of Hong Kong is 0.489,
17
(Ng 200517) Singapore is 0.571 (Chau and Gray 2002), and Malaysia is 0.43 (Tam and Tan 2007)
respectively. The mean pure family ownership excluding affiliated firm shareholding is 0.206 and
ownership-control disparity called ‘wedge’ is 0.793. Foreign ownership has the mean value of 0.08
and the median value is 0.0079. The severe difference between mean and median of foreign
ownership implies that foreign ownership is concentrated in specific firms. This feature of foreign
ownership supports that foreign shareholders prefer large manufacturing firms with good accounting
performance, lower unsystematic risk, and lower leverage but underweight smaller and highly
leveraged firms (Kang and Stulz 1997).
[Insert Table 2]
5.2. Correlations
Table 3 reports Pairwise correlation among variables. Family ownership (FAMILY) and pure
family ownership (PUREFAM) are positively related to ROA but negatively related to accruals quality
(AQ), whereas ownership-control disparity (WEDGE) is positively linked with all three dependent
variables (ROA, Tobin’s Q, and AQ. These correlations suggest that as family ownership including
pure family ownership increase, ROA and AQ increase, but the higher ownership-control disparity is,
the accruals quality are. In contrast to ROA, market firm value (Tobin’s Q) is negatively related to
both FAMILY and PUREFAM, but positively related to WEDGE. This suggest that stock prices, as a
measure of firm value, are less likely to reflect all available information in inefficient stock market
such as Korea (Joh 2003). Foreign ownership (FOREIGN) has positive relation with both firm value
(ROA and Tobin’s Q) and AQ, suggesting that foreign shareholders improve firm value but do not
decrease managerial opportunistic behavior. The highly negative correlation between WEDGE and
PUREFAM (-0.75) supports that pure family ownership and ownership-control disparity would
differently impacts firm value and earnings quality.
[Insert Table 3]
17 Ng (2005) use managerial ownership as proxy of family ownership in Hong Kong because the correlation between managerial ownership and family ownership is almost one (0.978)
18
5.3. The Impact of Family Ownership on Firm Value and Earnings Quality.
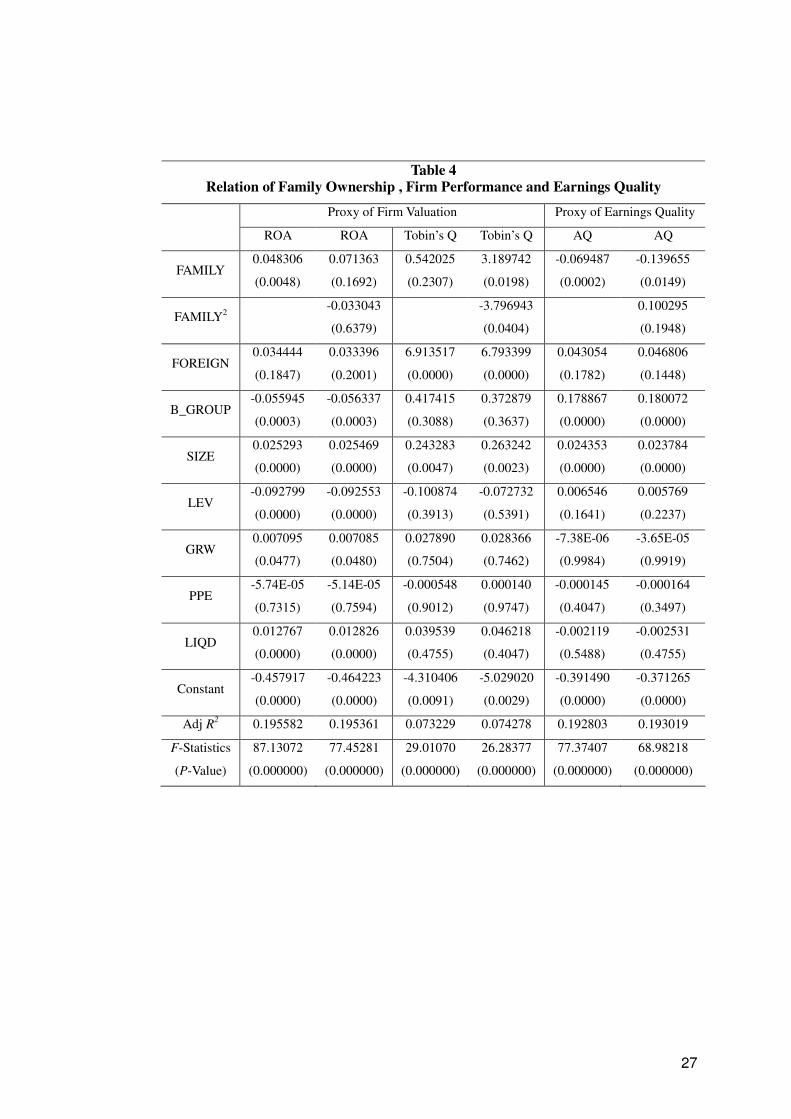
Table 4 reports the results of the regression for family ownership and firm value and accruals
quality using the pooled sample of 3054 firm-year observation over the 2000 to 2005 period. We
estimate linear and nonlinear regression model respectively.
From the perspective of family ownership measured as the largest shareholders and their
families and affiliated firms, the coefficient FAMILY is significant at 1% level and positive for ROA,
while the coefficient on the variable FAMILY2 is negative but insignificant. This suggests that
accounting firm value (ROA) increases with an increase in family ownership. In contrast to prior
research (e.g. Demsetz 1983), a nonlinear relation between family ownership and accounting firm
value (ROA) does not exist in Korea. The positive impacts of family shareholding on firm value
support the alignment effect of family ownership (Anders and Reeb 2003). When we use Tobin’s Q as
a measure of market firm value, we find a significant relation between FAMILY and FAMILY2 and
Tobin’s Q. The significant coefficients for FAMILY (positive) and FAMILY2 (negative) suggest a
nonlinear relation (reverse U-shape) between family ownership and market firm value (Tobin’s Q).
This result is consistent with prior research (e.g. Demsetz 1983; Mock et al. 1988) suggesting that an
increase in insider shareholding (family shareholding) could increase management entrenchment. The
coefficient of foreign ownership (FOREIGN) is positive for both ROA and Tobin’s Q but only
significant for Tobin’s Q. This result indicates that foreign shareholders play a role in monitoring
management as outside blockholders (Sach and Warner 1995), thereby increasing firm value. The P-
value of coefficient on business group dummy (B_GROUP) is negative and significant with ROA at
1% level (0.0003). This result is consistent with prior Korean studies (Joh 2003; Baek et al. 2004).
The relation between family ownership and accruals quality (AQ) support the alignment effect of
family ownership. In Table 4, FAMILY is negatively significant with AQ at the 1% level. In the
quadratic model, FAMILY is still negatively significant with AQ (0.014) and FAMILY2 is positive but
insignificant (0.195). Namely, family ownership increases accruals quality, supporting that family
19
owners have strong incentive to monitor management, consistent with Wang (2006) and Ali et al.
(2007). Contrast to the results on Tobin’s Q, FOREIGN is positive but insignificant with AQ. Foreign
ownership is weak with accounting measures (ROA and AQ) but strong with finance measure (Tobin’s
Q). Joh (2003) argues that accounting measure is better than finance measure since accounting
measure is more directly related to firm’s profitability. Accordingly, weak relation between foreign
ownership and accounting measures (ROA and AQ) implies that foreign shareholders do not
efficiently monitor firm’s management due to lacks of substantial knowledge for firm. Consistent with
the result of ROA, AQ is positively related to B_GROUP. Accordingly, Korean business groups
(Chaebols) have low accruals quality, implying that Chaebols tend to hide true firm performance by
managing earnings.
[Insert Table 4]
5.4. The Impact of Pure Family Ownership on Firm Value and Earnings Quality.
Table 5 presents the relation between pure family ownership and firm value and earnings quality.
As illustrated by results in Table 5, the impact of pure family ownership (PUREFAM) on firm value
and accruals quality is quite similar to that of family ownership (FAMILY). The coefficients of
PUREFAM on both ROA (0.0028) and Tobin’s Q (0.0595) are significantly positive. Consistent with
family ownership, firm value increases with pure family ownership. In the quadratic model, however,
both PUREFAM and PUREFAM2 are insignificant with two firm value proxies, ROA and Tobin’s Q.
Accordingly, there is no curvilinear relation between pure family ownership and firm value,
suggesting that entrenchment effect does not exist despite increasing pure family ownership. Foreign
ownership (FOREIGN) is significantly positive with Tobin’s Q suggesting that foreign shareholders
improve firm value. Similar to the result of Table 4, B_GROUP is significantly negative with ROA at
1% level. There is a negative relation between PUREFAM and accruals quality (AQ). The P-value of
PUREFAM (0.0028) on AQ supports the alignment effects of family ownership (Wang 2006; Ali et al.
2007). Namely, pure family ownership increases firm’s accruals quality, thereby reducing
20
management opportunistic behavior. This result supports that family ownership has a strong
monitoring incentive and reduces the agency problem between managers and owners. In the
curvilinear test, PUREFAM is significantly negative (0.05) while PUREFAM2 is positive but
insignificant. This is consistent with the results of firm value, supporting that the entrenchment effect
of family ownership is evident. The impact of FOREIGN on AQ is similar to the result of Table 4.
Accordingly, foreign shareholders improve firm value, but do not efficiently monitor firm’s
management because the relation between FOREIGN and accounting measures (ROA and AQ) is not
significant. The P-value of coefficient on B_GROUP is significantly positive (0.0000) with AQ,
consistent to the result of Table 4.
[Insert Table 5]
5.5. The Impact of Ownership-Control Disparity on Firm Value and Earnings Quality.
Table 6 indicates the results of ownership-control disparity (WEDGE) on firm value and accruals
quality. Consistent with prior Korean studies (Joh 2003; Kim and Yi 2006), the coefficient of WEDGE
is negative with both ROA and Tobin’s Q respectively and positive with AQ, but statistically
insignificant. Thus, the higher ownership-control disparity might decrease firm value and accruals
quality, but the impact is weak and insignificant. The coefficient of FOREIGN is significant and
positive with ROA and Tobin’s Q at 10% and 1% level respectively, suggesting that foreign
shareholders increase firm value, and greater impact on firm’s stock price than firm’s earnings.
However, the relation between FOREIGN and AQ is significantly positive at 5% level, supporting that
foreign shareholders do not efficiently monitor firm’s management. As expected, the coefficient of
B_GROUP is negatively significant with ROA and positively significant with AQ at both 1% level.
Thus, Korean chaebols negatively impact firm value and earnings quality even after the Asian
financial crisis, supporting Kim and Yi (2006).
[Insert Table 6]
21
6. Conclusion
This study examines the impact of family ownership on firm value and earnings quality using
3054 firm-year observations of Korean data over the 2000 to 2005 period. Specifically, we use three
different measures of family ownership: family ownership, pure family ownership, and ownership-
control disparity.
We find that family ownership increases firm value and accruals quality as well as pure family
ownership, whereas the effects of ownership-control disparity (Wedge) on firm value and accruals
quality is insignificant statistically despite consistency with expected sigh. Our finding supports that
family ownership in Korea exhibit mitigates agency problems. Overall, family ownership reduces
severe agency problems, thereby leading less opportunistic management behaviors. Consistent to prior
Korean studies (Joh 2003; Bae et al. 2002), Korean business groups (Chaebols) show low firm value
and accruals quality. We find that foreign ownership is only significant with market firm value
(Tobin’s Q), suggesting that foreign shareholders play a restrictive role in monitoring firms. It might
support that foreign shareholders, as large outside blockholders, are transient investors without
significant incentives to monitor firm management.
This study provides new evidence on the impact of family ownership on firm value and earnings
quality. Many East-Asian studies (Fan and Wong 2002; Claessen et al. 2002; Ball et al. 2000 and
2003) suggest that family ownership decreases firms value and earnings quality because controlling
families dominate firms at all levels of firm’s decision-making processes and overrides incentives to
report higher-quality earnings, thereby expropriating outside shareholders’ wealth. However, this
study finds that family ownership is better aligned with the firm, and thus higher family ownership
increases firm value and earnings quality.

22
References
Ali, A., Chen, T-Y., Radhakrishnan, S.: Corporate disclosures by family firms, Journal of Accounting and Economics 44, 238-286 (2007) Anderson, R.C., Reeb, D.M.: Founding family ownership and firm performance: evidence from the S&P 500, The Journal of Finance 58, 1301-1328 (2003) Anderson, R.C., Mansi S.A., Reeb, D.M.: Founding family ownership and agency cost of debt, Journal of Financial Economics 68, 263-285 (2003) Bae, K.H., Kang, J.K., Kim, J.M.: Tunneling or value added? Evidence from mergers by Korean business groups, The Journal of Finance 57, 2695-2740 (2002) Baek, J., Kang, J.K., Park, K.S.: Corporate governance and firm value: evidence from the Korean
financial crisis, Journal of Financial Economics 71, 265-313 (2004) Bagnoli, M., Liu, H-T., Watts, S.G.: Family firms, debtholder-shareholder agency costs and the use of covenants in private debt, working paper. Purdue University (2007) Ball, R., Robin, A., and Wu, J.S.: Incentives versus standards: properties of accounting income in four East Asian countries, Journal of Accounting and Economics 36, 235-270 (2003) Bebchunk, L., Kraakman, R., Triantis,G.: Stock pyramids, cross-ownership, and dual class equity: The creation and agency costs of separating control from cash flow rights. In: R. K. Morck, ed., Concentrated corporate ownership, Chicago, IL , University of Chicago Press (2000) Berle, A.A., Means, G.C.: The modern corporation and private property. New York: Harcourt, Brace & World (1932) Black, B.S., Jang, H., Kim, W.: Does corporate governance predict firm’s market values? Evidence from Korea, Journal of Law, Economics, and Organization 22, 366-413 (2006) Chau, G.K., Gray, S.J.: Ownership structure and corporate voluntary disclosure in Hong Kong and Singapore, The International Journal of Accounting 37, 247-265 (2002). Cho, M.H., Ownership structure, investment, and the corporate value: An empirical analysis, Journal of Financial Economics 47, 103-121 (1998) Choi, J.J., Park, S.W., Yoo, S.: The value of outside directors: evidence from corporate governance reform in Korea, Journal of Financial and Quantitative Analysis 42, 941-962 (2007) Chung, K.H., Pruitt, S.W.: A simple approximation of Tobin’s q, Financial Management 23, 70-74 (2004) Claessens, S., Djankov, S., Lang, L.: The separation of ownership and control in East Asian Corporations, Journal of Financial Economics 58, 81-112 (2000) Claessens, Djankov, S., Fan, J.P.H., Lang, H.P.: Disentangling the incentive and entrenchment effects of large shareholdings, The Journal of Finance 57, 2741-2771 (2002)
23
Dhaliwal, D., Lee, K., Fargher, N.: The Association Between Unexpected Earnings and Abnormal Security Returns in the Presence of Financial Leverage, Contemporary Accounting Research 8, 20-41 (1991) Dechow, P., Dichev, D.: The quality of accruals and earnings: the role of accrual estimation errors, The Accounting Review 77, 35-59 (2002) DeFond, M., Jiambalvo, J.: Debt covenant violation and manipulation of accruals, Journal of Accounting and Economics 17, 145-176 (1994) Demsetz, H.: The structure of ownership and the theory of the firm, Journal of Law and Economics 26, 301-325 (1983) Fan, J., Wong, T.J.: Corporate ownership structure and the informativeness of accounting earnings in East Asia, Journal of Accounting and Economics 33, 401-425 (2002) Fransis, J., LaFond, R., Olsson, P.M., Schipper, K.: The market pricing of accruals quality, Journal of Accounting and Economics 39, 259-327 (2005) Gomez-Mejia, L.R., Nunez-Nickel, M., Gutierrez, I.: The role of family ties in agency contracts, Academy of Management Journal 44, 81-96 (2001) Grossman, S., Hart, O.: Takeover bids, the free-rider problem, and the theory of the corporation, Bell Journal of Economics 11, 42-64 (1980) James, H.: Owner as manager, extended horizons and the family firm, International Journal of the Economics of Business 6, 41-56 (1999) Jang, J., Kim, W., Kim, K.: Valuation effect of accounting opacity of Korean companies. Korea Economic Research Institute: Seminar of Accounting Opacity and Firm Value 2002 [Printed in Korean] Jensen, M., Meckling, W.: The theory of the firm: Managerial behavior, agency costs and ownership structure, Journal of Financial Economics 3, 305-360 (1976) Joh, S.W.: Corporate governance and firm profitability: evidence from Korea before the economic crisis. Journal of Financial Economics 68, 287-322 (2003) Johnson, S., Boone, P., Breach, A., Friedman, E.: Corporate governance in the Asian financial crisis. Journal of Financial Economics 58, 141-186 (2000) Johnson, S., La Porta, R., Lopez-De-Silanes, F., Sheleifer, A.: Tunneling. American Economics Review 90, 22-27 (2000) Jung, K., Kwon, S.Y.: Ownership structure and earnings informativeness evidence from Korea, The international Journal of Accounting 37, 301-325 (2002). Kang, J.K., Stulz, R.M.: Why is there a home bias? An analysis of foreign portfolio equity ownership in Japan, Journal of Financial Economics 46, 3-28 (1997)
24
Kim, J-B., Yi, C.H.: Ownership Structure, Business Group Affiliation, Listing Status, and Earnings Management: Evidence from Korea. Contemporary Accounting Research 23, 427-464 (2006) Klein, A.: Audit committee, board of director characteristics, and earnings management, Journal of Accounting and Economics 33, 375-400 (2002) La Porta, R., Lopez-de-Salinas, F., Shleifer, A.: Corporate ownership around the world, Journal of Finance 54, 471-517 (1999) La Porta, R., Lopez-de-Salinas, F., Shleifer, A., Vishny, R.: Investor protection and corporate valuation, The Journal of Finance 57, 1147-1170 (2002). Lim, U., Kim, C.S.; Determinants of ownership structure: an empirical study of the Korean conglomerates, Pacific-Basin Finance Journal 13, 1-28 (2005) McNichols, M.: Discussion of the quality of accruals and earnings: the role of accrual estimation errors, The Accounting Review 77, 61-69 (2002) Morck, R., Shleifer, A., Vishny, R.W.: Management ownership and market valuation: An empirical analysis, Journal of Financial Economics 20, 293-315 (1988) Nah, C.: Informativeness of discretionary accruals depending on accruals quality and auditor types. Korean Accounting Review 29, 117-142 (2004) [Printed in Korean] Ng, C.: An empirical study on the relationship between ownership and performance in a family-based corporate environment, Journal of Accounting, Auditing and Finance 20, 121-146 (2005). Schulze, W.S., Lubatkin, M.H., Dino, R.N., Buchholtz, A.K.: Agency relationships in family firms: Theory and evidence, Organization Science 12, 99-116 (2001) Shleifer, A., Vishny, R.W.: Block shareholders and corporate control, Journal of Political Economy 95, 461-488 (1986) Shleifer, A., Vishny, R.W.: A survey of corporate governance. The Journal of Finance 52, 737-783 (1997) Srinidhi, B. N., and F. Gul.: The differential effects of auditors’ nonaudit and audit fees on accrual quality, Contemporary Accounting Research 24, 595-629 (2007) Tam, O.K., Tan, M.G-S.: Ownership, governance, and firm performance in Malaysia, Corporate Governance 15, 208-222 (2007). Wang, D.: Founding family ownership and earnings quality, Journal of Accounting Research 44, 619-656 (2006) Warfield, T.D., Wild, J.J, Wild, K.L.: Managerial ownership, accounting choices, and informativeness of earnings, Journal of Accounting and Economics 20, 61-91 (1995)
25
Table 1 Sample Description by SIC code and Industries
No Industry Industry Number of
Firms (n = 509)
Ratio in Industry (%)
1 Fishing & Food 05. Fishing
15.Manufacture of Food Product & Beverages 41 8.06%
2 Machinery
17. Manufacture of Textiles, Except Sewn Wearing Apparel
18. Manufacture of Computers & Office Machinery
19. Manufacture of Electrical Machinery & Apparatuses
36 7.07%
3 Other
Machinery
20. Manufacture of Electronic Components, Radio, TV &
Communication Equipment & Apparatuses
21. Manufacture of Pulp, Paper and Paper Products
22. Publishing, Printing and Reproduction of Record Media
29. Manufacture of Other Machinery & Equipment
36. Manufacture of Furniture; Manufacturing of Articles
53 10.41%
4 Chemicals
23. Manufacture of Coke, Refined Petroleum Products and
Nuclear Fuel
24. Manufacture of Chemicals & Chemical Products
25. Manufacture of Rubber & Plastic Products
104 20.43%
5 Metals
26. Manufacture of Other Non-metallic Mineral Products
27. Manufacture of Basic Metals
28. Manufacture of Fabricate Metal Products, Except Machinery
& Furniture
68 13.36%
6 Electrics
30. Manufacture of Computers & Office Machinery
31. Manufacture of Electrical Machinery & Apparatuses
32. Manufacture of Electronic Components, Radio, TV &
Communication Equipment & Apparatuses
33. Manufacture of Medical, Precision & Optical Instruments,
Watches & Clocks
63 12.38%
7 Motors 34. Manufacture of Motor Vehicles, Trailer & Semi trailers
35. Manufacture of Other Transport Equipment 36 7.07%
8 Constructions 45. General Construction 34 6.68%
9 Trades
50. Sale of Motor Vehicles & Motorcycles; Retail Sale of
Automotive Fuel
51. Wholesale Trade & Commission Trade, Except of Motor
Vehicles & Motorcycles
52. Retail Trade, Except Motor Vehicles & Motorcycles
35 6.88%
10 Others
10. Mining of Coal, Crude Petroleum & National Gas
40. Electricity, Gas, Steam & Hot Water Supply
60. Land Transport; Transport Via Pipelines
61. Water Transport
62. Air Transport
63. Supporting & Auxiliary Transport Activities; Activities of
Travel Agencies
64. Post and Telecommunications
72. Computer & Related Activities
74. Processional, Scientific, & Technical Services
87. Motion Picture, Broadcasting & Performing Arts Industries
39 7.66%
26
Table 2 Descriptive Statistics
Mean Median Max Min Standard Deviation
FAMILY 0.351363 0.358850 0.929500 0.000000 0.192289 PUREFAM 0.206449 0.202800 0.788200 0.000000 0.168349
WEDGE 0.383143 0.273517 1.000000 0.000000 0.377834 FOREIGN 0.080588 0.007950 0.993000 0.000000 0.144262 B_GROUP 0.086444 0.000000 1.000000 0.000000 0.281065
SIZE 19.23005 19.04312 24.89039 12.09130 1.456380 LEV 0.535567 0.491883 26.47682 0.016854 0.727524 GRW 0.131054 0.055900 30.35670 -1.000000 0.954355 PPE 1.427994 0.418585 573.3689 0.000701 19.37460
LIQD 1.733112 1.312874 33.35541 0.001904 1.657786
ROA 0.013486 0.030600 1.508700 -4.524200 0.213433 Tobin’s Q 1.268335 0.385650 288.0004 0.000199 6.912050
AQ 0.075608 0.022729 3.632068 1.48E-05 0.199123
Table 3 Correlation Matrix among Variables
ROA Tobin’s Q AQ FAMILY PUREFAM WEDGE FOREIGN B_GROUP SIZE LEV GRW PPE LIQD
ROA 1 Tobin’s Q -0.257114 1
AQ 0.020685 0.061637 1 FAMILY 0.115026 -0.019895 -0.107780 1
PUREFAM 0.073589 -0.033477 -0.148704 0.523348 1 WEDGE 0.035113 0.055977 0.134612 0.182182 -0.746863 1
FOREIGN 0.118781 0.168423 0.244658 -0.040576 -0.170987 0.213305 1 B_GROUP 0.028418 0.099680 0.414559 -0.119717 -0.221492 0.230277 0.388706 1
SIZE 0.161039 0.108179 0.381035 -0.024089 -0.213392 0.315781 0.472290 0.673355 1 LEV -0.389074 0.050760 0.028786 -0.149381 -0.123434 0.004463 -0.074985 0.024470 -0.052861 1 GRW 0.043331 -0.007909 -0.014348 -0.009154 -0.021796 0.014074 -0.018204 -0.008750 -0.052217 -0.030168 1 PPE -0.011552 -0.008123 -0.009286 -0.082497 -0.055701 0.021572 -0.023072 -0.013726 0.022664 0.013409 -0.006652 1
LIQD 0.137605 0.000212 -0.101229 -0.018232 0.039432 -0.058756 0.107117 -0.147197 -0.186965 -0.172579 -0.027013 -0.014218 1
27
Table 4
Relation of Family Ownership , Firm Performance and Earnings Quality
Proxy of Firm Valuation Proxy of Earnings Quality
ROA ROA Tobin’s Q Tobin’s Q AQ AQ
FAMILY 0.048306
(0.0048)
0.071363
(0.1692)
0.542025
(0.2307)
3.189742
(0.0198)
-0.069487
(0.0002)
-0.139655
(0.0149)
FAMILY2 -0.033043
(0.6379)
-3.796943
(0.0404)
0.100295
(0.1948)
FOREIGN 0.034444
(0.1847)
0.033396
(0.2001)
6.913517
(0.0000)
6.793399
(0.0000)
0.043054
(0.1782)
0.046806
(0.1448)
B_GROUP -0.055945
(0.0003)
-0.056337
(0.0003)
0.417415
(0.3088)
0.372879
(0.3637)
0.178867
(0.0000)
0.180072
(0.0000)
SIZE 0.025293
(0.0000)
0.025469
(0.0000)
0.243283
(0.0047)
0.263242
(0.0023)
0.024353
(0.0000)
0.023784
(0.0000)
LEV -0.092799
(0.0000)
-0.092553
(0.0000)
-0.100874
(0.3913)
-0.072732
(0.5391)
0.006546
(0.1641)
0.005769
(0.2237)
GRW 0.007095
(0.0477)
0.007085
(0.0480)
0.027890
(0.7504)
0.028366
(0.7462)
-7.38E-06
(0.9984)
-3.65E-05
(0.9919)
PPE -5.74E-05
(0.7315)
-5.14E-05
(0.7594)
-0.000548
(0.9012)
0.000140
(0.9747)
-0.000145
(0.4047)
-0.000164
(0.3497)
LIQD 0.012767
(0.0000)
0.012826
(0.0000)
0.039539
(0.4755)
0.046218
(0.4047)
-0.002119
(0.5488)
-0.002531
(0.4755)
Constant -0.457917
(0.0000)
-0.464223
(0.0000)
-4.310406
(0.0091)
-5.029020
(0.0029)
-0.391490
(0.0000)
-0.371265
(0.0000)
Adj R2 0.195582 0.195361 0.073229 0.074278 0.192803 0.193019
F-Statistics
(P-Value)
87.13072
(0.000000)
77.45281
(0.000000)
29.01070
(0.000000)
26.28377
(0.000000)
77.37407
(0.000000)
68.98218
(0.000000)

28
Table 5
Relation of Pure Family Ownership, Firm Performance, and Earnings Quality
Proxy of Firm Valuation Proxy of Earnings Quality
ROA ROA Tobin’s Q Tobin’s Q AQ AQ
PUREFAM 0.059626
(0.0028)
0.008890
(0.8741)
0.993005
(0.0595)
1.948131
(0.1885)
-0.069487
(0.0161)
-0.119645
(0.0518)
PUREFAM2 0.106038
(0.3332)
-1.996597
(0.4903)
0.139132
(0.2448)
FOREIGN 0.039186
(0.1321)
0.040716
(0.1183)
6.995380
(0.0000)
6.966503
(0.0000)
0.043269
(0.1767)
0.046431
(0.1486)
B_GROUP -0.057401
(0.0002)
-0.058471
(0.0002)
0.423871
(0.2991)
0.444022
(0.2780)
0.183069
(0.0000)
0.181886
(0.0000)
SIZE 0.026469
(0.0000)
0.026420
(0.0000)
0.260622
(0.0025)
0.261541
(0.0024)
0.022955
(0.0000)
0.022787
(0.0000)
LEV -0.092884
(0.0000)
-0.093135
(0.0000)
-0.092463
(0.4309)
-0.087766
(0.4555)
0.007665
(0.1028)
0.007333
(0.1192)
GRW 0.007355
(0.0401)
0.007334
(0.0407)
0.032056
(0.7147)
0.032347
(0.7122)
-0.000190
(0.9580)
-0.000210
(0.9537)
PPE -6.98E-05
(0.6755)
-7.66E-05
(0.6462)
-0.000533
(0.9038)
-0.000404
(0.9269)
-0.000111
(0.5244)
-0.000120
(0.4930)
LIQD 0.012507
(0.0000)
0.012369
(0.0000)
0.036867
(0.5051)
0.039474
(0.4765)
-0.000991
(0.7784)
-0.001206
(0.7322)
Constant -0.475525
(0.0000)
-0.471285
(0.0000)
-4.664773
(0.0052)
-4.744335
(0.0046)
-0.380895
(0.0000)
-0.373332
(0.0000)
Adj R2 0.195861 0.195843 0.073922 0.073750 0.190354 0.190466
F-Statistics
(P-Value)
87.28328
(0.000000)
77.68746
(0.000000)
29.29698
(0.000000)
26.08983
(0.000000)
76.17567
(0.000000)
67.87144
(0.000000)

29
Table 6
Relation of Ownership-Control Disparity (Wedge), Firm Performance, and
Earnings Quality
Proxy of Firm Valuation Proxy of Earnings Quality
ROA Tobin’s Q AQ
WEDGE -0.010843
(0.1702)
-0.311150
(0.2311)
0.004561
(0.6618)
FOREIGN 0.042929
(0.0741)
7.593916
(0.0000)
0.076813
(0.0297)
B_GROUP -0.054986
(0.0001)
0.427902
(0.3398)
0.191821
(0.0000)
SIZE 0.025861
(0.0000)
0.313025
(0.0014)
0.022392
(0.0000)
LEV -0.121204
(0.0000)
-0.230508
(0.1748)
0.012078
(0.0676)
GRW 0.006648
(0.0281)
0.032439
(0.7247)
-4.70E-05
(0.9897)
PPE 0.000548
(0.8903)
0.092825
(0.4772)
-0.002600
(0.6064)
LIQD 0.006963
(0.0002)
0.036742
(0.5305)
-0.005801
(0.1592)
Constant -0.426595
(0.0000)
-5.305550
(0.0045)
-0.381088
(0.0000)
Adj R2 0.240080 0.078601 0.193820
F-Statistics
(P-Value)
102.5709
(0.000000)
28.43666
(0.000000)
70.75136
(0.000000)