kota fiber case study
DESCRIPTION
This is a comprehensive case analysis of Kota Fiber caseTRANSCRIPT

Group 1:
Bhavananda Jha (14317)
Chanda Kiran Adhikari (14301)
Niraj Ghimire (14314)
Pragya Joshi (14318)
Prajwal Sagar Shrestha (14331)
1/8/2015

Introduction
Kota fiber is nylon fiber producing company situated in Kota, India. The business has been
running smoothly with steady market share. But the company is facing serious liquidity crunch
and even in the heavy selling season, the business has to take more loans. The situation has
become worse as the company had overdrawn the bank account and could not pay the excise tax.
The company had taken loan from the bank with a contract to clean up on December 2001 but
the financial projection for 2001 shows inability of Kota Fiber to repay all its line of credit to
bank on the specified period. On the other hand, there are four different proposals from managers
of different departments, which may be beneficial for the company. The reassessment of the
financial forecast including the new proposals is needed to find out the actual debt position of the
company.
Issues
Some of the issues taken into consideration are:
1. The current situation of business.
2. The reasons for company to run out of cash and its consequences.
3. Analysis of clean up requirement of the bank
4. Analysis of Mehta’s financial forecast and cash cycle analysis.
5. Analysis of impact of proposals given by employees and managers of Kota Fibres on the
debt position of the company.
6. The actions that can be taken by Pundir.
Analysis of the Issues
Current Situation:
The firm does not have enough cash in their bank accounts to pay off the tax inspector that
demand the excise tax to be paid. This situation backlogs the trucks ready to depart the night
before, but is unable to until the tax inspectors paid.
The company has also overdrawn on its bank account three weeks in a row and that situation
needs to be addressed. The bank has already been disappointed by the company’s inability to

clean up its debt balance for 30 days during this past off-season and would be expected to
advance no more cash unless the situation changes.
The reasons for company to run out of cash and consequences:
Kota fiber has run out of cash for because of the following main reasons:
o Sales growth (20% anticipated in 2001): In the year 2000, the actual growth in sales is
18% but in 2001 the company is expected a growth rate of 20% for which the company
need more cash.
o Declining profitability: An analysis of case reveals that net profit as a percentage of sales
has fallen over the past year 2000, from 5.6% to 3.4% of gross sales and is projected to
fall to 1.5% in 2001
o Aggressive dividend payments: The Company is paying a dividend of INR 2 million per
year which is higher than the expected net profit of INR 1.33 million.
o Increase in Cost of goods sold: The ratio of cost of goods sold to gross sales has risen by
2% from 69% to 71% and is expected to mount to 73.7% in 2001.
o Decrease in ROE: Kota return on equity is 21.5% in 2000 and falls to 11.9% in 2001
which is below than interest rate of 14.5%.
The consequence for the company is going to be
o If Kota does not clear line of credit, the bank will stop providing credit facilities to the
company.
o Insufficient cash flow will hamper the day to day operations of the business.
Analysis of Clean- up requirement of Bank
Clean-up requirement is a traditional way through which banks can secure its loan from being
default. Normally clean up requirement are from 30 to 60 days. The cleanup period is usually
arranged right after the peak sales time in the year for a particular business. After peak sales
period when receivables have mostly been collected and cash need for purchasing new inventory
is comparatively low, the portion from gross profit is to be paid to bank to remain debt free for
the specified period. This is a banking practice that requires a borrower to pay off all balances of
any renewable lines of credit and keep them at zero for 30 to 60 days or so. Banks require
cleanup of loan in order to manage the unsecured loans provided to businesses. In case of Kota
Fibers, the bank may have added clean up requirement in the loan contract in order to prevent
Kota fibers to use line of credit as ongoing permanent financing.
The bank must not continue to waive compliance with clean-up of the loan for Kota Fibers. As
the business is facing scarcity of cash, for certain years, the waiver may be continued so that
Kota Fiber would not have extra burden of mandatory clean up. But in long run, the waiver must
be ceased. On the other hand, after few years, if Kota fibers can turn the business as highly
profitable and if the loan given by the bank can be declared as secured loan, then the waiver of
clean up may be given continuity for long run.
Analysis of Mehta’s Financial forecast and cash cycle analysis.
The financial forecast was constructed based on the past financial report and to generate the
ability to clean up the loan by the end of 2001. The monthly forecast of the financial statements
was developed using the operating assumptions in exhibit 11 of the case. The forecast was
developed as the bank asked for a proper financial forecast of Kota fibers for the coming year.
The bank was refusing to extend further line of credit to Kota fibers unless the financial forecast
of the company demonstrated the ability of the firm to clear the loan by the end of 2001.
Mehta’s financial forecast shows that the expected Gross sales will be increased by 20% in 2001
which was increased by 18% in 2000. The expected gross net profit margin will be only 1.5% of
gross sales in 2001 which was 3.4% in 2000. The cost of goods sold which is increasing year by
year will expected to reach to 73.7% of sales in 2001 which was 71% in 2000.
According to the financial forecast, the current ratio as well as quick ratio are expected to decline
in 2001 indicating poor liquidity to be expected in the coming year. The gross profit margin is
also expected to decline to only 13.29 %. Return on assets is also expected to decline. And the
debt to assets ratio is expected to increase from 10.85% to 28.41 %, because of increase in short
term financing needs.

Financial Ratios Actual(2000) Forecast(2001)
Current ratio4684237/1,443,637 6,690,525/ 4,440,345
3.24 1.5
Quick ratio(4,684,237-1,249,185)/1,443,637 (6,690,525-2,225,373)/ 4,440,345
2 1
Gross profit margin64,487,358/10,621,447 77,265,092/10,271,712
16.47% 13.29%
Total asset turnover ratio64,487,358/13,295,604 77,265,092/15,628,161
4.85 4.94
Return on assets2,550,837/ 13,295,604 1,335,848 /15,628,161
19.18% 8.57%
Debt to asset ratio1,443,637/13,295,604 4,440,345/15,628,161
10.85% 28.41%
The calculation of Cash Cycle based on the financial forecast done by Mehta.
S
N Particulars Actual 2000
Forecasted
2001
1 Average inventory 1249185.00 2225372.57
2 COGS
53865911.0
0 66993379.60
3
Inventory turnover
ratio(2/1) 43.12 30.10
4 Inventory period(365/3) 8.46 12.12
5 Receivable 2672729.00 3715152.20
6 Sales
64487358.0
0 77265092.00
7
Receivables
turnover(6/5) 24.13 20.80
8 Receivable period(365/7) 15.13 17.55
9 Payables 759535.00 1157298.44
10 COGS
53865911.0
0 66993379.60
11 Payables turnover(10/9) 70.92 57.89
12 Payable period(365/11) 5.15 6.31
13 Operating cycle 23.59 29.67

14 Payable days 5.15 6.31
15 Cash cycle 18.45 23.37
The Cash Cycle prepared with the financial forecast shows that both operating cycle and cash
cycle will increase in 2001 from 23.59 days to 29.67 days and 5.15 days to 6.31 days
respectively because of which the company have to face crisis of cash flow in upcoming year
with this financial forecast.

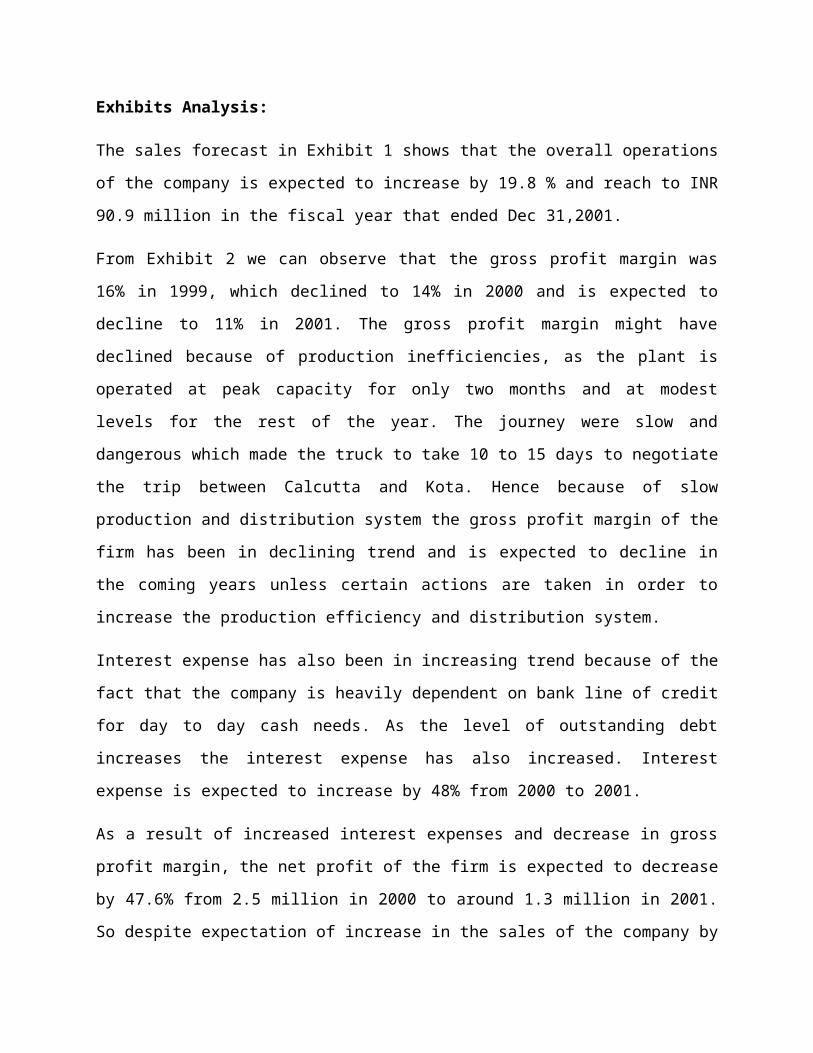
Exhibits Analysis:
The sales forecast in Exhibit 1 shows that the overall operations of the company is expected to
increase by 19.8 % and reach to INR 90.9 million in the fiscal year that ended Dec 31,2001.
From Exhibit 2 we can observe that the gross profit margin was 16% in 1999, which declined to
14% in 2000 and is expected to decline to 11% in 2001. The gross profit margin might have
declined because of production inefficiencies, as the plant is operated at peak capacity for only
two months and at modest levels for the rest of the year. The journey were slow and dangerous
which made the truck to take 10 to 15 days to negotiate the trip between Calcutta and Kota.
Hence because of slow production and distribution system the gross profit margin of the firm has
been in declining trend and is expected to decline in the coming years unless certain actions are
taken in order to increase the production efficiency and distribution system.
Interest expense has also been in increasing trend because of the fact that the company is heavily
dependent on bank line of credit for day to day cash needs. As the level of outstanding debt
increases the interest expense has also increased. Interest expense is expected to increase by 48%
from 2000 to 2001.
As a result of increased interest expenses and decrease in gross profit margin, the net profit of the
firm is expected to decrease by 47.6% from 2.5 million in 2000 to around 1.3 million in 2001. So
despite expectation of increase in the sales of the company by 19.8%, the net profit is expected to
decrease by 47.8%. The main reason behind this is in efficiency in production, poor management
of working capital and higher outstanding debt for financing short term financing needs.
By analyzing the actual and forecasted balance sheet of the Kota fiber, we can say that the
ending cash balance has not changed that much and firm is expected to maintain a minimum cash
balance of 750,000 in all the months of the coming year. But for maintaining the cash balance
the firm is expected to take more line of credit from the bank. So the notes payable to bank is
expected to increase by 406% from 648102 in 2000 to 3463701 in 2001. The main reason behind
his huge increase in notes payable might be attributed to poor cash management of the firm. The
firm is not expected to generate enough cash collections to cover the cash disbursement in each
month of the coming fiscal year, as a result of which the outstanding debt is expected to increase
in order to maintain the minimum cash balance at the end of each month.

Analysis of proposals and their impact on the debt position of the company.
Exhibit 4: Memo from field Sales Manager
One of firm’s goals is to keep the credit terms to 45 days. Pondicherry textiles propose that Kota
fibers, ltd extend the credit terms to 80 days and they will make the Kota as its prime yarn
suppliers. From the calculation of debt outstanding after incorporating the proposal given by
Pondicherry Textile, we can see the debt position in December raised to 3897616 which is IRs.
433915 higher than the forecast done by Mr. Mehta.
January February March April May June
Sales2,788,80
13,083,77
04,740,96
2 9,385,38814,802,09
818,749,32
4
Purchases (1)1,696,07
42,607,52
95,161,96
38,141,15
410,312,12
8 9,565,856 5,026,277Debt Outstanding 684,102
1,344,093
3,439,517
9,639,288
18,913,736
29,278,468
35,809,122
July August September October November December
Sales 17,392,465 9,138,686 5,363,079 4,740,9623,764,881 2,949,693
Purchases (1) 2,949,693 2,607,529 2,070,685 1,622,331
1,965,500 2,093,837
Debt Outstanding 29,863,049 17,800,191 9,583,567 5,754,282
3,827,762 3,897,616
Although net profit will rise after accepting this proposal, it is still not acceptable. The company
is facing liquidity crisis at present. To decrease the cash cycle, company has to focus on
decreasing the account receivable turnover. Instead of this, if this proposal is accepted, more
time will lag between the sales and receipt of cash. This will require more debt financing which
is not favorable in present situation. So, this proposal should be rejected now.
Exhibit 5: Memo from Transportation Manager
Comparing the initial case and after applying the according to memo by transportation manager,
there has been the decrease in interest expense by 21.41%. The decrease in interest expense
points that there has been decrease in debt outstanding. Also the average inventory per month has

decreased by 34.8%. This model has hence helped in increasing the quick ratio of the company
from 0.8622 in average to 1.01. There has also been increase in average account payable from
3403855 to 3522896 i.e. by 3.5%. This too plays role in improvising cash conversion cycle.
It can be seen that the proposal don’t have significant effect in improvising the working capital
condition, however, something is better than nothing and company should adopt this policy
along with other policies to improvise its working capital condition.
Total
Current
Assets Inventories
Total
Current
Liabilities
Note
Payable-
Bank (6)
Current
Ratio
Quick
Ratio
Jan
5831484.03
5 2308135.035 2684602.15
1146269.05
7
2.17219673
9
1.31242873
3
Feb
9891667.05
8 5850125.058 6826251.167
2962622.64
9
1.44906286
3
0.59205878
9
Mar
17617985.0
6 11855841.06 15392422.43
8767030.69
4
1.14458819
8
0.37434939
3
Apr
28689052.7
3 17637315.33 26169856.88
17419379.4
2
1.09626326
4
0.42230790
4
May
38413382.0
7 19666227.07 35275721.32
26997556.9
9 1.08894675
0.53144639
7
Jun
39968408.8
3 14469651.83 36834199.82
32950665.3
7
1.08508964
6
0.69225766
1
July 33262875.7 6815272.098 29383517.74
27167192.8
1
1.13202496
7
0.90008295
9
Aug
21825158.8
1 3883970.01 17740549.36
15795793.1
9 1.23024143
1.01130965
2
Sept
12703996.0
6 2950256.658 9463849.618
8352899.26
8
1.34237087
1
1.03063127
5
Oct 8899885.90 1854836.904 5654716.21 5002010.51 1.57388727 1.24587136

4 5 8 5
Nov 7419141.86 1639892.46 4219913.831
3278055.00
1
1.75812638
7
1.36951834
3
Dec 6690524.77 2225372.569 4440346.362 3463701.86
1.50675740
7
1.00558646
5
Total
231213562.
9 91156896.09 194085946.9
153303176.
8
1.19129471
5
0.72162188
5
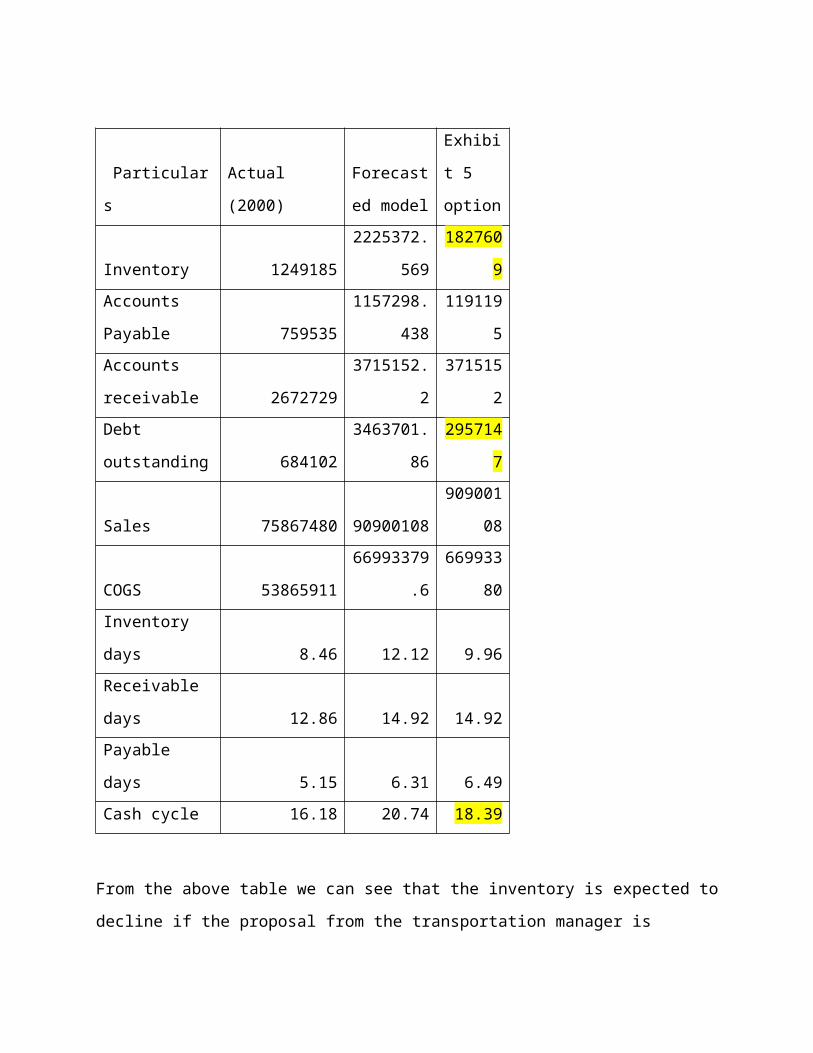
Particulars Actual (2000)
Forecasted
model
Exhibit
5 option
Inventory 1249185
2225372.56
9 1827609
Accounts
Payable 759535
1157298.43
8 1191195
Accounts
receivable 2672729 3715152.2 3715152
Debt outstanding 684102 3463701.86 2957147
Sales 75867480 90900108
9090010
8
COGS 53865911 66993379.6
6699338
0
Inventory days 8.46 12.12 9.96
Receivable days 12.86 14.92 14.92
Payable days 5.15 6.31 6.49
Cash cycle 16.18 20.74 18.39
From the above table we can see that the inventory is expected to decline if the proposal from the
transportation manager is accepted. The inventory is expected to decrease because the purchase
will be required to be made for only one month now, compared to two months previously. As a
result of this the accounts payable is also expected to decrease. All of these will decrease the
level of outstanding debt at the end of 2001.
The proposal will have a good impact on Kota’s short-term debt position as reduced amount of
inventory will reduce the net working capital requirement for the company and eventually the
debt outstanding in all the months from January to December is expected to decrease. Also the
cash cycle is expected to be shortened to 18 days after this proposal is accepted. So this proposal
will have a good impact on short term debt position of Kota fibers.

The decrease in borrowing requirement and debt outstanding makes sense as the proposal
reduces inventory requirements to half, which means that the amount of financing required for
current assets is lesser.
Exhibit 6: Memo from Purchasing Agent
The use of JIT method as proposed by Hibachi Chemicals includes purchase of 35% of one of
the raw materials. The proposal included the reduction of pellets inventory from 60 days
outstanding to 2 to 3 days.
The proposal was calculated in excel sheet and was found to have following positive impact on
the debt outstanding and borrowing of the company.
January February March April May June
Debt Outstanding 1,353,298 2,017,987 5,754,53712,043,361
19,390,528
24,728,089
Debt Outstanding initially
1,146,269 2,962,623 8,767,03117,419,379
26,997,557
32,950,665
July August September October November DecemberDebt Outstanding
21,067,369 12,403,927 5,990,806 2,980,827 1,646,578 1,844,640
Debt Outstanding initially
27,167,193 15,795,793 8,352,899 5,002,011 3,278,055 3,463,702
Total Current
Assets
Inventories
(3)
Total
Current
Liabilities
Note Payable-
Bank (6)
Current
Ratio
Quick
Ratio
Jan 4975358.765 1452009.765 2035130.44 1353297.856
2.44473
7 1.731264
Feb 7219122.884 3177580.884 4357241.09 2017987.213
1.65681
1 0.927546
Mar 12700823.76 6938679.761 10662059.87 5754536.944
1.19121
7 0.540434
Apr 21578653.44 10526916.04 19210779.92 12043361.35 1.12325 0.575288

8
May 30312426.48 11565271.48 27271180.58 19390527.64
1.11151
9 0.687435
Jun 33365082.66 7866325.664 30260342.47 24728088.95
1.10260
1 0.842646
Jul 29283772.99 2836169.388 25373312.02 21067368.77
1.15411
7 1.042339
Aug 19302136.33 1360947.533 15146281.94 12403926.55
1.27438
1 1.184528
Sep 10711655.03 957915.6323 7375929.187 5990805.687
1.45224
5 1.322374
Oct 7308058.487 263009.4868 3948771.776 2980826.654
1.85071
7 1.784111
Nov 5955715.801 176466.4009 2626923.044 1646577.928
2.26718
3 2.200007
Dec 5079974.454 614822.2544 2686484.25 1844640.455
1.89093
8 1.66208
This gives that the average current ratio of the company is upgraded to 1.54 per month. On
January, November and December, the working capital is relatively higher than other months as
well as the overall current ratio is better than the base model. Similar goes with the quick ratio.
The quick ratio is 1.2 and is better than the scenario of improvised transportation model. Also the
interest expense on debt is dropped down drastically by 99.4%. The decrease in debt outstanding
on average is reduced by 28.44% monthly ranging from 21% to 49.8%.
Particulars Actual (2000) Base model HibachiInventory 1249185 2225372.569 614822.3Accounts Payable 759535 1157298.438 1002041Accounts receivable 2672729 3715152.2 3715152Debt outstanding 684102 3463701.86 1844640Sales 75867480 90900108 90900108COGS 53865911 66993379.6 66993380

Inventory days 8.46 12.12 3.35Receivable days 12.86 14.92 14.92Payable days 5.15 6.31 5.46Cash cycle 16.18 20.74 12.81
By accepting Hibachi proposal the inventory level is expected to decline drastically to only IRS
614822.3 from original expectation of IRS 2225372.569. The debt outstanding is also expected
to decline drastically to only IRS 1.8 million from original forecast of IRS 3.46 million. The
decrease in debt outstanding is as a result of decrease in net working capital requirement of the
firm after the implementation of JIT proposal. The decrease in net working capital requirement is
also indicated by decrease in current and quick ratio after implementing JIT proposal. If this
proposal is accepted, cash cycle is expected to decrease to 12.81 days from 20.74 days.
Therefore, it is better to include Hibachi proposal. It is better to go both with the proposal by the
transportation manager and Hibachi proposal simultaneously.

Exhibit 7: Memo from Operation Manager
From the application of this proposal, it is expected that gross profit margin will increase by 2%
to 3% which may be because of reduction in seasonal training and set up cost and increase in
production efficiency. The work force will be more motivated to work and machine break down
will be less frequent. But, if we see the following calculation, the proposal seems vague and
inapplicable. If we convert the monthly sales as percentage of total sales in a year we will get the
following percentage of sales as shown in figure below. To make level production means to have
same percentage of total production every month which will eventually add up to 100%
annually. Now of when we add total sales requirement the product up to July i.e. till the end of
peak sales season, we find 73.21% of sales is made up to July. But when we add up the total
production only 58.33% is produced till the end of July. The strategy of the company is to
produce goods only according to demand and it is mentioned in the case description that
company does not follow overproduce the product as the profit margin is small and carrying cost
will be high. This also means the sales and production amount must be approximately equal. But
if level production strategy is followed, the company will not be able to fulfill the market
demand in time of peak sales due to under production. While on the other hand, company will be
over producing in the time of slack sale from the month of August till December. This will create
imbalance in the demand supply mechanism of the business.
LEVEL PRODUCTION PLAN
J anuary February March April May J une
Sales as percentage of year 2.88% 3.18% 4.89% 9.69% 15.28% 19.35%Production as percentage of year 8.33% 8.33% 8.33% 8.33% 8.33% 8.33%
J uly August September October November December
17.95% 9.43% 5.53% 4.89% 3.89% 3.04%8.33% 8.33% 8.33% 8.33% 8.33% 8.33%
Total sales through J uly 73.21%Total production through J uly 58.33%
Hence, this proposal of level production must be rejected.
Summary of all the Proposals.
Initial Forecast Pondicherry Inventory Hibachi JIT
Debt Balance Summary Debt Balance SummaryDebt Balance
Summary Debt Balance Summary
Jan 01 1,146,269 Jan 01 1,344,093 Jan 01 1,200,185 Jan 01 1,353,298
June 01 32,950,665 June 01 35,809,122 June 01 25,435,575 June 01 24,728,089
Dec 01 3,463,702 Dec 01 3,897,616 Dec 01 2,957,147 Dec 01 1,844,640
The action that can be taken by Pundir
Pundir can take the following steps:
o Reject the proposal from Field sales manager.
o Accept the proposal of Transportation manager
o Reducing raw material inventory by 30 days will reduce peak debt to INR 25
million and ending debt to INR 3 million, respectively, and will also increase the
profitability of the firm by INR 275,202. But the company should be aware of the
dangers of reducing inventory, a reduction from 60 to 30 days, although
significant, still leaves a good margin of safety.
o Accept the proposal of JIT from Hibachi Chemicals.
o Reject the proposal from Operations manager.
o Instead of providing quarterly dividend of INR 500000, the money can be used in the
business to manage the liquidity need. The Pundir family’s belief is not appreciable
regarding the funds of firm. The excess money would play significant role in enhancing
debt position of the company if used wisely rather than just giving out dividends.
Dividends can be taken when the debt position gets stronger after time being.
Only after implementing the strategies mentioned above, the level of debt outstanding can be
reduced to zero by the end of 2001. Which would mean that the company would be able to clear
the line of credit by December 2001.

Recommendations
o The firm should move towards cutting down the cash cycle and increase its liquidity. One of
the way the firm can do this is moving towards receiving their supplies on a JIT basis. This
will tie up less cash in inventory that is sitting in the warehouse. They could also lower credit
terms to receive funds quicker from their buyers. This strategy will lower their cash cycle and
free up cash and have more liquidity on hand. From these plans, company does not have to
purchase more inventory in the first two months since it will use raw material on hand and
order accordingly.
o The company should also request that the note payable be repaid in December of the fiscal
year, not October. This allows Kota fibers time to collect its outstanding receivables from its
peak selling season.
o The company should not provide dividend to its shareholder till all outstanding debt are
settled.
o The company can ask shareholder to invest in the company.
Learnings from the case
o The firm with poor cash management generally has trouble in carrying out day to day
operating activities such as making payments to the tax inspector for the excise tax due
to lack of liquidity in their cash balance. As a result of which, the level of debt increases
to meet the liquidity needs.
o If the firm is unable to manage its working capital, especially cash, then the short term
debt of the firm is going to increase which will have negative impact on the profitability
of the company through increased interest expenses.
o In order to manage the cash effectively and efficiently, the firm should try either to
decrease its inventory days or accounts receivable days or increase its accounts payable
days so that the cash cycle of the firm can be shortened.
o One of the ways a firm can reduce its inventory level is to implement Just in time system.
JIT production strategy strives to improve business return on investment by reducing in
process inventory and associated carrying cost. JIT focuses on continuous improvement
and can improve a manufacturing organization’s return on investment, quality and
efficiency.