kotak-life individual-fund changes done · market outlook annual fund update as on 31st march 2016...
TRANSCRIPT

Click on the Fund Name for details
Click on the Fund Name for details
INDIVIDUAL FUNDS
GROUP FUNDS
KOTAK GROUP DYNAMIC FLOOR FUND(ULGF-015-07/01/10-DYFLRFND-107)
KOTAK GROUP GILT FUND(ULGF-002-27/06/03-GLTFND-107)
KOTAK GROUP MONEY MARKET FUND(ULGF-001-27/06/03-MNMKFND-107)
KOTAK GROUP BALANCED FUND(ULGF-003-27/06/03-BALFND-107)
KOTAK GROUP FLOATING RATE FUND(ULGF-005-07/12/04-FLTRFND-107)
KOTAK GROUP BOND FUND(ULGF-004-15/04/04-BNDFND-107)
CLASSIC OPPORTUNITIES FUND(ULIF-033-16/12/09-CLAOPPFND-107)
MARKET OUTLOOK
MONEY MARKET FUND(ULIF-041-05/01/10-MNMKKFND-107)
BALANCED FUND(ULIF-037-21/12/09-BALKFND-107)
KOTAK OPPORTUNITIES FUND(ULIF-029-02/10/08-OPPFND-107)
FRONTLINE EQUITY FUND(ULIF-034-17/12/09-FRLEQUFND-107)
FUND PERFORMANCE OF ULIP FUNDS
KOTAK DYNAMIC GROWTH FUND(ULIF-012-27/06/03-DYGWTFND-107)
KOTAK AGGRESSIVE GROWTH FUND(ULIF-018-13/09/04-AGRGWTFND-107)
DYNAMIC FLOOR FUND II (ULIF-035-17/12/09-DYFLRFND2-107)
PRODUCT - FUND MATRIX
GUARANTEE FUND(ULIF-048-05/02/10-GRTFND-107)
KOTAK DYNAMIC BALANCED FUND(ULIF-009-27/06/03-DYBALFND-107)
KOTAK GUARANTEED GROWTH FUND(ULIF-013-27/06/03-GRTGWTFND-107)
KOTAK DYNAMIC FLOATING RATE FUND(ULIF-020-07/12/04-DYFLTRFND-107)
KOTAK DYNAMIC BOND FUND(ULIF-015-15/04/04-DYBNDFND-107)
DYNAMIC FLOOR FUND(ULIF-028-14/11/06-DYFLRFND-107)
PEAK GUARANTEE FUND I(ULIF-049-14/02/10-PKGRTFND1-107)
KOTAK DYNAMIC GILT FUND(ULIF-006-27/06/03-DYGLTFND-107)
KOTAK GROUP SHORT TERM BOND FUND(ULGF-018-18/12/13-SHTRMBND-107)
ANNEXURE
KOTAK GROUP SECURE CAPITAL FUND(ULGF-016-12/04/11-SECCAPFND-107)
KOTAK 57M FMP 07/04/2016(ULGF-017-14/07/11-57FM070416-107)
CONTENTS
ANNUAL FUND UPDATE AS ON 31st March 2016
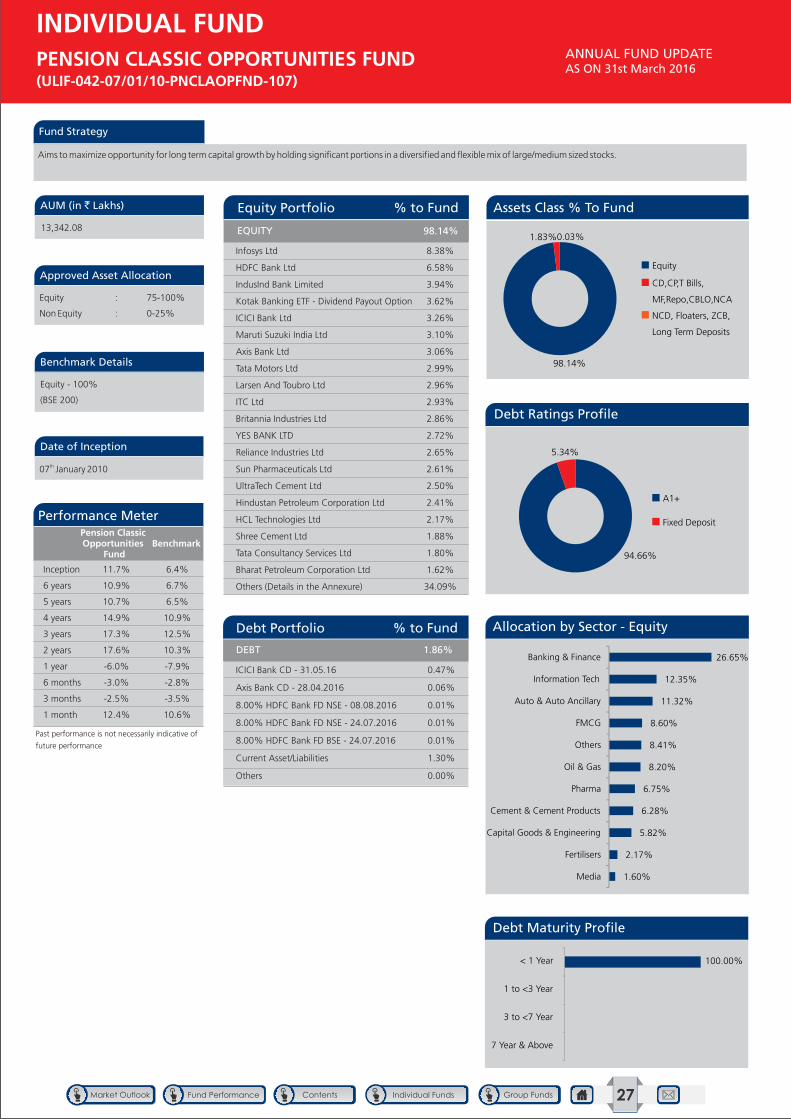
PENSION CLASSIC OPPORTUNITIES FUND(ULIF-042-07/01/10-PNCLAOPFND-107)
KOTAK PENSION OPPORTUNITIES FUND(ULIF-032-17/07/09-PNOPPFND-107)
PENSION FLOOR FUND II (ULIF-043-08/01/10-PNFLRKFND2-107 )
KOTAK PENSION BALANCED FUND (ULIF-011-27/06/03-PNBALFND-107 )
PENSION GUARANTEE FUND(ULIF-038-21/12/09-PNGRTFND-107)
KOTAK PENSION GROWTH FUND(ULIF-030-07/01/09-PNGWTFND-107)
KOTAK PENSION GILT FUND (ULIF-008-27/06/03-PNGLTFND-107)
KOTAK ADVANTAGE MULTIPLIER FUND II (ULIF-026-21/04/06-ADVMULFND2-107)
PENSION FRONTLINE EQUITY FUND(ULIF-044-11/01/10-PNFRLEQFND-107)
PENSION BALANCED FUND II(ULIF-046-24/01/10-PNBALFND2-107)
KOTAK ADVANTAGE PLUS FUND II(ULIF-027-21/04/06-ADVPLSFND2-107)
KOTAK PENSION FLOOR FUND(ULIF-031-13/07/09-PNFLRFND-107)
KOTAK PENSION FLOATING RATE FUND(ULIF-022-07/12/04-PNFLTRFND-107)
KOTAK GUARANTEED BALANCED FUND (ULIF-010-27/06/03-GRTBALFND-107)
KOTAK PENSION BOND FUND(ULIF-017-15/04/04-PNBNDFND-107)
PENSION MONEY MARKET FUND II(ULIF-039-28/12/09-PNMNMKFND-107)
DISCONTINUED POLICY FUND (ULIF-050-23/03/11-DISPOLFND-107)
2
5
8
10
11
12
13
14
15
16
17
18
19
20
21
22
23
44
45
46
47
48
49
50
51
52
53
DISCLAIMER 59
24
25
26
27
28
29
30
31
32
33
34
35
36
37
38
39
40
41
42
01
MARKET OUTLOOK
ANNUAL FUND UPDATE AS ON 31st March 2016
02
The investment objective is to ensure that returns on policyholder's funds are consistent with the protection, safety and liquidity of such funds, while
ensuring that the liabilities in respect of each of the funds are supported by a diversified pool of investments and assets, held under the respective
fund wherein the asset classes, asset allocation and asset selection are compliant with the nature of liabilities, investment objective for each of the
funds, IRDAI Investment Regulations and Insurance Act.
There are well-defined categories of funds across the risk-return spectrum. Based on the objectives and risk return profile of each fund, investments
are made in various assets classes like equity and debt. The Investment team is adequately staffed and structured for effective management of
respective funds and also to ensure independent checks and monitoring of investment performance. A process driven and moderate risk approach is
followed. While choosing stocks in portfolio, the business model, competitive edge, management quality, sustained economic earnings, and
corporate governance is assessed. The equity portfolio has a bias towards industry leaders and growth companies. In case of debt, emphasis and
focus is on safety, liquidity and returns with prime importance given to duration management with a view on interest rates.
Investment risk is managed by creating a portfolio of different asset classes and of varied maturities depending on the fund objective so as to spread
risk across a wide category of the investee companies, investee groups as well as the investee industries in accordance with the prudential exposure
norms and regulation stipulated by the IRDA. Investment Committee which acts as the policy making body for the investment operations,
periodically discusses the investment strategy, portfolio structures, performance of the portfolio and other issues relating to the investment
portfolio. The Asset & Liability Management Committee reviews the asset liability management strategy, investment risk, and other related risks
periodically. The Credit Committee approves the credit limit for each investee company and also does a periodical review of the existing exposure of
debt investments in companies.
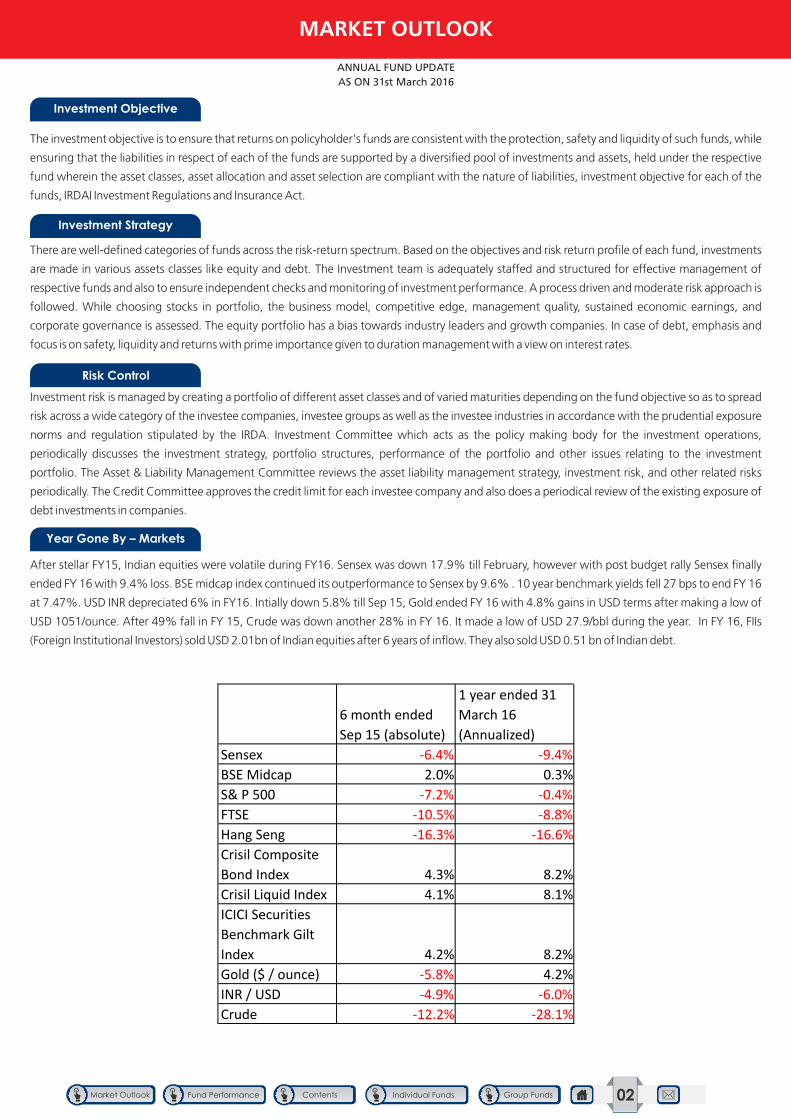
After stellar FY15, Indian equities were volatile during FY16. Sensex was down 17.9% till February, however with post budget rally Sensex finally
ended FY 16 with 9.4% loss. BSE midcap index continued its outperformance to Sensex by 9.6% . 10 year benchmark yields fell 27 bps to end FY 16
at 7.47%. USD INR depreciated 6% in FY16. Intially down 5.8% till Sep 15, Gold ended FY 16 with 4.8% gains in USD terms after making a low of
USD 1051/ounce. After 49% fall in FY 15, Crude was down another 28% in FY 16. It made a low of USD 27.9/bbl during the year. In FY 16, FIIs
(Foreign Institutional Investors) sold USD 2.01bn of Indian equities after 6 years of inflow. They also sold USD 0.51 bn of Indian debt.
Investment Objective
Risk Control
Year Gone By – Markets
Investment Strategy
6 month ended
Sep 15 (absolute)
1 year ended 31
March 16
(Annualized)
Sensex -6.4% -9.4%
BSE Midcap 2.0% 0.3%
S& P 500 -7.2% -0.4%
FTSE -10.5% -8.8%
Hang Seng -16.3% -16.6%
Crisil Composite
Bond Index 4.3% 8.2%
Crisil Liquid Index 4.1% 8.1%
ICICI Securities
Benchmark Gilt
Index 4.2% 8.2%
Gold ($ / ounce) -5.8% 4.2%
INR / USD -4.9% -6.0%
Crude -12.2% -28.1%
MARKET OUTLOOK
ANNUAL FUND UPDATE AS ON 31st March 2016
03
Key Economic Indicators
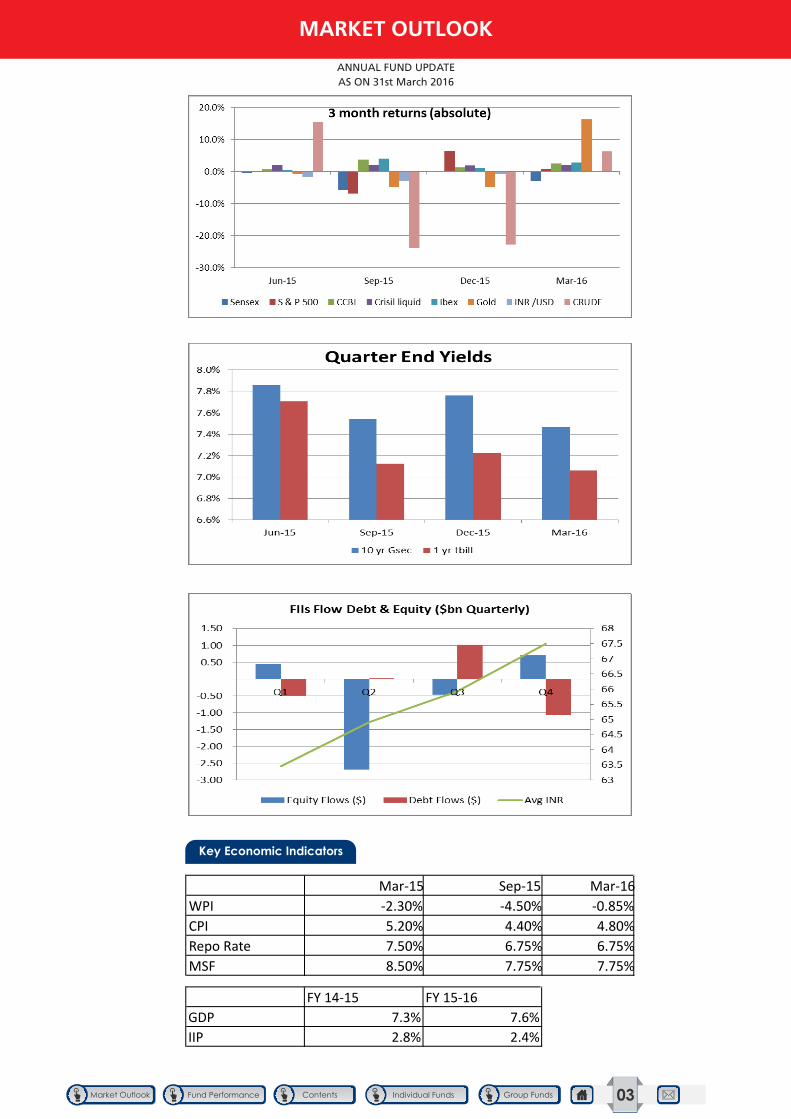
Mar-15 Sep-15 Mar-16
WPI -2.30% -4.50% -0.85%
CPI 5.20% 4.40% 4.80%
Repo Rate 7.50% 6.75% 6.75%
MSF 8.50% 7.75% 7.75%
FY 14-15 FY 15-16
GDP 7.3% 7.6%
IIP 2.8% 2.4%
MARKET OUTLOOK
ANNUAL FUND UPDATE AS ON 31st March 2016
04
Chinese Yuan (CNY) devaluation, weak growth data out of China leading to fear of global slowdown and a sell-off in commodities, fear over Greece's future in the
Eurozone and US Fed rate hike were some of the global factors that affected the markets in second quarter of FY 16. On domestic front muted corporate earnings,
logjam in monsoon session of Parliament and below normal monsoon (deficit of 14%) further dampened the markets. However the silver lining during the quarter was
Fed's decision to keep the rates unchanged and surprise RBI action of 50 bps rate cut. During the quarter the Indian government approved a composite cap on foreign
investment in companies.
Indian equities were down 5.9% and yield fell 32 bps for the quarter. Gold and crude fell 4.9% and 23.9% respectively during the quarter. Inflation both WPI and CPI
came down by 210 bps and 100 bps respectively. INR depreciated 3% against USD during the quarter. FIIs sold USD 2.6 bn of indian equities in Q2
Q3 started on positive note with Sensex up 2% in October, but the rally fizzled out with Sensex ending flat for the quarter. The fear of a higher fiscal deficit on the back
of the announcement of the seventh pay commission recommendations, non eventful winter session of Parliament and results of Bihar assembly election weighed on
the markets. On the reforms front, the government announced FDI reforms across 15 sectors and scheme for financial restructuring of power distribution companies.
10 year benchmark treasury yields increased 22 bps to end the quarter at 7.76%. Gold and crude fell another 4.8% and 22.9% respectively during the quarter.
On the global front, while US Federal Reserve raised Fed funds rate by 25 bps, European Central Bank (ECB) announced a 10 bps deposit rate cut and extended its asset
purchase program by six months. China also made policy announcements along with rate cut.
Start of the fourth quarter of FY 16 proved to be a trying one for equity markets world wide, with India being no exception. Sensex was down 11.9% by February. The
sell off was driven mainly by global developments particularly uncertainty around growth in China and falling crude prices (brent crude was down 7% hitting the lows
last seen in March 2003), IMF's weak outlook on global growth, concerns over increasing bad loans of Indian banks and disappointing 3QFY16 corporate results.
However monetary policy announcements by the European Central Bank (ECB) and Bank of Japan (BoJ), signals from Fed of slower pace of interest rate hike,
stabilisation of chinese currency and rally in commodities led by hopes of sustainability of growth in China fuelled by fiscal stimulus, lifted the investor sentiments with
market rising 10% in March.
On domestic front, the government announced constitution of the Bank Board Bureau which will recommend selection of heads of public sector banks and financial
institutions, and develop strategies and capital raising plans for them. Union Budget reflected government's stance of fiscal consolidation (fiscal deficit target
maintained at 3.9% for FY16 and 3.5% for FY17) with focus on revival of rural demand. The parliament made a notable progress in the budget session post the
stalemate monsoon and winter sessions by passing key bills such as Real Estate Bill and Aadhaar bill.
Q1 FY 16
Q2 FY 16
Q3 FY 16
Q1 started on weak note with Indian equities down 3.4% in April, however it recovered later to end the quarter flat (0.56%). Weak corporate earnings, tax
department's notice to FIIs for past dues of MAT, worries of Greece's exit from euro zone and expectation of a weak monsoon by the Indian Metorological Department
gloomed the market. However better than expected monsoon in June and status quo on interest rates by Fed helped the market recover.
The Reserve Bank of India (RBI) in its bi-monthly monetary policy (held in June) cut the policy repo rate by 25bps to 7.25% but maintained a cautious stance as it saw a
possibility of risk to inflation due to fears of abnormal monsoon, potential hike in crude prices and volatility in external environment. Amid volatility, 10 year Gsec yield
settled 12 bps up to end Q1 at 7.86%. Crude was up 15% in Q1.
Q4 FY 16
FUND PERFORMANCE OF ULIP FUNDS
ANNUAL FUND UPDATE AS ON 31st MARCH 2016
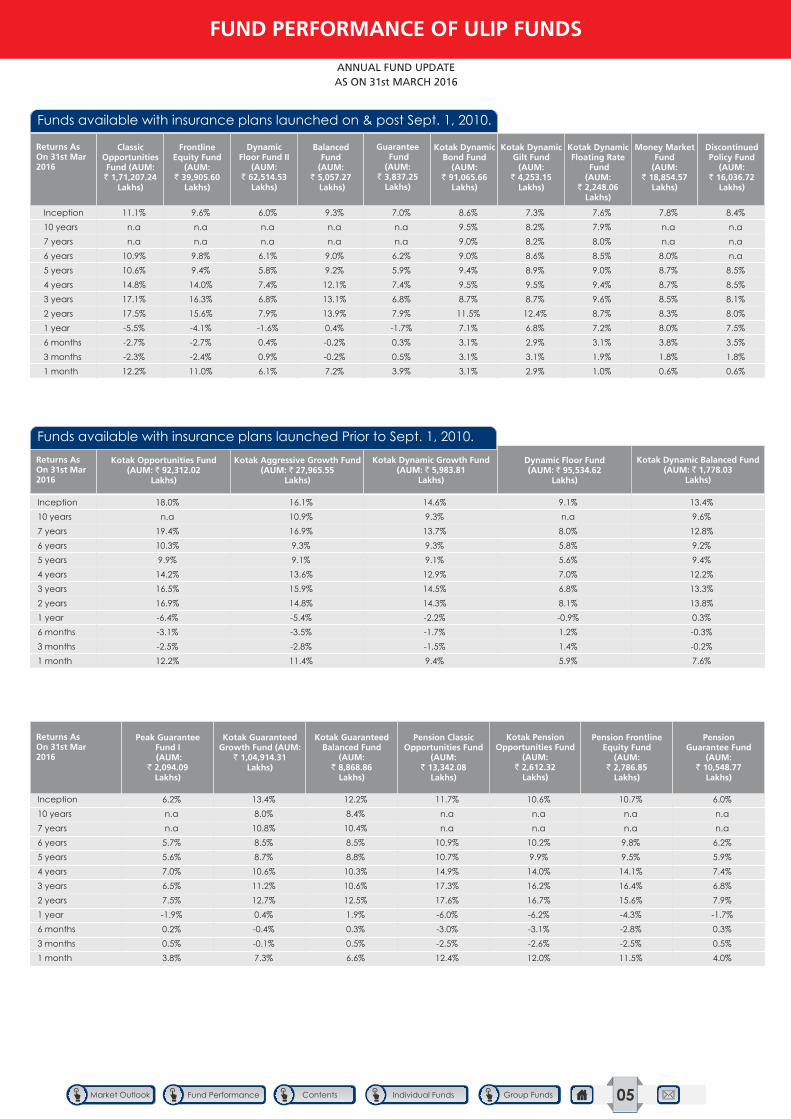
Returns As On 31st Mar 2016
Returns As On 31st Mar 2016
ClassicOpportunities Fund (AUM: ` 1,71,207.24
Lakhs)
Peak Guarantee Fund I (AUM:
` 2,094.09Lakhs)
Frontline Equity Fund
(AUM: ` 39,905.60
Lakhs)
Kotak Guaranteed Growth Fund (AUM:
` 1,04,914.31Lakhs)
Discontinued Policy Fund
(AUM: ` 16,036.72
Lakhs)
Money Market Fund
(AUM: ` 18,854.57
Lakhs)
Kotak Dynamic Gilt Fund
(AUM: ` 4,253.15
Lakhs)
Pension Guarantee Fund
(AUM: ` 10,548.77
Lakhs)
Kotak Dynamic Bond Fund
(AUM: ` 91,065.66
Lakhs)
Pension Frontline Equity Fund
(AUM: ` 2,786.85
Lakhs)
Guarantee Fund(AUM:
` 3,837.25Lakhs)
Kotak PensionOpportunities Fund
(AUM: ` 2,612.32
Lakhs)
BalancedFund
(AUM: ` 5,057.27
Lakhs)
Pension Classic Opportunities Fund
(AUM: ` 13,342.08
Lakhs)
DynamicFloor Fund II
(AUM: ` 62,514.53
Lakhs)
Kotak Guaranteed Balanced Fund
(AUM: ` 8,868.86
Lakhs)
Kotak Dynamic Floating Rate
Fund(AUM:
` 2,248.06Lakhs)
Returns As On 31st Mar 2016
Kotak Opportunities Fund(AUM: ` 92,312.02
Lakhs)
Kotak Aggressive Growth Fund(AUM: 27,965.55
Lakhs)`
Kotak Dynamic Balanced Fund(AUM: ` 1,778.03
Lakhs)
Dynamic Floor Fund(AUM: ` 95,534.62
Lakhs)
Kotak Dynamic Growth Fund(AUM: 5,983.81
Lakhs)`
Inception
10 years
7 years
6 years
5 years
4 years
3 years
2 years
1 year
6 months
3 months
1 month
Inception
10 years
7 years
6 years
5 years
4 years
3 years
2 years
1 year
6 months
3 months
1 month
Inception
10 years
7 years
6 years
5 years
4 years
3 years
2 years
1 year
6 months
3 months
1 month
6.2%
n.a
n.a
5.7%
5.6%
7.0%
6.5%
7.5%
-1.9%
0.2%
0.5%
3.8%
18.0%
n.a
19.4%
10.3%
9.9%
14.2%
16.5%
16.9%
-6.4%
-3.1%
-2.5%
12.2%
11.1%
n.a
n.a
10.9%
10.6%
14.8%
17.1%
17.5%
-5.5%
-2.7%
-2.3%
12.2%
9.6%
n.a
n.a
9.8%
9.4%
14.0%
16.3%
15.6%
-4.1%
-2.7%
-2.4%
11.0%
9.3%
n.a
n.a
9.0%
9.2%
12.1%
13.1%
13.9%
0.4%
-0.2%
-0.2%
7.2%
8.6%
9.5%
9.0%
9.0%
9.4%
9.5%
8.7%
11.5%
7.1%
3.1%
3.1%
3.1%
7.8%
n.a
n.a
8.0%
8.7%
8.7%
8.5%
8.3%
8.0%
3.8%
1.8%
0.6%
7.6%
7.9%
8.0%
8.5%
9.0%
9.4%
9.6%
8.7%
7.2%
3.1%
1.9%
1.0%
8.4%
n.a
n.a
n.a
8.5%
8.5%
8.1%
8.0%
7.5%
3.5%
1.8%
0.6%
6.0%
n.a
n.a
6.1%
5.8%
7.4%
6.8%
7.9%
-1.6%
0.4%
0.9%
6.1%
7.0%
n.a
n.a
6.2%
5.9%
7.4%
6.8%
7.9%
-1.7%
0.3%
0.5%
3.9%
7.3%
8.2%
8.2%
8.6%
8.9%
9.5%
8.7%
12.4%
6.8%
2.9%
3.1%
2.9%
16.1%
10.9%
16.9%
9.3%
9.1%
13.6%
15.9%
14.8%
-5.4%
-3.5%
-2.8%
11.4%
14.6%
9.3%
13.7%
9.3%
9.1%
12.9%
14.5%
14.3%
-2.2%
-1.7%
-1.5%
9.4%
9.1%
n.a
8.0%
5.8%
5.6%
7.0%
6.8%
8.1%
-0.9%
1.2%
1.4%
5.9%
13.4%
9.6%
12.8%
9.2%
9.4%
12.2%
13.3%
13.8%
0.3%
-0.3%
-0.2%
7.6%
13.4%
8.0%
10.8%
8.5%
8.7%
10.6%
11.2%
12.7%
0.4%
-0.4%
-0.1%
7.3%
12.2%
8.4%
10.4%
8.5%
8.8%
10.3%
10.6%
12.5%
1.9%
0.3%
0.5%
6.6%
11.7%
n.a
n.a
10.9%
10.7%
14.9%
17.3%
17.6%
-6.0%
-3.0%
-2.5%
12.4%
10.6%
n.a
n.a
10.2%
9.9%
14.0%
16.2%
16.7%
-6.2%
-3.1%
-2.6%
12.0%
10.7%
n.a
n.a
9.8%
9.5%
14.1%
16.4%
15.6%
-4.3%
-2.8%
-2.5%
11.5%
6.0%
n.a
n.a
6.2%
5.9%
7.4%
6.8%
7.9%
-1.7%
0.3%
0.5%
4.0%
Funds available with insurance plans launched on & post Sept. 1, 2010.
Funds available with insurance plans launched Prior to Sept. 1, 2010.
05
FUND PERFORMANCE OF ULIP FUNDS
ANNUAL FUND UPDATE AS ON 31st MARCH 2016
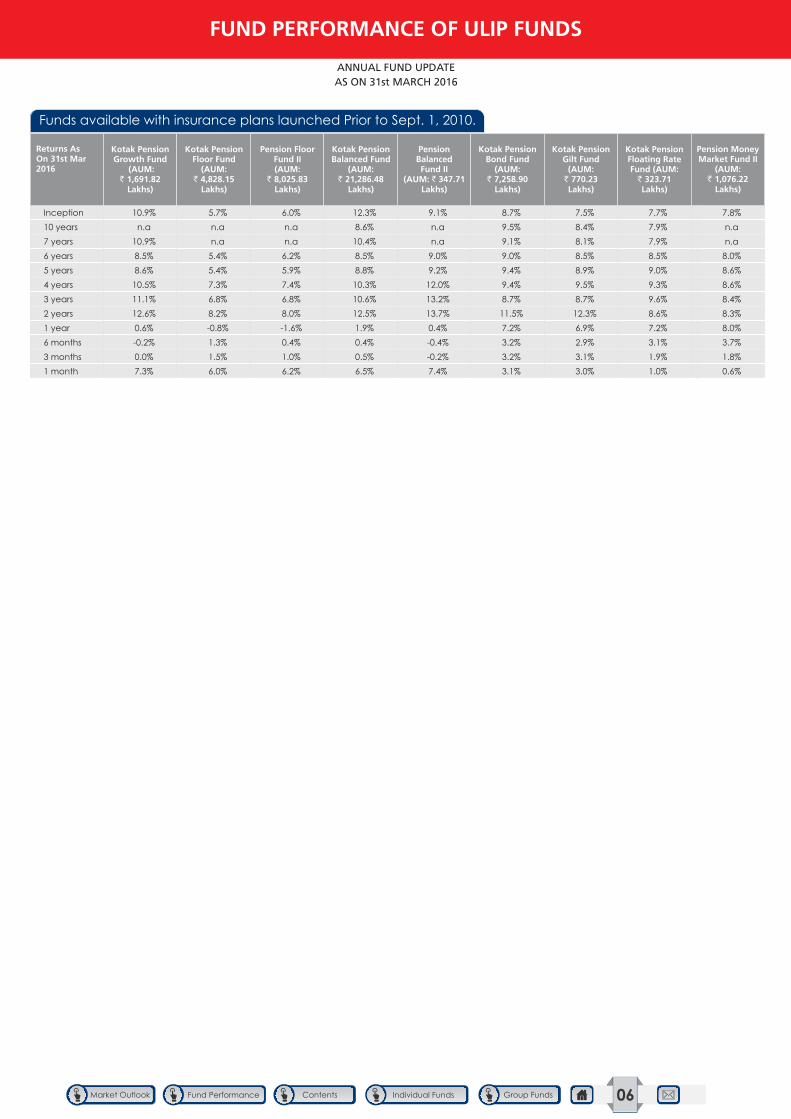
Returns As On 31st Mar 2016
Kotak Pension Growth Fund
(AUM: ` 1,691.82
Lakhs)
Kotak Pension Floor Fund
(AUM: ` 4,828.15
Lakhs)
Pension Money Market Fund II
(AUM: ` 1,076.22
Lakhs)
Kotak Pension Gilt Fund
(AUM: ` 770.23Lakhs)
Kotak Pension Bond Fund
(AUM: ` 7,258.90
Lakhs)
PensionBalancedFund II
(AUM: ` 347.71Lakhs)
Kotak Pension Balanced Fund
(AUM: ` 21,286.48
Lakhs)
Pension Floor Fund II(AUM:
` 8,025.83Lakhs)
Kotak PensionFloating RateFund (AUM:
` 323.71Lakhs)
Inception
10 years
7 years
6 years
5 years
4 years
3 years
2 years
1 year
6 months
3 months
1 month
10.9%
n.a
10.9%
8.5%
8.6%
10.5%
11.1%
12.6%
0.6%
-0.2%
0.0%
7.3%
12.3%
8.6%
10.4%
8.5%
8.8%
10.3%
10.6%
12.5%
1.9%
0.4%
0.5%
6.5%
7.5%
8.4%
8.1%
8.5%
8.9%
9.5%
8.7%
12.3%
6.9%
2.9%
3.1%
3.0%
7.8%
n.a
n.a
8.0%
8.6%
8.6%
8.4%
8.3%
8.0%
3.7%
1.8%
0.6%
8.7%
9.5%
9.1%
9.0%
9.4%
9.4%
8.7%
11.5%
7.2%
3.2%
3.2%
3.1%
6.0%
n.a
n.a
6.2%
5.9%
7.4%
6.8%
8.0%
-1.6%
0.4%
1.0%
6.2%
9.1%
n.a
n.a
9.0%
9.2%
12.0%
13.2%
13.7%
0.4%
-0.4%
-0.2%
7.4%
7.7%
7.9%
7.9%
8.5%
9.0%
9.3%
9.6%
8.6%
7.2%
3.1%
1.9%
1.0%
5.7%
n.a
n.a
5.4%
5.4%
7.3%
6.8%
8.2%
-0.8%
1.3%
1.5%
6.0%
Funds available with insurance plans launched Prior to Sept. 1, 2010.
06
FUND PERFORMANCE OF ULIP FUNDS
ANNUAL FUND UPDATE AS ON 31st MARCH 2016
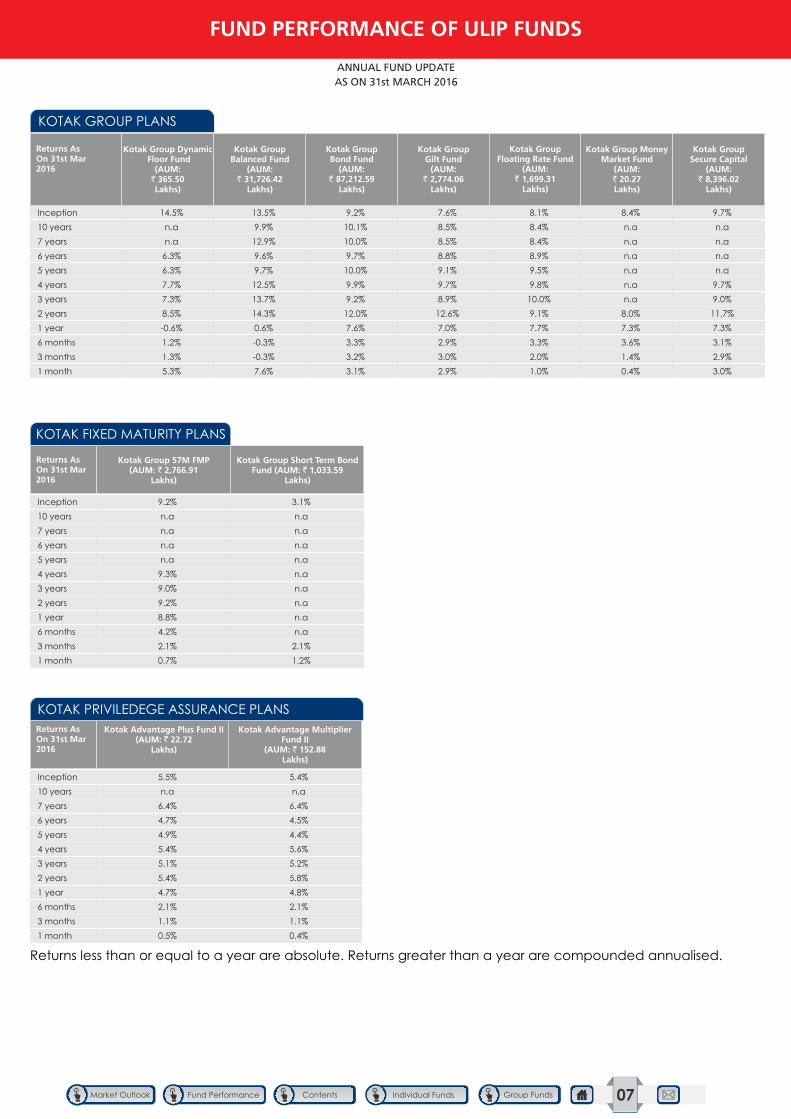
Returns As On 31st Mar 2016
Kotak Group Dynamic Floor Fund
(AUM: ` 365.50Lakhs)
Kotak Group Balanced Fund
(AUM: ` 31,726.42
Lakhs)
Kotak Group Secure Capital
(AUM: ` 8,396.02
Lakhs)
Kotak Group Money Market Fund
(AUM: ` 20.27Lakhs)
Kotak Group Floating Rate Fund
(AUM: ` 1,699.31
Lakhs)
Kotak Group Gilt Fund
(AUM: ` 2,774.06
Lakhs)
Kotak Group Bond Fund
(AUM: ` 87,212.59
Lakhs)
Returns As On 31st Mar 2016
Kotak Group 57M FMP(AUM: ` 2,766.91
Lakhs)
Kotak Group Short Term Bond Fund (AUM: 1,033.59
Lakhs)`
Returns As On 31st Mar 2016
Kotak Advantage Plus Fund II(AUM: ` 22.72
Lakhs)
Returns less than or equal to a year are absolute. Returns greater than a year are compounded annualised.
Kotak Advantage Multiplier Fund II
(AUM: 152.88Lakhs)
`
Inception
10 years
7 years
6 years
5 years
4 years
3 years
2 years
1 year
6 months
3 months
1 month
14.5%
n.a
n.a
6.3%
6.3%
7.7%
7.3%
8.5%
-0.6%
1.2%
1.3%
5.3%
9.2%
10.1%
10.0%
9.7%
10.0%
9.9%
9.2%
12.0%
7.6%
3.3%
3.2%
3.1%
8.1%
8.4%
8.4%
8.9%
9.5%
9.8%
10.0%
9.1%
7.7%
3.3%
2.0%
1.0%
9.7%
n.a
n.a
n.a
n.a
9.7%
9.0%
11.7%
7.3%
3.1%
2.9%
3.0%
13.5%
9.9%
12.9%
9.6%
9.7%
12.5%
13.7%
14.3%
0.6%
-0.3%
-0.3%
7.6%
7.6%
8.5%
8.5%
8.8%
9.1%
9.7%
8.9%
12.6%
7.0%
2.9%
3.0%
2.9%
8.4%
n.a
n.a
n.a
n.a
n.a
n.a
8.0%
7.3%
3.6%
1.4%
0.4%
Inception
10 years
7 years
6 years
5 years
4 years
3 years
2 years
1 year
6 months
3 months
1 month
Inception
10 years
7 years
6 years
5 years
4 years
3 years
2 years
1 year
6 months
3 months
1 month
9.2%
n.a
n.a
n.a
n.a
9.3%
9.0%
9.2%
8.8%
4.2%
2.1%
0.7%
5.5%
n.a
6.4%
4.7%
4.9%
5.4%
5.1%
5.4%
4.7%
2.1%
1.1%
0.5%
5.4%
n.a
6.4%
4.5%
4.4%
5.6%
5.2%
5.8%
4.8%
2.1%
1.1%
0.4%
3.1%
n.a
n.a
n.a
n.a
n.a
n.a
n.a
n.a
n.a
2.1%
1.2%
KOTAK GROUP PLANS
KOTAK FIXED MATURITY PLANS
KOTAK PRIVILEDEGE ASSURANCE PLANS
07
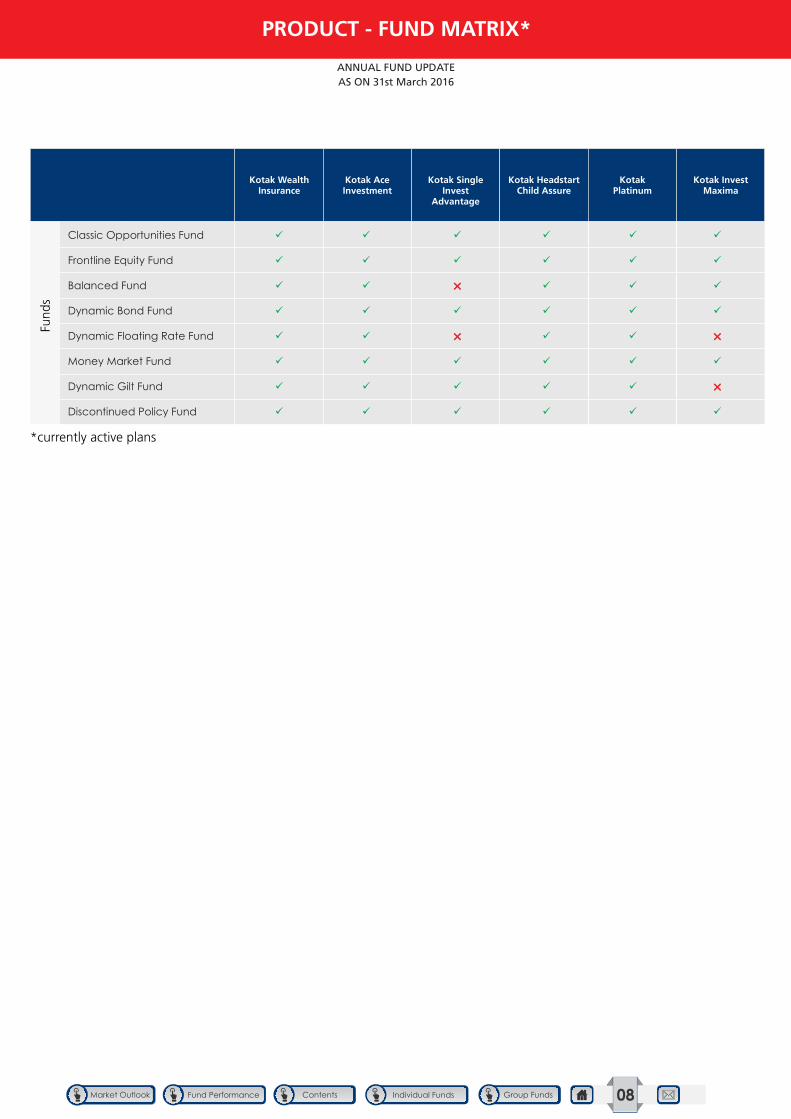
PRODUCT - FUND MATRIX*
ANNUAL FUND UPDATE AS ON 31st March 2016
Kotak WealthInsurance
Kotak AceInvestment
Kotak Invest Maxima
Kotak Platinum
Kotak HeadstartChild Assure
Kotak Single Invest
Advantage
*currently active plans
Fund
s
Classic Opportunities Fund
Frontline Equity Fund
Balanced Fund
Dynamic Bond Fund
Dynamic Floating Rate Fund
Money Market Fund
Dynamic Gilt Fund
Discontinued Policy Fund
ü ü ü ü ü ü
ü ü ü ü ü ü
ü ü ü ü ü
ü ü ü ü ü ü
ü ü ü ü
ü ü ü ü ü ü
ü ü ü ü ü
ü ü ü ü ü ü
r
r r
r
08
INDIVIDUAL FUNDS
ANNUAL FUND UPDATE AS ON 31st March 2016
CLASSIC OPPORTUNITIES FUND
FRONTLINE EQUITY FUND
DYNAMIC FLOORFUND II
BALANCED FUND
KOTAK GUARANTEED BALANCED FUND
PENSION CLASSIC OPPORTUNITIES FUND
KOTAK PENSION OPPORTUNITIES FUND
PENSION FRONTLINE EQUITY FUND
KOTAK OPPORTUNITIES FUND
KOTAK AGGRESSIVE GROWTH FUND
GUARANTEE FUND
MONEY MARKET FUND
PENSION GUARANTEE FUND
KOTAK PENSION GROWTH FUND
KOTAK PENSION FLOOR FUND
PENSION FLOOR FUND II
KOTAK DYNAMIC GROWTH FUND
DYNAMIC FLOOR FUND
KOTAK DYNAMIC BALANCED FUND
KOTAK DYNAMIC BOND FUND
KOTAK PENSION BALANCED FUND
PENSION BALANCED FUND II
KOTAK PENSION BOND FUND
KOTAK PENSION GILT FUND
KOTAK DYNAMIC GILT FUND
KOTAK DYNAMIC FLOATING RATE FUND
PEAK GUARANTEE FUND I
KOTAK GUARANTEED GROWTH FUND
KOTAK PENSION FLOATING RATE FUND
KOTAK ADVANTAGE MULTIPLIER FUND II
PENSION MONEY MARKET FUND II
DISCONTINUED POLICY FUND
KOTAK ADVANTAGE PLUS FUND II
09

GROUP FUND
Fund Strategy
Aims to maximize opportunity for you through long-term capital growth, by holding a significant portion in a diversified and flexible mix of large / medium sized company equities
Approved Asset Allocation
Benchmark Details
AUM (in ` Lakhs)
Date of Inception
Equity : 75-100%
Non Equity : 0-25%
Equity - 100% (BSE 200)
1,71,207.24
th16 December 2009
Performance Meter Classic
Opportunities Fund
Benchmark
Past performance is not necessarily indicative of
future performance
Inception 11.1% 7.1%
6 years 10.9% 6.7%
5 years 10.6% 6.5%
4 years 14.8% 10.9%
3 years 17.1% 12.5%
2 years 17.5% 10.3%
1 year -5.5% -7.9%
6 months -2.7% -2.8%
3 months -2.3% -3.5%
1 month 12.2% 10.6%
Infosys Ltd 8.17%
HDFC Bank Ltd 6.36%
IndusInd Bank Limited 3.76%
Kotak Banking ETF - Dividend Payout Option 3.51%
ICICI Bank Ltd 3.19%
Maruti Suzuki India Ltd 3.02%
Tata Motors Ltd 2.91%
Axis Bank Ltd 2.86%
ITC Ltd 2.85%
Larsen And Toubro Ltd 2.82%
YES BANK LTD 2.68%
Britannia Industries Ltd 2.64%
Reliance Industries Ltd 2.56%
Sun Pharmaceuticals Ltd 2.53%
UltraTech Cement Ltd 2.42%
Hindustan Petroleum Corporation Ltd 2.27%
HCL Technologies Ltd 2.04%
Shree Cement Ltd 1.83%
Tata Consultancy Services Ltd 1.74%
Bharat Petroleum Corporation Ltd 1.62%
Others (Details in the Annexure) 33.22%
EQUITY 95.01%
Equity Portfolio % to Fund
Axis Bank CD - 28.04.2016 0.76%
ICICI Bank CD - 31.05.16 0.56%
Corporation Bank CD - 02.05.2016 0.53%
SBBJ CD - 14.09.2016 0.52%
IDBI Bank CD - 05.04.16 0.47%
Canara Bank CD - 07.03.2017 0.27%
State Bank of Patiala CD - 28.12.2016 0.18%
Axis Bank CD - 27.10.2016 0.02%
8.00% HDFC Bank FD NSE - 08.08.2016 0.01%
8.00% HDFC Bank FD NSE - 24.07.2016 0.01%
CBLO Investments 0.01%
8.00% HDFC Bank FD BSE - 24.07.2016 0.00%
Current Asset/Liabilities 1.66%
Others 0.00%
DEBT 4.99%
Debt Portfolio % to Fund
ANNUAL FUND UPDATE AS ON 31st March 2016
CLASSIC OPPORTUNITIES FUND (ULIF-033-16/12/09-CLAOPPFND-107)
INDIVIDUAL FUND
Assets Class % To Fund
Debt Ratings Profile
Allocation by Sector - Equity
Debt Maturity Profile
95.01%
0.02%4.97%
Equity
NCD, Floaters, ZCB,
Long Term Deposits
CD,CP,T Bills,
MF,Repo,CBLO,NCA
99.27%
0.55% 0.18%
A1+
Fixed Deposit
CBLO
100.00%
7 Year & Above
3 to <7 Year
1 to <3 Year
< 1 Year
1.49%
2.09%
5.54%
6.11%
6.46%
7.94%
8.28%
8.32%
11.24%
11.95%
25.60%
Media
Fertilisers
Capital Goods & Engineering
Cement & Cement Products
Pharma
Oil & Gas
FMCG
Others
Auto & Auto Ancillary
Information Tech
Banking & Finance
10
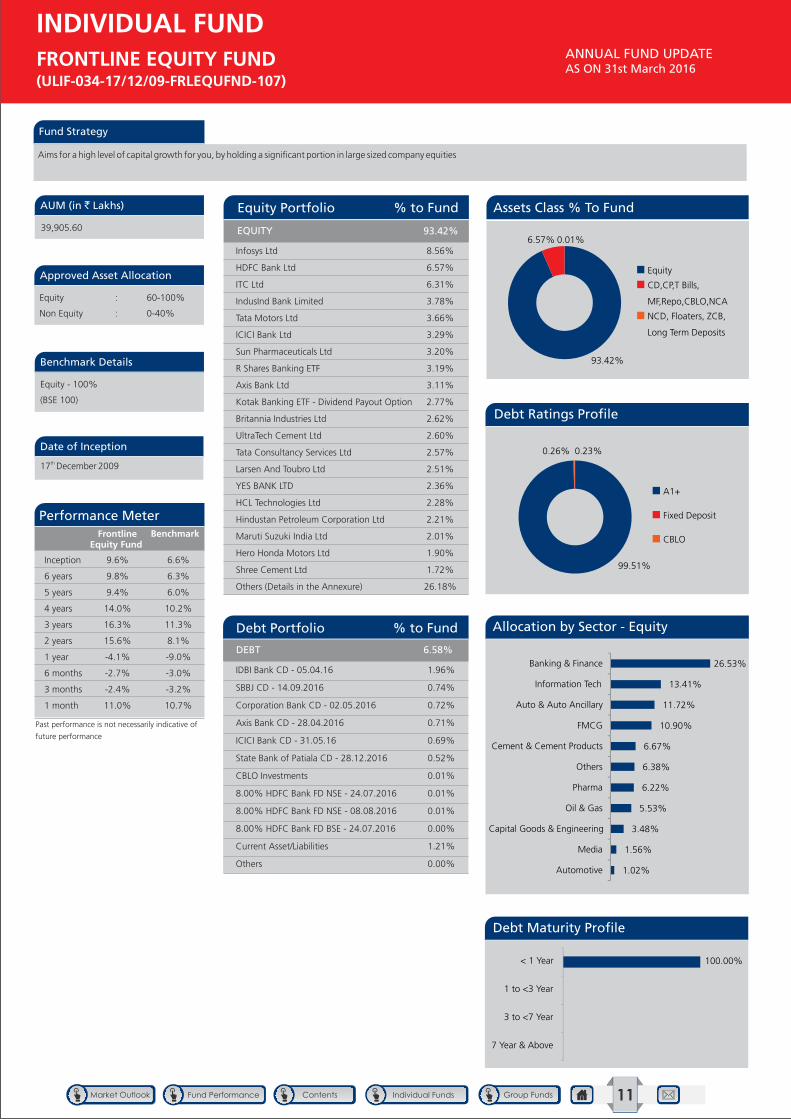
Fund Strategy
Aims for a high level of capital growth for you, by holding a significant portion in large sized company equities
Performance Meter
Approved Asset Allocation
Benchmark Details
AUM (in ` Lakhs)
Date of Inception
Equity : 60-100%
Non Equity : 0-40%
Equity - 100%
(BSE 100)
39,905.60
Frontline Equity Fund
Benchmark
Past performance is not necessarily indicative of
future performance
Inception 9.6% 6.6%
6 years 9.8% 6.3%
5 years 9.4% 6.0%
4 years 14.0% 10.2%
3 years 16.3% 11.3%
2 years 15.6% 8.1%
1 year -4.1% -9.0%
6 months -2.7% -3.0%
3 months -2.4% -3.2%
1 month 11.0% 10.7%
GROUP FUND
ANNUAL FUND UPDATE AS ON 31st March 2016
FRONTLINE EQUITY FUND (ULIF-034-17/12/09-FRLEQUFND-107)
th17 December 2009
Infosys Ltd 8.56%
HDFC Bank Ltd 6.57%
ITC Ltd 6.31%
IndusInd Bank Limited 3.78%
Tata Motors Ltd 3.66%
ICICI Bank Ltd 3.29%
Sun Pharmaceuticals Ltd 3.20%
R Shares Banking ETF 3.19%
Axis Bank Ltd 3.11%
Kotak Banking ETF - Dividend Payout Option 2.77%
Britannia Industries Ltd 2.62%
UltraTech Cement Ltd 2.60%
Tata Consultancy Services Ltd 2.57%
Larsen And Toubro Ltd 2.51%
YES BANK LTD 2.36%
HCL Technologies Ltd 2.28%
Hindustan Petroleum Corporation Ltd 2.21%
Maruti Suzuki India Ltd 2.01%
Hero Honda Motors Ltd 1.90%
Shree Cement Ltd 1.72%
Others (Details in the Annexure) 26.18%
EQUITY 93.42%
Equity Portfolio % to Fund
IDBI Bank CD - 05.04.16 1.96%
SBBJ CD - 14.09.2016 0.74%
Corporation Bank CD - 02.05.2016 0.72%
Axis Bank CD - 28.04.2016 0.71%
ICICI Bank CD - 31.05.16 0.69%
State Bank of Patiala CD - 28.12.2016 0.52%
CBLO Investments 0.01%
8.00% HDFC Bank FD NSE - 24.07.2016 0.01%
8.00% HDFC Bank FD NSE - 08.08.2016 0.01%
8.00% HDFC Bank FD BSE - 24.07.2016 0.00%
Current Asset/Liabilities 1.21%
Others 0.00%
DEBT 6.58%
Debt Portfolio % to Fund
Assets Class % To Fund
Debt Ratings Profile
Allocation by Sector - Equity
Debt Maturity Profile
93.42%
6.57% 0.01%
Equity
CD,CP,T Bills,
MF,Repo,CBLO,NCA
NCD, Floaters, ZCB,
Long Term Deposits
99.51%
0.26% 0.23%
A1+
Fixed Deposit
CBLO
100.00%
7 Year & Above
3 to <7 Year
1 to <3 Year
< 1 Year
1.02%
1.56%
3.48%
5.53%
6.22%
6.38%
6.67%
10.90%
11.72%
13.41%
26.53%
Automotive
Media
Capital Goods & Engineering
Oil & Gas
Pharma
Others
Cement & Cement Products
FMCG
Auto & Auto Ancillary
Information Tech
Banking & Finance
INDIVIDUAL FUND
11
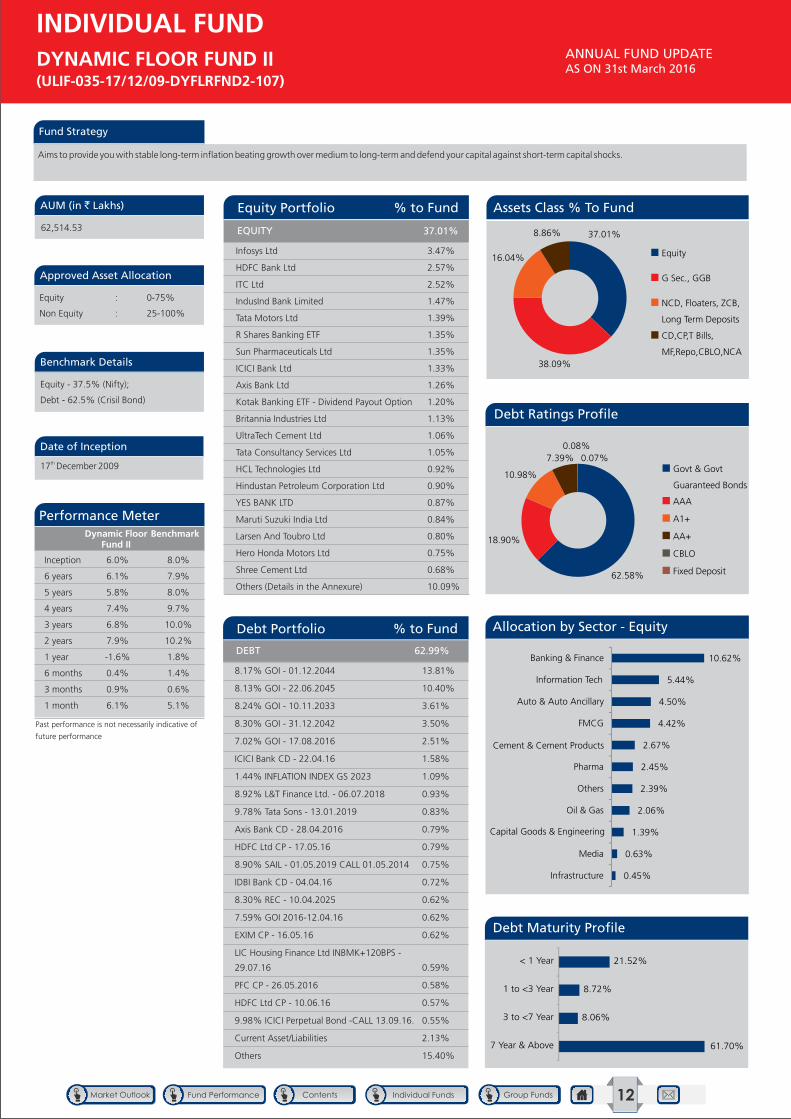
Fund Strategy
Aims to provide you with stable long-term inflation beating growth over medium to long-term and defend your capital against short-term capital shocks.
Performance Meter
Approved Asset Allocation
Benchmark Details
AUM (in ` Lakhs)
Date of Inception
Equity : 0-75%
Non Equity : 25-100%
Equity - 37.5% (Nifty);
Debt - 62.5% (Crisil Bond)
62,514.53
Dynamic Floor Fund II
Benchmark
Infosys Ltd 3.47%
HDFC Bank Ltd 2.57%
ITC Ltd 2.52%
IndusInd Bank Limited 1.47%
Tata Motors Ltd 1.39%
R Shares Banking ETF 1.35%
Sun Pharmaceuticals Ltd 1.35%
ICICI Bank Ltd 1.33%
Axis Bank Ltd 1.26%
Kotak Banking ETF - Dividend Payout Option 1.20%
Britannia Industries Ltd 1.13%
UltraTech Cement Ltd 1.06%
Tata Consultancy Services Ltd 1.05%
HCL Technologies Ltd 0.92%
Hindustan Petroleum Corporation Ltd 0.90%
YES BANK LTD 0.87%
Maruti Suzuki India Ltd 0.84%
Larsen And Toubro Ltd 0.80%
Hero Honda Motors Ltd 0.75%
Shree Cement Ltd 0.68%
Others (Details in the Annexure) 10.09%
EQUITY 37.01%
8.17% GOI - 01.12.2044 13.81%
8.13% GOI - 22.06.2045 10.40%
8.24% GOI - 10.11.2033 3.61%
8.30% GOI - 31.12.2042 3.50%
7.02% GOI - 17.08.2016 2.51%
ICICI Bank CD - 22.04.16 1.58%
1.44% INFLATION INDEX GS 2023 1.09%
8.92% L&T Finance Ltd. - 06.07.2018 0.93%
9.78% Tata Sons - 13.01.2019 0.83%
Axis Bank CD - 28.04.2016 0.79%
HDFC Ltd CP - 17.05.16 0.79%
8.90% SAIL - 01.05.2019 CALL 01.05.2014 0.75%
IDBI Bank CD - 04.04.16 0.72%
8.30% REC - 10.04.2025 0.62%
7.59% GOI 2016-12.04.16 0.62%
EXIM CP - 16.05.16 0.62%
LIC Housing Finance Ltd INBMK+120BPS -
29.07.16 0.59%
PFC CP - 26.05.2016 0.58%
HDFC Ltd CP - 10.06.16 0.57%
9.98% ICICI Perpetual Bond -CALL 13.09.16. 0.55%
Current Asset/Liabilities 2.13%
Others 15.40%
DEBT 62.99%
Debt Portfolio % to Fund
Equity Portfolio % to Fund
Past performance is not necessarily indicative of
future performance
Inception 6.0% 8.0%
6 years 6.1% 7.9%
5 years 5.8% 8.0%
4 years 7.4% 9.7%
3 years 6.8% 10.0%
2 years 7.9% 10.2%
1 year -1.6% 1.8%
6 months 0.4% 1.4%
3 months 0.9% 0.6%
1 month 6.1% 5.1%
GROUP FUND
ANNUAL FUND UPDATE AS ON 31st March 2016
DYNAMIC FLOOR FUND II (ULIF-035-17/12/09-DYFLRFND2-107)
th17 December 2009
Assets Class % To Fund
Debt Ratings Profile
Allocation by Sector - Equity
Debt Maturity Profile
37.01%
38.09%
16.04%
8.86%
Equity
G Sec., GGB
NCD, Floaters, ZCB,
Long Term Deposits
CD,CP,T Bills,
MF,Repo,CBLO,NCA
62.58%
18.90%
10.98%
7.39%0.08%
0.07%Govt & Govt
Guaranteed Bonds
AAA
A1+
AA+
CBLO
Fixed Deposit
61.70%
8.06%
8.72%
21.52%
7 Year & Above
3 to <7 Year
1 to <3 Year
< 1 Year
0.45%
0.63%
1.39%
2.06%
2.39%
2.45%
2.67%
4.42%
4.50%
5.44%
10.62%
Infrastructure
Media
Capital Goods & Engineering
Oil & Gas
Others
Pharma
Cement & Cement Products
FMCG
Auto & Auto Ancillary
Information Tech
Banking & Finance
INDIVIDUAL FUND
12
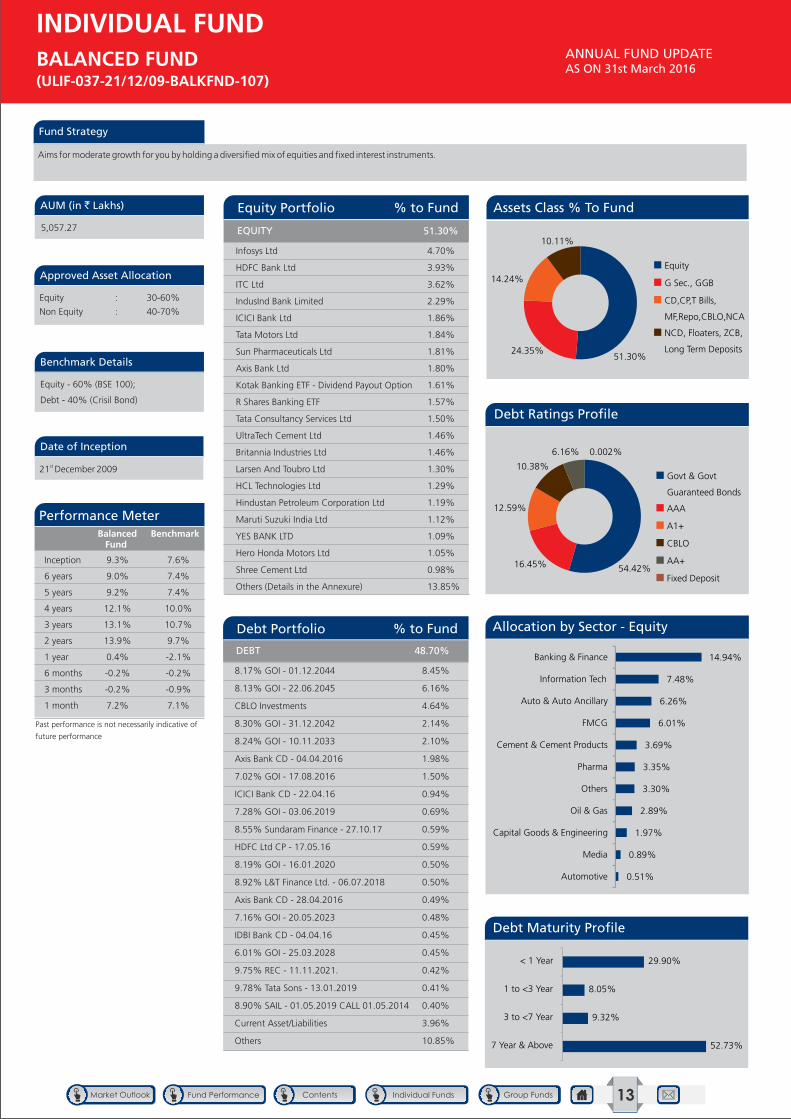
Fund Strategy
Aims for moderate growth for you by holding a diversified mix of equities and fixed interest instruments.
Performance Meter
Approved Asset Allocation
Benchmark Details
AUM (in ` Lakhs)
Date of Inception
Equity : 30-60%
Non Equity : 40-70%
Equity - 60% (BSE 100);
Debt - 40% (Crisil Bond)
5,057.27
st21 December 2009
Balanced Fund
Benchmark
Infosys Ltd 4.70%
HDFC Bank Ltd 3.93%
ITC Ltd 3.62%
IndusInd Bank Limited 2.29%
ICICI Bank Ltd 1.86%
Tata Motors Ltd 1.84%
Sun Pharmaceuticals Ltd 1.81%
Axis Bank Ltd 1.80%
Kotak Banking ETF - Dividend Payout Option 1.61%
R Shares Banking ETF 1.57%
Tata Consultancy Services Ltd 1.50%
UltraTech Cement Ltd 1.46%
Britannia Industries Ltd 1.46%
Larsen And Toubro Ltd 1.30%
HCL Technologies Ltd 1.29%
Hindustan Petroleum Corporation Ltd 1.19%
Maruti Suzuki India Ltd 1.12%
YES BANK LTD 1.09%
Hero Honda Motors Ltd 1.05%
Shree Cement Ltd 0.98%
Others (Details in the Annexure) 13.85%
51.30%
8.17% GOI - 01.12.2044 8.45%
8.13% GOI - 22.06.2045 6.16%
CBLO Investments 4.64%
8.30% GOI - 31.12.2042 2.14%
8.24% GOI - 10.11.2033 2.10%
Axis Bank CD - 04.04.2016 1.98%
7.02% GOI - 17.08.2016 1.50%
ICICI Bank CD - 22.04.16 0.94%
7.28% GOI - 03.06.2019 0.69%
8.55% Sundaram Finance - 27.10.17 0.59%
HDFC Ltd CP - 17.05.16 0.59%
8.19% GOI - 16.01.2020 0.50%
8.92% L&T Finance Ltd. - 06.07.2018 0.50%
Axis Bank CD - 28.04.2016 0.49%
7.16% GOI - 20.05.2023 0.48%
IDBI Bank CD - 04.04.16 0.45%
6.01% GOI - 25.03.2028 0.45%
9.75% REC - 11.11.2021. 0.42%
9.78% Tata Sons - 13.01.2019 0.41%
8.90% SAIL - 01.05.2019 CALL 01.05.2014 0.40%
Current Asset/Liabilities 3.96%
Others 10.85%
DEBT 48.70%
Debt Portfolio % to Fund
Equity Portfolio % to Fund
Past performance is not necessarily indicative of
future performance
Inception 9.3% 7.6%
6 years 9.0% 7.4%
5 years 9.2% 7.4%
4 years 12.1% 10.0%
3 years 13.1% 10.7%
2 years 13.9% 9.7%
1 year 0.4% -2.1%
6 months -0.2% -0.2%
3 months -0.2% -0.9%
1 month 7.2% 7.1%
GROUP FUND
ANNUAL FUND UPDATE AS ON 31st March 2016
BALANCED FUND (ULIF-037-21/12/09-BALKFND-107)
Assets Class % To Fund
Debt Ratings Profile
Allocation by Sector - Equity
Debt Maturity Profile
51.30%
24.35%
14.24%
10.11%
Equity
G Sec., GGB
CD,CP,T Bills,
MF,Repo,CBLO,NCA
NCD, Floaters, ZCB,
Long Term Deposits
54.42%
16.45%
12.59%
10.38% 6.16%
0.002%
Govt & Govt
Guaranteed Bonds
AAA
A1+
CBLO
AA+
Fixed Deposit
52.73%
9.32%
8.05%
29.90%
7 Year & Above
3 to <7 Year
1 to <3 Year
< 1 Year
0.51%
0.89%
1.97%
2.89%
3.30%
3.35%
3.69%
6.01%
6.26%
7.48%
14.94%
Automotive
Media
Capital Goods & Engineering
Oil & Gas
Others
Pharma
Cement & Cement Products
FMCG
Auto & Auto Ancillary
Information Tech
Banking & Finance
EQUITY
INDIVIDUAL FUND
13
Fund Strategy
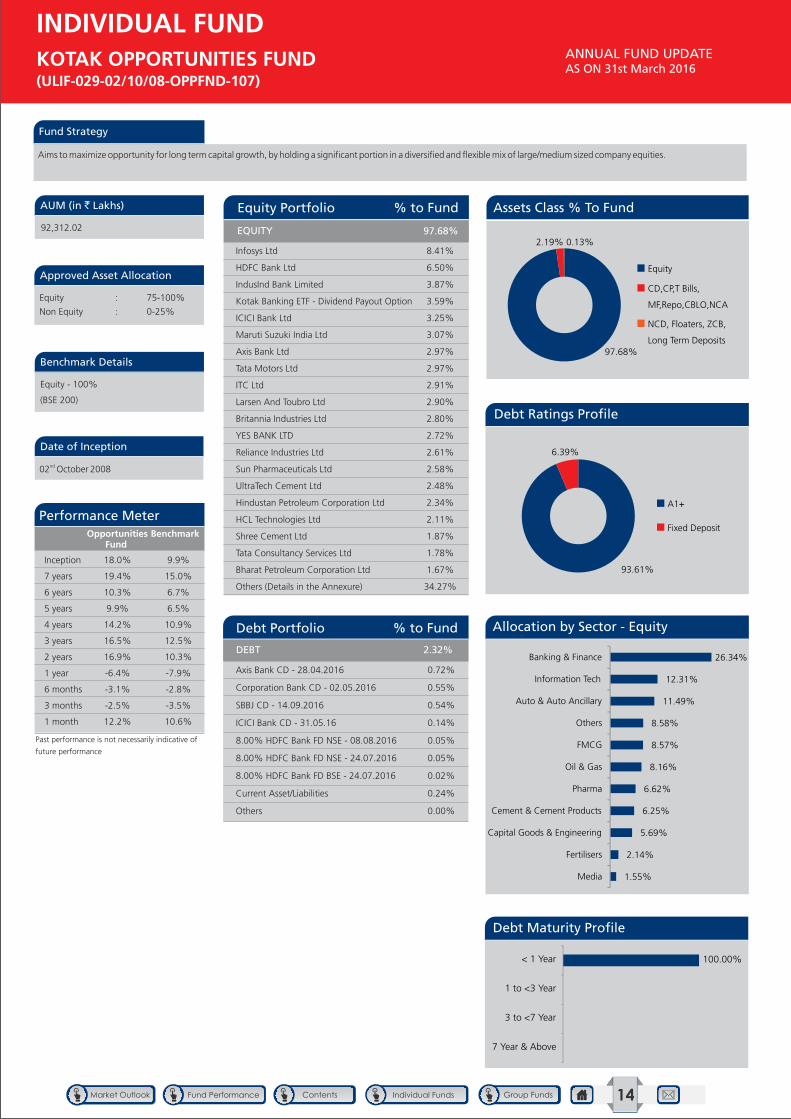
Aims to maximize opportunity for long term capital growth, by holding a significant portion in a diversified and flexible mix of large/medium sized company equities.
Performance Meter
Approved Asset Allocation
Benchmark Details
AUM (in ` Lakhs)
Date of Inception
Equity : 75-100%
Non Equity : 0-25%
Equity - 100%
(BSE 200)
92,312.02
nd02 October 2008
Opportunities Fund
Benchmark
Past performance is not necessarily indicative of
future performance
Inception 18.0% 9.9%
7 years 19.4% 15.0%
6 years 10.3% 6.7%
5 years 9.9% 6.5%
4 years 14.2% 10.9%
3 years 16.5% 12.5%
2 years 16.9% 10.3%
1 year -6.4% -7.9%
6 months -3.1% -2.8%
3 months -2.5% -3.5%
1 month 12.2% 10.6%
ANNUAL FUND UPDATE AS ON 31st March 2016
KOTAK OPPORTUNITIES FUND (ULIF-029-02/10/08-OPPFND-107)
Infosys Ltd 8.41%
HDFC Bank Ltd 6.50%
IndusInd Bank Limited 3.87%
Kotak Banking ETF - Dividend Payout Option 3.59%
ICICI Bank Ltd 3.25%
Maruti Suzuki India Ltd 3.07%
Axis Bank Ltd 2.97%
Tata Motors Ltd 2.97%
ITC Ltd 2.91%
Larsen And Toubro Ltd 2.90%
Britannia Industries Ltd 2.80%
YES BANK LTD 2.72%
Reliance Industries Ltd 2.61%
Sun Pharmaceuticals Ltd 2.58%
UltraTech Cement Ltd 2.48%
Hindustan Petroleum Corporation Ltd 2.34%
HCL Technologies Ltd 2.11%
Shree Cement Ltd 1.87%
Tata Consultancy Services Ltd 1.78%
Bharat Petroleum Corporation Ltd 1.67%
Others (Details in the Annexure) 34.27%
97.68%
Equity Portfolio % to Fund
DEBT 2.32%
Debt Portfolio % to Fund
Assets Class % To Fund
Debt Ratings Profile
Allocation by Sector - Equity
Debt Maturity Profile
97.68%
2.19% 0.13%
Equity
CD,CP,T Bills,
MF,Repo,CBLO,NCA
NCD, Floaters, ZCB,
Long Term Deposits
93.61%
6.39%
A1+
Fixed Deposit
1.55%
2.14%
5.69%
6.25%
6.62%
8.16%
8.57%
8.58%
11.49%
12.31%
26.34%
Media
Fertilisers
Capital Goods & Engineering
Cement & Cement Products
Pharma
Oil & Gas
FMCG
Others
Auto & Auto Ancillary
Information Tech
Banking & FinanceAxis Bank CD - 28.04.2016 0.72%
Corporation Bank CD - 02.05.2016 0.55%
SBBJ CD - 14.09.2016 0.54%
ICICI Bank CD - 31.05.16 0.14%
8.00% HDFC Bank FD NSE - 08.08.2016 0.05%
8.00% HDFC Bank FD NSE - 24.07.2016 0.05%
8.00% HDFC Bank FD BSE - 24.07.2016 0.02%
Current Asset/Liabilities 0.24%
Others 0.00%
EQUITY
INDIVIDUAL FUND
100.00%
7 Year & Above
3 to <7 Year
1 to <3 Year
< 1 Year
14
Fund Strategy
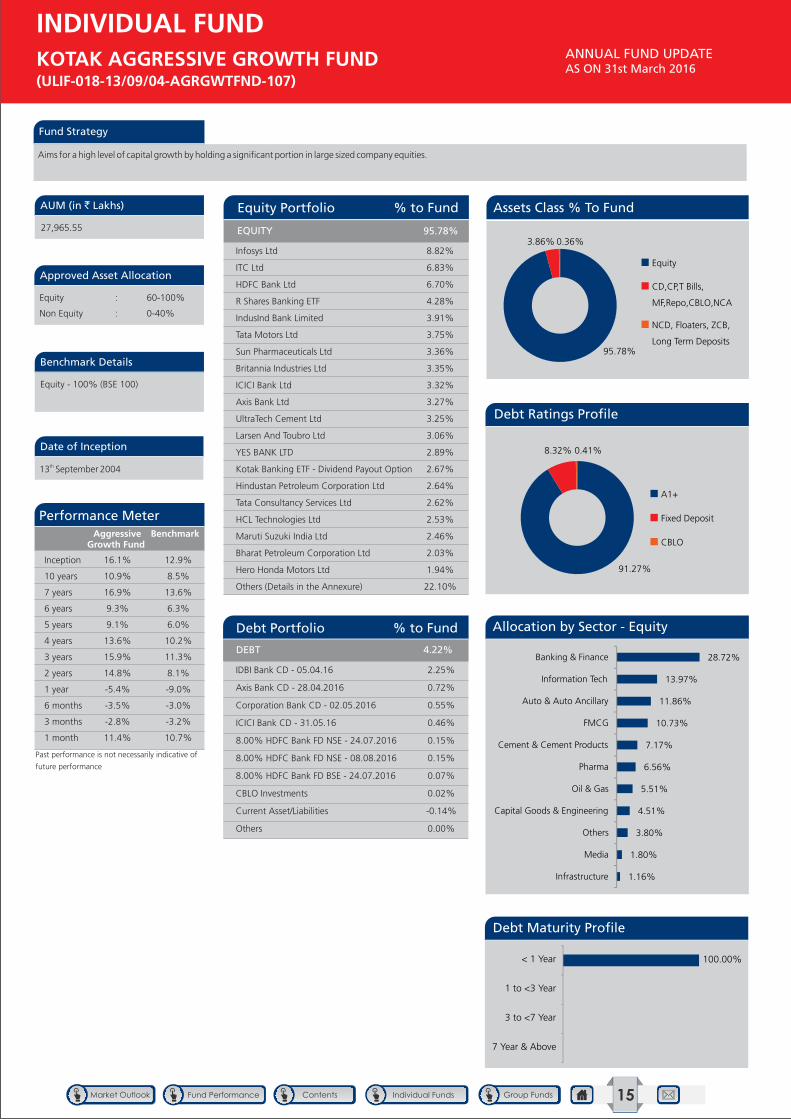
Aims for a high level of capital growth by holding a significant portion in large sized company equities.
Performance Meter
Approved Asset Allocation
Benchmark Details
AUM (in ` Lakhs)
Date of Inception
Equity : 60-100%
Non Equity : 0-40%
Equity - 100% (BSE 100)
27,965.55
th13 September 2004
Aggressive Growth Fund
Benchmark
Past performance is not necessarily indicative of
future performance
Inception 16.1% 12.9%
10 years 10.9% 8.5%
7 years 16.9% 13.6%
6 years 9.3% 6.3%
5 years 9.1% 6.0%
4 years 13.6% 10.2%
3 years 15.9% 11.3%
2 years 14.8% 8.1%
1 year -5.4% -9.0%
6 months -3.5% -3.0%
3 months -2.8% -3.2%
1 month 11.4% 10.7%
ANNUAL FUND UPDATE AS ON 31st March 2016
KOTAK AGGRESSIVE GROWTH FUND (ULIF-018-13/09/04-AGRGWTFND-107)
INDIVIDUAL FUND
Infosys Ltd 8.82%
ITC Ltd 6.83%
HDFC Bank Ltd 6.70%
R Shares Banking ETF 4.28%
IndusInd Bank Limited 3.91%
Tata Motors Ltd 3.75%
Sun Pharmaceuticals Ltd 3.36%
Britannia Industries Ltd 3.35%
ICICI Bank Ltd 3.32%
Axis Bank Ltd 3.27%
UltraTech Cement Ltd 3.25%
Larsen And Toubro Ltd 3.06%
YES BANK LTD 2.89%
Kotak Banking ETF - Dividend Payout Option 2.67%
Hindustan Petroleum Corporation Ltd 2.64%
Tata Consultancy Services Ltd 2.62%
HCL Technologies Ltd 2.53%
Maruti Suzuki India Ltd 2.46%
Bharat Petroleum Corporation Ltd 2.03%
Hero Honda Motors Ltd 1.94%
Others (Details in the Annexure) 22.10%
95.78%
Equity Portfolio % to Fund
IDBI Bank CD - 05.04.16 2.25%
Axis Bank CD - 28.04.2016 0.72%
Corporation Bank CD - 02.05.2016 0.55%
ICICI Bank CD - 31.05.16 0.46%
8.00% HDFC Bank FD NSE - 24.07.2016 0.15%
8.00% HDFC Bank FD NSE - 08.08.2016 0.15%
8.00% HDFC Bank FD BSE - 24.07.2016 0.07%
CBLO Investments 0.02%
Current Asset/Liabilities -0.14%
Others 0.00%
DEBT 4.22%
Debt Portfolio % to Fund
Assets Class % To Fund
Debt Ratings Profile
Allocation by Sector - Equity
Debt Maturity Profile
95.78%
3.86% 0.36%
Equity
CD,CP,T Bills,
MF,Repo,CBLO,NCA
NCD, Floaters, ZCB,
Long Term Deposits
91.27%
8.32% 0.41%
A1+
Fixed Deposit
CBLO
1.16%
1.80%
3.80%
4.51%
5.51%
6.56%
7.17%
10.73%
11.86%
13.97%
28.72%
Infrastructure
Media
Others
Capital Goods & Engineering
Oil & Gas
Pharma
Cement & Cement Products
FMCG
Auto & Auto Ancillary
Information Tech
Banking & Finance
EQUITY
100.00%
7 Year & Above
3 to <7 Year
1 to <3 Year
< 1 Year
15
Fund Strategy
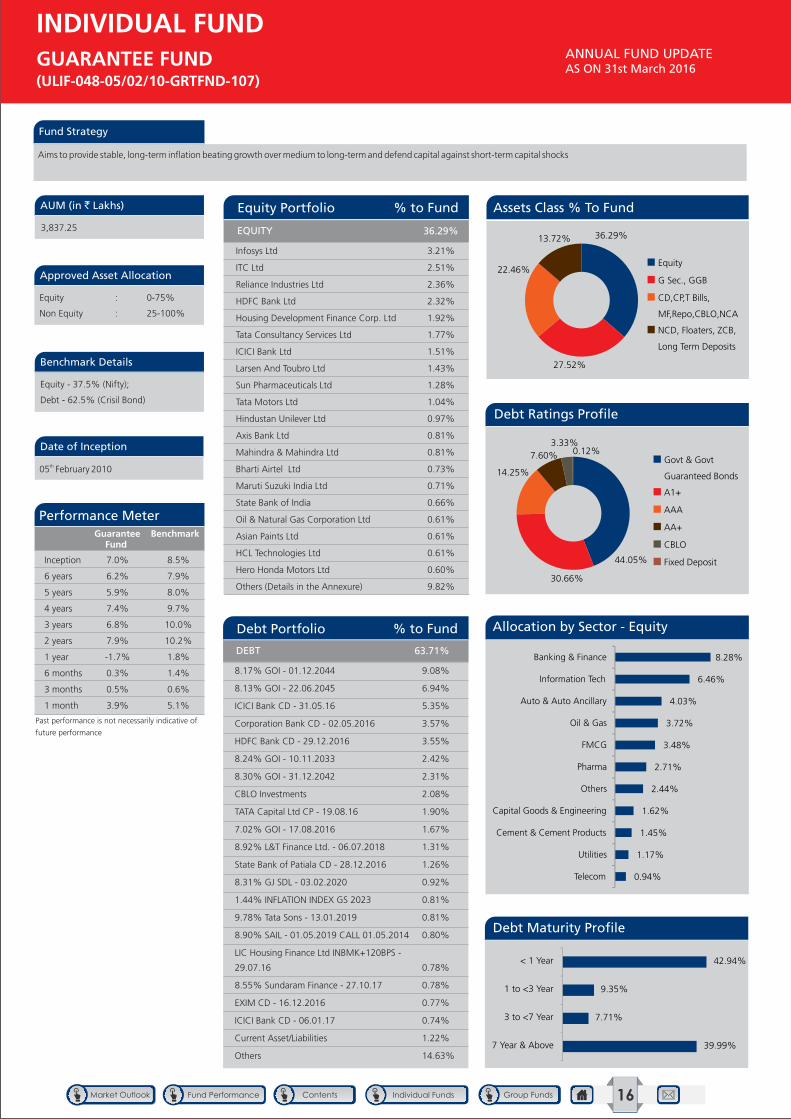
Aims to provide stable, long-term inflation beating growth over medium to long-term and defend capital against short-term capital shocks
Performance Meter
Approved Asset Allocation
Benchmark Details
AUM (in ` Lakhs)
Date of Inception
Equity : 0-75%
Non Equity : 25-100%
Equity - 37.5% (Nifty);
Debt - 62.5% (Crisil Bond)
3,837.25
th05 February 2010
Guarantee Fund
Benchmark
Infosys Ltd 3.21%
ITC Ltd 2.51%
Reliance Industries Ltd 2.36%
HDFC Bank Ltd 2.32%
Housing Development Finance Corp. Ltd 1.92%
Tata Consultancy Services Ltd 1.77%
ICICI Bank Ltd 1.51%
Larsen And Toubro Ltd 1.43%
Sun Pharmaceuticals Ltd 1.28%
Tata Motors Ltd 1.04%
Hindustan Unilever Ltd 0.97%
Axis Bank Ltd 0.81%
Mahindra & Mahindra Ltd 0.81%
Bharti Airtel Ltd 0.73%
Maruti Suzuki India Ltd 0.71%
State Bank of India 0.66%
Oil & Natural Gas Corporation Ltd 0.61%
Asian Paints Ltd 0.61%
HCL Technologies Ltd 0.61%
Hero Honda Motors Ltd 0.60%
Others (Details in the Annexure) 9.82%
36.29%
8.17% GOI - 01.12.2044 9.08%
8.13% GOI - 22.06.2045 6.94%
ICICI Bank CD - 31.05.16 5.35%
Corporation Bank CD - 02.05.2016 3.57%
HDFC Bank CD - 29.12.2016 3.55%
8.24% GOI - 10.11.2033 2.42%
8.30% GOI - 31.12.2042 2.31%
CBLO Investments 2.08%
TATA Capital Ltd CP - 19.08.16 1.90%
7.02% GOI - 17.08.2016 1.67%
8.92% L&T Finance Ltd. - 06.07.2018 1.31%
State Bank of Patiala CD - 28.12.2016 1.26%
8.31% GJ SDL - 03.02.2020 0.92%
1.44% INFLATION INDEX GS 2023 0.81%
9.78% Tata Sons - 13.01.2019 0.81%
8.90% SAIL - 01.05.2019 CALL 01.05.2014 0.80%
LIC Housing Finance Ltd INBMK+120BPS -
29.07.16 0.78%
8.55% Sundaram Finance - 27.10.17 0.78%
EXIM CD - 16.12.2016 0.77%
ICICI Bank CD - 06.01.17 0.74%
Current Asset/Liabilities 1.22%
Others 14.63%
DEBT 63.71%
Debt Portfolio % to Fund
Equity Portfolio % to Fund
Past performance is not necessarily indicative of
future performance
Inception 7.0% 8.5%
6 years 6.2% 7.9%
5 years 5.9% 8.0%
4 years 7.4% 9.7%
3 years 6.8% 10.0%
2 years 7.9% 10.2%
1 year -1.7% 1.8%
6 months 0.3% 1.4%
3 months 0.5% 0.6%
1 month 3.9% 5.1%
GROUP FUND
ANNUAL FUND UPDATE AS ON 31st March 2016
GUARANTEE FUND (ULIF-048-05/02/10-GRTFND-107)
INDIVIDUAL FUND
Assets Class % To Fund
Debt Ratings Profile
Allocation by Sector - Equity
Debt Maturity Profile
36.29%
27.52%
22.46%
13.72%
Equity
G Sec., GGB
CD,CP,T Bills,
MF,Repo,CBLO,NCA
NCD, Floaters, ZCB,
Long Term Deposits
44.05%
30.66%
14.25%
7.60%3.33%
0.12%Govt & Govt
Guaranteed Bonds
A1+
AAA
AA+
CBLO
Fixed Deposit
39.99%
7.71%
9.35%
42.94%
7 Year & Above
3 to <7 Year
1 to <3 Year
< 1 Year
0.94%
1.17%
1.45%
1.62%
2.44%
2.71%
3.48%
3.72%
4.03%
6.46%
8.28%
Telecom
Utilities
Cement & Cement Products
Capital Goods & Engineering
Others
Pharma
FMCG
Oil & Gas
Auto & Auto Ancillary
Information Tech
Banking & Finance
EQUITY
16
Fund Strategy
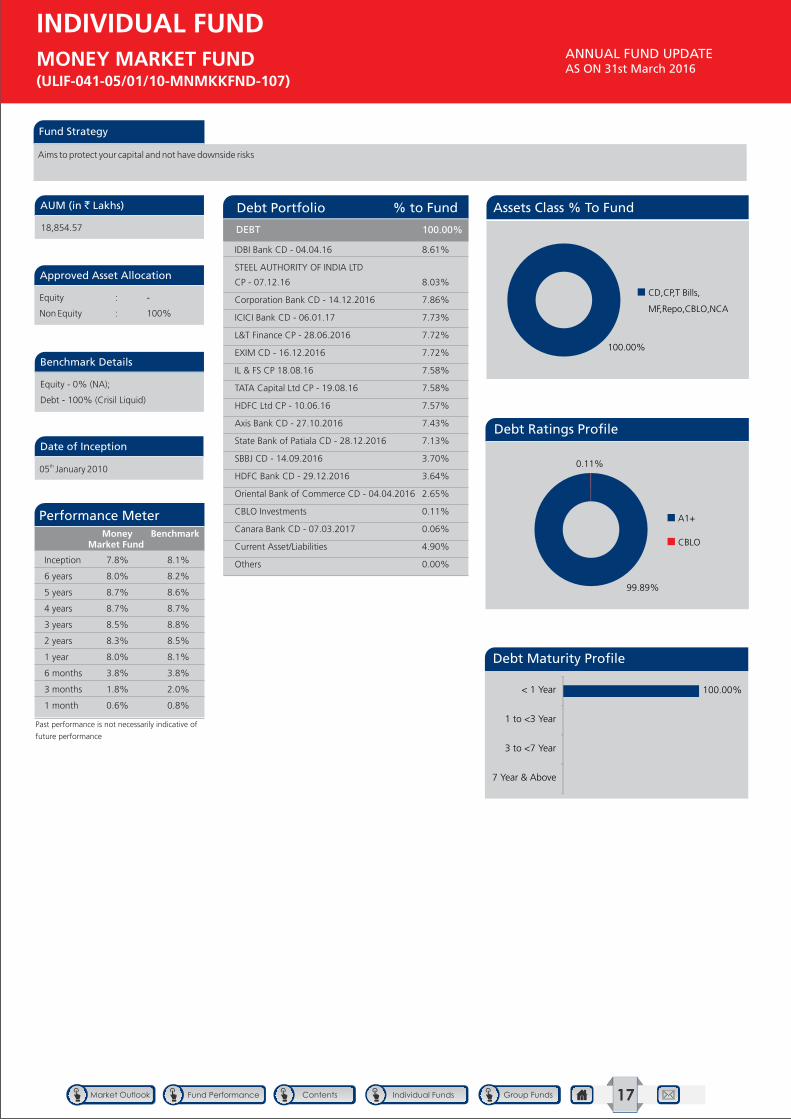
Aims to protect your capital and not have downside risks
Performance Meter
Approved Asset Allocation
Benchmark Details
AUM (in ` Lakhs)
Date of Inception
Equity : -
Non Equity : 100%
Equity - 0% (NA);
Debt - 100% (Crisil Liquid)
18,854.57
th05 January 2010
Money Market Fund
Benchmark
Past performance is not necessarily indicative of
future performance
Inception 7.8% 8.1%
6 years 8.0% 8.2%
5 years 8.7% 8.6%
4 years 8.7% 8.7%
3 years 8.5% 8.8%
2 years 8.3% 8.5%
1 year 8.0% 8.1%
6 months 3.8% 3.8%
3 months 1.8% 2.0%
1 month 0.6% 0.8%
IDBI Bank CD - 04.04.16 8.61%
STEEL AUTHORITY OF INDIA LTD
CP - 07.12.16 8.03%
Corporation Bank CD - 14.12.2016 7.86%
ICICI Bank CD - 06.01.17 7.73%
L&T Finance CP - 28.06.2016 7.72%
EXIM CD - 16.12.2016 7.72%
IL & FS CP 18.08.16 7.58%
TATA Capital Ltd CP - 19.08.16 7.58%
HDFC Ltd CP - 10.06.16 7.57%
Axis Bank CD - 27.10.2016 7.43%
State Bank of Patiala CD - 28.12.2016 7.13%
SBBJ CD - 14.09.2016 3.70%
HDFC Bank CD - 29.12.2016 3.64%
Oriental Bank of Commerce CD - 04.04.2016 2.65%
CBLO Investments 0.11%
Canara Bank CD - 07.03.2017 0.06%
Current Asset/Liabilities 4.90%
Others 0.00%
DEBT 100.00%
Debt Portfolio % to Fund
ANNUAL FUND UPDATE AS ON 31st March 2016
MONEY MARKET FUND (ULIF-041-05/01/10-MNMKKFND-107)
INDIVIDUAL FUND
Assets Class % To Fund
Debt Ratings Profile
Debt Maturity Profile
100.00%
CD,CP,T Bills,
MF,Repo,CBLO,NCA
99.89%
0.11%
A1+
CBLO
100.00%
7 Year & Above
3 to <7 Year
1 to <3 Year
< 1 Year
17
Fund Strategy
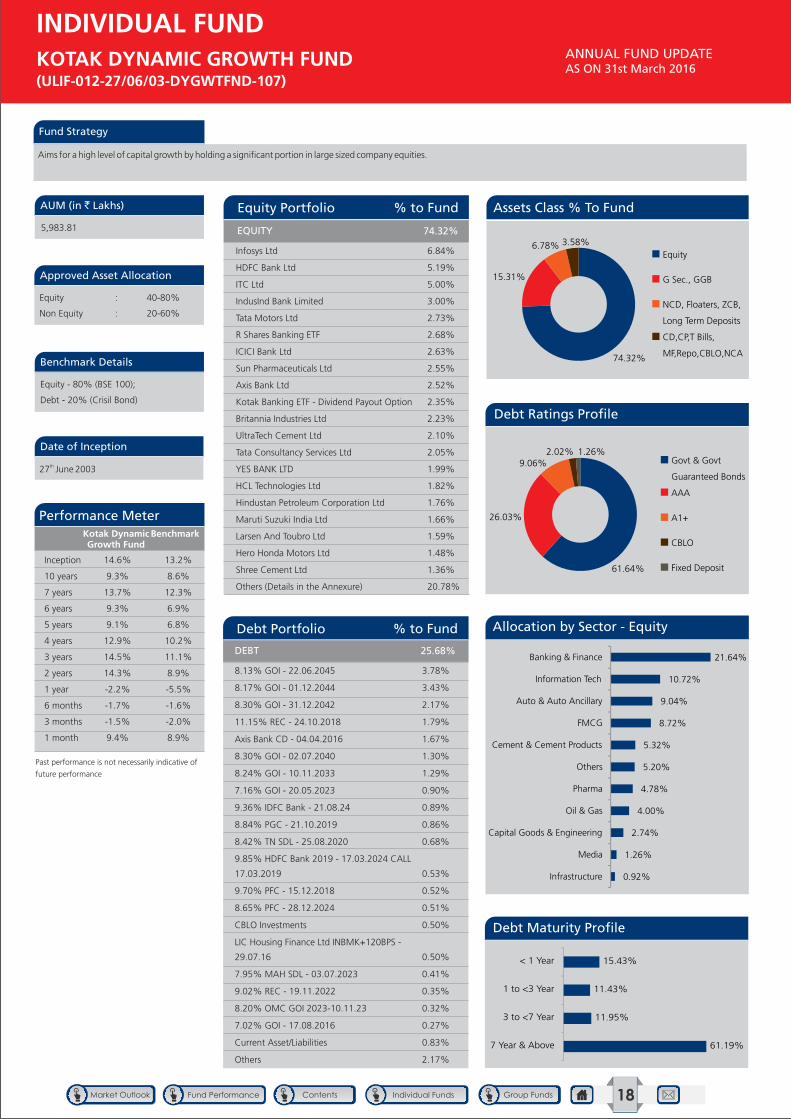
Aims for a high level of capital growth by holding a significant portion in large sized company equities.
Performance Meter
Approved Asset Allocation
Benchmark Details
AUM (in ` Lakhs)
Date of Inception
Equity : 40-80%
Non Equity : 20-60%
Equity - 80% (BSE 100);
Debt - 20% (Crisil Bond)
5,983.81
th27 June 2003
Kotak Dynamic Growth Fund
Benchmark
Infosys Ltd 6.84%
HDFC Bank Ltd 5.19%
ITC Ltd 5.00%
IndusInd Bank Limited 3.00%
Tata Motors Ltd 2.73%
R Shares Banking ETF 2.68%
ICICI Bank Ltd 2.63%
Sun Pharmaceuticals Ltd 2.55%
Axis Bank Ltd 2.52%
Kotak Banking ETF - Dividend Payout Option 2.35%
Britannia Industries Ltd 2.23%
UltraTech Cement Ltd 2.10%
Tata Consultancy Services Ltd 2.05%
YES BANK LTD 1.99%
HCL Technologies Ltd 1.82%
Hindustan Petroleum Corporation Ltd 1.76%
Maruti Suzuki India Ltd 1.66%
Larsen And Toubro Ltd 1.59%
Hero Honda Motors Ltd 1.48%
Shree Cement Ltd 1.36%
Others (Details in the Annexure) 20.78%
74.32%
8.13% GOI - 22.06.2045 3.78%
8.17% GOI - 01.12.2044 3.43%
8.30% GOI - 31.12.2042 2.17%
11.15% REC - 24.10.2018 1.79%
Axis Bank CD - 04.04.2016 1.67%
8.30% GOI - 02.07.2040 1.30%
8.24% GOI - 10.11.2033 1.29%
7.16% GOI - 20.05.2023 0.90%
9.36% IDFC Bank - 21.08.24 0.89%
8.84% PGC - 21.10.2019 0.86%
8.42% TN SDL - 25.08.2020 0.68%
9.85% HDFC Bank 2019 - 17.03.2024 CALL
17.03.2019 0.53%
9.70% PFC - 15.12.2018 0.52%
8.65% PFC - 28.12.2024 0.51%
CBLO Investments 0.50%
LIC Housing Finance Ltd INBMK+120BPS -
29.07.16 0.50%
7.95% MAH SDL - 03.07.2023 0.41%
9.02% REC - 19.11.2022 0.35%
8.20% OMC GOI 2023-10.11.23 0.32%
7.02% GOI - 17.08.2016 0.27%
Current Asset/Liabilities 0.83%
Others 2.17%
DEBT 25.68%
Debt Portfolio % to Fund
Equity Portfolio % to Fund
Past performance is not necessarily indicative of
future performance
Inception 14.6% 13.2%
10 years 9.3% 8.6%
7 years 13.7% 12.3%
6 years 9.3% 6.9%
5 years 9.1% 6.8%
4 years 12.9% 10.2%
3 years 14.5% 11.1%
2 years 14.3% 8.9%
1 year -2.2% -5.5%
6 months -1.7% -1.6%
3 months -1.5% -2.0%
1 month 9.4% 8.9%
GROUP FUND
ANNUAL FUND UPDATE AS ON 31st March 2016
KOTAK DYNAMIC GROWTH FUND (ULIF-012-27/06/03-DYGWTFND-107)
INDIVIDUAL FUND
Assets Class % To Fund
Debt Ratings Profile
Allocation by Sector - Equity
Debt Maturity Profile
74.32%
15.31%
6.78%
3.58%
Equity
G Sec., GGB
NCD, Floaters, ZCB,
Long Term Deposits
CD,CP,T Bills,
MF,Repo,CBLO,NCA
61.64%
26.03%
9.06%2.02% 1.26%
Govt & Govt
Guaranteed Bonds
AAA
A1+
CBLO
Fixed Deposit
61.19%
11.95%
11.43%
15.43%
7 Year & Above
3 to <7 Year
1 to <3 Year
< 1 Year
0.92%
1.26%
2.74%
4.00%
4.78%
5.20%
5.32%
8.72%
9.04%
10.72%
21.64%
Infrastructure
Media
Capital Goods & Engineering
Oil & Gas
Pharma
Others
Cement & Cement Products
FMCG
Auto & Auto Ancillary
Information Tech
Banking & Finance
EQUITY
18
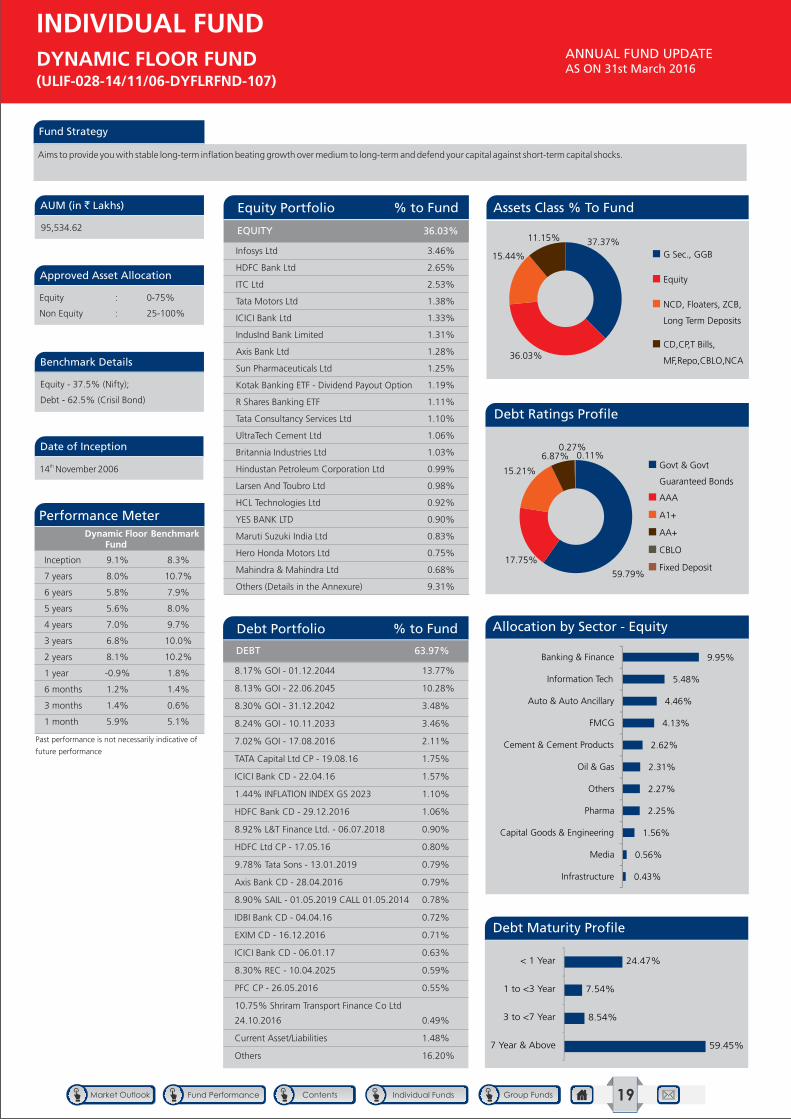
Fund Strategy
Aims to provide you with stable long-term inflation beating growth over medium to long-term and defend your capital against short-term capital shocks.
Performance Meter
Approved Asset Allocation
Benchmark Details
AUM (in ` Lakhs)
Date of Inception
Equity : 0-75%
Non Equity : 25-100%
Equity - 37.5% (Nifty);
Debt - 62.5% (Crisil Bond)
95,534.62
th14 November 2006
Dynamic Floor Fund
Benchmark
Infosys Ltd 3.46%
HDFC Bank Ltd 2.65%
ITC Ltd 2.53%
Tata Motors Ltd 1.38%
ICICI Bank Ltd 1.33%
IndusInd Bank Limited 1.31%
Axis Bank Ltd 1.28%
Sun Pharmaceuticals Ltd 1.25%
Kotak Banking ETF - Dividend Payout Option 1.19%
R Shares Banking ETF 1.11%
Tata Consultancy Services Ltd 1.10%
UltraTech Cement Ltd 1.06%
Britannia Industries Ltd 1.03%
Hindustan Petroleum Corporation Ltd 0.99%
Larsen And Toubro Ltd 0.98%
HCL Technologies Ltd 0.92%
YES BANK LTD 0.90%
Maruti Suzuki India Ltd 0.83%
Hero Honda Motors Ltd 0.75%
Mahindra & Mahindra Ltd 0.68%
Others (Details in the Annexure) 9.31%
36.03%
8.17% GOI - 01.12.2044 13.77%
8.13% GOI - 22.06.2045 10.28%
8.30% GOI - 31.12.2042 3.48%
8.24% GOI - 10.11.2033 3.46%
7.02% GOI - 17.08.2016 2.11%
TATA Capital Ltd CP - 19.08.16 1.75%
ICICI Bank CD - 22.04.16 1.57%
1.44% INFLATION INDEX GS 2023 1.10%
HDFC Bank CD - 29.12.2016 1.06%
8.92% L&T Finance Ltd. - 06.07.2018 0.90%
HDFC Ltd CP - 17.05.16 0.80%
9.78% Tata Sons - 13.01.2019 0.79%
Axis Bank CD - 28.04.2016 0.79%
8.90% SAIL - 01.05.2019 CALL 01.05.2014 0.78%
IDBI Bank CD - 04.04.16 0.72%
EXIM CD - 16.12.2016 0.71%
ICICI Bank CD - 06.01.17 0.63%
8.30% REC - 10.04.2025 0.59%
PFC CP - 26.05.2016 0.55%
10.75% Shriram Transport Finance Co Ltd
24.10.2016 0.49%
Current Asset/Liabilities 1.48%
Others 16.20%
DEBT 63.97%
Debt Portfolio % to Fund
Equity Portfolio % to Fund
Past performance is not necessarily indicative of
future performance
Inception 9.1% 8.3%
7 years 8.0% 10.7%
6 years 5.8% 7.9%
5 years 5.6% 8.0%
4 years 7.0% 9.7%
3 years 6.8% 10.0%
2 years 8.1% 10.2%
1 year -0.9% 1.8%
6 months 1.2% 1.4%
3 months 1.4% 0.6%
1 month 5.9% 5.1%
GROUP FUND
ANNUAL FUND UPDATE AS ON 31st March 2016
DYNAMIC FLOOR FUND (ULIF-028-14/11/06-DYFLRFND-107)
INDIVIDUAL FUND
Assets Class % To Fund
Debt Ratings Profile
Allocation by Sector - Equity
Debt Maturity Profile
59.79%
17.75%
15.21% 6.87%
0.27%0.11%
Govt & Govt
Guaranteed Bonds
AAA
A1+
AA+
CBLO
Fixed Deposit
37.37%
36.03%
15.44%
11.15%
G Sec., GGB
Equity
NCD, Floaters, ZCB,
Long Term Deposits
CD,CP,T Bills,
MF,Repo,CBLO,NCA
59.45%
8.54%
7.54%
24.47%
7 Year & Above
3 to <7 Year
1 to <3 Year
< 1 Year
0.43%
0.56%
1.56%
2.25%
2.27%
2.31%
2.62%
4.13%
4.46%
5.48%
9.95%
Infrastructure
Media
Capital Goods & Engineering
Pharma
Others
Oil & Gas
Cement & Cement Products
FMCG
Auto & Auto Ancillary
Information Tech
Banking & Finance
EQUITY
19
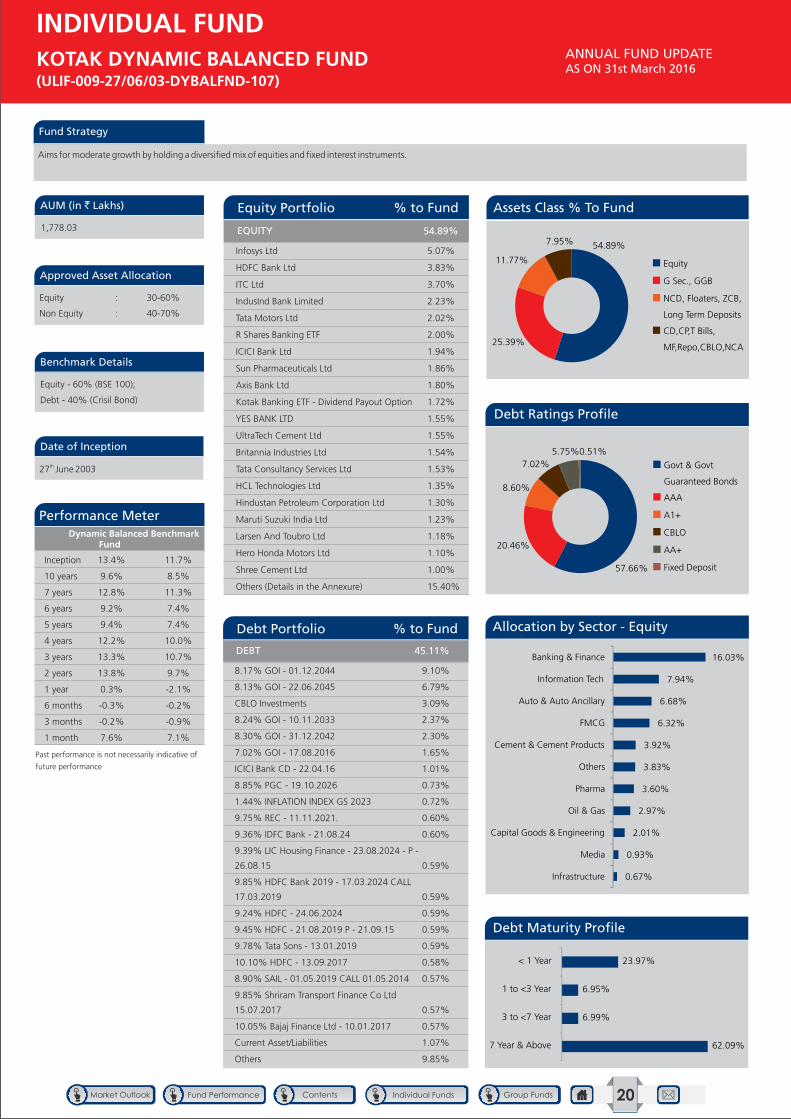
Fund Strategy
Aims for moderate growth by holding a diversified mix of equities and fixed interest instruments.
Approved Asset Allocation
Benchmark Details
AUM (in ` Lakhs)
Date of Inception
Equity : 30-60%
Non Equity : 40-70%
Equity - 60% (BSE 100);
Debt - 40% (Crisil Bond)
1,778.03
th27 June 2003
Infosys Ltd 5.07%
HDFC Bank Ltd 3.83%
ITC Ltd 3.70%
IndusInd Bank Limited 2.23%
Tata Motors Ltd 2.02%
R Shares Banking ETF 2.00%
ICICI Bank Ltd 1.94%
Sun Pharmaceuticals Ltd 1.86%
Axis Bank Ltd 1.80%
Kotak Banking ETF - Dividend Payout Option 1.72%
YES BANK LTD 1.55%
UltraTech Cement Ltd 1.55%
Britannia Industries Ltd 1.54%
Tata Consultancy Services Ltd 1.53%
HCL Technologies Ltd 1.35%
Hindustan Petroleum Corporation Ltd 1.30%
Maruti Suzuki India Ltd 1.23%
Larsen And Toubro Ltd 1.18%
Hero Honda Motors Ltd 1.10%
Shree Cement Ltd 1.00%
Others (Details in the Annexure) 15.40%
54.89%
8.17% GOI - 01.12.2044 9.10%
8.13% GOI - 22.06.2045 6.79%
CBLO Investments 3.09%
8.24% GOI - 10.11.2033 2.37%
8.30% GOI - 31.12.2042 2.30%
7.02% GOI - 17.08.2016 1.65%
ICICI Bank CD - 22.04.16 1.01%
8.85% PGC - 19.10.2026 0.73%
1.44% INFLATION INDEX GS 2023 0.72%
9.75% REC - 11.11.2021. 0.60%
9.36% IDFC Bank - 21.08.24 0.60%
9.39% LIC Housing Finance - 23.08.2024 - P -
26.08.15 0.59%
9.85% HDFC Bank 2019 - 17.03.2024 CALL
17.03.2019 0.59%
9.24% HDFC - 24.06.2024 0.59%
9.45% HDFC - 21.08.2019 P - 21.09.15 0.59%
9.78% Tata Sons - 13.01.2019 0.59%
10.10% HDFC - 13.09.2017 0.58%
8.90% SAIL - 01.05.2019 CALL 01.05.2014 0.57%
9.85% Shriram Transport Finance Co Ltd
15.07.2017 0.57%
10.05% Bajaj Finance Ltd - 10.01.2017 0.57%
Current Asset/Liabilities 1.07%
Others 9.85%
DEBT 45.11%
Debt Portfolio % to Fund
Equity Portfolio % to Fund
GROUP FUND
ANNUAL FUND UPDATE AS ON 31st March 2016
KOTAK DYNAMIC BALANCED FUND (ULIF-009-27/06/03-DYBALFND-107)
INDIVIDUAL FUND
Performance MeterDynamic Balanced
FundBenchmark
Past performance is not necessarily indicative of
future performance
Inception 13.4% 11.7%
10 years 9.6% 8.5%
7 years 12.8% 11.3%
6 years 9.2% 7.4%
5 years 9.4% 7.4%
4 years 12.2% 10.0%
3 years 13.3% 10.7%
2 years 13.8% 9.7%
1 year 0.3% -2.1%
6 months -0.3% -0.2%
3 months -0.2% -0.9%
1 month 7.6% 7.1%
Assets Class % To Fund
Debt Ratings Profile
Allocation by Sector - Equity
Debt Maturity Profile
54.89%
25.39%
11.77%
7.95%
Equity
G Sec., GGB
NCD, Floaters, ZCB,
Long Term Deposits
CD,CP,T Bills,
MF,Repo,CBLO,NCA
57.66%
20.46%
8.60%
7.02%5.75%0.51%
Govt & Govt
Guaranteed Bonds
AAA
A1+
CBLO
AA+
Fixed Deposit
62.09%
6.99%
6.95%
23.97%
7 Year & Above
3 to <7 Year
1 to <3 Year
< 1 Year
0.67%
0.93%
2.01%
2.97%
3.60%
3.83%
3.92%
6.32%
6.68%
7.94%
16.03%
Infrastructure
Media
Capital Goods & Engineering
Oil & Gas
Pharma
Others
Cement & Cement Products
FMCG
Auto & Auto Ancillary
Information Tech
Banking & Finance
EQUITY
20
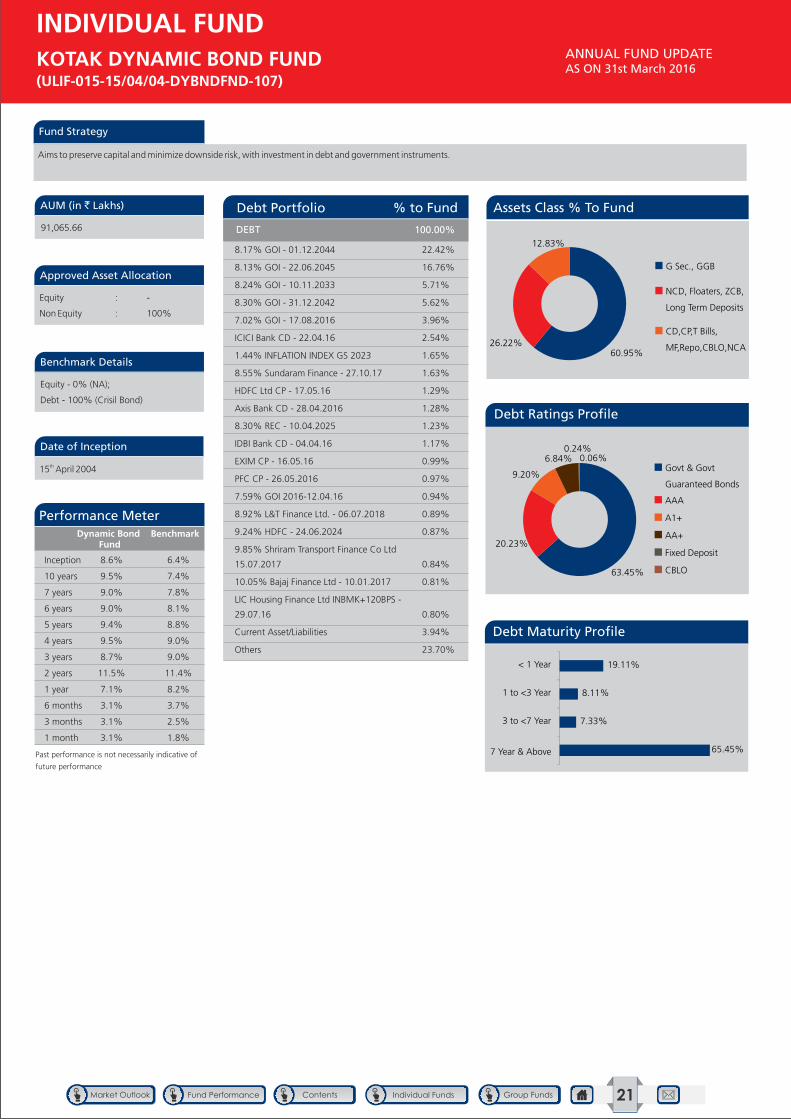
Fund Strategy
Aims to preserve capital and minimize downside risk, with investment in debt and government instruments.
Approved Asset Allocation
Benchmark Details
AUM (in ` Lakhs)
Date of Inception
Equity : -
Non Equity : 100%
Equity - 0% (NA);
Debt - 100% (Crisil Bond)
91,065.66
th15 April 2004
8.17% GOI - 01.12.2044 22.42%
8.13% GOI - 22.06.2045 16.76%
8.24% GOI - 10.11.2033 5.71%
8.30% GOI - 31.12.2042 5.62%
7.02% GOI - 17.08.2016 3.96%
ICICI Bank CD - 22.04.16 2.54%
1.44% INFLATION INDEX GS 2023 1.65%
8.55% Sundaram Finance - 27.10.17 1.63%
HDFC Ltd CP - 17.05.16 1.29%
Axis Bank CD - 28.04.2016 1.28%
8.30% REC - 10.04.2025 1.23%
IDBI Bank CD - 04.04.16 1.17%
EXIM CP - 16.05.16 0.99%
PFC CP - 26.05.2016 0.97%
7.59% GOI 2016-12.04.16 0.94%
8.92% L&T Finance Ltd. - 06.07.2018 0.89%
9.24% HDFC - 24.06.2024 0.87%
9.85% Shriram Transport Finance Co Ltd
15.07.2017 0.84%
10.05% Bajaj Finance Ltd - 10.01.2017 0.81%
LIC Housing Finance Ltd INBMK+120BPS -
29.07.16 0.80%
Current Asset/Liabilities 3.94%
Others 23.70%
DEBT 100.00%
Debt Portfolio % to Fund
GROUP FUND
ANNUAL FUND UPDATE AS ON 31st March 2016
KOTAK DYNAMIC BOND FUND (ULIF-015-15/04/04-DYBNDFND-107)
INDIVIDUAL FUND
Performance MeterDynamic Bond
FundBenchmark
Past performance is not necessarily indicative of
future performance
Inception 8.6% 6.4%
10 years 9.5% 7.4%
7 years 9.0% 7.8%
6 years 9.0% 8.1%
5 years 9.4% 8.8%
4 years 9.5% 9.0%
3 years 8.7% 9.0%
2 years 11.5% 11.4%
1 year 7.1% 8.2%
6 months 3.1% 3.7%
3 months 3.1% 2.5%
1 month 3.1% 1.8%
Assets Class % To Fund
Debt Ratings Profile
Debt Maturity Profile
60.95%
26.22%
12.83%
G Sec., GGB
NCD, Floaters, ZCB,
Long Term Deposits
CD,CP,T Bills,
MF,Repo,CBLO,NCA
63.45%
20.23%
9.20%
6.84%0.24%
0.06%Govt & Govt
Guaranteed Bonds
AAA
A1+
AA+
Fixed Deposit
CBLO
65.45%
7.33%
8.11%
19.11%
7 Year & Above
3 to <7 Year
1 to <3 Year
< 1 Year
21
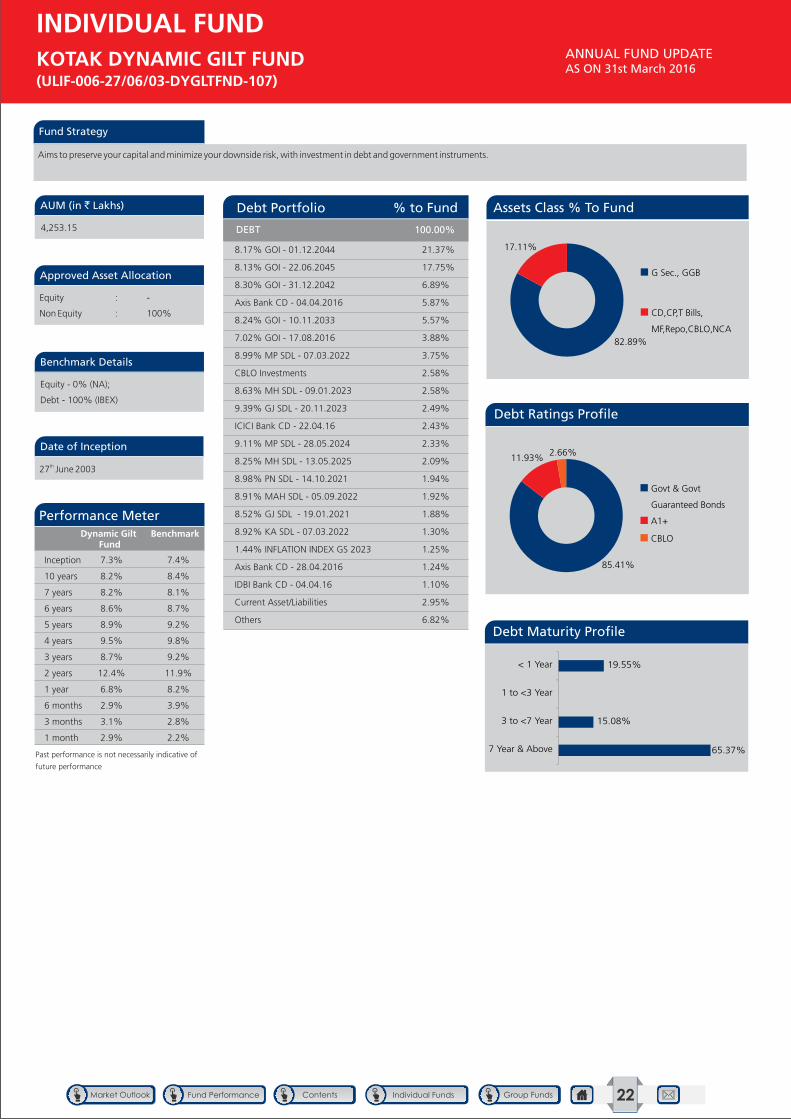
Fund Strategy
Aims to preserve your capital and minimize your downside risk, with investment in debt and government instruments.
Approved Asset Allocation
Benchmark Details
AUM (in ` Lakhs)
Date of Inception
Equity : -
Non Equity : 100%
Equity - 0% (NA);
Debt - 100% (IBEX)
4,253.15
th27 June 2003
GROUP FUND
ANNUAL FUND UPDATE AS ON 31st March 2016
KOTAK DYNAMIC GILT FUND (ULIF-006-27/06/03-DYGLTFND-107)
INDIVIDUAL FUND
8.17% GOI - 01.12.2044 21.37%
8.13% GOI - 22.06.2045 17.75%
8.30% GOI - 31.12.2042 6.89%
Axis Bank CD - 04.04.2016 5.87%
8.24% GOI - 10.11.2033 5.57%
7.02% GOI - 17.08.2016 3.88%
8.99% MP SDL - 07.03.2022 3.75%
CBLO Investments 2.58%
8.63% MH SDL - 09.01.2023 2.58%
9.39% GJ SDL - 20.11.2023 2.49%
ICICI Bank CD - 22.04.16 2.43%
9.11% MP SDL - 28.05.2024 2.33%
8.25% MH SDL - 13.05.2025 2.09%
8.98% PN SDL - 14.10.2021 1.94%
8.91% MAH SDL - 05.09.2022 1.92%
8.52% GJ SDL - 19.01.2021 1.88%
8.92% KA SDL - 07.03.2022 1.30%
1.44% INFLATION INDEX GS 2023 1.25%
Axis Bank CD - 28.04.2016 1.24%
IDBI Bank CD - 04.04.16 1.10%
Current Asset/Liabilities 2.95%
Others 6.82%
DEBT 100.00%
Debt Portfolio % to Fund
Performance MeterDynamic Gilt
FundBenchmark
Past performance is not necessarily indicative of
future performance
Inception 7.3% 7.4%
10 years 8.2% 8.4%
7 years 8.2% 8.1%
6 years 8.6% 8.7%
5 years 8.9% 9.2%
4 years 9.5% 9.8%
3 years 8.7% 9.2%
2 years 12.4% 11.9%
1 year 6.8% 8.2%
6 months 2.9% 3.9%
3 months 3.1% 2.8%
1 month 2.9% 2.2%
Assets Class % To Fund
Debt Ratings Profile
Debt Maturity Profile
82.89%
17.11%
G Sec., GGB
CD,CP,T Bills,
MF,Repo,CBLO,NCA
85.41%
11.93%2.66%
Govt & Govt
Guaranteed Bonds
A1+
CBLO
65.37%
15.08%
19.55%
7 Year & Above
3 to <7 Year
1 to <3 Year
< 1 Year
22
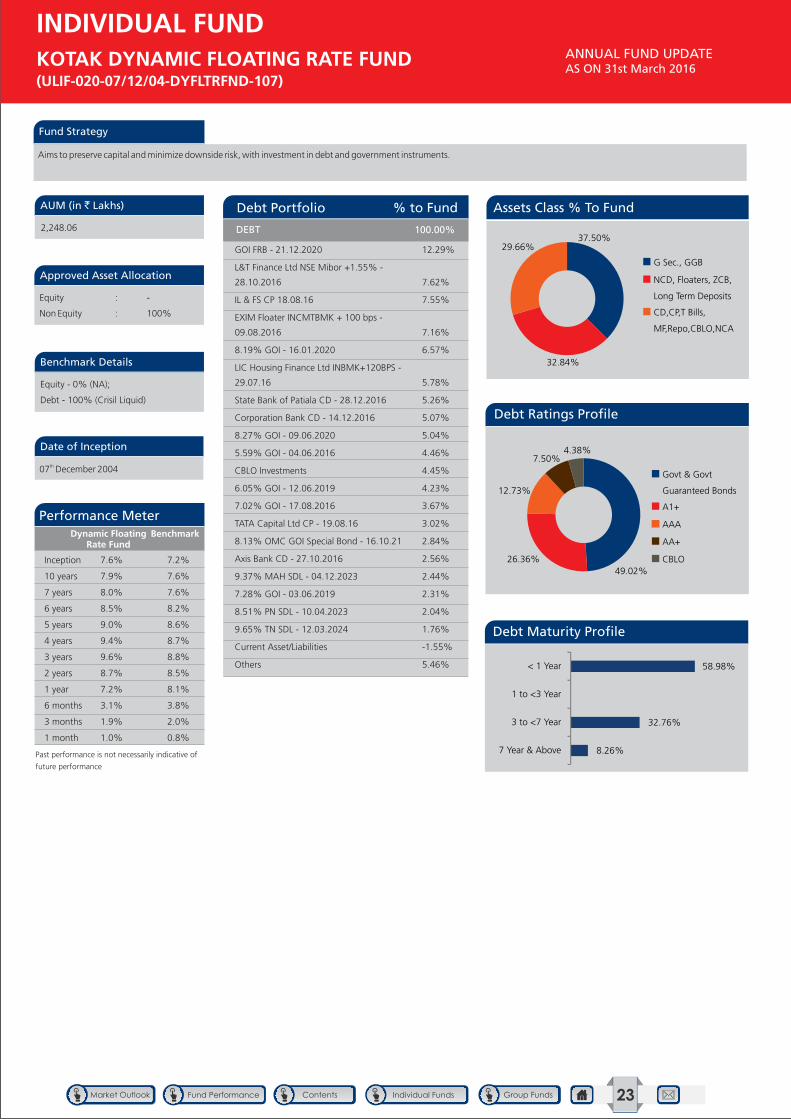
Fund Strategy
Aims to preserve capital and minimize downside risk, with investment in debt and government instruments.
Approved Asset Allocation
Benchmark Details
AUM (in ` Lakhs)
Date of Inception
Equity : -
Non Equity : 100%
Equity - 0% (NA);
Debt - 100% (Crisil Liquid)
2,248.06
th07 December 2004
GROUP FUND
ANNUAL FUND UPDATE AS ON 31st March 2016
KOTAK DYNAMIC FLOATING RATE FUND (ULIF-020-07/12/04-DYFLTRFND-107)
INDIVIDUAL FUND
GOI FRB - 21.12.2020 12.29%
L&T Finance Ltd NSE Mibor +1.55% -
28.10.2016 7.62%
IL & FS CP 18.08.16 7.55%
EXIM Floater INCMTBMK + 100 bps -
09.08.2016 7.16%
8.19% GOI - 16.01.2020 6.57%
LIC Housing Finance Ltd INBMK+120BPS -
29.07.16 5.78%
State Bank of Patiala CD - 28.12.2016 5.26%
Corporation Bank CD - 14.12.2016 5.07%
8.27% GOI - 09.06.2020 5.04%
5.59% GOI - 04.06.2016 4.46%
CBLO Investments 4.45%
6.05% GOI - 12.06.2019 4.23%
7.02% GOI - 17.08.2016 3.67%
TATA Capital Ltd CP - 19.08.16 3.02%
8.13% OMC GOI Special Bond - 16.10.21 2.84%
Axis Bank CD - 27.10.2016 2.56%
9.37% MAH SDL - 04.12.2023 2.44%
7.28% GOI - 03.06.2019 2.31%
8.51% PN SDL - 10.04.2023 2.04%
9.65% TN SDL - 12.03.2024 1.76%
Current Asset/Liabilities -1.55%
Others 5.46%
DEBT 100.00%
Debt Portfolio % to Fund
Performance MeterDynamic Floating
Rate FundBenchmark
Past performance is not necessarily indicative of
future performance
Inception 7.6% 7.2%
10 years 7.9% 7.6%
7 years 8.0% 7.6%
6 years 8.5% 8.2%
5 years 9.0% 8.6%
4 years 9.4% 8.7%
3 years 9.6% 8.8%
2 years 8.7% 8.5%
1 year 7.2% 8.1%
6 months 3.1% 3.8%
3 months 1.9% 2.0%
1 month 1.0% 0.8%
Assets Class % To Fund
Debt Ratings Profile
Debt Maturity Profile
37.50%
32.84%
29.66% G Sec., GGB
NCD, Floaters, ZCB,
Long Term Deposits
CD,CP,T Bills,
MF,Repo,CBLO,NCA
49.02%
26.36%
12.73%
7.50%4.38%
Govt & Govt
Guaranteed Bonds
A1+
AAA
AA+
CBLO
23
8.26%
32.76%
58.98%
7 Year & Above
3 to <7 Year
1 to <3 Year
< 1 Year

Fund Strategy
Aims for a high level of capital growth by holding a significant portion in large sized company equities.
Approved Asset Allocation
Benchmark Details
AUM (in ` Lakhs)
Date of Inception
Equity : 0-100%
Non Equity : 0-100%
Equity - 37.5% (Nifty);
Debt - 62.5% (Crisil Bond)
2,094.09
th14 February 2010
Infosys Ltd 3.10%
ITC Ltd 2.42%
Reliance Industries Ltd 2.28%
HDFC Bank Ltd 2.25%
Housing Development Finance Corp. Ltd 1.86%
Tata Consultancy Services Ltd 1.71%
ICICI Bank Ltd 1.46%
Larsen And Toubro Ltd 1.38%
Sun Pharmaceuticals Ltd 1.23%
Tata Motors Ltd 1.00%
Hindustan Unilever Ltd 0.93%
Axis Bank Ltd 0.79%
Mahindra & Mahindra Ltd 0.78%
Bharti Airtel Ltd 0.70%
Maruti Suzuki India Ltd 0.69%
State Bank of India 0.64%
Oil & Natural Gas Corporation Ltd 0.59%
Asian Paints Ltd 0.59%
HCL Technologies Ltd 0.58%
Hero Honda Motors Ltd 0.58%
Others (Details in the Annexure) 9.46%
35.01%
8.17% GOI - 01.12.2044 9.15%
8.13% GOI - 22.06.2045 7.39%
ICICI Bank CD - 31.05.16 5.80%
Corporation Bank CD - 02.05.2016 3.89%
HDFC Bank CD - 29.12.2016 2.71%
8.24% GOI - 10.11.2033 2.57%
8.30% GOI - 31.12.2042 2.38%
TATA Capital Ltd CP - 19.08.16 2.08%
7.02% GOI - 17.08.2016 1.73%
8.31% GJ SDL - 03.02.2020 1.45%
State Bank of Patiala CD - 28.12.2016 1.36%
8.92% L&T Finance Ltd. - 06.07.2018 1.20%
9.78% Tata Sons - 13.01.2019 0.99%
8.90% SAIL - 01.05.2019 CALL 01.05.2014 0.97%
LIC Housing Finance Ltd INBMK+120BPS -
29.07.16 0.95%
1.44% INFLATION INDEX GS 2023 0.88%
EXIM CD - 16.12.2016 0.82%
ICICI Bank CD - 06.01.17 0.81%
12.30% GOI - 02.07.2016 0.72%
10.75% Shriram Transport Finance Co Ltd
24.10.2016 0.70%
Current Asset/Liabilities 1.83%
Others 14.61%
DEBT 64.99%
Debt Portfolio % to Fund
Equity Portfolio % to Fund
GROUP FUND
ANNUAL FUND UPDATE AS ON 31st March 2016
PEAK GUARANTEE FUND I (ULIF-049-14/02/10-PKGRTFND1-107)
INDIVIDUAL FUND
Performance MeterPeak Guarantee
Fund IBenchmark
Past performance is not necessarily indicative of
future performance
Inception 6.2% 8.4%
6 years 5.7% 7.9%
5 years 5.6% 8.0%
4 years 7.0% 9.7%
3 years 6.5% 10.0%
2 years 7.5% 10.2%
1 year -1.9% 1.8%
6 months 0.2% 1.4%
3 months 0.5% 0.6%
1 month 3.8% 5.1%
Assets Class % To Fund
Debt Ratings Profile
Allocation by Sector - Equity
Debt Maturity Profile
35.01%
29.70%
21.56%
13.73%
Equity
G Sec., GGB
CD,CP,T Bills,
MF,Repo,CBLO,NCA
NCD, Floaters, ZCB,
Long Term Deposits
47.03%
30.48%
13.93%
7.61%0.76%
0.20%
Govt & Govt
Guaranteed Bonds
A1+
AAA
AA+
CBLO
Fixed Deposit
41.88%
7.70%
8.88%
41.54%
7 Year & Above
3 to <7 Year
1 to <3 Year
< 1 Year
0.91%
1.13%
1.40%
1.56%
2.35%
2.62%
3.35%
3.58%
3.89%
6.22%
8.01%
Telecom
Utilities
Cement & Cement Products
Capital Goods & Engineering
Others
Pharma
FMCG
Oil & Gas
Auto & Auto Ancillary
Information Tech
Banking & Finance
EQUITY
24
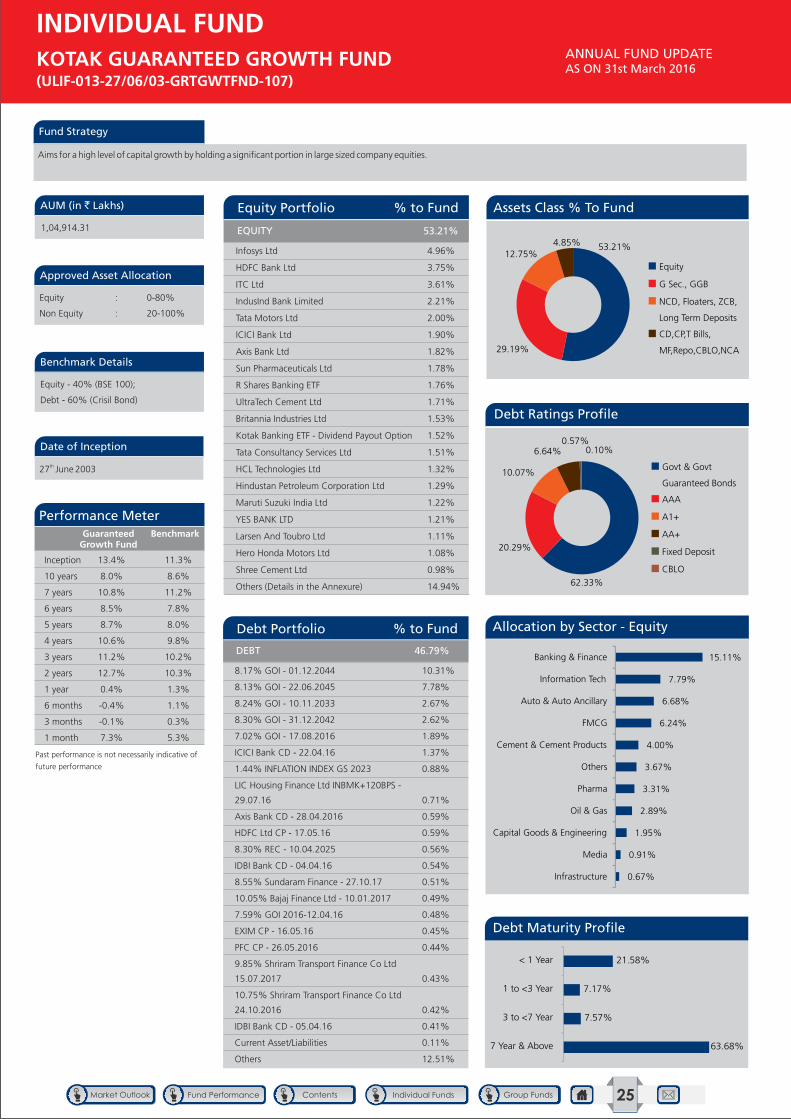
Fund Strategy
Aims for a high level of capital growth by holding a significant portion in large sized company equities.
Approved Asset Allocation
Benchmark Details
AUM (in ` Lakhs)
Date of Inception
Equity : 0-80%
Non Equity : 20-100%
Equity - 40% (BSE 100);
Debt - 60% (Crisil Bond)
1,04,914.31
th27 June 2003
Infosys Ltd 4.96%
HDFC Bank Ltd 3.75%
ITC Ltd 3.61%
IndusInd Bank Limited 2.21%
Tata Motors Ltd 2.00%
ICICI Bank Ltd 1.90%
Axis Bank Ltd 1.82%
Sun Pharmaceuticals Ltd 1.78%
R Shares Banking ETF 1.76%
UltraTech Cement Ltd 1.71%
Britannia Industries Ltd 1.53%
Kotak Banking ETF - Dividend Payout Option 1.52%
Tata Consultancy Services Ltd 1.51%
HCL Technologies Ltd 1.32%
Hindustan Petroleum Corporation Ltd 1.29%
Maruti Suzuki India Ltd 1.22%
YES BANK LTD 1.21%
Larsen And Toubro Ltd 1.11%
Hero Honda Motors Ltd 1.08%
Shree Cement Ltd 0.98%
Others (Details in the Annexure) 14.94%
53.21%
8.17% GOI - 01.12.2044 10.31%
8.13% GOI - 22.06.2045 7.78%
8.24% GOI - 10.11.2033 2.67%
8.30% GOI - 31.12.2042 2.62%
7.02% GOI - 17.08.2016 1.89%
ICICI Bank CD - 22.04.16 1.37%
1.44% INFLATION INDEX GS 2023 0.88%
LIC Housing Finance Ltd INBMK+120BPS -
29.07.16 0.71%
Axis Bank CD - 28.04.2016 0.59%
HDFC Ltd CP - 17.05.16 0.59%
8.30% REC - 10.04.2025 0.56%
IDBI Bank CD - 04.04.16 0.54%
8.55% Sundaram Finance - 27.10.17 0.51%
10.05% Bajaj Finance Ltd - 10.01.2017 0.49%
7.59% GOI 2016-12.04.16 0.48%
EXIM CP - 16.05.16 0.45%
PFC CP - 26.05.2016 0.44%
9.85% Shriram Transport Finance Co Ltd
15.07.2017 0.43%
10.75% Shriram Transport Finance Co Ltd
24.10.2016 0.42%
IDBI Bank CD - 05.04.16 0.41%
Current Asset/Liabilities 0.11%
Others 12.51%
DEBT 46.79%
Debt Portfolio % to Fund
Equity Portfolio % to Fund
GROUP FUND
ANNUAL FUND UPDATE AS ON 31st March 2016
KOTAK GUARANTEED GROWTH FUND (ULIF-013-27/06/03-GRTGWTFND-107)
INDIVIDUAL FUND
Performance MeterGuaranteed
Growth FundBenchmark
Past performance is not necessarily indicative of
future performance
Inception 13.4% 11.3%
10 years 8.0% 8.6%
7 years 10.8% 11.2%
6 years 8.5% 7.8%
5 years 8.7% 8.0%
4 years 10.6% 9.8%
3 years 11.2% 10.2%
2 years 12.7% 10.3%
1 year 0.4% 1.3%
6 months -0.4% 1.1%
3 months -0.1% 0.3%
1 month 7.3% 5.3%
Assets Class % To Fund
Debt Ratings Profile
Allocation by Sector - Equity
Debt Maturity Profile
53.21%
29.19%
12.75%4.85%
Equity
G Sec., GGB
NCD, Floaters, ZCB,
Long Term Deposits
CD,CP,T Bills,
MF,Repo,CBLO,NCA
62.33%
20.29%
10.07%
6.64%0.57%
0.10%
Govt & Govt
Guaranteed Bonds
AAA
A1+
AA+
Fixed Deposit
CBLO
63.68%
7.57%
7.17%
21.58%
7 Year & Above
3 to <7 Year
1 to <3 Year
< 1 Year
0.67%
0.91%
1.95%
2.89%
3.31%
3.67%
4.00%
6.24%
6.68%
7.79%
15.11%
Infrastructure
Media
Capital Goods & Engineering
Oil & Gas
Pharma
Others
Cement & Cement Products
FMCG
Auto & Auto Ancillary
Information Tech
Banking & Finance
EQUITY
25
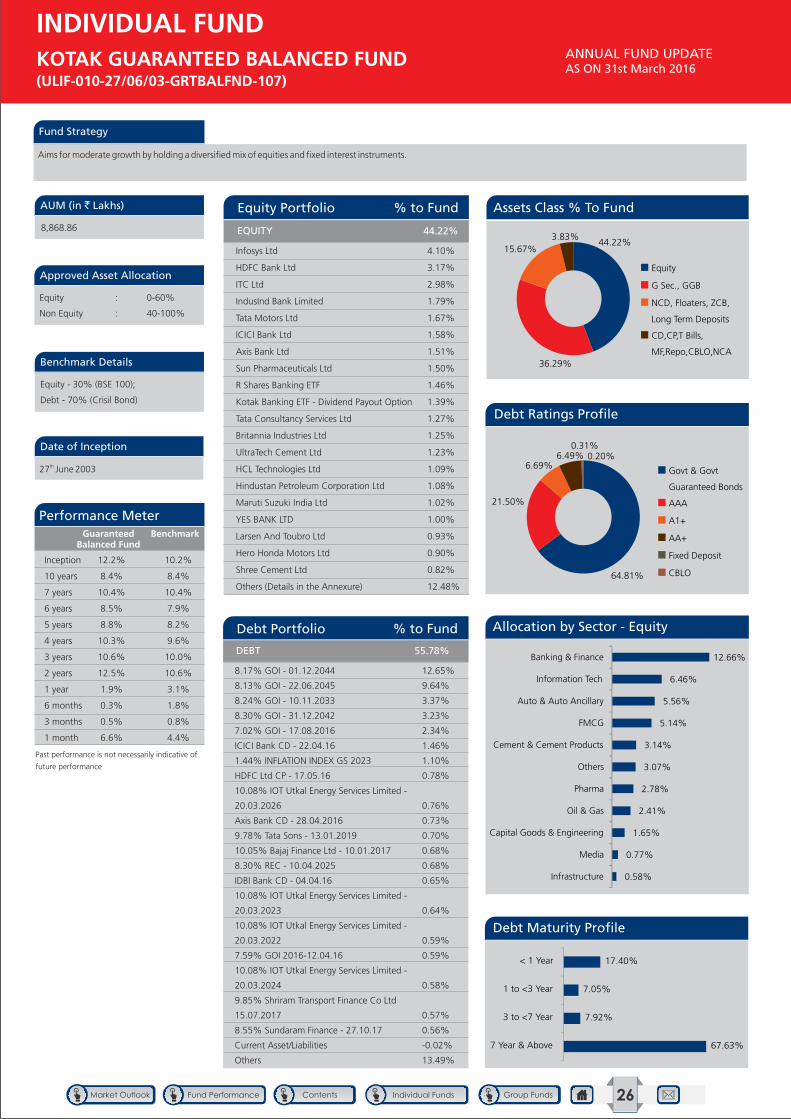
Fund Strategy
Aims for moderate growth by holding a diversified mix of equities and fixed interest instruments.
Approved Asset Allocation
Benchmark Details
AUM (in ` Lakhs)
Date of Inception
Equity : 0-60%
Non Equity : 40-100%
Equity - 30% (BSE 100);
Debt - 70% (Crisil Bond)
8,868.86
th27 June 2003
Infosys Ltd 4.10%
HDFC Bank Ltd 3.17%
ITC Ltd 2.98%
IndusInd Bank Limited 1.79%
Tata Motors Ltd 1.67%
ICICI Bank Ltd 1.58%
Axis Bank Ltd 1.51%
Sun Pharmaceuticals Ltd 1.50%
R Shares Banking ETF 1.46%
Kotak Banking ETF - Dividend Payout Option 1.39%
Tata Consultancy Services Ltd 1.27%
Britannia Industries Ltd 1.25%
UltraTech Cement Ltd 1.23%
HCL Technologies Ltd 1.09%
Hindustan Petroleum Corporation Ltd 1.08%
Maruti Suzuki India Ltd 1.02%
YES BANK LTD 1.00%
Larsen And Toubro Ltd 0.93%
Hero Honda Motors Ltd 0.90%
Shree Cement Ltd 0.82%
Others (Details in the Annexure) 12.48%
44.22%
8.17% GOI - 01.12.2044 12.65%
8.13% GOI - 22.06.2045 9.64%
8.24% GOI - 10.11.2033 3.37%
8.30% GOI - 31.12.2042 3.23%
7.02% GOI - 17.08.2016 2.34%
ICICI Bank CD - 22.04.16 1.46%
1.44% INFLATION INDEX GS 2023 1.10%
HDFC Ltd CP - 17.05.16 0.78%
10.08% IOT Utkal Energy Services Limited -
20.03.2026 0.76%
Axis Bank CD - 28.04.2016 0.73%
9.78% Tata Sons - 13.01.2019 0.70%
10.05% Bajaj Finance Ltd - 10.01.2017 0.68%
8.30% REC - 10.04.2025 0.68%
IDBI Bank CD - 04.04.16 0.65%
10.08% IOT Utkal Energy Services Limited -
20.03.2023 0.64%
10.08% IOT Utkal Energy Services Limited -
20.03.2022 0.59%
7.59% GOI 2016-12.04.16 0.59%
10.08% IOT Utkal Energy Services Limited -
20.03.2024 0.58%
9.85% Shriram Transport Finance Co Ltd
15.07.2017 0.57%
8.55% Sundaram Finance - 27.10.17 0.56%
Current Asset/Liabilities -0.02%
Others 13.49%
DEBT 55.78%
Debt Portfolio % to Fund
Equity Portfolio % to Fund
GROUP FUND
ANNUAL FUND UPDATE AS ON 31st March 2016
KOTAK GUARANTEED BALANCED FUND (ULIF-010-27/06/03-GRTBALFND-107)
INDIVIDUAL FUND
Performance MeterGuaranteed
Balanced FundBenchmark
Past performance is not necessarily indicative of
future performance
Inception 12.2% 10.2%
10 years 8.4% 8.4%
7 years 10.4% 10.4%
6 years 8.5% 7.9%
5 years 8.8% 8.2%
4 years 10.3% 9.6%
3 years 10.6% 10.0%
2 years 12.5% 10.6%
1 year 1.9% 3.1%
6 months 0.3% 1.8%
3 months 0.5% 0.8%
1 month 6.6% 4.4%
Assets Class % To Fund
Debt Ratings Profile
Allocation by Sector - Equity
Debt Maturity Profile
44.22%
36.29%
15.67%3.83%
Equity
G Sec., GGB
NCD, Floaters, ZCB,
Long Term Deposits
CD,CP,T Bills,
MF,Repo,CBLO,NCA
64.81%
21.50%
6.69%6.49%
0.31%0.20%
Govt & Govt
Guaranteed Bonds
AAA
A1+
AA+
Fixed Deposit
CBLO
67.63%
7.92%
7.05%
17.40%
7 Year & Above
3 to <7 Year
1 to <3 Year
< 1 Year
0.58%
0.77%
1.65%
2.41%
2.78%
3.07%
3.14%
5.14%
5.56%
6.46%
12.66%
Infrastructure
Media
Capital Goods & Engineering
Oil & Gas
Pharma
Others
Cement & Cement Products
FMCG
Auto & Auto Ancillary
Information Tech
Banking & Finance
EQUITY
26
Fund Strategy
Aims to maximize opportunity for long term capital growth by holding significant portions in a diversified and flexible mix of large/medium sized stocks.
Approved Asset Allocation
Benchmark Details
AUM (in ` Lakhs)
Date of Inception
Equity : 75-100%
Non Equity : 0-25%
Equity - 100%
(BSE 200)
13,342.08
th07 January 2010
ANNUAL FUND UPDATE AS ON 31st March 2016
PENSION CLASSIC OPPORTUNITIES FUND (ULIF-042-07/01/10-PNCLAOPFND-107)
INDIVIDUAL FUND
Infosys Ltd 8.38%
HDFC Bank Ltd 6.58%
IndusInd Bank Limited 3.94%
Kotak Banking ETF - Dividend Payout Option 3.62%
ICICI Bank Ltd 3.26%
Maruti Suzuki India Ltd 3.10%
Axis Bank Ltd 3.06%
Tata Motors Ltd 2.99%
Larsen And Toubro Ltd 2.96%
ITC Ltd 2.93%
Britannia Industries Ltd 2.86%
YES BANK LTD 2.72%
Reliance Industries Ltd 2.65%
Sun Pharmaceuticals Ltd 2.61%
UltraTech Cement Ltd 2.50%
Hindustan Petroleum Corporation Ltd 2.41%
HCL Technologies Ltd 2.17%
Shree Cement Ltd 1.88%
Tata Consultancy Services Ltd 1.80%
Bharat Petroleum Corporation Ltd 1.62%
Others (Details in the Annexure) 34.09%
98.14%
Equity Portfolio % to Fund
ICICI Bank CD - 31.05.16 0.47%
Axis Bank CD - 28.04.2016 0.06%
8.00% HDFC Bank FD NSE - 08.08.2016 0.01%
8.00% HDFC Bank FD NSE - 24.07.2016 0.01%
8.00% HDFC Bank FD BSE - 24.07.2016 0.01%
Current Asset/Liabilities 1.30%
Others 0.00%
DEBT 1.86%
Debt Portfolio % to Fund
Performance MeterPension Classic Opportunities
FundBenchmark
Past performance is not necessarily indicative of
future performance
Inception 11.7% 6.4%
6 years 10.9% 6.7%
5 years 10.7% 6.5%
4 years 14.9% 10.9%
3 years 17.3% 12.5%
2 years 17.6% 10.3%
1 year -6.0% -7.9%
6 months -3.0% -2.8%
3 months -2.5% -3.5%
1 month 12.4% 10.6%
Assets Class % To Fund
Debt Ratings Profile
Allocation by Sector - Equity
Debt Maturity Profile
98.14%
1.83%0.03%
Equity
CD,CP,T Bills,
MF,Repo,CBLO,NCA
NCD, Floaters, ZCB,
Long Term Deposits
94.66%
5.34%
A1+
Fixed Deposit
100.00%
7 Year & Above
3 to <7 Year
1 to <3 Year
< 1 Year
1.60%
2.17%
5.82%
6.28%
6.75%
8.20%
8.41%
8.60%
11.32%
12.35%
26.65%
Media
Fertilisers
Capital Goods & Engineering
Cement & Cement Products
Pharma
Oil & Gas
Others
FMCG
Auto & Auto Ancillary
Information Tech
Banking & Finance
EQUITY
27
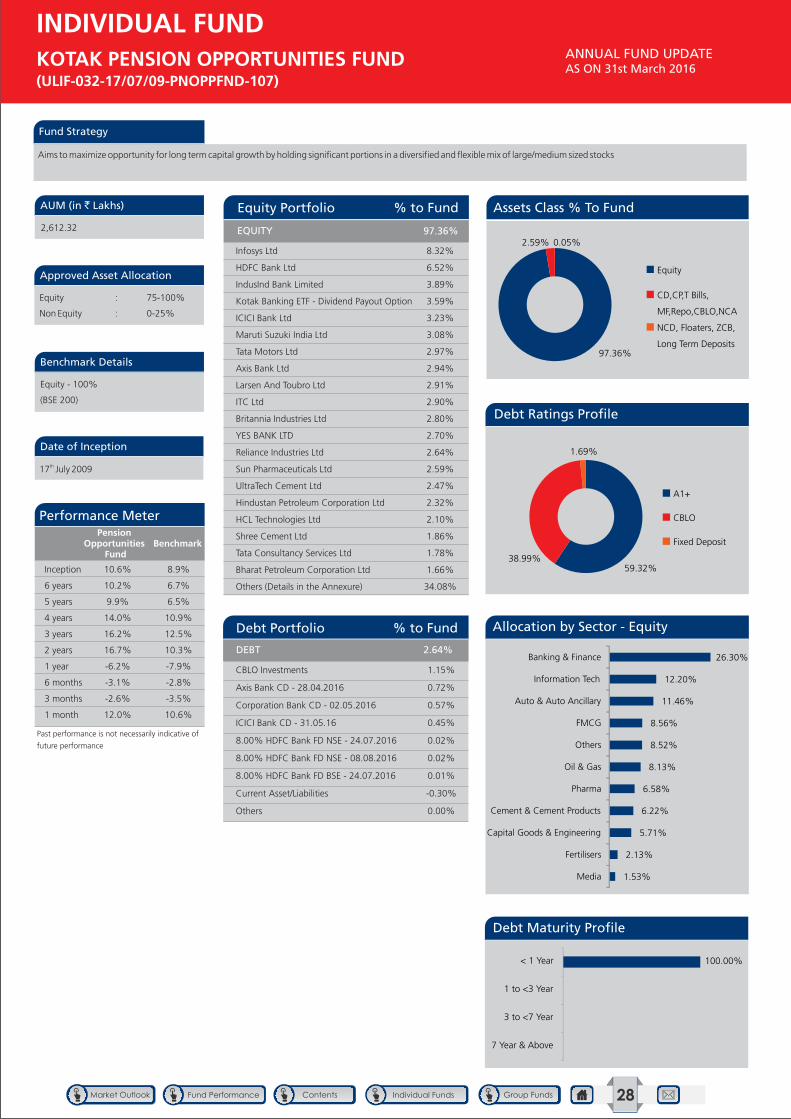
Fund Strategy
Aims to maximize opportunity for long term capital growth by holding significant portions in a diversified and flexible mix of large/medium sized stocks
Approved Asset Allocation
Benchmark Details
AUM (in ` Lakhs)
Date of Inception
Equity : 75-100%
Non Equity : 0-25%
Equity - 100%
(BSE 200)
2,612.32
th17 July 2009
ANNUAL FUND UPDATE AS ON 31st March 2016
KOTAK PENSION OPPORTUNITIES FUND (ULIF-032-17/07/09-PNOPPFND-107)
INDIVIDUAL FUND
Infosys Ltd 8.32%
HDFC Bank Ltd 6.52%
IndusInd Bank Limited 3.89%
Kotak Banking ETF - Dividend Payout Option 3.59%
ICICI Bank Ltd 3.23%
Maruti Suzuki India Ltd 3.08%
Tata Motors Ltd 2.97%
Axis Bank Ltd 2.94%
Larsen And Toubro Ltd 2.91%
ITC Ltd 2.90%
Britannia Industries Ltd 2.80%
YES BANK LTD 2.70%
Reliance Industries Ltd 2.64%
Sun Pharmaceuticals Ltd 2.59%
UltraTech Cement Ltd 2.47%
Hindustan Petroleum Corporation Ltd 2.32%
HCL Technologies Ltd 2.10%
Shree Cement Ltd 1.86%
Tata Consultancy Services Ltd 1.78%
Bharat Petroleum Corporation Ltd 1.66%
Others (Details in the Annexure) 34.08%
97.36%
Equity Portfolio % to Fund
CBLO Investments 1.15%
Axis Bank CD - 28.04.2016 0.72%
Corporation Bank CD - 02.05.2016 0.57%
ICICI Bank CD - 31.05.16 0.45%
8.00% HDFC Bank FD NSE - 24.07.2016 0.02%
8.00% HDFC Bank FD NSE - 08.08.2016 0.02%
8.00% HDFC Bank FD BSE - 24.07.2016 0.01%
Current Asset/Liabilities -0.30%
Others 0.00%
DEBT 2.64%
Debt Portfolio % to Fund
Performance MeterPension
Opportunities Fund
Benchmark
Past performance is not necessarily indicative of
future performance
Inception 10.6% 8.9%
6 years 10.2% 6.7%
5 years 9.9% 6.5%
4 years 14.0% 10.9%
3 years 16.2% 12.5%
2 years 16.7% 10.3%
1 year -6.2% -7.9%
6 months -3.1% -2.8%
3 months -2.6% -3.5%
1 month 12.0% 10.6%
Assets Class % To Fund
Debt Ratings Profile
Allocation by Sector - Equity
Debt Maturity Profile
97.36%
2.59% 0.05%
Equity
CD,CP,T Bills,
MF,Repo,CBLO,NCA
NCD, Floaters, ZCB,
Long Term Deposits
59.32%
38.99%
1.69%
A1+
CBLO
Fixed Deposit
100.00%
7 Year & Above
3 to <7 Year
1 to <3 Year
< 1 Year
1.53%
2.13%
5.71%
6.22%
6.58%
8.13%
8.52%
8.56%
11.46%
12.20%
26.30%
Media
Fertilisers
Capital Goods & Engineering
Cement & Cement Products
Pharma
Oil & Gas
Others
FMCG
Auto & Auto Ancillary
Information Tech
Banking & Finance
EQUITY
28
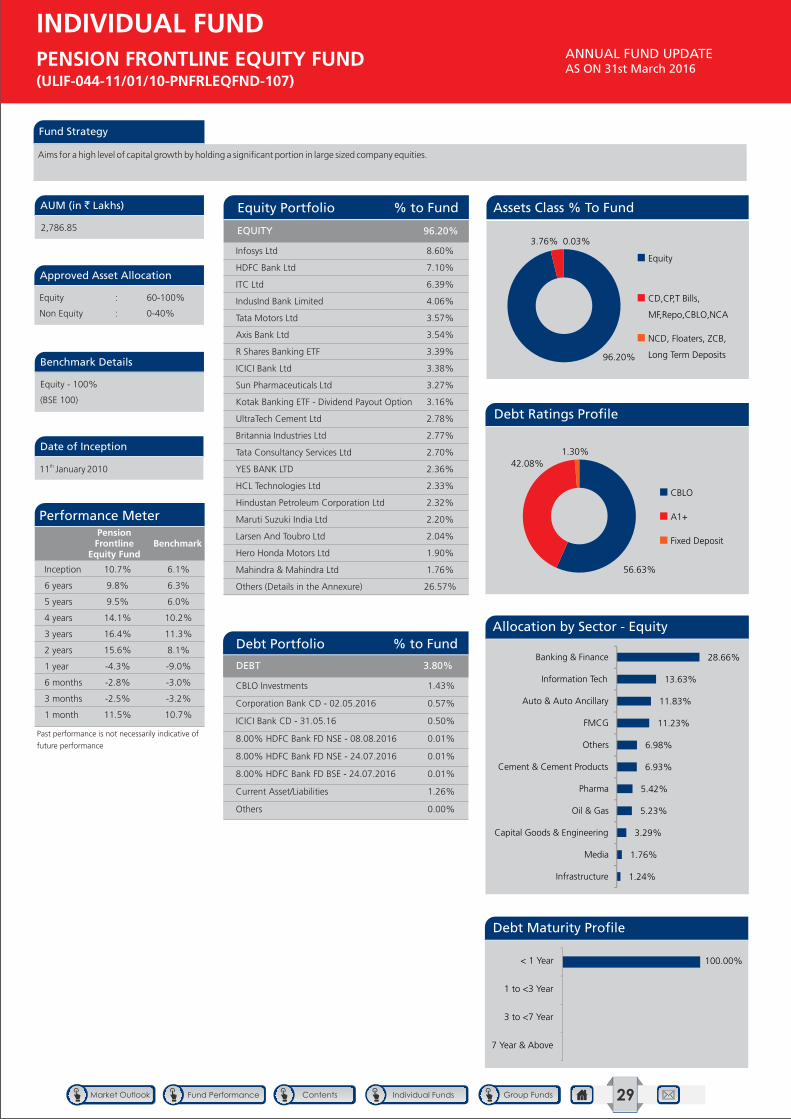
Fund Strategy
Aims for a high level of capital growth by holding a significant portion in large sized company equities.
Approved Asset Allocation
Benchmark Details
AUM (in ` Lakhs)
Date of Inception
Equity : 60-100%
Non Equity : 0-40%
Equity - 100%
(BSE 100)
2,786.85
th11 January 2010
ANNUAL FUND UPDATE AS ON 31st March 2016
PENSION FRONTLINE EQUITY FUND (ULIF-044-11/01/10-PNFRLEQFND-107)
INDIVIDUAL FUND
Infosys Ltd 8.60%
HDFC Bank Ltd 7.10%
ITC Ltd 6.39%
IndusInd Bank Limited 4.06%
Tata Motors Ltd 3.57%
Axis Bank Ltd 3.54%
R Shares Banking ETF 3.39%
ICICI Bank Ltd 3.38%
Sun Pharmaceuticals Ltd 3.27%
Kotak Banking ETF - Dividend Payout Option 3.16%
UltraTech Cement Ltd 2.78%
Britannia Industries Ltd 2.77%
Tata Consultancy Services Ltd 2.70%
YES BANK LTD 2.36%
HCL Technologies Ltd 2.33%
Hindustan Petroleum Corporation Ltd 2.32%
Maruti Suzuki India Ltd 2.20%
Larsen And Toubro Ltd 2.04%
Hero Honda Motors Ltd 1.90%
Mahindra & Mahindra Ltd 1.76%
Others (Details in the Annexure) 26.57%
96.20%
Equity Portfolio % to Fund
CBLO Investments 1.43%
Corporation Bank CD - 02.05.2016 0.57%
ICICI Bank CD - 31.05.16 0.50%
8.00% HDFC Bank FD NSE - 08.08.2016 0.01%
8.00% HDFC Bank FD NSE - 24.07.2016 0.01%
8.00% HDFC Bank FD BSE - 24.07.2016 0.01%
Current Asset/Liabilities 1.26%
Others 0.00%
DEBT 3.80%
Debt Portfolio % to Fund
Performance MeterPension Frontline
Equity FundBenchmark
Past performance is not necessarily indicative of
future performance
Inception 10.7% 6.1%
6 years 9.8% 6.3%
5 years 9.5% 6.0%
4 years 14.1% 10.2%
3 years 16.4% 11.3%
2 years 15.6% 8.1%
1 year -4.3% -9.0%
6 months -2.8% -3.0%
3 months -2.5% -3.2%
1 month 11.5% 10.7%
Assets Class % To Fund
Debt Ratings Profile
Allocation by Sector - Equity
Debt Maturity Profile
96.20%
3.76% 0.03%
Equity
CD,CP,T Bills,
MF,Repo,CBLO,NCA
NCD, Floaters, ZCB,
Long Term Deposits
56.63%
42.08%1.30%
CBLO
A1+
Fixed Deposit
100.00%
7 Year & Above
3 to <7 Year
1 to <3 Year
< 1 Year
1.24%
1.76%
3.29%
5.23%
5.42%
6.93%
6.98%
11.23%
11.83%
13.63%
28.66%
Infrastructure
Media
Capital Goods & Engineering
Oil & Gas
Pharma
Cement & Cement Products
Others
FMCG
Auto & Auto Ancillary
Information Tech
Banking & Finance
EQUITY
29
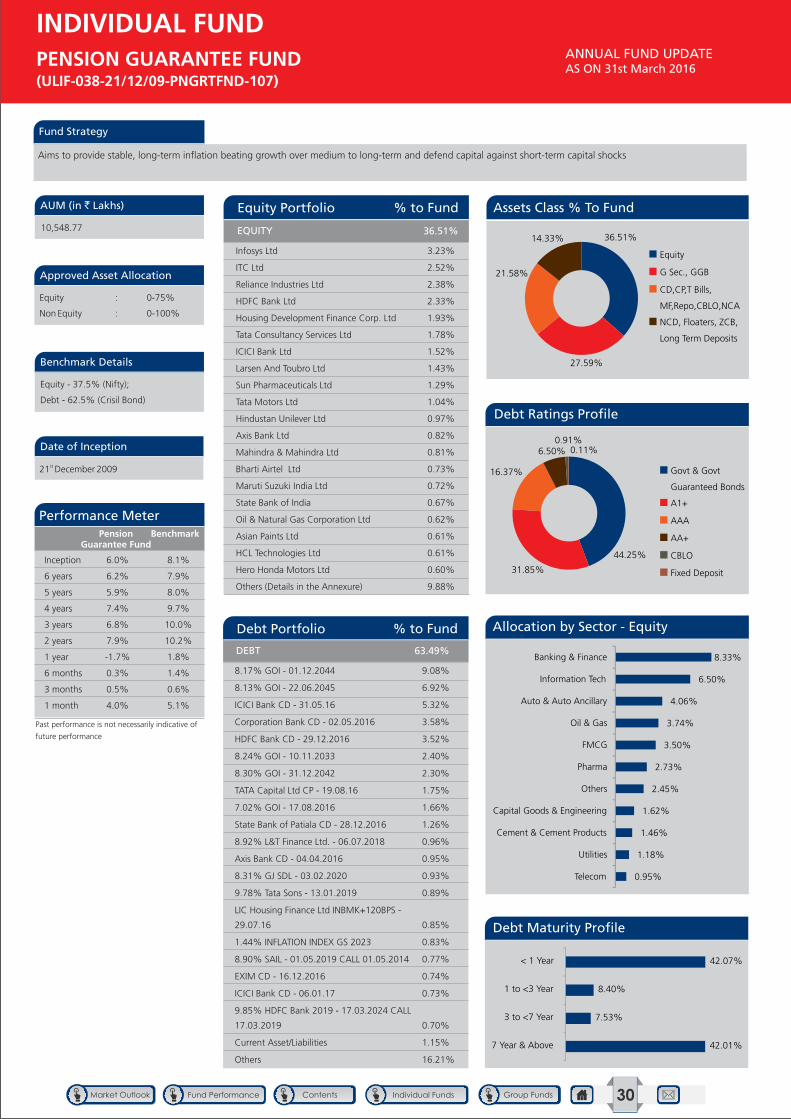
Fund Strategy
Aims to provide stable, long-term inflation beating growth over medium to long-term and defend capital against short-term capital shocks
Approved Asset Allocation
Benchmark Details
AUM (in ` Lakhs)
Date of Inception
Equity : 0-75%
Non Equity : 0-100%
Equity - 37.5% (Nifty);
Debt - 62.5% (Crisil Bond)
10,548.77
st21 December 2009
Infosys Ltd 3.23%
ITC Ltd 2.52%
Reliance Industries Ltd 2.38%
HDFC Bank Ltd 2.33%
Housing Development Finance Corp. Ltd 1.93%
Tata Consultancy Services Ltd 1.78%
ICICI Bank Ltd 1.52%
Larsen And Toubro Ltd 1.43%
Sun Pharmaceuticals Ltd 1.29%
Tata Motors Ltd 1.04%
Hindustan Unilever Ltd 0.97%
Axis Bank Ltd 0.82%
Mahindra & Mahindra Ltd 0.81%
Bharti Airtel Ltd 0.73%
Maruti Suzuki India Ltd 0.72%
State Bank of India 0.67%
Oil & Natural Gas Corporation Ltd 0.62%
Asian Paints Ltd 0.61%
HCL Technologies Ltd 0.61%
Hero Honda Motors Ltd 0.60%
Others (Details in the Annexure) 9.88%
36.51%
8.17% GOI - 01.12.2044 9.08%
8.13% GOI - 22.06.2045 6.92%
ICICI Bank CD - 31.05.16 5.32%
Corporation Bank CD - 02.05.2016 3.58%
HDFC Bank CD - 29.12.2016 3.52%
8.24% GOI - 10.11.2033 2.40%
8.30% GOI - 31.12.2042 2.30%
TATA Capital Ltd CP - 19.08.16 1.75%
7.02% GOI - 17.08.2016 1.66%
State Bank of Patiala CD - 28.12.2016 1.26%
8.92% L&T Finance Ltd. - 06.07.2018 0.96%
Axis Bank CD - 04.04.2016 0.95%
8.31% GJ SDL - 03.02.2020 0.93%
9.78% Tata Sons - 13.01.2019 0.89%
LIC Housing Finance Ltd INBMK+120BPS -
29.07.16 0.85%
1.44% INFLATION INDEX GS 2023 0.83%
8.90% SAIL - 01.05.2019 CALL 01.05.2014 0.77%
EXIM CD - 16.12.2016 0.74%
ICICI Bank CD - 06.01.17 0.73%
9.85% HDFC Bank 2019 - 17.03.2024 CALL
17.03.2019 0.70%
Current Asset/Liabilities 1.15%
Others 16.21%
DEBT 63.49%
Debt Portfolio % to Fund
Equity Portfolio % to Fund
GROUP FUND
ANNUAL FUND UPDATE AS ON 31st March 2016
PENSION GUARANTEE FUND (ULIF-038-21/12/09-PNGRTFND-107)
INDIVIDUAL FUND
Performance MeterPension
Guarantee FundBenchmark
Past performance is not necessarily indicative of
future performance
Inception 6.0% 8.1%
6 years 6.2% 7.9%
5 years 5.9% 8.0%
4 years 7.4% 9.7%
3 years 6.8% 10.0%
2 years 7.9% 10.2%
1 year -1.7% 1.8%
6 months 0.3% 1.4%
3 months 0.5% 0.6%
1 month 4.0% 5.1%
Assets Class % To Fund
Debt Ratings Profile
Allocation by Sector - Equity
Debt Maturity Profile
36.51%
27.59%
21.58%
14.33%
Equity
G Sec., GGB
CD,CP,T Bills,
MF,Repo,CBLO,NCA
NCD, Floaters, ZCB,
Long Term Deposits
44.25%
31.85%
16.37%
6.50%0.91%
0.11%
Govt & Govt
Guaranteed Bonds
A1+
AAA
AA+
CBLO
Fixed Deposit
42.01%
7.53%
8.40%
42.07%
7 Year & Above
3 to <7 Year
1 to <3 Year
< 1 Year
0.95%
1.18%
1.46%
1.62%
2.45%
2.73%
3.50%
3.74%
4.06%
6.50%
8.33%
Telecom
Utilities
Cement & Cement Products
Capital Goods & Engineering
Others
Pharma
FMCG
Oil & Gas
Auto & Auto Ancillary
Information Tech
Banking & Finance
EQUITY
30
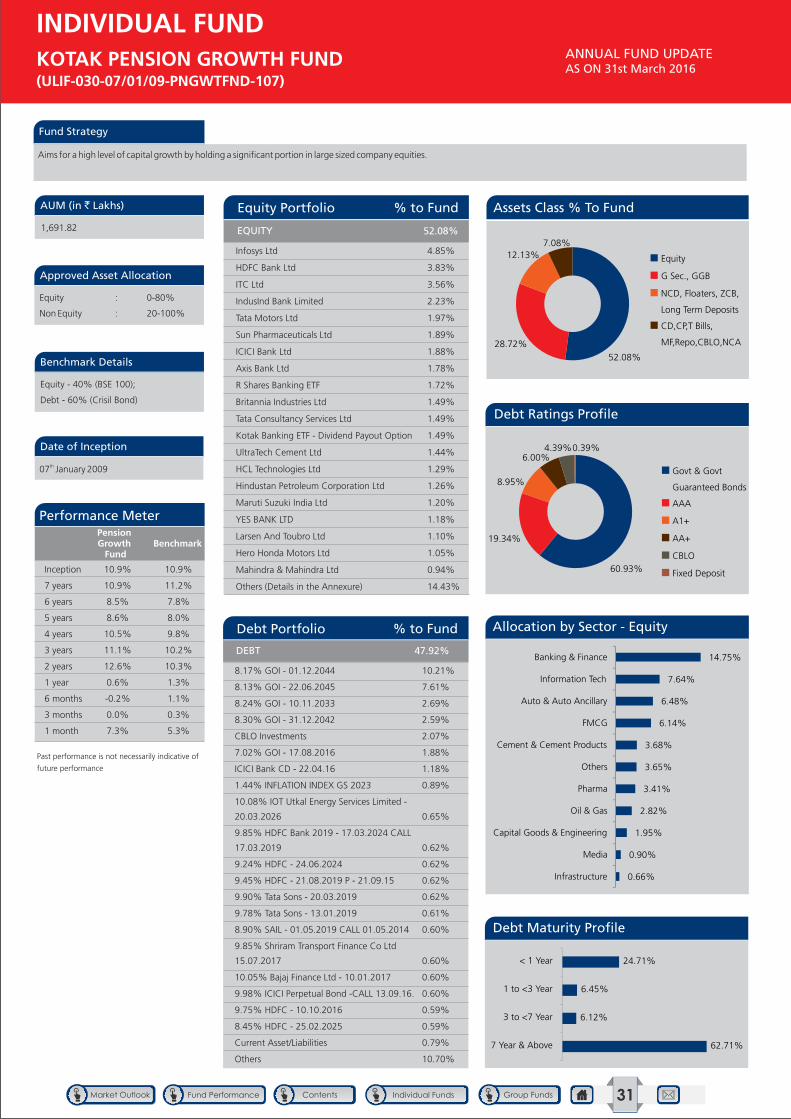
Fund Strategy
Aims for a high level of capital growth by holding a significant portion in large sized company equities.
Approved Asset Allocation
Benchmark Details
AUM (in ` Lakhs)
Date of Inception
Equity : 0-80%
Non Equity : 20-100%
Equity - 40% (BSE 100);
Debt - 60% (Crisil Bond)
1,691.82
th07 January 2009
Infosys Ltd 4.85%
HDFC Bank Ltd 3.83%
ITC Ltd 3.56%
IndusInd Bank Limited 2.23%
Tata Motors Ltd 1.97%
Sun Pharmaceuticals Ltd 1.89%
ICICI Bank Ltd 1.88%
Axis Bank Ltd 1.78%
R Shares Banking ETF 1.72%
Britannia Industries Ltd 1.49%
Tata Consultancy Services Ltd 1.49%
Kotak Banking ETF - Dividend Payout Option 1.49%
UltraTech Cement Ltd 1.44%
HCL Technologies Ltd 1.29%
Hindustan Petroleum Corporation Ltd 1.26%
Maruti Suzuki India Ltd 1.20%
YES BANK LTD 1.18%
Larsen And Toubro Ltd 1.10%
Hero Honda Motors Ltd 1.05%
Mahindra & Mahindra Ltd 0.94%
Others (Details in the Annexure) 14.43%
52.08%
8.17% GOI - 01.12.2044 10.21%
8.13% GOI - 22.06.2045 7.61%
8.24% GOI - 10.11.2033 2.69%
8.30% GOI - 31.12.2042 2.59%
CBLO Investments 2.07%
7.02% GOI - 17.08.2016 1.88%
ICICI Bank CD - 22.04.16 1.18%
1.44% INFLATION INDEX GS 2023 0.89%
10.08% IOT Utkal Energy Services Limited -
20.03.2026 0.65%
9.85% HDFC Bank 2019 - 17.03.2024 CALL
17.03.2019 0.62%
9.24% HDFC - 24.06.2024 0.62%
9.45% HDFC - 21.08.2019 P - 21.09.15 0.62%
9.90% Tata Sons - 20.03.2019 0.62%
9.78% Tata Sons - 13.01.2019 0.61%
8.90% SAIL - 01.05.2019 CALL 01.05.2014 0.60%
9.85% Shriram Transport Finance Co Ltd
15.07.2017 0.60%
10.05% Bajaj Finance Ltd - 10.01.2017 0.60%
9.98% ICICI Perpetual Bond -CALL 13.09.16. 0.60%
9.75% HDFC - 10.10.2016 0.59%
8.45% HDFC - 25.02.2025 0.59%
Current Asset/Liabilities 0.79%
Others 10.70%
DEBT 47.92%
Debt Portfolio % to Fund
Equity Portfolio % to Fund
GROUP FUND
ANNUAL FUND UPDATE AS ON 31st March 2016
KOTAK PENSION GROWTH FUND (ULIF-030-07/01/09-PNGWTFND-107)
INDIVIDUAL FUND
Performance MeterPension Growth Fund
Benchmark
Past performance is not necessarily indicative of
future performance
Inception 10.9% 10.9%
7 years 10.9% 11.2%
6 years 8.5% 7.8%
5 years 8.6% 8.0%
4 years 10.5% 9.8%
3 years 11.1% 10.2%
2 years 12.6% 10.3%
1 year 0.6% 1.3%
6 months -0.2% 1.1%
3 months 0.0% 0.3%
1 month 7.3% 5.3%
Assets Class % To Fund
Debt Ratings Profile
Allocation by Sector - Equity
Debt Maturity Profile
52.08%
28.72%
12.13%
7.08%
Equity
G Sec., GGB
NCD, Floaters, ZCB,
Long Term Deposits
CD,CP,T Bills,
MF,Repo,CBLO,NCA
60.93%
19.34%
8.95%
6.00%
4.39%0.39%
Govt & Govt
Guaranteed Bonds
AAA
A1+
AA+
CBLO
Fixed Deposit
62.71%
6.12%
6.45%
24.71%
7 Year & Above
3 to <7 Year
1 to <3 Year
< 1 Year
0.66%
0.90%
1.95%
2.82%
3.41%
3.65%
3.68%
6.14%
6.48%
7.64%
14.75%
Infrastructure
Media
Capital Goods & Engineering
Oil & Gas
Pharma
Others
Cement & Cement Products
FMCG
Auto & Auto Ancillary
Information Tech
Banking & Finance
EQUITY
31
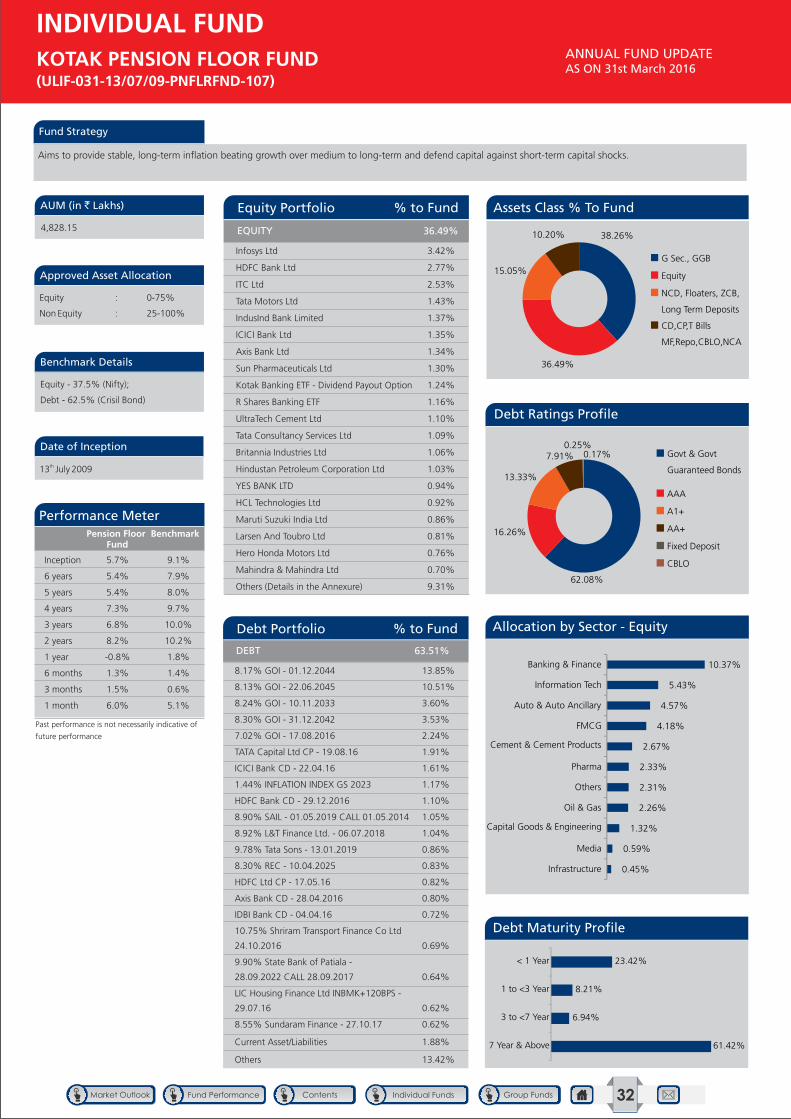
Fund Strategy
Aims to provide stable, long-term inflation beating growth over medium to long-term and defend capital against short-term capital shocks.
Approved Asset Allocation
Benchmark Details
AUM (in ` Lakhs)
Date of Inception
Equity : 0-75%
Non Equity : 25-100%
Equity - 37.5% (Nifty);
Debt - 62.5% (Crisil Bond)
4,828.15
th13 July 2009
Infosys Ltd 3.42%
HDFC Bank Ltd 2.77%
ITC Ltd 2.53%
Tata Motors Ltd 1.43%
IndusInd Bank Limited 1.37%
ICICI Bank Ltd 1.35%
Axis Bank Ltd 1.34%
Sun Pharmaceuticals Ltd 1.30%
Kotak Banking ETF - Dividend Payout Option 1.24%
R Shares Banking ETF 1.16%
UltraTech Cement Ltd 1.10%
Tata Consultancy Services Ltd 1.09%
Britannia Industries Ltd 1.06%
Hindustan Petroleum Corporation Ltd 1.03%
YES BANK LTD 0.94%
HCL Technologies Ltd 0.92%
Maruti Suzuki India Ltd 0.86%
Larsen And Toubro Ltd 0.81%
Hero Honda Motors Ltd 0.76%
Mahindra & Mahindra Ltd 0.70%
Others (Details in the Annexure) 9.31%
36.49%
8.17% GOI - 01.12.2044 13.85%
8.13% GOI - 22.06.2045 10.51%
8.24% GOI - 10.11.2033 3.60%
8.30% GOI - 31.12.2042 3.53%
7.02% GOI - 17.08.2016 2.24%
TATA Capital Ltd CP - 19.08.16 1.91%
ICICI Bank CD - 22.04.16 1.61%
1.44% INFLATION INDEX GS 2023 1.17%
HDFC Bank CD - 29.12.2016 1.10%
8.90% SAIL - 01.05.2019 CALL 01.05.2014 1.05%
8.92% L&T Finance Ltd. - 06.07.2018 1.04%
9.78% Tata Sons - 13.01.2019 0.86%
8.30% REC - 10.04.2025 0.83%
HDFC Ltd CP - 17.05.16 0.82%
Axis Bank CD - 28.04.2016 0.80%
IDBI Bank CD - 04.04.16 0.72%
10.75% Shriram Transport Finance Co Ltd
24.10.2016 0.69%
9.90% State Bank of Patiala -
28.09.2022 CALL 28.09.2017 0.64%
LIC Housing Finance Ltd INBMK+120BPS -
29.07.16 0.62%
8.55% Sundaram Finance - 27.10.17 0.62%
Current Asset/Liabilities 1.88%
Others 13.42%
DEBT 63.51%
Debt Portfolio % to Fund
Equity Portfolio % to Fund
GROUP FUND
ANNUAL FUND UPDATE AS ON 31st March 2016
KOTAK PENSION FLOOR FUND (ULIF-031-13/07/09-PNFLRFND-107)
INDIVIDUAL FUND
Performance MeterPension Floor
FundBenchmark
Past performance is not necessarily indicative of
future performance
Inception 5.7% 9.1%
6 years 5.4% 7.9%
5 years 5.4% 8.0%
4 years 7.3% 9.7%
3 years 6.8% 10.0%
2 years 8.2% 10.2%
1 year -0.8% 1.8%
6 months 1.3% 1.4%
3 months 1.5% 0.6%
1 month 6.0% 5.1%
Assets Class % To Fund
Debt Ratings Profile
Allocation by Sector - Equity
Debt Maturity Profile
61.42%
6.94%
8.21%
23.42%
7 Year & Above
3 to <7 Year
1 to <3 Year
< 1 Year
62.08%
16.26%
13.33%
7.91%0.25%
0.17% Govt & Govt
Guaranteed Bonds
AAA
A1+
AA+
Fixed Deposit
CBLO
38.26%
36.49%
15.05%
10.20%
G Sec., GGB
Equity
NCD, Floaters, ZCB,
Long Term Deposits
CD,CP,T Bills
MF,Repo,CBLO,NCA
0.45%
0.59%
1.32%
2.26%
2.31%
2.33%
2.67%
4.18%
4.57%
5.43%
10.37%
Infrastructure
Media
Capital Goods & Engineering
Oil & Gas
Others
Pharma
Cement & Cement Products
FMCG
Auto & Auto Ancillary
Information Tech
Banking & Finance
EQUITY
32

Fund Strategy
Aims to provide stable, long-term inflation beating growth over medium to long-term and defend capital against short-term capital shocks.
Approved Asset Allocation
Benchmark Details
AUM (in ` Lakhs)
Date of Inception
Equity : 0-75%
Non Equity : 25-100%
Equity - 37.5% (Nifty);
Debt - 62.5% (Crisil Bond)
8,025.83
th08 January 2010
Infosys Ltd 3.40%
HDFC Bank Ltd 2.72%
ITC Ltd 2.53%
IndusInd Bank Limited 1.53%
Tata Motors Ltd 1.42%
Sun Pharmaceuticals Ltd 1.42%
R Shares Banking ETF 1.38%
ICICI Bank Ltd 1.35%
Axis Bank Ltd 1.34%
Kotak Banking ETF - Dividend Payout Option 1.24%
Britannia Industries Ltd 1.17%
UltraTech Cement Ltd 1.08%
Tata Consultancy Services Ltd 1.08%
HCL Technologies Ltd 0.93%
Hindustan Petroleum Corporation Ltd 0.92%
YES BANK LTD 0.92%
Maruti Suzuki India Ltd 0.87%
Larsen And Toubro Ltd 0.81%
Hero Honda Motors Ltd 0.76%
Shree Cement Ltd 0.71%
Others (Details in the Annexure) 10.16%
37.75%
8.17% GOI - 01.12.2044 13.82%
8.13% GOI - 22.06.2045 10.57%
8.24% GOI - 10.11.2033 3.71%
8.30% GOI - 31.12.2042 3.53%
7.02% GOI - 17.08.2016 2.56%
ICICI Bank CD - 22.04.16 1.59%
1.44% INFLATION INDEX GS 2023 1.20%
8.92% L&T Finance Ltd. - 06.07.2018 0.94%
9.78% Tata Sons - 13.01.2019 0.91%
Axis Bank CD - 28.04.2016 0.80%
8.30% REC - 10.04.2025 0.75%
LIC Housing Finance Ltd INBMK+120BPS -
29.07.16 0.75%
HDFC Ltd CP - 17.05.16 0.74%
IDBI Bank CD - 04.04.16 0.72%
9.24% HDFC - 24.06.2024 0.65%
7.59% GOI 2016-12.04.16 0.65%
8.90% SAIL - 01.05.2019 CALL 01.05.2014 0.63%
10.05% Bajaj Finance Ltd - 10.01.2017 0.63%
PFC CP - 26.05.2016 0.62%
9.85% HDFC Bank 2019 - 17.03.2024 CALL
17.03.2019 0.52%
Current Asset/Liabilities 2.49%
Others 13.47%
DEBT 62.25%
Debt Portfolio % to Fund
Equity Portfolio % to Fund
GROUP FUND
ANNUAL FUND UPDATE AS ON 31st March 2016
PENSION FLOOR FUND II (ULIF-043-08/01/10-PNFLRKFND2-107)
INDIVIDUAL FUND
Performance MeterPension Floor
Fund IIBenchmark
Past performance is not necessarily indicative of
future performance
Inception 6.0% 7.8%
6 years 6.2% 7.9%
5 years 5.9% 8.0%
4 years 7.4% 9.7%
3 years 6.8% 10.0%
2 years 8.0% 10.2%
1 year -1.6% 1.8%
6 months 0.4% 1.4%
3 months 1.0% 0.6%
1 month 6.2% 5.1%
Assets Class % To Fund
Debt Ratings Profile
Allocation by Sector - Equity
Debt Maturity Profile
64.81%
7.98%
7.87%
19.34%
7 Year & Above
3 to <7 Year
1 to <3 Year
< 1 Year
66.02%
18.73%
8.19%
6.28%0.63%
0.15%
Govt & Govt
Guaranteed Bonds
AAA
A1+
AA+
CBLO
Fixed Deposit
39.45%
37.75%
15.04%
7.76% G Sec., GGB
Equity
NCD, Floaters, ZCB,
Long Term Deposits
CD,CP,T Bills
MF,Repo,CBLO,NCA
0.48%
0.66%
1.34%
2.09%
2.36%
2.46%
2.73%
4.50%
4.62%
5.41%
11.09%
Infrastructure
Media
Capital Goods & Engineering
Oil & Gas
Pharma
Others
Cement & Cement Products
FMCG
Auto & Auto Ancillary
Information Tech
Banking & Finance
EQUITY
33
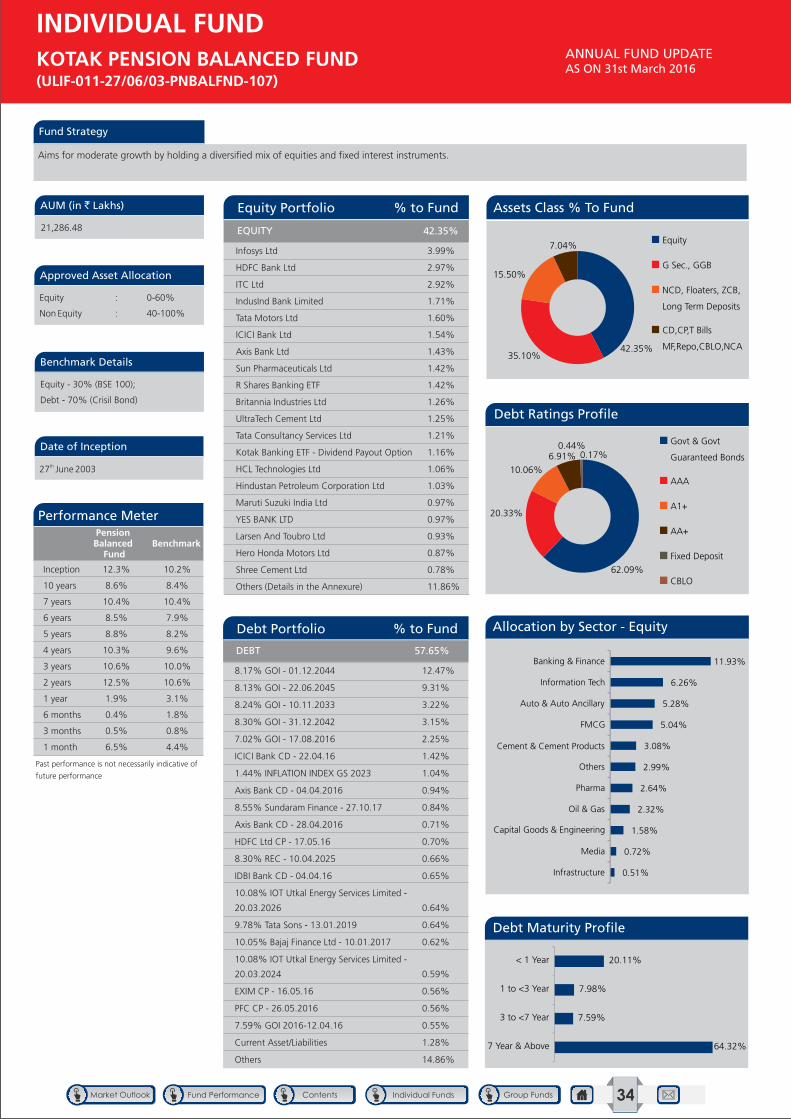
Fund Strategy
Aims for moderate growth by holding a diversified mix of equities and fixed interest instruments.
Approved Asset Allocation
Benchmark Details
AUM (in ` Lakhs)
Date of Inception
Equity : 0-60%
Non Equity : 40-100%
Equity - 30% (BSE 100);
Debt - 70% (Crisil Bond)
21,286.48
th27 June 2003
Infosys Ltd 3.99%
HDFC Bank Ltd 2.97%
ITC Ltd 2.92%
IndusInd Bank Limited 1.71%
Tata Motors Ltd 1.60%
ICICI Bank Ltd 1.54%
Axis Bank Ltd 1.43%
Sun Pharmaceuticals Ltd 1.42%
R Shares Banking ETF 1.42%
Britannia Industries Ltd 1.26%
UltraTech Cement Ltd 1.25%
Tata Consultancy Services Ltd 1.21%
Kotak Banking ETF - Dividend Payout Option 1.16%
HCL Technologies Ltd 1.06%
Hindustan Petroleum Corporation Ltd 1.03%
Maruti Suzuki India Ltd 0.97%
YES BANK LTD 0.97%
Larsen And Toubro Ltd 0.93%
Hero Honda Motors Ltd 0.87%
Shree Cement Ltd 0.78%
Others (Details in the Annexure) 11.86%
42.35%
8.17% GOI - 01.12.2044 12.47%
8.13% GOI - 22.06.2045 9.31%
8.24% GOI - 10.11.2033 3.22%
8.30% GOI - 31.12.2042 3.15%
7.02% GOI - 17.08.2016 2.25%
ICICI Bank CD - 22.04.16 1.42%
1.44% INFLATION INDEX GS 2023 1.04%
Axis Bank CD - 04.04.2016 0.94%
8.55% Sundaram Finance - 27.10.17 0.84%
Axis Bank CD - 28.04.2016 0.71%
HDFC Ltd CP - 17.05.16 0.70%
8.30% REC - 10.04.2025 0.66%
IDBI Bank CD - 04.04.16 0.65%
10.08% IOT Utkal Energy Services Limited -
20.03.2026 0.64%
9.78% Tata Sons - 13.01.2019 0.64%
10.05% Bajaj Finance Ltd - 10.01.2017 0.62%
10.08% IOT Utkal Energy Services Limited -
20.03.2024 0.59%
EXIM CP - 16.05.16 0.56%
PFC CP - 26.05.2016 0.56%
7.59% GOI 2016-12.04.16 0.55%
Current Asset/Liabilities 1.28%
Others 14.86%
DEBT 57.65%
Debt Portfolio % to Fund
Equity Portfolio % to Fund
GROUP FUND
ANNUAL FUND UPDATE AS ON 31st March 2016
KOTAK PENSION BALANCED FUND (ULIF-011-27/06/03-PNBALFND-107)
INDIVIDUAL FUND
Performance MeterPension Balanced
FundBenchmark
Past performance is not necessarily indicative of
future performance
Inception 12.3% 10.2%
10 years 8.6% 8.4%
7 years 10.4% 10.4%
6 years 8.5% 7.9%
5 years 8.8% 8.2%
4 years 10.3% 9.6%
3 years 10.6% 10.0%
2 years 12.5% 10.6%
1 year 1.9% 3.1%
6 months 0.4% 1.8%
3 months 0.5% 0.8%
1 month 6.5% 4.4%
64.32%
7.59%
7.98%
20.11%
7 Year & Above
3 to <7 Year
1 to <3 Year
< 1 Year
Assets Class % To Fund
Debt Ratings Profile
Allocation by Sector - Equity
Debt Maturity Profile
62.09%
20.33%
10.06%
6.91%0.44%
0.17%
Govt & Govt
Guaranteed Bonds
AAA
A1+
AA+
Fixed Deposit
CBLO
42.35%35.10%
15.50%
7.04%Equity
G Sec., GGB
NCD, Floaters, ZCB,
Long Term Deposits
CD,CP,T Bills
MF,Repo,CBLO,NCA
0.51%
0.72%
1.58%
2.32%
2.64%
2.99%
3.08%
5.04%
5.28%
6.26%
11.93%
Infrastructure
Media
Capital Goods & Engineering
Oil & Gas
Pharma
Others
Cement & Cement Products
FMCG
Auto & Auto Ancillary
Information Tech
Banking & Finance
EQUITY
34
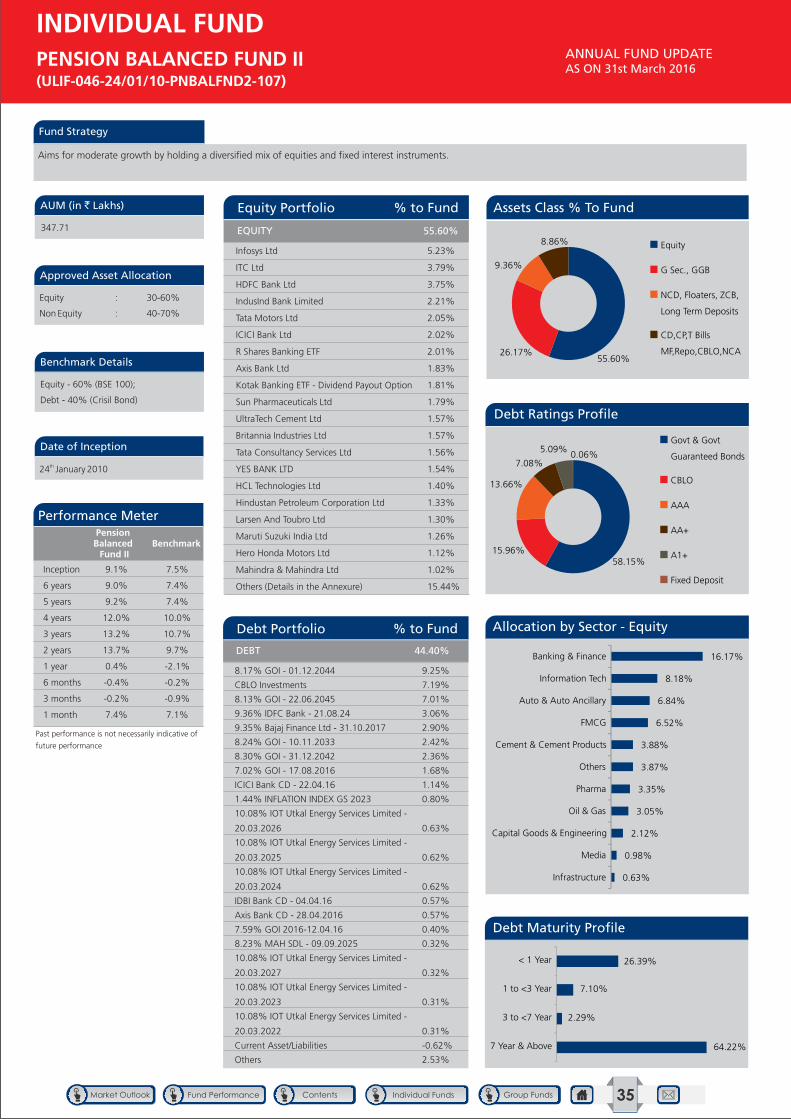
Fund Strategy
Aims for moderate growth by holding a diversified mix of equities and fixed interest instruments.
Approved Asset Allocation
Benchmark Details
AUM (in ` Lakhs)
Date of Inception
Equity : 30-60%
Non Equity : 40-70%
Equity - 60% (BSE 100);
Debt - 40% (Crisil Bond)
347.71
th24 January 2010
Infosys Ltd 5.23%
ITC Ltd 3.79%
HDFC Bank Ltd 3.75%
IndusInd Bank Limited 2.21%
Tata Motors Ltd 2.05%
ICICI Bank Ltd 2.02%
R Shares Banking ETF 2.01%
Axis Bank Ltd 1.83%
Kotak Banking ETF - Dividend Payout Option 1.81%
Sun Pharmaceuticals Ltd 1.79%
UltraTech Cement Ltd 1.57%
Britannia Industries Ltd 1.57%
Tata Consultancy Services Ltd 1.56%
YES BANK LTD 1.54%
HCL Technologies Ltd 1.40%
Hindustan Petroleum Corporation Ltd 1.33%
Larsen And Toubro Ltd 1.30%
Maruti Suzuki India Ltd 1.26%
Hero Honda Motors Ltd 1.12%
Mahindra & Mahindra Ltd 1.02%
Others (Details in the Annexure) 15.44%
55.60%
8.17% GOI - 01.12.2044 9.25%
CBLO Investments 7.19%
8.13% GOI - 22.06.2045 7.01%
9.36% IDFC Bank - 21.08.24 3.06%
9.35% Bajaj Finance Ltd - 31.10.2017 2.90%
8.24% GOI - 10.11.2033 2.42%
8.30% GOI - 31.12.2042 2.36%
7.02% GOI - 17.08.2016 1.68%
ICICI Bank CD - 22.04.16 1.14%
1.44% INFLATION INDEX GS 2023 0.80%
10.08% IOT Utkal Energy Services Limited -
20.03.2026 0.63%
10.08% IOT Utkal Energy Services Limited -
20.03.2025 0.62%
10.08% IOT Utkal Energy Services Limited -
20.03.2024 0.62%
IDBI Bank CD - 04.04.16 0.57%
Axis Bank CD - 28.04.2016 0.57%
7.59% GOI 2016-12.04.16 0.40%
8.23% MAH SDL - 09.09.2025 0.32%
10.08% IOT Utkal Energy Services Limited -
20.03.2027 0.32%
10.08% IOT Utkal Energy Services Limited -
20.03.2023 0.31%
10.08% IOT Utkal Energy Services Limited -
20.03.2022 0.31%
Current Asset/Liabilities -0.62%
Others 2.53%
DEBT 44.40%
Debt Portfolio % to Fund
Equity Portfolio % to Fund
GROUP FUND
ANNUAL FUND UPDATE AS ON 31st March 2016
PENSION BALANCED FUND II (ULIF-046-24/01/10-PNBALFND2-107)
INDIVIDUAL FUND
Benchmark
Performance MeterPension Balanced Fund II
Benchmark
Past performance is not necessarily indicative of
future performance
Inception 9.1% 7.5%
6 years 9.0% 7.4%
5 years 9.2% 7.4%
4 years 12.0% 10.0%
3 years 13.2% 10.7%
2 years 13.7% 9.7%
1 year 0.4% -2.1%
6 months -0.4% -0.2%
3 months -0.2% -0.9%
1 month 7.4% 7.1%
55.60%26.17%
9.36%
8.86% Equity
G Sec., GGB
NCD, Floaters, ZCB,
Long Term Deposits
CD,CP,T Bills
MF,Repo,CBLO,NCA
64.22%
2.29%
7.10%
26.39%
7 Year & Above
3 to <7 Year
1 to <3 Year
< 1 Year
Assets Class % To Fund
Debt Ratings Profile
Allocation by Sector - Equity
Debt Maturity Profile
58.15%15.96%
13.66%
7.08%
5.09%0.06%
Govt & Govt
Guaranteed Bonds
CBLO
AAA
AA+
A1+
Fixed Deposit
0.63%
0.98%
2.12%
3.05%
3.35%
3.87%
3.88%
6.52%
6.84%
8.18%
16.17%
Infrastructure
Media
Capital Goods & Engineering
Oil & Gas
Pharma
Others
Cement & Cement Products
FMCG
Auto & Auto Ancillary
Information Tech
Banking & Finance
EQUITY
35
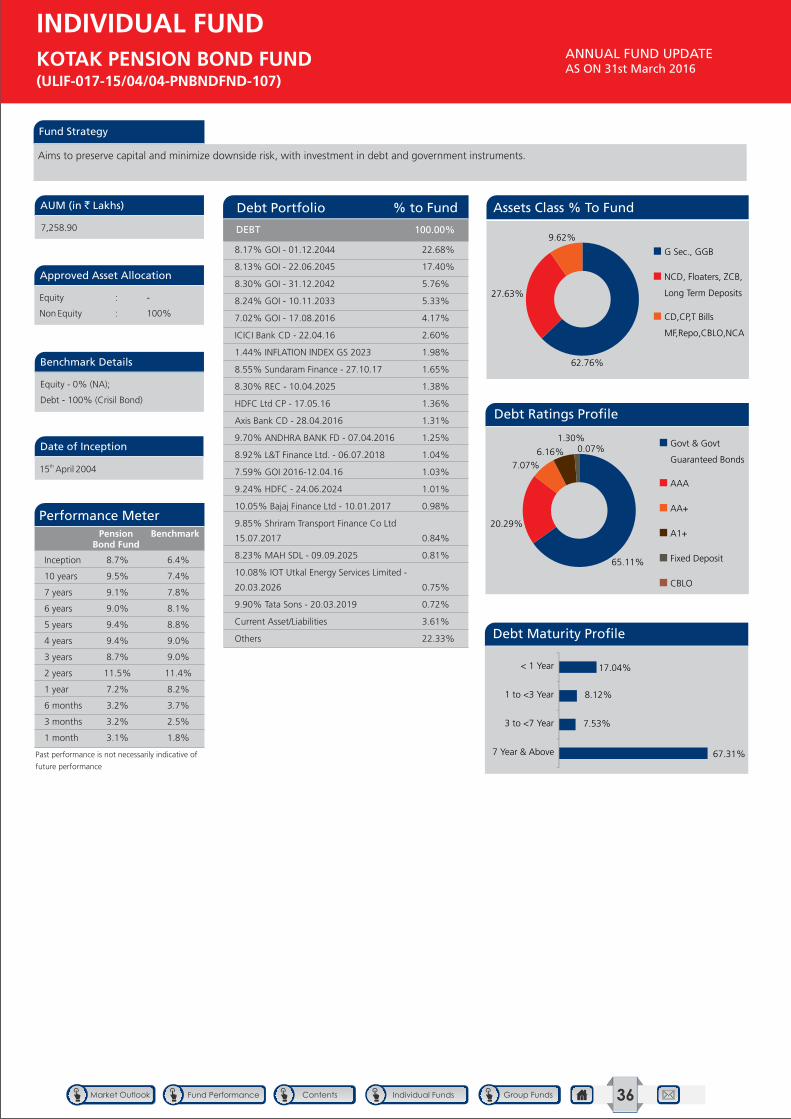
Fund Strategy
Aims to preserve capital and minimize downside risk, with investment in debt and government instruments.
Approved Asset Allocation
Benchmark Details
AUM (in ` Lakhs)
Date of Inception
Equity : -
Non Equity : 100%
Equity - 0% (NA);
Debt - 100% (Crisil Bond)
7,258.90
th15 April 2004
8.17% GOI - 01.12.2044 22.68%
8.13% GOI - 22.06.2045 17.40%
8.30% GOI - 31.12.2042 5.76%
8.24% GOI - 10.11.2033 5.33%
7.02% GOI - 17.08.2016 4.17%
ICICI Bank CD - 22.04.16 2.60%
1.44% INFLATION INDEX GS 2023 1.98%
8.55% Sundaram Finance - 27.10.17 1.65%
8.30% REC - 10.04.2025 1.38%
HDFC Ltd CP - 17.05.16 1.36%
Axis Bank CD - 28.04.2016 1.31%
9.70% ANDHRA BANK FD - 07.04.2016 1.25%
8.92% L&T Finance Ltd. - 06.07.2018 1.04%
7.59% GOI 2016-12.04.16 1.03%
9.24% HDFC - 24.06.2024 1.01%
10.05% Bajaj Finance Ltd - 10.01.2017 0.98%
9.85% Shriram Transport Finance Co Ltd
15.07.2017 0.84%
8.23% MAH SDL - 09.09.2025 0.81%
10.08% IOT Utkal Energy Services Limited -
20.03.2026 0.75%
9.90% Tata Sons - 20.03.2019 0.72%
Current Asset/Liabilities 3.61%
Others 22.33%
DEBT 100.00%
Debt Portfolio % to Fund
ANNUAL FUND UPDATE AS ON 31st March 2016
KOTAK PENSION BOND FUND (ULIF-017-15/04/04-PNBNDFND-107)
INDIVIDUAL FUND
Performance MeterPension
Bond FundBenchmark
Past performance is not necessarily indicative of
future performance
Inception 8.7% 6.4%
10 years 9.5% 7.4%
7 years 9.1% 7.8%
6 years 9.0% 8.1%
5 years 9.4% 8.8%
4 years 9.4% 9.0%
3 years 8.7% 9.0%
2 years 11.5% 11.4%
1 year 7.2% 8.2%
6 months 3.2% 3.7%
3 months 3.2% 2.5%
1 month 3.1% 1.8%
65.11%
20.29%
7.07%
6.16%
1.30%0.07%
Govt & Govt
Guaranteed Bonds
AAA
AA+
A1+
Fixed Deposit
CBLO
Assets Class % To Fund
Debt Ratings Profile
Debt Maturity Profile
67.31%
7.53%
8.12%
17.04%
7 Year & Above
3 to <7 Year
1 to <3 Year
< 1 Year
62.76%
27.63%
9.62%
G Sec., GGB
NCD, Floaters, ZCB,
Long Term Deposits
CD,CP,T Bills
MF,Repo,CBLO,NCA
36
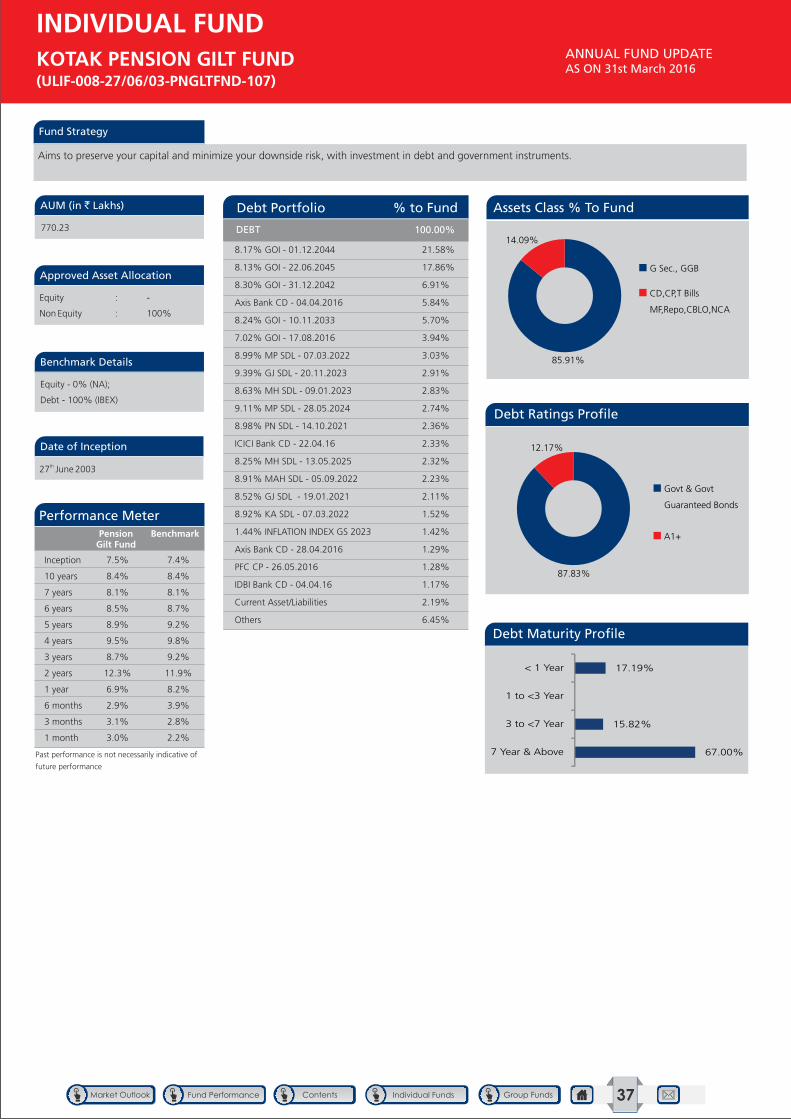
Fund Strategy
Aims to preserve your capital and minimize your downside risk, with investment in debt and government instruments.
Approved Asset Allocation
Benchmark Details
AUM (in ` Lakhs)
Date of Inception
Equity : -
Non Equity : 100%
Equity - 0% (NA);
Debt - 100% (IBEX)
770.23
th27 June 2003
GROUP FUND
ANNUAL FUND UPDATE AS ON 31st March 2016
KOTAK PENSION GILT FUND (ULIF-008-27/06/03-PNGLTFND-107)
INDIVIDUAL FUND
8.17% GOI - 01.12.2044 21.58%
8.13% GOI - 22.06.2045 17.86%
8.30% GOI - 31.12.2042 6.91%
Axis Bank CD - 04.04.2016 5.84%
8.24% GOI - 10.11.2033 5.70%
7.02% GOI - 17.08.2016 3.94%
8.99% MP SDL - 07.03.2022 3.03%
9.39% GJ SDL - 20.11.2023 2.91%
8.63% MH SDL - 09.01.2023 2.83%
9.11% MP SDL - 28.05.2024 2.74%
8.98% PN SDL - 14.10.2021 2.36%
ICICI Bank CD - 22.04.16 2.33%
8.25% MH SDL - 13.05.2025 2.32%
8.91% MAH SDL - 05.09.2022 2.23%
8.52% GJ SDL - 19.01.2021 2.11%
8.92% KA SDL - 07.03.2022 1.52%
1.44% INFLATION INDEX GS 2023 1.42%
Axis Bank CD - 28.04.2016 1.29%
PFC CP - 26.05.2016 1.28%
IDBI Bank CD - 04.04.16 1.17%
Current Asset/Liabilities 2.19%
Others 6.45%
DEBT 100.00%
Debt Portfolio % to Fund
Performance MeterPension
Gilt FundBenchmark
Past performance is not necessarily indicative of
future performance
Inception 7.5% 7.4%
10 years 8.4% 8.4%
7 years 8.1% 8.1%
6 years 8.5% 8.7%
5 years 8.9% 9.2%
4 years 9.5% 9.8%
3 years 8.7% 9.2%
2 years 12.3% 11.9%
1 year 6.9% 8.2%
6 months 2.9% 3.9%
3 months 3.1% 2.8%
1 month 3.0% 2.2%
Assets Class % To Fund
Debt Ratings Profile
Debt Maturity Profile
87.83%
12.17%
Govt & Govt
Guaranteed Bonds
A1+
85.91%
14.09%
G Sec., GGB
CD,CP,T Bills
MF,Repo,CBLO,NCA
37
67.00%
15.82%
17.19%
7 Year & Above
3 to <7 Year
1 to <3 Year
< 1 Year
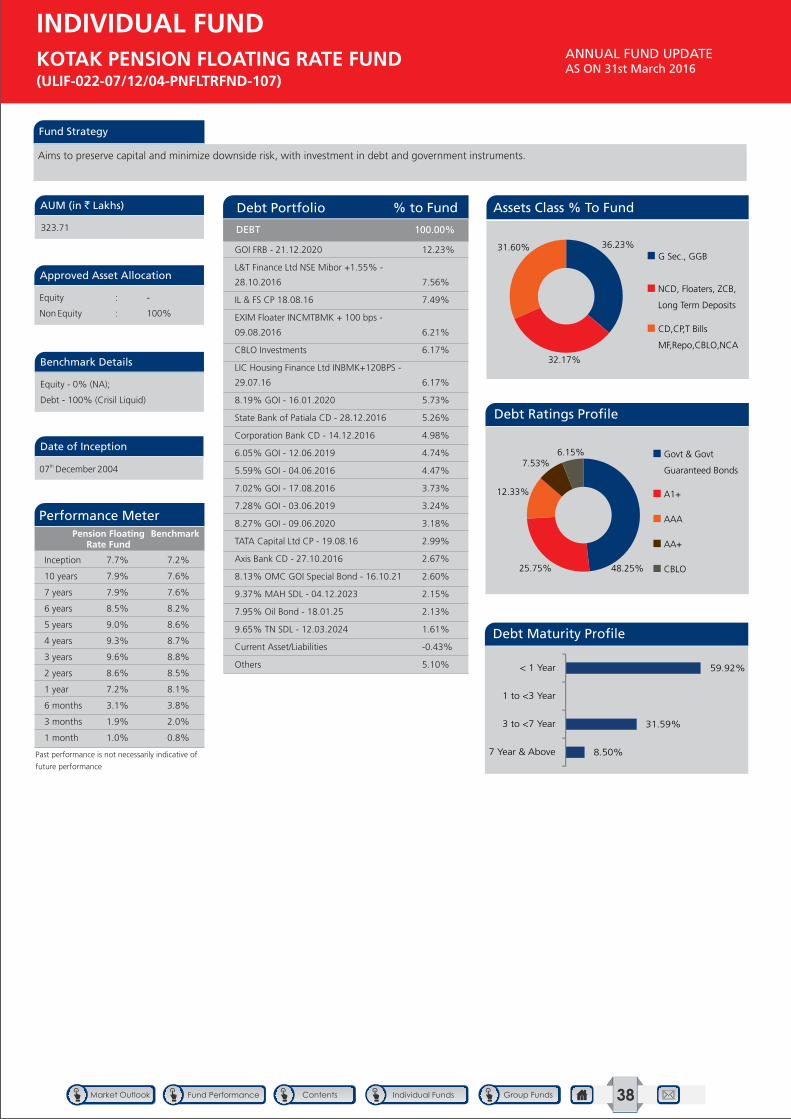
Fund Strategy
Aims to preserve capital and minimize downside risk, with investment in debt and government instruments.
Approved Asset Allocation
Benchmark Details
AUM (in ` Lakhs)
Date of Inception
Equity : -
Non Equity : 100%
Equity - 0% (NA);
Debt - 100% (Crisil Liquid)
323.71
th07 December 2004
GROUP FUND
ANNUAL FUND UPDATE AS ON 31st March 2016
KOTAK PENSION FLOATING RATE FUND (ULIF-022-07/12/04-PNFLTRFND-107)
INDIVIDUAL FUND
GOI FRB - 21.12.2020 12.23%
L&T Finance Ltd NSE Mibor +1.55% -
28.10.2016 7.56%
IL & FS CP 18.08.16 7.49%
EXIM Floater INCMTBMK + 100 bps -
09.08.2016 6.21%
CBLO Investments 6.17%
LIC Housing Finance Ltd INBMK+120BPS -
29.07.16 6.17%
8.19% GOI - 16.01.2020 5.73%
State Bank of Patiala CD - 28.12.2016 5.26%
Corporation Bank CD - 14.12.2016 4.98%
6.05% GOI - 12.06.2019 4.74%
5.59% GOI - 04.06.2016 4.47%
7.02% GOI - 17.08.2016 3.73%
7.28% GOI - 03.06.2019 3.24%
8.27% GOI - 09.06.2020 3.18%
TATA Capital Ltd CP - 19.08.16 2.99%
Axis Bank CD - 27.10.2016 2.67%
8.13% OMC GOI Special Bond - 16.10.21 2.60%
9.37% MAH SDL - 04.12.2023 2.15%
7.95% Oil Bond - 18.01.25 2.13%
9.65% TN SDL - 12.03.2024 1.61%
Current Asset/Liabilities -0.43%
Others 5.10%
DEBT 100.00%
Debt Portfolio % to Fund
Performance MeterPension Floating
Rate FundBenchmark
Past performance is not necessarily indicative of
future performance
Inception 7.7% 7.2%
10 years 7.9% 7.6%
7 years 7.9% 7.6%
6 years 8.5% 8.2%
5 years 9.0% 8.6%
4 years 9.3% 8.7%
3 years 9.6% 8.8%
2 years 8.6% 8.5%
1 year 7.2% 8.1%
6 months 3.1% 3.8%
3 months 1.9% 2.0%
1 month 1.0% 0.8%
Assets Class % To Fund
Debt Ratings Profile
Debt Maturity Profile
48.25%25.75%
12.33%
7.53%6.15% Govt & Govt
Guaranteed Bonds
A1+
AAA
AA+
CBLO
36.23%
32.17%
31.60%G Sec., GGB
NCD, Floaters, ZCB,
Long Term Deposits
CD,CP,T Bills
MF,Repo,CBLO,NCA
38
8.50%
31.59%
59.92%
7 Year & Above
3 to <7 Year
1 to <3 Year
< 1 Year
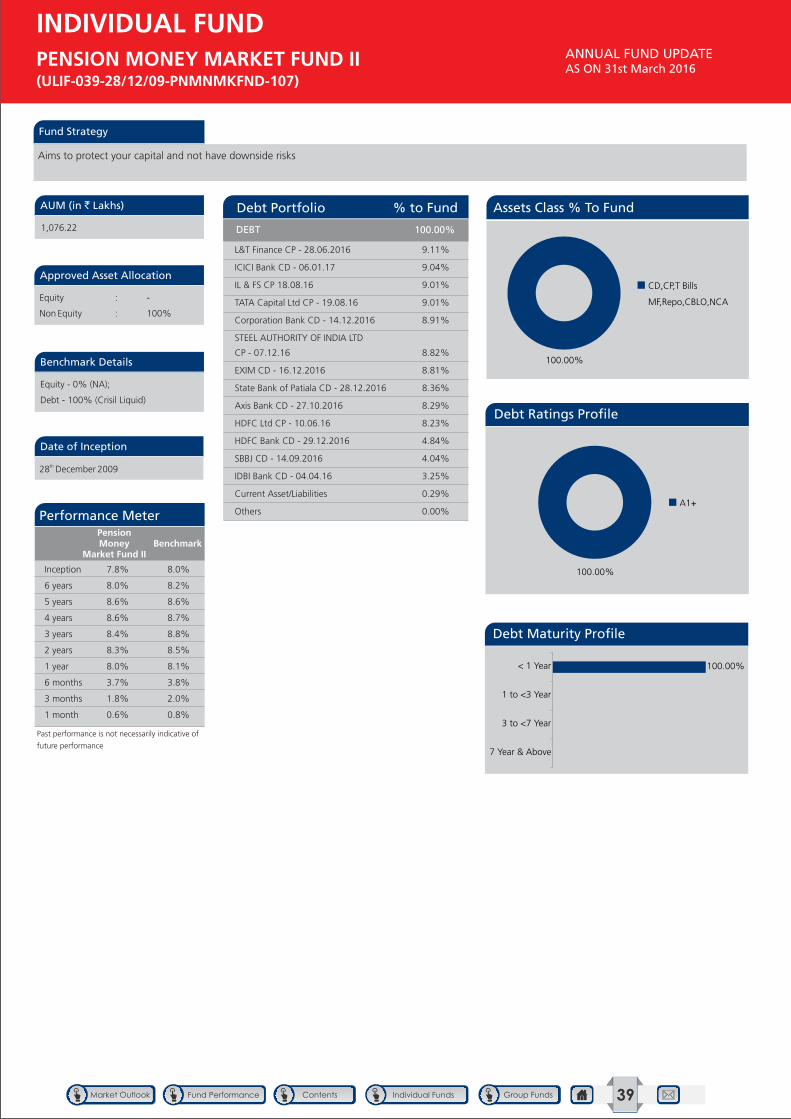
Fund Strategy
Aims to protect your capital and not have downside risks
Approved Asset Allocation
Benchmark Details
AUM (in ` Lakhs)
Date of Inception
Equity : -
Non Equity : 100%
Equity - 0% (NA);
Debt - 100% (Crisil Liquid)
1,076.22
th28 December 2009
GROUP FUND
ANNUAL FUND UPDATE AS ON 31st March 2016
PENSION MONEY MARKET FUND II (ULIF-039-28/12/09-PNMNMKFND-107)
INDIVIDUAL FUND
L&T Finance CP - 28.06.2016 9.11%
ICICI Bank CD - 06.01.17 9.04%
IL & FS CP 18.08.16 9.01%
TATA Capital Ltd CP - 19.08.16 9.01%
Corporation Bank CD - 14.12.2016 8.91%
STEEL AUTHORITY OF INDIA LTD
CP - 07.12.16 8.82%
EXIM CD - 16.12.2016 8.81%
State Bank of Patiala CD - 28.12.2016 8.36%
Axis Bank CD - 27.10.2016 8.29%
HDFC Ltd CP - 10.06.16 8.23%
HDFC Bank CD - 29.12.2016 4.84%
SBBJ CD - 14.09.2016 4.04%
IDBI Bank CD - 04.04.16 3.25%
Current Asset/Liabilities 0.29%
Others 0.00%
DEBT 100.00%
Debt Portfolio % to Fund
Performance MeterPension Money
Market Fund IIBenchmark
Past performance is not necessarily indicative of
future performance
Inception 7.8% 8.0%
6 years 8.0% 8.2%
5 years 8.6% 8.6%
4 years 8.6% 8.7%
3 years 8.4% 8.8%
2 years 8.3% 8.5%
1 year 8.0% 8.1%
6 months 3.7% 3.8%
3 months 1.8% 2.0%
1 month 0.6% 0.8%
Assets Class % To Fund
Debt Ratings Profile
Debt Maturity Profile
100.00%
7 Year & Above
3 to <7 Year
1 to <3 Year
< 1 Year
100.00%
A1+
100.00%
CD,CP,T Bills
MF,Repo,CBLO,NCA
39
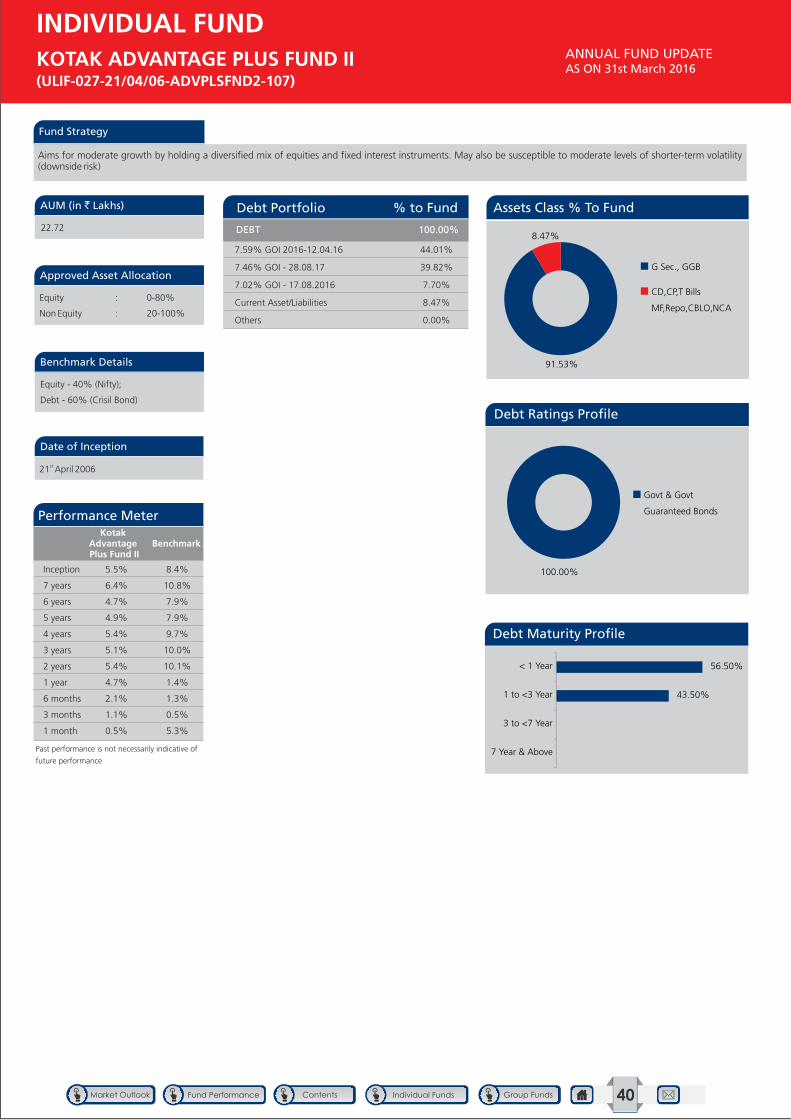
Fund Strategy
Aims for moderate growth by holding a diversified mix of equities and fixed interest instruments. May also be susceptible to moderate levels of shorter-term volatility (downside risk)
Approved Asset Allocation
Benchmark Details
AUM (in ` Lakhs)
Date of Inception
Equity : 0-80%
Non Equity : 20-100%
Equity - 40% (Nifty);
Debt - 60% (Crisil Bond)
22.72
st21 April 2006
GROUP FUND
ANNUAL FUND UPDATE AS ON 31st March 2016
KOTAK ADVANTAGE PLUS FUND II (ULIF-027-21/04/06-ADVPLSFND2-107)
INDIVIDUAL FUND
7.59% GOI 2016-12.04.16 44.01%
7.46% GOI - 28.08.17 39.82%
7.02% GOI - 17.08.2016 7.70%
Current Asset/Liabilities 8.47%
Others 0.00%
DEBT 100.00%
Debt Portfolio % to Fund
Performance MeterKotak
Advantage Plus Fund II
Benchmark
Past performance is not necessarily indicative of
future performance
Inception 5.5% 8.4%
7 years 6.4% 10.8%
6 years 4.7% 7.9%
5 years 4.9% 7.9%
4 years 5.4% 9.7%
3 years 5.1% 10.0%
2 years 5.4% 10.1%
1 year 4.7% 1.4%
6 months 2.1% 1.3%
3 months 1.1% 0.5%
1 month 0.5% 5.3%
Assets Class % To Fund
Debt Ratings Profile
Debt Maturity Profile
43.50%
56.50%
7 Year & Above
3 to <7 Year
1 to <3 Year
< 1 Year
100.00%
Govt & Govt
Guaranteed Bonds
91.53%
8.47%
G Sec., GGB
CD,CP,T Bills
MF,Repo,CBLO,NCA
40
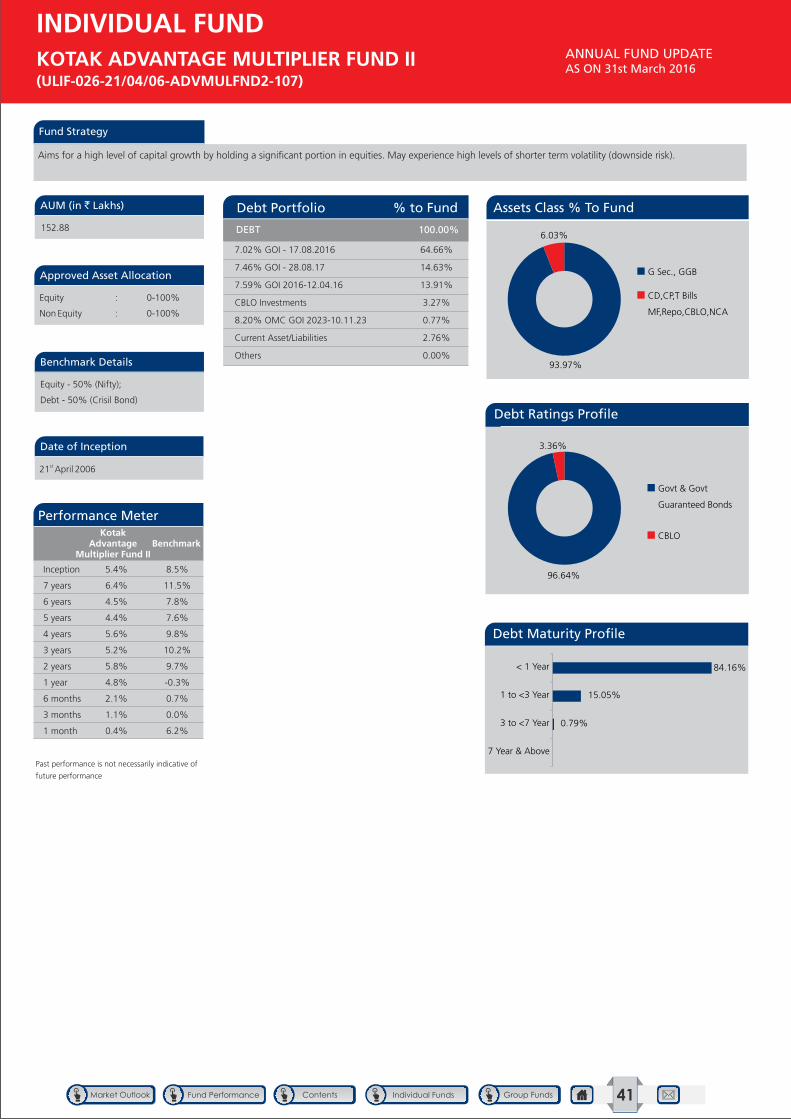
Fund Strategy
Aims for a high level of capital growth by holding a significant portion in equities. May experience high levels of shorter term volatility (downside risk).
Approved Asset Allocation
Benchmark Details
AUM (in ` Lakhs)
Date of Inception
Equity : 0-100%
Non Equity : 0-100%
Equity - 50% (Nifty);
Debt - 50% (Crisil Bond)
152.88
st21 April 2006
GROUP FUND
ANNUAL FUND UPDATE AS ON 31st March 2016
KOTAK ADVANTAGE MULTIPLIER FUND II (ULIF-026-21/04/06-ADVMULFND2-107)
INDIVIDUAL FUND
7.02% GOI - 17.08.2016 64.66%
7.46% GOI - 28.08.17 14.63%
7.59% GOI 2016-12.04.16 13.91%
CBLO Investments 3.27%
8.20% OMC GOI 2023-10.11.23 0.77%
Current Asset/Liabilities 2.76%
Others 0.00%
DEBT 100.00%
Debt Portfolio % to Fund
Performance MeterKotak
Advantage Multiplier Fund II
Benchmark
Past performance is not necessarily indicative of
future performance
Inception 5.4% 8.5%
7 years 6.4% 11.5%
6 years 4.5% 7.8%
5 years 4.4% 7.6%
4 years 5.6% 9.8%
3 years 5.2% 10.2%
2 years 5.8% 9.7%
1 year 4.8% -0.3%
6 months 2.1% 0.7%
3 months 1.1% 0.0%
1 month 0.4% 6.2%
Assets Class % To Fund
Debt Ratings Profile
Debt Maturity Profile
0.79%
15.05%
84.16%
7 Year & Above
3 to <7 Year
1 to <3 Year
< 1 Year
96.64%
3.36%
Govt & Govt
Guaranteed Bonds
CBLO
93.97%
6.03%
G Sec., GGB
CD,CP,T Bills
MF,Repo,CBLO,NCA
41

Fund Strategy
Aims to provide secure returns to policies in the discontinued state, by investing in low- risk debt instruments.
Approved Asset Allocation
Benchmark Details
AUM (in ` Lakhs)
Date of Inception
Equity : -
Non Equity : 100%
Debt - 100%
(Crisil Liquid)
16,036.72
rd23 March 2011
GROUP FUND
ANNUAL FUND UPDATE AS ON 31st March 2016
DISCONTINUED POLICY FUND (ULIF-050-23/03/11-DISPOLFND-107)
INDIVIDUAL FUND
7.59% GOI 2016-12.04.16 45.65%
7.02% GOI - 17.08.2016 31.17%
TATA Capital Ltd CP - 19.08.16 6.68%
STEEL AUTHORITY OF INDIA
LTD CP - 07.12.16 4.74%
Axis Bank CD - 27.10.2016 4.65%
L&T Finance CP - 28.06.2016 4.55%
Axis Bank CD - 04.04.2016 3.11%
IDBI Bank CD - 04.04.16 1.25%
PFC CP - 26.05.2016 1.05%
EXIM CD - 16.12.2016 0.12%
CBLO Investments 0.09%
Current Asset/Liabilities -3.06%
Others 0.00%
DEBT 100.00%
Debt Portfolio % to Fund
Performance MeterDiscontinued
Policy Fund
Benchmark
Past performance is not necessarily indicative of
future performance
Inception 8.4% 8.6%
5 years 8.5% 8.6%
4 years 8.5% 8.7%
3 years 8.1% 8.8%
2 years 8.0% 8.5%
1 year 7.5% 8.1%
6 months 3.5% 3.8%
3 months 1.8% 2.0%
1 month 0.6% 0.8%
Assets Class % To Fund
Debt Ratings Profile
Debt Maturity Profile
100.00%
7 Year & Above
3 to <7 Year
1 to <3 Year
< 1 Year
74.54%
25.37%0.09%
Govt & Govt Guaranteed
Bonds
A1+
CBLO
76.82%
23.18%
G Sec., GGB
CD,CP,T Bills
MF,Repo,CBLO,NCA
42
GROUP FUNDS
ANNUAL FUND UPDATE AS ON 31st MARCH 2016
KOTAK GROUP DYNAMIC FLOOR FUND
KOTAK GROUP BALANCED FUND
KOTAK GROUP BOND FUND
KOTAK GROUP GILT FUND
KOTAK GROUP FLOATING RATE FUND
KOTAK GROUP MONEY MARKET FUND
KOTAK GROUP SECURE CAPITAL FUND
KOTAK 57M FMP
KOTAK GROUP SHORT TERM BOND FUND
43
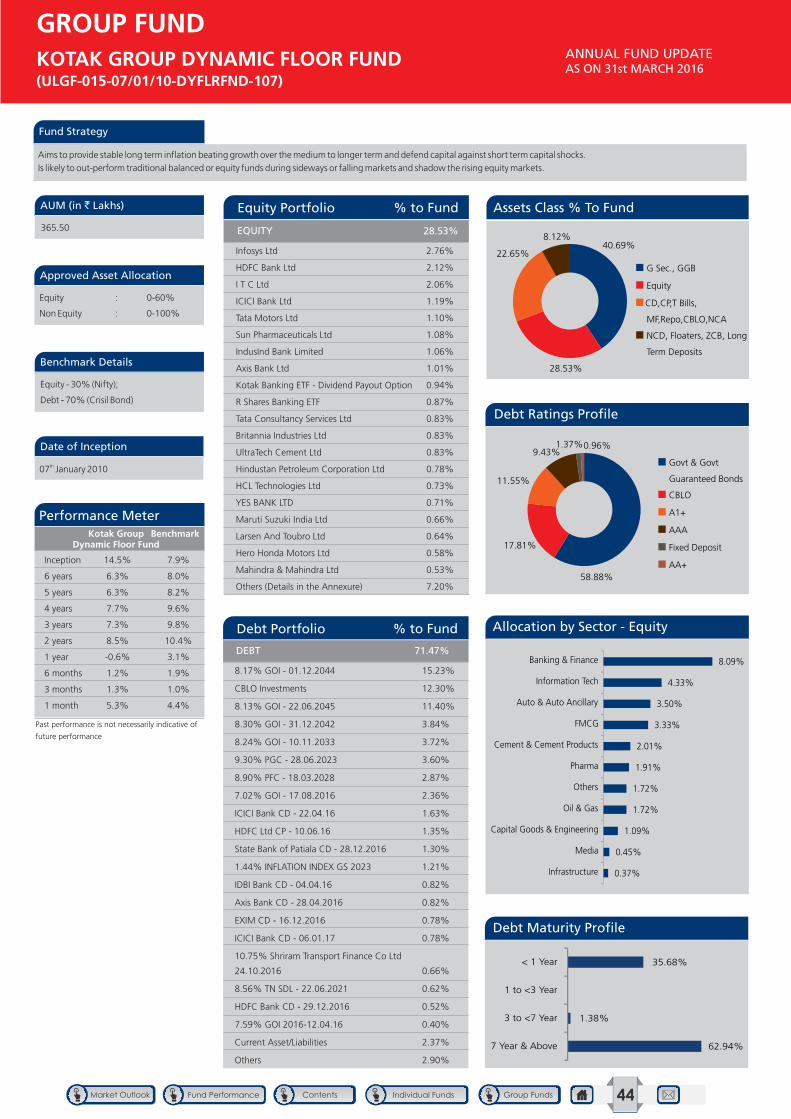
Fund Strategy
Aims to provide stable long term inflation beating growth over the medium to longer term and defend capital against short term capital shocks.
Is likely to out-perform traditional balanced or equity funds during sideways or falling markets and shadow the rising equity markets.
Performance Meter
Approved Asset Allocation
Benchmark Details
AUM (in ` Lakhs)
Date of Inception
Equity : 0-60%
Non Equity : 0-100%
Equity - 30% (Nifty);
Debt - 70% (Crisil Bond)
365.50
th07 January 2010
Kotak Group Dynamic Floor Fund
Benchmark
Infosys Ltd 2.76%
HDFC Bank Ltd 2.12%
I T C Ltd 2.06%
ICICI Bank Ltd 1.19%
Tata Motors Ltd 1.10%
Sun Pharmaceuticals Ltd 1.08%
IndusInd Bank Limited 1.06%
Axis Bank Ltd 1.01%
Kotak Banking ETF - Dividend Payout Option 0.94%
R Shares Banking ETF 0.87%
Tata Consultancy Services Ltd 0.83%
Britannia Industries Ltd 0.83%
UltraTech Cement Ltd 0.83%
Hindustan Petroleum Corporation Ltd 0.78%
HCL Technologies Ltd 0.73%
YES BANK LTD 0.71%
Maruti Suzuki India Ltd 0.66%
Larsen And Toubro Ltd 0.64%
Hero Honda Motors Ltd 0.58%
Mahindra & Mahindra Ltd 0.53%
Others (Details in the Annexure) 7.20%
EQUITY 28.53%
8.17% GOI - 01.12.2044 15.23%
CBLO Investments 12.30%
8.13% GOI - 22.06.2045 11.40%
8.30% GOI - 31.12.2042 3.84%
8.24% GOI - 10.11.2033 3.72%
9.30% PGC - 28.06.2023 3.60%
8.90% PFC - 18.03.2028 2.87%
7.02% GOI - 17.08.2016 2.36%
ICICI Bank CD - 22.04.16 1.63%
HDFC Ltd CP - 10.06.16 1.35%
State Bank of Patiala CD - 28.12.2016 1.30%
1.44% INFLATION INDEX GS 2023 1.21%
IDBI Bank CD - 04.04.16 0.82%
Axis Bank CD - 28.04.2016 0.82%
EXIM CD - 16.12.2016 0.78%
ICICI Bank CD - 06.01.17 0.78%
10.75% Shriram Transport Finance Co Ltd
24.10.2016 0.66%
8.56% TN SDL - 22.06.2021 0.62%
HDFC Bank CD - 29.12.2016 0.52%
7.59% GOI 2016-12.04.16 0.40%
Current Asset/Liabilities 2.37%
Others 2.90%
DEBT 71.47%
Debt Portfolio % to Fund
Equity Portfolio % to Fund
Past performance is not necessarily indicative of
future performance
Inception 14.5% 7.9%
6 years 6.3% 8.0%
5 years 6.3% 8.2%
4 years 7.7% 9.6%
3 years 7.3% 9.8%
2 years 8.5% 10.4%
1 year -0.6% 3.1%
6 months 1.2% 1.9%
3 months 1.3% 1.0%
1 month 5.3% 4.4%
GROUP FUND
ANNUAL FUND UPDATE AS ON 31st MARCH 2016
KOTAK GROUP DYNAMIC FLOOR FUND(ULGF-015-07/01/10-DYFLRFND-107)
GROUP FUND
Govt & Govt
Guaranteed Bonds
CBLO
A1+
AAA
Fixed Deposit
AA+58.88%
17.81%
11.55%
9.43%1.37%0.96%
Assets Class % To Fund
Debt Ratings Profile
Allocation by Sector - Equity
Debt Maturity Profile
40.69%
28.53%
22.65%
8.12%
G Sec., GGB
Equity
CD,CP,T Bills,
MF,Repo,CBLO,NCA
NCD, Floaters, ZCB, Long
Term Deposits
0.37%
0.45%
1.09%
1.72%
1.72%
1.91%
2.01%
3.33%
3.50%
4.33%
8.09%
Infrastructure
Media
Capital Goods & Engineering
Oil & Gas
Others
Pharma
Cement & Cement Products
FMCG
Auto & Auto Ancillary
Information Tech
Banking & Finance
44
62.94%
1.38%
35.68%
7 Year & Above
3 to <7 Year
1 to <3 Year
< 1 Year
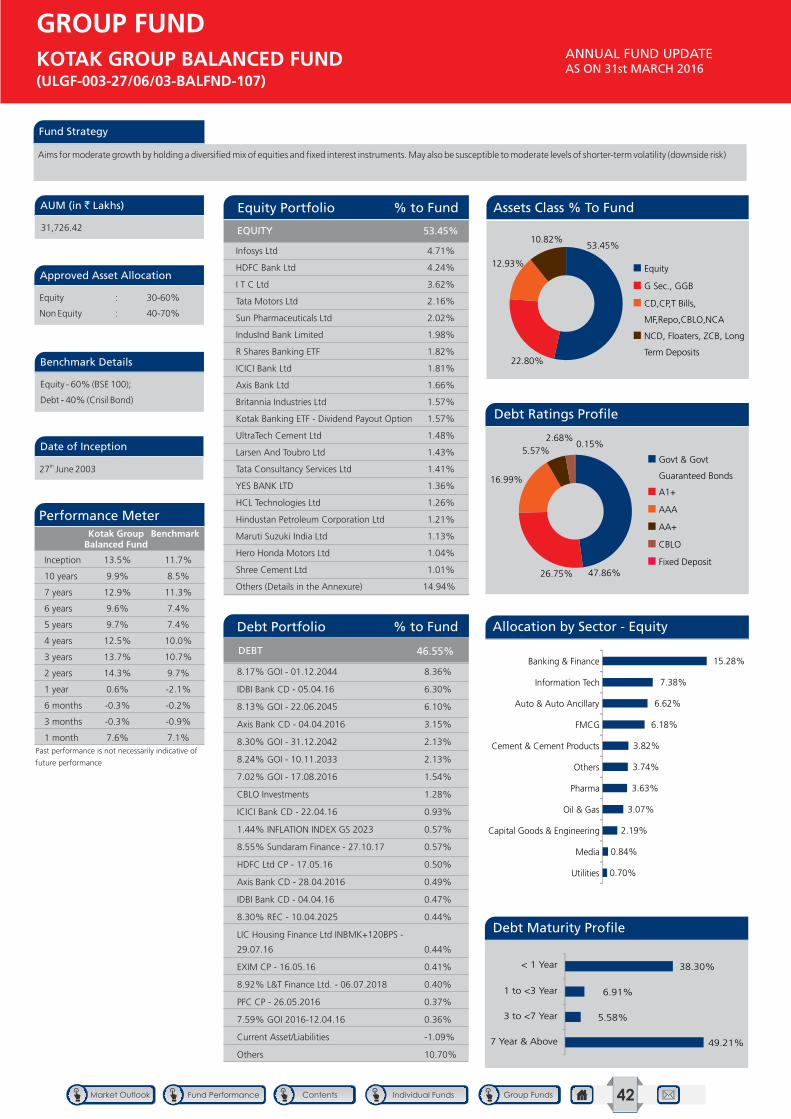
Fund Strategy
Aims for moderate growth by holding a diversified mix of equities and fixed interest instruments. May also be susceptible to moderate levels of shorter-term volatility (downside risk)
Performance Meter
Approved Asset Allocation
Benchmark Details
AUM (in ` Lakhs)
Date of Inception
Equity : 30-60%
Non Equity : 40-70%
Equity - 60% (BSE 100);
Debt - 40% (Crisil Bond)
31,726.42
th27 June 2003
Kotak Group Balanced Fund
Benchmark
Infosys Ltd 4.71%
HDFC Bank Ltd 4.24%
I T C Ltd 3.62%
Tata Motors Ltd 2.16%
Sun Pharmaceuticals Ltd 2.02%
IndusInd Bank Limited 1.98%
R Shares Banking ETF 1.82%
ICICI Bank Ltd 1.81%
Axis Bank Ltd 1.66%
Britannia Industries Ltd 1.57%
Kotak Banking ETF - Dividend Payout Option 1.57%
UltraTech Cement Ltd 1.48%
Larsen And Toubro Ltd 1.43%
Tata Consultancy Services Ltd 1.41%
YES BANK LTD 1.36%
HCL Technologies Ltd 1.26%
Hindustan Petroleum Corporation Ltd 1.21%
Maruti Suzuki India Ltd 1.13%
Hero Honda Motors Ltd 1.04%
Shree Cement Ltd 1.01%
Others (Details in the Annexure) 14.94%
EQUITY 53.45%
Equity Portfolio % to Fund
Past performance is not necessarily indicative of
future performance
Inception 13.5% 11.7%
10 years 9.9% 8.5%
7 years 12.9% 11.3%
6 years 9.6% 7.4%
5 years 9.7% 7.4%
4 years 12.5% 10.0%
3 years 13.7% 10.7%
2 years 14.3% 9.7%
1 year 0.6% -2.1%
6 months -0.3% -0.2%
3 months -0.3% -0.9%
1 month 7.6% 7.1%
GROUP FUND
ANNUAL FUND UPDATE AS ON 31st MARCH 2016
KOTAK GROUP BALANCED FUND(ULGF-003-27/06/03-BALFND-107)
GROUP FUND
Debt Portfolio % to Fund
8.17% GOI - 01.12.2044 8.36%
IDBI Bank CD - 05.04.16 6.30%
8.13% GOI - 22.06.2045 6.10%
Axis Bank CD - 04.04.2016 3.15%
8.30% GOI - 31.12.2042 2.13%
8.24% GOI - 10.11.2033 2.13%
7.02% GOI - 17.08.2016 1.54%
CBLO Investments 1.28%
ICICI Bank CD - 22.04.16 0.93%
1.44% INFLATION INDEX GS 2023 0.57%
8.55% Sundaram Finance - 27.10.17 0.57%
HDFC Ltd CP - 17.05.16 0.50%
Axis Bank CD - 28.04.2016 0.49%
IDBI Bank CD - 04.04.16 0.47%
8.30% REC - 10.04.2025 0.44%
LIC Housing Finance Ltd INBMK+120BPS -
29.07.16 0.44%
EXIM CP - 16.05.16 0.41%
8.92% L&T Finance Ltd. - 06.07.2018 0.40%
PFC CP - 26.05.2016 0.37%
7.59% GOI 2016-12.04.16 0.36%
Current Asset/Liabilities -1.09%
Others 10.70%
DEBT 46.55%
47.86%26.75%
16.99%
5.57%2.68%
0.15%
Govt & Govt
Guaranteed Bonds
A1+
AAA
AA+
CBLO
Fixed Deposit
53.45%
22.80%
12.93%
10.82%
Equity
G Sec., GGB
CD,CP,T Bills,
MF,Repo,CBLO,NCA
NCD, Floaters, ZCB, Long
Term Deposits
Assets Class % To Fund
Debt Ratings Profile
Allocation by Sector - Equity
Debt Maturity Profile
0.70%
0.84%
2.19%
3.07%
3.63%
3.74%
3.82%
6.18%
6.62%
7.38%
15.28%
Utilities
Media
Capital Goods & Engineering
Oil & Gas
Pharma
Others
Cement & Cement Products
FMCG
Auto & Auto Ancillary
Information Tech
Banking & Finance
49.21%
5.58%
6.91%
38.30%
7 Year & Above
3 to <7 Year
1 to <3 Year
< 1 Year
42
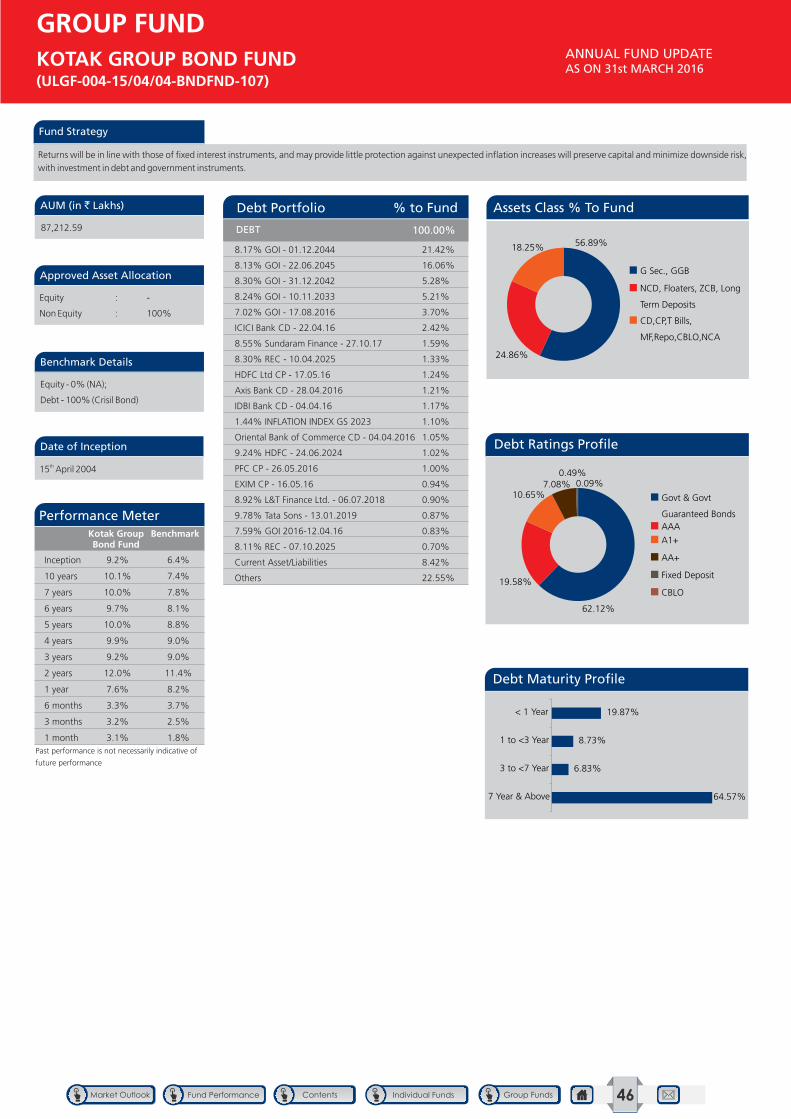
Fund Strategy
Returns will be in line with those of fixed interest instruments, and may provide little protection against unexpected inflation increases will preserve capital and minimize downside risk,
with investment in debt and government instruments.
Performance Meter
Approved Asset Allocation
Benchmark Details
AUM (in ` Lakhs)
Date of Inception
Equity : -
Non Equity : 100%
Equity - 0% (NA);
Debt - 100% (Crisil Bond)
87,212.59
th15 April 2004
Kotak Group Bond Fund
Benchmark
Past performance is not necessarily indicative of
future performance
Inception 9.2% 6.4%
10 years 10.1% 7.4%
7 years 10.0% 7.8%
6 years 9.7% 8.1%
5 years 10.0% 8.8%
4 years 9.9% 9.0%
3 years 9.2% 9.0%
2 years 12.0% 11.4%
1 year 7.6% 8.2%
6 months 3.3% 3.7%
3 months 3.2% 2.5%
1 month 3.1% 1.8%
GROUP FUND
ANNUAL FUND UPDATE AS ON 31st MARCH 2016
KOTAK GROUP BOND FUND(ULGF-004-15/04/04-BNDFND-107)
DEBT 100.00%
Debt Portfolio % to Fund
8.17% GOI - 01.12.2044 21.42%
8.13% GOI - 22.06.2045 16.06%
8.30% GOI - 31.12.2042 5.28%
8.24% GOI - 10.11.2033 5.21%
7.02% GOI - 17.08.2016 3.70%
ICICI Bank CD - 22.04.16 2.42%
8.55% Sundaram Finance - 27.10.17 1.59%
8.30% REC - 10.04.2025 1.33%
HDFC Ltd CP - 17.05.16 1.24%
Axis Bank CD - 28.04.2016 1.21%
IDBI Bank CD - 04.04.16 1.17%
1.44% INFLATION INDEX GS 2023 1.10%
Oriental Bank of Commerce CD - 04.04.2016 1.05%
9.24% HDFC - 24.06.2024 1.02%
PFC CP - 26.05.2016 1.00%
EXIM CP - 16.05.16 0.94%
8.92% L&T Finance Ltd. - 06.07.2018 0.90%
9.78% Tata Sons - 13.01.2019 0.87%
7.59% GOI 2016-12.04.16 0.83%
8.11% REC - 07.10.2025 0.70%
Current Asset/Liabilities 8.42%
Others 22.55%
GROUP FUND
Assets Class % To Fund
Debt Ratings Profile
Debt Maturity Profile
56.89%
24.86%
18.25%
G Sec., GGB
NCD, Floaters, ZCB, Long
Term Deposits
CD,CP,T Bills,
MF,Repo,CBLO,NCA
62.12%
19.58%
10.65% 7.08%
0.49%0.09%
Govt & Govt
Guaranteed BondsAAA
A1+
AA+
Fixed Deposit
CBLO
64.57%
6.83%
8.73%
19.87%
7 Year & Above
3 to <7 Year
1 to <3 Year
< 1 Year
46
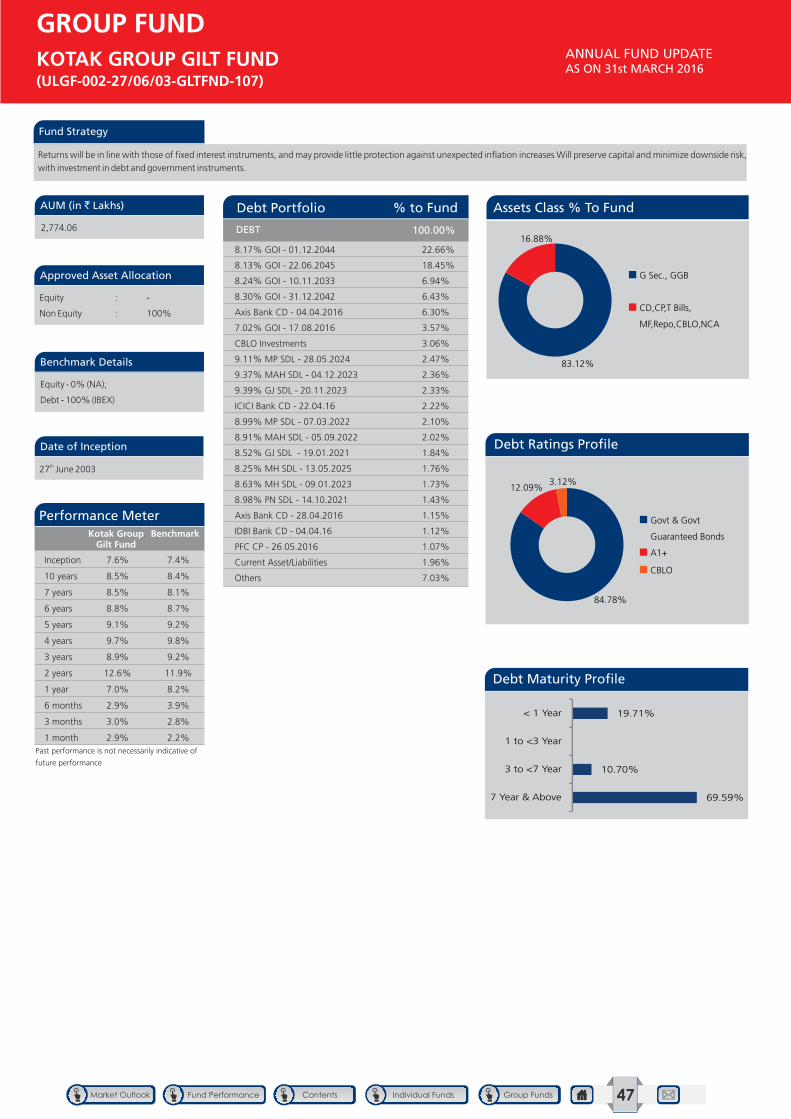
Fund Strategy
Returns will be in line with those of fixed interest instruments, and may provide little protection against unexpected inflation increases Will preserve capital and minimize downside risk,
with investment in debt and government instruments.
Performance Meter
Approved Asset Allocation
Benchmark Details
AUM (in ` Lakhs)
Date of Inception
Equity : -
Non Equity : 100%
Equity - 0% (NA);
Debt - 100% (IBEX)
2,774.06
th27 June 2003
Kotak Group Gilt Fund
Benchmark
Past performance is not necessarily indicative of
future performance
Inception 7.6% 7.4%
10 years 8.5% 8.4%
7 years 8.5% 8.1%
6 years 8.8% 8.7%
5 years 9.1% 9.2%
4 years 9.7% 9.8%
3 years 8.9% 9.2%
2 years 12.6% 11.9%
1 year 7.0% 8.2%
6 months 2.9% 3.9%
3 months 3.0% 2.8%
1 month 2.9% 2.2%
GROUP FUND
ANNUAL FUND UPDATE AS ON 31st MARCH 2016
KOTAK GROUP GILT FUND(ULGF-002-27/06/03-GLTFND-107)
DEBT 100.00%
Debt Portfolio % to Fund
8.17% GOI - 01.12.2044 22.66%
8.13% GOI - 22.06.2045 18.45%
8.24% GOI - 10.11.2033 6.94%
8.30% GOI - 31.12.2042 6.43%
Axis Bank CD - 04.04.2016 6.30%
7.02% GOI - 17.08.2016 3.57%
CBLO Investments 3.06%
9.11% MP SDL - 28.05.2024 2.47%
9.37% MAH SDL - 04.12.2023 2.36%
9.39% GJ SDL - 20.11.2023 2.33%
ICICI Bank CD - 22.04.16 2.22%
8.99% MP SDL - 07.03.2022 2.10%
8.91% MAH SDL - 05.09.2022 2.02%
8.52% GJ SDL - 19.01.2021 1.84%
8.25% MH SDL - 13.05.2025 1.76%
8.63% MH SDL - 09.01.2023 1.73%
8.98% PN SDL - 14.10.2021 1.43%
Axis Bank CD - 28.04.2016 1.15%
IDBI Bank CD - 04.04.16 1.12%
PFC CP - 26.05.2016 1.07%
Current Asset/Liabilities 1.96%
Others 7.03%
GROUP FUND
Assets Class % To Fund
Debt Ratings Profile
Debt Maturity Profile
G Sec., GGB
CD,CP,T Bills,
MF,Repo,CBLO,NCA
83.12%
16.88%
84.78%
12.09%3.12%
Govt & Govt
Guaranteed Bonds
A1+
CBLO
47
69.59%
10.70%
19.71%
7 Year & Above
3 to <7 Year
1 to <3 Year
< 1 Year
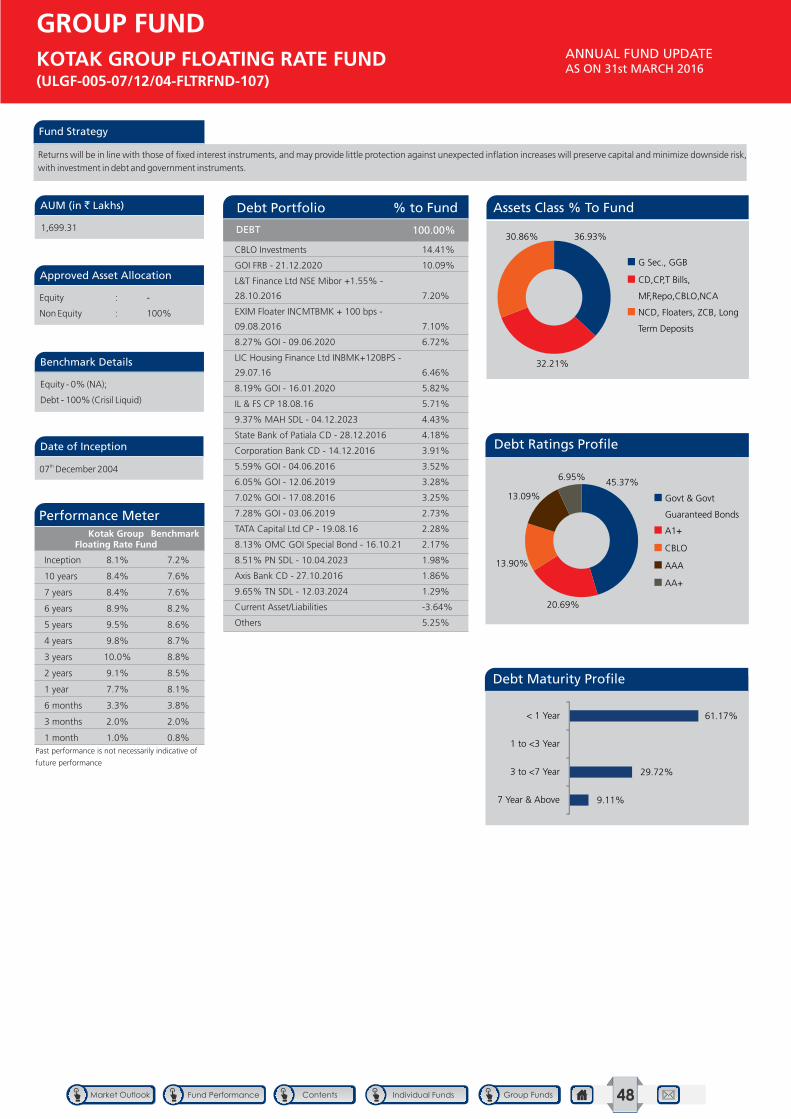
Fund Strategy
Returns will be in line with those of fixed interest instruments, and may provide little protection against unexpected inflation increases will preserve capital and minimize downside risk,
with investment in debt and government instruments.
Performance Meter
Approved Asset Allocation
Benchmark Details
AUM (in ` Lakhs)
Date of Inception
Equity : -
Non Equity : 100%
Equity - 0% (NA);
Debt - 100% (Crisil Liquid)
1,699.31
th07 December 2004
Kotak Group Floating Rate Fund
Benchmark
Past performance is not necessarily indicative of
future performance
Inception 8.1% 7.2%
10 years 8.4% 7.6%
7 years 8.4% 7.6%
6 years 8.9% 8.2%
5 years 9.5% 8.6%
4 years 9.8% 8.7%
3 years 10.0% 8.8%
2 years 9.1% 8.5%
1 year 7.7% 8.1%
6 months 3.3% 3.8%
3 months 2.0% 2.0%
1 month 1.0% 0.8%
GROUP FUND
ANNUAL FUND UPDATE AS ON 31st MARCH 2016
KOTAK GROUP FLOATING RATE FUND(ULGF-005-07/12/04-FLTRFND-107)
DEBT 100.00%
Debt Portfolio % to Fund
CBLO Investments 14.41%
GOI FRB - 21.12.2020 10.09%
L&T Finance Ltd NSE Mibor +1.55% -
28.10.2016 7.20%
EXIM Floater INCMTBMK + 100 bps -
09.08.2016 7.10%
8.27% GOI - 09.06.2020 6.72%
LIC Housing Finance Ltd INBMK+120BPS -
29.07.16 6.46%
8.19% GOI - 16.01.2020 5.82%
IL & FS CP 18.08.16 5.71%
9.37% MAH SDL - 04.12.2023 4.43%
State Bank of Patiala CD - 28.12.2016 4.18%
Corporation Bank CD - 14.12.2016 3.91%
5.59% GOI - 04.06.2016 3.52%
6.05% GOI - 12.06.2019 3.28%
7.02% GOI - 17.08.2016 3.25%
7.28% GOI - 03.06.2019 2.73%
TATA Capital Ltd CP - 19.08.16 2.28%
8.13% OMC GOI Special Bond - 16.10.21 2.17%
8.51% PN SDL - 10.04.2023 1.98%
Axis Bank CD - 27.10.2016 1.86%
9.65% TN SDL - 12.03.2024 1.29%
Current Asset/Liabilities -3.64%
Others 5.25%
GROUP FUND
Assets Class % To Fund
Debt Ratings Profile
Debt Maturity Profile
36.93%
32.21%
30.86%
G Sec., GGB
CD,CP,T Bills,
MF,Repo,CBLO,NCA
NCD, Floaters, ZCB, Long
Term Deposits
45.37%
20.69%
13.90%
13.09%
6.95%
Govt & Govt
Guaranteed Bonds
A1+
CBLO
AAA
AA+
48
9.11%
29.72%
61.17%
7 Year & Above
3 to <7 Year
1 to <3 Year
< 1 Year
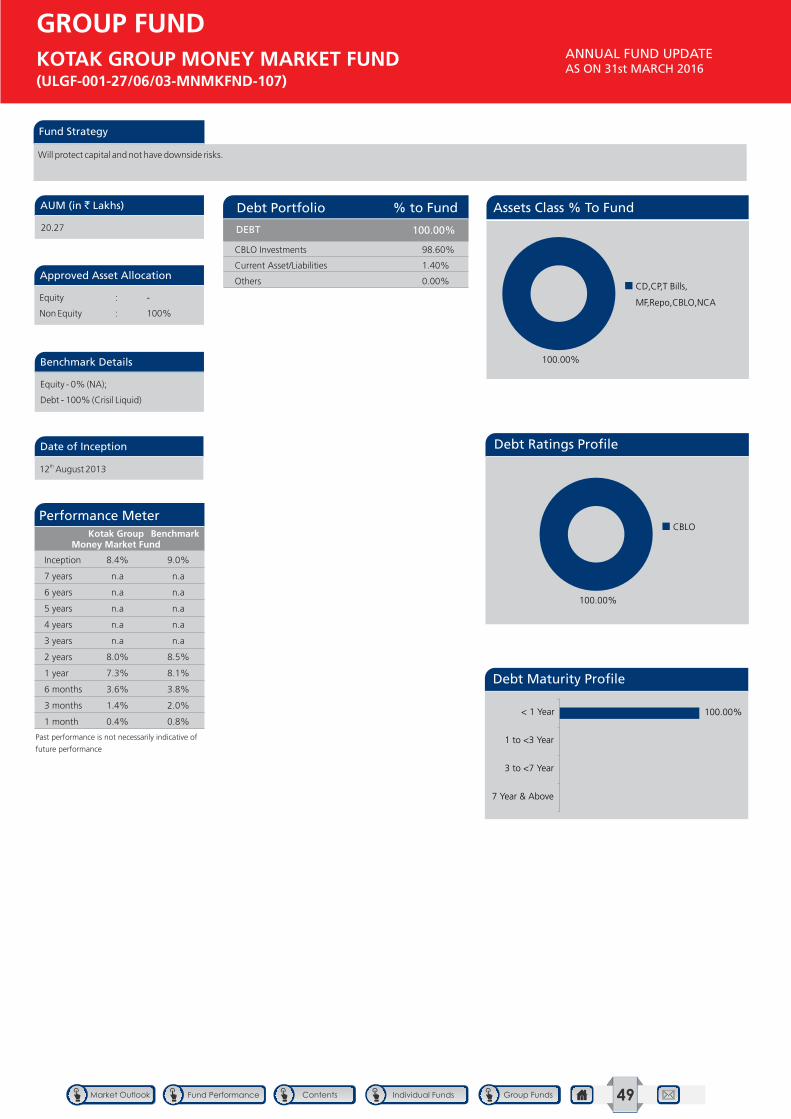
Fund Strategy
Will protect capital and not have downside risks.
Performance Meter
Approved Asset Allocation
Benchmark Details
AUM (in ` Lakhs)
Date of Inception
Equity : -
Non Equity : 100%
Equity - 0% (NA);
Debt - 100% (Crisil Liquid)
20.27
th12 August 2013
Kotak Group Money Market Fund
Benchmark
Past performance is not necessarily indicative of
future performance
Inception 8.4% 9.0%
7 years n.a n.a
6 years n.a n.a
5 years n.a n.a
4 years n.a n.a
3 years n.a n.a
2 years 8.0% 8.5%
1 year 7.3% 8.1%
6 months 3.6% 3.8%
3 months 1.4% 2.0%
1 month 0.4% 0.8%
GROUP FUND
ANNUAL FUND UPDATE AS ON 31st MARCH 2016
KOTAK GROUP MONEY MARKET FUND(ULGF-001-27/06/03-MNMKFND-107)
DEBT 100.00%
Debt Portfolio % to Fund
CBLO Investments 98.60%
Current Asset/Liabilities 1.40%
Others 0.00%
GROUP FUND
Assets Class % To Fund
Debt Ratings Profile
Debt Maturity Profile
100.00%
CD,CP,T Bills,
MF,Repo,CBLO,NCA
100.00%
CBLO
100.00%
7 Year & Above
3 to <7 Year
1 to <3 Year
< 1 Year
49
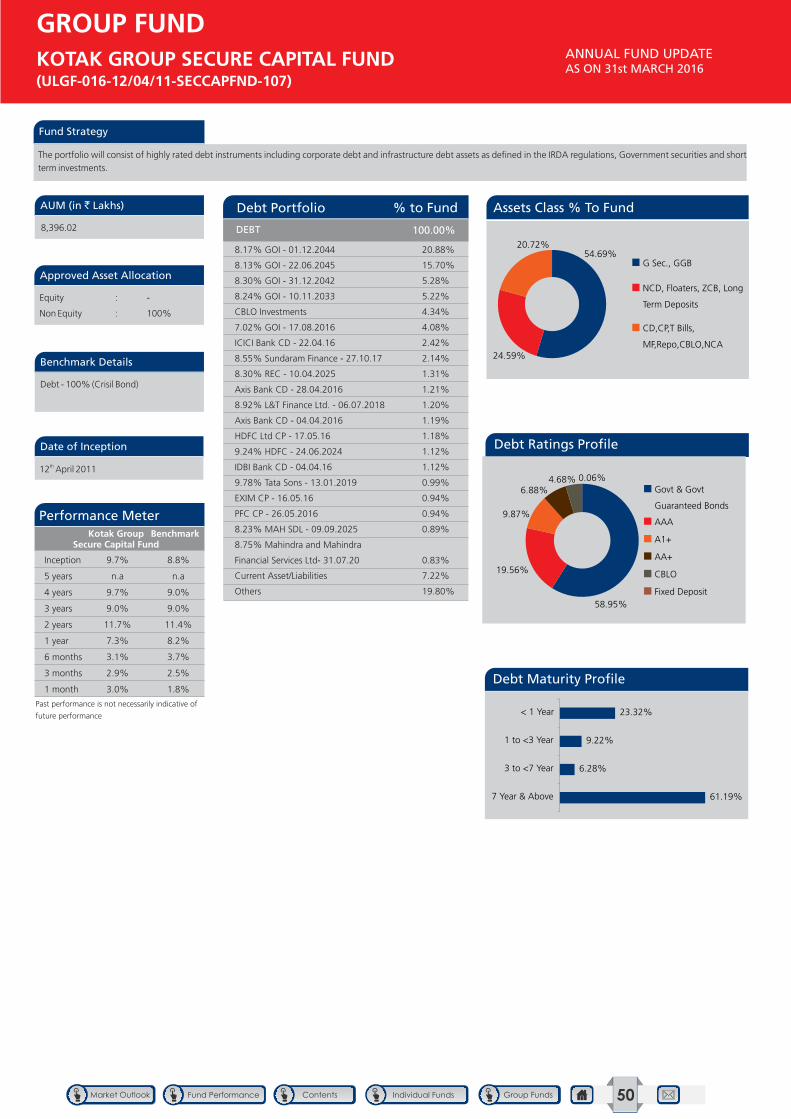
Fund Strategy
The portfolio will consist of highly rated debt instruments including corporate debt and infrastructure debt assets as defined in the IRDA regulations, Government securities and short
term investments.
Performance Meter
Approved Asset Allocation
Benchmark Details
AUM (in ` Lakhs)
Date of Inception
Equity : -
Non Equity : 100%
Debt - 100% (Crisil Bond)
8,396.02
th12 April 2011
Kotak Group Secure Capital Fund
Benchmark
Past performance is not necessarily indicative of
future performance
Inception 9.7% 8.8%
5 years n.a n.a
4 years 9.7% 9.0%
3 years 9.0% 9.0%
2 years 11.7% 11.4%
1 year 7.3% 8.2%
6 months 3.1% 3.7%
3 months 2.9% 2.5%
1 month 3.0% 1.8%
GROUP FUND
ANNUAL FUND UPDATE AS ON 31st MARCH 2016
KOTAK GROUP SECURE CAPITAL FUND(ULGF-016-12/04/11-SECCAPFND-107)
DEBT 100.00%
Debt Portfolio % to Fund
8.17% GOI - 01.12.2044 20.88%
8.13% GOI - 22.06.2045 15.70%
8.30% GOI - 31.12.2042 5.28%
8.24% GOI - 10.11.2033 5.22%
CBLO Investments 4.34%
7.02% GOI - 17.08.2016 4.08%
ICICI Bank CD - 22.04.16 2.42%
8.55% Sundaram Finance - 27.10.17 2.14%
8.30% REC - 10.04.2025 1.31%
Axis Bank CD - 28.04.2016 1.21%
8.92% L&T Finance Ltd. - 06.07.2018 1.20%
Axis Bank CD - 04.04.2016 1.19%
HDFC Ltd CP - 17.05.16 1.18%
9.24% HDFC - 24.06.2024 1.12%
IDBI Bank CD - 04.04.16 1.12%
9.78% Tata Sons - 13.01.2019 0.99%
EXIM CP - 16.05.16 0.94%
PFC CP - 26.05.2016 0.94%
8.23% MAH SDL - 09.09.2025 0.89%
8.75% Mahindra and Mahindra
Financial Services Ltd- 31.07.20 0.83%
Current Asset/Liabilities 7.22%
Others 19.80%
GROUP FUND
Assets Class % To Fund
Debt Ratings Profile
Debt Maturity Profile
54.69%
24.59%
20.72%
G Sec., GGB
NCD, Floaters, ZCB, Long
Term Deposits
CD,CP,T Bills,
MF,Repo,CBLO,NCA
58.95%
19.56%
9.87%
6.88%4.68% 0.06%
Govt & Govt
Guaranteed Bonds
AAA
A1+
AA+
CBLO
Fixed Deposit
61.19%
6.28%
9.22%
23.32%
7 Year & Above
3 to <7 Year
1 to <3 Year
< 1 Year
50
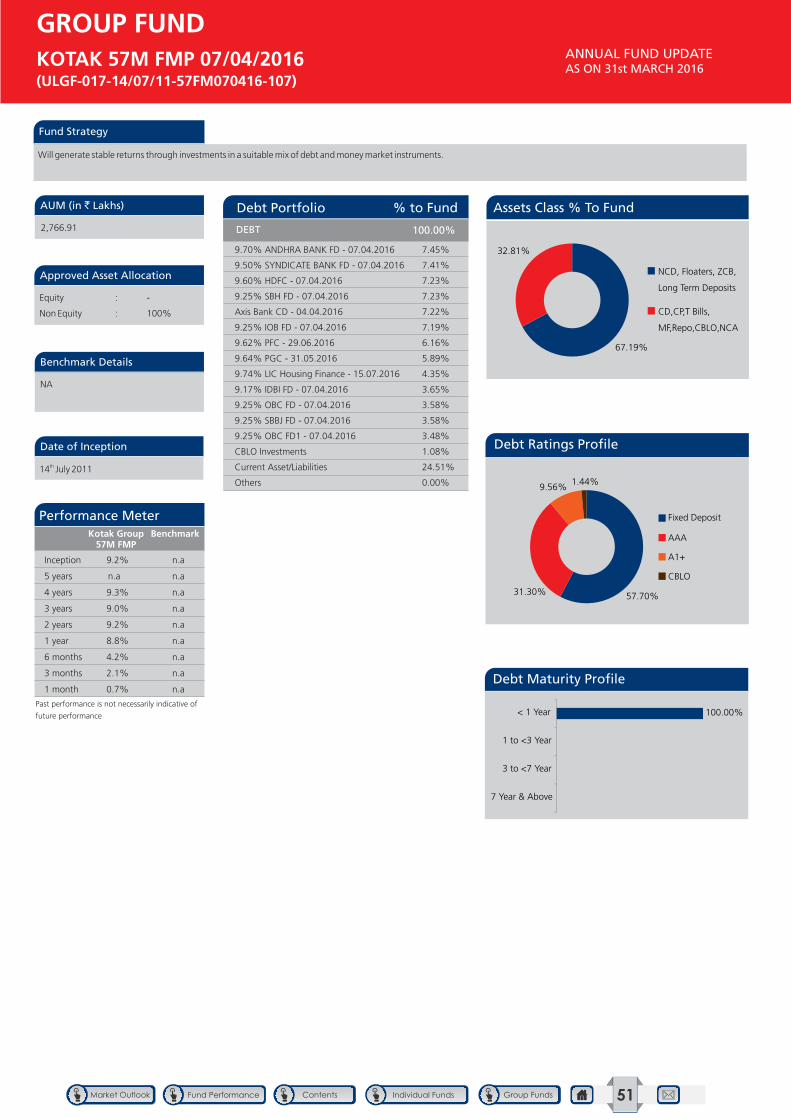
Fund Strategy
Will generate stable returns through investments in a suitable mix of debt and money market instruments.
Performance Meter
Approved Asset Allocation
Benchmark Details
AUM (in ` Lakhs)
Date of Inception
Equity : -
Non Equity : 100%
NA
2,766.91
th14 July 2011
Kotak Group 57M FMP
Benchmark
Past performance is not necessarily indicative of
future performance
Inception 9.2% n.a
5 years n.a n.a
4 years 9.3% n.a
3 years 9.0% n.a
2 years 9.2% n.a
1 year 8.8% n.a
6 months 4.2% n.a
3 months 2.1% n.a
1 month 0.7% n.a
GROUP FUND
ANNUAL FUND UPDATE AS ON 31st MARCH 2016
KOTAK 57M FMP 07/04/2016(ULGF-017-14/07/11-57FM070416-107)
DEBT 100.00%
Debt Portfolio % to Fund
9.70% ANDHRA BANK FD - 07.04.2016 7.45%
9.50% SYNDICATE BANK FD - 07.04.2016 7.41%
9.60% HDFC - 07.04.2016 7.23%
9.25% SBH FD - 07.04.2016 7.23%
Axis Bank CD - 04.04.2016 7.22%
9.25% IOB FD - 07.04.2016 7.19%
9.62% PFC - 29.06.2016 6.16%
9.64% PGC - 31.05.2016 5.89%
9.74% LIC Housing Finance - 15.07.2016 4.35%
9.17% IDBI FD - 07.04.2016 3.65%
9.25% OBC FD - 07.04.2016 3.58%
9.25% SBBJ FD - 07.04.2016 3.58%
9.25% OBC FD1 - 07.04.2016 3.48%
CBLO Investments 1.08%
Current Asset/Liabilities 24.51%
Others 0.00%
GROUP FUND
Assets Class % To Fund
Debt Ratings Profile
Debt Maturity Profile
67.19%
32.81%
NCD, Floaters, ZCB,
Long Term Deposits
CD,CP,T Bills,
MF,Repo,CBLO,NCA
57.70%31.30%
9.56%1.44%
Fixed Deposit
AAA
A1+
CBLO
100.00%
7 Year & Above
3 to <7 Year
1 to <3 Year
< 1 Year
51
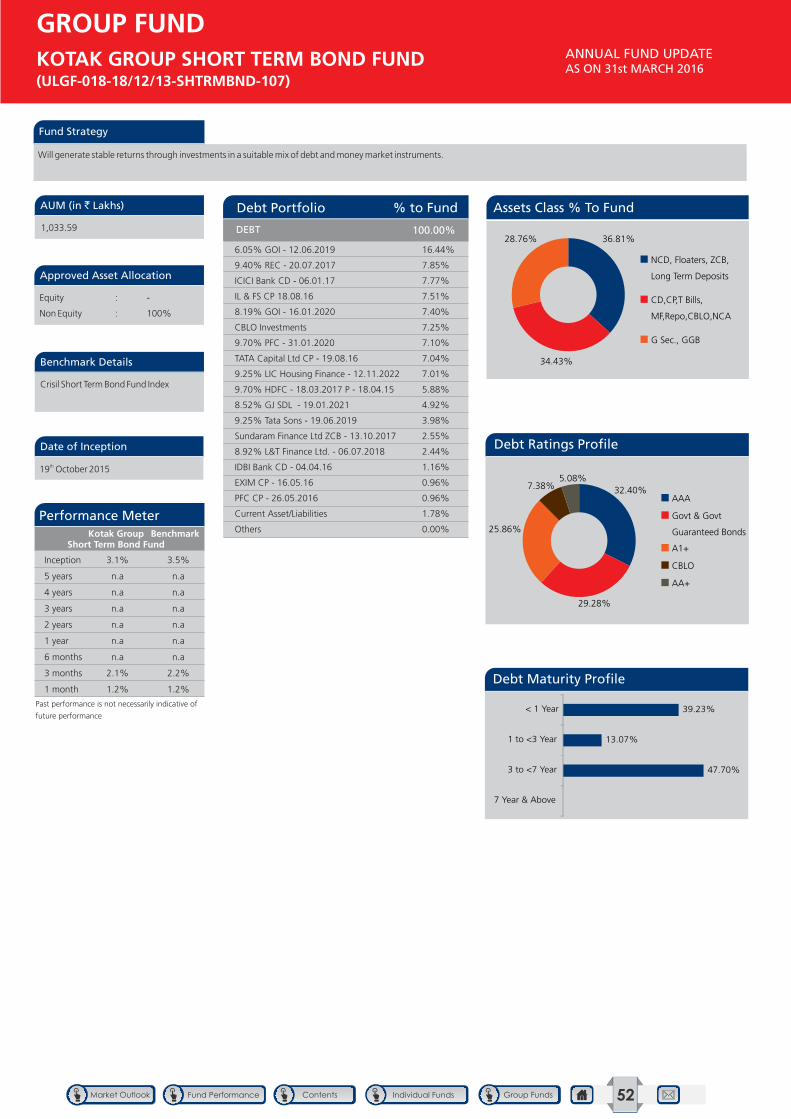
Fund Strategy
Will generate stable returns through investments in a suitable mix of debt and money market instruments.
Performance Meter
Approved Asset Allocation
Benchmark Details
AUM (in ` Lakhs)
Date of Inception
Equity : -
Non Equity : 100%
Crisil Short Term Bond Fund Index
1,033.59
th19 October 2015
Kotak Group Short Term Bond Fund
Benchmark
Past performance is not necessarily indicative of
future performance
Inception 3.1% 3.5%
5 years n.a n.a
4 years n.a n.a
3 years n.a n.a
2 years n.a n.a
1 year n.a n.a
6 months n.a n.a
3 months 2.1% 2.2%
1 month 1.2% 1.2%
GROUP FUND
ANNUAL FUND UPDATE AS ON 31st MARCH 2016
KOTAK GROUP SHORT TERM BOND FUND(ULGF-018-18/12/13-SHTRMBND-107)
DEBT 100.00%
Debt Portfolio % to Fund
6.05% GOI - 12.06.2019 16.44%
9.40% REC - 20.07.2017 7.85%
ICICI Bank CD - 06.01.17 7.77%
IL & FS CP 18.08.16 7.51%
8.19% GOI - 16.01.2020 7.40%
CBLO Investments 7.25%
9.70% PFC - 31.01.2020 7.10%
TATA Capital Ltd CP - 19.08.16 7.04%
9.25% LIC Housing Finance - 12.11.2022 7.01%
9.70% HDFC - 18.03.2017 P - 18.04.15 5.88%
8.52% GJ SDL - 19.01.2021 4.92%
9.25% Tata Sons - 19.06.2019 3.98%
Sundaram Finance Ltd ZCB - 13.10.2017 2.55%
8.92% L&T Finance Ltd. - 06.07.2018 2.44%
IDBI Bank CD - 04.04.16 1.16%
EXIM CP - 16.05.16 0.96%
PFC CP - 26.05.2016 0.96%
Current Asset/Liabilities 1.78%
Others 0.00%
GROUP FUND
Assets Class % To Fund
Debt Ratings Profile
Debt Maturity Profile
36.81%
34.43%
28.76%
NCD, Floaters, ZCB,
Long Term Deposits
CD,CP,T Bills,
MF,Repo,CBLO,NCA
G Sec., GGB
32.40%
29.28%
25.86%
7.38%5.08%
AAA
Govt & Govt
Guaranteed Bonds
A1+
CBLO
AA+
47.70%
13.07%
39.23%
7 Year & Above
3 to <7 Year
1 to <3 Year
< 1 Year
52
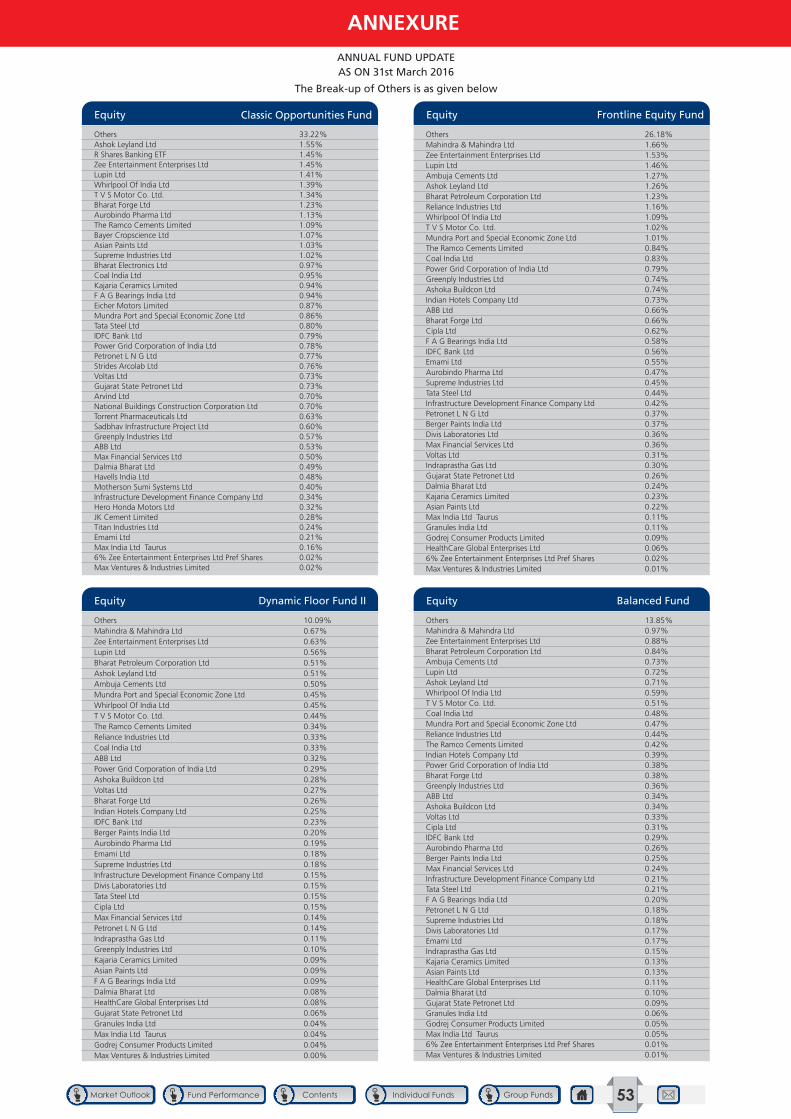
Others 33.22%Ashok Leyland Ltd 1.55%R Shares Banking ETF 1.45%Zee Entertainment Enterprises Ltd 1.45%Lupin Ltd 1.41%Whirlpool Of India Ltd 1.39%T V S Motor Co. Ltd. 1.34%Bharat Forge Ltd 1.23%Aurobindo Pharma Ltd 1.13%The Ramco Cements Limited 1.09%Bayer Cropscience Ltd 1.07%Asian Paints Ltd 1.03%Supreme Industries Ltd 1.02%Bharat Electronics Ltd 0.97%Coal India Ltd 0.95%Kajaria Ceramics Limited 0.94%F A G Bearings India Ltd 0.94%Eicher Motors Limited 0.87%Mundra Port and Special Economic Zone Ltd 0.86%Tata Steel Ltd 0.80%IDFC Bank Ltd 0.79%Power Grid Corporation of India Ltd 0.78%Petronet L N G Ltd 0.77%Strides Arcolab Ltd 0.76%Voltas Ltd 0.73%Gujarat State Petronet Ltd 0.73%Arvind Ltd 0.70%National Buildings Construction Corporation Ltd 0.70%Torrent Pharmaceuticals Ltd 0.63%Sadbhav Infrastructure Project Ltd 0.60%Greenply Industries Ltd 0.57%ABB Ltd 0.53%Max Financial Services Ltd 0.50%Dalmia Bharat Ltd 0.49%Havells India Ltd 0.48%Motherson Sumi Systems Ltd 0.40%Infrastructure Development Finance Company Ltd 0.34%Hero Honda Motors Ltd 0.32%JK Cement Limited 0.28%Titan Industries Ltd 0.24%Emami Ltd 0.21%Max India Ltd Taurus 0.16%6% Zee Entertainment Enterprises Ltd Pref Shares 0.02%Max Ventures & Industries Limited 0.02%
Equity Classic Opportunities Fund
Others 10.09%Mahindra & Mahindra Ltd 0.67%Zee Entertainment Enterprises Ltd 0.63%Lupin Ltd 0.56%Bharat Petroleum Corporation Ltd 0.51%Ashok Leyland Ltd 0.51%Ambuja Cements Ltd 0.50%Mundra Port and Special Economic Zone Ltd 0.45%Whirlpool Of India Ltd 0.45%T V S Motor Co. Ltd. 0.44%The Ramco Cements Limited 0.34%Reliance Industries Ltd 0.33%Coal India Ltd 0.33%ABB Ltd 0.32%Power Grid Corporation of India Ltd 0.29%Ashoka Buildcon Ltd 0.28%Voltas Ltd 0.27%Bharat Forge Ltd 0.26%Indian Hotels Company Ltd 0.25%IDFC Bank Ltd 0.23%Berger Paints India Ltd 0.20%Aurobindo Pharma Ltd 0.19%Emami Ltd 0.18%Supreme Industries Ltd 0.18%Infrastructure Development Finance Company Ltd 0.15%Divis Laboratories Ltd 0.15%Tata Steel Ltd 0.15%Cipla Ltd 0.15%Max Financial Services Ltd 0.14%Petronet L N G Ltd 0.14%Indraprastha Gas Ltd 0.11%Greenply Industries Ltd 0.10%Kajaria Ceramics Limited 0.09%Asian Paints Ltd 0.09%F A G Bearings India Ltd 0.09%Dalmia Bharat Ltd 0.08%HealthCare Global Enterprises Ltd 0.08%Gujarat State Petronet Ltd 0.06%Granules India Ltd 0.04%Max India Ltd Taurus 0.04%Godrej Consumer Products Limited 0.04%Max Ventures & Industries Limited 0.00%
Equity Dynamic Floor Fund II
ANNUAL FUND UPDATE AS ON 31st March 2016
ANNEXURE
Others 26.18%Mahindra & Mahindra Ltd 1.66%Zee Entertainment Enterprises Ltd 1.53%Lupin Ltd 1.46%Ambuja Cements Ltd 1.27%Ashok Leyland Ltd 1.26%Bharat Petroleum Corporation Ltd 1.23%Reliance Industries Ltd 1.16%Whirlpool Of India Ltd 1.09%T V S Motor Co. Ltd. 1.02%Mundra Port and Special Economic Zone Ltd 1.01%The Ramco Cements Limited 0.84%Coal India Ltd 0.83%Power Grid Corporation of India Ltd 0.79%Greenply Industries Ltd 0.74%Ashoka Buildcon Ltd 0.74%Indian Hotels Company Ltd 0.73%ABB Ltd 0.66%Bharat Forge Ltd 0.66%Cipla Ltd 0.62%F A G Bearings India Ltd 0.58%IDFC Bank Ltd 0.56%Emami Ltd 0.55%Aurobindo Pharma Ltd 0.47%Supreme Industries Ltd 0.45%Tata Steel Ltd 0.44%Infrastructure Development Finance Company Ltd 0.42%Petronet L N G Ltd 0.37%Berger Paints India Ltd 0.37%Divis Laboratories Ltd 0.36%Max Financial Services Ltd 0.36%Voltas Ltd 0.31%Indraprastha Gas Ltd 0.30%Gujarat State Petronet Ltd 0.26%Dalmia Bharat Ltd 0.24%Kajaria Ceramics Limited 0.23%Asian Paints Ltd 0.22%Max India Ltd Taurus 0.11%Granules India Ltd 0.11%Godrej Consumer Products Limited 0.09%HealthCare Global Enterprises Ltd 0.06%6% Zee Entertainment Enterprises Ltd Pref Shares 0.02%Max Ventures & Industries Limited 0.01%
Equity Frontline Equity Fund
Others 13.85%Mahindra & Mahindra Ltd 0.97%Zee Entertainment Enterprises Ltd 0.88%Bharat Petroleum Corporation Ltd 0.84%Ambuja Cements Ltd 0.73%Lupin Ltd 0.72%Ashok Leyland Ltd 0.71%Whirlpool Of India Ltd 0.59%T V S Motor Co. Ltd. 0.51%Coal India Ltd 0.48%Mundra Port and Special Economic Zone Ltd 0.47%Reliance Industries Ltd 0.44%The Ramco Cements Limited 0.42%Indian Hotels Company Ltd 0.39%Power Grid Corporation of India Ltd 0.38%Bharat Forge Ltd 0.38%Greenply Industries Ltd 0.36%ABB Ltd 0.34%Ashoka Buildcon Ltd 0.34%Voltas Ltd 0.33%Cipla Ltd 0.31%IDFC Bank Ltd 0.29%Aurobindo Pharma Ltd 0.26%Berger Paints India Ltd 0.25%Max Financial Services Ltd 0.24%Infrastructure Development Finance Company Ltd 0.21%Tata Steel Ltd 0.21%F A G Bearings India Ltd 0.20%Petronet L N G Ltd 0.18%Supreme Industries Ltd 0.18%Divis Laboratories Ltd 0.17%Emami Ltd 0.17%Indraprastha Gas Ltd 0.15%Kajaria Ceramics Limited 0.13%Asian Paints Ltd 0.13%HealthCare Global Enterprises Ltd 0.11%Dalmia Bharat Ltd 0.10%Gujarat State Petronet Ltd 0.09%Granules India Ltd 0.06%Godrej Consumer Products Limited 0.05%Max India Ltd Taurus 0.05%6% Zee Entertainment Enterprises Ltd Pref Shares 0.01%Max Ventures & Industries Limited 0.01%
Equity Balanced Fund
The Break-up of Others is as given below
53
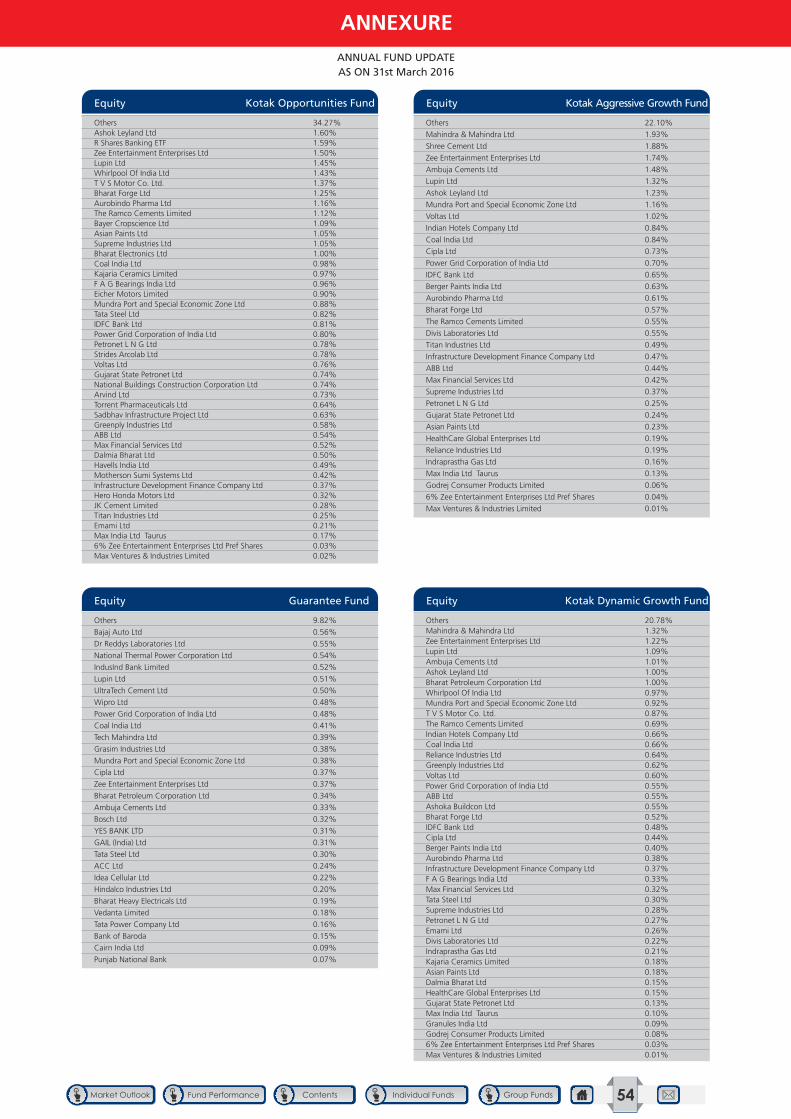
Others 34.27%Ashok Leyland Ltd 1.60%R Shares Banking ETF 1.59%Zee Entertainment Enterprises Ltd 1.50%Lupin Ltd 1.45%Whirlpool Of India Ltd 1.43%T V S Motor Co. Ltd. 1.37%Bharat Forge Ltd 1.25%Aurobindo Pharma Ltd 1.16%The Ramco Cements Limited 1.12%Bayer Cropscience Ltd 1.09%Asian Paints Ltd 1.05%Supreme Industries Ltd 1.05%Bharat Electronics Ltd 1.00%Coal India Ltd 0.98%Kajaria Ceramics Limited 0.97%F A G Bearings India Ltd 0.96%Eicher Motors Limited 0.90%Mundra Port and Special Economic Zone Ltd 0.88%Tata Steel Ltd 0.82%IDFC Bank Ltd 0.81%Power Grid Corporation of India Ltd 0.80%Petronet L N G Ltd 0.78%Strides Arcolab Ltd 0.78%Voltas Ltd 0.76%Gujarat State Petronet Ltd 0.74%National Buildings Construction Corporation Ltd 0.74%Arvind Ltd 0.73%Torrent Pharmaceuticals Ltd 0.64%Sadbhav Infrastructure Project Ltd 0.63%Greenply Industries Ltd 0.58%ABB Ltd 0.54%Max Financial Services Ltd 0.52%Dalmia Bharat Ltd 0.50%Havells India Ltd 0.49%Motherson Sumi Systems Ltd 0.42%Infrastructure Development Finance Company Ltd 0.37%Hero Honda Motors Ltd 0.32%JK Cement Limited 0.28%Titan Industries Ltd 0.25%Emami Ltd 0.21%Max India Ltd Taurus 0.17%6% Zee Entertainment Enterprises Ltd Pref Shares 0.03%Max Ventures & Industries Limited 0.02%
Equity Kotak Opportunities Fund
Others 9.82%
Bajaj Auto Ltd 0.56%
Dr Reddys Laboratories Ltd 0.55%
National Thermal Power Corporation Ltd 0.54%
IndusInd Bank Limited 0.52%
Lupin Ltd 0.51%
UltraTech Cement Ltd 0.50%
Wipro Ltd 0.48%
Power Grid Corporation of India Ltd 0.48%
Coal India Ltd 0.41%
Tech Mahindra Ltd 0.39%
Grasim Industries Ltd 0.38%
Mundra Port and Special Economic Zone Ltd 0.38%
Cipla Ltd 0.37%
Zee Entertainment Enterprises Ltd 0.37%
Bharat Petroleum Corporation Ltd 0.34%
Ambuja Cements Ltd 0.33%
Bosch Ltd 0.32%
YES BANK LTD 0.31%
GAIL (India) Ltd 0.31%
Tata Steel Ltd 0.30%
ACC Ltd 0.24%
Idea Cellular Ltd 0.22%
Hindalco Industries Ltd 0.20%
Bharat Heavy Electricals Ltd 0.19%
Vedanta Limited 0.18%
Tata Power Company Ltd 0.16%
Bank of Baroda 0.15%
Cairn India Ltd 0.09%
Punjab National Bank 0.07%
Equity Guarantee Fund
ANNUAL FUND UPDATE AS ON 31st March 2016
ANNEXURE
Others 22.10%
Mahindra & Mahindra Ltd 1.93%
Shree Cement Ltd 1.88%
Zee Entertainment Enterprises Ltd 1.74%
Ambuja Cements Ltd 1.48%
Lupin Ltd 1.32%
Ashok Leyland Ltd 1.23%
Mundra Port and Special Economic Zone Ltd 1.16%
Voltas Ltd 1.02%
Indian Hotels Company Ltd 0.84%
Coal India Ltd 0.84%
Cipla Ltd 0.73%
Power Grid Corporation of India Ltd 0.70%
IDFC Bank Ltd 0.65%
Berger Paints India Ltd 0.63%
Aurobindo Pharma Ltd 0.61%
Bharat Forge Ltd 0.57%
The Ramco Cements Limited 0.55%
Divis Laboratories Ltd 0.55%
Titan Industries Ltd 0.49%
Infrastructure Development Finance Company Ltd 0.47%
ABB Ltd 0.44%
Max Financial Services Ltd 0.42%
Supreme Industries Ltd 0.37%
Petronet L N G Ltd 0.25%
Gujarat State Petronet Ltd 0.24%
Asian Paints Ltd 0.23%
HealthCare Global Enterprises Ltd 0.19%
Reliance Industries Ltd 0.19%
Indraprastha Gas Ltd 0.16%
Max India Ltd Taurus 0.13%
Godrej Consumer Products Limited 0.06%
6% Zee Entertainment Enterprises Ltd Pref Shares 0.04%
Max Ventures & Industries Limited 0.01%
Equity Kotak Aggressive Growth Fund
Others 20.78%Mahindra & Mahindra Ltd 1.32%Zee Entertainment Enterprises Ltd 1.22%Lupin Ltd 1.09%Ambuja Cements Ltd 1.01%Ashok Leyland Ltd 1.00%Bharat Petroleum Corporation Ltd 1.00%Whirlpool Of India Ltd 0.97%Mundra Port and Special Economic Zone Ltd 0.92%T V S Motor Co. Ltd. 0.87%The Ramco Cements Limited 0.69%Indian Hotels Company Ltd 0.66%Coal India Ltd 0.66%Reliance Industries Ltd 0.64%Greenply Industries Ltd 0.62%Voltas Ltd 0.60%Power Grid Corporation of India Ltd 0.55%ABB Ltd 0.55%Ashoka Buildcon Ltd 0.55%Bharat Forge Ltd 0.52%IDFC Bank Ltd 0.48%Cipla Ltd 0.44%Berger Paints India Ltd 0.40%Aurobindo Pharma Ltd 0.38%Infrastructure Development Finance Company Ltd 0.37%F A G Bearings India Ltd 0.33%Max Financial Services Ltd 0.32%Tata Steel Ltd 0.30%Supreme Industries Ltd 0.28%Petronet L N G Ltd 0.27%Emami Ltd 0.26%Divis Laboratories Ltd 0.22%Indraprastha Gas Ltd 0.21%Kajaria Ceramics Limited 0.18%Asian Paints Ltd 0.18%Dalmia Bharat Ltd 0.15%HealthCare Global Enterprises Ltd 0.15%Gujarat State Petronet Ltd 0.13%Max India Ltd Taurus 0.10%Granules India Ltd 0.09%Godrej Consumer Products Limited 0.08%6% Zee Entertainment Enterprises Ltd Pref Shares 0.03%Max Ventures & Industries Limited 0.01%
Equity Kotak Dynamic Growth Fund
54
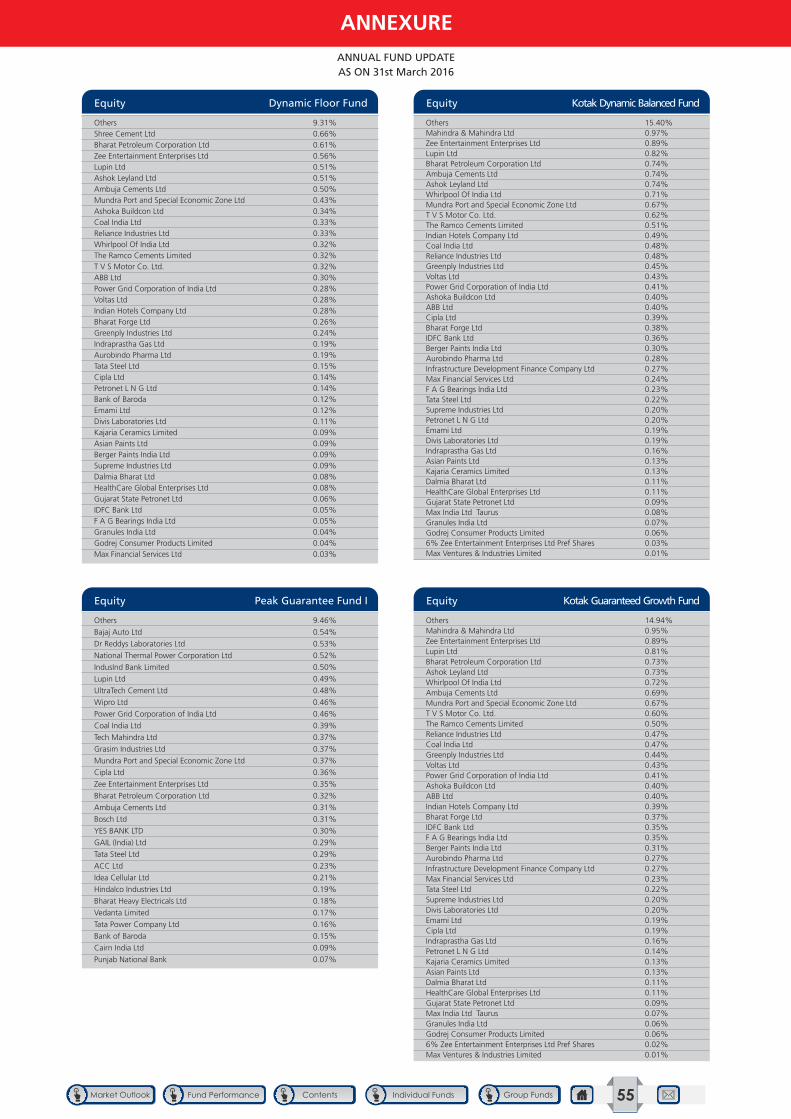
Others 9.31%Shree Cement Ltd 0.66%Bharat Petroleum Corporation Ltd 0.61%Zee Entertainment Enterprises Ltd 0.56%Lupin Ltd 0.51%Ashok Leyland Ltd 0.51%Ambuja Cements Ltd 0.50%Mundra Port and Special Economic Zone Ltd 0.43%Ashoka Buildcon Ltd 0.34%Coal India Ltd 0.33%Reliance Industries Ltd 0.33%Whirlpool Of India Ltd 0.32%The Ramco Cements Limited 0.32%T V S Motor Co. Ltd. 0.32%ABB Ltd 0.30%Power Grid Corporation of India Ltd 0.28%Voltas Ltd 0.28%Indian Hotels Company Ltd 0.28%Bharat Forge Ltd 0.26%Greenply Industries Ltd 0.24%Indraprastha Gas Ltd 0.19%Aurobindo Pharma Ltd 0.19%Tata Steel Ltd 0.15%Cipla Ltd 0.14%Petronet L N G Ltd 0.14%Bank of Baroda 0.12%Emami Ltd 0.12%Divis Laboratories Ltd 0.11%Kajaria Ceramics Limited 0.09%Asian Paints Ltd 0.09%Berger Paints India Ltd 0.09%Supreme Industries Ltd 0.09%Dalmia Bharat Ltd 0.08%HealthCare Global Enterprises Ltd 0.08%Gujarat State Petronet Ltd 0.06%IDFC Bank Ltd 0.05%F A G Bearings India Ltd 0.05%Granules India Ltd 0.04%Godrej Consumer Products Limited 0.04%Max Financial Services Ltd 0.03%
Equity Dynamic Floor Fund
Others 9.46%
Bajaj Auto Ltd 0.54%
Dr Reddys Laboratories Ltd 0.53%
National Thermal Power Corporation Ltd 0.52%
IndusInd Bank Limited 0.50%
Lupin Ltd 0.49%
UltraTech Cement Ltd 0.48%
Wipro Ltd 0.46%
Power Grid Corporation of India Ltd 0.46%
Coal India Ltd 0.39%
Tech Mahindra Ltd 0.37%
Grasim Industries Ltd 0.37%
Mundra Port and Special Economic Zone Ltd 0.37%
Cipla Ltd 0.36%
Zee Entertainment Enterprises Ltd 0.35%
Bharat Petroleum Corporation Ltd 0.32%
Ambuja Cements Ltd 0.31%
Bosch Ltd 0.31%
YES BANK LTD 0.30%
GAIL (India) Ltd 0.29%
Tata Steel Ltd 0.29%
ACC Ltd 0.23%
Idea Cellular Ltd 0.21%
Hindalco Industries Ltd 0.19%
Bharat Heavy Electricals Ltd 0.18%
Vedanta Limited 0.17%
Tata Power Company Ltd 0.16%
Bank of Baroda 0.15%
Cairn India Ltd 0.09%
Punjab National Bank 0.07%
Equity Peak Guarantee Fund I
ANNUAL FUND UPDATE AS ON 31st March 2016
Others 15.40%Mahindra & Mahindra Ltd 0.97%Zee Entertainment Enterprises Ltd 0.89%Lupin Ltd 0.82%Bharat Petroleum Corporation Ltd 0.74%Ambuja Cements Ltd 0.74%Ashok Leyland Ltd 0.74%Whirlpool Of India Ltd 0.71%Mundra Port and Special Economic Zone Ltd 0.67%T V S Motor Co. Ltd. 0.62%The Ramco Cements Limited 0.51%Indian Hotels Company Ltd 0.49%Coal India Ltd 0.48%Reliance Industries Ltd 0.48%Greenply Industries Ltd 0.45%Voltas Ltd 0.43%Power Grid Corporation of India Ltd 0.41%Ashoka Buildcon Ltd 0.40%ABB Ltd 0.40%Cipla Ltd 0.39%Bharat Forge Ltd 0.38%IDFC Bank Ltd 0.36%Berger Paints India Ltd 0.30%Aurobindo Pharma Ltd 0.28%Infrastructure Development Finance Company Ltd 0.27%Max Financial Services Ltd 0.24%F A G Bearings India Ltd 0.23%Tata Steel Ltd 0.22%Supreme Industries Ltd 0.20%Petronet L N G Ltd 0.20%Emami Ltd 0.19%Divis Laboratories Ltd 0.19%Indraprastha Gas Ltd 0.16%Asian Paints Ltd 0.13%Kajaria Ceramics Limited 0.13%Dalmia Bharat Ltd 0.11%HealthCare Global Enterprises Ltd 0.11%Gujarat State Petronet Ltd 0.09%Max India Ltd Taurus 0.08%Granules India Ltd 0.07%Godrej Consumer Products Limited 0.06%6% Zee Entertainment Enterprises Ltd Pref Shares 0.03%Max Ventures & Industries Limited 0.01%
Equity Kotak Dynamic Balanced Fund
Others 14.94%Mahindra & Mahindra Ltd 0.95%Zee Entertainment Enterprises Ltd 0.89%Lupin Ltd 0.81%Bharat Petroleum Corporation Ltd 0.73%Ashok Leyland Ltd 0.73%Whirlpool Of India Ltd 0.72%Ambuja Cements Ltd 0.69%Mundra Port and Special Economic Zone Ltd 0.67%T V S Motor Co. Ltd. 0.60%The Ramco Cements Limited 0.50%Reliance Industries Ltd 0.47%Coal India Ltd 0.47%Greenply Industries Ltd 0.44%Voltas Ltd 0.43%Power Grid Corporation of India Ltd 0.41%Ashoka Buildcon Ltd 0.40%ABB Ltd 0.40%Indian Hotels Company Ltd 0.39%Bharat Forge Ltd 0.37%IDFC Bank Ltd 0.35%F A G Bearings India Ltd 0.35%Berger Paints India Ltd 0.31%Aurobindo Pharma Ltd 0.27%Infrastructure Development Finance Company Ltd 0.27%Max Financial Services Ltd 0.23%Tata Steel Ltd 0.22%Supreme Industries Ltd 0.20%Divis Laboratories Ltd 0.20%Emami Ltd 0.19%Cipla Ltd 0.19%Indraprastha Gas Ltd 0.16%Petronet L N G Ltd 0.14%Kajaria Ceramics Limited 0.13%Asian Paints Ltd 0.13%Dalmia Bharat Ltd 0.11%HealthCare Global Enterprises Ltd 0.11%Gujarat State Petronet Ltd 0.09%Max India Ltd Taurus 0.07%Granules India Ltd 0.06%Godrej Consumer Products Limited 0.06%6% Zee Entertainment Enterprises Ltd Pref Shares 0.02%Max Ventures & Industries Limited 0.01%
Equity Kotak Guaranteed Growth Fund
ANNEXURE
55
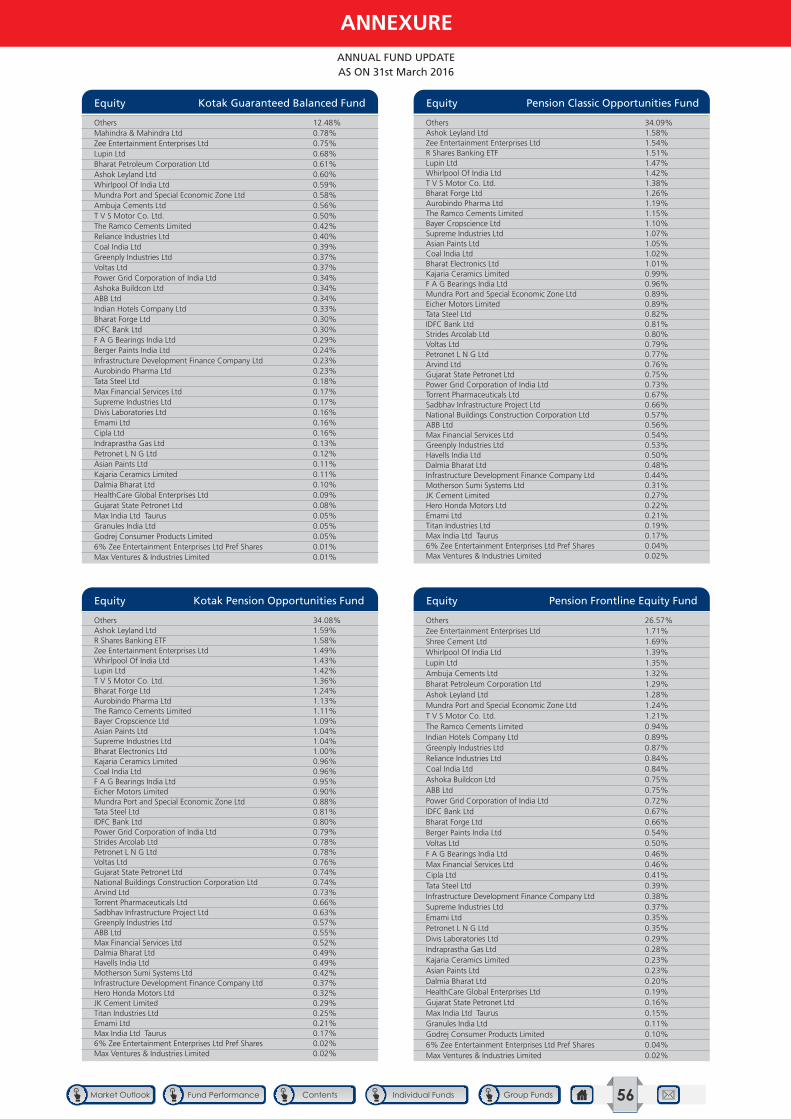
Others 12.48%Mahindra & Mahindra Ltd 0.78%Zee Entertainment Enterprises Ltd 0.75%Lupin Ltd 0.68%Bharat Petroleum Corporation Ltd 0.61%Ashok Leyland Ltd 0.60%Whirlpool Of India Ltd 0.59%Mundra Port and Special Economic Zone Ltd 0.58%Ambuja Cements Ltd 0.56%T V S Motor Co. Ltd. 0.50%The Ramco Cements Limited 0.42%Reliance Industries Ltd 0.40%Coal India Ltd 0.39%Greenply Industries Ltd 0.37%Voltas Ltd 0.37%Power Grid Corporation of India Ltd 0.34%Ashoka Buildcon Ltd 0.34%ABB Ltd 0.34%Indian Hotels Company Ltd 0.33%Bharat Forge Ltd 0.30%IDFC Bank Ltd 0.30%F A G Bearings India Ltd 0.29%Berger Paints India Ltd 0.24%Infrastructure Development Finance Company Ltd 0.23%Aurobindo Pharma Ltd 0.23%Tata Steel Ltd 0.18%Max Financial Services Ltd 0.17%Supreme Industries Ltd 0.17%Divis Laboratories Ltd 0.16%Emami Ltd 0.16%Cipla Ltd 0.16%Indraprastha Gas Ltd 0.13%Petronet L N G Ltd 0.12%Asian Paints Ltd 0.11%Kajaria Ceramics Limited 0.11%Dalmia Bharat Ltd 0.10%HealthCare Global Enterprises Ltd 0.09%Gujarat State Petronet Ltd 0.08%Max India Ltd Taurus 0.05%Granules India Ltd 0.05%Godrej Consumer Products Limited 0.05%6% Zee Entertainment Enterprises Ltd Pref Shares 0.01%Max Ventures & Industries Limited 0.01%
Equity Kotak Guaranteed Balanced Fund
Others 34.08%Ashok Leyland Ltd 1.59%R Shares Banking ETF 1.58%Zee Entertainment Enterprises Ltd 1.49%Whirlpool Of India Ltd 1.43%Lupin Ltd 1.42%T V S Motor Co. Ltd. 1.36%Bharat Forge Ltd 1.24%Aurobindo Pharma Ltd 1.13%The Ramco Cements Limited 1.11%Bayer Cropscience Ltd 1.09%Asian Paints Ltd 1.04%Supreme Industries Ltd 1.04%Bharat Electronics Ltd 1.00%Kajaria Ceramics Limited 0.96%Coal India Ltd 0.96%F A G Bearings India Ltd 0.95%Eicher Motors Limited 0.90%Mundra Port and Special Economic Zone Ltd 0.88%Tata Steel Ltd 0.81%IDFC Bank Ltd 0.80%Power Grid Corporation of India Ltd 0.79%Strides Arcolab Ltd 0.78%Petronet L N G Ltd 0.78%Voltas Ltd 0.76%Gujarat State Petronet Ltd 0.74%National Buildings Construction Corporation Ltd 0.74%Arvind Ltd 0.73%Torrent Pharmaceuticals Ltd 0.66%Sadbhav Infrastructure Project Ltd 0.63%Greenply Industries Ltd 0.57%ABB Ltd 0.55%Max Financial Services Ltd 0.52%Dalmia Bharat Ltd 0.49%Havells India Ltd 0.49%Motherson Sumi Systems Ltd 0.42%Infrastructure Development Finance Company Ltd 0.37%Hero Honda Motors Ltd 0.32%JK Cement Limited 0.29%Titan Industries Ltd 0.25%Emami Ltd 0.21%Max India Ltd Taurus 0.17%6% Zee Entertainment Enterprises Ltd Pref Shares 0.02%Max Ventures & Industries Limited 0.02%
Equity Kotak Pension Opportunities Fund
ANNUAL FUND UPDATE AS ON 31st March 2016
Others 34.09%Ashok Leyland Ltd 1.58%Zee Entertainment Enterprises Ltd 1.54%R Shares Banking ETF 1.51%Lupin Ltd 1.47%Whirlpool Of India Ltd 1.42%T V S Motor Co. Ltd. 1.38%Bharat Forge Ltd 1.26%Aurobindo Pharma Ltd 1.19%The Ramco Cements Limited 1.15%Bayer Cropscience Ltd 1.10%Supreme Industries Ltd 1.07%Asian Paints Ltd 1.05%Coal India Ltd 1.02%Bharat Electronics Ltd 1.01%Kajaria Ceramics Limited 0.99%F A G Bearings India Ltd 0.96%Mundra Port and Special Economic Zone Ltd 0.89%Eicher Motors Limited 0.89%Tata Steel Ltd 0.82%IDFC Bank Ltd 0.81%Strides Arcolab Ltd 0.80%Voltas Ltd 0.79%Petronet L N G Ltd 0.77%Arvind Ltd 0.76%Gujarat State Petronet Ltd 0.75%Power Grid Corporation of India Ltd 0.73%Torrent Pharmaceuticals Ltd 0.67%Sadbhav Infrastructure Project Ltd 0.66%National Buildings Construction Corporation Ltd 0.57%ABB Ltd 0.56%Max Financial Services Ltd 0.54%Greenply Industries Ltd 0.53%Havells India Ltd 0.50%Dalmia Bharat Ltd 0.48%Infrastructure Development Finance Company Ltd 0.44%Motherson Sumi Systems Ltd 0.31%JK Cement Limited 0.27%Hero Honda Motors Ltd 0.22%Emami Ltd 0.21%Titan Industries Ltd 0.19%Max India Ltd Taurus 0.17%6% Zee Entertainment Enterprises Ltd Pref Shares 0.04%Max Ventures & Industries Limited 0.02%
Equity Pension Classic Opportunities Fund
Others 26.57%Zee Entertainment Enterprises Ltd 1.71%Shree Cement Ltd 1.69%Whirlpool Of India Ltd 1.39%Lupin Ltd 1.35%Ambuja Cements Ltd 1.32%Bharat Petroleum Corporation Ltd 1.29%Ashok Leyland Ltd 1.28%Mundra Port and Special Economic Zone Ltd 1.24%T V S Motor Co. Ltd. 1.21%The Ramco Cements Limited 0.94%Indian Hotels Company Ltd 0.89%Greenply Industries Ltd 0.87%Reliance Industries Ltd 0.84%Coal India Ltd 0.84%Ashoka Buildcon Ltd 0.75%ABB Ltd 0.75%Power Grid Corporation of India Ltd 0.72%IDFC Bank Ltd 0.67%Bharat Forge Ltd 0.66%Berger Paints India Ltd 0.54%Voltas Ltd 0.50%F A G Bearings India Ltd 0.46%Max Financial Services Ltd 0.46%Cipla Ltd 0.41%Tata Steel Ltd 0.39%Infrastructure Development Finance Company Ltd 0.38%Supreme Industries Ltd 0.37%Emami Ltd 0.35%Petronet L N G Ltd 0.35%Divis Laboratories Ltd 0.29%Indraprastha Gas Ltd 0.28%Kajaria Ceramics Limited 0.23%Asian Paints Ltd 0.23%Dalmia Bharat Ltd 0.20%HealthCare Global Enterprises Ltd 0.19%Gujarat State Petronet Ltd 0.16%Max India Ltd Taurus 0.15%Granules India Ltd 0.11%Godrej Consumer Products Limited 0.10%6% Zee Entertainment Enterprises Ltd Pref Shares 0.04%Max Ventures & Industries Limited 0.02%
Equity Pension Frontline Equity Fund
ANNEXURE
56
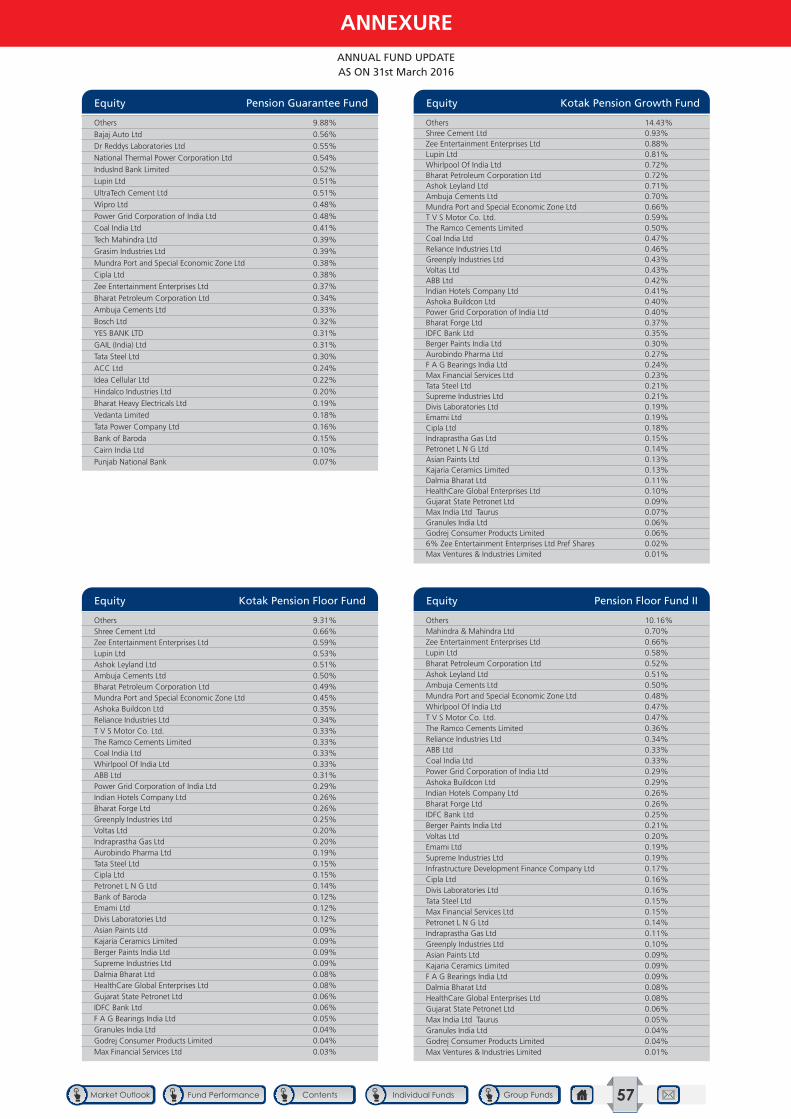
Others 9.88%
Bajaj Auto Ltd 0.56%
Dr Reddys Laboratories Ltd 0.55%
National Thermal Power Corporation Ltd 0.54%
IndusInd Bank Limited 0.52%
Lupin Ltd 0.51%
UltraTech Cement Ltd 0.51%
Wipro Ltd 0.48%
Power Grid Corporation of India Ltd 0.48%
Coal India Ltd 0.41%
Tech Mahindra Ltd 0.39%
Grasim Industries Ltd 0.39%
Mundra Port and Special Economic Zone Ltd 0.38%
Cipla Ltd 0.38%
Zee Entertainment Enterprises Ltd 0.37%
Bharat Petroleum Corporation Ltd 0.34%
Ambuja Cements Ltd 0.33%
Bosch Ltd 0.32%
YES BANK LTD 0.31%
GAIL (India) Ltd 0.31%
Tata Steel Ltd 0.30%
ACC Ltd 0.24%
Idea Cellular Ltd 0.22%
Hindalco Industries Ltd 0.20%
Bharat Heavy Electricals Ltd 0.19%
Vedanta Limited 0.18%
Tata Power Company Ltd 0.16%
Bank of Baroda 0.15%
Cairn India Ltd 0.10%
Punjab National Bank 0.07%
Equity Pension Guarantee Fund
Others 9.31%Shree Cement Ltd 0.66%Zee Entertainment Enterprises Ltd 0.59%Lupin Ltd 0.53%Ashok Leyland Ltd 0.51%Ambuja Cements Ltd 0.50%Bharat Petroleum Corporation Ltd 0.49%Mundra Port and Special Economic Zone Ltd 0.45%Ashoka Buildcon Ltd 0.35%Reliance Industries Ltd 0.34%T V S Motor Co. Ltd. 0.33%The Ramco Cements Limited 0.33%Coal India Ltd 0.33%Whirlpool Of India Ltd 0.33%ABB Ltd 0.31%Power Grid Corporation of India Ltd 0.29%Indian Hotels Company Ltd 0.26%Bharat Forge Ltd 0.26%Greenply Industries Ltd 0.25%Voltas Ltd 0.20%Indraprastha Gas Ltd 0.20%Aurobindo Pharma Ltd 0.19%Tata Steel Ltd 0.15%Cipla Ltd 0.15%Petronet L N G Ltd 0.14%Bank of Baroda 0.12%Emami Ltd 0.12%Divis Laboratories Ltd 0.12%Asian Paints Ltd 0.09%Kajaria Ceramics Limited 0.09%Berger Paints India Ltd 0.09%Supreme Industries Ltd 0.09%Dalmia Bharat Ltd 0.08%HealthCare Global Enterprises Ltd 0.08%Gujarat State Petronet Ltd 0.06%IDFC Bank Ltd 0.06%F A G Bearings India Ltd 0.05%Granules India Ltd 0.04%Godrej Consumer Products Limited 0.04%Max Financial Services Ltd 0.03%
Equity Kotak Pension Floor Fund
ANNUAL FUND UPDATE AS ON 31st March 2016
Others 14.43%Shree Cement Ltd 0.93%Zee Entertainment Enterprises Ltd 0.88%Lupin Ltd 0.81%Whirlpool Of India Ltd 0.72%Bharat Petroleum Corporation Ltd 0.72%Ashok Leyland Ltd 0.71%Ambuja Cements Ltd 0.70%Mundra Port and Special Economic Zone Ltd 0.66%T V S Motor Co. Ltd. 0.59%The Ramco Cements Limited 0.50%Coal India Ltd 0.47%Reliance Industries Ltd 0.46%Greenply Industries Ltd 0.43%Voltas Ltd 0.43%ABB Ltd 0.42%Indian Hotels Company Ltd 0.41%Ashoka Buildcon Ltd 0.40%Power Grid Corporation of India Ltd 0.40%Bharat Forge Ltd 0.37%IDFC Bank Ltd 0.35%Berger Paints India Ltd 0.30%Aurobindo Pharma Ltd 0.27%F A G Bearings India Ltd 0.24%Max Financial Services Ltd 0.23%Tata Steel Ltd 0.21%Supreme Industries Ltd 0.21%Divis Laboratories Ltd 0.19%Emami Ltd 0.19%Cipla Ltd 0.18%Indraprastha Gas Ltd 0.15%Petronet L N G Ltd 0.14%Asian Paints Ltd 0.13%Kajaria Ceramics Limited 0.13%Dalmia Bharat Ltd 0.11%HealthCare Global Enterprises Ltd 0.10%Gujarat State Petronet Ltd 0.09%Max India Ltd Taurus 0.07%Granules India Ltd 0.06%Godrej Consumer Products Limited 0.06%6% Zee Entertainment Enterprises Ltd Pref Shares 0.02%Max Ventures & Industries Limited 0.01%
Equity Kotak Pension Growth Fund
Others 10.16%Mahindra & Mahindra Ltd 0.70%Zee Entertainment Enterprises Ltd 0.66%Lupin Ltd 0.58%Bharat Petroleum Corporation Ltd 0.52%Ashok Leyland Ltd 0.51%Ambuja Cements Ltd 0.50%Mundra Port and Special Economic Zone Ltd 0.48%Whirlpool Of India Ltd 0.47%T V S Motor Co. Ltd. 0.47%The Ramco Cements Limited 0.36%Reliance Industries Ltd 0.34%ABB Ltd 0.33%Coal India Ltd 0.33%Power Grid Corporation of India Ltd 0.29%Ashoka Buildcon Ltd 0.29%Indian Hotels Company Ltd 0.26%Bharat Forge Ltd 0.26%IDFC Bank Ltd 0.25%Berger Paints India Ltd 0.21%Voltas Ltd 0.20%Emami Ltd 0.19%Supreme Industries Ltd 0.19%Infrastructure Development Finance Company Ltd 0.17%Cipla Ltd 0.16%Divis Laboratories Ltd 0.16%Tata Steel Ltd 0.15%Max Financial Services Ltd 0.15%Petronet L N G Ltd 0.14%Indraprastha Gas Ltd 0.11%Greenply Industries Ltd 0.10%Asian Paints Ltd 0.09%Kajaria Ceramics Limited 0.09%F A G Bearings India Ltd 0.09%Dalmia Bharat Ltd 0.08%HealthCare Global Enterprises Ltd 0.08%Gujarat State Petronet Ltd 0.06%Max India Ltd Taurus 0.05%Granules India Ltd 0.04%Godrej Consumer Products Limited 0.04%Max Ventures & Industries Limited 0.01%
Equity Pension Floor Fund II
ANNEXURE
57
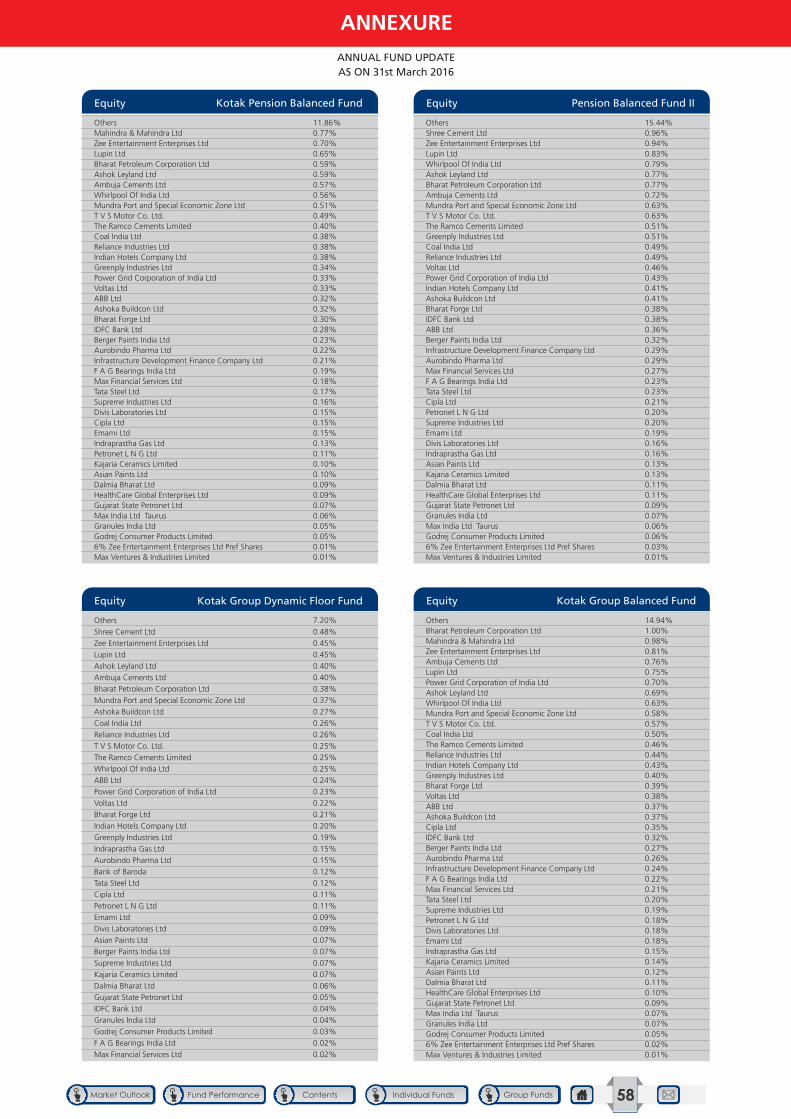
Others 11.86%Mahindra & Mahindra Ltd 0.77%Zee Entertainment Enterprises Ltd 0.70%Lupin Ltd 0.65%Bharat Petroleum Corporation Ltd 0.59%Ashok Leyland Ltd 0.59%Ambuja Cements Ltd 0.57%Whirlpool Of India Ltd 0.56%Mundra Port and Special Economic Zone Ltd 0.51%T V S Motor Co. Ltd. 0.49%The Ramco Cements Limited 0.40%Coal India Ltd 0.38%Reliance Industries Ltd 0.38%Indian Hotels Company Ltd 0.38%Greenply Industries Ltd 0.34%Power Grid Corporation of India Ltd 0.33%Voltas Ltd 0.33%ABB Ltd 0.32%Ashoka Buildcon Ltd 0.32%Bharat Forge Ltd 0.30%IDFC Bank Ltd 0.28%Berger Paints India Ltd 0.23%Aurobindo Pharma Ltd 0.22%Infrastructure Development Finance Company Ltd 0.21%F A G Bearings India Ltd 0.19%Max Financial Services Ltd 0.18%Tata Steel Ltd 0.17%Supreme Industries Ltd 0.16%Divis Laboratories Ltd 0.15%Cipla Ltd 0.15%Emami Ltd 0.15%Indraprastha Gas Ltd 0.13%Petronet L N G Ltd 0.11%Kajaria Ceramics Limited 0.10%Asian Paints Ltd 0.10%Dalmia Bharat Ltd 0.09%HealthCare Global Enterprises Ltd 0.09%Gujarat State Petronet Ltd 0.07%Max India Ltd Taurus 0.06%Granules India Ltd 0.05%Godrej Consumer Products Limited 0.05%6% Zee Entertainment Enterprises Ltd Pref Shares 0.01%Max Ventures & Industries Limited 0.01%
Equity Kotak Pension Balanced Fund
Others 7.20%
Shree Cement Ltd 0.48%
Zee Entertainment Enterprises Ltd 0.45%
Lupin Ltd 0.45%
Ashok Leyland Ltd 0.40%
Ambuja Cements Ltd 0.40%
Bharat Petroleum Corporation Ltd 0.38%
Mundra Port and Special Economic Zone Ltd 0.37%
Ashoka Buildcon Ltd 0.27%
Coal India Ltd 0.26%
Reliance Industries Ltd 0.26%
T V S Motor Co. Ltd. 0.25%
The Ramco Cements Limited 0.25%
Whirlpool Of India Ltd 0.25%
ABB Ltd 0.24%
Power Grid Corporation of India Ltd 0.23%
Voltas Ltd 0.22%
Bharat Forge Ltd 0.21%
Indian Hotels Company Ltd 0.20%
Greenply Industries Ltd 0.19%
Indraprastha Gas Ltd 0.15%
Aurobindo Pharma Ltd 0.15%
Bank of Baroda 0.12%
Tata Steel Ltd 0.12%
Cipla Ltd 0.11%
Petronet L N G Ltd 0.11%
Emami Ltd 0.09%
Divis Laboratories Ltd 0.09%
Asian Paints Ltd 0.07%
Berger Paints India Ltd 0.07%
Supreme Industries Ltd 0.07%
Kajaria Ceramics Limited 0.07%
Dalmia Bharat Ltd 0.06%
Gujarat State Petronet Ltd 0.05%
IDFC Bank Ltd 0.04%
Granules India Ltd 0.04%
Godrej Consumer Products Limited 0.03%
F A G Bearings India Ltd 0.02%
Max Financial Services Ltd 0.02%
Equity Kotak Group Dynamic Floor Fund
ANNUAL FUND UPDATE AS ON 31st March 2016
Others 15.44%Shree Cement Ltd 0.96%Zee Entertainment Enterprises Ltd 0.94%Lupin Ltd 0.83%Whirlpool Of India Ltd 0.79%Ashok Leyland Ltd 0.77%Bharat Petroleum Corporation Ltd 0.77%Ambuja Cements Ltd 0.72%Mundra Port and Special Economic Zone Ltd 0.63%T V S Motor Co. Ltd. 0.63%The Ramco Cements Limited 0.51%Greenply Industries Ltd 0.51%Coal India Ltd 0.49%Reliance Industries Ltd 0.49%Voltas Ltd 0.46%Power Grid Corporation of India Ltd 0.43%Indian Hotels Company Ltd 0.41%Ashoka Buildcon Ltd 0.41%Bharat Forge Ltd 0.38%IDFC Bank Ltd 0.38%ABB Ltd 0.36%Berger Paints India Ltd 0.32%Infrastructure Development Finance Company Ltd 0.29%Aurobindo Pharma Ltd 0.29%Max Financial Services Ltd 0.27%F A G Bearings India Ltd 0.23%Tata Steel Ltd 0.23%Cipla Ltd 0.21%Petronet L N G Ltd 0.20%Supreme Industries Ltd 0.20%Emami Ltd 0.19%Divis Laboratories Ltd 0.16%Indraprastha Gas Ltd 0.16%Asian Paints Ltd 0.13%Kajaria Ceramics Limited 0.13%Dalmia Bharat Ltd 0.11%HealthCare Global Enterprises Ltd 0.11%Gujarat State Petronet Ltd 0.09%Granules India Ltd 0.07%Max India Ltd Taurus 0.06%Godrej Consumer Products Limited 0.06%6% Zee Entertainment Enterprises Ltd Pref Shares 0.03%Max Ventures & Industries Limited 0.01%
Equity Pension Balanced Fund II
Others 14.94%Bharat Petroleum Corporation Ltd 1.00%Mahindra & Mahindra Ltd 0.98%Zee Entertainment Enterprises Ltd 0.81%Ambuja Cements Ltd 0.76%Lupin Ltd 0.75%Power Grid Corporation of India Ltd 0.70%Ashok Leyland Ltd 0.69%Whirlpool Of India Ltd 0.63%Mundra Port and Special Economic Zone Ltd 0.58%T V S Motor Co. Ltd. 0.57%Coal India Ltd 0.50%The Ramco Cements Limited 0.46%Reliance Industries Ltd 0.44%Indian Hotels Company Ltd 0.43%Greenply Industries Ltd 0.40%Bharat Forge Ltd 0.39%Voltas Ltd 0.38%ABB Ltd 0.37%Ashoka Buildcon Ltd 0.37%Cipla Ltd 0.35%IDFC Bank Ltd 0.32%Berger Paints India Ltd 0.27%Aurobindo Pharma Ltd 0.26%Infrastructure Development Finance Company Ltd 0.24%F A G Bearings India Ltd 0.22%Max Financial Services Ltd 0.21%Tata Steel Ltd 0.20%Supreme Industries Ltd 0.19%Petronet L N G Ltd 0.18%Divis Laboratories Ltd 0.18%Emami Ltd 0.18%Indraprastha Gas Ltd 0.15%Kajaria Ceramics Limited 0.14%Asian Paints Ltd 0.12%Dalmia Bharat Ltd 0.11%HealthCare Global Enterprises Ltd 0.10%Gujarat State Petronet Ltd 0.09%Max India Ltd Taurus 0.07%Granules India Ltd 0.07%Godrej Consumer Products Limited 0.05%6% Zee Entertainment Enterprises Ltd Pref Shares 0.02%Max Ventures & Industries Limited 0.01%
Equity Kotak Group Balanced Fund
ANNEXURE
58
ANNUAL FUND UPDATE AS ON 31st March 2016
Disclaimer :Though document is thoroughly researched & prepared by our fund experts. kotak l ife insurance ltd however makes no warranties, representations, promises or statements that the information contained herein is clear, correct, precise or accurate. this document has been prepared for the purpose of providing an overview of kli funds without taking account of any particular investor’s objectives, financial situation or needs you are therefore requested not to substitute this document with any professional opinion/advice and to use your discretion basis your financial objectives.
Risk factors :
• Unit Linked Life Insurance Products are different from traditional insurance products and are subject to the risk factors.
• The premium paid in Unit Linked Life Insurance Products are subject to investment risk associated with capital markets and the NAVs of
the units may go up or down based on the performance of the fund and factors influencing the capital market and insured is responsible for his/her decisions.
• Kotak Life Insurance is only the name of the Insurance Company and the specified Unit Linked funds do not in any way indicate the quality
of the contract, its future prospects or returns.
• Please know the associated risks and the applicable charges from your insurance agent or the intermediary or policy document of the
insurer.
• Past performance of any of the funds is not indicative of their future prospects or returns.
About Us :About Kotak Mahindra Old Mutual Life InsuranceKotak Mahindra Old Mutual Life Insurance is a 74:26 joint venture between Kotak Mahindra Bank Ltd., its affiliates and Old Mutual plc. A company that combines its international strengths and local advantages to offer its customers a wide range of innovative life insurance products, helping them takes important financial decisions at every stage in life and stay financially independent. The company is one of the fastest growing insurance companies in India and has shown remarkable growth since its inception in 2000. Kotak Life Insurance employs over 5500^ people in its various businesses and has 205^ branches pan India.
The Kotak Mahindra GroupThe Kotak Mahindra group is one of India’s leading banking and financial services organizations, with offerings across personal financial services; commercial banking; corporate and investment banking and markets; stock broking; asset management and life insurance. The Kotak Group has a net worth of Rs. 19,076* cr and has a distribution network through branches, franchisees, representative offices and satellite offices across cities and towns in India and offices in London, New York, San Francisco, Singapore, Dubai and Mauritius, servicing around 7 million customer accounts.
Old Mutual plcOld Mutual plc is an international savings and wealth management company based in the UK. Originating in South Africa in 1845, Old Mutual is a Global 500 and FTSE 100 company, listed in UK, South Africa and other 3 African exchanges. The group has a balanced portfolio of businesses offering Asset Management, Life Assurance, Banking and General Insurance Services in over 40 countries, with a focus on South Africa, Europe and the United States, and a growing presence in Asia Pacific.
*Source: Investor Relation- Earning update Q2 FY 2013-14.
^Public disclosure FY 2013-14
Kotak Mahindra Old Mutual Life Insurance Ltd., Regn. No.107, Regd. Office: 4th Floor, Vinay Bhavya Complex, 159 A, C.S.T. Road, Kalina, Santacruz (East), Mumbai - 400 098 .
Website: http://insurance.kotak.com, Email: [email protected]. Insurance is the subject matter of the solicitation
DISCLAIMER
59