kpi report for the minister for construction · the kpi groups 8 the key project stages 8...
TRANSCRIPT

KPI Report forThe Minister for
Construction
By The KPI Working Groupdated January 2000
KPI Report forThe Minister for Construction
By The KPI Working Groupdated January 2000
January 2000
Department of the Environment, Transport and the Regions

Department of the Environment, Transport and the RegionsEland HouseBressenden PlaceLondon SW1E 5DUTelephone 020 7944 3000Internet service http://www.detr.gov.uk
© Crown Copyright 1999
Extracts of this guide may be made for non-commercial in-house use, subject to the sourcebeing acknowledged.
Applications for reproduction should be made in writing to The Copyright Unit, Her Majesty’sStationery Office, St Clements House, 1-16 Colegate, Norwich NR3 1BQ.
Further copies of this report are available from:Department of the Environment, Transport and the RegionsPO Box 236WetherbyWest YorkshireLS23 7NBTel: 0870 1226 236Fax: 0870 1226 237
Product code 99 CD 0820.
Printed in the UK, January 2000 on material containing 100% post-consumer waste.Cover printed on material containing 75% post-consumer waste and 25% ECF pulp.
ACKNOWLEDGEMENTSIn publishing the KPI Report, the Department of the Environment, Transport and the Regionsacknowledges the work of the KPI Working Group, its seven Sub-Groups and in particular thetireless efforts of its chairman Alan Crane.
The KPI Working Group was made up from a broad spectrum of members representing all sides ofthe Construction Industry and its Clients.
This report represents the groups collective views on the measurement of the industry’s performanceand is the direct response to Sir John Egan’s report Rethinking Construction called for by theMinister for Construction.
The following is a list of members of the group in alphabetical order:
Adrian Blumenthall, M4I
Eddie Brown, CLG
Stuart Burchell, ECA
Mike Burt, HM Treasury
Vassos Chrysostomou, BRE
Ruth Clifton, Ove Arup
Clive Clowes, Housing Corporation
John Connaughton, Davis LangdonConsultancy
Roger Courtney, BRE
Alan Crane, Christiani & Nielson –(Chairman)
Steve Creed, Stanger
Bob Davies, DETR
Jon Emery, Hammerson
David Fison, Kavaerner
Rob Garvey, Mace
Paul Harries, Ernst & Young
Guy Hazelhurst, UWE
Simon Lunn, DETR
Ian Macpherson, Mace
Will McKee, BPF
Simon Murray, Railtrack
Chris Nicholls, Construction Confederation
Charles Novotny, Tarmac
Bob Packham, DETR
Andrew Partridge, Christiani & Neilson
Jennie Price, MCG
Martin Print, DTI
Roderick Rennison, WS Atkins
Terry Rochester, CCF
Richard Ryder, Pfizer
Alan Taylor, Bovis European
Don Ward, CIB
Alan Willen, ACPS

KPI Report
FOREWORDby Nick Raynsford, Minister for Construction
Sir John Egan’s report, Rethinking Construction, challenged the industry to measure itsperformance over a range of its activities and to meet a set of ambitious improvement targets.
This is the KPI Working Group’s answer to that challenge. It sets out a comprehensive frameworkwhich construction enterprises can use to measure their performance against the rest of the industry,and has been designed to be used by organisations, large or small, specialist or supplier, designers orconstructors.
It builds on the Key Performance Indicators pack released earlier this year. The KPI Pack presentsthe construction industry’s range of performance using ten headline measures, but omits the moredetailed elements of performance. This report addresses that need, by presenting organisations with aframework to benchmark activities both at a broad level, and at a level much closer to the ‘coal face’- such as rectifying defects and meeting clients’ expectations.
I urge organisations to use this framework to examine their performance and compare it with otherswithin benchmarking clubs. Only by doing this, can the construction industry truly demonstrate thatit is successfully improving its performance. I believe that this framework has surpassed Sir John’schallenge, and is another major step forward in making the industry truly first class in every sense.
I am grateful to the industry at many levels for responding so positively to the challenge Sir John andI have set them.
Nick RaynsfordMinister for Construction

CONTENTS
INTRODUCTION
The Purpose of the KPIs 7
The KPI Groups 8
The Key Project Stages 8
Interpretation of the Key Project Stages 9
The KPIs 10
The Level of KPIs 11
The Supply Chain Cube 11
THE KPI DEFINITIONS AND GUIDANCE
Time 13
Cost 15
Quality 16
Client Satisfaction 18
Change Orders 19
Business Performance 21
Health and Safety 23
APPENDICES
Appendix 1 – Example KPI Calculations 24
Appendix 2 – Quality Register 31
Appendix 3 – Client Satisfaction Survey Forms 32

Introduction
7
Introduction
The Purpose of the KPIsClients of the construction industry want their projects delivered:
• on time
• on budget
• free from defects
• efficiently
• right first time
• safely
• by profitable companies1
Regular clients expect continuous improvement from their construction team to achieve year-on-year:
• reductions in project costs
• reductions in project times
The purpose of the Key Performance Indicators (KPIs) is to enable measurement of project andorganisational performance throughout the construction industry. This information can then be usedfor benchmarking purposes, and will be a key component of any organisation’s move towardsachieving best practice.
Clients, for instance, assess the suitability of potential suppliers for a project, by asking them toprovide information about how they perform against a range of indicators. Some information willalso be available through the industry’s benchmarking initiatives, so clients can see how potentialsuppliers compare with the rest of the industry in a number of different areas.
Construction supply chain companies will be able to benchmark their performance to enable themto identify strengths and weaknesses, and assess their ability to improve over time.
While individual organisations have been measuring their performance for many years, there hasbeen little consistency in the data, and the way it has been published. This report is another step inrectifying this deficiency, which builds on the foundation of the Construction Industry KPIs2 bydetailing a comprehensive framework for measurement.
1 Contractors’ inability to make a profit was identified as a major reason for project cost and time over-runs in SirMichael Latham’s report ‘Constructing the Team’.
2 The Construction Best Practice Programme has published the Construction Industry Key Performance Indicators1998 – Project Delivery and Company Performance, which contains the industry’s performance in ten areasacross the industry’s sectors; tel: 0845 605 5556.

KPI Report
8
The Department of the Environment, Transport and the Regions, the Construction Industry Board,and the Movement for Innovation will, through the Construction Best Practice Programme,continue to publish annual wallcharts for the headline KPIs. Where available, operational anddiagnostic data will also be published. However, the primary application of this report is forindividual firms or benchmarking clubs to adopt a common framework as the basis for understandingin more depth their relative performance against the headline KPIs, confident that others will beusing the same common definitions.
The working group recommends that the most effective tool for analysing all aspects of anorganisation’s operations is the EFQM (Business) Excellence Model promoted in the UK by theBritish Quality Foundation. This enables comparison with other firms and with other industries.
The KPI GroupsThe KPI framework consists of seven main groups:
• Time
• Cost
• Quality
• Client Satisfaction
• Client Changes
• Business Performance
• Health and Safety
Within these groups, a range of indicators has been developed to analyse either project or companyperformance, or both.
The Key Project StagesIn order to define the KPIs throughout the lifetime of a project, five key stages have been identified:
A. Commit to Invest – the point at which the client decides in principle to invest in a project, setsout the requirements in business terms and authorises the project team to proceed with theconceptual design.
B. Commit to Construct – the point at which the client authorises the project team to start theconstruction of the project.
C. Available for Use – the point at which the project is available for substantial occupancy or use.This may be in advance of the completion of the project.
D. End of Defect Liability Period – the point at which the period within the construction contractduring which the contractor is obliged to rectify defects ends (often 12 months from point C).

Introduction
9
E. End of Lifetime of Project – the point at which the period over which the project is employedin its original or near original purpose ends. As this is usually many years after the project’scompletion, this is a theoretical point over which concepts such as full life costs can be applied.
Interpretation of the Key Project StagesFor the most common systems of procurement, experience of the first year’s use of the ConstructionIndustry KPIs suggests the following common interpretations of the five key stages. However, giventhe diversity of modern procurement systems, and the many variations in practice, it may beappropriate or necessary to adopt different interpretations.
Key Project Stages
Procurement Typical Milestone at Key Point/StageSystem
End ofconcessionuseful life;on-goingpayment tocontractor
End of defectsliability period ifrelevant
Handover ofbuilt facility foruse
Appointment oflead contractor(if different), orsanction toproceed withconstructionphase
Appointment of‘SpecialPurposeVehicle’
PFI
DittoDittoDittoAppointment ofconstructionmanager
Appointment oflead designer
ConstructionManagement
DittoDittoDittoAppointmentof leadD&B contractor
Appointment(if any) ofconsultantsprior to maincontract
Design & Build
End ofuseful life
End of defectsliability period(often 12months);payment of anyretentionmonies
Handover ofbuilt facility foruse; paymentof all non-retentionmonies
Appointment oflead (main)contractor
Appointment oflead designer
Traditional(designer-led)
EDCBA
Commit Commit Available End of End ofto to for Defects Liability Lifetime of
Invest Construction Use Period Project
Planning & Design Construction Defect Liability Lifetime ofPeriod Project
A B C D E

KPI Report
10
The KPIs The KPI groups and their associated indicators are shown in the table below.
The definitions for these indicators and guidance on their use is given in the section KPI Definitionsand Guidance.
Group Indicators Level
Time 1. Time for Construction Headline2. Time Predictability – Design Headline3. Time Predictability – Construction Headline4. Time Predictability – Design & Construction Operational5. Time Predictability – Construction Diagnostic
(Client Change Orders)6. Time Predictability – Construction Diagnostic
(Project Leader Change Orders)7. Time to Rectify Defects Operational
Cost 1. Cost for Construction Headline2. Cost Predictability – Design Headline3. Cost Predictability – Construction Headline4. Cost Predictability – Design and Construction Operational5. Cost Predictability – Construction (Client Diagnostic
Change Orders)6. Cost Predictability – Construction (Project Diagnostic
Leader Change Orders)7. Cost of Rectifying Defects Operational8. Cost In Use Operational
Quality 1. Defects Headline2. Quality Issues at Available for Use Operational3. Quality Issues at End of Defect Rectification Period Operational
Client Satisfaction 1. Client Satisfaction Product – Standard Criteria Headline2. Client Satisfaction Service – Standard Criteria Headline3. Client Satisfaction – Client-Specified Criteria Operational
Change Orders 1. Change Orders – Client Diagnostic2. Change Orders – Project Manager Diagnostic
Business 1. Profitability (company) HeadlinePerformance 2. Productivity (company) Headline
3. Return on Capital employed (company) Operational4. Return on Value Added (company) Operational5. Interest Cover (company) Operational6. Return on Investment (client) Operational7. Profit Predictability (project) Operational8. Ratio of Value Added (company) Diagnostic9. Repeat Business (company) Diagnostic10. Outstanding Money (project) Diagnostic11. Time taken to reach Final Account (project) Diagnostic
Health and Safety 1. Reportable Accidents (inc fatalities) Headline2. Reportable Accidents (non-fatal) Operational3. Lost Time Accidents Operational4. Fatalities Operational

Introduction
11
The Level of KPIsHeadline Indicators provide a measure of the overall, rude state of health of a firm.
Operational Indicators bear on specific aspects of a firm’s activities and should enable managementto identify and focus on specific areas for improvement.
Diagnostic Indicators provide information on why certain changes may have occurred in theheadline or operational indicators and are useful in analysing areas for improvement in more detail.
The indicators are identified as applicable at project and/or company levels. In some cases thecompany indicator is the average value of that company’s project indicators.
The indicators are identified as appropriate to the various members of the supply chain to whichthey could be applied.
For all indicators an organisation may have to use estimated, predicted or actual data depending onthe stage of progress on the project.
The Supply Chain CubeThe indicators presented in this report are designed to be applied at a project or a company level,depending on the indicator in question. However, the working group also considered extending theapplication of the key performance indicators to the different parts of the construction supply chain.This creates a network of suppliers and clients. An organisation will be either client or supplierdepending on which part of the supply chain the organisation lies within, and with whom thatorganisation is dealing. This section briefly outlines how these indicators can be extendedthroughout this supply chain.
The diagram on the next page indicates in the form of a cube the inter-relationships between theparts of the supply chain and the key performance indicators. Each of the individual building blocksrepresents a different component of the KPIs. As it is three dimensional, the analysis will depend onthe dimension in which the performance is analysed: by supply chain component; by time period; or– when viewed in the dimension of arrow A – by KPI.
In the diagram, the first face of the cube analysed in the direction of arrow A would be time. Here,the materials supplier is above the contractor in the supply chain, so the latter is, in this case, theclient. Therefore, the key performance indicators used for the contractor as a client of the materialssupplier will be similar, but not the same as for the whole project’s client.

KPI Report
12
For example among the main satisfaction considerations that a contractor, as a client to a materialssupplier might have, are the following:
1. defects
2. delivery time
3. ability to deliver straight to site
4. cost of materials
5. payment terms
The project’s client is also interested in the defects, not only of the materials, but those that comeabout from workmanship. Similarly, the project’s client is interested in delivery times and costs, butof the whole project, not for individual items. Manufacturers’ ability to deliver materials straight tosite will not be an explicit consideration for the project’s client, but will have a bearing on the finalcompletion time and cost. Payment terms will be of interest to the client, but again, will be for thewhole project, not the individual materials.
Of course, because the cube is three dimensional, it can be ‘sliced’ in different dimensions. Instead ofhaving each face as a separate KPI, it can, for instance, be analysed for a separate part of the supplychain or a different point in the project cycle by cutting it in a different dimension.
The working group believe that the framework is flexible enough for companies to take theindividual KPIs and adapt them in a way which will suit their specific needs, regardless of whetherthey are materials suppliers, advisers, contractors, sub-contractors or clients. It challenges theindustry to tailor the framework so that it fully integrates it throughout the whole supply chain.
Supply Chain Cube
Cos
t
Tim
eQua
lity
Cha
nges
Ord
ers
Com
mit
to In
vest
Com
mit
to C
onst
ruct
Ava
ilabl
e fo
r U
se
Def
ects
Lia
bilit
yP
erio
d
Who
le L
ife
Contractors
Consultants /Advisers
Clients
Etc TimeKPIs
Sup
ply
Cha
in
Sub-ContractorsSuppliers
Clie
nt S
atis
fact
ion
A
Etc

The KPI Definitions and Guidance
13
The KPI Definitions and Guidance
TimeOBJECTIVE
Provide a suite of KPIs which facilitate measures of time performance improvement on a project byproject basis, either within a single company or within a market sector.
INDICATORS
Indicator Type Definition
1. Time for Construction Headline Change in the current normalised construction time ofa project at Commit to Construct (point B) comparedwith one year earlier, expressed as a percentage of theone year earlier time.
2. Time Predictability – Headline Change between the actual design time at Commit todesign Construct (point B) and the estimated design time at
Commit to Invest (point A), expressed as a percentageof the estimated design time at Commit to Invest(point A).
3. Time Predictability – Headline Change between the actual construction time atconstruction Available for Use (point C) and the estimated
construction time at Commit to Construct (point B),expressed as a percentage of the estimatedconstruction time at Commit to Construct (point B).
4. Time Predictability – Operational Change between the actual design and constructiondesign & construction time at Available for Use (point C) and the estimated
design and construction time at Commit to Invest(point A), expressed as a percentage of the estimateddesign and construction time at Commit to Invest(point A).
5. Time Predictability – Diagnostic Change, attributable to client approved change ordersconstruction (client originating from the client / client representative,change orders) between the actual construction time at Available for
Use (point C) and the estimated construction time atCommit to Construct (point B), expressed as apercentage of the estimated construction time atCommit to Construct (point B).
6. Time Predictability – Diagnostic Change, attributable to client approved change ordersconstruction (project originating from the project manager, between themanager change actual construction time at Available for Use (point C)orders) and the estimated construction time at Commit to
Construct (point B), expressed as a percentage of theestimated construction time at Commit to Construct(point B).
7. Time to rectify defects Operational The Contractors time taken to rectify all defects in thein maintenance maintenance period between Available for Use (pointperiod C) and End of the Contractually Agreed Period for
Rectifying Defects (point D), expressed in weeks.

KPI Report
14
GUIDANCE
Time information for some KPIs will be difficult to obtain, particularly “estimates of time at point A”and “time taken to rectify all defects between points C and D”. It is recommended that all parties tothe project agree at the start of a project to disclose the necessary data to allow such measures to bemade.
Within market sectors, it is suggested that target time periods, change levels and predictability levelsare agreed for repetitive or comparable projects. These will serve as benchmark targets against whichperformance is measured (ie the target to better).
It should be noted that the definitions include the effect of client changes in the headline “TimePredictability” KPIs 2, 3 & 4.
KPIs 5 & 6 seek to diagnose the responsibility for the Time Predictability performance measurebetween the estimated construction time at Commit to Construct (point B) and the actualconstruction time at Available for Use (point C) in line with the Client Change KPIs.
The definition of what time should or should not be included in each of the parameters is important.It is the working party’s view that specific definitions are restrictive and that, where necessary, thoseusing the measures should adapt the definitions to suit their particular industry/application. Thiswould not present a problem for an individual organisation, however, where comparisons acrossprojects are being made, care should be taken to ensure uniform definitions (this is especiallyimportant in benchmarking groups). If sector or industry wide comparisons with the ConstructionIndustry KPIs published by the Construction Best Practice Programme are being made, thedefinitions described in the KPI Handbook should be used.
Example calculations of Time KPIs are contained at Appendix 1.

The KPI Definitions and Guidance
15
CostOBJECTIVE
Provide a suite of KPIs which facilitate measures of cost performance improvement on a project byproject basis, either within a single company or within a market sector.
INDICATORS
Indicator Type Definition
1. Cost of Construction Headline Change in the current normalised construction cost ofa project at Commit to Construct (point B) comparedwith one year earlier, expressed as a percentage of theone year earlier cost.
2. Cost Predictability – Headline Change between the actual design cost at Availabledesign for Use (point C) and the estimated design cost at
Commit to Invest (point A), expressed as a percentageof the estimated design cost at Commit to Invest(point A).
3. Cost Predictability – Headline Change between the actual construction cost atconstruction Available for Use (point C) and the estimated
construction cost at Commit to Construct (point B),expressed as a percentage of the estimatedconstruction cost at Commit to Construct (point B).
4. Cost Predictability – Operational Change between the actual design and constructiondesign & construction cost at Available for Use (point C) and the estimated
design and construction cost at Commit to Invest(point A), expressed as a percentage of the estimateddesign and construction cost at Commit to Invest(point A).
5. Cost Predictability – Diagnostic Change, attributable to client approved change ordersconstruction (client originating from the client / client representative,change orders) between the actual construction cost at Available for
Use (point C) and the estimated construction cost atCommit to Construct (point B), expressed as apercentage of the estimated construction cost atCommit to Construct (point B).
6. Cost Predictability – Diagnostic Change, attributable to client approved change ordersconstruction (project originating from the project manager, between themanager change actual construction cost at Available for Use (point C)orders) and the estimated construction cost at Commit to
Construct (point B), expressed as a percentage of theestimated construction cost at Commit to Construct(point B).
7. Cost to rectify defects Operational The Contractors cost of rectifying all defects in thein the maintenance maintenance period between Available for Use (pointperiod C) and End of the Contractually Agreed Period for
Rectifying Defects (point D), expressed as apercentage of construction cost at Available for Use(point C).
8. Cost-in-Use Operational The annual operating and maintenance cost followingAvailable for Use (point C), expressed as a percentageof the actual design and construction cost at Availablefor Use (point C).

KPI Report
16
GUIDANCE
Cost information for some KPIs will be difficult to obtain, particularly “estimates of cost at point A”,“costs of rectifying all defects between points C and D”, and “annual operating and maintenancecosts after point C”. It is recommended that all parties to the project agree at the start of a project todisclose the necessary data to allow such measures to be made.
Within market sectors, it is suggested that target costs, change levels and predictability levels areagreed for repetitive or comparable projects. These will serve as benchmark targets against whichperformance is measured (ie the target to better).
It should be noted that the definitions include the effect of client changes in the headline “CostPredictability” KPIs 2, 3 & 4.
KPIs 5 & 6 seek to diagnose the responsibility for the Cost Predictability performance measurebetween the estimated construction cost at Commit to Construct (point B) and the actualconstruction cost at Available for Use (point C) in line with the Client Change KPIs.
The definition of what cost should or should not be included in each of the parameters is important.It is the working party’s view that specific definitions are restrictive and that, where necessary, thoseusing the measures should adapt the definitions to suit their particular industry/application. Thiswould not present a problem for an individual organisation, however, where comparisons acrossprojects are being made, care should be taken to ensure uniform definitions (this is especiallyimportant in benchmarking groups). If sector or industry wide comparisons with the ConstructionIndustry KPIs are being made, the definitions described in the KPI Handbook should be used.
Example calculations of Cost KPIs are contained at Appendix 1.
QualityOBJECTIVE
Provide a suite of KPIs which can be used to measure quality improvements from the start of aproject by measuring the number of ‘quality issues’.
INDICATORS
Indicator Type Definition
1. Defects Headline Impact, at the time of handover, caused by thecondition of the facility with respect to defects usingthe 1 to 10 scale set out below.
2. Quality issues at Operational The number of outstanding quality issues at Availableavailable for use for Use (point C).
3. Quality issues at end Operational The number of outstanding quality issues at the Endof defect rectification of the Contractually Agreed Period for Rectifyingperiod Defects (point D)

The KPI Definitions and Guidance
17
GUIDANCE
The headline Defects KPI is currently recorded on projects by the Construction Clients Forum(CCF) survey using the following scoring system.
10 = Apparently defect free
8 = Few defects no significant impact on client
5/6 = Some defects some impact on client
3 = Major defect major impact on client
1 = Totally defective
It is anticipated that this system should be used not only for the completed project but for elementswithin the project to be able to measure the performance of this indicator for all parts of the supplychain.
Quality is subjective and means different things to different people. At present there is no objectiverecognised method of measuring quality in the construction industry. The aim of the two operationalQuality KPIs is to improve the visibility of quality issues on construction projects through themeasurement of “quality issues”. Therefore this measure should record all quality issues on allelements within the project from project commencement.
A Quality Issue is defined as:
An issue that effects the project so that work needs to redone, modified or compromisedto a lower standard than originally agreed.
As a result, a quality issue will encompass defects, but it is also a much wider measure which coversissues which would not normally be considered to be defects. For instance, a quality issue mayinclude incorrect information on a drawing, defective materials, poor workmanship on site etc.
Definitions of the three types of quality issue are:
Rejected: When a quality issue involves the work being completely restarted and allprevious work deemed unusable, then the quality issue will be classified as rejected.
Reworked: When a quality issue involves work that requires modification to return it tothe agreed standard, then it should be classified as rework.
Compromised: If the project team accept work below the agreed standard this will beclassified as compromised.
When an agreed quality issue is identified it is recommended that details of quality issues arerecorded in a project quality register. The quality register should be started at the start of the projectand be maintained for the duration of the project.
A quality register proforma is contained at Appendix 2.

KPI Report
18
Client satisfactionOBJECTIVE
Provide a suite of KPIs which measure client satisfaction on a project by projects basis which can beused throughout the supply chain. Use surveys to assess whether projects meet clients’ expectationsand whether they are satisfied with the results.
INDICATORS
GUIDANCE
The two headline Client Satisfaction KPIs are currently recorded on projects by the ConstructionClients Forum (CCF) survey for consultants and main contractors using the following scoringsystem.
10 = Totally satisfied
5/6 = Neither satisfied nor dissatisfied
1 = Totally dissatisfied
The two headline Client Satisfaction KPIs have been developed with standard criteria in order tomake comparisons between projects
Customer satisfaction is by definition subjective, and as a consequence, is influenced by theindividual customer’s requirements. For this reason, a Client Satisfaction KPI has been developedwhich addresses the specific criteria which the client feels are important. It is recommended that theidentification of the client-specified criteria and weightings be requested in pre-tender qualifications.Also, regular monitoring should be undertaken in open dialogue between the customer and supplier.This will ensure not only that the criteria and weightings attached to them are both relevant andunderstood but also that the resultant scores are understood, accepted and ultimately acted upon.The final score is then normalised to enable comparison between projects.
The indicators have been developed to assess client satisfaction with advisors, suppliers andcontractors throughout the various parts of the supply chain.
A client satisfaction survey proforma is contained at Appendix 3.
Indicator Type Definition
1. Client Satisfaction Headline How satisfied the client was with the finished productProduct – standard using the score against the 1 to 10 scale set outcriteria below.
2. Client Satisfaction Headline How satisfied the client was with the service of theService – standard advisor, suppliers and contractors using the scorecriteria against the 1 to 10 scale set out below.
3. Client Satisfaction – Operational How satisfied the client was with certain client-client-specified specified criteria using the scores, against the 1 to 10criteria scale set out below, weighted together to determine
their level of importance.

The KPI Definitions and Guidance
19
Change ordersOBJECTIVE
Provide a suite of KPIs which facilitate measures of the extent to which a project has been affectedby changing specifications during the construction phase, either within a single company or within amarket sector.
INDICATORS
GUIDANCE
This indicator attempts to track the source of any change in a project’s design. The type of projectand type of contract will, therefore, determine whether a change order originates from theclient/client representative or the reporting company. Under a traditional contract with the designcontract separated from the construction contract, a change originating from the designer can beinterpreted as a client representative order. With a design and build contract, however, the samechange order from the designer would be interpreted as the project leader’s order. As a result, carefulinterpretation is required in assessing this indicator.
Client representative includes the client’s advisor. It will include designers under traditionalcontractual arrangements.
Project manager includes main contractor, sub contractor, and (occasionally) designers.
One Architect’s Instruction may contain a number of change orders. It is the number of changeorders, not the number of pieces of paper which should be recorded.
This indicator only serves to record the number of changes, and not the amount of re-working whichthese changes entail. A substantial amount of re-working as a result of the change orders will bepicked up by the time and cost predictability indicators. Clients can call for any number of changesto the design and other items as permitted under the contract. Additionally, they can introduce, byagreement with the supply side, changes that are not covered under the contract.
There are of course many reasons why changes arise, ranging from general improvements to thecontract, optimisation of design, errors, omissions, changed performance requirements,non-availability of products/materials, changes to overcome difficulties/problems that are discoveredas the work proceeds etc.
Indicator Type Definition
1. Change orders – Diagnostic Number of individual change orders approved by theclient client/client representative between Commit to
Construct (point B) and Available for Use (point C),originating from the client / client representative.
2. Change orders – Diagnostic The number of individual change orders approved byproject manager the client/client representative between Commit to
Construct (point B) and Available for Use (point C),originating from the project manager.

KPI Report
20
Some changes will be unavoidable and others will be necessary through the optimisation process, butchanges arising from unclear objectives at the start of the project or insufficient preplanning and preinvestigation should be avoidable in most situations.
The cost of changes may not represent good value for money and may have other disadvantages likedisrupting the programme and extending the contract period. As a general approach, it is suggestedthat client changes should only be instructed/introduced where they are necessary to maintain or addvalue to the clients’ business case.
Zero change orders should be the target and would imply the design was ‘right first time’. However,such a target should not be traded off against customer satisfaction and defects if improvements canbe made by design changes throughout the construction process.
KPIs 5 & 6 in the Time and Cost sections seek to evaluate the responsibility for both the KPIs inthis section.

The KPI Definitions and Guidance
21
Business performanceOBJECTIVE
Provide a suite of KPIs which facilitate measures of business performance on a project or companybasis along the supply chain, either within a single company or within a market sector.
INDICATORS
* profit predictability should be tracked throughout a project – see Management Accounting Practice below
Indicator Type Definition
1. Profitability Headline Company profit expressed as a percentage ofturnover.
2. Productivity Headline Company value added per employee expressed inpounds.
3. Return on capital Operational Company profit expressed as a percentage of capitalemployed employed.
4. Return on value Operational Company profit expressed as a percentage of valueadded added.
5. Interest cover Operational Company profit (before interest and tax) expressed asa percentage of interest payable.
6. Return on investment Operational Comparison of estimated return on investment for theclient at Commit to Invest (point A) to actual return oninvestment at End of the Contractually Agreed Periodfor Rectifying Defects (point D) expressed as apercentage.
7. Profit predictability* Operational Change in final gross margin at available for use (point(project) C) and End of the Contractually Agreed Period for
Rectifying Defects (point D) expressed as apercentage of the planned gross margin at Commit toConstruct (point B).
8. Ratio of value added Diagnostic Company value added expressed as a percentage ofturnover.
9. Repeat business Diagnostic The value of repeat business expressed as apercentage of turnover.
10. Outstanding money Diagnostic Amount of the total final account outstanding atAvailable for Use (point C) and at End of theContractually Agreed Period for Rectifying Defects(point D) expressed as a percentage of the total finalaccount at Available for Use (point C).
11. Time taken to reach Diagnostic Time taken to reach final account from Available forfinal account Use (point C) expressed in weeks.
KPI Report
22
GUIDANCE
Glossary of terms:
Profit Profit before interest and tax.
Capital For a company is the sum of the shareholders funds and the bank debt andEmployed overdrafts.
For a project is the participants own cash required to fund the project.
Final account All moneys receivable on the contract, including retention.
Gross margin Project profit, before any central overheads.
Moneys The difference between the cash received and the final account.outstanding
Turnover Sales from construction activities.
Value added Turnover less all costs subcontracted to, or supplied by, other parties.
Return on The internal rate of return of the project, using the cost of acquiring the asset andInvestment the operating cashflows over the life of the asset.
Interest Sum of interest paid minus interest received.payable
Repeat Proportion of the value of all business won from existing clients before End of thebusiness Contractually Agreed Period for Rectifying Defects (point D) on existing
contracts.
MANAGEMENT ACCOUNTING PRACTICE
There are areas where the accounting practice may differ between companies, and which may havean impact on the ability to compare results between companies
The three most common ways of allocating overheads are to: cost overheads to jobs on a resourceutilised basis; to cost overheads to jobs based on the contract turnover; or to bear all overheadscentrally. The indicators attempt to reduce the impact of different treatments of overheads bylooking at the percentage change in predicted gross margins, rather than the absolute value,wherever possible.
Due to the nature of a partnership the net profit will be calculated before taking account of anypayments to the partners, including interest on any loans made by the partners. Due to the absenceof costs for the most senior staff the profit figure is likely to be higher in a partnership. This does notimpact the project specific indicators.

The KPI Definitions and Guidance
23
Health & safetyOBJECTIVE
Provide a suite of KPIs which facilitate measures of the frequency of lost time and reportableaccidents and fatalities.
HEADLINE INDICATORS
GUIDANCE
On a properly measured site details of all accidents will be recorded in an accident book. Recordedaccidents should include those involving third parties such as members of the public.
The indicators are the frequency rate per 100,000 hours worked. If data is not available for thenumber of hours worked on site, an estimate can be calculated by multiplying the average numberemployed on a site during the year by an estimate of the average number of hours worked. Wherethe construction period is for less than a year the figures need to be adjusted on a pro-rata basis.
Clients, consultants, contractors and sub-contractors should all be associated with the figures for allon-site accidents during the construction phase on projects with which they are involved. Forexample, if the contractor has an accident rate of 4.2, say, the Client, the Consultant and the sub-contractor will also have an accident rate of 4.2 for that particular project. This reflects the need totake a joint approach to tackling on-site health and safety issues.
Suppliers should calculate accident frequency rates at their own facilities. Due to the nature of themanufacturing process, these figures will usually relate to the total operation of the plant rather thanthe production of materials for a particular project.
Indicator Type Definition
1. Reportable accidents Headline Reportable accidents per 100,000 hours worked(inc fatalities) (inc fatalities)
2. Reportable accidents Operational Reportable accidents per 100,000 hours worked(non-fatal) (non-fatal)
3. Lost time accidents Operational Lost time accidents per 100,000 hours worked
4. Fatalities Operational Fatalities per 100,000 hours worked

KPI Report
24
APPENDIX 1
Example KPI Calculations
TimeExample data for the current project:
• Estimated design time at A. 60 weeks
• Actual design time at B. 68 weeks
• Estimated construction time at A. 65 weeks
• Construction contract period at B. 56 weeks
• Actual construction period at C. 60 weeks
• Additional time attributable to client change orders B-C. 3 weeks
• Additional time attributable to project managers change orders B-C. 1 weeks
• Actual time taken to rectify all defects between C-D. 6 weeks
• Higher specification than year earlier project (assessed). 8%
• Smaller than year earlier project (assessed). 10%
and for the year earlier project:
• Construction contract period at B. 59 weeks
Indicator 1(56wks – 8% + 10%) – 59wks
Time for Construction = X 100 = –3.9%59wks
Indicator 2Time Predictability 68wks – 60wks– design = X 100 = +13.3%– A to B 60wks
Indicator 3Time Predictability 60wks – 56wks– construction = X 100 = –7.1%– B to C 56wks
Indicator 4Time Predictability (68wks + 52wks) – (60wks + 65wks)– design & construction = X 100 = –4.0%– A to C (60wks + 65wks)

25
Indicator 5Time Predictability 3wks– construction = X 100 = +5.3%– client change orders 56wks– B to C
Indicator 6Time Predictability 1wks– construction = X 100 = +1.8%– pm change orders 56wks– B to C
Indicator 7Time torectify defects = 6 weeks– C to D
COST
Example data for the current project:
• Estimated cost of design at A. £500k
• Tendered cost for design A-B. £340k
• Tendered cost for design B-C. £150k
• Final cost of design at C. £490k
• Estimated cost of construction at A. £3,500k
• Tendered cost for construction at B. £3,400k
• Final cost of construction at C. £3,475k
• Additional cost attributable to client change orders B-C. £60k
• Additional cost attributable to project managers change orders B-C. £15k
• Rate per m2 from tendered cost for construction at B. £930/m2
• Higher quality than year earlier project (assessed). 5%
• More expensive region than year earlier project (assessed). 8%
• Resource costs have increased since year earlier project (published). 3%
• Cost of rectifying all defects between C-D. £150k
• Annual operating cost arranged over years complete after C excluding defect £100krectification cost.
and for the year earlier project:
• Rate per m2 from tendered cost for construction at B. £805/m2

KPI Report
26
Indicator 1(£930 – 5% – 8% – 3%) – £805
Cost of Construction = X 100 = –2.1%£805
Indicator 2Cost Predictability £490k – £500k– design = X 100 = –2.0%– A to C £500k
Indicator 3Cost Predictability £3,475k – £3,400k– construction = X 100 = +2.2%– B to C £3,400k
Indicator 4Cost Predictability (£490k + £3,475k) – (£500k + £3,500k)– design & construction = X 100 = –0.9%– A to C (£500k + £3,500k)
Indicator 5Cost Predictability £60k– construction = X 100 = +1.8%– client change orders £3,400k– B to C
Indicator 6Cost Predictability £15k– construction = X 100 = +0.4%– pm change orders £3,400k– B to C
Indicator 7Cost to £150krectify defects = X 100 = +4.3%– C to D £3,475k
Indicator 8Cost in Use £100k
= X 100 = +2.5%(£3,475k + £490k)

27
QUALITY
Example data for the current project:
Quality issues were raised during and after the construction process as follows:
Stages A to C:
• Defective joinery had to be reworked at a cost of £500 and took two days to complete
• Flooring covered with wrong material had to be replaced at a cost of £3000 and took five days torectify
• Door handles were different from those originally specified, but client accepted these
• Design allowed insufficient ventilation space for boiler and had to be reworked at a cost of £200and took 1⁄2 day
• Four other reworked quality issues due to damage on site caused by scaffolding collapsing at atotal cost of £4000 and took five days to rectify
At stage C:
• Boiler failed to work properly due to a faulty valve. It cost £50 and took 1⁄2 day to repair
At stage D:
• Boiler deemed insufficiently powerful to properly heat the building. It was replaced at a cost of£10,000 and took two days to install replacement
• Leaking roof due to workmanship cost £3,000 and took four days to repair
Indicator 1The score for defects = 6
Indicator 2Quality issues at available for use: 1⁄8 x 100 = 121⁄2%
Indicator 3Quality issues at end of defect rectification period: 2⁄8 x 100 = 25%
The quality register will also produce the following additional data:
Summary
Rejected: 3 (flooring, boiler valve, boiler); cost: £13,050; time: 71⁄2 days
Reworked: 7 (joinery, design, 4 additional issues, roof); cost: £7,700; time: 111⁄2 days
Criteria – Defects Score (1 to 10)
1 Impact, at the time of handover, caused by the condition of the facility 6with respect to defects

KPI Report
28
Compromised: 1 (door handles): cost: £0; time: £0
Source of quality issues
Workmanship: 2 (joinery, roof)
Design/Specification: 4 (wrong flooring, door handles, boiler ventilation, boiler’s power)
Defective Materials: 1 (valve)
Damage on Site: 4 (scaffolding-induced damage)
Other: none
CLIENT SATISFACTION
A client commissions an office block development, and the main concerns are to have low runningcosts and a good working environment which determine the Client Specified Criteria questionnaire.
The client indicates the following scores for the same office development:
Standard Criteria
Criteria – Supplier and Contractor Score (1 to 10)
1 Overall performance 6
2 Ability to keep to the price 6
3 Ability to keep to time 3
4 Build/quality of completed items 8
5 Resolution of defects 4
6 Trust/overall confidence in their ability 6
Criteria – Advisor Score (1 to 10)
1 Overall performance 5
2 Design creativity 4
3 Ability to innovate 5
4 Speed and reliability of service 6
5 Co-ordination between team members 3
6 Overall value for money 7
Criteria – Product Score (1 to 10)
1 Finished product 6

29
Client Specified Criteria
Indicator 1The mean overall score for Satisfaction with the Product = 6
Indicator 2The mean overall score for Satisfaction with the Service derived from the two parties are:
Advisor’s score = (5+4+5+6+3+7)÷6 = 30÷6 = 5.0
Supplier and contractor’s score = (6+6+3+8+4+6)÷6 = 33÷6 = 5.5
Overall score = (5+5.5)÷2 = 5.25
Indicator 3Weighted score =(10x7)+(9x4)+(8x8)+(7x5)+(6x2)+(5x3)+(4x7)+(3x5)+(2x10)+(1x6)= 301
Normalised score =301÷(1+2+3+4+5+6+7+8+9+10) = 301÷55 = 5.47
CHANGES ORDERS
Using the following data for an example design and build project:
Change orders issued by clients representative/advisor: 15on 5 variation instructions changes
Change orders issued by contractors design team project leader: 72on 24 variation instructions changes
Criteria – Client-Specified Weight Score (1 to 10)
1 Low running costs 10 7
2 Bright and spacious working space 9 4
3 Low maintenance costs 8 8
4 Comfortable temperature all year round 7 5
5 Good sound insulation 6 2
6 Built on time 5 3
7 Built within budget 4 7
8 Large meeting rooms 3 5
9 Company-coloured decoration 2 10
10 Defect free at ‘available for use’ stage 1 6

KPI Report
30
Indicator 1Change ordersclient = 15 change orders– B to C
Indicator 2Change ordersproject leader = 72 change orders– B to C
31
APPENDIX 2
Quality Register
A quality register proforma is shown below. It provides additional information on the implications toprogramme and cost, and the cause of the quality issues. This will also provide “trend” informationthat should form the basis of future programmes of Continuous Improvement. It will also be valuableobjective data for monthly project reviews and at the completion of the project.
Additional fields on the quality register (optional) are:
Cost of rectification: an estimate of the cost of rectifying the quality issue. This excludes theimplications of consequential costs.
Time: an estimate of the time to rectify the quality issue and the impact of the quality issue on theoverall programme.
Source/Effectiveness: by identifying the source of the quality issue, who identified it and when it wasrectified, the quality register will be a valuable source of data to begin to understand the causes ofquality issues and start to improve quality of construction projects.
Quality Registery g
Project
Name: Date:Location (Region):
Value: Project's Stage:Sector (eg. Civil Engineering, Commercial): Ref. No.:Class (eg. Road, Office): Funding (eg. PFI):Type (eg. New Build, Refurbishment): Contract (eg. Consortium):
ClientName:Type (eg. Developer, Local Government):
Reported Quality Issues Summary Details Time/Cost Details Source of Quality Issue Effectiveness
Rej
ecte
d
Rew
orke
d
Com
prom
ised
Cos
t: R
ectif
icat
ion
Tim
e: R
ectif
icat
ion
Tim
e: Im
pact
Wor
kman
ship
Des
ign
& S
peci
ficat
ion
Def
ectiv
e M
ater
ial
Dam
age
On
Site
Oth
er
Qua
lity
Issu
e Id
entif
ied
by
Dat
e Is
sue
was
Cle
ared
To
tal Q
ualit
y Is
sues
123456789
10
Total

KPI Report
32
APPENDIX 3
Customer Satisfaction Survey
PROFORMA I
Customer: Type of customer:
Project name and address:
Type of project: Value of project:
Supplier to whom this pro-forma refers:
Individuals to be responsible for these reviews:From client
From supplier
Frequency of reviews
IT IS STRONGLY RECOMMENDED THAT THE GUIDANCE NOTES FOR THE RELEVANT PHASE OF THEPROJECT BE READ BEFORE COMPLETION OF THE NEXT SECTION.
Key aspects which customers view as critical measures of his/her Customer-satisfaction (to be filled in by customer following a dialogue specifiedwith supplier) weighting (1-10)
1
2
3
4
5
6
7
8
9
10
33
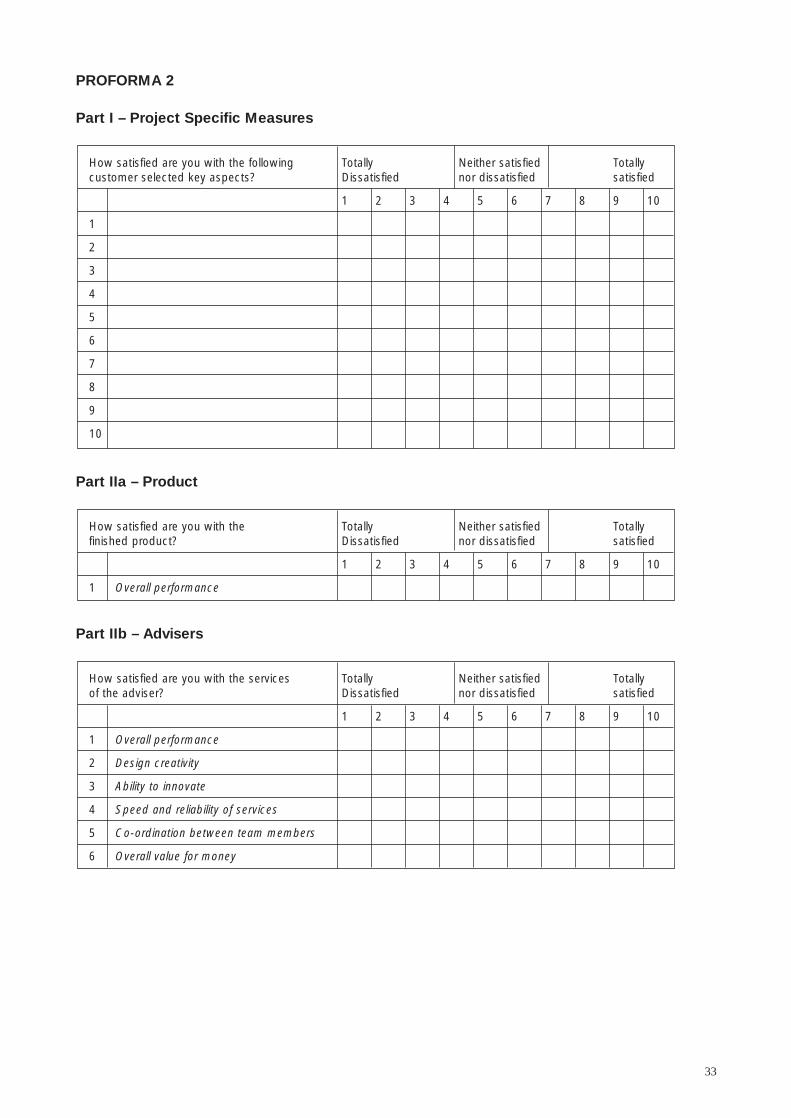
PROFORMA 2
Part I – Project Specific Measures
Part IIa – Product
Part IIb – Advisers
How satisfied are you with the services Totally Neither satisfied Totallyof the adviser? Dissatisfied nor dissatisfied satisfied
1 2 3 4 5 6 7 8 9 10
1 Overall performance
2 Design creativity
3 Ability to innovate
4 Speed and reliability of services
5 Co-ordination between team members
6 Overall value for money
How satisfied are you with the Totally Neither satisfied Totallyfinished product? Dissatisfied nor dissatisfied satisfied
1 2 3 4 5 6 7 8 9 10
1 Overall performance
How satisfied are you with the following Totally Neither satisfied Totallycustomer selected key aspects? Dissatisfied nor dissatisfied satisfied
1 2 3 4 5 6 7 8 9 10
1
2
3
4
5
6
7
8
9
10

KPI Report
34
Part IIc – Suppliers and Contractors
Part IId – Defects
What was the impact, at the time of handover, caused by the condition of the facility with respect to defects?
Totally defective Major defects Some defects Few defects no Apparentlymajor impact some impact significant impact defect freeon client on client on client
1 2 3 4 5 6 7 8 9 10
How satisfied are you with the services Totally Neither satisfied Totallyof the suppliers and contractors? Dissatisfied nor dissatisfied satisfied
1 2 3 4 5 6 7 8 9 10
1 Overall performance
2 Ability to keep to price quoted
3 Ability to keep to time
4 Build/quality of completed items
5 Resolution of any defects
6 Trust/overall confidence in their ability