kpmg global mining institute · kpmg global mining institute democratic republic of congo country...
TRANSCRIPT

KPMG GLOBAL MINING INSTITUTE
Democratic Republic of Congo
Country mining guide
kpmg.com/mining
KPMG INTERNATIONAL
Strategy Series

© 2014 KPMG International Cooperative (“KPMG International”). KPMG International provides no client services and is a Swiss entity with which the independent member firms of the KPMG network are affiliated.

ContentsExecutive summary 2New geographic expansion risk framework 3Country snapshot 4World Bank ranking: Ease of doing business 5Economy and fiscal policy 6Heritage Foundation of Economic Freedom 8Fraser Institute rankings 9Survey of Mining Companies 2012/2013 9Regulatory Environment 10Sustainability and Environment 12Taxation 13Power supply 14Infrastructure development 15Labour and Employment conditions 17Inbound and outbound investment 18Key commodities – Production and reserves 19Investment Environment in the DRC 29Major mining companies in the DRC 30Foreign companies with operations in the DRC 31Further insight from KPMG 32Mining asset life cycle 33KPMG’s mining strategy service offerings 33KPMG’s Global Mining practice 34KPMG’s footprint in Africa 35
© 2014 KPMG International Cooperative (“KPMG International”). KPMG International provides no client services and is a Swiss entity with which the independent member firms of the KPMG network are affiliated.

2 | Democratic Republic of Congo mining guide
Executive summary The Democratic Republic of the Congo’s (DRC) mining sector presents a high-risk high-return opportunity. The country has a unique position with substantial untapped gold, cobalt and high-grade copper reserves, but equally significant are the political and security risks accentuated by a lack of robust infrastructure. The DRC is the largest producer of cobalt globally, accounting for about 55% of the global output in 2012 according to the US Geological Survey (USGS) Mineral Commodity Summaries 2013 report. It was the second largest producer of industrial diamonds in 2012, contributing about 21% of global production behind only Botswana, which accounted for about 31% of global industrial diamond output. Furthermore, the country boasts some of the highest quality copper reserves globally, with some of the mines estimated to contain grades above 3%, significantly higher than the global average of 0.6% - 0.8%. International mining companies attracted by high grade and low cost mines, may be increasingly attracted to the DRC’s copper wealth situated on the Copperbelt in the Southern part of the country. In turn, with operating costs that are lower than traditional gold producing countries like South Africa, DRC’s gold mining sector is also witnessing renewed interest from mining companies. The Kibali gold project being developed by Randgold Resources is estimated to be the largest undeveloped gold mine in Africa with about 13 – 14 million ounces of gold reserves.
However, the mining sector faces significant growth challenges due to political instability, conflict in the east of the country (which is a key mining region), and a severe lack of robust infrastructure and reliable electricity supply. The World Bank’s Doing Business 2014 report ranks DRC at 183rd position out of 189 countries, highlighting the uncertain business environment in the country. Despite these challenges, the DRC’s mining sector is expected to grow substantially on the back of the growing interest from mining companies from China, Australia, Canada, the UK and the US, among others, due to the large untapped mineral reserves and perceived low mining costs. The country received about $8bn in investment during 2009-12 with the majority being invested in the mining sector. Global companies like Freeport McMoran are currently developing and have announced several new projects in the country. The increasing presence of global miners in the country could lead to greater mechanisation of the mining process. This is expected to result in further development of the transport network as well as infrastructure, including electricity and water supply, supporting the overall development of the country.
$3.3 billion In 2012 FDI into DRC (Source: World Investment Report 2013, United Nations, July 2013)
10TH
Highest gold reserves globally
1ST
Largest global cobalt production with approx.. 45% of global cobalt reserves
8TH
Largest copper producer globally in 2012
7TH
Largest tin producer globally in 2012
3RD
Largest tantalum producer globally in 2012.
90% Percentage minerals extracted from Katanga mines exported to China
Source: 1. China has a Congo Copper headache Asia Times, March 11, 20102. Chinas a Congo Copper headache, Asia Times, March 11, 20103. USGS
The Africa Report, Investing DR Congo 2013; USGS Mineral Commodity Summaries 2013; World Bank, Doing Business 2014
25% Global diamond reserves in DRC, and largest in Africa
80% Percentage mineral processing plants in Katanga Province owned by Chinese companies
3% Global copper reserves situated in the DRC
© 2014 KPMG International Cooperative (“KPMG International”). KPMG International provides no client services and is a Swiss entity with which the independent member firms of the KPMG network are affiliated.

Democratic Republic of Congo mining guide | 3
New geographic expansion risk frameworkRisk framework to assess new geographic expansion
KPMG in DRC’s risk framework
The current power supply is inefficient and
unreliable and no longer adequate to meet electricity
demands within the DRC. It is estimated that only 6 percent
of people in the DRC have access to electricity. The government has
however signed a treaty with South Africa to develop a hydro plant in the DRC.
External factors
Political risk
Macro-driv
ersC
omm
ercial
Socia
l
Inve
stor
/ass
et o
wne
r pr
otec
tion
Polit
ical
and
judi
cial
envi
ronm
ent
Risk regarding ethical
compliancePoli
tical
vision
for
the s
ecto
r Exchange control
Local macroeconomic
environment
Infrastructure
Physical security of
people and assetsAbi
lity
to p
artn
er
Environm
ental
Socio-economic
considerations
Development status
Cultural context
Licensing and taxation
Acces
s to r
equir
ed
inputs
(wate
r,
power,
labo
r)
Despite abundant water resources, the DRC has a 26 percent drinking water
access rate which is rather low. The majority of the population is young
with approximately 71 percent of the population living below the
poverty line. The educational system needs to be improved
as only 18 percent of pupils advance to the secondary level
of education.
The East of the DRC which is a key mining area has suffered from years
of armed conflicts and violence. Overall, political risk remains
high.
Due to years of conflict and political instability, some of the established infrastructure
has been destroyed and further infrastructure
delayed. However in September 2007, China
signed a massive deal with the DRC’s state copper company
in which resources will be exchanged for infrastructure.
Source: KPMG International 2012
© 2014 KPMG International Cooperative (“KPMG International”). KPMG International provides no client services and is a Swiss entity with which the independent member firms of the KPMG network are affiliated.

4 | Democratic Republic of Congo mining guide
Country snapshotThe DRC
Geography The Democratic Republic of Congo (DRC), officially ‘République Démocratique du Congo’, is the third-largest country in Africa and the largest among the member nations of the Southern Africa Development Community (SADC). Located in the central part of Africa (0o00 N, 25o00 E) and spread over 2,344,858 square kilometers – slightly less than one-fourth of the size of the US and nearly two-thirds the size of the European Union – it is the 11th largest country in the world. The capital Kinshasa is the largest city in the DRC, and the country shares borders with Angola, Burundi, Central African Republic, Republic of Congo, Rwanda, South Sudan, Tanzania, Uganda and Zambia.
Climate Tropical; hot and humid in equatorial river basin; cooler and drier in southern highlands; cooler and wetter in eastern highlands. North of Equator - wet season (April to October), dry season (December to February); south of Equator - wet season (November to March), dry season (April to October).
Population As of July 2013, the DRC’s population is estimated to be 75.5 million, making it the 20th most-populous country in the world. Its population is relatively young, with a median age of 17.7 years, and its life expectancy at birth is 56.14 years.
Currency The official currency of the DRC is the Congolese Democratic Franc (CDF).
The following was its average exchange rate in October 2013:
• CDF 909.41: US$1
• CDF 1,233.84: EUR1
Source: CIA: The World Factbook; Reuters
© 2014 KPMG International Cooperative (“KPMG International”). KPMG International provides no client services and is a Swiss entity with which the independent member firms of the KPMG network are affiliated.
Democratic Republic of Congo mining guide | 5
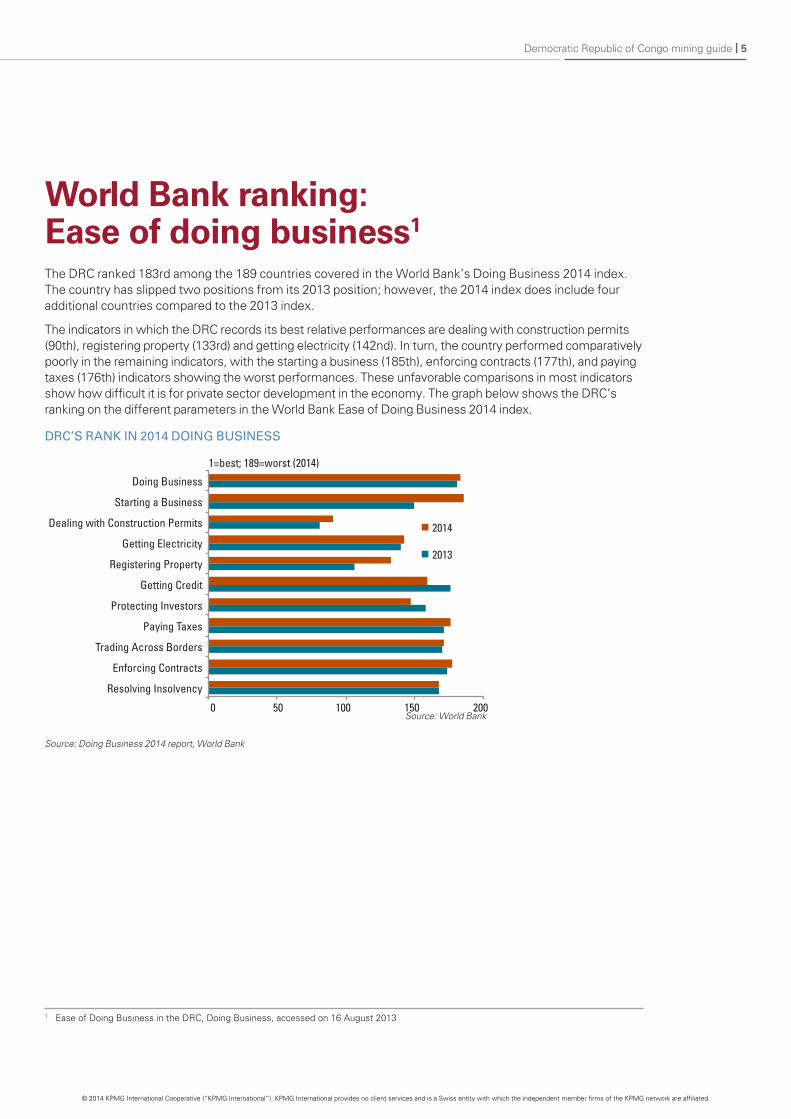
World Bank ranking: Ease of doing business1 The DRC ranked 183rd among the 189 countries covered in the World Bank’s Doing Business 2014 index. The country has slipped two positions from its 2013 position; however, the 2014 index does include four additional countries compared to the 2013 index.
The indicators in which the DRC records its best relative performances are dealing with construction permits (90th), registering property (133rd) and getting electricity (142nd). In turn, the country performed comparatively poorly in the remaining indicators, with the starting a business (185th), enforcing contracts (177th), and paying taxes (176th) indicators showing the worst performances. These unfavorable comparisons in most indicators show how difficult it is for private sector development in the economy. The graph below shows the DRC’s ranking on the different parameters in the World Bank Ease of Doing Business 2014 index.
DRC’S RANK IN 2014 DOING BUSINESS
1 Ease of Doing Business in the DRC, Doing Business, accessed on 16 August 2013
Source: Doing Business 2014 report, World Bank
0 50 100 150 200
Doing Business
Starting a Business
Dealing with Construction Permits
Getting Electricity
Registering Property
Getting Credit
Protecting Investors
Paying Taxes
Trading Across Borders
Enforcing Contracts
Resolving Insolvency
2014
2013
1=best; 189=worst (2014)
Source: World Bank
© 2014 KPMG International Cooperative (“KPMG International”). KPMG International provides no client services and is a Swiss entity with which the independent member firms of the KPMG network are affiliated.

6 | Democratic Republic of Congo mining guide
Type of government and political environment2,3,4,5
The DRC is a presidential republic where the president acts as both head of state and head of the government. The Constitution of DRC was adopted by the transitional legislature on 5 May 2005 and was approved by the electorate in a referendum on 18 December and 19 December 2005. It came into effect with the election of Joseph Kabila as the president on 6 December 2006. Joseph Kabila first took over the position in 2001 after the assassination of his father, but was elected in 2006 and then re-elected for a second term in 2011. The November 2011 elections suffered significant violence including the destruction of ballots in two constituencies resulting in the closure of polling sites. Election results were delayed for three months and then contested leaving many issues unresolved. In 2012, President Kabila chose Matata Ponyo Mapon as the new Prime Minister of the country.
The President is the Head of State, Commander of The Armed Forces and guarantor of the Constitution. The President is elected by a plurality voting system and the term of office is five years; only two terms may be served.
The Legislature consists of a National Assembly – 500 seats with 61 members elected by majority vote in single-member constituencies, 439 members elected by open list proportional-representation in multi-member constituencies; to serve five-year terms and a Senate – 108 seats where members are elected by provincial assemblies to serve five-year terms. The DRC Judiciary consists of a Constitutional Court; Appeals Court or Cour de Cassation; Council of State; High Military Court; plus civil and military courts and tribunals. The judiciary is severely compromised by political interference.
Economy and fiscal policy6,7,8
After a decade of contraction, DRC’s economic growth revived in 2002, registering an average growth of 5.8% through 2012. Prudent macroeconomic policies and structural reforms have led to the DRC receiving debt relief under the Heavily Indebted Poor Countries (HIPC) debt relief initiative in mid-2010. Being the beneficiary of the largest amount distributed to any HIPC eligible country, the DRC’s external debt burden was reduced from about 123.4% of GDP in 2009 to around 35.9% of GDP at the end of 2010.The strong growth that the DRC has shown has been two percentage points higher than the average for sub-Saharan Africa over the last three years. During the period, production in the mining sector increased dramatically as violence and internal conflicts gradually came under control. The country has made commendable progress with regards to economic fundamentals. The economy is driven by the mining sector, which has shown strong growth in recent years, but widespread corruption and inadequate governance prevent resource wealth from benefiting other sectors of the economy. The government has attempted to improve economic policy, and has made some progress, but there seems to be a mismatch between explicit political will and implementation capacity. Improved revenue mobilisation and central bank independence have been accompanied by overambitious revenue projections and questionable inflation figures.
2 CIA: The World Factbook, accessed on November 13, 20133 Country profile: The Democratic Republic of Congo, Action for Southern Africa, July 20104 “Congo President Chooses New PM,” VOA news, accessed 19 August 2013 5 “DRC: Constitution,” EISA, accessed 19 August 20136 “Democratic Republic of Congo Economic Outlook,” African Development Bank Group, accessed 21 August 2013 7 “Democratic Republic of Congo – 2013-17 Country Strategy Paper,” African Development Bank, accessed 21 August 20138 IMF; Democratic Republic of the Congo: Joint Staff Advisory Note
© 2014 KPMG International Cooperative (“KPMG International”). KPMG International provides no client services and is a Swiss entity with which the independent member firms of the KPMG network are affiliated.

Democratic Republic of Congo mining guide | 7
Notwithstanding a dip in 2009 in which real GDP growth only reached 2.8% amid renewed violence in the northern and eastern regions as well as a decline in demand for commodities, economic growth has remained strong and the country has positive growth prospects. The economy has been buoyed by strong trade and investment flows, protecting it from lingering global economic malaise. This has resulted in strong GDP growth, estimated at 7.1% in 2012, but is expected to decrease to 6.2% in 2013. While this still indicates strong economic growth, this figure was revised downwards from 8.1% in the International Monetary Fund’s (IMF) most recent projections made in October. Still, the country is expected to continue to show strong economic growth over the medium term, with the IMF expecting 10.5% GDP growth in 2014.
Despite the positive outlook for many macroeconomic indicators, the country remains one of the least developed in the world. The mining industry will continue to receive interest from investors with an appetite for risk, driven mainly by the abundance of natural resources in the country, while the lack of transparency and governance will ensure that large corporations and the politically connected are the main beneficiaries of its expansion. The nature of the expansion of the mining industry, and thus effectively economic growth, is heavily reliant on foreign direct investment (FDI) as well as external debt, which in itself carries inherent risks. Opaque infrastructure/mining deals, particularly in the Sino-Congolese relationship, only increase uncertainty. However, the condition is expected to improve with the government joining the Organisation for the Harmonisation of Business Law in Africa (OHADA).
Economic growth will be highly contingent on expansion of the mining sector and improvement in infrastructure, particularly that of energy. However, institutional reforms to boost efficiency and consolidate macroeconomic stability would have the most profound impact on future economic growth, and improvements in the domestic environment would greatly decrease the country’s vulnerability to external shocks.
Turning to fiscal policy, in the IMF’s Joint Staff Advisory Note released at the end of July 2013, the Fund raised some concerns regarding the government’s revenue projections. The Government Action Plan (GAP) for 2012-16 focuses on aspects of modernising the state and improving the population’s quality of life, but the IMF cautions that the revenue projections in the GAP will be difficult to achieve in the short to medium term. While the Fund supports the view that significantly more revenue can be collected through the full implementation of value added tax (VAT), the elimination of various tax exemptions, a reduction in the number of taxes, and the improvement of natural resource management, the projected tripling of domestic revenue over the next five years is overly ambitious. More specifically, the Fund highlighted the fact that the implementation of tax reforms has been slow, particularly with regards to the elimination of numerous taxes that enable tax evasion.
© 2014 KPMG International Cooperative (“KPMG International”). KPMG International provides no client services and is a Swiss entity with which the independent member firms of the KPMG network are affiliated.

8 | Democratic Republic of Congo mining guide
Heritage Foundation of Economic Freedom2013 Index of Economic Freedom 9
The Heritage Foundation, in its 2013 Index of Economic Freedom, scores DRC’s economy as 39.6 percent free, which makes it the world’s 171st freest economy. Its overall score is 1.5 points lower than last year, reflecting significant deterioration in control of government spending that is only partially mitigated by an increase in monetary freedom. The DRC is ranked 44th out of 46 countries in the sub-Saharan Africa region, and its score is far below (i.e. weaker than) the regional average. The 2013 Index measures and ranks 177 countries across 10 specific freedoms. A score of 80% to 100% is seen as “free”, while a score of between 0 percent and 49.9 percent is classified as “repressed”.
The Foundation notes that the Congo’s extractive industries and exports have generated high nominal rates of economic growth, but little sustainable or broad-based development. Political risk remains high, severely undermining prospects for diversified growth and trapping a majority of the population in poverty. Informal economic activity is rampant, and businesses have little recourse in law and little protection for their property.
Parameter Score Rank
Property Rates 10.0 percent 165th
Freedom from Corruption 20.0 percent 165th
Fiscal Freedom 71.4 percent 131st
Government Spending 60.1 percent 109th
Business Freedom 38.7 percent 164th
Labor Freedom 36.3 percent 165th
Monetary Freedom 56.5 percent 172nd
Trade Freedom 63.0 percent 148th
Investment Freedom 20.0 percent 154th
Financial Freedom 20.0 percent 159th
9 Index of Economic Freedom 2013, Heritage Foundation
Sources: 2013 Index of Economic Freedom, Heritage Foundation
Source: Heritage Foundation
© 2014 KPMG International Cooperative (“KPMG International”). KPMG International provides no client services and is a Swiss entity with which the independent member firms of the KPMG network are affiliated.

Democratic Republic of Congo mining guide | 9
10 Economic Freedom of the World 2013 Annual Report, Fraser Institute11 “Survey of Mining Companies: 2012/2013”, Fraser Institute, February 2013
Fraser Institute rankingsEconomic Freedom of the World 2013 report 10
Among the 152 countries covered in the Fraser Institute’s Economic Freedom of the World 2013 Report, the DRC ranked 144th, with a score of 5.28 on a scale of 0 to 10, with 0 being the worst and 10 being the best.
The annual peer-reviewed report ranks 152 countries around the world, based on their policies that encourage 42 different economic measures in the following areas:
• Size of government: Expenditures, taxes and enterprises
• Legal structure and security of property rights
• Access to sound money
• Freedom to trade internationally
• Regulation of credit, labour and business
Survey of Mining Companies 2012/201311
The DRC ranked 23rd on Policy/Mineral Potential among the 96 jurisdictions covered by the Fraser Institute‘s Survey of Mining Companies 2012/13. The Policy/Mineral Potential Index is based on respondents’ answers to the question about mineral potential of jurisdictions, assuming their policies are based on “best practices”. Figure 1 provides the country’s scores on key indices of the survey.
Figure 1: The DRC’s scores, Fraser Institute’s Survey Of Mining Companies, 2007–13
Policy Potential Index* (lhs) Current Mineral Potential** (rhs) Policy/Mineral Potential *** (rhs)
Sources: Fraser Institute’s Survey of Mining Companies 2012/2013
Notes:# The rating of 10 is taken as the highest and 1 as the lowest in the Economic Freedom of the World 2012 Report.* The Policy Potential Index is a composite index that measures the effects on exploration of government policies. ** The Current Mineral Potential index is based on respondents’ answers to whether a jurisdiction’s mineral potential under the current policy environment
encourages or discourages exploration. It assumes current regulations and land use restrictions.*** The Policy/Mineral Potential Index is based on respondents’ answers to the question about mineral potential of jurisdictions, assuming their policies are
based on “best practices.” It assumes no land use restrictions and considers the industry “best. practices.”
34,4
24,1
18,9
7,8
19,9
12,3 0,38 0,44
0,30
0,21
0,38
0,23
0,88 0,89 0,86
0,90 0,87
0,70
0
0,1
0,2
0,3
0,4
0,5
0,6
0,7
0,8
0,9
1
0
5
10
15
20
25
30
35
40
2007–08 2008–09 2009–10 2010–12 2011–12 2012-13
Curr
ent
Min
eral
Pot
entia
l and
Pol
icy/
Min
eral
Pote
ntia
l sco
re, o
n a
scal
e of
1
Polic
y Po
tent
ial I
ndex
sco
reon
a s
cale
of 1
00
© 2014 KPMG International Cooperative (“KPMG International”). KPMG International provides no client services and is a Swiss entity with which the independent member firms of the KPMG network are affiliated.

10 | Democratic Republic of Congo mining guide
Regulatory Environment12
The law that governs the mining sector in the DRC is the 2002 Mining Code (Law no. 007/2002). In terms of this law, foreign natural and legal persons may own unrestricted mining rights as long as they elect domicile with a mining and quarrying agent (mandataire en mines etcarrières – a sort of government-registered notary), through whom the foreign investor is obliged to act. Article 104 of the Code stipulates that small-scale miners (where investment is less than $2m and reserves do not exceed 10 years of operation) must operate through a Congolese company in which local investors must own 25 percent or more of share capital. The Mining Code provides a comprehensive set of rules applicable to all aspects of mining, including acquisition, transfer, operation and termination of mining rights, environment protection, cultural heritage, protection of neighbouring communities, and tax and customs incentives. It also covers the quarrying activities on a self-contained basis. The constraints on operating in the mining sector are not regulatory ones, and are often illegal. Some foreign operators are favoured for historical and political reasons, and receive preferential treatment by government at all levels. These companies’ actual or potential competitors, in contrast, often find themselves at a disadvantage in their dealings with government agencies.
The Mining Code is currently being revised by the DRC’s Minister of Mines in order to increase government’s benefit from the expansion of its mining industry. The government plans to raise its free stake in new mining projects from 5 percent to 15 percent considerably lower than the 35 percent figure that has been mentioned in recent months. In addition, proposed changes to the mining code include tripling the royalty on copper and cobalt to 6 percent, and cutting the amount of time that contract stability is guaranteed from 10 years to five years.
The country’s president is entitled to classify, declassify or reclassify mineral substances as mines or as quarry products, or as an area prohibited for mining or quarrying activities. While the Ministry of Mines is responsible for granting, refusing, and cancelling mining rights, the Mining Registry is responsible for administrative proceedings concerning the application for and registration of mining rights, in addition to the withdrawal, cancellation, and expiry of these rights. Congolese legislation allows for expropriation “in the public interest”; the usual reasons given are public works requirements, community heritage and the presence of precious minerals. Fair compensation is supposed to be paid in terms of the law, but in the words of the US State Department: “as with many Congolese laws, these requirements are not always fully respected”. In September 2009, the government shut down a mine operated by Canadian mining house First Quantum over violations of its contract, and the following year the Supreme Court formally withdrew the company’s rights. The Canadian government initially threatened to oppose debt relief for the DRC over the issue, but eventually relented.
The legislation reserves the State as the owner of all the minerals resources and there exists a clear distinction between surface rights and mining rights. The surface right holder has no claim over the mineral resources present in his/her surface right area. Furthermore, there are two types of mining rights awarded to a party – ‘research or exploration’ and ‘exploitation or operation’ rights – for which permits have to be obtained.
12 Getting the deal through’, McGuireWoods, dated June 2013; ‘Current DR Congo Mining Code under Revision’, McGuireWoods website, accessed 21 August 2013
© 2014 KPMG International Cooperative (“KPMG International”). KPMG International provides no client services and is a Swiss entity with which the independent member firms of the KPMG network are affiliated.

Democratic Republic of Congo mining guide | 11
Research permitA research permit provides the exclusive right to its holder, inside its mining perimeter, to conduct exploration activities for the minerals for which the permit is awarded. The maximum mining area that can be granted for a research or exploitation permit is 400 km², while the maximum mining area that can be held by one person and his or her affiliated companies is 20,000 km².
• It can be obtained in a maximum of 47 calendar days from the date of filing the request, while the approval of the environmental mitigation plan can be obtained in a maximum of 24 calendar days from its filing.
• It is granted for four years for precious stones and for five years for other minerals.
• The holder of the research permit must commence the exploration activity within six months from the date of issue of the permit.
• The permit for precious stones can be renewed twice for two years, while that for other minerals can be renewed twice for five years. However, at each renewal, the holder must vacate 50 percent of the mining perimeter for which the permit was initially given.
Exploitation permitAn exploitation permit provides the exclusive right to its holder to conduct exploration, development, construction and mining activities for those minerals for which the permit is given. It also allows its holder to build the installations and infrastructure required for the mining exploitation, use the water and forestry resources inside the mining perimeter, and process, transport and market the minerals extracted from the mining perimeter.
• An exploitation permit can be obtained in a maximum of 252 calendar days, including the time required for the environmental review.
• To obtain an exploitation permit, the party is required to transfer 5 percent carried interest to the government.
• There are three types of exploitation permits:
– Exploitation permit: It is a standard, large-scale operation permit that is granted for 30 years. It can be renewed for 15 years for as long as the deposit can be mined.
– Tailings exploitation permit: It is similar to the exploitation permit and is granted for five years. It can be renewed for five years for as long as the tailings can be mined.
– Small-scale exploitation permit: It is given for investments requiring $100,000 – $2,000,000 for exploitable reserves having a mine life of less than 10 years and the operations of which can be mechanised. It is granted for a maximum of 10 years and cannot be renewed beyond 10 years from its date of issuance, but extension can be obtained.
© 2014 KPMG International Cooperative (“KPMG International”). KPMG International provides no client services and is a Swiss entity with which the independent member firms of the KPMG network are affiliated.

12 | Democratic Republic of Congo mining guide
Sustainability and EnvironmentSocioeconomic situation13,14,15
While the DRC is endowed with valuable mineral and agricultural resource (fertile soils and ample rainfall), the country’s development has been slow on account of years of armed conflicts and violence. In addition, the social infrastructure remains hugely strained even after a decade of peace due to widespread corruption and insecurity caused by ethnic clashes that have fostered an environment conducive to exploitation and rent-seeking. The situation remains precarious in the eastern part of the country where conflicts and human rights abuse remain common. Critical institutional reforms are lagging, and elements of political culture and general capacity issues create a downside risk for the economy, and this is then exploited by risk-taking entities that do not have much to gain from changing the status quo. Furthermore, the persistence of poverty can be explained by the rapid population growth and inefficient use of existing resources. The DRC’s population is growing at around 2.9 percent a year, one of the highest rates worldwide, while investment has been limited to the mining regions and Kinshasa. Despite the immense resource wealth, the majority of the population remains desperately poor, with an estimated GDP per capita of just $241 in 2013 according to the IMF’s most recent (October 2013) estimates.
The DRC is ranked lowest in the 2013 United Nations Human Development Index (HDI) with a development index score of 0.304, which ties the DRC in 186th position with Niger. The HDI is a composite statistic of life expectancy, education, and income indices used to rank countries into four tiers of human development. According to a report by the African Development Bank, the DRC is unlikely to achieve most of the Millennium Development Goals (MDGs). For instance, 71 percent of the population continues to live below the poverty threshold. With regard to basic education, some developments have been made in primary-level enrolment; however, the quality and efficiency of the educational system have remained very low with only 18 percent of pupils advancing to the secondary level of education. In addition, despite some improvement in recent years, infant/child and maternal mortality rates remain among the highest in the world at 148 per 100,000 and 549 per 100,000, respectively. Malaria is also a leading cause of morbidity, while almost 10% of the sexually active population is living with HIV/AIDS. Armed conflicts have led to the internal displacement of about two million people and increased food insecurity, affecting around 75 percent of the population. Despite abundant water resources, the country has a low drinking water access rate of 26 percent as compared to the African average of 60 percent.
In part due to the involvement of multinational operators with existing Corporate Social Responsibility (CSR) programmes, the mining industry’s contribution to communities in which miners operate is growing. The Mining Code makes a miner liable for any damages it causes that may affect the rightful occupants of the land on which it mines. Mining companies are also required to support infrastructure projects, such as roads, schools and hospitals.
13 “Democratic Republic of Congo – 2013-17 Country Strategy Paper,” African Development Bank, accessed 21 August 201314 “World Economic Outlook Database,” International Monetary Fund, accessed 21 August 201315 “Equity in Extractives,” Africa Progress Report 2013
© 2014 KPMG International Cooperative (“KPMG International”). KPMG International provides no client services and is a Swiss entity with which the independent member firms of the KPMG network are affiliated.

Democratic Republic of Congo mining guide | 13
EnvironmentIn the area of environmental regulations applicable to the mining industry, there is the Mining Code and the Mining Regulation which provide mainly for self-contained environmental measures. The main regulatory and control body that regulates these laws is the department in charge of the protection of the mining environment. There is an environmental review and permitting process for mining projects whereby exploitation permits are subject to prior approval of an environmental impact study (EIS) and an environmental management plan (EMP). Exploration operations are subject to the prior approval of a mitigation and rehabilitation plan (MRP) subsequent to the delivery of the research permit. Prospecting and small-scale exploitation permits are only subject to codes of conduct. The closure and remediation process for a mining projects is addressed as part of the EMP whereby the holder of a research or exploitation right must provide for the measures of remediation and environmental rehabilitation after closure, the costs of which need to be entirely backed by a financial guarantee. The type of funding will depend on the operation and duration thereof.
It is difficult to quantify the environmental degradation of the DRC due to mining activities as it is unstable and difficult for researchers to enter and do work in the country. It is also difficult to quantify loss of biodiversity as the animals are mobile and the lack of roads and navigable rivers make transportation into the rural areas difficult for researchers. However certain world heritage sites such as Kahuzi-Biega and the Okapi Wildlife Reserve have been affected by mining activities. However in 2002, the DRC started working toward modernising the legal framework of the forest, environment & tourism sector with the adoption of a new Forest Code mainstreaming sustainable development. Since then, while a large number of illegal forest concessions has been terminated, sustainable forest resource management remains a challenge. This is illustrated by a deforestation rate of 0.2 percent annually in the Congo Basin. The country is also developing a Reduction of Emissions from Deforestation and Forest Degradation (REDD+) national process aimed at establishing a national measurement, reporting and verification system of carbon stocks and flows. The DRC has been selected as one of the eight pilot countries for the Forest Investment Programme (FIP). It also benefits from the Congo Basin Forest Fund (CBFF).
Nationally appropriate mitigation actions (NAMAs) are concrete projects, policies, and/or programmes that shift a technology or sector in a country onto a low-carbon development trajectory. The DRC have communicated amongst others the following NAMAs:
• The promotion of the use of improved stoves;
• The development of REDD;
• The development of forestry in degraded forest areas and conducting forestry activities in dense forests;
Two CDM projects currently registered with the UNFCCC for the DRC are the combustion of gas from a landfill in Kinshasa (125 tCO2eq./an) and the Ibi Bateke degraded savannah afforestation project for fuelwood production (55 tCO2eq./an).
© 2014 KPMG International Cooperative (“KPMG International”). KPMG International provides no client services and is a Swiss entity with which the independent member firms of the KPMG network are affiliated.

14 | Democratic Republic of Congo mining guide
Taxation16,17,18
In the DRC, the highest marginal corporate income tax for corporations and individual is 35 percent and 30 percent, respectively. On 1 January 2012, the government introduced value-added tax (VAT) of 16 percent, while a rate of 0 percent is applied on exports. The VAT replaced the sales tax on the supply of taxable goods and services manufactured or provided in the DRC by a taxable person in the course or furtherance of a business carried on by that person, and on the import of goods and services into the DRC.
Mining companies are subject only to the taxes and custom duties enlisted in the Mining Code of 2002. In a bid to encourage miners to process and refine copper concentrates domestically, the mines minister signed a directive in early April 2013 that bans copper and cobalt concentrates exports. The ban was scheduled to come into effect in July 2013, however, the ban was pushed out to 1 January 2014. Towards the end of 2013, the ban was once again delayed to 31 December 2014. According to the mines minister Martin Kabwelulu “The export of copper and cobalt concentrates is banned, however, a moratorium until 31 December 2014 is granted to all mining operators producing copper and cobalt to comply.”
The reason for the delay pertains to the ongoing electricity constraints in the DRC. And it is the view of some skeptics that the country does not have adequate electricity supply to operate the refining and processing equipment that the ban’s implementation calls for.
As the start of the July 2013 deadline loomed, the DRC instead decided to raise the tax on current exports from $60/tonne to $100/tonne to encourage companies to already start to process and refine copper concentrates domestically. But with the second delay, no tax increase has been announced at this stage.
Nevertheless, the mines minister has already stated that companies would be able to get around the ban, provided they make extra payments to the state.
Profit-based tax: Mining companies are subjected to a professional tax of 30 percent instead of 35 percent, which is levied on the net profits of the company. Also, there are a number of specific rules for depreciation and deductible costs, set by the Mining Code.
Tax on the surface area of mining: A research permit holder is required to pay tax on the surface area of mining at the rates of $0.02 per hectare for the first year, $0.03 for the second year, $0.035 for the third year and $0.04 for each subsequent year, while an exploitation permit holder is taxed at the rates of $0.04 per hectare for the first year, $0.06 for the second year, $0.07 for the third year and $0.08 for subsequent years.
Annual area fee per square: Mining companies are subjected to an annual fee on the number of squares held, with one square being equal to 84.955 hectares. While a research permit holder is required to pay the annual fee of $2.55 per square for each of the first two years, $26.34 for each subsequent year, $43.33 for each year of the first renewal period and $124.03 for each year of the second renewal period, an exploitation permit holder is required to pay $424.78 for an ordinary exploitation permit, $679.64 for a tailings exploitation permit and $195.40 for a small-scale exploitation permit.
Royalty: Mining companies are required to pay a mining royalty from the date of commencement of effective exploitation, which is equivalent to the value of sales made, less transport costs, costs of assay, as well as insurance and marketing costs. The rate of the mining royalty is 0.5 percent for iron or ferrous metals, 2 percent for non-ferrous metals, 2.5 percent for precious metals, 4 percent for precious stones, 1 percent for industrial minerals, solid hydrocarbons and other not-cited substances, and no royalty is to be paid for standard construction material.
Source: http://www.formationmetals.com/s/CobaltNews.asp?ReportID=618724//www.miningnewsmagazine.org/?p=646
16 The Foreign Investment Operations in the Democratic Republic of Congo, HG Global Legal Resources, 7 December 201117 Investing in the Democratic Republic of Congo: Tax Highlights, HG Global Legal Resources, 8 March 201218 Mining in The Democratic Republic Of Congo, Rocky Mountain Mineral Law Foundation, June 2011
© 2014 KPMG International Cooperative (“KPMG International”). KPMG International provides no client services and is a Swiss entity with which the independent member firms of the KPMG network are affiliated.

Democratic Republic of Congo mining guide | 15
19 The Democratic Republic of Congo’s Infrastructure: A Continental Perspective, The World Bank, March 2011; AFDB sets out DR Congo strategy, African Energy website, dated 25 July 2013
20 DR of Congo: Country Brief, The World Bank, accessed on July 3, 2012; Congo Confident US$12 Billion Power Plant Will Proceed by 2015, Bloomberg, dated 28 May 2013
There are several preferential tax rates for mining companies under the Mining Code.
• The mining permit holder is fully exempted (0% instead of duties of 1 percent – 10 percent) from all customs duties and other taxes, regardless of their nature, for exports in relation to the mining project.
• Prior to the effective commencement of exploitation work, all goods and products imported strictly for mining purposes are subjected to import duties at the preferential rate of 2 percent.
• The mining companies are subjected to a preferential rate of 3 percent for the purchase of locally manufactured products for mining activities.
• A preferential Mining Code rate of 5 percent is applicable to services received by the mining companies that are directly related to their corporate purpose.
The Congolese prime minister recently stated that, within the next three years, the government plans to tax mining companies in local currency in an attempt to decrease dollarisation in the economy. Hyper-inflation in the 1990s, when consumer prices rose by almost 10,000 percent, prompted the government to collect taxes in dollars. The prime minister continued to state that the Congolese franc has remained relatively stable against the dollar in recent years, and concluded that “we [the government] don’t have any justification for people to pay taxes in US dollars.”
Power supply19,20
For the DRC, one of the immediate challenges on the infrastructure front is to increase the supply of power in a cost-efficient manner. The country has huge hydropower potential, estimated at over 100,000 megawatts (MW), of which about 44% (44,000 MW) is concentrated at the site of Inga, located at 150 km from the mouth of the Congo River. However, only a fraction of the total potential, estimated at 2,540 MW, has been developed, mainly consisting of hydro-based stations and thermal power plants. This represents only 2.2 percent of the country’s hydropower capacity, with a majority of thermal power stations currently not functioning due to lack of spare parts and recurrent shortages of gas oil. Société Nationale d’Electricité (SNEL), the public utility, owns an estimated 39 power stations, comprising 24 thermal-powered stations (with a negligible electricity output) and 15 hydro-powered stations, with the latter accounting for 98.5 percent of the total installed capacity. Guaranteed electricity capacity currently stands at approximately 1,245 MW (interconnected). The Inga 1 and Inga 2 hydropower stations account for approximately 78.5 percent of the current installed capacity (interconnected), with the remaining electricity production supplied by thermal plants scattered across the country.
Another serious current constraint in the power sector is the inefficiency and unreliability of the power delivery network. The transmission and distribution systems have also suffered due to limited funding. As a result, they are no longer adequate to meet the current electricity requirements in the country. This is compounded by an overload of transmission installations, which has resulted in recurring drops in voltage and failures of transformers. The DRC is currently operating with a national energy deficit, which needs to be urgently addressed to provide one of the key inputs for economic growth in the mining sector (particularly in the Katanga Province) and other sectors of the economy. Many mining companies in the country have set up, and operate, their own local hydroelectric schemes, costing about 10 US cents per kWh. In comparison, the long-run marginal cost of grid supply is estimated at about four US cents per kWh. The DRC’s national power utility SNEL has been ridden with huge inefficiencies in the form of high distribution losses and non-payment of dues.
© 2014 KPMG International Cooperative (“KPMG International”). KPMG International provides no client services and is a Swiss entity with which the independent member firms of the KPMG network are affiliated.

16 | Democratic Republic of Congo mining guide
The DRC will require investments to the tune of $750m a year over the next decade for setting up new generation and transmission capacity to realise its potential as a power exporter. In October, the South African energy minister and his Congolese counterpart signed a treaty to develop the Grand Inga Hydro Plant in the DRC. The South African government agreed to buy over half of the power generated by the first phase of the Grand Inga project, amounting to around 2,500 MW. Construction of the 4,800 MW first phase is set to begin in October 2015, and could take five to six years before completion. The $100bn Grand Inga project will be built in six phases before reaching full capacity, which could reach 44,000 MW. Sizeable investments are required to make use of the country’s hydropower potential, which, if fully exploited, will enable it to not just meet its own energy demands but also turn the DRC into the continent’s largest exporter of power. Furthermore, hydroelectricity generation is expected to be hugely cost efficient, with the long-run marginal cost estimated at 1.4 US cents per kWh.
The DRC has initiated a new bill to govern the electricity sector which was passed into Act by Parliament in May 2013 and is currently under review by the Senate for its adoption. This bill ushers in numerous innovations that will result in changing various aspects of the DRC’s electrical energy law. These include liberalising the electrical energy sector and opening the electricity market to operators, establishing a regulation mechanism for settlement of disputes amongst operators as well as between operators and customers, creating servitudes inherent to power public utility activities, and establishing tax, customs, and financial regimes under common law or contracts. However, it is only compliance with and efficient implementation of the provisions of the Bill by the government, operators, and consumers that will determine the success in achieving the set energy objectives.
Infrastructure development21,22
The DRC faces significant infrastructure challenges. Conflict and instability have had a major impact on infrastructure development, with decades of war not only destroying some if the established infrastructure, but due to the complete inattention to the issue, the current government is practically starting from scratch. The most serious impact of insecurity on infrastructure development has been felt in the east, where there has been little or no infrastructure development except in close proximity to the Rwandan and Ugandan borders, in areas where most trade is international. In Katanga, specifically around Lubumbashi, there has been some progress in the area of infrastructure development, and the same is true along the lower reaches of the Congo River on the border with the Congo Republic. In addition to security concerns, in much of the country geography and weather makes infrastructure development a real challenge. The freight tariffs in the DRC are high both on the road and the rail network, even in comparison to other countries in the region.
In a country of 75.5 million people, only 6% have access to electricity. The national power utility, SNEL, serves just over 400,000 customers, and almost half of the nation’s available electricity is consumed by just 20 large clients. The Congolese government has set a highly aggressive target to provide 60% of the population with access to electricity by 2025. But given projected population growth, this would require an estimated 400,000 new connections every year. Inadequate electricity supply is a significant constraint on the development of the mining sector, with many large mines investing in mining-specific energy generation.
21 International Human Development Indicators, United Nations, accessed 22 Aug 201322 “Democratic Republic of Congo Country Report, African Development Bank website, accessed 22 Aug 2013
© 2014 KPMG International Cooperative (“KPMG International”). KPMG International provides no client services and is a Swiss entity with which the independent member firms of the KPMG network are affiliated.

Democratic Republic of Congo mining guide | 17
In September 2007, a massive deal was signed between two Chinese state construction companies and the DRC’s state copper company in which resources would be exchanged for infrastructure. The deal was worth more than the DRC’s state budget, and was the largest of its kind at the time. The Chinese partners are set to provide $9bn in financing, while a 19 percent “internal rate of return” has been pledged. However, little information is publicly available about financial aspects of the deal, including the sales price of minerals, as well as the planned cost of the infrastructure projects. The Chinese involvement in the DRC is expected to be a significant source of FDI in the medium to long term. Not only is China set to invest heavily in the mining industry, but public-private projects are being implemented as part of a joint agreement. Chinese assistance is expected in the form of both grants and interest-free loans in exchange for mineral resources. This distorts the line between FDI and transfers, as infrastructure is being built in exchange for mining proceeds. Beijing will build or rehabilitate some 3,500 km of roads and 3,200 km of railroads, 32 hospitals, 145 health centres and two universities in the country. Gecamines, the state-owned mining company, will then in turn cede a potential 10.6 million tonnes of copper and 626,619 tonnes of cobalt in the Dima mining complex to the joint venture, Sicomine. More recently, the joint venture has been rephrased and the expected disbursement of the related public infrastructure loans has also been reprofiled. The period over which the loans will be disbursed has been extended, with the last disbursement now expected in 2019 instead of 2014, while the amount of each disbursement is also smaller than initially projected.
In May this year, the World Bank pledged $1bn in funding for the African Great Lakes region to support infrastructure development and increase regional trade. The funding includes $150m toward rehabilitating the Ruzizi I and II hydropower plants, as well as helping to finance Ruzizi III to supply electricity to Rwanda, Burundi and the DRC. Furthermore, the DRC will receive $165m to build roads in the North and South Kivu and Orientale provinces, while $180m will be directed towards infrastructure improvement and border management along the Rwanda-DRC border.
© 2014 KPMG International Cooperative (“KPMG International”). KPMG International provides no client services and is a Swiss entity with which the independent member firms of the KPMG network are affiliated.

18 | Democratic Republic of Congo mining guide
Labour and Employment conditions23,24,25,26
Employment In the DRC, due to lack of a real policy for youth employment, there is serious imbalance in the employment situation. The country has a high unemployment rate of 73%, and around 80% of the population operates in the informal sector. The country faces a major employment crisis particularly for its youth, with about 70% of the young population being unemployed. Furthermore, among the 9,000 students graduating from the Congolese universities each year, only 100 are able to find work. In the second Poverty Reduction Strategy Document (DSCRP 2), over 2012–16, the country targets the creation of 900,000 jobs annually for the young; however, considering the present youth employment scenario, such a high target appears difficult to achieve.
In 2010 an extensive study by US NGO Pact estimated that up to a million people could be active in artisanal mining in the entire DRC, but acknowledged that any estimates would necessarily be very rough. Owing to the country’s massive infrastructure deficit, industrial mining is only possible in a small number of places. In fact, it has arguably become viable in Katanga only because miners in that region have easy access to Zambia’s more developed transport networks. The lack of effective policy to address the inadequate infrastructure, combined with political instability in parts of the country, should mean that the situation will persist for some years. The government recognises the importance of artisanal mining in allowing the development of the sector, especially in areas where prospecting is still necessary or where local conditions make industrial operations impossible, and as such, issues artisanal licences to promote this sector and defines certain areas as “artisanal operating zones”.
Labour The DRC created the 1967 Labour Code with the intention of providing guidelines for labour practices such as the employment of women and children, anti-discrimination laws and restrictions on working conditions. With the collapse of the economy and corruption in the government, the enforcement of the code has been negatively affected. The working conditions of mining workers in the country are poor. The miners are exposed to landslide hazards, especially during monsoons, and to heavy metals through dust inhalation and water contamination. Child labour is prevalent in the informal sector and in subsistence agriculture.
Artisanal mining presents some risks, notably in the areas of health and safety and of child labour. Artisanal miners are routinely victims of digging collapses, and generally work in very strenuous conditions. Artisanal gold miners still work with mercury, although this is illegal. According to a 2013 report by charity organisation World Vision, children as young as eight years old are forced to work in artisanal mines. According to this report, as many as 40% of workers in artisanal mining in the DRC are children. Although Congolese law forbids child labour, the government is party to international treaties on child labour and many NGOs are actively trying to root it out, the practice remains widespread owing to spotty enforcement and corruption.
23 “Congo, Democratic Republic 2012”, African Economic Outlook, accessed 21 August 201324 “Social impacts of artisanal cobalt mining in Katanga, Democratic Republic of Congo”, Oeko-Institut, accessed 21 August 201325 “Legal system protects multinationals”, Swiss info, accessed 21 August 201326 “Democratic Republic of the Congo - Working conditions”, Encyclopedia of the Nations, accessed 21 August 2013
© 2014 KPMG International Cooperative (“KPMG International”). KPMG International provides no client services and is a Swiss entity with which the independent member firms of the KPMG network are affiliated.

Democratic Republic of Congo mining guide | 19
Inbound and outbound investmentThe civil war between 1994 and 2002 resulted in the hampering of economic growth and discouraged foreign investment. Economic mismanagement over the period resulted in disruptive fiscal and monetary cycles, loss of hard currency through falling export revenues, financial meltdown and hyperinflation. This cycle, in turn, led to a virtual halt in private and public investment. However, the country tackled this by adopting the Mining Code in 2002 (with the help of World Bank, to promote private investment in the country’s mining sector), which resulted in the resumption of investment flow. Despite relatively lacklustre global economic sentiment in recent years, the DRC has continued to maintain investor interest, particularly in the mining sector. As a developing country with one of the largest endowments of natural resources, investment has been crucial to the DRC’s economic progress. Inadequate domestic funding necessitates foreign investment in order to exploit mineral wealth. Most investments have a medium- to long-term time horizon as the mining industry is the primary FDI destination.
With regard to investment projects, Ivanplats’s discovery of Africa’s largest high-grade copper deposit and the world’s largest undeveloped high-grade copper deposit in the DRC has immense potential to increase FDI. According to Ivanplats, the current base-case involves a five million tonne a year mine plan. However, the company stated that mining rates of up to 20 million tonnes a year were believed to be possible. This has great potential to attract FDI over the medium to long term, with benefits potentially spreading to the rest of the economy. Furthermore, the planned upgrades by Ivanplats of the Mwadingusha and Koni hydroelectric plants would provide required infrastructure and supply clean energy to the power grid. In addition, about 60% of the bulk earthworks at copper producer Tiger Resources’ Kipoi Stage-two solvent extraction and electro-winning plant development project have been completed. Construction on the $30m facility started on 16 January 2013, and was on schedule for first production of copper cathode in mid-2014. South African cement firm PPC Ltd also plans to enter the DRC with a $200m cement factory. The one million tonne cement factory should begin cement production by the fourth quarter of 2015.
The accompanying graph illustrates historical foreign investment flows into the DRC, as well as outward investment flows stemming from the country.
Figure 2: Trend for inward and outward direct investment in the DRC, 2003–12
Source: World Investment Report 2013, United Nations, July 2013
391 409
-
256
1 808 1 727
664
2 939
1 687
3 312
23 8
13
18 14 54 35 7 91
421
-
500
1 000
1 500
2 000
2 500
3 000
3 500
2003 2004 2005 2006 2007 2008 2009 2010 2011 2012
Inward foreign direct investment Outward foreign direct investment
Inve
stm
ent �
ow ($
m)
© 2014 KPMG International Cooperative (“KPMG International”). KPMG International provides no client services and is a Swiss entity with which the independent member firms of the KPMG network are affiliated.

20 | Democratic Republic of Congo mining guide
The mining sector is expected to remain the main FDI draw card over the short to medium term. Indeed, expansion of the copper-cobalt Tenke Fungurume mine was one of the most significant investments into Africa in 2012, and is currently the largest private foreign investment in the DRC. In turn, profit repatriation by mining companies could also explain the spike in outward FDI in 2012. Mining exploration subsidiaries in the DRC are funded by parent companies that recoup investments in the production stage, which are counted as FDI outflows according to UN statistics. In addition, cross-border investments by DRC-based mining companies would also have contributed to the increase in FDI outflows in 2012. In recent years, China has emerged as one of the main investors in the DRC. About 80% of the mineral-processing plants in the Katanga province are owned by Chinese companies and nearly 90% of the minerals extracted from these mines are exported to China. Investment into the sector will be dependent on commodity prices, as these have an impact on expected future returns.27,28
Key commodities – Production and reserves The most important minerals for the DRC are cobalt, copper, and diamonds. The country also produces some gold, tin, iron, nickel, and tantalum, amongst others. According to the USGS, in 2010, the country’s share of the world’s cobalt production amounted to 51%; industrial diamonds, 25%; tantalum, 14%; gem-quality diamonds, 5%; and copper and tin 3% each. The DRC has some of the largest deposits of non-ferrous metals in the world. It has about 3% of the global copper reserves and 45% of global cobalt reserves, about 25% of the global diamond reserves, and reserves of some precious metals such as gold and tantalum. In relative terms, the DRC is the largest cobalt producer globally, it boasts the 10th highest gold reserves globally, and the country has the largest diamond reserves in Africa. The country’s vast mineral resources will attract significant international interest. The value of the DRC’s mining sector is expected to increase to $2.6bn in 2017, mostly driven by copper and gold production.29,30,31
Figure 3: The DRC’s mineral reserves, 2012
Source: US Geological Survey, Mineral Commodity Summaries 2013
3 400 000
20 000 150
7 500 000
680 000 600
45,3%
2,9% 25,0%
0%
5%
10%
15%
20%
25%
30%
35%
40%
45%
50%
0
1 000 000
2 000 000
3 000 000
4 000 000
5 000 000
6 000 000
7 000 000
8 000 000
Cobalt (metric tonnes)
Copper (thousand metric tonnes)
Diamond (million carats)
Shar
e of
DRC
in g
loba
l res
erve
leve
l
Rese
rve
leve
l, DR
C an
dGl
obal
, at t
he e
nd o
f 201
2
DRC World DRC's % share of global reserve
27 China has a Congo copper headache, Asia Times, March 11, 201028 The US Geological Society: The Democratic Republic of the Congo29 Democratic Republic of Congo (DRC), Revenue Watch, accessed 16 August 201330 “Research and Markets: Mining Industry in Democratic Republic of Congo - The Sector is Forecast to Expand by Almost 70% in Value Terms between
2011 and 2015”, Business Wire,9 February 201231 “Democratic Republic of Congo Mining Report: Q3 2013”, Business Monitor International, May 2013
© 2014 KPMG International Cooperative (“KPMG International”). KPMG International provides no client services and is a Swiss entity with which the independent member firms of the KPMG network are affiliated.

Democratic Republic of Congo mining guide | 21
CobaltFigure 4: Production level of cobalt in the DRC
TOP COBALT PRODUCING COUNTRIES, 2012E
Sources: US Geological Survey, Mineral Commodity Summaries 2013; US Geological Survey Mineral Information–Congo (Kinshasa)
Recent estimates by the USGS suggest that the DRC produced 55% of the world’s cobalt in 2012, and boasts around 3.4 million tonnes in reserves. Tenke, the DRC’s largest miner of cobalt in 2012, produced 11,669 metric tonnes of cobalt according to Lundin Mining Corp., who owns 24% of Tenke. Cobalt is the DRC’s second-biggest earning export product, after being overtaken by copper in 2011. Cobalt is used in the preparation of magnetic, wear/corrosion resistant and high strength alloys. Meanwhile, cobalt silicate and cobalt blue are also used to give a distinctive deep blue colour to glass, ceramics, inks, paints and varnishes.
Figure 5: DRC and world cobalt production levels, 2001–12
COBALT PRODUCTION LEVELS, 2001–12E
Sources: US Geological Survey, Mineral Commodity Summaries 2013; US Geological Survey Mineral Information–Congo (Kinshasa) Cobalt Statistics and Information, US Geological Survey Mineral
60 000
7 000 6 700 6 200 4 500 3 700 3 700 3 500 3 000 1 800
9 000
55,00%
6,42% 6,14% 5,68% 4,12% 3,39% 3,39% 3,21% 2,75% 1,65% 8,25%
0,0%
10,0%
20,0%
30,0%
40,0%
50,0%
60,0%
0
10 000
20 000
30 000
40 000
50 000
60 000
70 000
DRC
China
Canada
Russia
Australia
Brazil Cuba
New Caledonia
Zambia
Morocco
Other countrie
s
% s
hare
of g
loba
l pro
duct
ion
Prod
uctio
n (T
onne
s)
Production % share of global production
2001 2002 2003 2004 2005 2006 2007 2008 2009 2010 2011 2012E DRC 15 000 14 500 14 800 20 200 24 500 27 100 25 400 32 300 35 500 47 400 60 000 60 000 World 47 900 50 700 52 900 58 600 63 400 70 000 71 700 76 400 72 100 89 500 109 000 110 000
-
20 000
40 000
60 000
80 000
100 000
120 000
Prod
uctio
n (T
onne
s)
© 2014 KPMG International Cooperative (“KPMG International”). KPMG International provides no client services and is a Swiss entity with which the independent member firms of the KPMG network are affiliated.

22 | Democratic Republic of Congo mining guide
CopperFigure 6: Production level of copper in the DRC
TOP COPPER PRODUCING COUNTRIES, 2012E
Sources: US Geological Survey, Mineral Commodity Summaries 2013; US Geological Survey Mineral Information–Congo (Kinshasa)
In 2011, mine production of copper in the DRC increased by an estimated 28%, reaching 520,000 tonnes according to the USGS. This is equivalent to around 3.2% of global copper output. Copper production has increased significantly in recent years due to large projects by international mining companies coming on stream. The USGS estimates around 20 million tonnes of copper reserves in the DRC, some 2.8% of global known reserves. Copper is the DRC’s largest export earning product, accounting for over 30% of export receipts. According to the chief executive of state-owned miner Gecamines, copper miners in the DRC are forecast to produce 1.5 million tonnes of copper by 2015, up from about 600,000 tonnes in 2012. Prospects for the copper and cobalt industry in the DRC seem exceptionally bright, given that both metals are predominantly mined in the relatively conflict-free Katanga Province. However, the copper output target can only be reached if more investments are made in energy and transport infrastructure. This will require significant private sector involvement, and the recent uncertainty raised by the government regarding mining and export policy could harm the investment climate.
Figure 7: DRC copper production levels, 2001–12
COPPER PRODUCTION LEVELS, 2001–12E
Sources: US Geological Survey, Mineral Commodity Summaries 2013; US Geological Survey Mineral Information–Congo (Kinshasa) Copper Statistics and Information, US Geological Survey Mineral
5 370
1 500 1 240 1 150 970
720 675 580 530 500 430 430 420
2 100
32,32%
9,03% 7,46% 6,92% 5,84%
4,33% 4,06% 3,49% 3,19% 3,01% 2,59% 2,59% 2,53%
12,64%
0,0%
5,0%
10,0%
15,0%
20,0%
25,0%
30,0%
35,0%
0
1 000
2 000
3 000
4 000
5 000
6 000
Chile
China Peru
United States
Australia
Russia
Zambia DRC
Canada
Mexico
Indonesia
Poland
Kazakh
stan
Other countrie
s
% s
hare
of g
loba
l pro
duct
ion
Prod
uctio
n (T
hous
and
tonn
es) Production % share of global production
2001 2002 2003 2004 2005 2006 2007 2008 2009 2010 2011 2012E DRC 38 34 60 73 94 144 148 234 310 343 520 580
0
100
200
300
400
500
600
700
Prod
uctio
n (T
hous
and
tonn
es)
© 2014 KPMG International Cooperative (“KPMG International”). KPMG International provides no client services and is a Swiss entity with which the independent member firms of the KPMG network are affiliated.

Democratic Republic of Congo mining guide | 23
TINFigure 8: Production level of tin in the DRC
TOP TIN-PRODUCING COUNTRIES, 2012E
Sources: US Geological Survey, Mineral Commodity Summaries 2013; US Geological Survey Mineral Information–Congo (Kinshasa)
In a positive development, AIM Solder announced that the first lot of tin produced through the Conflict-Free Tin Initiative (CFTI) arrived at their Montreal plant in mid-August. The tin was extracted at the Kalimbi mine in South Kivu in the DRC in 2012. The mine was validated as conflict-free by a multi-stakeholder team, including officials from the Congolese government, the United Nations, the German Geological Service, and the non-governmental organisation Pact, and is continually monitored and evaluated by the International Tin Research Institute (ITRI) Tin Supply Chain Initiative (iTSCi) programme. In addition, Dow Jones reported that Congolese miners finalised plans to resume tin exports at the end of August from North Kivu, an area that has been under de facto embargo since 1 April 2011, and affected by the mining suspension by the DRC government for six months prior to that. Government officials are in the process of validating more than a dozen mining sites in the region, which should allow the resumption of mining activities and shipments “very soon”. However, international mineral buyers require a range of assurances and have to ensure due diligence has been carried out in order to resume purchases, and it is not certain that validation of the mines will be sufficient. Until the embargo, North Kivu accounted for at least 80% of the DRC’s total tin output. Tin is widely used as a solder or to coat other metals to prevent corrosion.
100 000
41 000
29 000 20 000
11 500 6 000 5 700 5 400 3 600 3 300 300 160 2 000
43,87%
17,99% 12,72%
8,77% 5,04% 2,63% 2,50% 2,37% 1,58% 1,45% 0,13% 0,07% 0,88% 0,0%
5,0% 10,0% 15,0% 20,0% 25,0% 30,0% 35,0% 40,0% 45,0% 50,0%
0
20 000
40 000
60 000
80 000
100 000
120 000
China
Indonesia
Peru
Bolivia
Brazil
Australia
DRC
Vietnam
Rwanda
Malaysia
Thailand
Russia
Other countrie
s
% s
hare
of g
loba
l pro
duct
ion
Prod
uctio
n (T
onne
s)
Production (lhs) % share of global production (rhs)
© 2014 KPMG International Cooperative (“KPMG International”). KPMG International provides no client services and is a Swiss entity with which the independent member firms of the KPMG network are affiliated.

24 | Democratic Republic of Congo mining guide
Figure 9: DRC tin production level, 2001–12
TIN PRODUCTION LEVELS, 2001–12E
Sources: US Geological Survey, Mineral Commodity Summaries 2013; US Geological Survey Mineral Information–Congo (Kinshasa); Tin Statistics and Information, US Geological Survey Mineral
TantalumThe major use for tantalum, as the metal powder, is in the production of electronic components, mainly capacitors and some high-power resistors. Tantalum is also used to produce a variety of alloys that have high melting points, are strong and have good ductility.
Figure 10: Production level of tantalum in the DRC
TOP TANTALUM PRODUCING COUNTRIES, 2012E
Sources: US Geological Survey, Mineral Commodity Summaries 2013; US Geological Survey Mineral Information–Congo (Kinshasa); Niobium Columbium) and Tantalum Statistics and Information, US Geological Survey Mineral
Note: Tantalum production in Uganda is less than half a metric tonne.
2001 2002 2003 2004 2005 2006 2007 2008 2009 2010 2011 2012E DRC 50 300 800 4 900 4 400 3 800 8 900 12 300 10 000 6 700 2 900 5 700
0
2 000
4 000
6 000
8 000
10 000
12 000
14 000
Pro
duct
ion
(Ton
nes)
260
180
95 90 76
50
13
34,03%
23,56%
12,43% 11,78% 9,95%
6,54% 1,70% 0,0%
5,0%
10,0%
15,0%
20,0%
25,0%
30,0%
35,0%
40,0%
0
50
100
150
200
250
300
Mozambique Brazil DRC Rwanda Ethiopia Nigeria Burundi
% s
hare
of g
loba
l pro
duct
ion
Prod
uctio
n (T
onne
s)
Production % share of global production
© 2014 KPMG International Cooperative (“KPMG International”). KPMG International provides no client services and is a Swiss entity with which the independent member firms of the KPMG network are affiliated.

Democratic Republic of Congo mining guide | 25
Figure 11: DRC and world tantalum production levels, 2001–12
TANTALUM PRODUCTION LEVELS, 2001–12E
Sources: US Geological Survey, Mineral Commodity Summaries 2013; US Geological Survey Mineral Information–Congo (Kinshasa); Niobium Columbium) and Tantalum Statistics and Information, US Geological Survey Mineral
DiamondsFigure 12: Production level of industrial diamonds in the DRC
TOP DIAMOND PRODUCING COUNTRIES, 2012E
Sources: US Geological Survey, Mineral Commodity Summaries 2013;
US Geological Survey Mineral Information–Congo (Kinshasa)
2001 2002 2003 2004 2005 2006 2007 2008 2009 2010 2011 2012E DRC 60 30 30 20 33 14 71 140 130 140 95 95 World 1 170 1 460 1 390 1 430 1 380 859 995 1 270 764 682 767 765
0
200
400
600
800
1 000
1 200
1 400
1 600
Prod
uctio
n (T
onne
s)
24
16 15
8
4
1
10
30,77%
20,51% 19,23%
10,26%
5,13% 1,28%
12,82%
0,0%
5,0%
10,0%
15,0%
20,0%
25,0%
30,0%
35,0%
0
5
10
15
20
25
30
Botswana DRC Russia Australia South Africa China Other countries
% s
hare
of g
loba
l pro
duct
ion
Prod
uctio
n (M
illio
n ca
rats
) Production (lhs) % share of global production (rhs)
© 2014 KPMG International Cooperative (“KPMG International”). KPMG International provides no client services and is a Swiss entity with which the independent member firms of the KPMG network are affiliated.

26 | Democratic Republic of Congo mining guide
The traditionally secretive diamond trade in the DRC has had a mixed effect on the country, amassing substantial wealth for few individuals, while causing insecurity and detriment to others. DRC legislation reserves the right to diamond trading inside the country to Congolese nationals, with two layers of middlemen involved. Some are based close to the mines and buy directly from artisanal diggers, while Kinshasa-based traders are closer to the foreign exporters. The diamond trade has gained some legitimacy in recent years, with diamonds becoming one of the country’s largest exports. According to the Banque Centrale du Congo (BCC, the central bank), total artisanal diamond production reached 20.1 million carats in 2012. This is an 8.3% increase from the 18.6 million carats produced in 2011. The central bank does not provide figures for industrial diamond production as diamond production is dominated by artisanal and small-scale miners in the DRC, which are together classified as artisanal. Consequently, some diamond production will be considered as artisanal by the BCC, but classified as industrial by the USGS, albeit through numerous, small-scale “industrial” mines. This variation in category definitions explains the large industrial diamond production figures according to the USGS. The figures for artisanal and small-scale production, however, could be a significant underestimate due to unregulated activity in the informal sector. This has some significant consequences when diamond prices fall because many small scale producers shut down and workers are forced to seek employment in other sectors.
Figure 13: DRC and world industrial diamond production levels, 2001–12
INDUSTRIAL DIAMOND PRODUCTION LEVELS, 2001–12E
Sources: US Geological Survey, Mineral Commodity Summaries 2013;
US Geological Survey Mineral Information–Congo (Kinshasa);
Diamond Statistics and Information, US Geological Survey Mineral
2001 2002 2003 2004 2005 2006 2007 2008 2009 2010 2011 2012E DRC 9 9 22 22 25 22 22 22 14 22 16 16 World 48 55 70 67 81 80 77 72 55 64 77 78
0
10
20
30
40
50
60
70
80
90
Pro
duct
ion
(Mill
ion
cara
ts)
© 2014 KPMG International Cooperative (“KPMG International”). KPMG International provides no client services and is a Swiss entity with which the independent member firms of the KPMG network are affiliated.

Democratic Republic of Congo mining guide | 27
GemstonesGemstones are pieces of mineral, which, in cut and polished form, are used to make jewelry or other adornments, with the value estimated by the gemstones’ beauty, rarity, and durability. Silicates compose the largest group of gemstones, and oxides and quartz compose the second largest.
Figure 14: Production level of gemstones in the DRC
TOP GEMSTONE PRODUCING COUNTRIES, 2012E
Sources: US Geological Survey, Mineral Commodity Summaries 2013;
US Geological Survey Mineral Information–Congo (Kinshasa)
Figure 15: DRC and world gemstone production levels, 2001–12
GEMSTONE PRODUCTION LEVELS, 2001–12E
Sources: US Geological Survey, Mineral Commodity Summaries 2013; US Geological Survey Mineral Information–Congo (Kinshasa); Gemstones Statistics and Information, US Geological Survey Mineral
24 000
18 500
10 500
7 200
3 900 2 800 1 400 450 300 200
2 026
33,67%
25,96%
14,73%
10,10%
5,47% 3,93% 1,96% 0,63% 0,42% 0,28% 2,84%
0,0%
5,0%
10,0%
15,0%
20,0%
25,0%
30,0%
35,0%
40,0%
0
5 000
10 000
15 000
20 000
25 000
30 000
Botswana Russia Canada Angola DRC South Africa
Namibia Lesotho Sierra Leone
Central African
Republic
Other countries
% s
hare
of g
loba
l pro
duct
ion
Prod
uctio
n (T
hous
and
cara
ts) Production (lhs) % share of global production (rhs)
2001 2002 2003 2004 2005 2006 2007 2008 2009 2010 2011 2012E DRC 9 100 9 100 5 400 6 000 6 300 5 600 5 400 5 400 3 600 5 500 3 900 3 900 World 68 500 76 500 80 900 89 400 102 000 91 300 93 000 87 000 74 100 79 900 69 900 71 000
-
20 000
40 000
60 000
80 000
100 000
120 000
Pro
duct
ion
(Tho
usan
d ca
rats
)
© 2014 KPMG International Cooperative (“KPMG International”). KPMG International provides no client services and is a Swiss entity with which the independent member firms of the KPMG network are affiliated.

28 | Democratic Republic of Congo mining guide
Gold In the DRC, gold was first discovered at Namoya, in 1931, and production from alluvial operations continued through to 1947. In the 1990s, the invasion from eastern neighbors Uganda and Rwanda resulted in the seizure of the operations of many gold mines by the Congolese military forces. Artisanal and small-scale miners produced gold in the Ituri district of Orientale province, North-Kivu province and South-Kivu province in the eastern part of the DRC. However, in October 2011, Canada-based Banro Corporation launched the first commercial gold mine in the country in 50 years.32,33,34
According to Business Monitor International, the DRC’s gold output could increase from around 2.5 tonnes in 2012 to some 12.4 tonnes by 2017. Banro Corp and Randgold Resources are developing projects that are expected to provide a significant surge to the country’s gold sector. Banro Corp is developing the Twangiza and Namoya mines, which are expected to have a combined output of about 7,000 kg per annum by 2013. The Twangiza mine is the first new gold operation in the country since independence in 1960. In turn, Randgold Resources is expected to produce 15,000 kg per annum from its Kibali mine when at full capacity over the long term. However, factors such as internal security concerns and a substantial deficit in power generation could restrain growth.35
Figure 16: DRC gold production levels, 2001–11
GOLD PRODUCTION IN THE DRC, 2001–11E
Source: US Geological Survey Mineral Information–Congo (Kinshasa)
Zinc Figure 17: DRC zinc production levels, 2001–11
ZINC PRODUCTION IN THE DRC, 2001–11E
Source: US Geological Survey Mineral Information–Congo (Kinshasa)
According to the International Zinc Association, over 11 million tonnes of zinc are produced annually worldwide. Around 50% of this amount is used for galvanising to protect steel from corrosion. Approximately 17% goes into the production of zinc base alloys, mainly to supply the die casting industry, and 17% to produce brass and bronze.
1 014
6 000 7 911 8 027 7 588
16 831
11 925
15 465
19 636
9 223
19 035
-
5 000
10 000
15 000
20 000
25 000
2001 2002 2003 2004 2005 2006 2007 2008 2009 2010E 2011E
Prod
uctio
n (T
onne
s)
Zinc production
6 100
12 400
8 900
6 300 7 200
10 300
5 100
3 300 3 500 3 500 3 500
-
2 000
4 000
6 000
8 000
10 000
12 000
14 000
2001 2002 2003 2004 2005 2006 2007 2008 2009 2010E 2011E
Prod
uctio
n (K
ilogr
amm
es)
Gold production
32 2010 Minerals Yearbook Congo (Kinshasa), US Geological Survey, accessed 22 August 201333 CORRECTED-FEATURE-Gold to flow from Congo’s cloud-capped hills, Reuters, accessed 22 August 201334 Gold Mining In The Democratic Republic Of Congo, Ezine Articles, accessed 22 August 201335 “Democratic Republic of Congo: Q3 2013”, Business Monitor International, May 2013
© 2014 KPMG International Cooperative (“KPMG International”). KPMG International provides no client services and is a Swiss entity with which the independent member firms of the KPMG network are affiliated.

Democratic Republic of Congo mining guide | 29
Investment Environment in the DRC36,37,38,39
The DRC offers huge untapped and high-grade reserves of vital commodities. However, the investment environment in the country remains risky with security issues and the lack of adequate infrastructure affecting the business environment. Many of the projects under development are located in the eastern region of the country, which has poor linkages to ports and suffers from shortages of electricity and water. In addition, continuing rebel activity in this region could disrupt operations and affect the development of new projects.
The east of the DRC, within 300 km or so of the borders with Rwanda and Uganda, is the region in which the security situation is the worst (although the shores of Lake Kivu are relatively safe). The rest of the country is secure, although the ongoing crisis in the Central African Republic (CAR) has led to an influx of refugees in the north of the country recently. This has not yet become a security issue, but it may turn into one in the future. In the rest of the country, security issues are not a significant factor for investment. Katanga is the most developed part of the Congo as far as industrial-scale mining operations are concerned, thanks to a stable security environment and the possibility for operators in the region to set up logistical networks through Zambia. The greater Kinshasa agglomeration and Bas-Congo province are the two other prosperous parts of the country, thanks to the large consumer market, and are safe areas for investment.
In its Joint Staff Advisory Note in July, the IMF classified the constraints and risks preventing investors from producing domestically and servicing the relatively large local market into four broad categories: deficient infrastructure, poor governance & complex business regulations, high financing costs, and a lack of trained workers. These factors deter investment into other sectors of the economy, and thus prevent the domestic economy from taking advantage of potential foreign interest. The government’s inability to provide adequate infrastructure and failure to create a business environment conducive to economic growth, have marred the country for numerous years. Consequently, the mining industry has seen strong growth, but the private sector is largely underdeveloped.
The UK is increasing its business with DRC and supporting the government’s anti-corruption efforts through its Department for International Development (DFID). DFID is in partnership with the World Bank, supporting “ProMines”, a mining sector good governance and transparency programme aimed at enabling the country to rely on its mineral resources for prosperity and poverty alleviation. DFID has also supported the drafting of a business code of conduct for the private sector and the government in the DRC. The code has been signed by many foreign companies who committed to implement it in their business activities. This could improve the business environment, create jobs and aid the construction of essential infrastructure in the country.
36 “Democratic Republic of Congo Mining Report: Q3 2013”, Business Monitor International, May 201337 “Note: The Sovereign-Commercial Hybrid: Chinese Minerals for Infrastructure Financing in the Democratic Republic of the Congo”, Lexis Nexis,
accessed 22 August 201338 Country Report: Democratic Republic of Congo, EIU, March 201139 “Increasing business with the Democratic Republic of Congo”, Gov.UK, accessed 22 August 2013
© 2014 KPMG International Cooperative (“KPMG International”). KPMG International provides no client services and is a Swiss entity with which the independent member firms of the KPMG network are affiliated.
30 | Democratic Republic of Congo mining guide
Major mining companies in the DRC40
Key domestic players
• Africa Smelting Corporation Sprl
• Amani Consulting Sprl
• Austral Africa Resources Ltd
• Boboko Investment Pte Ltd
• Congo Cobalt Corporation
• Congo Dongfang International Mining Sprl
• Congo Mineral Resources Sprl
• Congo Mining Co. Sprl
• Diamond Industry Associates Ltd
• Exploitation Artisanale Du Congo Sprl
• Kasai Wa Balengela/ Tshiamalamuikila
• Margaux Sprl
• Mine De Kawama
• Mine De Likulu Kisenge
• Minière de Bakwanga Sarl
• Mining Company Katanga Trucks Sprl
• Mining Mineral Resources Sprl
• Namakwa Diamonds Ltd
• New Stone Mining Sprl
• Nucoco Sprl
• Pangimines Sprl
• Phoenix Mining Corporation Sprl
• Rubamin Sprl
• Shituru Mining Corporation Sprl
• Slag Treatment Plant Lubumbashi
• Société Minière de Kilo-Moto Sarl
• Sojofils Mining (Pty) Ltd
• Somika Sprl
• TSM Enterprise Sprl
40 Capital IQ, accessed 14 August 2013
© 2014 KPMG International Cooperative (“KPMG International”). KPMG International provides no client services and is a Swiss entity with which the independent member firms of the KPMG network are affiliated.

Democratic Republic of Congo mining guide | 31
Foreign companies with operations in the DRC41
• Glencore (Mutanda Mining Sprl, Katanga Mining Ltd)
• Camrose Resources
• Katanga Minerals
• Premiere Miniere Du Katanga
• Anvil Mining Congo Sarl
• Benzu Resources Ltd
• Camrose Resources Ltd
• Chemaf Sprl
• Compagnie Minière du Sud Katanga Sprl
• Congo Minerals Sprl
• Frontier Sprl
• Groupe George Forrest Internationale Afrique Sprl
• Jindal DRC Sprl
• Katanga Minerals Processing
• Kibali Goldmines Sprl
• Kolwezi Investments Ltd, Frontier Sprl
• La Compagnie minière de Sakania Sprl
• Loncor Resources Inc (Prior to Acquisition by Nevada Bob’s International Inc)
• Luisha Mining Enterprise Sprl
• Miniere Musoshi Kinsenda
• Mining and Processing Congo Sprl
• New Congo Resources Development Company Inc
• Pangimines Sprl, Four Exploration Licences in Maniema Province
• Premiere Miniere Du Katanga
• RAK Minerals & Metals Congo FZ - LLC
• Roan Prospecting & Mining Sprl
• Rockbury Properties Ltd
• Ruashi Mining Sprl
• Shamika Resources, Inc
• Société Minière de Kolwezi Sprl
• Tenke Fungurume Mining Sprl
Notes:Methodology used for identification of mining companies: • FortheidentificationofminingsectorcompaniesintheDRC,weaccessedCapitalIQtogeneratealistinthefollowingindustrysectors:MetalsandMining.• ThedomesticcompanieslistincludescompanieswhosecountryofultimateparentandgeographiclocationistheDRC.• TheforeigncompanieslistincludescompanieswhosegeographiclocationistheDRCbutthecountryofultimateparentwasnottheDRC.
41 Capital IQ, accessed 14 August 2013
© 2014 KPMG International Cooperative (“KPMG International”). KPMG International provides no client services and is a Swiss entity with which the independent member firms of the KPMG network are affiliated.

Further insight from KPMG
Country mining guidesThis series of country guides provides an overview of the mining industry from a geographical, economic and legislative context. These country guides are invaluable for those already operating or considering an investment in the country.
Growth in a time of scarcity: Managing transactions in the mining sectorA combination of demand from the East, dwindling mineral resources and rising costs is reshaping the mining sector. As mining companies attempt to manage their asset life cycle in
this new landscape, their three main strategic priorities are growth, performance and compliance. Whether organically or (increasingly) through mergers and acquisitions, growth is a perennial objective in an industry where assets continually erode. This guide is the first in a series that discusses how mining companies can best navigate the asset life cycle, and covers the five key elements of the transaction phase: geographic expansion, financing and mergers & acquisitions, tax structuring, due diligence and integration.
Download this publication from kpmg.com/mining
Strategy Series
Growth Series
Strategy Series
MINING
PeruCountry mining guide
kpmg.com/mining
KPMG INterNatIoNal
MINING
Growth in a time of scarcityManaging transactions in the mining sector
kpmg.com
KPMG INTERNATIONAL
KPMG Mining Operational Excellence FrameworkKPMG member firms have developed their own operational excellence framework over the last several years of association with leading mining companies. It helps organizations begin a journey of efficiency and then, over
time, embeds such characteristics in order to make change sustainable over business cycles. This puts together all the capabilities necessary to assure the organization’s leadership that it will be able to adapt to support their hunt for the next opportunity, whatever its nature.
Download this publication from kpmg.com/mining
Performance Series
Performance Series
Our bulletins focus on key mining commodities. Each bulletin provides insight into trends, issues and changes within the key mining commodity sectors. The series currently includes bulletins focusing on our key mining commodities: Copper, Diamond, Gold, Iron ore, Metallurgical coal, Nickel, Platinum, Thermal coal and Uranium.
Download the bulletins from kpmg.com/mining
Capitalizing on sustainabilityin miningThis publication examines how mining companies can leverage sustainable development to tackle resource constraints and sociopolitical challenges in remote areas in the world.
Commodity ins ights
BulletinJULY 2013
Chromite – Special edition
Commodity outlook Chrome ore witnessed challenging market conditions in 2012, especially during 2h12. there was a fall in ferrochrome prices due to renewed concerns over European debt, general global economic weakness, weaker stainless steel demand and lack of producer discipline in south Africa.
Ferrochrome prices showed a modest increase of 2.5 cents to 112.5 cents/lb during 1Q13. spot prices in Europe and China have also recently started rising on increased demand, restocking, higher nickel prices and some anticipation of producer cutbacks in south Africa as they enter another round of power buyback deals with Eskom (south African Power Utility). Ferrochrome prices are expected to rise modestly during 2Q13 to 120 cents/lb as the Eskom buy-back deals start, and then remain unchanged throughout the remainder of the year.1
As per consensus price estimates, the yearly average prices for chrome ore and ferrochrome are expected to increase to Us$219/t and 120 cents/lb, respectively, during 2013.2 the prices are expected to further increase in 2014 and then remain steady till 2016. south African producers are expected to remain under cost pressure as the south African Rand appreciates. With Eskom buy-back agreements coming into implementation and the prevailing labor situation, south Africa is expected to witness only a modest production growth during 2013.
Figure 2: Stainless steel end-use consumption by region, 2010–17F
2010 2011 2012 2013F 2014F 2015F 2016F 2017F
Mill
ion
to
nn
es
0
5
10
15
20
25
30
35
40
EMEA Americas APAC
source: outokumpu interim report dated 25 April 2013; KPmg analysis
in the medium term, ferrochrome demand is expected to be driven by the global stainless steel demand which is expected to increase at a CAgR of about 4.3 percent over the next five years. this has been shown in Figure 2. this growth rate is expected to be driven by increased demand coming from Asian countries especially the growth in Chinese steel demand. the APAC, EmEA and Americas regions are expected to witness a steel demand growth rate of about 4.9 percent, 3.2 percent and 2.8 percent respectively till 2017.3
Copper | diamond | gold | iron ore | metallurgical Coal | nickel | Platinum | thermal Coal | Uranium
1 numis securities, “metals & mining: Finding the right gear”, 14 January 2013, via thomson Research/investext accessed 28 June 20132 deutsche Bank “mining Commodities Update: mixed earnings changes, market remains unconvinced of growth”, 9 April 2013, via thomson
Research/investext accessed 28 June 20133 “Creating a new global leader in stainless steel: iR presentation January 2013”, outokumpo, January 2013
source: merafe Resources; deutsche Bank; morgan stanley; numis securities; macquarie Research Ferrochrome price forecasts represent average price estimates of deutsche Bank, morgan stanley, numis securities and macquarie Research
Figure 1: Chromite and Ferrochrome price forecasts, 2011–18F
Ch
rom
ite
pri
ces
(US
$/t)
112
114
116
118
120
122
124
126
128
130
180
190
200
210
220
230
240
250
260249
208
219
236 234
236 238 240
118120
128128127
120
121
125
2011 2012 2013F 2014F 2015F 2016F 2017F 2018F
Ferr
och
rom
e p
rice
s (U
Sc/
lb)
Chromite (US$/t) Ferrochrome (USc/lb)
Commodity Insights Bulletins
Sustainability Series
Mining risk and assurance: A survival strategyFaced with falling commodity demand and prices and a continued escalation of input costs, mining companies are experiencing declining margins. A series of major project failures has also put risk management under the microscope.
Based on interviews with several partners from KPMG member firms, this paper identifies eight key drivers of value – from strategy to sustainability and reputation to taxation – examining the risks inherent in each of these areas. In order to survive and prosper, organizations should adopt a holistic, integrated risk and assurance strategy that enables them to become masters of risk – rather than victims.
Download this publication from kpmg.com/mining
Compliance Series
© 2014 KPMG International Cooperative (“KPMG International”). KPMG International provides no client services and is a Swiss entity with which the independent member firms of the KPMG network are affiliated.

Democratic Republic of Congo mining guide | 33
Mining asset life cycleLe
vel o
f ac
tivi
ty
Time
Evaluate country risks and marketopportunities
Search forcommerciallyexploitableresources
Removal of overburdenand waste, and plantcommissioning
Permit and licenseapplications
Commercial exploitationbegins
Expansion ofmine and plant
Commercialexploitation ends
Closure ofmine and plant
Ongoingrehabilitation
Bankable feasibilitystudy (BFS)
Prospectingrightsapplication
Pre-feasibility study
Competentperson's report
Preliminaryeconomicassessment (PEA) Construction of
infrastructureand plant
Design andimplementmarket strategy
Source: KPMG International 2012
Note: (1) Estimated duration of stage in the mining asset life cycle
Assetlife cycle
Expansion1–2 years1
Exploration2–10 years1
Evaluation3–6 years1
Development1–3 years1
Production10–50 years1
Closure1–10 years1
KPMG’s mining strategy service offeringsAssetlife cycle
Expansion1–2 years1
Exploration2–10 years1
Evaluation3–6 years1
Development1–3 years1
Production10–50 years1
Closure1–10 years1
Your asset life cycle — How KPMG can help
Performance
Operationalexcellence
Growth
ProjectsTransactions
Market entry
Financing and M&A
Tax structuring
Due diligence
Integration
Compliance
Risk andcompliance
Statutory audit
Enterprise riskmanagement
Internal assurance
Businessresilience
Communityinvestment
Energy, waterand carbon
Materialstewardship
Mine rehabilitation
Reporting andtax transparency
Sustainability
Strategic andscenario planning
Scenario planning
Strategydevelopment
People andchange
Tax strategyand policy
Strategy
Portfoliomanagement
Projectdevelopment
Feasibilities
Financing
Tax structuring
Project execution
Operating modeldevelopment
Cost andtax optimization
Supply chaintransformation
Businesstransformation
Businessintelligence
Source: KPMG International 2012Note: (1) Estimated duration of stage in the mining asset life cycle
Forensic investigations
Tax compliance
© 2014 KPMG International Cooperative (“KPMG International”). KPMG International provides no client services and is a Swiss entity with which the independent member firms of the KPMG network are affiliated.

34 | Democratic Republic of Congo mining guide
KPMG’s Global Mining practiceKPMG member firms’ mining clients operate in many countries and have a diverse range of needs. In each of these countries, we have local practices that understand the mining industry’s challenges, regulatory requirements and preferred practices.
It is this local knowledge, supported and coordinated through KPMG’s regional mining centers, that helps to ensure our mining clients consistently receive high-quality services and advice tailored to their specific challenges, conditions, regulations and markets. We offer global connectivity through our 14 dedicated mining centers in key locations around the world, working together as one global network. They are a direct response to the rapidly evolving mining sector and the resultant challenges that industry players face.
Located in or near areas that traditionally have high levels of mining activity, we have centers in Melbourne, Brisbane, Perth, Rio de Janeiro, Santiago, Singapore,Toronto, Vancouver, Beijing, Moscow, Johannesburg, London, Denver and Mumbai. These centers support mining companies around the world, helping them to anticipate and meet their business challenges.
For more information, visit kpmg.com/miningCape Verde
© 2014 KPMG International Cooperative (“KPMG International”). KPMG International provides no client services and is a Swiss entity with which the independent member firms of the KPMG network are affiliated.

Democratic Republic of Congo mining guide | 35
KPMG’s footprint in Africa
SouthAfrica
Lesotho
Swaziland
Mozambique
Madagascar
Namibia
Botswana
Angola
Zambia
Malawi
Democratic Republic of
Congo
Tanzania
CongoGabon
EquatorialGuinea
Burundi
Rwanda
Uganda
Kenya
EthiopiaSouthSudan
Sudan
EgyptLibya
Tunisia
WesternSahara
Mauritania
MaliNiger
Chad
CentralAfrican
RepublicCameroon
NigeriaBenin
TogoGhana
Côted’Ivoire
Liberia
Sierra Leone
GuineaGuinea-Bissau
The Gambia
SenegalEritrea
BurkinaFaso
Sao Tome& Principe
Reunion
Mauritius
Seychelles
Cape Verde
Morocco
Algeria
Djibouti
Comores
Zimbabwe
Somalia
Licensed KPMG offices
Serviced via regional KPMG offices
As of July 2013
© 2014 KPMG International Cooperative (“KPMG International”). KPMG International provides no client services and is a Swiss entity with which the independent member firms of the KPMG network are affiliated.

36 | Democratic Republic of Congo mining guide
© 2014 KPMG International Cooperative (“KPMG International”). KPMG International provides no client services and is a Swiss entity with which the independent member firms of the KPMG network are affiliated.

Democratic Republic of Congo mining guide | 37
© 2014 KPMG International Cooperative (“KPMG International”). KPMG International provides no client services and is a Swiss entity with which the independent member firms of the KPMG network are affiliated.

Contact us
KPMG in The DRC country contacts
Alexis Majnoni d’IntignanoDirector – Sub Saharan French-Speaking AfricaM: + 241 04 06 08 06E: [email protected]
Patrice YanthoSenior Manager – Advisory ServicesT: +237 33 43 96 79E: [email protected]
KPMG’s mining leaders
David Waldron Global Mining Leader – Strategy T: +1 514 985 1274 E: [email protected]
Rama Ayman Global Head of Metals and Mining Corporate Finance T: +44 20 7311 5092 E: [email protected]
Rodney Nelson Global Mining Leader – Projects T: +61 8 9263 7454 E: [email protected]
Hiran Bhadra Global Mining Leader – Operational Excellence T: +1 214 840 2291 E: [email protected]
Dane Ashe Global Mining Leader – Internal Assurance T: +27 82 828 4812 E: [email protected]
Lee Hodgkinson Global Mining Leader – External Audit T: +1 416 777 3414 E: [email protected]
Rohitesh Dhawan Global Mining Leader – Sustainability T: +27 82 719 6114 E: [email protected]
Rod Henderson Global Mining Leader – Taxation T: +61 2 9335 8787 E: [email protected]
Wayne JansenGlobal Head of MiningT: +27 11 647 7201E: [email protected]
kpmg.com/miningkpmgafrica.comkpmg.com/socialmedia
The information contained herein is of a general nature and is not intended to address the circumstances of any particular individual or entity. Although we endeavor to provide accurate and timely information, there can be no guarantee that such information is accurate as of the date it is received or that it will continue to be accurate in the future. No one should act on such information without appropriate professional advice after a thorough examination of the particular situation.
© 2014 KPMG International Cooperative (“KPMG International”), a Swiss entity. Member firms of the KPMG network of independent firms are affiliated with KPMG International. KPMG International provides no client services. No member firm has any authority to obligate or bind KPMG International or any other member firm vis-à-vis third parties, nor does KPMG International have any such authority to obligate or bind any member firm. All rights reserved.
The KPMG name, logo and “cutting through complexity” are registered trademarks or trademarks of KPMG International. MC11840