kpmg royalties
DESCRIPTION
Royality StudyTRANSCRIPT
ADVISORY
Profitability and royalty rates across industries: Some preliminary evidence
2012
kpmg.com
KPMG INTERNATIONAL
KPMG’s Global valuation institute (Gvi) is pleased to introduce its second management paper since the launch of our research agenda, authored by Jonathan E. Kemmerer and Jiaqing “Jack” Lu.
As an independent think tank, we recognize that valuation is a constantly evolving discipline that has been shaped by practical and theoretical advances. Many high quality research papers on valuation subjects never find their way to influencing the evolution of standards and practice due to a lack of exposure to practitioners.
our goal is to act as a catalyst for the adoption of breakthrough valuation research. To this end, KPMG’s Gvi benefits from the expertise of an Academic Advisory Board comprised of professors from Beijing University in China, Northwestern University in the Us and oxford University in the UK. This Board designs a research agenda and selects and reviews the research we sponsor.
We work closely with researchers to present their managerial papers in a format that is understandable to a broad range of business professionals. This includes illustrative papers with applications and/or case studies. Through this process, we keep KPMG’s global network of 1,200 valuation professionals informed of emerging valuation issues.
Foreword
Yves Courtois Partner KPMG in Luxembourg
Doug McPhee Partner KPMG in the UK
With the growing and critical importance of intellectual property in our modern societies, it is vital for practitioners to be able to value iP adequately. in this paper, Jack Lu and Jonathan Kemmerer explore the 25 percent rule in the licensing market to determine royalty rates and the relationship between royalty rates and profitability. Goldscheider defines the 25 percent rule as “the licensee paying a royalty rate equivalent to 25 percent of its expected profit for the product that incorporates the iP at issue”.
The authors’ found that the reported royalty rates across industries do not converge with the rates generated by the 25 percent rule, although they tend to fall between 25 percent of gross margins and 25 percent of operating margins. The EBiTdA margin seems to be a more reasonable basis to apply the 25 percent rule as opposed to the EBiT margin sometimes used by practitioners.
Lastly, the authors also found a linear relationship between reported royalty rates and several profitability measures, showing the 25 percent rule as a special case of this relationship.
This paper is the second of a series that will be sponsored by KPMG’s Global valuation institute. As practitioners, we trust that you will find these of interest.
This paper reflects the views of the authors and not necessarily those of KPMG.
Jean Florent Rerolle Partner KPMG in France
© 2012 KPMG International Cooperative (“KPMG International”), a Swiss entity. Member firms of the KPMG network of independent firms are affiliated with KPMG International. KPMG International provides no client services. All rights reserved.

© 2012 KPMG International Cooperative (“KPMG International”), a Swiss entity. Member firms of the KPMG network of independent firms are affiliated with KPMG International. KPMG International provides no client services. All rights reserved.

© 2012 KPMG International Cooperative (“KPMG International”), a Swiss entity. Member firms of the KPMG network of independent firms are affiliated with KPMG International. KPMG International provides no client services. All rights reserved.
Abstract
Is the licensing market efficient such that royalty rates reflect costs and profitability across industries? This paper tries to answer the question through exploring the relationship between royalty rates and profitability. Analysis shows that the reported royalty rates across industries do not converge with the rates generated by the 25 percent rule, although they tend to fall between 25 percent of gross margins and 25 percent of operating margins. Regression analyses indicate that there is a linear relationship between reported royalty rates and various profitability measures, which suggests that the licensing market is efficient and that cost structure and profitability across industries have been factored into royalty rate negotiation. Therefore, the 25 percent rule is simply a special case of such a general linear relationship. A revisit of the data in Goldscheider et al (2002) further demonstrates that a “forced” linear fitting seems to make the average royalty rate equal to 23 percent of the average operating profit margin, rendering indirect support to the 25 percent rule. However, such a conclusion should be taken as for the purpose of illustration and contrast only, because no general linear relationship was found between the reported royalty rates and operating margins as defined by Goldscheider et al (2002).
Jonathan E. Kemmerer earned his BBA in accounting from The University of Texas at Austin, and is a founding partner and managing director of Applied Economics Consulting Group, Inc. He is a CPA, member of the American Institute of CPAs, the Texas Society of CPAs, and is a member of the Licensing Executives Society. Mr. Kemmerer can be contacted at [email protected].
Jiaqing “Jack” Lu received his Ph.D. from the University of Texas at Austin, and is the Chief Economist and a Senior Director for IP Market Advisory Practice (IPMAP) at Applied Economics Consulting Group, Inc. He is a Chartered Financial Analyst (CFA), and is a member of the CFA Institute, the National Association for Business Economics, and the Licensing Executives Society. He can be reached at [email protected].
Profitability and royalty rates across industries | 1
© 2012 KPMG International Cooperative (“KPMG International”), a Swiss entity. Member firms of the KPMG network of independent firms are affiliated with KPMG International. KPMG International provides no client services. All rights reserved.
IntroductionRoyalty payments can be interpreted as a profit sharing mechanism. In other words, by receiving royalty income, a technology licensor shares the profit streams generated from the licensee’s efforts in commercializing the patented technology. Royalty rates in a majority of license agreements are defined as a percentage of sales or a payment per unit. However, the profitability of the products or services that incorporate the patented technology plays a dominant role in royalty determination. According to a survey published by Degan and Horton (1997), when asked what financial measures they used in determining royalty amounts, more than half of the survey respondents listed
discounted cash flow or profit sharing analysis, while nearly a quarter used the 25 percent rule as a starting point.
This paper explores the relationship between profitability and royalty rates across industries.1 We will answer two questions in patent licensing. First, do reported royalty rates across industries, on average, converge with the rates generated by the 25 percent rule? Second and more generally, is the licensing market efficient such that reported royalty rates reflect the profitability across industries? Intuitively, the higher an industry’s profitability, the higher the royalty rate. If a linear relationship exists between profitability
and reported royalty rates, the 25 percent rule is simply a special case of such a general linear relationship.
Analysis of the data shows that reported royalty rates across industries do not converge with the rates generated by 25 percent rule at an industry level, although the reported rates tend to fall between 25 percent of gross profit margins and 25 percent of operating profit margins. Analysis also indicates that EBITDA may be a reasonable base for applying the 25 percent rule.
Regression analyses using industry data further demonstrates that, generally, there is a linear relationship between reported royalty rates and various
1 Throughout the paper, royalty rate is defined as a fixed percentage rate of sales.
2 | Profitability and royalty rates across industries
© 2012 KPMG International Cooperative (“KPMG International”), a Swiss entity. Member firms of the KPMG network of independent firms are affiliated with KPMG International. KPMG International provides no client services. All rights reserved.
profitability measures. Specifically, the reported royalty rates account for 15 percent, 41 percent, and 54 percent of gross, EBITDA, and EBIT margins, respectively. Such a linear relationship suggests that the licensing market is efficient and cost structure and profitability across industries have been factored into the royalty rate negotiation. The 25 percent rule is simply a special case of such general linear relationship.
Does this mean that the 25 percent rule is invalid? The answer is no. We agree with many authors that the 25 percent rule serves as a good starting point for royalty negotiations. Also, based on the
authors analyses on the data published in Goldscheider, et al. (2002), a “forced” linear fitting seems to make the average royalty rate equal to 23 percent of the operating profit margin, indirectly supporting the 25 percent rule. However, such a conclusion should be taken as for the purpose of illustration and contrast only, because no linear relationship was found between the reported royalty rates and operating margins as defined by Goldscheider, et al. (2002).
The rest of the paper is structured as follows. Section 1 briefly reviews the literature, especially the most recent efforts by researchers and practitioners in studying the 25 percent rule. The
scope of this research is also defined in this section which mainly highlights the differences between this paper and the earlier ones, specifically Goldscheider, et al. (2002). Section 2 describes the data issues and discusses certain important issues in calculating profitability measures. Section 3 presents the data analyses to determine if reported royalty rates across industries converge with the rates generated by the 25 percent rule. Sections 4 and 5 report regression analyses on the reported royalty rates against various profit margins. Finally, Section 6 discusses the implications of the results and highlights issues for further research.
Profitability and royalty rates across industries | 3
© 2012 KPMG International Cooperative (“KPMG International”), a Swiss entity. Member firms of the KPMG network of independent firms are affiliated with KPMG International. KPMG International provides no client services. All rights reserved.
1. Literature review and research scope
4 | Profitability and royalty rates across industries
© 2012 KPMG International Cooperative (“KPMG International”), a Swiss entity. Member firms of the KPMG network of independent firms are affiliated with KPMG International. KPMG International provides no client services. All rights reserved.
Discussions about profitability and royalty rate determination have generated a large pool of literature. In most intellectual property (IP) related books, such topics are addressed in at least three places: the Georgia-Pacific factors, the income approach for IP valuation, and the 25 percent rule. The discussions usually offer general guidelines and qualitative descriptions about the importance of profitability without much analytical elaboration (let alone empirical evidence).
It is the persistent interest in the 25 percent rule from IP researchers and practitioners that has advanced the understanding of the relationship between profitability and royalty rate. The 25 percent rule, as defined by Goldscheider, et al. (2002), “suggests that the licensee pay a royalty rate equivalent to 25 percent of its expected profits for the product that incorporates the IP at issue.” Over the years, this rule has gained popularity as a good starting point for royalty negotiations, thanks to its simplicity, intuitive reasonableness, and the keen advocacy from well-respected authors including Goldscheider and Razgaitis. Goldscheider first wrote about the rule in the 1970s. Since then, there have been numerous publications focusing on the 25 percent rule, among which the most recent ones include Goldscheider (2001), Goldscheider, et al. (2002), and Razgaitis (1999, 2002).
Not surprisingly, the 25 percent rule has also encountered criticism for its one-size-fits-all nature, seeming oversimplification, and failure to consider many important factors in royalty rate determinations. A complete review of major criticisms can be found in Goldscheider, et al. (2002). Most recently, Hagelin (2004) pointed out several other problems arising from application of the rule, including profit
measurement, cost inclusion and contributions of non-infringing assets.
In the wake of criticism, the recent research regarding the 25 percent rule has refocused on two new areas. First, there have been efforts to generalize the rule, which would imply that the name of “the 25 percent rule” simply means a general rule of thumb associating royalty rates with operating profit. The rule might better be referred to as the 25 percent to 33 percent rule, as suggested by Razgaitis (2002). Grandstrand (2006) offers another way to support the 25 percent rule. According to his model, the rule is simply a special case of his general model, by which a licensor’s share of profits equals his/her share of total investment in bringing the technology into commercialization. In other words, when a licensor’s share in total investment is 25 percent, his model becomes the 25 percent rule.
Second, the recent research has turned to empirical evidence to seek further justification for the 25 percent rule. Razgaitis (2002) pointed out that the actual percentage can vary a great deal. For software and content licensing, it could be as high as 50 percent. Jousma (2005) analyzed royalty determination in the pharmaceutical industry and concluded that the 25 percent rule can be a good starting point for a start-of-phase I deal. For the deals commencing at start-of-registration, 50 percent is more reasonable, while rates for start-of-phase II and III transactions are about 33 percent and 40 percent, respectively.
The most comprehensive study, conducted by Goldscheider and his co-authors, was first published in Les Nouvelles in 2002 and was later included in Parr and Smith (2004) and Parr (2007). In this now well-cited study, Goldsheider, et al. concluded that based on the royalty rates reported
by RoyaltySource, the median rate of 347 licensee companies converges with the rate generated from applying the 25 percent rule to the weighted operating profit margins of the same group of companies.
Research scope While this research also address the 25 percent rule as part of the efforts to explore a generic relationship between profitability and royalty rates, the paper expands the research scope beyond that of the existing literature. First, the main purpose of this paper is not to test the validity of the 25 percent rule. Instead, it aims at answering a more fundamental question: is the licensing market efficient such that the reported royalty rates reflect the cost structures and profitability across various industries? Since the reported royalty rates are defined as a fixed percentage of sales, it is especially interesting to see whether royalty negotiations have factored in the cost and profitability characteristics across industries.
Second, the authors research focuses more on the industry pattern, not a simple aggregate of individual companies as in Goldscheider, et al. (2002). In other words, this paper focuses on exploring the pattern of royalty rates and profitability across industries in an effort to gain the insight of the relationship between the pair.
Finally, instead of using only one profitability measure, namely, operating profit, the paper calculates three different profit margins for all industry sectors studied. The goal is to examine the general relationship between royalty rates and profitability and to investigate how the royalty rates are associated with various profitability measures.

Profitability and royalty rates across industries | 5
© 2012 KPMG International Cooperative (“KPMG International”), a Swiss entity. Member firms of the KPMG network of independent firms are affiliated with KPMG International. KPMG International provides no client services. All rights reserved.
2 This was done for two reasons. First, internet companies’ major assets are software to operate the internet business model, any in- or out-licensing may well involve software technology. It is hard to imagine that eBay, Amazon or Yahoo may license significant other technology besides software. Second, separating internet from software businesses would make it hard to classify a company whose business is selling software through internet.
3 The authors want to thank Mr. David Weiler of AUS Consultants for explaining RoyaltySource’s classification in great detail. Any errors or mistakes in matching the companies with the RoyaltySource classification are ours.
Based on the discussion with Mr. Weiler and our understanding, only manufacturing companies or services companies were included, not service outlets. For example, while food processing companies are included, restaurants are not. By the same token, apparel producing companies are included, but supermarkets such as JCPenny and Dillards are excluded.
4 Truncating data this way can be justified in practice. Specifically, according to the 25 percent rule, licensees would not pay negative royalty to licensors. Generally, since the goal is to examine the relationship between royalty rate and profitability, associating royalty rates with negative profit margins would distort the relationship, as will be seen later in this paper.
2. Data description and profitability measures
6 | Profitability and royalty rates across industries
© 2012 KPMG International Cooperative (“KPMG International”), a Swiss entity. Member firms of the KPMG network of independent firms are affiliated with KPMG International. KPMG International provides no client services. All rights reserved.
Data descriptionIndustrial classification: The royalty rate data by industry used in this paper is from RoyaltySource of AUS Consultants and the company financial data from CompuStat. RoyaltySource reported royalty data for 15 industries on its publication the Licensing Economics Review (LER). It is important for us to classify the companies in the same way as RoyaltySource does, because RoyaltySource’s classification is different from other standard classifications such as the US Government’s SIC and NAICS or those used by private data vendors such as Standard and Poor’s. Therefore, simply matching RoyaltySource’s classification with others could lead to completely mismatched data, rendering the research outcome meaningless.
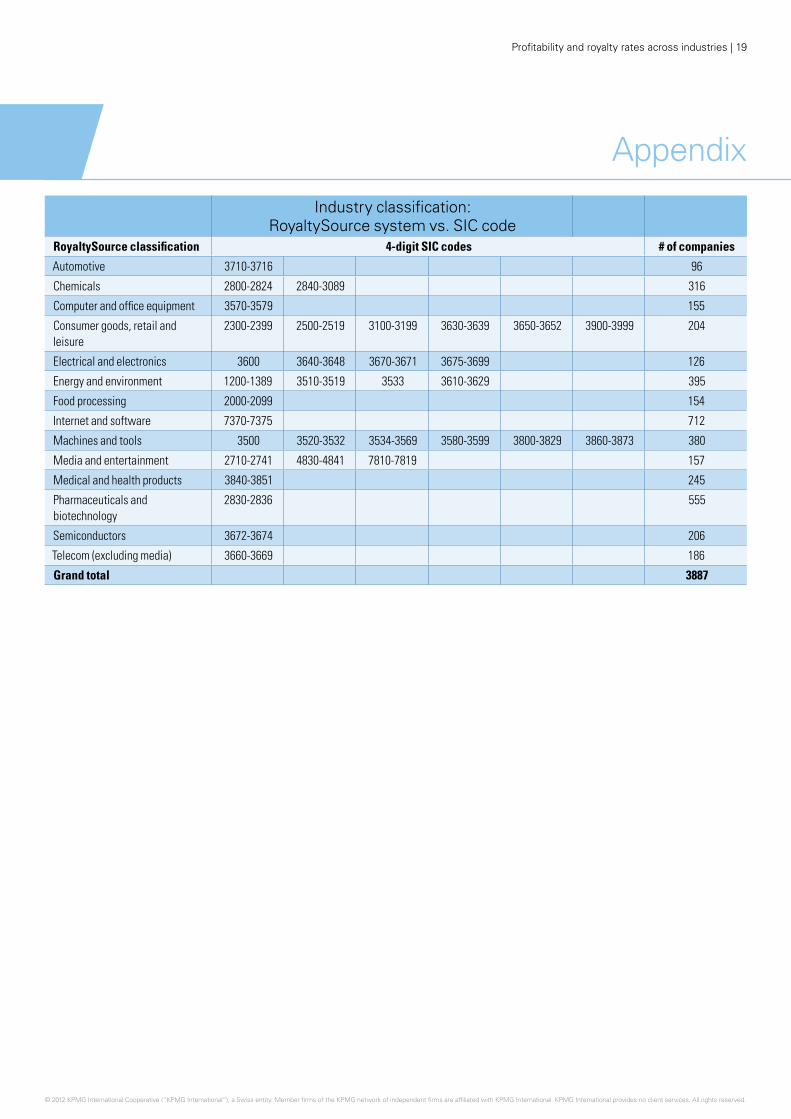
This paper adopts the classification as reported by the RoyaltySource, but reduces it to 14 industries by combining the internet and software sectors.2 The company list was generated at the 4-digit SIC code level by querying CompuStat. The query yielded a total of 3,887 companies that match RoyaltySource’s classification.3 Individual companies are then mapped into 14 industries. The industry names and corresponding 4-digit SIC codes are reported in the Appendix at the end of this paper.
Royalty rate data: The royalty data calculated by RoyaltySource is published annually in the December
issue of LER. The most recent survey was published in December 2007, which was calculated from a sample of 3,015 transactions collected over a 21-year period. The transactions are then classified into 15 industries. Two industries, health/medical products and pharmaceuticals, account for nearly half of the transactions, while media and entertainment have only 43. For further details, refer to the December 2007 issue of LER.
Financial data: Financial data were retrieved from CompuStat, and ratios and percentages were calculated. Average profit margin is calculated as an arithmetic mean of the profit margins of all companies in the sector with data available, in an effort to alleviate the effects of large companies possibly caused by sales-weighted profit margins. A significant number of companies in each industry report negative profit margins, especially EBIT margins. After balancing potential negatives and positives, the authors decided to truncate the samples by excluding all companies with negative margins.4
Profitability measuresProfit margins at company level vs. at the product level: To better explore the relationship between royalty rates and profitability, profit margins need to be calculated at product level for the specific product that incorporates the
licensed technology. Again, it is virtually impossible in practice to compile the data for profitability analysis at the product level. Companies usually produce dozens or even hundreds of products, and they are usually reluctant to disclose financial data at the product level, even if they internally compile such data.
As a result, profit margins at the company level as a proxy are used, based on several important considerations. First of all, over the product life cycle, profit margins will typically swing significantly, from negative initially, to higher margins when sales are rising, and eventually flatten out and even decline when the market saturates. Therefore, over its life cycle, a product’s profit margin should converge to the company average margin. Industry-wide, competition would be expected to ultimately drive away any price premium and/or cost advantage a product enjoys, making product profitability revert to industry average.
Gross margin vs. operating profit margin: The last issue, is what profitability measure should be used for our study. According to accounting and financial reporting principles, there are three major profitability measures. Gross profit is measured as sales less manufacturing costs that include mainly raw materials, direct labor costs, and other costs directly associated with production. Operating profit equals the gross profits less operating costs
5 When addressing the 25 percent rule, most authors have used loose terms such as “gross profits, before tax”, “operating profits”, or “pre-tax profitability” (see Razgaitis (2002), Goldscheider (2001), Goldscheider et al (2002), Parr and Smith (2000), Parr (1999), and Battersby and Grimes (2001)).
6 The argument that all other things being equal – a patent incurring less initial capital investment should command a higher royalty rate than the one requiring more initial investment – is not valid. In an efficient market, if a less capital-intensive alternative exists, the more one will have no market share (unless the more capital-intensive one is superior so that net PV is positive for the licensee). However, the superiority violates the condition of “all other things being equal”.
7 It is worth to pointing out that theoretically, expected margins should be used instead of historical for royalty rate research, because in licensing negotiation, the focus is on expected margins. However, for the purpose of research, we would have to use historic margins.
Profitability and royalty rates across industries | 7
© 2012 KPMG International Cooperative (“KPMG International”), a Swiss entity. Member firms of the KPMG network of independent firms are affiliated with KPMG International. KPMG International provides no client services. All rights reserved.© 2011 KPMG International Cooperative (“KPMG International”). KPMG International provides no client services and is a Swiss entity with which the independent member firms of the KPMG network are affiliated. All rights reserved.
such as sales, marketing, and general administrative (SMGA), and R&D costs. Operating profit with depreciation and amortization costs subtracted is called earnings before income tax or EBIT, and before such subtraction, referred to as earnings before income tax, depreciation, and amortization or EBITDA.
Since most patented technologies are utilized to either increase sales volumes or reduce direct costs, it is reasonable to associate gross profit with the royalty rate. However, as pointed out by Parr (1999) and Parr and Smith (2000), operating expenses
and operating profits certainly play important roles in determining royalty rates. For example, a patented technology ready for incorporation into an existing manufacturing process should command a higher royalty rate than a similar one that requires large spending in further R&D.
If operating profit is relevant, which should be used, EBIT or EBITDA?5 Compared to EBIT, EBITDA, which includes two non-cash items of depreciation and amortization, is a better indicator for value creation. It is also neutral to capital intensity, and without including depreciation and
amortization, is more immunized to potential accounting manipulations such as depreciation method and useful life estimates.6 EBIT measures net profitability before interest and tax and is immunized to capital structure and financing method. However, it is more sensitive to capital intensity and accounting methods.
All three profitability measures were calculated based on the historical data from CompuStat7 and will discuss their relationships with the reported royalty rates in the rest of this paper.
3. Royalty rates and the 25 percent rule
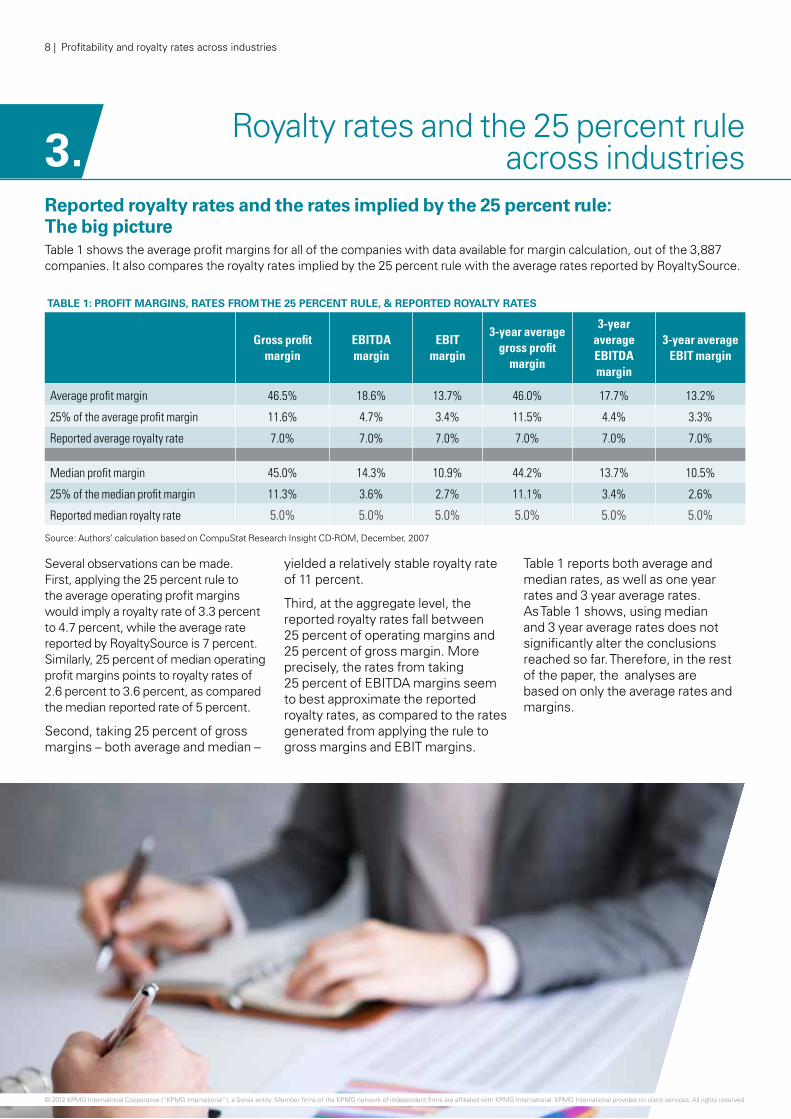
across industries Reported royalty rates and the rates implied by the 25 percent rule: The big pictureTable 1 shows the average profit margins for all of the companies with data available for margin calculation, out of the 3,887 companies. It also compares the royalty rates implied by the 25 percent rule with the average rates reported by RoyaltySource.
TABLE 1: PROFIT MARGINS, RATES FROM THE 25 PERCENT RULE, & REPORTED ROYALTY RATES
Gross profit margin
EBITDA margin
EBIT margin
3-year average gross profit
margin
3-year average EBITDA margin
3-year average EBIT margin
Average profit margin 46.5% 18.6% 13.7% 46.0% 17.7% 13.2%
25% of the average profit margin 11.6% 4.7% 3.4% 11.5% 4.4% 3.3%
Reported average royalty rate 7.0% 7.0% 7.0% 7.0% 7.0% 7.0%
Median profit margin 45.0% 14.3% 10.9% 44.2% 13.7% 10.5%
25% of the median profit margin 11.3% 3.6% 2.7% 11.1% 3.4% 2.6%
Reported median royalty rate 5.0% 5.0% 5.0% 5.0% 5.0% 5.0%
Source: Authors’ calculation based on CompuStat Research Insight CD-ROM, December, 2007
8 | Profitability and royalty rates across industries
Several observations can be made. First, applying the 25 percent rule to the average operating profit margins would imply a royalty rate of 3.3 percent to 4.7 percent, while the average rate reported by RoyaltySource is 7 percent. Similarly, 25 percent of median operating profit margins points to royalty rates of 2.6 percent to 3.6 percent, as compared the median reported rate of 5 percent.
Second, taking 25 percent of gross margins – both average and median –
yielded a relatively stable royalty rate of 11 percent.
Third, at the aggregate level, the reported royalty rates fall between 25 percent of operating margins and 25 percent of gross margin. More precisely, the rates from taking 25 percent of EBITDA margins seem to best approximate the reported royalty rates, as compared to the rates generated from applying the rule to gross margins and EBIT margins.
Table 1 reports both average and median rates, as well as one year rates and 3 year average rates. As Table 1 shows, using median and 3 year average rates does not significantly alter the conclusions reached so far. Therefore, in the rest of the paper, the analyses are based on only the average rates and margins.
© 2012 KPMG International Cooperative (“KPMG International”), a Swiss entity. Member firms of the KPMG network of independent firms are affiliated with KPMG International. KPMG International provides no client services. All rights reserved.
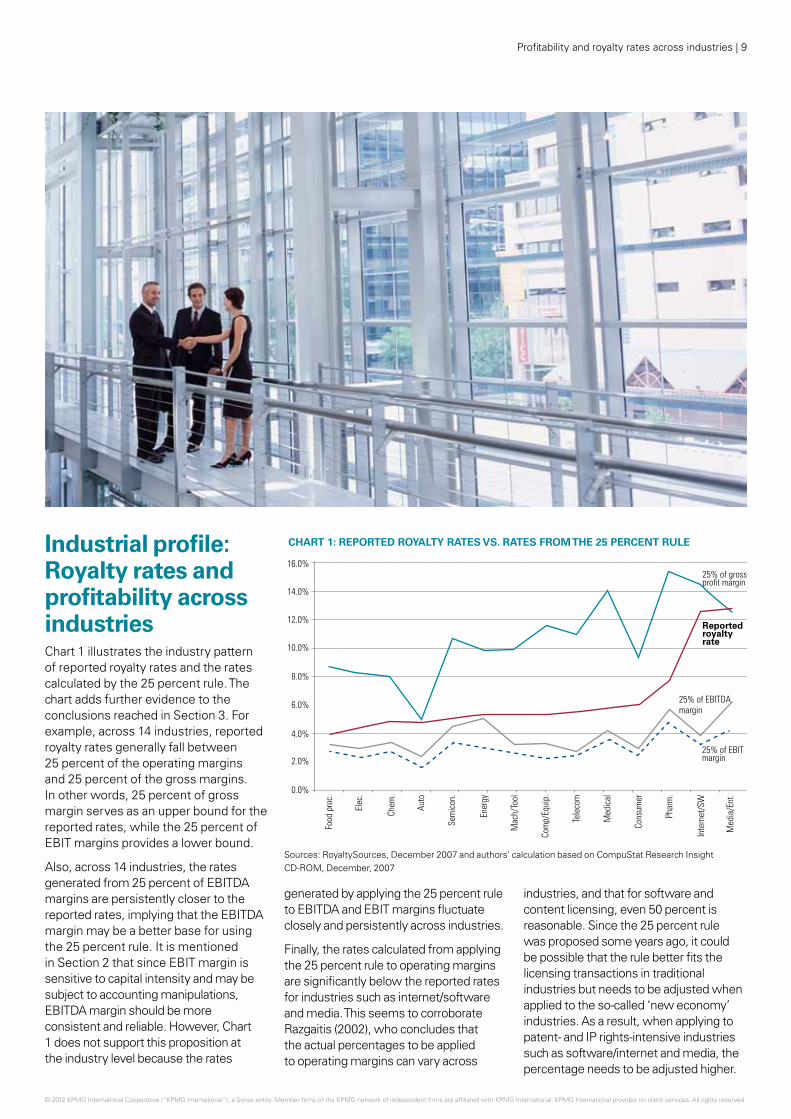
Industrial profile: Royalty rates and profitability across industriesChart 1 illustrates the industry pattern of reported royalty rates and the rates calculated by the 25 percent rule. The chart adds further evidence to the conclusions reached in Section 3. For example, across 14 industries, reported royalty rates generally fall between 25 percent of the operating margins and 25 percent of the gross margins. In other words, 25 percent of gross margin serves as an upper bound for thereported rates, while the 25 percent of EBIT margins provides a lower bound.
Also, across 14 industries, the rates generated from 25 percent of EBITDA margins are persistently closer to the reported rates, implying that the EBITDA margin may be a better base for using the 25 percent rule. It is mentioned in Section 2 that since EBIT margin is sensitive to capital intensity and may be subject to accounting manipulations, EBITDA margin should be more consistent and reliable. However, Chart 1 does not support this proposition at the industry level because the rates
generated by applying the 25 percent rule to EBITDA and EBIT margins fluctuate closely and persistently across industries.
Finally, the rates calculated from applying the 25 percent rule to operating margins are significantly below the reported rates for industries such as internet/software and media. This seems to corroborate Razgaitis (2002), who concludes that the actual percentages to be applied to operating margins can vary across
industries, and that for software and content licensing, even 50 percent is reasonable. Since the 25 percent rule was proposed some years ago, it could be possible that the rule better fits the licensing transactions in traditional industries but needs to be adjusted when applied to the so-called ‘new economy’ industries. As a result, when applying to patent- and IP rights-intensive industries such as software/internet and media, the percentage needs to be adjusted higher.
16.0%
14.0%
12.0%
10.0%
8.0%
6.0%
4.0%
2.0%
0.0%
Food
pro
c.
Elec
.
Chem
.
Auto
Sem
icon
.
Ener
gy
Mac
h/To
ol
Com
p/Eq
uip.
Tele
com
Med
ical
Cons
umer
Phar
m.
Inte
rnet
/SW
Med
ia/E
nt.
25% of EBITDAmargin
25% of grossprofit margin
Reportedroyaltyrate
25% of EBITmargin
Profitability and royalty rates across industries | 9
© 2012 KPMG International Cooperative (“KPMG International”), a Swiss entity. Member firms of the KPMG network of independent firms are affiliated with KPMG International. KPMG International provides no client services. All rights reserved.
CHART 1: REPORTED ROYALTY RATES VS. RATES FROM THE 25 PERCENT RULE
Sources: RoyaltySources, December 2007 and authors’ calculation based on CompuStat Research Insight CD-ROM, December, 2007
4. Royalty rate and profit margin
across industries If the reported royalty rates do not converge with the rates reached from applying the 25 percent rule to operating profit margins, the next question is: Is there any general linear relationship between royalty rates and profitability? As Goldscheider, et al. (2002), Smith and Parr (2004), and Parr (1999) have pointed
out, both direct manufacturing costs and operating expenses should be included in the royalty negotiations. If this is true, assuming the licensing market is efficient, we would expect to see that generally, the higher the profit margins, the higher the associated royalty rates.
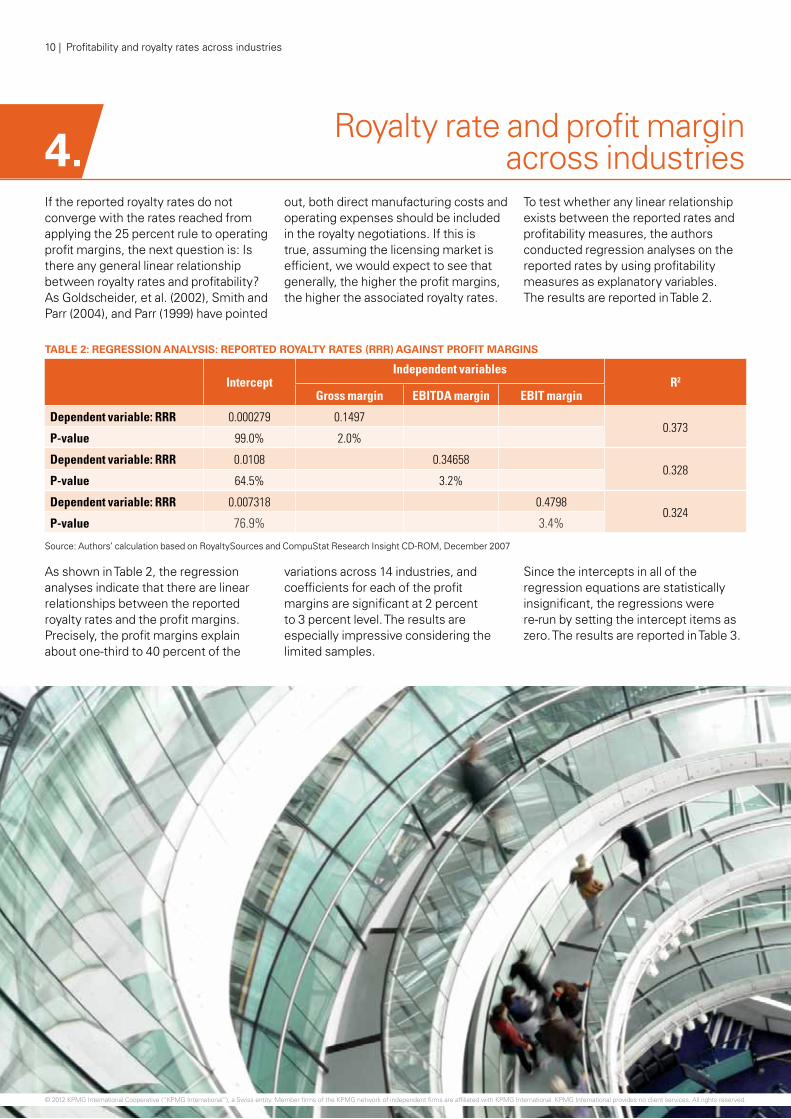
To test whether any linear relationship exists between the reported rates and profitability measures, the authors conducted regression analyses on the reported rates by using profitability measures as explanatory variables. The results are reported in Table 2.
TABLE 2: REGRESSION ANALYSIS: REPORTED ROYALTY RATES (RRR) AGAINST PROFIT MARGINS
Intercept
Independent variablesR2
Gross margin EBITDA margin EBIT margin
Dependent variable: RRR 0.000279 0.14970.373
P-value 99.0% 2.0%
Dependent variable: RRR 0.0108 0.346580.328
P-value 64.5% 3.2%
Dependent variable: RRR 0.007318 0.47980.324
P-value 76.9% 3.4%
Source: Authors’ calculation based on RoyaltySources and CompuStat Research Insight CD-ROM, December 2007
As shown in Table 2, the regression analyses indicate that there are linear relationships between the reported royalty rates and the profit margins. Precisely, the profit margins explain about one-third to 40 percent of the
variations across 14 industries, and coefficients for each of the profit margins are significant at 2 percent to 3 percent level. The results are especially impressive considering the limited samples.
Since the intercepts in all of the regression equations are statistically insignificant, the regressions were re-run by setting the intercept items as zero. The results are reported in Table 3.
10 | Profitability and royalty rates across industries
© 2012 KPMG International Cooperative (“KPMG International”), a Swiss entity. Member firms of the KPMG network of independent firms are affiliated with KPMG International. KPMG International provides no client services. All rights reserved.
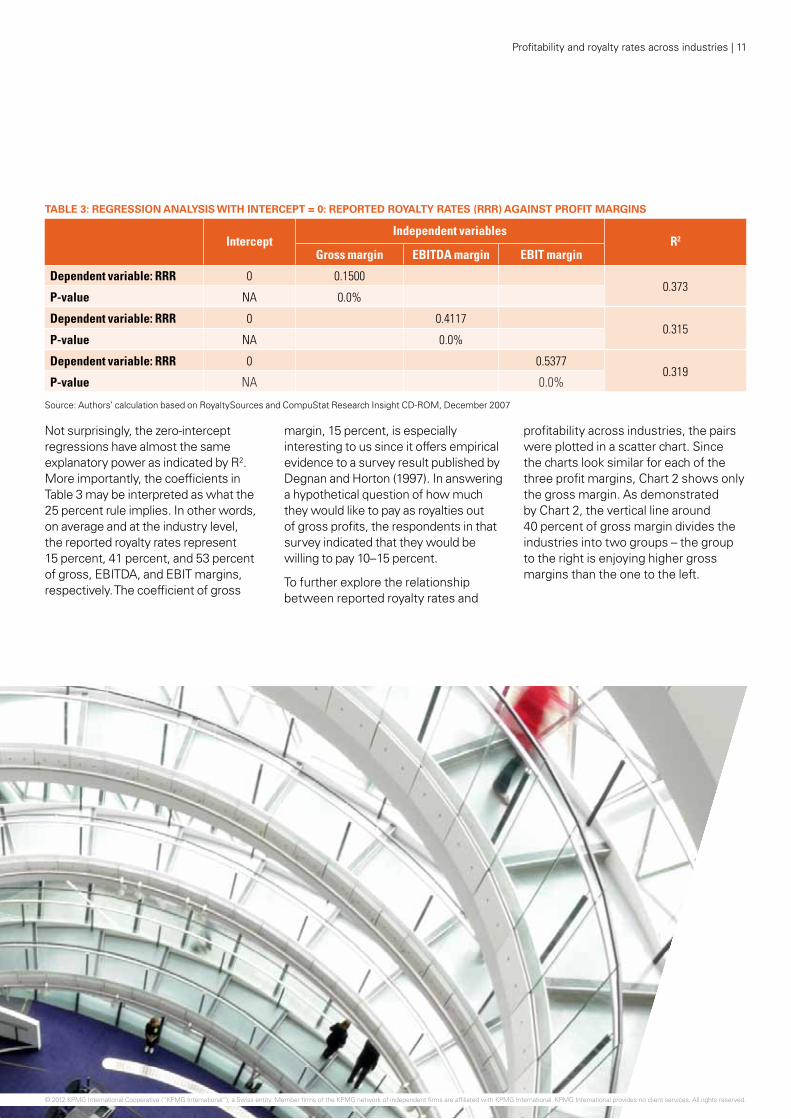
TABLE 3: REGRESSION ANALYSIS WITH INTERCEPT = 0: REPORTED ROYALTY RATES (RRR) AGAINST PROFIT MARGINS
Intercept
Independent variablesR2
Gross margin EBITDA margin EBIT margin
Dependent variable: RRR 0 0.15000.373
P-value NA 0.0%
Dependent variable: RRR 0 0.41170.315
P-value NA 0.0%
Dependent variable: RRR 0 0.53770.319
P-value NA 0.0%
Source: Authors’ calculation based on RoyaltySources and CompuStat Research Insight CD-ROM, December 2007
Not surprisingly, the zero-intercept regressions have almost the same explanatory power as indicated by R2. More importantly, the coefficients in Table 3 may be interpreted as what the 25 percent rule implies. In other words, on average and at the industry level, the reported royalty rates represent 15 percent, 41 percent, and 53 percent of gross, EBITDA, and EBIT margins, respectively. The coefficient of gross
margin, 15 percent, is especially interesting to us since it offers empirical evidence to a survey result published by Degnan and Horton (1997). In answering a hypothetical question of how much they would like to pay as royalties out of gross profits, the respondents in that survey indicated that they would be willing to pay 10–15 percent.
To further explore the relationship between reported royalty rates and
profitability across industries, the pairs were plotted in a scatter chart. Since the charts look similar for each of the three profit margins, Chart 2 shows only the gross margin. As demonstrated by Chart 2, the vertical line around 40 percent of gross margin divides the industries into two groups – the group to the right is enjoying higher gross margins than the one to the left.
Profitability and royalty rates across industries | 11
© 2012 KPMG International Cooperative (“KPMG International”), a Swiss entity. Member firms of the KPMG network of independent firms are affiliated with KPMG International. KPMG International provides no client services. All rights reserved.
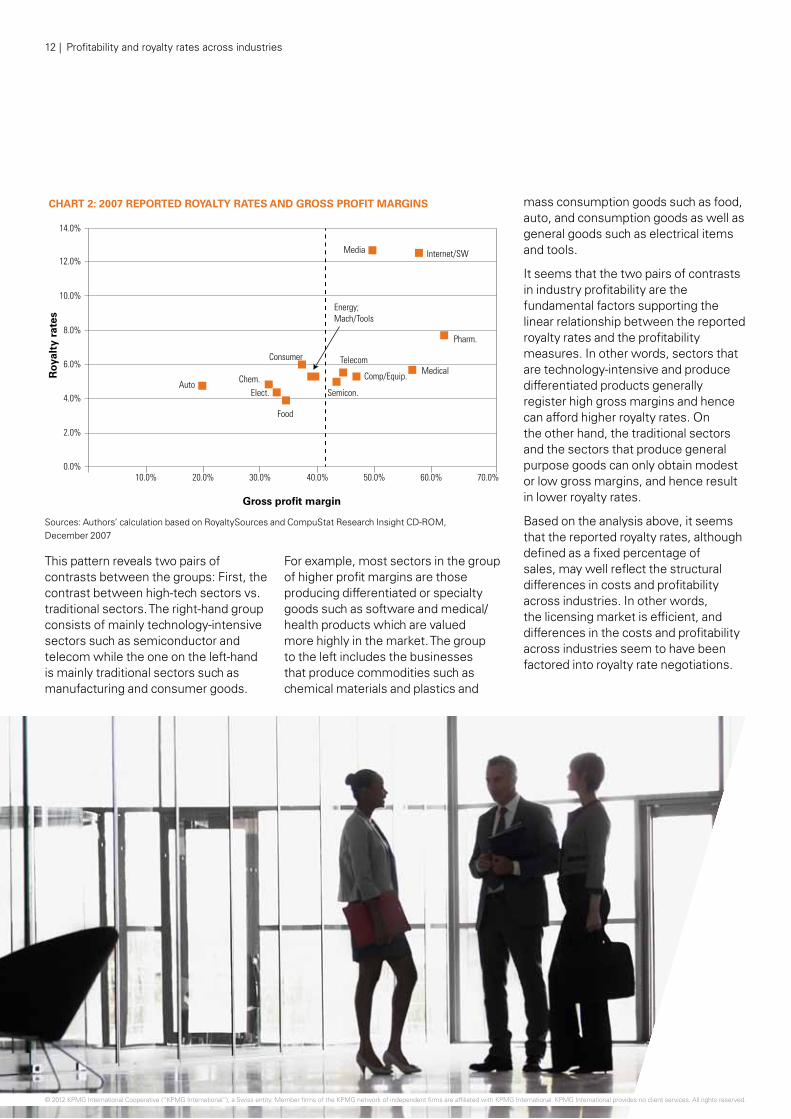
This pattern reveals two pairs of contrasts between the groups: First, the contrast between high-tech sectors vs. traditional sectors. The right-hand group consists of mainly technology-intensive sectors such as semiconductor and telecom while the one on the left-hand is mainly traditional sectors such as manufacturing and consumer goods.
For example, most sectors in the group of higher profit margins are those producing differentiated or specialty goods such as software and medical/health products which are valued more highly in the market. The group to the left includes the businesses that produce commodities such as chemical materials and plastics and
mass consumption goods such as food, auto, and consumption goods as well as general goods such as electrical items and tools.
It seems that the two pairs of contrasts in industry profitability are the fundamental factors supporting the linear relationship between the reported royalty rates and the profitability measures. In other words, sectors that are technology-intensive and produce differentiated products generally register high gross margins and hence can afford higher royalty rates. On the other hand, the traditional sectors and the sectors that produce general purpose goods can only obtain modest or low gross margins, and hence result in lower royalty rates.
Based on the analysis above, it seems that the reported royalty rates, although defined as a fixed percentage of sales, may well reflect the structural differences in costs and profitability across industries. In other words, the licensing market is efficient, and differences in the costs and profitability across industries seem to have been factored into royalty rate negotiations.
CHART 2: 2007 REPORTED ROYALTY RATES AND GROSS PROFIT MARGINS
14.0%
12.0%
10.0%
8.0%
6.0%
4.0%
2.0%
0.0%10.0% 20.0% 30.0% 40.0% 50.0% 60.0%
Semicon.
Pharm.
MedicalChem.Auto
Consumer
Media
Gross profit margin
70.0%
Roy
alty
rat
es
Elect.
Food
Energy;Mach/Tools
Comp/Equip.
Telecom
Internet/SW
Sources: Authors’ calculation based on RoyaltySources and CompuStat Research Insight CD-ROM, December 2007
12 | Profitability and royalty rates across industries
© 2012 KPMG International Cooperative (“KPMG International”), a Swiss entity. Member firms of the KPMG network of independent firms are affiliated with KPMG International. KPMG International provides no client services. All rights reserved.
5. Royalty rates and operating profit margins:
Revisit the data and Goldscheider, et al (2002) Goldscheider, et al. (2002) reported that, by matching the reported royalty rates with licensees’ operating profit margins, the median royalty rate of 347 companies converge with the royalty rate generated from applying the 25 percent rule to the weighted operating profit margin. This is certainly a very impressive result for a company level analysis.
However, matching the reported royalty rates with licensees’ operating profit data comes at the expense of data exclusion and information loss. First, a majority of reported royalty rates were excluded. According to Goldscheider, et al. (2002), at the time of their research, RoyaltySource reported 1,533 transactions, but matching the reported royalty rate data with licensees’ financials left only 347 companies for study. Also, the reduction in sample size made the sample much less industry-representative. Their research indicated that there were 6,309 companies with data for operating margin calculation. However, after the matching, only the data from 347 companies were used for analysis, leaving five out of the 15 industries with fewer than
10 samples (two of which had fewer than five samples).
Goldcheider, et al. (2002) calculated median royalty rates and operating margins for 15 industries although they did not conduct any further analysis at the industry level. By contrast, this research is more interested in the relationship between reported rates and profitability across industries. In this section, we will use the data sets reported by Goldscheider, et al. (2002) to conduct regression analyses similar to what was done in Section 4.
Goldscheider and his co-authors reported three pairs of royalty rates and operating profit margins for 15 industries,8 including:
i) Industry data: Include all transaction from the RoyaltySource, and weighted operating profit margins calculated from Bloomberg data. The authors did not use this data set to test the 25 percent rule, citing that “total industry profits are not a particularly close match to royalty rates covering a limited number of companies.”
ii) Licensee data: The royalty rates and weighted operating profit margins are matched for the set of licensee companies.
iii) Successful licensee data: Royalty rates are the same in Licensee Data, while the operating profit margin data is calculated based on only the successful licensees, defined as the licensees “with profit rates in the top quartile for each industries.”
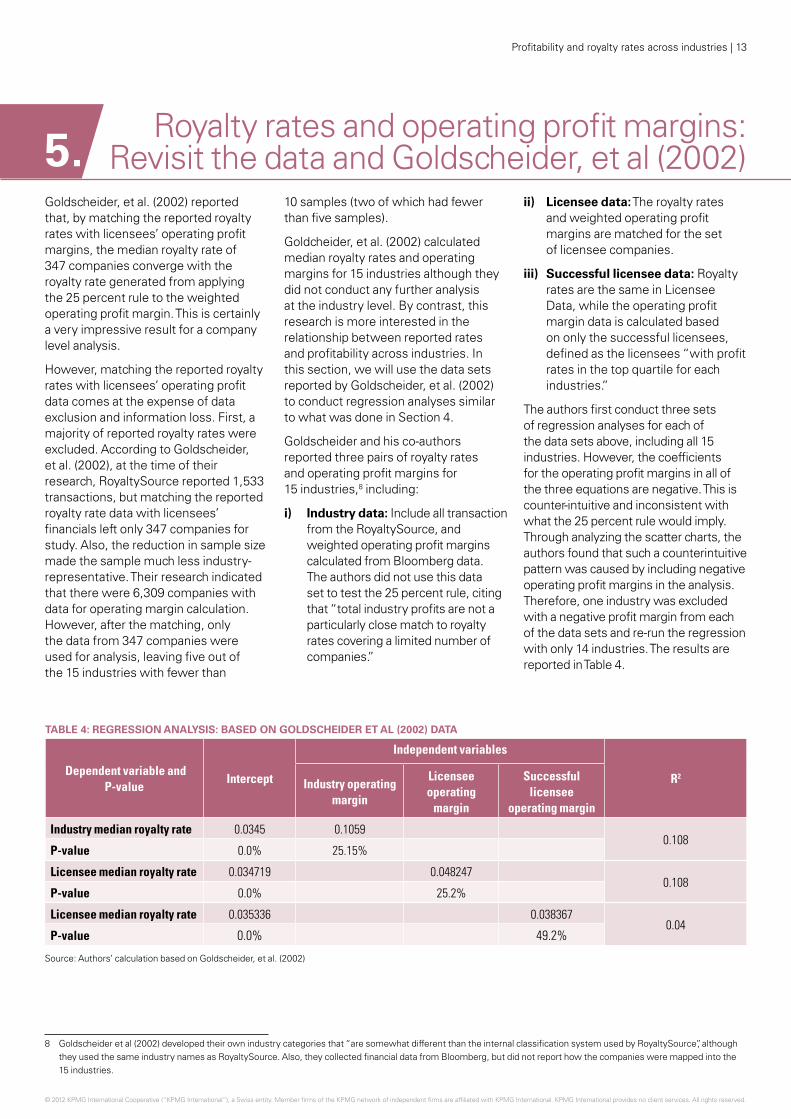
The authors first conduct three sets of regression analyses for each of the data sets above, including all 15 industries. However, the coefficients for the operating profit margins in all of the three equations are negative. This is counter-intuitive and inconsistent with what the 25 percent rule would imply. Through analyzing the scatter charts, the authors found that such a counterintuitive pattern was caused by including negative operating profit margins in the analysis. Therefore, one industry was excluded with a negative profit margin from each of the data sets and re-run the regression with only 14 industries. The results are reported in Table 4.
8 Goldscheider et al (2002) developed their own industry categories that “are somewhat different than the internal classification system used by RoyaltySource”, although they used the same industry names as RoyaltySource. Also, they collected financial data from Bloomberg, but did not report how the companies were mapped into the 15 industries.
TABLE 4: REGRESSION ANALYSIS: BASED ON GOLDSCHEIDER ET AL (2002) DATA
Dependent variable and P-value
Intercept
Independent variables
R2Industry operating
margin
Licensee operating
margin
Successful licensee
operating margin
Industry median royalty rate 0.0345 0.10590.108
P-value 0.0% 25.15%
Licensee median royalty rate 0.034719 0.0482470.108
P-value 0.0% 25.2%
Licensee median royalty rate 0.035336 0.0383670.04
P-value 0.0% 49.2%
Source: Authors’ calculation based on Goldscheider, et al. (2002)
Profitability and royalty rates across industries | 13
© 2012 KPMG International Cooperative (“KPMG International”), a Swiss entity. Member firms of the KPMG network of independent firms are affiliated with KPMG International. KPMG International provides no client services. All rights reserved.© 2011 KPMG International Cooperative (“KPMG International”). KPMG International provides no client services and is a Swiss entity with which the independent member firms of the KPMG network are affiliated. All rights reserved.
9 Chart 3 is based on the Licensee Data, excluding Median and Entertainment that was reported to have an operating profit margin of -304.5 percent. Charts with Industry Data and Successful Licensees Data are similar to Chart 3.
Dependent variable and P-value
Intercept
Independent variables
R2Industry operating
margin
Licensee operating
margin
Successful licensee
operating margin
Industry median royalty rate 0 0.3706–0.65
P-value NA 0.0%
Licensee median royalty rate 0 0.223821–1.9231
P-value NA 0.0%
Licensee median royalty rate 0 0.225259–1.096
P-value NA 0.0%
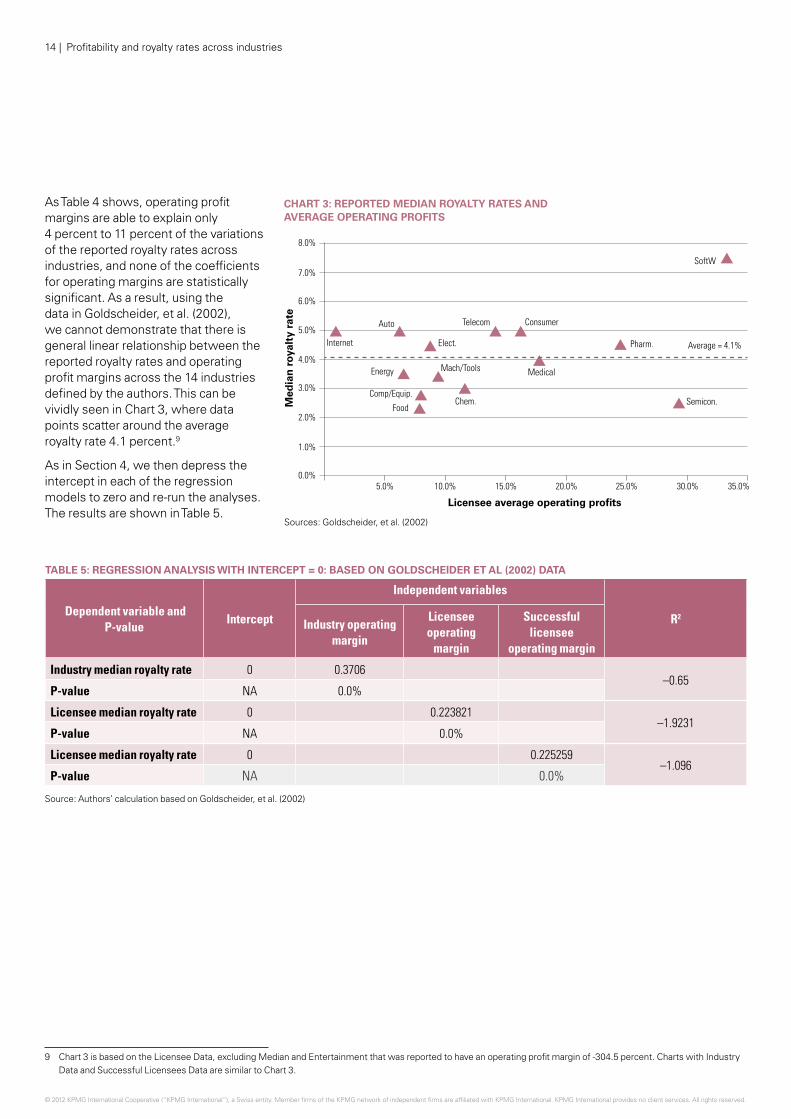
As Table 4 shows, operating profit margins are able to explain only 4 percent to 11 percent of the variations of the reported royalty rates across industries, and none of the coefficients for operating margins are statistically significant. As a result, using the data in Goldscheider, et al. (2002), we cannot demonstrate that there is general linear relationship between the reported royalty rates and operating profit margins across the 14 industries defined by the authors. This can be vividly seen in Chart 3, where data points scatter around the average royalty rate 4.1 percent.9
As in Section 4, we then depress the intercept in each of the regression models to zero and re-run the analyses. The results are shown in Table 5.
CHART 3: REPORTED MEDIAN ROYALTY RATES AND AVERAGE OPERATING PROFITS
8.0%
7.0%
6.0%
5.0%
4.0%
3.0%
2.0%
1.0%
0.0%5.0% 10.0% 15.0% 20.0% 25.0% 30.0%
Semicon.
Pharm.
Medical
Chem.
Mach/Tools
Food
Energy
Internet
Auto Telecom Consumer
Elect.
SoftW
Comp/Equip.
Average = 4.1%
Licensee average operating profits
35.0%
Med
ian
roy
alty
rat
e
Sources: Goldscheider, et al. (2002)
14 | Profitability and royalty rates across industries
TABLE 5: REGRESSION ANALYSIS WITH INTERCEPT = 0: BASED ON GOLDSCHEIDER ET AL (2002) DATA
Source: Authors’ calculation based on Goldscheider, et al. (2002)
© 2012 KPMG International Cooperative (“KPMG International”), a Swiss entity. Member firms of the KPMG network of independent firms are affiliated with KPMG International. KPMG International provides no client services. All rights reserved.
A couple of interesting conclusions can be drawn from reading the table. First, the R2 for each of the regression models is negative, which means a linear model without intercept does not fit the data and that there is no linear relationship between the reported rates and operating profit margins. This is simply another way to say that the average of the median royalty rates, or the horizontal line at 4.1 percent in
Chart 3, fits better than the regression equations.
Second, by “forcing” a linear fitting with a zero intercept, regression models based on the data set (ii) and (iii) indicate that the reported royalty rates, on average, amount to about 22.5 percent of the weighted operating profit margins. The 22.5 percent number seems to be close to the
26.7 percent number calculated from company-level data in Goldscheider, et al. (2002), and both numbers seem to lend support to the 25 percent rule. However, because there exists no linear relationship between the reported royalty rates and the operating profit margins, the results from such an “imposed” fitting should be taken as for the purpose of illustration and contrast only.
Profitability and royalty rates across industries | 15
© 2012 KPMG International Cooperative (“KPMG International”), a Swiss entity. Member firms of the KPMG network of independent firms are affiliated with KPMG International. KPMG International provides no client services. All rights reserved.
6. Discussions and conclusions This paper reaches three important conclusions. First, the reported royalty rates across industries do not converge with the rates generated by the 25 percent rule at industry level, although they generally fall between 25 percent of gross profit margins and 25 percent of operating profit margins. Also, the EBITDA margin seems to be a more reasonable base upon which to apply the 25 percent rule compared to gross margin and EBIT margin.
Second, there is a linear relationship between the reported royalty rates and three profitability measures. As shown in Section 4, the reported royalty rates account for 15 percent, 41 percent, and 53 percent of gross, EBITDA, and EBIT margins, respectively. Such a linear relationship suggests that the licensing market is efficient and cost structure and profitability across industries have been factored into royalty rate negotiations. The 25 percent rule of thumb is simply a special case of such general linear relationship.
Finally, for the purpose of illustration and contrast, the author’s conducted further analyses on the data published in Goldscheider, et al. (2002). In a “forced” linear fitting between the reported royalty rates and operating margins, the coefficients for the operating margins are about 23 percent, offering some support to the 25 percent rule. However, the reliability of such a conclusion is tempered by the extent and treatment of the data as discussed in Section 5.
There are at least three areas that are worth further research efforts.
The research in this paper covers only 14 industries, a very limited size of sample. Further research may focus on collecting royalty rate and financial data for more industry sectors, which, hopefully, will increase the sample size and make the research more robust and reliable. Also, it will be very interesting to conduct regression analysis using company level data, such as the data sets in Goldscheider, et al. (2002). While matching will inevitably reduce the sample size and render the sample less industry-representative, studying company level data should reveal additional insights.
Finally, as mentioned in Section 2, the analyses in this paper are based only on the data as published in the December 2007 issue of LER. Royalty Source only publishes data for 15 industries although it collects much more licensing transaction data then it actually reports. There are many licensing transactions with royalty payments in either unit running rates, percentages of certain profit measures, or simply lump sum. It is highly possible that by including more industries and by converting non-sales-based royalty payments into sales-based ones, the number of observations can be dramatically increased such that the analysis will be more comprehensive and reliable. Such a research effort will be able to reveal more than what has been possible from this paper and lead to more robust and reliable conclusions on the 25 percent rule.
16 | Profitability and royalty rates across industries
© 2012 KPMG International Cooperative (“KPMG International”), a Swiss entity. Member firms of the KPMG network of independent firms are affiliated with KPMG International. KPMG International provides no client services. All rights reserved.

Profitability and Royalty Rates Across Industries | 17
© 2012 KPMG International Cooperative (“KPMG International”), a Swiss entity. Member firms of the KPMG network of independent firms are affiliated with KPMG International. KPMG International provides no client services. All rights reserved.
ReferencesBattersby, Gregory J. and Grimes, Charles W., Licensing Royalty Rates, 2001 Edition, Aspen Law and Business, New York, 2001.
Degnan, Stephen A. and Horton, Corwin, “A Survey of Licensed Royalties,” les Nouvelles, June 1997, 91-96.
Goldscheider, Jarosz, and Mulhern, “Use of the 25 Per Cent Rule in Valuing IP,” les Nouvelles, December 2002, 123-133.
Goldscheider, Robert, Technology Management: Law/Tactics/Forms, West Group, St. Paul, MN, 2001.
Granstrand, Ove, “Fair and Reasonable Royalty Rate Determination – When is the 25% Rule Applicable?” les Nouvelles, September 2006, 179-181.
Hagelin, Ted, “Valuation of Patent Licenses,” Texas Intellectual Property Law Journal, Vol. 12, 2004, 423-441.
“Industry Royalty Rate Data Summary,” Licensing Economics Review, Vol. 6, December 2007, 6-7.
Jousma, Harmen, “Considering Pharmaceutical Royalties,” les Nouvelles, June 2005, 65-77.
Parr, Russell L., Intellectual Property Infringement Damages: A Litigation Support Handbook, 2nd Edition, John Wiley and Sons, Inc., Somerset, NJ, 1999.
Parr, Russell L., Royalty Rates for Licensing Intellectual Property, John Wiley and Sons, Inc., Hoboken, NJ, 2007.
Razgaitis, Richard, “Chapter 2: Technology Valuation,” in The LESI Guide to Licensing Best Practices: Strategic Issues and Comtemporary Realities, Edited by Robert Goldscheider, John Wily and Sons, Inc., New York, 2002.
Razgaitis, Richard, Early Stage Technologies: Valuation and Pricing, John Wiley and Sons, Inc., New York, 1999.
Smith, Gordon V. and Parr, Russell L., Intellectual Property: Licensing and Joint Venture Profit Strategies, 3rd Edition, John Wiley and Sons, Inc., Hoboken, NJ, 2004.
Smith, Gordon V. and Parr, Russell L., Valuation of Intellectual Property and Intangible Assets, 3rd Edition, John Wiley and Sons, Inc., New York, 2000.
18 | Profitability and royalty rates across industries
© 2012 KPMG International Cooperative (“KPMG International”), a Swiss entity. Member firms of the KPMG network of independent firms are affiliated with KPMG International. KPMG International provides no client services. All rights reserved.
Appendix
Profitability and royalty rates across industries | 19
© 2012 KPMG International Cooperative (“KPMG International”), a Swiss entity. Member firms of the KPMG network of independent firms are affiliated with KPMG International. KPMG International provides no client services. All rights reserved.
Industry classification: RoyaltySource system vs. SIC code
RoyaltySource classification 4-digit SIC codes # of companies
Automotive 3710-3716 96
Chemicals 2800-2824 2840-3089 316
Computer and office equipment 3570-3579 155
Consumer goods, retail and leisure
2300-2399 2500-2519 3100-3199 3630-3639 3650-3652 3900-3999 204
Electrical and electronics 3600 3640-3648 3670-3671 3675-3699 126
Energy and environment 1200-1389 3510-3519 3533 3610-3629 395
Food processing 2000-2099 154
Internet and software 7370-7375 712
Machines and tools 3500 3520-3532 3534-3569 3580-3599 3800-3829 3860-3873 380
Media and entertainment 2710-2741 4830-4841 7810-7819 157
Medical and health products 3840-3851 245
Pharmaceuticals and 2830-2836 555biotechnology
Semiconductors 3672-3674 206
Telecom (excluding media) 3660-3669 186
Grand total 3887

Contact us
Global Leader
Doug McPhee Tel: +44 20 7311 8524 [email protected]
Country Leaders
Argentina Gabriel G. TairaTel: +54 11 4891 [email protected]
Australia Ian Jedlin Tel: +61 (2) 9335 8207 [email protected]
Austria Klaus Mittermair Tel: +43 732 6938 2151 [email protected]
Bahamas Simon Townend Tel: +1 242 393 2007 [email protected]
Bahrain and Qatar CN Ramachandran Tel: +973 17 224 807 [email protected]
BarbadosLisa TaylorTel: +1 246 434 [email protected]
Belgium* Jorn de Neve Tel: +32 2 708 4778 [email protected]
Brazil Cláudio Ramos Tel: +55 11 3245 8313 [email protected]
Canada Susan H. Glass Tel: +1 416 777 3315 [email protected]
China/Hong Kong Janet Cheung Tel: +852 2140 2818 [email protected]
Czech Republic Jaromir Horejsi Tel: +420 222 123 128 [email protected]
Finland Mikko Palmu Tel: +358 20 760 3405 [email protected]
France Jean-Florent Rerolle Tel: +33 1 5568 8666 [email protected]
Germany* Gertraud Dirscherl Tel: +49 89 9282 1200 [email protected]
Dr Marc Castedello Tel: +49 89 9282 1145 [email protected]
Greece Athanasios Tsotsoros Tel: +30 210 6052121 [email protected]
Hungary Andrea Sartori Tel: +36 18 877 215 [email protected]
Iceland Benedikt Magnússon Tel: +354 545 6236 [email protected]
India Nandini Chopra Tel: +91 (22) 3090 2603 [email protected]
Ireland Steven Spillane Tel: +353 1 410 1276 [email protected]
Israel Avivit Ben-simchon Tel: +972 3 684 8000 [email protected]
Italy Simone Maurizio Tel: +39 02 6764 31 [email protected]
JamaicaRaymond CampbellTel: +1 876 922 [email protected]
Japan Takako Iwata Tel: +81 3 5218 6704 [email protected]
Korea Ho Seung (Henry) Son Tel: +82 (2) 2112 0717 [email protected]
Kuwait* Anindya Roychowdhury Tel: +965 2247 5090 [email protected]
Luxembourg* Yves Courtois Tel: +352 22 51 51 7503 [email protected]
Malaysia Ooi Woon Chee Tel: +603 2095 3388 [email protected]
Mexico Federico Hernandez Tel: +52 55 5246 8620 [email protected]
Netherlands* Jeroen Weimer Tel: +31 20 656 7469 [email protected]
New Zealand Justin Ensor Tel: +64 9 367 5934 [email protected]
Nigeria Kunle Elebute Tel: +234 1 271 0534 [email protected]
Norway* Håkon StensrudTel: +47 40 63 92 [email protected]
Philippines Michael Arcatomy Guarin Tel: +63 (2) 885 7000 ext: 347 [email protected]
Poland Tomasz Wisniewski Tel: +48 22 528 12 19 [email protected]
Portugal Jose Silva Tel: +351 21 011 01 60 [email protected]
Romania Adrian Vascu Tel: +40 372 377 884 [email protected]
Russia and the CIS* John Kallaway Tel: +7 (495) 7716 457 ext:[email protected]
Saudi Arabia* Islam Al Bayaa Tel: +966 1 874 8707 [email protected]
Singapore Vishal Sharma Tel: +65 6213 2845 [email protected]
South Africa Neeraj Shah Tel: +27 11 647 7825 [email protected]
Spain* Ana Martinez Ramon Tel: +34 91 456 34 70 [email protected]
Sweden Martin Ericsson Tel: +46 (8) 7239829 [email protected]
Switzerland* Johannes Post Tel: +41 44 249 23 74 [email protected]
Thailand Kasemsarn Tanate Tel: +66 2677 2750 [email protected]
Turkey* Hande Senova Tel: +90 21 2317 7400 ext: 445 [email protected]
UAE Elias Daou Tel: +971 2 401 4867 [email protected]
United Kingdom* Heather Gray Tel: +44 20 7311 8578 [email protected]
United States Jordan Lamm Tel: +1 312 665 2263 [email protected]
Vietnam Franz Degenhardt Tel: +84 8 3821 9266 ext: [email protected]
* Part of KPMG Europe LLP
kpmg.com/socialmedia kpmg.com/app
The information contained herein is of a general nature and is not intended to address the circumstances of any particular individual or entity. Although we endeavor to provide accurate and timely information, there can be no guarantee that such information is accurate as of the date it is received or that it will continue to be accurate in the future. No one should act on such information without appropriate professional advice after a thorough examination of the particular situation.
Any trademarks identified in this publication are the property of their respective owner(s).
© 2012 KPMG International Cooperative (“KPMG International”), a Swiss entity. Member firms of the KPMG network of independent firms are affiliated with KPMG International. KPMG International provides no client services. No member firm has any authority to obligate or bind KPMG International or any other member firm vis-à-vis third parties, nor does KPMG International have any such authority to obligate or bind any member firm. All rights reserved.
The KPMG name, logo and “cutting through complexity” are registered trademarks or trademarks of KPMG International.
Designed by Evalueserve. Publication name: Profitability and royalty rates across industries: Some preliminary evidence.
Publication number: 120985. Publication date: November 2012