krause fund research | spring 2016 consumer staples … · krause fund research | spring 2016...
TRANSCRIPT

Importantdisclosuresappearonthelastpageofthisreport.
1
KrauseFundResearch|Spring2016 ConsumerStaples
Recommendation:HOLD
Analysts
KolRath [email protected] [email protected]
CompanyOverviewThe Boston Beer Company is one of the largest craftbrewers in the U.S. Boston Beer manufacturers and sellscraft beer, flavored malt beverages, and hard ciders,primarily in the domesticmarket. Founded in 1984 by C.James Koch and headquartered in BostonMassachusetts,BostonBeersoldover120differentkindsofbeerin2015.Boston Beer’s most popular brands include: SamuelAdams,TwistedTea,andAngryOrchard.Forthefiscalyearended12/26/15,totalrevenuesrose6%to$1.024billion.1
StockPerformanceHighlights
52-WeekHigh $270.00
52-WeekLow $160.84
Beta 0.86
ShareHighlights
MarketCapitalization $2.30B
SharesOutstanding 12.83M
BookValuepershare $36.33
EPS(2015) $7.46
P/ERatio(ttm) 24.8
DividendYield NA
CompanyPerformanceHighlights
ROA 15.74%
ROE 21.93%
ROIC 22.11%
Sales $1.024B
FinancialRatios
CurrentRatio 2.01
GrossMargin 52.26%
TheBostonBeerCo.(NYSE:SAM) May1,2016
CurrentPrice:$156.08TargetPrice:$156-160
BostonBeerCo.StrugglestoRecapture
PreviousGrowth • Driven by trends in consumer preferences and agingmillennials,weexpectthecraftbeercategorytocontinueto increase itsmarket share of the overall beer industry.TheBostonBeerCompany’sabilitytotapintothisgrowthwell enough to recapture previous levels of revenuegrowthdependsonthecompany’sabilitytomakestrategicacquisitionsanddevelopandmarketinnovativeproducts.• Withrevenuegrowthfallingto6%in2015from22%and27%in2014and2013,respectively,theBostonBeerCo.issuffering from a loss ofmarket share to small, local craftbreweries.
• Large producers, such as the Boston Beer Co. strugglewith being perceived as too mainstream or unauthentic.These producers must develop strategies to disconnecttheirbignamesfromtheirproductsandearntheloyaltyofcustomers.
• Continued concerns of alcohol abuse make thepossibilityoffederalandstateexcisetax increasesa likelyevent in the near future, putting downward pressure onthebottomlineofcompaniesliketheBostonBeerCo.
Source:Bloomberg

Importantdisclosuresappearonthelastpageofthisreport.
2
ExecutiveSummary
EconomicAnalysis
We are initiating our coverage of the Boston BeerCompany with a HOLD rating. Shares are currentlytradingata levelthatwefeel isneitherovervaluednorundervalued.Whilewefeel that theBostonBeerCo. iswell-positioned in the craft beer industry, we areuncertainofthecompany’sabilitytoregainlostmarketshare and successfully market new products to craftbeerdrinkerswhoperceiveproductsfromlargebrewersasmainstreamandunauthentic.
GrossDomesticProduct(GDP)As a key measurement of economic growth,expectationsforGDPcanbeobservedasanindicatoroffuture performance within the alcoholic beveragesindustry, and specifically for the Boston Beer Co. As aproducer of specialty beers that are pricier than otherproducts in the beer industry, the Boston Beer Co.’srevenuetendstobemoreprocyclic thantheconsumerstaplessectorasawhole,andthushasastrongpositiverelationshipwithGDP.
Real GDP increased 2.4% in 2015, the same rate as in2014.Most recentdata (fourthquarterof2015)showsGDPincreasedatanannualrateof1.4%,downfrom2%inthethirdquarterof2015.2Whilethesefiguresshowarelatively stable, sluggish trend in economic growth,consumerspendinghasbeenanunderlying strengthoftotalrealGDP.
IntheshorttermweexpectrealGDPgrowthtoremainrelativelystable,ataround2.1%in2016.Lookingout2-3 years we predict real GDP growth to be consistentwithperformanceinrecentyears,atroughly2.6%.
Source:U.S.BureauofEconomicAnalysis
UnemploymentSimilar toGDP, low levelsofunemploymentcontributetoincreasedsalesinthealcoholicbeveragesindustry.Asmore people become employed, disposable income inthe economy increases. This increase enablesconsumers to spend more dollars on non-essentialitems, such as craft beer. On the other hand, whenunemployment rises beer drinkers may choose topurchasecheaperbrandsortogiveupdrinkingalcoholicbeveragesalltogether.
Unemployment levels have been steadily decreasingoverthepastseveralyearsandhavelingeredaround5%for almost a year.3 We expect the level ofunemployment to remain at roughly 5% in the shortterm. Over the next 2-3 years we predict theunemployment rate will decrease to 4.5% as GDPrecoverstoperformancelevelsseeninrecentyears.
Source:U.S.BureauofLaborStatistics
CommodityPricesRawmaterials, such as hops,malt, barley, and apples,accountforasubstantialportionofthecostsassociatedwith brewing craft beers and hard ciders.1 The BostonBeer Co. purchases these materials from both foreignanddomesticsuppliers.Whilepricesofcommodities ingeneral have been low, demand for the mentionedmaterials has increased in recent years due to positivegrowthinthecraftbeermarket.Weexpectthistrendtocontinue, thus increasing demand for these rawmaterials and thereby increasing input cost in theindustry.
InflationAs prices increase it can be difficult for producers topass increasedproduction costdown to the consumer.When this occurs, the profit margins of the producershrink.Inaddition,inflationcandiminishthepurchasing

Importantdisclosuresappearonthelastpageofthisreport.
3
IndustryAnalysis
power of consumers if wage growth doesn’t coincide,therebydecreasingdisposableincome,andpurchasesofspecialty products, such as craft beer. Finally, theFederal Reserve uses inflation statistics as a keyindicator of the health of the economy. An increase ininflationmayprompttheFedtoraisethefederalfundsrate, making borrowing more expensive. While theBostonBeerCompanycurrentlydoesnotutilizedebt,anincreaseinthecostofdebtcouldhindertheirabilitytodosointhefuture.
The inflation rate has been falling since 2011, with aslightuptickin2016;bothJanuaryandFebruaryof2016saw upward pressure. Core CPI in February was 2.3%,above the 2%mark the Fed likes to see before raisingrates.3Weexpect inflationratesto lingeraround1% intheshortterm,andtoincreasetoaround3%inthenext2-3yearsasoilprices reboundandconsumerspendingcontinuestoincrease.
Source:U.S.BureauofLaborStatistics
The craft beer market comprises 12% of the beerindustry,anindustryclassifiedinthebeveragessegmentof the consumer staples sector.4 To qualify as a craftbreweracompany’sannualproductionmustnotexceedsixmillion barrels and the companymust not bemorethan25%ownedorcontrolledbyanalcoholicbeverageindustrymemberthatisnotinitselfacraftbrewer.4TheBoston Beer Co. qualifies as a craft brewer under thementionedcriteria,however,giventhesizeandproductmix of the Boston Beer Co., itmakes sense to analyzethe company both in the context of the craft beerindustryandintheoverallbeerindustry.
IndustryTrendsThecraftbeermarkethasexperiencedsuccessinrecentyears, growing 19% per year on average over the pastfive years.5 At the same time the overall beer markethas been stagnate, with overall production fallingslightly,duetoincreasedcompetitionfromthewineandspirits category, and less alcohol consumption byconsumers.Thegrowthinthecraftbeermarketcanbeattributed to changing customer preferences andshiftingdemographics.Millennials,whomakeupabouttwenty-fivepercentofthetotalU.S.populationandtheentirety of the coveted 21-35 year old beer drinkerssegment, have been the key driver of the increasedpopularity of craft beer. We expect this agedemographic to continue to drive growth in the craftbeer market as more millennials become of legaldrinking age and secure incomes suitable for theconsumption of pricier beer. As the popularity of craftbeer continues to grow, so toowill itsmarket share intheoverallbeer industry,nowstandingat roughly21%intermsofdollarsales.4
Source:U.S. Department of the Treasury, Alcohol and Tobacco TaxandTradeBureau;IBISWorld
In addition to increased popularity of craft beer, thebeerindustryhasbeenexperiencingtheintroductionofnew products such as hard tea, hard cider, hard soda,and most recently, hard water. These easy to drink,alcoholic beverages aim to capture the attention ofmillennials.
Acquisitionshavebeenverypopularinthebeerindustryrecentlyandshownosignsofslowingdown.Largebeerproducershavebeenacquiring craftbreweries left andright, trying to cash in on the growthof the craft beermarket. We will discuss acquisitions further insubsequentsections.

Importantdisclosuresappearonthelastpageofthisreport.
4
CompetitiveOutlookAs shown in the chart below, the U.S. beer market isdominated by two companies: Anheuser-Busch InBevandMillerCoors.Anheuser-Busch InBevcontrolsalmosthalfofthedomesticbeermarket,sellingbrandssuchasBudLight,Budweiser,MichelobUltra,StellaArtois,etc.11Anheuser-Busch InBev is currently in the process ofacquiring the second largest brewer in the world,SABMiller, for $108 billion.12 Completion of thisacquisition would give Anheuser-Busch InBev adominantpresenceinnearlyeverymajormarketandanestimated 28.4% market share world-wide afterexpecteddivestitures.13Miller Coors is a joint venture,58% owned by London based SABMiller, and 42%owned by Denver basedMolson Coors.14 Miller Coorsownsroughlyone-thirdoftheU.S.beermarket,sellingbrandssuchasCoorsBanquet,CoorsLight,BlueMoon,Keystone, etc.15 Molson Coors announced plans toacquire the remaining ownership ofMiller Coors fromSABMiller for $12 billion.14 These plans could bedisturbed by Anheuser-Busch InBev’s plans to acquireSABMillerbytheendof2016.
Company U.S.MarketShare
Anheuser-BuschInBev 45%MillerCoors 26%PabstBrewingCompany 3%BostonBeerCo. 1%D.G.Yuengling&SonInc. 1%
Source:StatistaThe two largestAmericancraftbrewersare theBostonBeer Co. and D.G. Yuengling & Son Inc. Each of thesecompaniescontroljustoveronepercentofthedomesticbeermarketandroughly19%ofthecraftbeermarket.4Yuengling&SonInc.,theoldestbreweryinAmerica,isaprivate,family-ownedcompany.
The growth experienced by the craft beer market hascomeat the cost of increased competition. In theirQ42015earningscall,managementattheBostonBeerCo.stated:“Webelievewehavelost(market)share,asnewcraftbrewersenter themarketandmoreexisting craftbrewers are expanding their regional distribution,withthe result that drinkers are seeing more choices,including a wave of new beers in all markets.6 Themajority of new craft brewers are small, privatelyowned,regionaloperations.Theseoperationshavethe
benefit of local market loyalty and they produceproducts thatareperceivedasmoreauthenticby craftbeer drinkers, while larger companies, such as theBoston Beer Co. struggle with being perceived as toomainstream. Large companies, like Boston Beer, areusingstrategies(whichwillbediscussedinthefollowingsection)tocombatthisproblem. Inaddition, importedbeers, such as Corona, HeinekenandModelo Especial,continue to compete aggressively in the United Statesandhavegainedmarketshareoverthelasttenyears.1
Source:Statista
Beerproducerscompetewithinathree-tierdistributionsystem. Companies compete for a share of thedistributor’sattention, timeandsellingefforts. In retailestablishments,companiescompeteforshelf,coldbox,andtapspace.Fromadrinkerperspective,competitionexists for brand acceptance and loyalty.1 Becausedistributors also distribute competitors’ products,negotiating contracts is a common practice whenestablishing andmaintaining a competitive distributionnetwork.Distributioncontractsimposerequirementsondistributors that are intended to maximize thedistributors’ attention, time and selling efforts on thebrewer’sproducts.1
CatalystforGrowthAs small craft brewers continue to drive the growthofthe craft beer segment’s market share in the overallbeermarket, larger producersmust develop strategiesto tap into that growth. Large companies have beendoingthisbycreatingnewproductsandacquiringsmallcraft breweries. The difficulty with creating newproducts is the struggle of disconnecting the productfrom the large company. Craft beer drinkers oftenregard a product as too mainstream or unauthenticwhen produced by a large beer manufacturer, andprefertoconsumeproductsfromsmall,localbrewers.
0 400 800 1200 1600 2000
KeystoneLightMillerHighLifeNaturalLight
MichelobUltraLightBuschLightBudweiserMillerLightCoorsLightBudLight
2015U.S.BeerSales($M)byBrand

Importantdisclosuresappearonthelastpageofthisreport.
5
CompanyAnalysis
Acquisitionshavebeenakeystrategyincombatingthisproblem. Anheuser-Busch InBev for example,announced in December of 2015 that they would bepurchasing three more craft breweries, bringing theirtotal craft brewery portfolio to eight companies.7 TheBoston Beer Co. has used its subsidiary, Alchemy &Science, to create and acquire a number of smallbreweries, including, Angel City Brewery, ConcreteBeachBrewery, andConey IslandBrewery.1Weexpectthis trend of acquisitions to continue as the craft beersegment continues to grow and the cost of capitalremainslow.
Source:FactSet
GeneralOverviewTheBostonBeerCo. (SAM)was founded in 1984byC.JamesKoch. Thecompany isheadquartered inBoston,Massachusetts and owns breweries in four additionalstates. Having experienced tremendous success, thecompany laterwentontobecomepublic in1995.SAMstock has increased roughly 800 percent since thecompany’s initial public offering. The Company’sbusiness goal is to become the leading supplier in theBetter Beer and hard cider categories by creating andofferinghighqualityfull-flavoredbeersandhardciders.1
OwnershipThe founderandChairman,C. JamesKoch,holds100%ownership of the Boston Beer Co.’s Class B CommonStockand28.7%ofthecompany’stotalstock.1Companydecisions including the compositions of the board ofdirectors and other significant decisions have to beapprovedbyClassBCommonStockshareholders.ThisgivesMr.Kochsubstantialcontrolandgovernanceoverthecompanydirection.
Boston Beer has slightly increased shares outstandingfrom2014to2015buthasrecentlyseenadecreaseofholdings in many of its largest share. 87% of thecompany’s Class A shares are held by institutionalinvestorsandmutualfunds,and7.4%ofsharesareheldby insiders. In the past sixmonths, there has been an18% decrease in the shares held by insiders and a 4%decreaseininstitutionalshareholders.10FinancialSummaryBoston Beer saw an increase in net income of $7.7million to $98.4 million, up 8.5% from 2014 sales of$90.7 million. This increase was largely due to a 2.6%increase in revenue per barrel and a 3.6% increase ofthe company’s core brands shipment volumes. Thecompany’sgrossprofitmarginslightlyincreasedby0.8%to52.3%in2015.1
BostonBeerhasseenanaveragegrowthinnetrevenueof15.9%overthepastfiveyears,butgrowthslowedto6.3%from2014to2015.Totaloperatingexpenseshaveincreasedconsistentlyyear-after-year,slightlyundertheaverage growth of net revenue. This is mainly due toadditional advertising and promotions which can beeludedtotheconsistent increase incompetitionwithinthecraftbeermarket.
Source:YahooFinanceProductsandMarketsThe Boston Beer Co. generates the majority of itsrevenue by selling alcoholic beverages, which itconsiderstobeofthe“BetterBeer”productscategory.The Better Beer category includes craft beers andimported beers. According to the company’s annualreport, these beers are considered to be of superiorquality, image and taste, and thus have the ability togenerate higher revenue per barrel compared totraditionaldomesticlagers.TheBostonBeerCo.breaksdownitsproducts intotwocategories,corebrandsandnon-corebrands.Lessthanonepercentofthecompany’srevenuecanbeattributed
Date Acquirer Acquired Value(M)
Mar'14Anheuser-BuschInBev OrientalBrewingCo. $5,632
Jun'13ConstellationBrands
CompaniaCerveceradeCoahuila 2,900
Jun'13 Anheuser-BuschInBev
GrupoModelo 17,617
Jun'12 MolsonCoorsStarbevManagement 3,525
Dec'11 SABMiller Foster'sGroup 13,051
Holder PercentOwnership
TheVanguardGroup,Inc. 6.88%TybourneCapitalManagement(HK)Limited 5.85%FidelityContrafundInc 5.73%BlackRockFundAdvisors 4.87%NeubergerBermanGroup,LLC 4.76%

Importantdisclosuresappearonthelastpageofthisreport.
6
to non-core brands. Non-core brands include productsbrewedandpackagedatthecompany’sCincinnati,Ohiobrewery under a contract arrangement for a thirdparty.1 The company’s corebrands includeall productssold under the Samuel Adams, Twisted Tea, AngryOrchardandAlchemy&Sciencetradenames.1Becausecore-brands consistently generate over 99% of thecompany’s revenue, and because knowledge of non-core brands is limited, our analysis will focus on thecompany’score-brands.During2015,theCompanysoldover sixtybeersunder the SamuelAdamsand the SamAdamsbrand names, twelve flavored malt beveragesunder the Twisted Teabrand name, ten hard ciderbeverages under the Angry Orchardbrand name, andover forty beers under four of the brand names of itsAlchemy&ScienceSubsidiary.1
The Company’s hard cider brand, Angry Orchard, wasintroduced in2011andhasbeen themost sellinghardcider in the United States since 2013.1 Growth in thehard cider market slowed dramatically in 2015; weexpectthistrendtocontinueduetochangingconsumerpreferences, resulting in downward pressure on theBostonBeerCo.’sfuturerevenuegrowth.
Source:TheBostonBeerCo.2015AnnualReportNewproducts, suchashardsoda,hardwaterandhardrootbeerhaverecentlyemergedtocompetewithbeerand cider products. Hard root beer has been themostsuccessful. The Boston Beer Co. began nationaldistributionof itsConey IslandHardRootBeerproductin2015.1ConeyIslandHardRootBeerisnumbertwointhe hard root beer market to Not Your Father’s RootBeer,whichisresponsiblefor75%ofallhardrootbeersales.17We expect the Boston Beer Co.’s Coney Islandbrandtocontinuetoslowlyincreaseitsmarketshare,
however,weexpectgrowththehardrootbeercategoryto slow in coming years. The Boston Beer Co. recentlyannounced plans to introduce a hard water productcalled Truly Spiked & Sparkling. Truly Spiked andSparkling is not the first hardwater product to hit themarket.TheBoathouseBeverageCo.initiallyintroducedhardwaterin2013andWachusettBrewinglauncheditsNauti Seltzer inFebruary of this year, but neithercompany has the size and distribution network toexperiment with the product on a national level. TheBostonBeerCo. is the first largebrewer toexperimentwith hard water on a national level.18 Boston Beer’sTrulySpiked&Sparklinghardwater isaneasytodrink,flavorfulbeveragewith5%alcoholand100calories.Theproduct is aimed at the younger females and beginnerdrinkers.We expect the potential success or failure ofthis product to have little impact on the company’sfinancials.Products are sold to distributors who in turn sell toretailers, such as restaurants, grocery stores, bars, etc.where the products are sold to the end consumer. In2015, the company’s largest customer accounted forapproximately 7% of the company’s net sales.1 Thecompany’s top three distributors account for roughly12%of the company’snet sales. If, forany reason, thecompany lost these customers, net sales would besignificantlyimpacted.The company engages in a variety of sales andmarketing activities to attract and retain customers.Advertising,promotionalandsellingforcorebrandswas28.5%ofnetrevenue,or$64.53perbarrel,fortheyearendedDecember26,2015,andthecompanyintendstoincrease promotional and selling expenses by $10millionto$20millioninthe2016fiscalyear.1
ProductionandDistributionThemajorityofBostonBeersrawmaterialscomesfromthe United States, Canada and England. Some of thecompany’s necessary ingredients, such as specialtyapplesandcertainstrainsofyeastcanbeinshortsupplyand easily affected by outside factors, creatinguncertain and potential increased input costs. Thecompany brews and stores the majority of its coreproducts in a one million square foot facility oncompanyownedlandinBreinigsville,Pennsylvania.Thisfacilitymakes up approximately 77% of the companiesowned and leased facilities in the United States,including its corporate headquarters office.1 Based onthepastfiveyears,thecompany’scostofgoodssoldhas

Importantdisclosuresappearonthelastpageofthisreport.
7
been increasing at a rate exceeding that of revenues.Thecompany’s2015costofgoodsoldperbarrelofcoreproductsis$107.89,$0.98higherthanin2014,primarilyduetohigherbreweryoperatingcostsandnewproductpackaging. When certain product manufacturing isoutsourced, the company enters into limited-termsupply agreements with specific vendors to ensurepreferredpricing. The company is then charged a basefee for the service provided to create each unit andchargedadditionally for all the rawmaterials used anddistribution costs incurred by each of the suppliers.BostonBeer currentlyoutsources all of itsbottlingandpackagingtoonesupplier.The Boston Beer Co. has a network of 350 third-partydistributors in the United States and more globally.1Distributors are in charge of selling the products toretailers across the countries including: pubs, grocerystores,conveniencestores,restaurantsandmanymore.The company invests a lot of time and energy toreachinggoalstosubstantiallyreduceinventorylevelsatthe distributors, in attempt to deliver fresher, higherqualityproductstoconsumers,byforecastingsalesandprovidingbetter on-time service for shipments.Amongthe 350 distributors, a small number contribute to alargeportionofthecompany’srevenue,creatingalevelofrisktolostrevenueifanythingbadweretohappen.
CompetitionAsmentionedabove,thecompanyconstantlycompeteswith other beer producers for new and existingdistributors’ time and efforts to sell their products, inaddition to competing for retailers’ shelf space ingrocery stores, fridge space in convenient stores andtaps in pubs and restaurants. Boston Beer is alsocompeting for customers to obtain a larger portion ofmarket sharebyacquiringnewcustomersand creatingbrand loyalty. The company currently lacks the buyingpower that some of its larger competitors have withdistributors.
Source:ThomsonONE,BostonBeerCo.201510K,MolsonCoorsBrewingCo.201510K,Anheuser-BuschInBev2015AnnualReport,
ConstellationBrands201510kIBISWorld,Bloomberg
To compete with new craft brewers and differentiatethemselves,theBostonBeerCo.primarilyfocusestheirefforts on product quality, promotions andadvertisement, pricing and cost reduction, andplacement of their products. Advertising, promotionaland selling expenses was the companies largestoperating expense, accounting for 28.5% of thecompany’snetrevenue.1Thecompany’sadvertisingandpromotions expenses have consistently increased year-after-year to maintain its current market share andpotentiallygrowitscustomerbase.
RegulationsThealcoholicbeverageindustryishighlyregulatedatallthree levels of government, federal, state and locallevels. These regulations can restrict and alter thecompanies approach to marketing, pricing anddistribution. To abideby the rules and regulations, thecompany has to receive permits and licenses to begranted permission to produce and distribute itsproducts. Some states have imposed new regulationsrestricting the advertisement of controlled substancesdue to the increase of incidences of drunk driving andunderage drinking. This trend could lead to adiminishing demand for the company’s products inthoseareas.The federal excise tax on malt beverages isapproximately 7.98% of the 2015 price per barrel of$226.18,$0.226pergallononhardcidersand$3.30pergallononartificiallycarbonatedwine.1Thegovernmenthas the ability to increase the excise tax rates at anypoint in timeandwill likely increasetherateover timeonthefederalandstatelevel.CatalystforGrowthandChangeWith the increasing number of craft breweries in themarket, it’s importantthattheBostonBeerCo.focuseson differentiating themselves from others. To do that,theyneedtocontinuetoproduceexceptionalqualityintheir products to be strategic to grow their marketshare.Advertisementandpromotionswillbeakeytoolin helping the company to acquire new customers andgenerate awareness to new specialty and seasonalproducts. If the company is able to gain a largercustomerbaseandcontinuetoincreaseunitsales,theywill generate more buying power with their suppliersand distributors, and in turn will decrease costs andincreaseprofits.
Company BostonBeerCo.
Anheuser-BuschInBev
MolsonCoorsBrewingCo.
ConstellationBrands,INC.
MarketCap 2.3B 199.5B 20.5B 31.5B
NetSales2015(millions) $960 $43,604 $3,568 $6,028
EPS(ttm) $7.25 $4.96 $1.93 $5.03
BarrelsSold(thousands) 4,256 389,711 25,789 201,400
NetRevenue/Barrel $225.55 $111.89 $138.33 $218.13
GrossMargin 52.3% 60.1% 39.2% 42.8%
ForeignSales 4.0% 74.2% 97.0% 65.6%
DomesticSales 96.0% 25.8% 3.0% 34.4%

Importantdisclosuresappearonthelastpageofthisreport.
8
ValuationAnalysis
It’scrucialthatthecompanymaintainsitsprofitmarginsand keeps its operating expenses down. It will bebeneficial for Boston Beer to continue to innovateexisting products and to continue experimenting withnew product categories, such as its most recent hardsparkling water. New product categories will helpdiversifythecompanyandhedgeagainstpotentialrisksfrom regulation changes and increased competition.Entering new markets would allow the company toobtainnewcustomersegments.
KeyInvestmentPositivesandNegativesPositives:BostonBeerisoneofthelargestcraftbrewersintheUnitedStatesandhasbeenaroundsince1984.Ithasanetworkof350distributorsandwholesalersintheUnited States. They have the ability to scale up theiroperations and production if necessary. There isexpected to be continued growth in the craft brewermarket. The company is taking initiatives to beinnovativewithitsproducts.
Negatives: A large portion of the company’s rawmaterials is derived from a specific area of the worldand limited to a minimal amount of suppliers. Certainnecessaryrawmaterialsmaybeinshortsupplycausingunpredictabilitywithpricingforbothspotpurchasesandforward contract pricing. The company lacks buyingpower with its suppliers and distributors and isdependent on its relationshipwith its distributors. Thecraft beer industry is seeing a continuous increase incompetition. Potential changes in governmentregulations are unpredictable and impactful to thecompany’s net revenue business operations. Thecompany’scans,bottlesandlabelsareeachsuppliedbya single source. There isdecliningalcohol consumptionperpersoninthepopulation.
RevenueOur revenue forecasts is broken down into twosegments: core brands and non-core brands. Revenueswere forecasted by holding volume of barrels soldconstant and increasing the sell price per barrel at asteadyinflationrateof1.5%,guidedbycommentsfrommanagement. Revenue growth numbers were thenmanipulatedbasedonexpectationsfor industrytrends,theeconomy,guidancefrommanagement,etc.
TheBostonBeerCo.experiencedadecreaseinrevenuegrowth from22% in theyearending2014to6% in theyearending2015.Thisdecreaseingrowthissaidtobearesult of decreased market share due to increasedcompetition from new craft breweries.We expect thistrend to continue through 2016, leading to decreasedrevenuegrowthof4.5%,beforereturningto5%through2018 as GDP returns to normal growth rates. As 2018passes, we expect the company’s growth to slowlydeclinetoasteadystaterateof3%inyear2021.
CostsCost of Goods Sold – Cost of goods sold is forecastedbasedonanalysisofrecenthistoricalcostsasapercentofnetsales,withaslightincreasegoingintothesteadystate period as commodity prices rise with increasedcompetition.
Advertising, Promotional and Selling Expenses – 2016expenses are forecasted with direct guidance frommanagement. In the Boston Beer Co.’s 2015 annualreport management states that the company “intendsto increase advertising, promotional and sellingexpensesbybetween$10millionand$20millionforthefull year 2016.” Beyond 2016 expenses are forecastedbased on analysis of recent historical expenses as apercentageofnetsales.General and Administrative Expenses – Expenses areforecastedbasedonanalysisofhistoricalexpensesasapercentageofnetsales.CapitalExpenditures&DepreciationExpenseCapitalExpenditures–Capitalexpendituresfor2016areforecasted with guidance from management. In theBoston Beer Co.’s 2015 annual report managementstatesthatthecompanycurrentlyestimatestoexpensebetween $60million and $80million for capitalexpenditures. Beyond 2016, capital expenditures areforecasted based on analysis of historical capitalexpendituresasapercentageofnetsales.Depreciation Expense – Depreciation expense isforecastedbasedonafive-yearaverageofdepreciationexpense as a percent of gross property, plant andequipment.WeightedAverageCostofCapital(WACC)CostofEquity–CostofequitywascalculatedusingtheCAPMapproach.TheyieldontheUnitedStates30-yearTreasurywasusedastherisk-freerate.Betawas

Importantdisclosuresappearonthelastpageofthisreport.
9
estimatedusinganaverageof2-yearweeklydataand5-yearmonthlydataprovidedbyBloomberg.CostofDebt–Onceagain,theyieldontheUnitedStates30-year Treasury was used as the risk-free rate whenestimating the cost of debt. Because the Boston BeerCo.hasnooutstandingdebt,thecurrentyieldsonlong-term debt of competitors were considered whendeterminingtheyieldspreadovertheriskfreerate.Dueto the company’s capital structure of more than 99%equity, our assumptions on the cost of debt have verylittleimpactontheWACCcalculation.
DiscountedCashFlowandEconomicProfitThediscountedcashflowandeconomicprofitmethodsimply stock prices of $176. After adjusting for thepassage of time since the company’s fiscal year ofDecember26th2015,themodelimpliesapriceof$184,3% higher than the currentmarket price of $179. Thisvaluation supports our recommendation of “Hold” ontheBostonBeerCo.DividendDiscountModelOurdividenddiscountmodel implies an adjusted stockpriceof$176,however, theBostonBeerCo.hasneverpaidadividendandshowsnointentionsofdoingso.Forthisreason,wefindthedividenddiscountmodeltobeapoor model method for forecasting the value of theBostonBeer Co. Thus,weplacemost emphasis on thediscountedcashflowandeconomicprofitmethods.RelativeP/EWe compared Boston Beer to variety of competitorsbased on their industry, size and target market. Wecompared the company to other similar alcoholcompanies and to other beverage companies as awhole. We chose to include soft drink companies likeCoca-Cola,PepsiandSnapplebecausethesecompaniescan target similar consumer segments as Boston Beerdoes.
The Relative P/E is an inconclusive metric to find therelativevalueofthecompany,duetothethevastrangeof product lines offered fromother competitors. Someof the competitors’ sizes are quite large compared toBoston Beers market cap, making it difficult torespectivelycomparetoone-another.
SensitivityAnalysisWechosetofocusoursensitivityanalysisontheimpliedadjusted stock price provided by our discounted cashflowandeconomicprofitmodels.
Beta vs. Market Risk Premium – Given the capitalstructure of the Boston Beer Co., our chosen beta andmarketriskpremiumbothhaveatremendouseffectonthe calculation of our target price. Analysis of thesensitivityofthesetwovariablesshowthatbetaismuchinfluential to our target price than the market riskpremium. An increase of just ten basis points in beta,while holding the market risk premium constant,decreasesthetargetpriceby18%.Asimilar increase inthemarket risk premiumdecreases the target pricebylessthan5%.Betavs.RiskFreeRate–AstheFedcontinuestotalkofpotential increases in the federal funds ratewe find itreasonable to test the sensitivity of our target price tomovements intheriskfreerate,holdingbetaconstant.Our analysis indicates that a 15 basis point increase inthe risk-free rate would decrease our target price byroughlythreepercent.
2016 COGS vs. CV ROIC – As Boston Beer’s largestexpense,wefinditrelevanttoanalyzetheeffectofourforecasted cost of goods sold on our target price.BecauseCOGSisconsistentlyforecastedasapercentageofnetsales,analyzingyear2016givesusagoodideaofhow future COGS might affect our target price, whenholdingthereturnoninvestedcapitalconstant.AnalysisofthesensitivityofCOGSindicatethata100basispointincreaselowersourtargetpricebysixpercent.WACC vs. Marginal Tax Rate – The Boston Beer Co.operates in number of states which have varying taxrates.Asoperationsgrowinexistingstatesandemergeand other states, the company’s marginal tax rate issubjecttochange.Inthissensitivityanalysisweevaluatethe effect of a change in the marginal tax rate whenholdingtheweightedaveragecostofcapitalconstantatvarious levels. Our analysis indicates that marginal taxratehas aminimal effect onour target stockprice.Anincrease to the marginal tax rate of 150 basis pointsdecreasesourcurrenttargetpriceof$184.13to$184.2017Advertising,PromotionalandSellingExpensesvs.CVGrowth of NOPLAT – As Advertising, Promotional andSelling Expenses being Boston Beer’s largest operatingexpense,weseeitbeingbeneficialtoanalyzetheeffectsit has on our target price. Increasing the company’sadvertising, promotional and selling expenses by onepercent and holding all else constant, results in a totaldecreaseintargetpriceof7.3%.

Importantdisclosuresappearonthelastpageofthisreport.
10
References
ImportantDisclaimer
This report was created by students enrolled in theApplied Equity Valuation (FIN:4250) course at theUniversity of Iowa. The report was originally created tooffer an internal investment recommendation for theUniversity of Iowa Krause Fund and its advisory board.The report also provides potential employers and otherinterested parties an example of the students’ skills,knowledgeandabilities.MembersoftheKrauseFundarenot registered investment advisors, brokers or officiallylicensed financial professionals. The investment advicecontained in this report does not represent an offer orsolicitationtobuyorsellanyofthesecuritiesmentioned.Unlessotherwisenoted,factsandfiguresincludedinthisreport are from publicly available sources. This report isnot a complete compilation of data, and its accuracy isnot guaranteed. From time to time, the University ofIowa, its faculty, staff, students,or theKrauseFundmayhold a financial interest in the companies mentioned inthisreport.
1TheBostonBeerCo.201510Khttp://www.bostonbeer.com/phoenix.zhtml?c=69432&p=irol-overview2U.S.BureauofEconomicAnalysishttp://www.bea.gov/3U.S.BureauofLaborStatisticshttp://www.bls.gov/4BrewersAssociationhttps://www.brewersassociation.org/statistics/craft-brewer-defined/5IBISWorld–craftbeerproduction–industryperformancehttp://clients1.ibisworld.com.proxy.lib.uiowa.edu/reports/us/industry/currentperformance.aspx?entid=43026BostonBeerReportsFourthQuarter2015Resultshttp://www.bostonbeer.com/phoenix.zhtml?c=69432&p=irol-newsArticle&ID=2140743
7CNNMoney http://money.cnn.com/2015/12/23/investing/anheuser-busch-inbev-craft-brewery-acquisitions/8U.S.DepartmentoftheTreasury,AlcoholandTobaccoTaxandTradeBureauhttps://www.ttb.gov/beer/beer-stats.shtml9IBISWorld,CraftBeerIndustryhttp://clients1.ibisworld.com.proxy.lib.uiowa.edu/reports/us/industry/currentperformance.aspx?entid=430210YahooFinancehttps://beta.finance.yahoo.com/quote/SAM11Anheuser-BuschInBev2015AnnualReporthttp://annualreport.ab-inbev.com/12MilwaukeeBusinessJournalhttp://www.bizjournals.com/milwaukee/news/2016/04/15/a-b-inbev-pledges-not-to-cut-south-african-jobs.html?ana=yahoo13TheWallStreetJournalhttp://www.wsj.com/articles/ab-inbev-takeover-of-sabmiller-would-reshuffle-global-beer-industry-1444743235
14MolsonCoorshttp://www.molsoncoors.com/en/news/united-states/corporate/2015/november/11/molson-coors-to-acquire-full-ownership-of-millercoors
15MillerCoorshttp://www.millercoors.com/beers/great-beers16Yuenglinghttps://www.yuengling.com/our_story/17BonAppetitehttp://www.bonappetit.com/drinks/beer/article/hard-root-beer-popularity18Fool.comhttp://www.fool.com/investing/general/2016/04/09/will-boston-beers-new-brand-pop-sodastream-interna.aspx?source=yahoo-2&utm_campaign=article&utm_medium=feed&utm_source=yahoo-2

The Boston Beer CompanyRevenue Decomposition
Fiscal Years Ending Dec. 26 2013 2014 2015 2016E 2017E 2018E 2019E 2020E 2021E (CV)Revenue ‐ Core Brands 738,247 902,343 959,229 949,637 987,623 1,027,127 1,068,213 1,105,600 1,138,768 Revenue ‐ Non‐Core Brands 806 664 705 736 773 812 844 874 900 Net Revenue 739,053 903,007 959,934 950,373 988,396 1,027,939 1,069,057 1,106,474 1,139,668 Growth 27.37% 22.18% 6.30% ‐1.00% 4.00% 4.00% 4.00% 3.50% 3.00%
Volume (in 1000 barrels)Core Brands 3,403 4,093 4,241 4,137 4,238 4,343 4,450 4,537 4,605
24.79% 20.28% 3.62% ‐2.46% 2.46% 2.46% 2.46% 1.97% 1.48%
Non‐Core Brands 13 10 15 15 16 17 17 17 18 ‐31.58% ‐23.08% 50.00% 2.96% 3.45% 3.45% 2.46% 1.97% 1.48%
Total Volume 3,416 4,103 4,256 4,152 4,254 4,359 4,467 4,555 4,622 24% 20% 4% ‐2% 2% 2% 2% 2% 1%
Price ($ per barrel)Core Brands 216.94 220.46 226.18 229.57 233.02 236.51 240.06 243.66 247.31
2.15% 1.62% 2.59% 1.50% 1.50% 1.50% 1.50% 1.50% 1.50%
Non‐Core Brands 62.01 66.42 46.97 47.68 48.39 49.12 49.86 50.61 51.36 8.20% 7.11% ‐29.28% 1.50% 1.50% 1.50% 1.50% 1.50% 1.50%

The Boston Beer CompanyIncome Statement
Fiscal Years Ending Dec. 26 2013 2014 2015 2016E 2017E 2018E 2019E 2020E 2021E (CV)
Revenue 793,705 966,478 1,024,040 1,012,148 1,052,641 1,094,755 1,138,546 1,178,395 1,213,746 Less excise taxes 54,652 63,471 64,106 61,774 64,246 66,816 69,489 71,921 74,078
Net revenue 739,053 903,007 959,934 950,373 988,396 1,027,939 1,069,057 1,106,474 1,139,668 Cost of goods sold 328,228 402,858 415,432 412,160 424,629 437,596 451,079 461,847 470,372 Depreciation 25,903 35,138 42,885 44,019 49,801 55,814 62,068 69,261 76,668
Gross profit 384,922 465,011 501,617 494,194 513,966 534,528 555,910 575,366 592,627
Operating expenses:Advertising, promotional and selling expenses 207,930 250,696 273,629 283,629 286,635 292,963 304,681 309,813 319,107 General and administrative expenses 62,332 65,971 71,556 71,278 74,130 77,095 80,179 82,986 85,475 Impairment of assets 1,567 1,777 258 1,422 1,609 1,803 2,005 2,238 2,477 Settlement proceeds ‐ ‐ ‐ ‐ ‐ ‐ ‐ ‐ ‐ Total operating expenses 271,829 318,444 345,443 356,329 362,373 371,861 386,866 395,036 407,059
Operating income 113,093 146,567 156,174 137,865 151,592 162,667 169,044 180,331 185,568
Other income (expense), net:Interest income 31 21 56 85 60 66 82 99 122 Other income (expense), net (583) (994) (1,220) (1,200) (1,200) (1,200) (1,200) (1,200) (1,200) Total other income (expense), net (552) (973) (1,164) (1,115) (1,140) (1,134) (1,118) (1,101) (1,078)
Income (loss) before provision for income tax 112,541 145,594 155,010 136,750 150,452 161,533 167,926 179,230 184,491
Provision for income taxes 42,149 54,851 56,596 50,597 55,667 59,767 62,133 66,315 68,262 Net income 70,392 90,743 98,414 86,152 94,785 101,766 105,794 112,915 116,229
Net income per common share — basic 5.47 6.96 7.46 6.96 7.74 8.37 8.75 9.36 9.65 Weighted‐average shares outstanding — basic 12,766 12,968 13,123 12,370 12,250 12,160 12,097 12,059 12,046 Dividends declared per share ‐ ‐ ‐ ‐ ‐ ‐ ‐ ‐ ‐

The Boston Beer CompanyBalance Sheet
Fiscal Years Ending Dec. 26 2013 2014 2015 2016E 2017E 2018E 2019E 2020E 2021E (CV)
Assets Current Assets:Cash & cash equivalents 49,524 76,402 94,193 66,203 72,843 91,584 110,118 136,018 167,774 Accounts receivable, net 42,001 36,860 38,984 38,015 39,536 41,118 48,108 49,791 51,285 Inventories 56,397 51,307 56,462 57,022 59,304 61,676 64,143 66,388 68,380 Prepaid expenses & other assets 10,644 12,887 12,053 14,256 14,826 15,419 16,036 16,597 17,095 Income taxes receivable 1,038 21,321 14,928 9,108 10,020 10,758 11,184 11,937 12,287 Deferred income taxes 5,712 8,685 6,983 8,582 10,341 12,230 14,193 16,289 18,446 Total current assets 164,278 207,462 223,603 193,185 206,869 232,785 263,781 297,020 335,267
Property, plant & equipment, gross 409,689 553,979 617,214 677,214 766,170 858,684 954,899 1,065,547 1,179,513 Less accumulated depreciation 143,131 172,410 207,288 251,307 301,108 356,922 418,991 488,251 564,920
Property, plant & equipment, net 266,558 381,569 409,926 425,907 465,062 501,762 535,908 577,295 614,594
Other assets 9,556 12,447 8,188 9,504 10,378 10,279 11,225 11,065 11,967 Goodwill 3,683 3,683 3,683 3,683 3,683 3,683 3,683 3,683 3,683
Total assets 444,075 605,161 645,400 632,279 685,992 748,509 814,598 889,063 965,510
Liabilities and Stockholders' EquityCurrent Liabilities:Accounts payable 34,424 35,576 42,718 41,341 42,995 44,715 46,504 48,132 49,576 Current portion of debt & capital lease obligations 53 55 58 50 44 38 34 30 26 Accrued expenses & other current liabilities 69,900 74,539 68,384 68,902 71,659 74,526 77,507 80,219 82,626 Total current liabilities 104,377 110,170 111,160 110,293 114,698 119,279 124,044 128,381 132,228
Deferred income taxes 32,394 50,717 56,001 63,854 72,493 81,769 91,412 101,704 112,298 Debt & capital lease obligations, less current portion 584 528 471 413 363 320 281 248 218 Other liabilities 4,635 7,606 16,547 9,979 9,884 10,793 10,691 11,618 11,397
Total liabilities 141,990 169,021 184,179 184,539 197,438 212,162 226,429 241,951 256,141
Stockholder's Equity:Common equity 173,153 225,040 290,224 311,252 332,281 353,309 374,337 395,366 416,394 Accumulated other comprehensive income (loss), net of tax (417) (1,133) (951) (912) (912) (912) (912) (912) (912) Retained earnings (accumulated deficit) 129,349 212,233 171,948 258,100 352,885 454,651 560,444 673,359 789,588 Common stock held in treasury, at cost ‐ ‐ ‐ (120,700) (195,700) (270,700) (345,700) (420,700) (495,700) Total stockholders' equity (deficit) 302,085 436,140 461,221 447,741 488,554 536,348 588,169 647,112 709,370 Total liabilities and stockholders’ equity 444,075 605,161 645,400 632,279 685,992 748,509 814,598 889,063 965,510

The Boston Beer CompanyCash Flow Statement
Fiscal Years Ending Dec. 26 2013 2014 2015
Cash flows provided by operating activities:Net income 70,392 90,743 98,414 Adjustments to reconcile net income to net cash provided by operating activities:Depreciation & amortization 25,903 35,138 42,885 Impairment of assets 1,567 1,777 258 Loss (gain) on disposal of property, plant & equipment 462 434 515 Bad debt expense (recovery) 19 (16) 165 Stock‐based compensation expense 7,318 6,857 6,665 Excess tax benefit from stock‐based compensation arrangements (5,282) (17,353) (15,350) Deferred income taxes 11,630 15,350 6,986
Changes in operating assets and liabilities:Accounts receivable (10,542) 5,157 (2,289) Inventories (12,036) 5,090 (5,155) Prepaid expenses, income tax receivable & other assets (7,616) (9,447) 11,858 Accounts payable 3,173 884 5,985 Accrued expenses & other current liabilities 14,633 4,578 9,014 Other liabilities 361 2,019 8,732 Net cash flows from operating activities 99,982 141,211 168,683
Cash flows used in investing activities:Purchases of property, plant & equipment (100,655) (151,784) (74,187) Cash paid for acquisition of brewery assets & other intangible assets (2753) (100) (100)Change in restricted cash 62 53 57Proceeds from disposal of property, plant & equipment 18 ‐ ‐
Net cash flows from investing activities (103,328) (151,831) (74,230)
Cash flows (used in) provided by financing activities:Repurchase of class A common stock (29,585) (7,859) (135,705) Proceeds from exercise of stock options 2,541 27,272 42,339 Proceeds from note payable ‐ ‐ ‐Cash paid on note payable & capital lease (787) (53) (54) Excess tax benefit from stock‐based compensation arrangements 5,282 17,353 15,350 Net proceeds from sale of investment shares 956 785 1,408
Net cash flows from financing activities (21,593) 37,498 (76,662)
Change in cash & cash equivalents (24,939) 26,878 17,791 Cash & cash equivalents at beginning of year 74,463 49,524 76,402 Cash & cash equivalents at end of period 49,524 76,402 94,193

The Boston Beer CompanyCash Flow Statement
Fiscal Years Ending Dec. 26 2016E 2017E 2018E 2019E 2020E 2021E (CV)
Cash flows provided by operating activities:Net income 86,152 94,785 101,766 105,794 112,915 116,229
Adjustments to reconcile net income to net cash provided by operating activities:Depreciation & amortization 44,019 49,801 55,814 62,068 69,261 76,668
Gross Cash from Operations 130,171 144,586 157,580 167,862 182,175 192,897
Changes in Working Capital Accounts:Accounts receivable, net 969 (1,521) (1,582) (6,990) (1,684) (1,494) Inventories (560) (2,281) (2,373) (2,467) (2,245) (1,992) Prepaid expenses & other assets (2,203) (570) (593) (617) (561) (498) Income taxes receivable 5,820 (913) (738) (426) (753) (350) Accounts payable (1,377) 1,654 1,720 1,789 1,628 1,444 Accrued expenses & other current liabilities 518 2,757 2,867 2,981 2,713 2,407 Other liabilities (6,568) (95) 909 (103) 927 (221)
(3,400) (970) 211 (5,833) 25 (704)
Net cash flows from operating activities 126,771 143,616 157,791 162,029 182,200 192,193
Cash flows used in investing activities:Property, plant & equipment, gross (60,000) (88,956) (92,515) (96,215) (110,647) (113,967) Other assets (1,316) (874) 99 (946) 160 (902) Deferred income tax assets (1,599) (1,759) (1,889) (1,963) (2,096) (2,157) Net cash flows from investing activities (62,915) (91,589) (94,304) (99,124) (112,583) (117,026)
Cash flows (used in) provided by financing activities:Repurchase of class A common stock (120,700) (75,000) (75,000) (75,000) (75,000) (75,000) Proceeds from exercise of stock options 21,028 21,028 21,028 21,028 21,028 21,028 Deferred income tax liabilities 7853 8640 9276 9643 10292 10594Current portion of debt & capital lease obligations (8) (6) (5) (5) (4) (4)Cash paid on note payable & capital lease (58) (50) (44) (38) (34) (30) Accumulated other comprehensive income (loss), net of tax 39 ‐ ‐ ‐ ‐ ‐ Net cash flows from financing activities (91,846) (45,388) (44,745) (44,372) (43,717) (43,411)
Change in cash & cash equivalents (27,990) 6,639 18,742 18,533 25,900 31,757 Cash & cash equivalents at beginning of year 94,193 66,203 72,843 91,584 110,118 136,018 Cash & cash equivalents at end of period 66,203 72,843 91,584 110,118 136,018 167,774

The Boston Beer CompanyCommon Size Income Statement
Fiscal Years Ending Dec. 26 2013 2014 2015 2016E 2017E 2018E 2019E 2020E 2021E (CV)
Revenue 107.39% 107.03% 106.68% 106.50% 106.50% 106.50% 106.50% 106.50% 106.50%Less excise taxes 7.39% 7.03% 6.68% 6.50% 6.50% 6.50% 6.50% 6.50% 6.50%
Net revenue 100.00% 100.00% 100.00% 100.00% 100.00% 100.00% 100.00% 100.00% 100.00%Cost of goods sold 44.41% 44.61% 43.28% 43.37% 42.96% 42.57% 42.19% 41.74% 41.27%
Gross profit 52.08% 51.50% 52.26% 52.00% 52.00% 52.00% 52.00% 52.00% 52.00%Operating expenses:Advertising, promotional and selling expenses 28.13% 27.76% 28.50% 29.84% 29.00% 28.50% 28.50% 28.00% 28.00%General and administrative expenses 8.43% 7.31% 7.45% 7.50% 7.50% 7.50% 7.50% 7.50% 7.50%Settlement proceeds 0.00% 0.00% 0.00% 0.00% 0.00% 0.00% 0.00% 0.00% 0.00%Total operating expenses 36.78% 35.26% 35.99% 37.49% 36.66% 36.18% 36.19% 35.70% 35.72%
Operating income 15.30% 16.23% 16.27% 14.51% 15.34% 15.82% 15.81% 16.30% 16.28%Other income (expense), net:Interest income 0.00% 0.00% 0.01% 0.01% 0.01% 0.01% 0.01% 0.01% 0.01%Other income (expense), net ‐0.08% ‐0.11% ‐0.13% ‐0.13% ‐0.12% ‐0.12% ‐0.11% ‐0.11% ‐0.11%Total other income (expense), net ‐0.07% ‐0.11% ‐0.12% ‐0.12% ‐0.12% ‐0.11% ‐0.10% ‐0.10% ‐0.09%
Income (loss) before provision for income tax 15.23% 16.12% 16.15% 14.39% 15.22% 15.71% 15.71% 16.20% 16.19%Provision for income taxes 5.70% 6.07% 5.90% 5.32% 5.63% 5.81% 5.81% 5.99% 5.99%Net income 9.52% 10.05% 10.25% 9.07% 9.59% 9.90% 9.90% 10.20% 10.20%

The Boston Beer CompanyCommon Size Balance Sheet
Fiscal Years Ending Dec. 26 2013 2014 2015 2016E 2017E 2018E 2019E 2020E 2021E (CV)
Assets Current Assets:Cash & cash equivalents 6.70% 8.46% 9.81% 6.97% 7.37% 8.91% 10.30% 12.29% 14.72%Accounts receivable, net 5.68% 4.08% 4.06% 4.00% 4.00% 4.00% 4.50% 4.50% 4.50%Inventories 7.63% 5.68% 5.88% 6.00% 6.00% 6.00% 6.00% 6.00% 6.00%Prepaid expenses & other assets 1.44% 1.43% 1.26% 1.50% 1.50% 1.50% 1.50% 1.50% 1.50%Income taxes receivable 0.14% 2.36% 1.56% 0.96% 1.01% 1.05% 1.05% 1.08% 1.08%Deferred income taxes 0.77% 0.96% 0.73% 0.90% 1.05% 1.19% 1.33% 1.47% 1.62%Total current assets 22.23% 22.97% 23.29% 20.33% 20.93% 22.65% 24.67% 26.84% 29.42%
Property, plant & equipment, gross 55.43% 61.35% 64.30% 71.26% 77.52% 83.53% 89.32% 96.30% 103.50%Property, plant & equipment, net 36.07% 42.26% 42.70% 44.81% 47.05% 48.81% 50.13% 52.17% 53.93%Other assets 1.29% 1.38% 0.85% 1.00% 1.05% 1.00% 1.05% 1.00% 1.05%Goodwill 0.50% 0.41% 0.38% 0.39% 0.37% 0.36% 0.34% 0.33% 0.32%
Total assets 60.09% 67.02% 67.23% 66.53% 69.40% 72.82% 76.20% 80.35% 84.72%Liabilities and Stockholders' Equity
Current Liabilities:Accounts payable 4.66% 3.94% 4.45% 4.35% 4.35% 4.35% 4.35% 4.35% 4.35%Current portion of debt & capital lease obligations 0.01% 0.01% 0.01% 0.01% 0.00% 0.00% 0.00% 0.00% 0.00%Accrued expenses & other current liabilities 9.46% 8.25% 7.12% 7.25% 7.25% 7.25% 7.25% 7.25% 7.25%Total current liabilities 14.12% 12.20% 11.58% 11.61% 11.60% 11.60% 11.60% 11.60% 11.60%
Deferred income taxes 4.38% 5.62% 5.83% 6.72% 7.33% 7.95% 8.55% 9.19% 9.85%Debt & capital lease obligations, less current portion 0.08% 0.06% 0.05% 0.04% 0.04% 0.03% 0.03% 0.02% 0.02%Other liabilities 0.63% 0.84% 1.72% 1.05% 1.00% 1.05% 1.00% 1.05% 1.00%
Total liabilities 19.21% 18.72% 19.19% 19.42% 19.98% 20.64% 21.18% 21.87% 22.48%Stockholder's Equity:Additional paid‐in capital 23.43% 24.92% 30.23% 32.75% 33.62% 34.37% 35.02% 35.73% 36.54%Accumulated other comprehensive income (loss), net of tax ‐0.06% ‐0.13% ‐0.10% ‐0.10% ‐0.09% ‐0.09% ‐0.09% ‐0.08% ‐0.08%Retained earnings (accumulated deficit) 17.50% 23.50% 17.91% 27.16% 35.70% 44.23% 52.42% 60.86% 69.28%Total stockholders' equity (deficit) 40.87% 48.30% 48.05% 47.11% 49.43% 52.18% 55.02% 58.48% 62.24%Total liabilities and stockholders’ equity 60.09% 67.02% 67.23% 66.53% 69.40% 72.82% 76.20% 80.35% 84.72%

The Boston Beer CompanyWeighted Average Cost of Capital (WACC) Estimation
Cost of Equity (CAPM)Risk Free Rate 2.59%Market Risk Premium 5.15%Beta 0.87Cost of Equity 7.06%
Cost of DebtRisk Free Rate ‐ 30 Yr US Treasury 2.59%Spread on Comparable Note 2.03%Pretax Cost of Debt 4.62%Marginal Tax Rate 38%After Tax Cost of Debt 1.77%
WeightsEquity:Stock Price $156.08No. Shares Outstanding 12,833 Market Value (Thousands) $2,002,922
Debt:Short Term Debt 58 Long Term Debt 471 PV Operating Leases 14,828 Total Value of Debt $15,357
Total Value $2,018,279Equity Weight 99.24%Debt Weight 0.76%
WACC 7.02%

The Boston Beer CompanyValue Driver Estimation
Fiscal Years Ending Dec. 26 2011 2012 2013 2014 2015 2016E 2017E 2018E 2019E 2020E 2021E (CV)NOPLATEBITA
Net sales 513,000 580,222 739,053 903,007 959,934 950,373 988,396 1,027,939 1,069,057 1,106,474 1,139,668 ‐ Cost of goods sold 209,641 244,804 328,228 402,858 415,432 412,160 424,629 437,596 451,079 461,847 470,372 ‐ Depreciation 18,792 20,208 25,903 35,138 42,885 44,019 49,801 55,814 62,068 69,261 76,668 ‐ Advertising, promotional and selling expenses 157,261 169,306 207,930 250,696 273,629 283,629 286,635 292,963 304,681 309,813 319,107 ‐ General and administrative expenses 43,485 50,171 62,332 65,971 71,556 71,278 74,130 77,095 80,179 82,986 85,475 + Implied interest on operating leases 228 214 373 383 297 684 711 777 838 895 964 EBITA 84,049 95,947 115,033 148,727 156,729 139,972 153,912 165,247 171,887 183,463 189,009
Less: Adjusted TaxesProvision for income taxes 37,441 36,050 42,149 54,851 56,596 50,597 55,667 59,767 62,133 66,315 68,262 ‐ Interest income 21 12 12 8 22 33 23 25 32 38 47 + Other expenses (income), net 80 38 224 382 468 461 461 461 461 461 461 + Tax shield on implied lease interest 88 82 143 147 114 263 273 298 322 344 370 + tax on impairment 256 57 602 682 99 546 618 692 770 859 951 Adjusted taxes 37,844 36,215 43,106 56,054 57,256 51,835 56,996 61,193 63,654 67,941 69,997
Plus: Change in Deferred Taxes
Deferred tax liabilities 17,349 20,463 32,394 50,717 56,001 63,854 72,493 81,769 91,412 101,704 112,298 Deferred tax assets 4,363 5,411 5,712 8,685 6,983 8,582 10,341 12,230 14,193 16,289 18,446
Net deferred taxes (12,986) (15,052) (26,682) (42,032) (49,018) (55,272) (62,152) (69,540) (77,219) (85,416) (93,853) Change in deferred taxes 453 (2,066) (11,630) (15,350) (6,986) (6,254) (6,880) (7,387) (7,680) (8,197) (8,437)
NOPLAT 46,658 57,666 60,297 77,323 92,487 81,883 90,036 96,666 100,554 107,326 110,575
Invested CapitalOperating Current Assets
Normal Cash (lesser of actual or %) 10,260 11,604 14,781 18,060 19,199 19,007 19,768 20,559 21,381 22,129 22,793 Accounts Receivable, Net 23,233 31,479 42,001 36,860 38,984 38,015 39,536 41,118 48,108 49,791 51,285 Inventory 34,072 44,361 56,397 51,307 56,462 57,022 59,304 61,676 64,143 66,388 68,380 PPD Expenses 14,605 6,628 10,644 12,887 12,053 14,256 14,826 15,419 16,036 16,597 17,095 Income Tax Receivable 7,762 1,645 1,038 21,321 14,928 9,108 10,020 10,758 11,184 11,937 12,287 Operating Current Assets 89,932 95,717 124,861 140,435 141,626 128,300 133,433 138,772 149,668 154,906 159,554
Operating Current LiabilitiesAccounts Payable 18,806 28,303 34,424 35,576 42,718 41,341 42,995 44,715 46,504 48,132 49,576 Accrued Expenses 48,243 60,529 69,900 74,539 68,384 68,902 71,659 74,526 77,507 80,219 82,626 Operating Current Liabilitie 67,049 88,832 104,324 110,115 111,102 110,243 114,654 119,241 124,011 128,351 132,201
Net Operating Working Capita 22,883 6,885 20,537 30,320 30,524 18,057 18,780 19,531 25,657 26,555 27,352
Plus: Net PPE 143,586 189,948 266,558 381,569 409,926 425,907 465,062 501,762 535,908 577,295 614,594 Plus: PV of Operating Leases 4,627 8,080 8,289 6,440 14,828 15,406 16,823 18,150 19,385 20,883 22,232
Invested Capital 171,096 204,913 295,384 418,329 455,278 459,371 500,664 539,443 580,951 624,733 664,177
Value DriversNOPLAT 46,658 57,666 60,297 77,323 92,487 81,883 90,036 96,666 100,554 107,326 110,575 Beginning Invested Capital 149,918 171,096 204,913 295,384 418,329 455,278 459,371 500,664 539,443 580,951 624,733 Return on Invested Capital (ROIC) 31.12% 33.70% 29.43% 26.18% 22.11% 17.99% 19.60% 19.31% 18.64% 18.47% 17.70%
NOPLAT 46,658 57,666 60,297 77,323 92,487 81,883 90,036 96,666 100,554 107,326 110,575 Δ Invested Capital 21,178 33,816 90,471 122,945 36,949 4,093 41,293 38,779 41,508 43,782 39,444 Free Cash Flow (FCF) 25,480 23,849 (30,174) (45,623) 55,538 77,791 48,743 57,887 59,045 63,544 71,131
Beginning Invested Capital 149,918 171,096 204,913 295,384 418,329 455,278 459,371 500,664 539,443 580,951 624,733 ROIC ‐ WACC 24.10% 26.68% 22.41% 19.16% 15.09% 10.97% 12.58% 12.29% 11.62% 11.45% 10.68%Economic Profit (EP) 36,134 45,655 45,912 56,587 63,121 49,923 57,788 61,520 62,685 66,543 66,719

The Boston Beer CompanyDiscounted Cash Flow (DCF) Model
Key Inputs:CV Growth of NOPLAT 3.03%CV ROIC 17.70%WACC 7.02%CV NOPLAT 110,575
Fiscal Years Ending Dec. 26 2016E 2017E 2018E 2019E 2020E 2021E (CV)
DCF ModelPeriod 1 2 3 4 5 5FCF 77,791 48,743 57,887 59,045 63,544 71,131 Continuing Value 2,296,911 PV 72,688 42,558 47,227 45,012 45,264 1,636,139 V (operating) 1,888,887
Non‐operating Assets:Excess Cash 74,994 Other Assets 8,188 V(non‐operating) 83,182
Debt:Current Portion of Debt 58 Long Debt, Less Current Portion 471 V(debt) 529
Non‐operating Liabilities:PV Operating Leases 14,828 Other Liabilities 16,547 V(other) 31,375
V(equity) 1,940,165 Shares Outstanding 12,833 Intrinsic Value of Stock (FY End '15) 151.19Adjusted Stock Price (Today) 158.01
Current Share Price 156.08
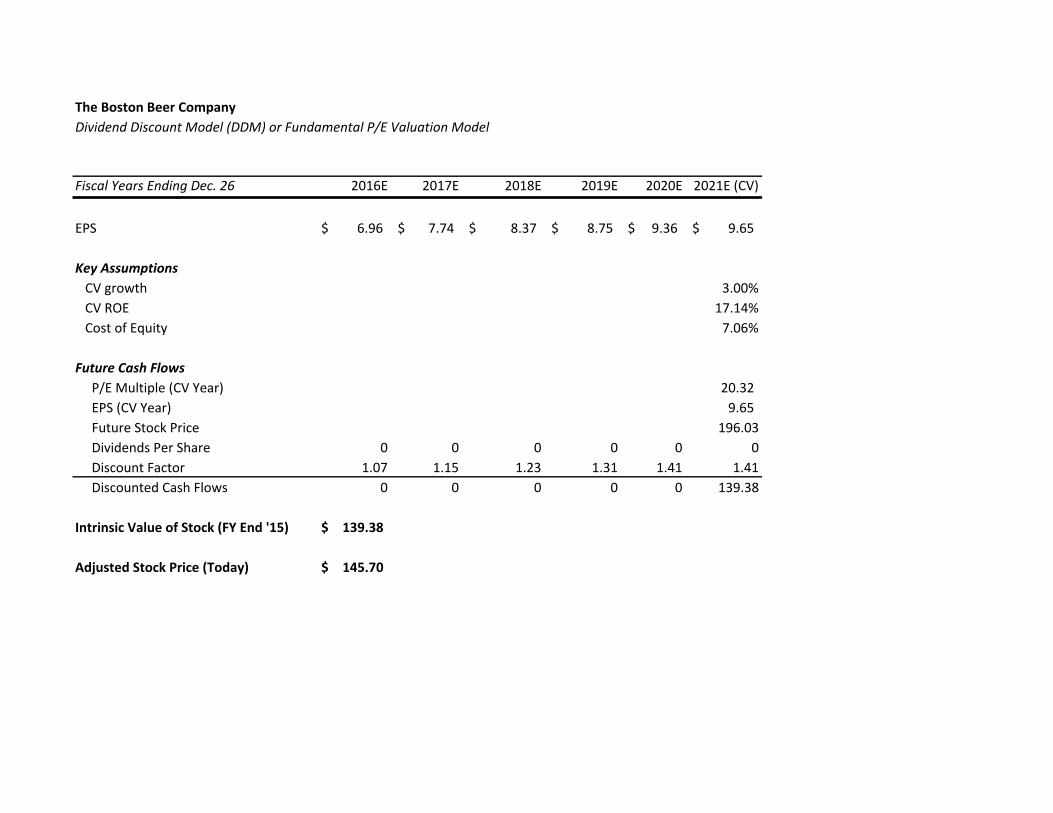
The Boston Beer CompanyDividend Discount Model (DDM) or Fundamental P/E Valuation Model
Fiscal Years Ending Dec. 26 2016E 2017E 2018E 2019E 2020E 2021E (CV)
EPS 6.96$ 7.74$ 8.37$ 8.75$ 9.36$ 9.65$
Key Assumptions
CV growth 3.00% CV ROE 17.14% Cost of Equity 7.06%
Future Cash Flows P/E Multiple (CV Year) 20.32 EPS (CV Year) 9.65 Future Stock Price 196.03 Dividends Per Share 0 0 0 0 0 0 Discount Factor 1.07 1.15 1.23 1.31 1.41 1.41 Discounted Cash Flows 0 0 0 0 0 139.38
Intrinsic Value of Stock (FY End '15) 139.38$
Adjusted Stock Price (Today) 145.70$

The Boston Beer CompanyRelative Valuation Model ‐ Alcoholic Beverage Companies
EPS EPSTicker Company Price 2016E 2017E P/E 16 P/E 17BUD AB Inbev $121.89 $4.75 $5.32 25.7 22.9 SBMRY SABMiller PLC $60.46 $2.20 $2.29 27.5 26.4 TAP Molson Coors Brewing Compan $95.40 $3.21 $5.26 29.7 18.1 STZ Constellation Brands, INC. $149.41 $5.38 $6.10 27.8 24.5 BF‐B Brown‐Forman Corp $96.54 $3.37 $3.54 28.6 27.3
Average 27.9 23.8
SAM The Boston Beer Company $156.08 6.96 7.74 22.4 20.2
Implied Value: Relative P/E (EPS16) $ 194.00 Relative P/E (EPS17) 184.48$
Relative Valuation Model ‐ Beverage CompaniesEPS EPS
Ticker Company Price 2016E 2017E P/E 16 P/E 17BUD AB Inbev $121.89 $4.75 $5.32 25.7 22.9 SBMRY SABMiller PLC $60.46 $2.20 $2.29 27.5 26.4 TAP Molson Coors Brewing Compan $95.40 $3.21 $5.26 29.7 18.1 STZ Constellation Brands, INC. $149.41 $5.38 $6.10 27.8 24.5 BF‐B Brown‐Forman Corp $96.54 $3.37 $3.54 28.6 27.3 KO The Coca‐Cola Company $45.80 $1.95 $2.05 23.5 22.3 PEP Pepsico, INC. $100.98 $4.68 $5.06 21.6 20.0 DPS Dr Pepper Snapple Group, INC. $89.44 $4.31 $4.67 20.8 19.2
Average 25.6 22.6
SAM The Boston Beer Company $156.08 6.96 7.74 22.4 20.2
Implied Value: Relative P/E (EPS16) $ 178.55 Relative P/E (EPS17) 174.73$

The Boston Beer CompanyKey Management Ratios
Fiscal Years Ending Dec. 26 2013 2014 2015 2016E 2017E 2018E 2019E 2020E 2021E (CV)
Liquidity RatiosCurrent RatioCurrent Assets/Current Liabilities 1.57 1.88 2.01 1.75 1.80 1.95 2.13 2.31 2.54
Quick Ratio (Current Assets ‐ Inventories)/Current Liabilties 1.03 1.42 1.50 1.23 1.29 1.43 1.61 1.80 2.02
Cash RatioCash & Cash Equivalents/Current Liabilities 0.47 0.69 0.85 0.60 0.64 0.77 0.89 1.06 1.27
Activity or Asset‐Management RatiosTotal Asset TurnoverNet Sales/Average Total Assets 1.84 1.72 1.54 1.49 1.50 1.43 1.37 1.30 1.23
Inventory TurnoverNet Sales/Inventory 13.10 17.60 17.00 16.67 16.67 16.67 16.67 16.67 16.67
Receivables TurnoverNet Sales/Accounts Receivable 17.60 24.50 24.62 25.00 25.00 25.00 22.22 22.22 22.22
Financial Leverage RatiosDebt‐to‐Equity RatioTotal Debt/Total Equity 0.2% 0.1% 0.1% 0.1% 0.1% 0.1% 0.1% 0.0% 0.0%
Equity MultiplierTotal Assets/Total Equity 1.47 1.39 1.40 1.41 1.40 1.40 1.38 1.37 1.36
LT Liabilities RatioTotal Long‐Term Liabilities/Total Assets 0.08 0.10 0.11 0.12 0.12 0.12 0.13 0.13 0.13
Profitability RatiosGross Profit MarginGross Profit/Net Sales 52.1% 51.5% 52.3% 52.0% 52.0% 52.0% 52.0% 52.0% 52.0%
Net Profit MarginNet Income/Net Sales 9.5% 10.0% 10.3% 9.1% 9.6% 9.9% 9.9% 10.2% 10.2%
ROANet Income/Avg. Total Assets 17.5% 17.3% 15.7% 13.5% 14.4% 14.2% 13.5% 13.3% 12.5%
ROENet Income/Avg. Total Equity 25.7% 24.6% 21.9% 19.0% 20.2% 19.9% 18.8% 18.3% 17.1%

Share Price Share Price158.01 0.57 0.67 0.77 0.87 0.97 1.07 1.17 158.01 46.50% 47.00% 47.50% 48.00% 48.50% 49.00% 49.50%4.55% 295.23$ 243.71$ 207.57$ 181.30$ 160.25$ 143.92$ 130.65$ 17.40% 158.17$ 157.96$ 157.75$ 157.54$ 157.32$ 157.11$ 156.90$ 4.75% 280.37$ 231.82$ 197.67$ 172.80$ 152.85$ 137.35$ 124.76$ 17.50% 158.33$ 158.12$ 157.91$ 157.70$ 157.48$ 157.27$ 157.06$ 4.95% 266.94$ 221.04$ 188.68$ 165.07$ 146.11$ 131.37$ 119.38$ 17.60% 158.49$ 158.28$ 158.06$ 157.85$ 157.64$ 157.43$ 157.22$ 5.15% 254.75$ 211.22$ 180.47$ 158.01$ 139.95$ 125.90$ 114.46$ 17.70% 158.64$ 158.43$ 158.22$ 158.01$ 157.80$ 157.59$ 157.38$ 5.35% 243.62$ 202.24$ 172.96$ 151.54$ 134.29$ 120.87$ 109.94$ 17.80% 158.80$ 158.59$ 158.38$ 158.16$ 157.95$ 157.74$ 157.53$ 5.55% 233.43$ 194.01$ 166.06$ 145.58$ 129.09$ 116.24$ 105.77$ 17.90% 158.95$ 158.74$ 158.53$ 158.32$ 158.11$ 157.89$ 157.68$ 5.75% 224.07$ 186.42$ 159.69$ 140.08$ 124.28$ 111.96$ 101.92$ 18.00% 159.10$ 158.89$ 158.68$ 158.47$ 158.26$ 158.05$ 157.83$
Share Price Share Price158.01 0.57 0.67 0.77 0.87 0.97 1.07 1.17 158.01 6.72% 6.82% 6.92% 7.02% 7.12% 7.22% 7.32%2.14% 310.85$ 248.28$ 206.77$ 177.73$ 155.13$ 138.00$ 124.33$ 36.90% 170.85$ 166.39$ 162.15$ 158.13$ 154.30$ 150.66$ 147.18$ 2.29% 289.58$ 234.55$ 197.18$ 170.62$ 149.71$ 133.71$ 120.85$ 37.40% 170.81$ 166.35$ 162.11$ 158.09$ 154.26$ 150.62$ 147.15$ 2.44% 271.04$ 222.27$ 188.45$ 164.07$ 144.66$ 129.68$ 117.57$ 37.90% 170.77$ 166.30$ 162.07$ 158.05$ 154.22$ 150.58$ 147.11$ 2.59% 254.75$ 211.22$ 180.47$ 158.01$ 139.95$ 125.90$ 114.46$ 38.40% 170.73$ 166.26$ 162.03$ 158.01$ 154.18$ 150.54$ 147.07$ 2.74% 240.31$ 201.22$ 173.15$ 152.38$ 135.54$ 122.33$ 111.52$ 38.90% 170.69$ 166.22$ 161.99$ 157.97$ 154.15$ 150.51$ 147.04$ 2.89% 227.43$ 192.14$ 166.40$ 147.15$ 131.40$ 118.97$ 108.73$ 39.40% 170.64$ 166.18$ 161.95$ 157.93$ 154.11$ 150.47$ 147.00$ 3.04% 215.87$ 183.85$ 160.17$ 142.27$ 127.51$ 115.79$ 106.08$ 39.90% 170.60$ 166.14$ 161.91$ 157.89$ 154.07$ 150.43$ 146.97$
Share Price158.01 27.50% 28.00% 28.50% 29.00% 29.50% 30.00% 30.50%2.73% 167.09$ 161.80$ 156.51$ 151.23$ 145.94$ 140.65$ 135.36$ 2.83% 169.56$ 164.17$ 158.77$ 153.38$ 147.98$ 142.59$ 137.19$ 2.93% 172.16$ 166.65$ 161.15$ 155.64$ 150.13$ 144.62$ 139.11$ 3.03% 174.89$ 169.26$ 163.64$ 158.01$ 152.38$ 146.76$ 141.13$ 3.13% 177.76$ 172.00$ 166.25$ 160.50$ 154.75$ 149.00$ 143.25$ 3.23% 180.77$ 174.89$ 169.01$ 163.13$ 157.25$ 151.36$ 145.48$ 3.33% 183.96$ 177.94$ 171.92$ 165.90$ 159.88$ 153.86$ 147.84$
CV ROIC
Beta
Market Risk Premium
Beta WACC
Marginal Tax Rate
2017 Advertising, Promotional and Selling Expenses as a Percentage of Sales
CV Growth of NOPLAT
Risk Free Rate
2016 COGS as a Percent of Sales

VALUATION OF OPTIONS GRANTED IN ESOP
Ticker Symbol SAMCurrent Stock Price $156.08Risk Free Rate 2.59%Current Dividend Yield 0.00%Annualized St. Dev. of Stock Returns 34.20%
Average Average B‐S ValueRange of Number Exercise Remaining Option of OptionsOutstanding Options of Shares Price Life (yrs) Price GrantedRange 1 1,127,162 63.99$ 3.43 99.06$ 111,658,544$ Total 1,127,162 63.99$ 3.43 99.06$ 111,658,544$

Effects of ESOP Exercise and Share Repurchases on Common Stock Balance Sheet Account and Number of Shares Outstanding
Number of Options Outstanding (shares): 1,127,162Average Time to Maturity (years): 3.43Expected Annual Number of Options Exercised: 328,619
Current Average Strike Price: 63.99$ Cost of Equity: 7.06%Current Stock Price: $156.08
2016E 2017E 2018E 2019E 2020E 2021E (CV)Increase in Shares Outstanding: 328,619 328,619 328,619 328,619 328,619 328,619Average Strike Price: 63.99$ 63.99$ 63.99$ 63.99$ 63.99$ 63.99$ Increase in Common Stock Account: 21,028,308 21,028,308 21,028,308 21,028,308 21,028,308 21,028,308
Change in Treasury Stock 120,700,000 75,000,000 75,000,000 75,000,000 75,000,000 75,000,000Expected Price of Repurchased Shares: 156.08$ 167.10$ 178.90$ 191.53$ 205.05$ 219.53$ Number of Shares Repurchased: 790,851 448,834 419,235 391,588 365,765 341,644
Shares Outstanding (beginning of the year) 12,832,661 12,370,429 12,250,213 12,159,597 12,096,627 12,059,481Plus: Shares Issued Through ESOP 328,619 328,619 328,619 328,619 328,619 328,619Less: Shares Repurchased in Treasury 790,851 448,834 419,235 391,588 365,765 341,644 Shares Outstanding (end of the year) 12,370,429 12,250,213 12,159,597 12,096,627 12,059,481 12,046,455

Present Value of Operating Lease Obligations (2015) Present Value of Operating Lease Obligations (2014) Present Value of Operating Lease Obligations (2013)
Operating Operating OperatingFiscal Years Ending Dec. 26 Leases Fiscal Years Ending Dec. 26 Leases Fiscal Years Ending Leases2016 2,664 2015 2,263 2014 2,726 2017 2,809 2016 1,601 2015 1,989 2018 2,809 2017 1,601 2016 1,989 2019 2,478 2018 507 2017 771 2020 2,478 2019 507 2018 771 Thereafter 4,286 Thereafter 780 Thereafter 1,154 Total Minimum Payments 17,523 Total Minimum Payments 7,259 Total Minimum Payments 9,399 Less: Interest 2,695 Less: Interest 819 Less: Interest 1,110 PV of Minimum Payments 14,828 PV of Minimum Payments 6,440 PV of Minimum Payments 8,289
Capitalization of Operating Leases Capitalization of Operating Leases Capitalization of Operating Leases
Pre‐Tax Cost of Debt 4.62% Pre‐Tax Cost of Debt 4.62% Pre‐Tax Cost of Debt 4.62%Number Years Implied by Year 6 Payment 1.7 Number Years Implied by Year 6 Payment 1.5 Number Years Implied by Year 6 Payment 1.5
Lease PV Lease Lease PV Lease Lease PV LeaseYear Commitment Payment Year Commitment Payment Year Commitment Payment1 2,664 2,546 1 2,263 2,163 1 2,726 2,606 2 2,809 2,567 2 1,601 1,463 2 1,989 1,817 3 2,809 2,453 3 1,601 1,398 3 1,989 1,737 4 2,478 2,068 4 507 423 4 771 644 5 2,478 1,977 5 507 405 5 771 615 6 & beyond 2,478 3,217 6 & beyond 507 588 6 & beyond 771 871 PV of Minimum Payments 14,828 PV of Minimum Payments 6,440 PV of Minimum Payments 8,289

Present Value of Operating Lease Obligations (2012) Present Value of Operating Lease Obligations (2011) Present Value of Operating Lease Obligations (2010)
Operating Operating OperatingFiscal Years Ending Leases Fiscal Years Ending Leases Fiscal Years Ending Leases2013 1,874 2012 1,122 2011 955 2014 1,800 2013 1,121 2012 1,017 2015 1,800 2014 1,121 2013 1,017 2016 1,177 2015 920 2014 932 2017 1,177 2016 920 2015 932 Thereafter 1,518 Thereafter 67 Thereafter 902 Total Minimum Payments 9,345 Total Minimum Payments 5,269 Total Minimum Payments 5,754 Less: Interest 1,265 Less: Interest 642 Less: Interest 815 PV of Minimum Payments 8,080 PV of Minimum Payments 4,627 PV of Minimum Payments 4,939
Capitalization of Operating Leases Capitalization of Operating Leases Capitalization of Operating Leases
Pre‐Tax Cost of Debt 4.62% Pre‐Tax Cost of Debt 4.62% Pre‐Tax Cost of Debt 4.62%Number Years Implied by Year 6 Payment 1.3 Number Years Implied by Year 6 Payment 1.0 Number Years Implied by Year 6 Payment 1.0
Lease PV Lease Lease PV Lease Lease PV LeaseYear Commitment Payment Year Commitment Payment Year Commitment Payment1 1,874 1,791 1 1,122 1,072 1 955 913 2 1,800 1,644 2 1,121 1,024 2 1,017 929 3 1,800 1,572 3 1,121 979 3 1,017 888 4 1,177 983 4 920 768 4 932 778 5 1,177 939 5 920 734 5 932 743 6 & beyond 1,177 1,150 6 & beyond 67 51 6 & beyond 902 688 PV of Minimum Payments 8,080 PV of Minimum Payments 4,627 PV of Minimum Payments 4,939