krishma sip report
TRANSCRIPT

1 | P a g e K r i s h m a S a n d e s r a
Money Masters
Sri Sri University
Master of Business Administration (Finance)
By
Krishma Sandesra
MBA2015-17 000266
Under the guidance of
Mr. Ravindra Jagasia
Founder, Financial Advisor
Sri Sri University
CUTTACK -754006
July 18, 2016

2 | P a g e K r i s h m a S a n d e s r a
ANALYSING AND COMPARING THE
PERFORMANCE OF DIFFERENT MUTUAL FUNDS
AND COMPARING WITH ULIP PLANS
By
Krishma Sandesra
MBA 2015-17 000266
Sri Sri University
UTTACK - 754006
July, 2016
3 | P a g e K r i s h m a S a n d e s r a
ANALYSING AND COMPARING THE
PERFORMANCE OF DIFFERENT MUTUAL FUNDS
AND COMPARING WITH ULIP PLANS
By
Krishma Sandesra
Under the guidance of
Mr. Ravindra Jagasia
Founder, Financial Advisor
Money Masters.
Sri Sri University
CUTTACK - 754006
July, 2016

4 | P a g e K r i s h m a S a n d e s r a
CERTIFICATE OF APPROVAL
The following Summer Internship Report titled “ANALYSING AND COMPARING THE
PERFORMANCE OF DIFFERENT MUTUAL FUNDS AND COMPARING WITH ULIP
PLANS " is hereby approved as a certified study in management carried out and presented in a
manner satisfactory to warrant its acceptance as a prerequisite for the award of Master of
Business Administrationfor which it has been submitted. It is understood that by this approval
the undersigned do not necessarily endorse or approve any statement made, opinion expressed
or conclusion drawn therein but approve the Summer Internship Report only for the purpose it
is submitted.
Summer Internship Report Examination Committee for evaluation of Summer Internship
Report
Organizational Guide Signature: …………………………………
Name: Mr. Ravindra Jagasia
Designation: Founder, Financial Advisor
Email: [email protected]
Address: 7, Universal Indl. Estate,
Opp. Andheri Sports Complex,
J.P. Road, Andheri (W),
Mumbai- 400058
Tel Number: 022-26253530
Mobile No: +91 8691065757
Name: Krishma Sandesra
Roll No. FMS/MBA2015-17/000266

5 | P a g e K r i s h m a S a n d e s r a
LETTER OF ACKNOWLEDGEMENT
I really feel privileged for getting an opportunity to do a Summer Internship Project in Money
Masters. I would like to thank our Vice Chancellor Mr. Nandlalji and our Placement Co-
ordinator Mr. Virat Chirania and Ms. Tanu Kanchan for recommending me for the same.
I would also like to thank my Project Mentor Mr. Ravindra Jagasia (founder, financial advisor)
for his valuable guidance and inputs throughout the Project. I also want to thank Mrs. Vijaya
Bhatt (faculty mentor) for giving her guidance.
Special thanks to Ms. Leena Roge (Head of mutual funds department), Ms.
Reshma Manjarekar(Head of Insurance department) and Ms. Gayatri Prajapati (Insurance) for
continuously helping me to give the best in the Project.They have provided their valuable time
and required information needed for this study.
Lastly, I thank almighty, my parents, seniors and friends for their support and encouragement.
Krishma Sandesra.
FMS/MBA2015-17/000266
MBA (General Management) 2016-2017
Sri Sri University

6 | P a g e K r i s h m a S a n d e s r a
EXECUTIVE SUMMARY
This report covers detailed analysis of the different kinds of mutual funds available in
India for investment and suggesting the best funds to invest in. It will explain why
ULIPs are good investment option i.e. it is a mix of good returns + life cover. This report
explains how to analyse one’s investment portfolio and accordingly suggesting the
investment that best suits him/her from the wide range of investment products.
The project was undertaken with the following objectives in mind:
To analyse and compare the performance of different mutual funds (according
to different AMC’S, Sector, schemes)
Do a comparative analysis of Mutual Funds with other investment avenues (eg
Insurance ULIP plans), their benefits to investor
To understand customers portfolio and suggest them the investment option that
best suits him

7 | P a g e K r i s h m a S a n d e s r a
TABLE OF CONTENTS
List of chart
Chart no TITLE Page no.
1 Large cap 25
2 Small and mid cap funds 26
3 Diversified equity 27
4 Tax saver funds 27
5 Balanced Fund 28
6 MNC funds 29
7 Fund of Funds 29
8 Sector oriented funds 30
9 Short term debt 31
10 Ultra short term 32
11 Long term debt 32
12 Credit Opportunities Funds 33
13 Monthly income plan 34
14 Illustration of elite life II 35
Sr. no. Title Page
no
1 Title Page 1
2 Certificate of approval 4
3 Letter of acknowledgement 5
4 Executive summary 6
5 Chapter 1: introduction 8
5.a. Research Objective 8
5.b. Research Question 8
5.c. About the Company 8
6. Chapter 2: method 11
6.a. About mutual funds 11
6.b. Tools for Comparing and analyzing mutual funds 14
6.c. How to choose between Scheme Categories 16
6.d. Comparing mutual funds with ULIP’s 19
6.e. Managing clients portfolio 23
7 Chapter 3: results & discussion 25
7.a. Result and suggestion of mutual funds 25
7.b. Analysing client’s portfolio 36
8 Conclusions and learnings 38
9 References and Bibliography 39

8 | P a g e K r i s h m a S a n d e s r a
CHAPTER 1: INTRODUCTION
I. Research Objective
Any research done must be backed by some objectives. The following are the objective of my
research
1. To compare and analysethe different funds within the segments of different AMC’s and
with different segments, and suggest our clients the best fund to invest in.
2. To compare mutual funds with unit linked insurance plans.
3. To analyse the portfolio of the clients and suggest them where to invest. Make clients
aware of different products and software that we offer.
II. Research Question
Which mutual funds are good to invest in today?
Which out of the two – mutual funds and unit linked insurance products are good to
invest
Which are the best investments our client can put their money in, so that their different
kind of needs get fulfilled.
III. About the Company:
Vision:
To become most preferred financial advisor with a wide range of quality products.
To help our clients achieve their financial prosperity and peace of mind.
Mission:
To make financial difference in life of all more than 10,000 people in 5 years.
A financial plan is the road map for your financial life. We help you create this map for a
smooth journey.
Why do I a need financial planner?
Yes - if you have an income, a family or planning to have one in the future, retirement dreams,
and for many other financial reasons / goals that are unique to you. No one can predict the
future but one can certainly be better prepared for it. A financial planner will make sure that
you are financially prepared to deal with the unexpected and stormy times. If you don’t have a
financial planner you are more likely to end up in a financial mess. On the contrary, if you have
a financial planner most of your financial goals will be satisfactorily met. Just as one needs a
family doctor, for regular health check-ups and follow-ups, one also a financial planner. A
good financial planner alerts you and hand holds you through the financial turning points such
as change of job, decreasing spending or changing asset allocation. It covers major financial
areas of your life addressing aspects such as cash flow, savings, debt management, risk
management, children’s education planning, taxes, retirement, estate planning, and of course,
investments and a strategy for managing them. It is more than a guide.
MONEY MASTERS is here for you. We are a financial advisory firm for individual customers,
corporate, and NRIs. We analyze different investment avenues according to their return and

9 | P a g e K r i s h m a S a n d e s r a
performance and suggest our clients the best investment avenues which suit them and
design their portfolio. We have a vast client base of over more than 1000 clients and working
towards increasing it manifold. Having choices is important in investing. All believe in change
of Investors plans as their lifestyles and needs do. Through us, investors are offered an
extensive array of investment alternatives and services. We deal in following financial
investments:
1. SHARES
2. MUTUAL FUNDS
3. INSURANCE ( LIFE, GENERAL, MEDICLIAM)
4. PUBLIC ISSUES
5. FIXED DEPOSITS
6. BONDS
7. REAL ESTATE
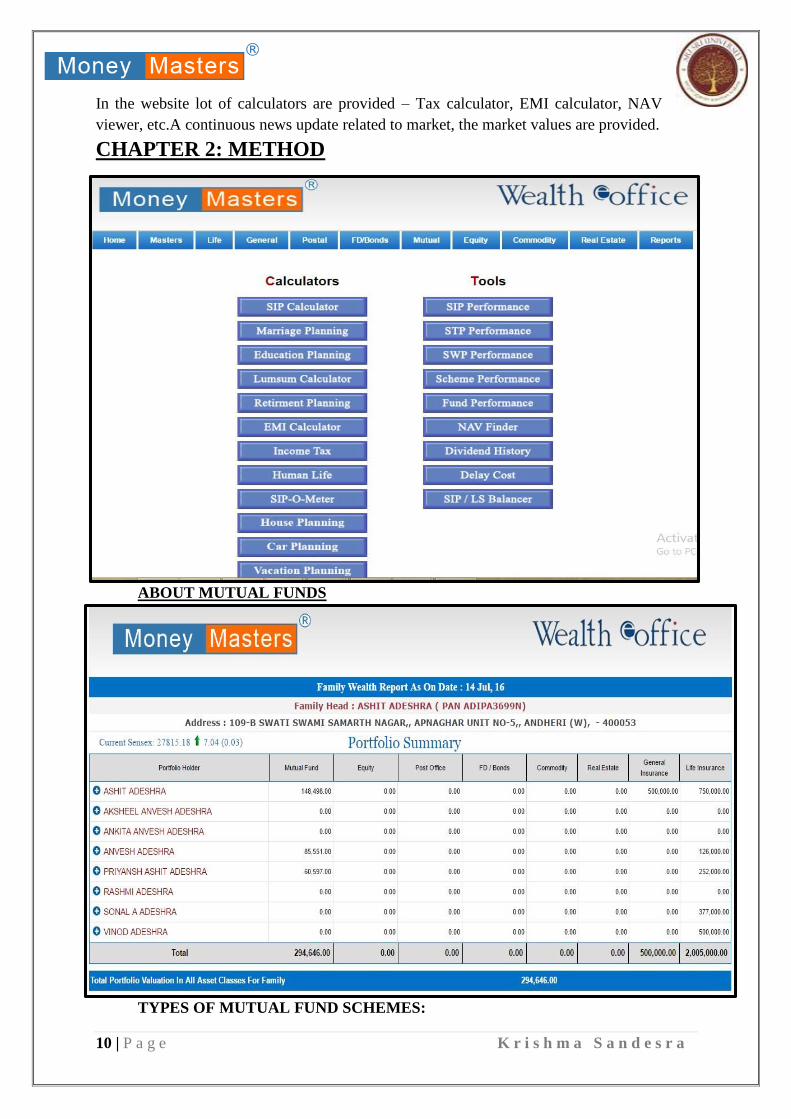
We provide software to our clients by giving them a login id and password. They can go on
www.moneymasters.co.in and sign in with login id and password and feed in all of their
investment details and can view their entire portfolio at one place any time anywhere. This can
be individual or family i.e. investment details of all the family members together. This helps
money masters also to suggest best investment avenue according to their portfolio.
10 | P a g e K r i s h m a S a n d e s r a
In the website lot of calculators are provided – Tax calculator, EMI calculator, NAV
viewer, etc.A continuous news update related to market, the market values are provided.
CHAPTER 2: METHOD
ABOUT MUTUAL FUNDS
TYPES OF MUTUAL FUND SCHEMES:

11 | P a g e K r i s h m a S a n d e s r a
By Structure
o Open-ended schemes
o Close-ended schemes
o Interval schemes
By Investment Objective
o Growth schemes
o Income schemes
o Balance schemes
o Money Market schemes
Other types of schemes
o Tax Saving schemes
o Special schemes
o Index schemes
o Sector specific schemes
Closed-end funds: Closed-end mutual funds are for a specific period of
time, one can only buy at that time. These are exchange traded.
Open-end funds: These funds buy and sell units on a continuous basis
and, hence, allow investors to enter and exit as per their convenience. The
units are bought and sold at the net asset value (NAV) declared by the
fund.
Large cap funds: Large cap funds are those mutual funds, which look for
capital appreciation by way of investing in blue chip stocks.
Mid-cap funds: Mid cap funds invest in small/medium sized companies,
but with no proper definition of classifying a company.
Equity funds: Equity mutual funds, also known as stock mutual funds
invest pooled amounts of money in public company stocks.
Balanced funds: Balanced funds are also known as hybrid fund, buying
a combination of common stock, preferred stock, bonds, and short-term
bonds.
Growth funds: Growth funds are mutual funds that target at capital
appreciation by investing in growth stocks.
Exchange traded funds: Exchange Traded Funds (ETFs) are a basket of
securities being traded on an exchange, just similar to that of a stock. They
are not like the conventional mutual funds.
Sector funds: These funds are funds that restrict the investments to a
specific segment or sector.
Index funds: An index fund aims to replicate the actions of an index of a
specific financial market.
The Advantages of investing in a Mutual Fund are:

12 | P a g e K r i s h m a S a n d e s r a
Professional Management: The primary advantage of funds (at least
theoretically) is the professional management of your money. Investors purchase funds
because they do not have the time or the expertise to manage their own portfolio. A
mutual fund is a relatively inexpensive way for a small investor to get a full-time
manager to make and monitor investments.
Diversification: By owning shares in a mutual fund instead of owning individual stocks
or bonds, your risk is spread out. The idea behind diversification is to invest in a large
number of assets so that a loss in any particular investment is minimized by gains in
others. In other words, the more stocks and bonds you own, the less any one of them
can hurt you (think about Enron). Large mutual funds typically own hundreds of
different stocks in many different industries. It wouldn't be possible for an investor to
build this kind of a portfolio with a small amount of money.
Economies of Scale: Because a mutual fund buys and sells large amounts of securities
at a time, its transaction costs are lower than you as an individual would pay.
Convenient Administration: Investing in a Mutual Fund reduces paperwork and helps
you avoid many problems such as bad deliveries, delayed payments and follow up with
brokers and companies. Mutual Funds save your time and make investing easy and
convenient.
Return Potential:Over a medium to long-term, Mutual Funds have the potential to
provide a higher return as they invest in a diversified basket of selected securities.
Low Costs:Mutual Funds are a relatively less expensive way to invest compared to
directly investing in the capital markets because the benefits of scale in brokerage,
custodial, Demat costs, depository costs etc and other fees translate into lower costs for
investors.
Liquidity: In open-end schemes, the investor gets the money back promptly at net asset
value related prices from the Mutual Fund. In closed-end schemes, the units can be sold
on a stock exchange at the prevailing market price or the investor can avail of the facility
of direct repurchase at NAV related prices by the Mutual Fund.
Transparency: You get regular information on the value of your investment in addition
to disclosure on the specific investments made by your scheme, the proportion invested
in each class of assets and the fund manager's investment strategy and outlook.
Flexibility: Through features such as regular investment plans, regular withdrawal
plans and dividend reinvestment plans, you can systematically invest or withdraw funds
according to your needs and convenience.
Affordability: Investors individually may lack sufficient funds to invest in high-grade
stocks. A mutual fund because of its large corpus allows even a small investor to take
the benefit of its investment strategy.

13 | P a g e K r i s h m a S a n d e s r a
Choice of Schemes: Mutual Funds offer a family of schemes to suit your varying
needs over a lifetime.
Well-Regulated: All Mutual Funds are registered with SEBI and they function within
the provisions of strict regulations designed to protect the interests of investors. The
operations of Mutual Funds are regularly monitored by SEBI. AMFI is the supervisory
body of Mutual Fund Industry.
Simplicity: Buying a mutual fund is easy! Pretty well any bank has its own line of
mutual funds, and the minimum investment is small. Most companies also have
automatic purchase plans whereby as little as $100 can be invested on a monthly basis.
The Disadvantages of Mutual Funds are:
The Disadvantages of investing in a Mutual Fund are:
• Professional Management: Many investors debate over whether or not the so-called
professionals are any better than you or I at picking stocks. Management is by no means
infallible, and, even if the fund loses money, the manager still takes his/her cut. We'll talk about
this in detail in a later section.
• Costs: Mutual funds don't exist solely to make your life easier--all funds are in it for a profit.
The mutual fund industry is masterful at burying costs under layers of jargon. These costs are
so complicated that in this tutorial have devoted an entire section to the subject.
• Dilution: It's possible to have too much diversification (this is explained in our article entitled
"Are You Over-Diversified?". Because funds have small holdings in so many different
companies, high returns from a few investments often don't make much difference on the
overall return. Dilution is also the result of a successful fund getting too big. When money
pours into funds that have had strong success, the manager often has trouble finding a good
investment for all the new money.
• Taxes: When making decisions about your money, fund managers don't consider your
personal tax situation. For example, when a fund manager sells a security, a capital-gain tax is
triggered, which affects how profitable the individual is from the sale. It might have been more
advantageous for the individual to defer the capital gains liability.
Tools for Comparing and analyzing mutual funds
To select the best funds we need to take into consider many things to compare the mutual funds.
I have taken the following:
Fund size

14 | P a g e K r i s h m a S a n d e s r a
Portfolio Turnover Ratio
Standard Deviation
Beta
Sharpe Ratio
Expense Ratio
Annualised return (%) CAGR for 1, 3, & 5 years
Weighted Average YTM
Average Maturity
Modified Duration
Fund Size The size of funds needs to be seen in the context of the proposed investment universe. Thus, a
sector fund with net assets of Rs 1,000 crore, is likely to find investment challenging if the all
the companies in the sector together are worth only about Rs 10,000 crore. On the other hand,
too small a fund size means that the scheme will not benefit from economies of scale.
Portfolio Turnover Purchase and sale of securities entails broking costs for the scheme. Frequent churning of the
portfolio would not only add to the broking costs, but also be indicative of unsteady investment
management.
Portfolio Turnover Ratio is calculated as Value of Purchase and Sale of Securities during a
period divided by the average size of net assets of the scheme during the period. Thus, if the
sale and purchase transactions amounted to Rs 10,000 crore, and the average size of net assets
is Rs 5,000 crore, then the portfolio turnover ratio is Rs 10,000cr ÷ Rs 5,000cr i.e. 200%. This
means that investments are held in the portfolio, on an average for 12 months ÷ 2 i.e. 6 months.
The portfolio turnover needs to be viewed in the light of the investment style. 6 month holding
period may be too short for a value investment style, but perfectly acceptable for a scheme that
wants to benefit from shifts in momentum in pivotal.
BETA
Beta describes the relationship between the stock’s return and index returns. There can be direct
or indirect relation between stock’s return and index return. Indirect relations are very rare.
1) Beta = + 1.0
It indicates that one percent change in market index return causes exactly one percent change
in the stock return. It indicates that stock moves along with the market.
2) Beta= + 0.5
One percent changes in the market index return causes 0.5 percent change in the stock
return. It indicates that it is less volatile compared to market.
3) Beta= + 2.0

15 | P a g e K r i s h m a S a n d e s r a
One percent change in the market index return causes 2 percent change in the stock return.
The stock return is more volatile. The stocks with more than 1 beta value are considered to be
very risky.
4) Negative beta value indicates that the stocks return move in opposite direction to the
market return.
5) Beta= N*∑XY- (∑X) (∑Y) / N(∑X) * (∑x)2
Where
N- No of observation X- Total of market index value Y- Total of return to Nav
Sharpe Ratio An investor can invest with the government, and earn a risk-free rate of return (Rf). T-Bill
index is a good measure of this risk-free return. Through investment in a scheme, a risk is
taken, and a return earned (Rs). The difference between the two returns i.e. Rs – Rf is called
riskpremium. It is like a premium that the investor has earned for the risk taken, as compared
to government’s risk-free return. This risk premium is to be compared with the risk taken.
Sharpe Ratio uses Standard Deviation as a measure of risk. It is calculated as(Rs minus Rf) ÷
Standard DeviationThus, if risk free return is 5%, and a scheme with standarddeviation of 0.5
earned a return of 7%, its Sharpe Ratio would be(7% - 5%) ÷ 0.5 i.e. 4%.Sharpe Ratio is
effectively the risk premium per unit of risk. Higher the Sharpe Ratio, better the scheme is
considered to be. Careshould be taken to do Sharpe Ratio comparisons betweencomparable
schemes. For example, Sharpe Ratio of an equityscheme is not to be compared with the Sharpe
Ratio of a debtscheme.
Expense Ratio Any cost is a drag on investor’s returns. Investors need to beparticularly careful about the cost
structure of debt schemes, because in the normal course, debt returns can be much lower than
equity schemes. Similarly, since index funds follow a passive investment strategy, a high cost
structure is questionable in such schemes.
Fund age It is especially important for equity schemes, where there are more investment options, and
divergence in performance of schemes within the same category tends to be more.
Tracking Error Amongst index schemes, tracking error is a basis to select thebetter scheme. Lower the tracking
error, the better it is. Similarly,Gold ETFs need to be selected based on how well they track
goldprices.
Annualised return (%) CAGR
It is the returns given by the fund over a period of time. I have taken CAGR for 1, 3, & 5 years.
The more the return the better is the fund. Fund having higher CAGR within one segment
should be chosen.

16 | P a g e K r i s h m a S a n d e s r a
Weighted Average YTM Yield to Maturity (YTM) is indicative of what returns can be expected out of fund’s portfolio.
YTM must be compared with current returns of your traditional safer instruments. YTM of
debt funds should not be abnormally higher as these would at times mean compromising on
the quality and safety of instruments. This increases credit risk in those instruments held by the
debt funds and at times even leads to liquidity risk also.
Average Maturity and Modified Duration
A bond portfolio usually consists of a number of bonds where each could have a different
maturity date. Maturity is the time period remaining before which a bond comes up for
repayment by the issuer. Average maturity is simply the weighted average time left up to the
maturity of the various bonds in a portfolio. Modified duration is a variant of Macaulay duration
and is used to measure how much the bond price will vary for every 1% change in yield. If say,
the modified duration of a bond or portfolio is 3, then 1% change in yield will cause a 3%
change in bond price.
How to choose between Scheme Categories? Risk levels, especially across categories, are subjective. Yet, as a learning-aid, a pictorial
representation of the risk hierarchy of different schemes follows:
Equity Funds While investing in equity funds, a principle to internalize is that markets are more predictable
in the long term, than in the short term. So, it is better to consider equity funds, when the
investment horizon is adequately long. How long is long? Investing in equities with a horizon
below 2 years can be dangerous. Ideally, the investor should look at 3 years. With an investment
horizon of 5 years and above, the probability of losing money in equities is negligible. Chances
are that within this 5 year horizon, the investor will have at least one window of opportunity,
to sell the equity investments for an attractive return. The role of various broad equity scheme
categories in an investor’s portfolio is as follows:
Active or Passive Index funds are passive funds. They are expected to offer a return in line with the market. An
investor in an active fund is bearing a higher cost for the fund management, and a higher risk.
Therefore, the returns ought to be higher i.e. the scheme should beat the benchmark, to make
the investor believe that choice of active scheme was right. This, in no way, means that the
higher return that ought to happen, will happen.
Investors who are more interested in the more modest objective of having an equity growth
component in their portfolio, rather than the more aggressive objective of beating the equity
market benchmark, would be better off investing in an index fund. This again does not mean
that the NAV of an index fund will not decline in value. If the bench mark index goes down,
then the NAV of the index fund too will go down. However, as suggested earlier, if the investor
has a long enough horizon, then his investment will do well, in line with the overall market.
Several pension funds are limited by their charter, to take equity exposures only through index
funds.
Diversified, Sector or Thematic

17 | P a g e K r i s h m a S a n d e s r a
The critical difference between the two is that the multi-sector exposure in a diversified
fund makes it less risky. Further, in an actively managed diversified fund, the fund manager
performs the role of ensuring higher exposure to the better performing sectors. An investor,
investing or taking money out of a sector fund has effectively taken up the role of making the
sector choices. Diversified funds should be part of the core portfolio of every investor.
Investors who are comfortable with risk can invest in sector funds. Further, an investor should
have the skill to make the right sector choices, before venturing into sector funds. Some
investors are more comfortable identifying promising investment themes (for example,
infrastructure), rather than specific sectors (like cement, steel etc.). Such investors can decide
on investment themes they would like to buy. At any point of time, an investor in sector funds
should have exposure to not more than 3 - 5 different sectors. Investing in more sectors than
that, would amount to having a diversified portfolio of sector funds. The investor can save a
lot of time by investing in a diversified fund instead! Large-cap v/s Mid-cap / Small Cap Funds
When industry scenario is difficult, the resource strengths of large cap front-line stocks help
them survive; many mid-cap / small cap companies fall by the way side during economic
turmoil, because they lack the resources to survive. It can therefore be risky to invest in mid-
cap / small cap funds during periods of economic turmoil. As the economy recovers, and
investors start investing in themarket, the valuations in front-line stocks turn expensive. At this
stage, the mid-cap / small cap funds offer attractive investment opportunities. Over a long
period of time, some of the mid-cap and small-cap companies will become large companies,
whose stocks get rerated in the market. The healthy returns on such stocks can boost the returns
on mid-cap and small-cap portfolios. Growth or Value funds As seen in the previous unit, in
the initial phases of a bull run, growth funds tend to offer good returns. Over a period of time,
as the growth stocks get fully valued, value funds tend to perform better. Investments in value
funds yield benefits over longer holding periods. In a market correction, the Growth funds can
decline much more than value funds.
Arbitrage funds These are not meant for equity risk exposure, but to lock into abetter risk-return relationship
than liquid funds – and ride on the tax benefits that equity schemes offer. Domestic Equity v/s
International Equity funds When an Indian investor invests in equities abroad, he is essentially
taking two exposures:
• An exposure on the international equity market
• An exposure to the exchange rate of the rupee. If the investorinvests in the US, and the US
Dollar becomes stronger during the period of his investment, he benefits; if the US Dollar
weakens (i.e. Rupee becomes stronger), he loses.
Investors might consider investing abroad, for any of the following reasons:
He feels that the overall returns (international equity + exchange rate movement)will be
attractive
• He is taking an asset allocation call of diversifying his investments to reduce the risk.
Debt Funds Debts funds are less risky than equity funds for the reasons discussed in the previous unit.
These can be structured in various ways to meet useful investor needs. Some of these structures,
and their benefits to investors were discussed in Unit 1. The risks in these structures, as
discussed in the previous unit, need to be understood. Regular Debt Funds v/s MIPs. MIP has
an element of equity in its portfolio. Investors who do not wish to take any equity exposure,
should opt for a regular debt fund.

18 | P a g e K r i s h m a S a n d e s r a
Open-end Funds v/s FMP FMP is ideal when the investor’s investment horizon is in synch with the maturity of the
scheme, and the investor is looking for a predictable return that is superior to what is available
in a fixed deposit. An investor who is likely to require the funds anytime, would be better of
investing in a normal open-ended debt fund.
Gilt Funds v/s Diversified Debt Funds Diversified debt funds invest in a mix of government securities (which are safer) and non-
government securities (which offer higher yields, but are subject to credit risk). A diversified
mutual fund scheme that manages its credit risk well can generate superior returns, as compared
to a Gilt Fund. Long-Term Debt Fund v/s Short Term Debt Fund As discussed in the previous
unit, longer term debt securities fluctuate more than shorter term debt securities. Therefore,
NAVs of long-term debt funds tend to be more volatile than those of short-term debt funds.
It was also seen that as yields in the market goes down, debt securities gain in value. Therefore,
long term debt funds would be sensible in declining interest rate scenarios. However, if it is
expected that interest rates in the market would go up, it would be safer to go with Short Term
Debt Funds.
Money Market Funds / Liquid Schemes An investor seeking the lowest risk ought to go for a liquid scheme However; the returns in
such instruments are lower. The comparable for a liquid scheme in the case of retail investors
is a savings bank account. Switching some of the savings bank deposits into liquid schemes
can improve the returns for him. Businesses, which in any case do not earn a return on their
current account, can transfer some of the surpluses to liquid schemes. Just as it is not advisable
to keep all of one’s moneys in a savings bank account – some money needs to go into fixed
deposits in order to improve returns – similarly, all of one’s mutual fund investments should
not be in liquid schemes. Hence there is a need to invest in other debt schemes – and also equity
schemes. Schemes that are named ‘liquid plus’ are not more liquid. These are like the Short
Term Funds discussed earlier. They try to earn a higher return by investing in securities of a
longer tenor than the regular liquid schemes. As the tenor increases, risk too increases. In order
to prevent potential mis-selling, SEBI has now disallowed the use of the term ‘liquid plus’ as
a fund type.
Regular Debt Funds v/s Floaters Regular debt funds are subject to the risk of fluctuations in NAV. Since floating rate debt
securities tend to hold their values, even if interest rates fluctuate, the NAV of floaters tend to
be steady. When the interest rate scenario is unclear, then floaters are a safer option. Similarly,
in rising interest rate environments, floaters can be considered as an alternative to short term
debt funds and liquid funds.
Balanced Schemes The discussion on asset allocation brought out the benefit of diversifying the investment
portfolio across asset classes. An investor desirous of having a mix of debt and equity exposures
has two options –
• He can invest in a mix of equity schemes and debt schemes. He can invest in a balanced
scheme, which in turn invests in a mix of equity and debt securities.
The first option obviously implies more decisions on scheme. Selection that the investor would
need to take. But the benefit is that the investor has a wide array of scheme options, within both

19 | P a g e K r i s h m a S a n d e s r a
equity and debt scheme categories. Further, the investor would be in a position to work
towards a mix of debt and equity that is most appropriate for him.
Investing in a balanced scheme makes things simpler for the investor, because fewer scheme
selection decisions need to be taken. However, the investor would need to go by the debt-equity
mix in the investment portfolio of the schemes.
Investors need to be cautious of the high risk potential of a variant of balanced schemes that
are structured as flexible asset allocation schemes. Further, balanced schemes may be taxed as
a debt scheme or an equity
Gold Funds Investors need to differentiate between Gold ETF and Gold Sector Funds. The latter are
schemes that invest in shares of gold mining and other gold processing companies. The
performance of these gold sector funds is linked to the profitability and gold reserves of these
gold companies – unlike Gold ETFs whose performance would track the price of gold. When
gold metal prices go up, gold mining companies with large reserves of gold can appreciate a
lot more than the gold metal. Conversely, they can also fall more when gold metal prices
decline.
Investors therefore need to understand the structure of the gold schemes more closely, before
investing.
Comparing mutual funds with ULIP’s
In terms of structure and functioning, ULIPs as an investment avenue compares well with
mutual funds. Just like mutual funds, the insurance company allots units to its ULIP investors
and a net asset value (NAV) is declared on a regular basis. Along with that, ULIPs have the
liberty to invest across assets just like mutual funds.
Of course, to say that the two are similar except for the insurance is simplistic. Despite all the
similarities, there are several factors that set them apart. We evaluate the two avenues on the
most critical parameters to see how they measure up.
Ease of investment Investors have greater flexibility while investing in a mutual fund. In most cases they can start
small with as little as ₹ 500 a month for as short a horizon as 12 months. This feature known
as SIP i.e. Systematic Investment Plan, proves to be affordable for just about anyone—even
college students and is a great way to start saving for a goal. An investor once he commits to
an SIP can discontinue midway without any penalty or financial implications and his
investment remains intact.
ULIPs on the other hand are more structured in that sense. The insurance advisor will assess
your income, your financial responsibilities and will draw up an investment plan, which will
entail paying a fixed premium for a minimum of 5 years. If the individual wants to exit the
ULIP before the minimum investment tenure, there is a financial implication and he stands to
lose part of his premium.
Needless to say, investing in mutual funds is easier and embraces a larger segment of the
investor community.
Expenses
20 | P a g e K r i s h m a S a n d e s r a
As determined by the Securities and Exchange Board of India (SEBI), expenses charged
by mutual funds to investors for a range of activities like fund management, sales and
marketing, administration are subject to certain limits. For example, equity-oriented funds can
charge investors a maximum of 2.25% per annum for all expenses; if it exceeds the limit, the
expenses will be borne by the fund house instead of investors.
The Insurance Regulatory and Development Authority (IRDA), the regulator for insurance
companies, also prescribes limits on certain but not all ULIP expenses. The most expensive
part about ULIPs is the high-premium allocation charge usually not exceeding 10% of
premium. This was even higher before IRDA clamped down to eschew mis-selling in ULIPs.
Then there are mortality charges, fund management charges and policy administration charges
among others. Most of these charges are without limits and at the discretion of the life insurer.
Since higher expenses translate into lower return, expenses have far-reaching consequences
and must not be taken lightly. A big advantage mutual funds enjoy is that the investor knows
upfront what he is getting into from an expenses perspective, because the structure is very
simple. ULIPs on the other hand have complex expense structure, which to comprehend might
not be easy for everyone. From a purely expense perspective, mutual funds are more cost-
effective, which will reflect in their performance vis-à-vis ULIPs, everything else being the
same.
Portfolio disclosure Based on SEBI guidelines, mutual funds are expected to disclose their portfolios on a quarterly
basis, although most disclose them monthly as best practices. This gives investors a chance to
study their portfolio and figure out where and how their money is working for them.
ULIPs are also required to disclose their portfolios on a quarterly basis and like mutual funds
many choose to do so monthly for greater transparency.
Flexibility in altering asset allocation Mutual funds are not as flexible or friendly as ULIPs in giving investors the opportunity to
migrate across plans. The facility to switch across plans is particularly useful for informed
investors, who want to migrate from equity to debt at peak market levels or from debt to equity
at the bottom.
When an investor in a diversified equity fund wants to switch to another mutual fund within
the same fund house, there is usually a cost implication in terms of entry or exit loads. Also, in
most cases he is required to invest particularly in long-term equity and debt-oriented firms for
a minimum investment tenure, violating which entails an exit load.
ULIPs offer more freedom to investors in terms of migrating across various asset allocation
plans. Most insurers offer certain free switches a year, exceeding which investors may be
charged a nominal fee per switch.
Tax benefits Under Section 80C of the Income Tax Act, premium on ULIP investments are allowed as
deduction from income up to a limit of Rs. 150,000. Likewise ULIP proceeds are tax-free in
the hands of investors under Section 10 (10D). There are detailed guidelines on the percentage
of the ULIP premium eligible for tax benefit.

21 | P a g e K r i s h m a S a n d e s r a
As far as Section 80C is concerned, only Equity Linked Savings Schemes (ELSS)
qualifies for tax benefit. So investments up to a maximum of Rs. 150,000 in ELSS are allowed
as deduction from income. ELSS proceeds are not tax-free in the sense that they attract
Securities Transaction Tax (STT) on redemption.
Non-ELSS mutual funds have varying tax implications on redemption depending on the nature
of the mutual fund viz. equity-oriented, debt-oriented, money-market/liquid fund.
There isn't a clear winner. Both ULIPs and mutual funds have their benefits and investors
should ideally consult their investment advisors before making an investment.
Types of ULIP Plans– Classification by Purpose
ULIPs are best classified on the basis of purpose they serve.
ULIP for Retirement - In this plan, you need to make the payment during your tenure
with your employer, which is automatically collected in a corpus amount, which is paid
in the form of annuities to a policyholder after retirement.
ULIPs for Wealth Collection – This plan primarily accumulates your wealth over a
period of time. Such plans are recommended for people who are in the late twenties and
early thirties and by investing in this plan; they get the flexibility to fund their any future
financial goal.
ULIP for Children Education – As a parent, you want to ensure that no unforeseen
event affects your child’s overall education in any condition. There are several ULIP
plans that provide money in small chunks in the key events of your children’s life. This
ensures that no unforeseen even hinders their life in any manner.
ULIPs for Health Benefits – In addition to some common benefits, ULIPS efficiently
provide financial assistance to meet medical contingencies.
7 Reasons Why ULIPs are Good Choice
Being an investment-cum-insurance policy, ULIP is among the most productive options to
choose for investment. In this plan, the sum of your money is invested across stock markets,
which generates considerable returns and provides you with the coverage for any risk as long
as the policy remains in force.
Following benefits of ULIPs make them fall under investment options: o Transparent structure, features, and charges
o Flexibility to switch between funds
o In cover option
o Different premium paying frequencies
o Various fund options to suit both risk takers and averters
o Rider options for additional coverage
Tax benefit u/s 80C, 80D and 10 (10D)
Parameters Low Cost ULIPs Traditional Plans Mutual Funds
Definition
A ULIP is insurance cum
investment plan in which
risk cover is promised, but
return solely depends on the
market performance
Traditional plan is insurance
cum investment plan that
promises both risk cover and
returns to the investor
A mutual fund is a pure
investment product that
gives market linked returns.
There's no risk cover

22 | P a g e K r i s h m a S a n d e s r a
Investment
The money is invested in
debt, equity and hybrid
funds which can be chosen
as per risk capacity
The money is invested only
in debt instruments
The money is invested in
equities, debts and other
money market instruments
Liquidity
You can withdraw money
but only after the lock in
period (currently 5 years)
Traditional Plan locks in
your funds. You can't
withdraw money before
maturity
No lock-in period. Cashing
out your funds is easy
Loyalty benefits
Loyalty benefits are given
on long term investment of
ULIPs
Some traditional plans offer
loyalty benefits to
policyholders for continuing
the policy for the full tenure
No loyalty or long term
benefit is given
Risk factor It is a market linked product
so there is risk element
These plan cater to people
having low risk appetite
Mutual funds are risky
ULIP Charges
ULIPs do have certain charges associated with them, which can be sub-divided into multiple
categories. Following are the one you must know:
Premium Allocation Charges – The charges, namely premium allocation charges are
imposed - beforehand on the premium paid by the investor. These are the initial
expenses incurred by a company in issuing the policy, like medical expenses and
underwriting cost. This charge is highest among all the charges. SEBI has set a cap – it
can be 10% at highest for regular pay then year by year it decreases. It is less in one
pay option.
Policy Administrative Charges - These charges are deducted regularly for the
recovery of expenses borne by the insurance company for maintaining a life insurance
policy. This charge at max can be - Rs.500/p.m. (Rs.6000/p.a.)
Surrender Charges– These charges refer to the deduction for full or partial
encashment of premature units subject to the policy documents. These charges are
levied as a percentage of the fund value or as a percentage of the premium.
Mortality Charges – The expenses, namely mortality charges are borne by the insurer
to provide a life cover to insured, which vary with the age and sum assured of the policy.
These charges are deducted on a monthly basis. The younger the age lesser the mortality
charge.
Fund Management Charges – The aggregated sum through ULIP funds is invested in
equity instruments and debt. The insurer bears these charges for fund management,
which vary with both fund and plan. The amount is subject to deduction calculating the
net asset value or NAV. This charge is
Fund Switching Charge – ULIP plans enable you to invest your hard-earned money
in different fund options that further have multiple debts equity exposure as well as
provide you with the option to switch between different funds for which your insurance
company will charge the switching fee. Most of the policies provide few free switches
every year.

23 | P a g e K r i s h m a S a n d e s r a
Discontinuance Charges – On premature discontinuation of a plan within lock-
in period, the insurer deducts a small fee. Since these charges are preset by IRDA, these
are the same for almost all policies. This charge applies if we discontinue the policy
before its term gets over. If we surrender in the first year itself in 5 pay option charge
starts from 6% of the annualised premium/ fund value, it reduces to 4% in 2nd year, 3%
in 3rd year, 2% in 4th and 5th year. In the case of one pay option it starts from 1% of the
annualised premium/fund value in 1st year, and reduces to 0.5% in 2nd year, 0.25% in
3rd year, 0.1% in 4th year. It cannot exceed a maximum of Rs. 6000.
MANAGING CLIENTS PORTFOLIO All the client’s investment portfolios are present in the website. I used to view their portfolio
and analyzing it. According to the profile and we can decide what type of investment we can
suggest them. It also depends on their income, age, gender, education, etc. factors. It is
explained further.
Age
group 18-24:
These are young college students, maybe just started working. They can start their savings at
this age. In this group there are people having good amount of money and a risk taking attitude
can invest in shares and mutual funds. Others with little/ moderate amount of money we can
suggest them to start mutual fund – SIP.
Age group 25-30:
These are young emerging professionals. They have started earning and going up the level,
taking own decisions. Now in this group, people with moderate and low income can invest in
mutual funds (SIP or lump-sum), life insurance (term, endowment, ULIPs), Medical insurance
People who are earning high income – we can suggest them shares, mutual funds (SIP or lump-
sum), life insurance (term, endowment, ULIPs), Medical insurance, car insurance, travel
insurance, real estate, etc.
24 | P a g e K r i s h m a S a n d e s r a
Age group 30-45:
With increasing age comes lot of responsibilities. They think of children’s future planning, and
retirement planning. We suggest them to invest in mutual funds (SIP or lump-sum), life
insurance (children’s plan, term plan, ULIPs, endowment, money back plans), Medical
insurance, car insurance, travel insurance. People with high income can also invest in shares
and real estate.
Age group 45-55:
Mainly these people invest in retirement planning schemes, endowment insurance, FDs, bonds,
such guaranteed return schemes.
Age group55+ (retired person):
We suggest them mutual funds – dividend yield option, FDs, bonds.’
Businessman:
We suggest them mutual funds, Medical insurance, real estate, travel insurance ULIPs, and
more importantly term insurance as lot of responsibilities are there on them. You can do it in 3
ways
I. As an individual - You can either take as an individual or by proprietorship to safeguard
your business
II. Under Married women property act - It is a solution to protect your family wealth from
third party litigation. It can protect the life insured death claim benefit from the creditors
and ensure that your wife and childrens are secured. Only the family can make a claim
no third party (creditors).
III. Under employer employee scheme - Employees are important assets of the company
who helps you top build your company stronger and bigger. Employers can ensure their
employees life. You can take it by partnership firm or private ltd company.
IV. CHAPTER 3: RESULTS & DISCUSSION
Result and suggestion of mutual funds It is very difficult for an investor to just select schemes for investments in any fund. Before
investing, the investor should go for a detailed study of the fund, which includes portfolio
analysis, type of fund and its return for last one year, three year, and since inception. & the
risk involved in each fund, which is mentioned in the Fact Sheet.

25 | P a g e K r i s h m a S a n d e s r a
I have compared and analysed all different kind of funds. These funds are of different
AMCs. They are as follows:
Axis mutual fund
Birla sun life mutual fund
DSP Black Rock mutual fund
Franklin India mutual fund
HDFC mutual fund
Reliance mutual fund
Kotak mutual fund
L&T mutual fund
ICICI Prudential mutual fund
SBI mutual fund
IDFC mutual fund
These are the final suggested funds the analysis is done in excel sheet
Large Cap Funds:
These funds invest only in shares of large cap companies. The following are recommended
funds
The highest return is of ICICI Prudential Top 100 Fund with the highest CAGR, 1
year-8.1%, 3 years- 19.6%, 5 years- 12.7% but expense ratio is high-2.44%.
Kotak select focus fund is also preferable as it is giving good returns with CAGR,
1 year-6.8%, 3 years- 25.3%, 5 years- 15.8% and good Sharpe ratio- .86 and
expense ratio is also low- 2.02%. The portfolio turnover ratio is also highest among
other-23%, but its good as we are getting good returns it shows the spontaneity of
fund manager
Birla sun life blue chip fundhasCAGR, 1 year-5.9%, 3 years- 23.5%, 5 years-
17.1%but its expense ratio is very high- 2.38% and beta is also high-1.11.
ICICI Prudential Top 100 Fund has given good return with good Sharpe ratio and
low beta
0
5
10
15
20
25
30
Franklin IndiaBluechip Fund
Franklin IndiaOpportunities
Fund
KOTAK SELECTFOCUS FUND
SBI BLUE CHIPFUND
Birla Sun LifeTop 100 Fund
Birla Sun LifeEquity Fund
ICICI PrudentialTop 100 Fund
CA
GR
Chart 1:Large cap

26 | P a g e K r i s h m a S a n d e s r a
ICICI Prudential Top 100 Fund then next SBI blue chip fund, Kotak select
focus fund then Franklin India Opportunity fund.
Small and Mid Cap Funds: These funds invest in shares of small cap and mid cap companies. These companies are in
development phase of the business lifecycle so the growth expected is high. The following are
recommended funds
The best fund in this section is DSP Black Rock Micro Cap Fund with the highest
CAGR, 1 year-15.4%, 3 years- 46.1%, 5 years- 25.4%. It has high sharpe ratio-1.79 and
low beta – 0.85.
The next best performed fund is L&T Emerging Businesses Fund as it is a new fund it
has only completed one year but has performed brilliantly, CAGR- 1 year -14.4%. One
can invest in this fund.
Then comes Reliance Small Cap Fund with CAGR, 1 year-13.7%, 3 years- 43.8%, 5
years- 22.9%. But it has low sharpe ratio – 0.32
Followed by Birla Sun Life Small & Midcap Fund with CAGR, 1 year-13.7%, 3 years-
32.1%, 5 years- 19%. It has average sharpe ratio-1.09 and low beta – 1.
Diversified Equity Fund:
These funds invest in shares of companies of all sectors. This reduces the risk of market
fluctuations affecting the fund. The following are recommended funds
The best performing of diversified equity is L&T India Value Fund with CAGR, 1 year-
8.7%, 3 years- 31.4%, 5 years- 20.1%. It has high sharpe ratio-1.27 but beta is high –
1.16.
0
10
20
30
40
50
CA
GR
Chart 2: Small & mid cap

27 | P a g e K r i s h m a S a n d e s r a
The 2nd comes new comer fund ICICI Prudential Equity Income Fund with
CAGR- 1 year -8.3%.
Next is ICICI Prudential Value Discovery Fund with CAGR, 1 year-6.4%, 3 years-
33%, 5 years- 19.6%.
Then comes HDFC Small and Mid-Cap Fund which was moderate earlier but now
performing well with 1 year CAGR – 8.8%
Tax Saver Funds These funds have tax free returns. The following are recommended funds
The best performing of diversified equity is Reliance Tax Saver (ELSS) Fund (G) with
CAGR, 1 year-9.14%, 3 years- 28.8%, 5 years- 16.78%
Then L&T Tax Saver Fund with CAGR, 1 year-8.6%, 3 years- 23.9%, 5 years- 13.2%.
It has high sharpe ratio-1.06 but beta is high – 1.01.
DSP Blackrock Tax saver has given highest return with CAGR, 1 year-5.9%, 3 years-
23.7%, 5 years- 16.2%, and its expense ratio is also not too high – 2.01% with good
Sharpe ratio and beta. It is good fund to invest in.
Birla sun life Relief ’96 is also giving good returns with CAGR, 1 year-4.2%, 3 years-
26.2%, 5 years- 16.3%. The Sharpe ratio and expense ratio is also decent.
-505
101520253035
CA
GR
Chart 3: Diversified Equity
0
10
20
30
CA
GR
Chart 4: Tax saver

28 | P a g e K r i s h m a S a n d e s r a
ICICI Prudential long term equity fund is next best fund one can invest in followed
by Franklin India Tax Saver fund.
Balanced Fund In this there is a mix of equity and debt instrument so that fund grows at the same time in
secured to some extent. The following are recommended funds
Reliance Regular Savings Fund - Balanced Option is the top performing balanced fund
with CAGR, 1 year-8.7%, 3 years- 18.83%, 5 years- 13.58%, but it has high beta-1.22
and low Sharpe ratio- 0.24 so we can keep it as 2nd/3rd option.
Birla Sun Life Dynamic Asset Allocation Fund has now started performing better than
earlier with 1 year CAGR- 8.6%, 3 years 15.1%, 5 years10.2%. The only problem is it
has highest expense ratio-2.97%, we can wait and see if it’s improves further and give
high return then we can suggest it.
Then comes Birla Sun Life Balanced ‘95 Fund with CAGR, 1 year-7.4%, 3 years-
20.1%, 5 years- 14.3%.
Followed by L&T India Prudence Fundwith CAGR, 1 year-6.6%, 3 years- 22.2%, 5
years- 15.6%.
MNC funds The corpus of the fund is invested in international market equity. As the world market is down
from past sometime so lot of funds is underperforming.
0
5
10
15
20
25
SBI MagnumBalanced
fund
RelianceRegular
Savings Fund- Balanced
Option
ICICIPrudentialChild CarePlan (Gift
Plan)
Birla Sun LifeDynamic
AssetAllocation
Fund
ICICIPrudentialBalanced
AdvantageFund
L&T IndiaPrudence
Fund
Birla Sun Life Balanced ‘95
Fund
CA
GR
Chart 5: Balanced fund

29 | P a g e K r i s h m a S a n d e s r a
Some funds are doing well mostly gold funds - Kotak World Gold Fund with
CAGR of 1 year 65%, 3 years 14.5%
The other is DSP Black Rock World Gold Fund with CAGR 1 year- 41.9%, 3 years-
10.5%
Kotak Us Equity Fund is new fund but has performed better than others with 1 year
CAGR- 2.6%
Fund of Funds The corpus is invested in other well performing funds. It can be of other AMCs also.
Birla sun life global real estate fund invest in funds of global real estate. Is has
performed well with CAGR, 1 year-10.1%, 3 years- 7.6%, 5 years- 12.4%.
Next gold funds has done really good and Birla Sun Life Gold Fund has given good
returns with CAGR, 1 year-9.8%, 3 years- 2.8%
Followed by IDFC All Seasons Bond Fund with CAGR, 1 year-8.4%, 3 years- 9%, 5
years 8.8%
Birla Sun Life Active Debt Multi Manager FoF Scheme have started performing well
with 1 year CAGR- 8.1%
Sector Oriented Funds The corpus is invested in only a particular sector. It is very specific.
-10
0
10
20
30
40
50
60
70
Birla Sun Life MNCFund (small and
mid cap
DSP BlackRockWorld Gold Fund
KOTAK US EQUITYFUND
KOTAK WORLDGOLD FUND
CA
GR
Chart 7: Funds of Fund
0
10
20
birla sun lifeglobal realestate fund
Birla Sun LifeGold Fund
Birla Sun LifeAsset
AllocatorMulti
Manager
Birla Sun LifeActive Debt
MultiManager
IDFC AllSeasons Bond
Fund
CA
GR
Chart 6: MNC fund

30 | P a g e K r i s h m a S a n d e s r a
The infra funds have underperformed in past 1 year except one fund - Kotak
Infrastructure & Economic Reform Fund has performed well with CAGR, 1 year-
10.7%, 3 years- 36.2%, 5 years 20.9%.
Birla Sun Life Banking and Financial Services Fund is a new fund and has performed
well with 1 year CAGR- 10.8%
Reliance Media & Entertainment Fund has outstanding performance with CAGR, 1
year-16.5%, 3 years- 18.4%, 5 years 16.2%.
SBI FMCG Fund has also performed well with CAGR, 1 year-14.1%, 3 years- 15.5%.
Technology funds has performed well- Birla Sun Life New Millennium Fund with
CAGR, 1 year-11.2%, 3 years- 26.9%, 5 years 15.4%.
The next technology fund is DSP Black Rock Technology.com Fund with CAGR, 1
year-10.3%, 3 years- 24.2%, 5 years 12.2%.
Index Funds These are funds just chasing sensex or nifty. They invest in that company which are included
in the index and in the same proportion so the returns are almost same but the least tracking
error was of Kotak Nifty ETF
Hybrid Funds The corpus is invested in equity, debt instruments, gold etc. these are for specific purpose i.e.
HDFC Children’s Gift Fund Investment plan, Franklin India Pension Plan, Axis Children's gift
fund, Axis Income Saver fund (low risk)
The best performing is HDFC Children’s Gift Fund Savings Plan with CAGR, 1 year-8.9%,
3 years- 12.8%, 5 years 10.5%, YTM – 7.89%, average maturity- 8.16 years.
Debt Funds
-505
10152025303540
CA
GR
Chart 8: Sector oriented

31 | P a g e K r i s h m a S a n d e s r a
These funds invest in secure instruments like treasury bills, commercial papers, corporate
bonds, government bonds, etc. generally short term and high YTM (yield to maturity) fund is
suggested.
a. Short Term Debt Fund Best performing is Kotak Flexi Debt with CAGR, 1 year-10.4%, 3 years- 9.3%, 5
years 9.4%, YTM – 8.07%, average maturity- 5.09 years and modified maturity 3.68
years.
Birla Sun Life Treasury Optimizer Plan has performed well with CAGR, 1 year-9.6%,
3 years- 10.3%, 5 years 10.1%, YTM – 8.07%, average maturity- 2.62years and
modified maturity 1.96 years.
Franklin India Banking & PSU Debt Fund is new fund and has performed well with 1
year CAGR-9%, YTM- 8.27%,%, average maturity- 5.14 years and modified maturity
4.64 years.
HDFC Medium Term Opportunities Fund is good fund with CAGR, 1 year-9%,3
years- 8.9%, 5 years 10.1%, YTM – 7.95%, average maturity- 3.27 years and
modified maturity 2.61 years.
Birla Sun Life Treasury Optimizer Plan, Birla Sun Life Dynamic Bond Fund, L&T
Resurgent India Corporate Bond Fund are well performing but their maturity period is
very long.
Ultra Short Term Debt Fund
8
8.5
9
9.5
10
10.5
s
Chart 9: short term debt

32 | P a g e K r i s h m a S a n d e s r a
Best performing fund is Franklin India Ultra Short Bond Fund with CAGR, 1 year-
9.7%, 3 years- 9.8%, 5 years 9.9%, YTM – 9.19%, average maturity- 0.47 years and
modified maturity 0.42 years.
Reliance Banking & PSU Debt Fund is new fund and has performed well with 1 year
CAGR-8.9%, YTM- 7.89%, average maturity- 1.91years and modified maturity 1.63
years.
Then comes ICICI Prudential Ultra Short Term Planwith CAGR, 1 year-9.5%,3 years-
9.7%, 5 years 9.9%, YTM – 7.98%, average maturity- 2.19
Followed by Kotak Low Duration Fund, Reliance Medium Term Fund
Long Term Debt Fund First in this category comes ICICI Prudential Dynamic Bond Fund with CAGR, 1 year-
12.8%, 3 years- 10.2%, 5 years 10.2%, YTM – 8.27%, average maturity- 7.47 years
and modified maturity 4.86 years.
Next is ICICI Prudential Long Term Plan with CAGR, 1 year-11.8%, 3 years- 12.7%,
5 years 11.3%, YTM – 7.78%, average maturity- 14.29 years and modified maturity
7.70 years.
8
9
10
CA
GR
Chart 10: Ultra short term
0
5
10
15
CA
GR
Chart 11: Long term Debt

33 | P a g e K r i s h m a S a n d e s r a
HDFC High Interest Fund Dynamic Plan with CAGR, 1 year-11.8%, 3 years-
10.1%, 5 years 9.4%, YTM – 7.96%, average maturity- 16.37 years and modified
maturity 7.64 years.
Then comes ICICI Prudential Income Plan with CAGR, 1 year-11.7%, 3 years- 9.1%,
5 years 8.8%, YTM – 8.05%, average maturity- 15.35 years and modified maturity 7.59
years.
Credit Opportunities Funds
The top performing in this section is Kotak Medium Term Fund which is new fund with
1 year CAGR -11.5%, YTM – 9.83%, average maturity- 3.05 years and modified
maturity 2.27 years.
Another new fund is Reliance Corporate Bond Fund with 1 year CAGR -10.6%, YTM
– 9.60%, average maturity- 4.52 years and modified maturity 3.41 years.
Next well performing fund is DSP Black Rock Income Opportunities Fund with CAGR,
1 year-10.7%, 3 years- 10.3%, 5 years 10%, YTM – 9.84%, average maturity- 2.93
years and modified maturity 2.18 years.
Followed by Franklin India Dynamic Accrual Fund with CAGR, 1 year-10.5%, 3 years-
9.7%, 5 years 8.9%, it has highest YTM – 11.78%, average maturity- 3.46 years and
modified maturity 3.09 years
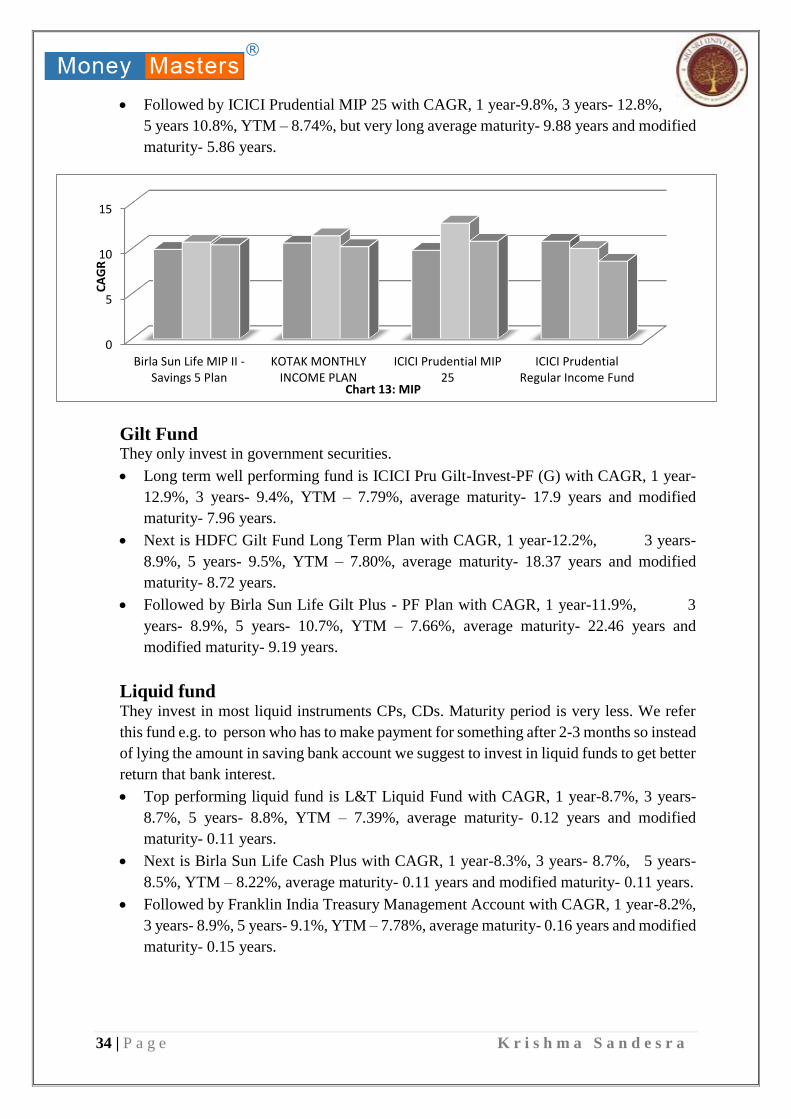
Monthly Income Plan There are 2 kinds one is aggressive and other is conservative
The top performing conservative MIP is ICICI Prudential Regular Income Fund with
CAGR, 1 year-10.8%, 3 years- 10%, 5 years 8.6%, it has highest YTM – 10.6%, and
quick average maturity- 1.24 years and modified maturity- 1.15 years.
Next is Birla Sun Life MIP II - Savings 5 Plan with CAGR, 1 year-9.9%, 3 years-
10.7%, 5 years 10.4%, it has highest YTM – 8.20%, but long average maturity- 13.99
years and modified maturity- 6.29 years.
Top performing aggressive fund is Kotak Monthly Income Plan with CAGR, 1 year-
10.6%, 3 years- 11.4%, 5 years 10.2%, YTM – 7.72%, but very long average maturity-
9.97 years and modified maturity- 6.14 years.
0
5
10
15
KOTAKMEDIUM
TERM FUND
Birla Sun LifeMedium Term
Plan
DSP BlackRockIncome
OpportunitiesFund
Franklin IndiaDynamic
Accrual Fund
RelianceCorporateBond Fund
ICICIPrudentialCorporateBond Fund
CA
GR
Chart 12: Credit opportunities fund
34 | P a g e K r i s h m a S a n d e s r a
Followed by ICICI Prudential MIP 25 with CAGR, 1 year-9.8%, 3 years- 12.8%,
5 years 10.8%, YTM – 8.74%, but very long average maturity- 9.88 years and modified
maturity- 5.86 years.
Gilt Fund They only invest in government securities.
Long term well performing fund is ICICI Pru Gilt-Invest-PF (G) with CAGR, 1 year-
12.9%, 3 years- 9.4%, YTM – 7.79%, average maturity- 17.9 years and modified
maturity- 7.96 years.
Next is HDFC Gilt Fund Long Term Plan with CAGR, 1 year-12.2%, 3 years-
8.9%, 5 years- 9.5%, YTM – 7.80%, average maturity- 18.37 years and modified
maturity- 8.72 years.
Followed by Birla Sun Life Gilt Plus - PF Plan with CAGR, 1 year-11.9%, 3
years- 8.9%, 5 years- 10.7%, YTM – 7.66%, average maturity- 22.46 years and
modified maturity- 9.19 years.
Liquid fund They invest in most liquid instruments CPs, CDs. Maturity period is very less. We refer
this fund e.g. to person who has to make payment for something after 2-3 months so instead
of lying the amount in saving bank account we suggest to invest in liquid funds to get better
return that bank interest.
Top performing liquid fund is L&T Liquid Fund with CAGR, 1 year-8.7%, 3 years-
8.7%, 5 years- 8.8%, YTM – 7.39%, average maturity- 0.12 years and modified
maturity- 0.11 years.
Next is Birla Sun Life Cash Plus with CAGR, 1 year-8.3%, 3 years- 8.7%, 5 years-
8.5%, YTM – 8.22%, average maturity- 0.11 years and modified maturity- 0.11 years.
Followed by Franklin India Treasury Management Account with CAGR, 1 year-8.2%,
3 years- 8.9%, 5 years- 9.1%, YTM – 7.78%, average maturity- 0.16 years and modified
maturity- 0.15 years.
0
5
10
15
Birla Sun Life MIP II -Savings 5 Plan
KOTAK MONTHLYINCOME PLAN
ICICI Prudential MIP25
ICICI PrudentialRegular Income Fund
CA
GR
Chart 13: MIP

35 | P a g e K r i s h m a S a n d e s r a
ANALYSIS OF MUTUAL FUNDS WITH ULIPS
When we invest in mutual funds we have option to select the fund and will get returns
accordingly. In ULIPs also we get a wide range of funds to select from high risk funds to debt
guaranteed return fund. In mutual funds if we need to change fund we need to shift from one
to another charges are to be paid if the lock-in period is not over, but this is not in the case of
ULIPs you can shift the funds freely maximum of 20 times in the term of the policy.
The ULIPs are long term investment starting from 10year. As it is long term the return is also
good (depends on the fund selected).
There are different charges in ULIPs but it is long term so returns are also good and then after
some years these charges starts decreasing. Mortality charges are according to the age of the
person and the risk company is taking for life of that person. Younger the age lower the
mortality charge.
I have taken ICICI Prudential plans for my study.
ICICI Pru Wealth Builder II sum assured can be Rs.500000 only
ICICI Pru Elite Life II sum assured from Rs.2000000 till Rs.8000000
ICICI Pru Elite Wealth II sum assured from Rs. 10000000 to 40000000
The following illustration is taken of ICICI Pru Elite Life II at 8%, SA-5000000
5 pay option.
Chart 15: Illustration of elite life II

36 | P a g e K r i s h m a S a n d e s r a
As you are just paying for 5 years premium allocation charge – 4% and policy
administration charge – 4800 will only be charged for 5 years.
The mortality charges are very high and then keeps on decreasing. If we take illustration
of person aged 25 the mortality charges starts from Rs.5, 418.
Then comes service tax, it is calculated on the fund at the end.
The last is fund management charge hear it is 1.35%
Now the interesting point is we get wealth booster at 10, 15, and 20 years. And we also
start getting loyalty additions from 6th year and it will increase year by year. The fund
management charge will get adjust from loyalty additions and it is not getting charged
from the fund.
This loyalty addition is provided only by ICICI Prudential.
ANALYSING CLIENT’S PORTFOLIO
Many clients’ portfolio was analysed. Analyses of one client’s portfolio are shown as follows.
The portfolio of Mr. Arun Desai and his family is as follows:
This family contains portfolio of 3 members
Mr. Arundesai – age 63
Mrs. Daksha Desai – age 61
Mr. Ashit Desai – age 30
All 3 had invested in mutual funds (lump-sum investment) in the year 2009 and 2014 which
have giving good returns.
Only Ashit has insurance of S.A. 610,000/- which is underinsured.
They have bonds of Shriram Ltd. And one of them were maturing worth of Rs. 40,000/- in July,
2016. We called them for meeting and discussed their portfolio and suggested and done
following investments.
1. Start SIP in balanced fund worth Rs. 30,000/- dividend option
2. Invest in shares- L&T’s IPO taken 2 slots of 20 shares each worth Rs. 48,000/-
3. He is under insured we suggested him ICICI Prudential iprotect smart of S.A. of
Rs.1crore, premium Rs.11967/-annum or Rs. 1001/- month.

37 | P a g e K r i s h m a S a n d e s r a
4. He does not have medical insurance
LIMITATIONS:
The analysis is done on the basis of past performance of the funds. But the past
performance may not be an indicator of future performance.
Performance of mutual funds is largely affected by environmental factors, which are
beyond the control of investors.
I have taken limited funds of AMC and ULIP of only ICICI Prudential
I was given a time period of 2 months only, which may not suffice the required tenure
to study the MF industry.

38 | P a g e K r i s h m a S a n d e s r a
CHAPTER 4: CONCLUSION
The market is quite volatile now days due to many economic and other matters some
of recent matters were due to Brexit, 7th pay commission, etc. So we are suggesting to
invest in balanced fund or midcap and small cap fund (as they invest in emerging
companies). We are also suggesting online term plan – ICICI Iprotect Smart, and
ULIPs.
Apart from my main project I had done many small assignments
Worked on internal coordination with the employer and employees
Helping employees to sole some issues, making them meditate.
Analysed the company’s website www.moneymasters.co.in and suggested
important and required changes in the website.
Worked on the marketing aspect of the company especially online – as there
was no online presence. I designed their FB page
Made the whole framework/ blueprint of the marketing campaigns making a
YouTube channel, and twitter handle.
Regularly calling clients and fixing up meeting to discuss their portfolio and
I got a great chance to visit BNI(Business Networking International) with my
mentor as he is a member there. I made a presentation for my mentor to present
there about term insurance – ICICI Prudential iprotect smart. We got total 5
crore policy from after the presentation and many more proposals are lined up
for closure.
This is online policy so premium is very less. It is the best plan because it has double accidental
cover This protects you from
1. Death benefit
2. Accidental death
3. Wavier of premium on disability
4. Terminal illness

39 | P a g e K r i s h m a S a n d e s r a
Death benefit is paid upon earlier of
1. Diagnosis of terminal illness or
2. Death of term assured
Another superb feature is you get a waiver of premium in case of disability due to accident i.e.
life cover continues without paying any premium on disability.
You are protected for 35 terminal illness- aids is not covered in this policy.
You can insure yourself via 3 ways
I. As an individual
II. Under Married women property act
III. Under employer employee scheme
I had great learnings during my internship period in Money Masters. By doing such analysis I
have a good knowledge for suggesting where to invest today, how to diversify the investment
portfolio – in what proportion according to the client’s income, age, etc. Apart from my project
topic I had much other learning. Learned how to interact with different kind of clients, how to
close the deal.
References
BOOKS
1. Ti. M. Swaaminathan-
Performance of mutual funds in India: A comparative study of public and
private sector mutual funds
2. NSIM – National Institute of Securities Market workbook
NSIM – Series – V – A
3. Fact sheet of all mutual fund providing companies
WEB
www.nsim.ac.in
www.valueresearchonline.com

40 | P a g e K r i s h m a S a n d e s r a
www.moneycontrol.com
www.mutualfundsindia.com
www.moneymasters.co.in