krishna kumar 110903 - american university (1994) and amir and lev (1996) argue that accounting...
TRANSCRIPT

INVESTMENT OPPORTUNITIES AND THE VALUE-RELEVANCE
OF EARNINGS, CASH FLOWS AND ACCRUALS
Gopal V. Krishnan Department of Accountancy
City University of Hong Kong, Kowloon, Hong Kong [email protected]
and
Krishna R. Kumar School of Business and Public Management
The George Washington University, Washington, DC 20052, USA [email protected]
June 2003 (Work still in progress, please do not quote)
Address correspondence to: Krishna R. Kumar Department of Accountancy School of Business and Public Management The George Washington University Washington DC 20052 Phone: (202) 994-5976 E-mail: [email protected] We gratefully acknowledge helpful comments and suggestions from Steve Christophe, Chris Jones, Sok-Hyon Kang, Fred Lindahl, James Livingstone, Jim Patton, Kumar Visvanathan, and especially Bill Baber. We also thank participants for comments at the accounting research workshop at The George Washington University, and at conferences of the Washington Area Finance Association, European Accounting Association and the American Accounting Association.

Investment Opportunities and the Value-Relevance of Earnings, Cash Flows and Accruals
Abstract
(Under construction) Data Availability: All data are publicly available. Keywords: Capital markets; Investment opportunities; Earnings; Cash flows from operations; Accruals; Value Relevance

1
Investment Opportunities and the Value-Relevance of Earnings, Cash Flows and Accruals
I. Introduction
Investment (growth) opportunities (IOS) are, for many firms, a substantial and valuable
component of corporate assets. Frequently, they represent a greater part of a firm’s potential for
competitive advantage, abnormal profits and value creation than assets-in-place.1 Thus,
investors have a strong need for information about investment opportunities, the assessment of
their value and the likelihood of their realization.
Evidence is mixed on the usefulness of financial information for firms with investment
opportunities. Using the ratio of market-to-book-value of equity (MB ratio) as a growth
opportunities proxy, Collins and Kothari (1989) argue that earnings response coefficients (ERCs)
increase with investment opportunities. On the other hand, Ahmed (1994) uses a proxy based on
investment in research and development (R&D) expenditures to demonstrate that ERCs decline
with growth opportunities. In the context of the wireless communications industry, Amir and
Lev (1996) find that non-financial information (market potential and market penetration)
dominates financial information [earnings and cash flows from operations (CFO)] in determining
security prices for high-growth firms. On a stand-alone basis, they find financial information to
be uninformative. Finally, Bodnar and Weintrop (BW) (1997) document higher ERCs for
foreign earnings of US multinationals and make the case, using realized sales growth rates as the
proxy for growth prospects, that ERCs are higher for foreign operations due to higher growth
opportunities.
In this paper, we reexamine relations between investment opportunities and the value-
relevance of earnings while addressing a variety of limitations in prior studies. A distinguishing
feature of our study is a specification that allows ERCs to vary non-linearly with IOS. This

2
approach considers the possibility that the inconsistent findings across previous studies are due
in part to the fitting of linear models to samples that represent different segments of the IOS
spectrum. We also use a substantially larger sample, a more comprehensive and better-validated
measure of investment opportunities and a measure of unexpected earnings that considers
transitory earnings. Our results support a characterization wherein ERCs first increase and then
decrease as IOS increases.
As noted earlier, prior research offers opposing predictions for the behavior of ERCs as
IOS increases. CK argue that if current earnings provide useful information to investors about
the extent of abnormal profits in current and future investments, and if such abnormal profits
increase with investment opportunities, then ERCs will increase with IOS. On the other hand,
Ahmed (1994) and Amir and Lev (1996) argue that accounting conservatism, by proscribing the
recognition of growth options on the balance sheet and requiring the immediate expensing of
investments in R&D, advertising and other costs of intangible assets, compromises the
informativeness of earnings as IOS increases and causes ERCs to decline. Yet other arguments,
which we outline below, suggest that return responses to the CFO component of earnings may
either increase or decrease as IOS increase. Our empirical results suggest that factors that cause
ERCs to increase with IOS dominate for relatively low IOS values and then ERC-decreasing
factors dominate for higher IOS values.
Next, we extend the analysis by decomposing earnings into CFO and accruals to
investigate how security returns respond to each of these earnings components as IOS increases.
We are motivated by the fact that theoretical predictions for security return responses for each
component as IOS increases differ from the other. On the one hand, increasing cost differentials
between internal and external financing as IOS increases, attributable to information

3
asymmetries, agency costs and transaction costs, can cause CFO to be an increasingly important
determinant of whether or not investment opportunities are realized. Consequently, security
price responses to CFO – denoted as the cash flow response coefficient (CRC) – can increase
with IOS. CRCs can also increase with IOS if, as suggested by CK, CFO – as a component of
earnings – inform investors about abnormal earnings in current and future investments. On the
other hand, the usefulness of CFO as a performance measure is potentially compromised by the
deduction from CFO of investment outlays for R&D, and other intangible-asset-building
expenditures dedicated to the development and realization of investment opportunities. Which
of these effects dominates at various levels of IOS and how the net effect varies with IOS is an
empirical question, which we address in this paper.
Dechow (1994) argues that timing and matching problems in CFO increase with the
volatility of working capital and cause working capital accruals to play an increasing role in the
usefulness of earnings. She suggests that the informativeness of working capital accruals
increases with the length of the operating cycle and the level of working capital. In the present
context, her analysis suggests that the usefulness to investors of working capital accruals is likely
to decline as IOS increases. This is because as IOS increases, operating assets, and more
specifically working capital, are a decreasing proportion of total assets (including investment
opportunities). Furthermore, the usefulness of non-current accruals is also likely to decline as
IOS increases. This is because, many non-current assets, particularly intangibles, are not
recorded on the balance sheet because of accounting conservatism. Others, such as goodwill and
purchased intangibles, are often amortized at arbitrary rates (Ahmed 1994, Amir and Lev 1996).
Thus, we expect security return responses to accruals – denoted as the accrual response
coefficient (ARC) – to decline as IOS increases.

4
As a further test of our predictions, we examine whether CRC and ARC sensitivity to
IOS varies with the nature of assets acquired – tangibles such as inventory, receivables, land,
building and equipment versus intangibles such as intellectual property, knowledge and brand
power – in order to realize investment opportunities. Following Smith and Watts (1992), we
expect that information asymmetries and agency costs are lower for tangible assets. We also
expect that the usefulness of both working capital and non-current accruals is greater when
tangible assets are acquired. Thus, we expect that as IOS increases, the informativeness of CFO
increases and that of accruals decreases at a faster rate for firms realizing investment
opportunities through intangible rather than tangible investments. Using the ratio of R&D-plus-
advertising expense to capital-expenditures as a proxy for the relative intensity of investment in
intangible assets, we document that CRC sensitivity to IOS increases at a faster rate and ARC
sensitivity to IOS declines at a faster rate when investment opportunities are realized to
intangible investments rather than tangible investments.
This study contributes in several ways to research on how investment opportunities
influence security price responses to earnings and its components. First, it reconciles the
conflicting results in prior research by using a more general model specification and addressing
limitations, in order to provide a more complete understanding of how earnings informativeness
varies with investment opportunities. Second, it extends current research by considering how the
value-relevance of two important earnings components – CFO and accruals – varies with IOS.2
This evidence is potentially of value to investors and analysts in determining which earnings
component – CFO or accruals – to emphasize when they evaluate high-IOS versus low-IOS
firms. Third, the paper contributes to research that looks beyond earnings in studying the
valuation of high-growth firms. Whereas, Amir and Lev (1996) demonstrate the importance of

5
non-financial information, the present study shows how the usefulness of important elements of
the financial information set varies as IOS increases. A standard-setting implication of our
findings is that investors in large-IOS firms may benefit from more detailed disclosures on
operating cash flows. At the same time, new standards for large-IOS firms, designed to generate
more value-relevant accruals, may be called for. Finally, the paper considers a number of
economic explanations for why the value-relevance of CFO increases and that of accruals
decreases as IOS increases and provide evidence on them.3
The next section of the paper discusses prior studies and how this paper addresses several
of their limitations. It also presents potential explanations for how the informativeness of
earnings, CFO, and accruals varies as IOS increases. Section three presents the research design
and empirical methods. Sample selection, data sources and variable measurement are addressed
in section four. Results are reported in section five. Conclusions are in section six.
II. Prior research, theory and motivation
Prior Research Studies investigating how security return responses to earnings vary with investment
opportunities typically adopt model specifications of the following form. Inferences are based
on coefficient a2.
itn
itnitititit iablescontrolaUEIOSaUEaaCAR ε+×+×++= ∑ var_210 (1)
where
CARit = the cumulative abnormal returns during the disclosure period in which performance-related information for firm i for period t is disclosed;
UEit = the unexpected earnings relative to expectations for firm i at the beginning of the disclosure period;

6
IOSit = investment opportunities for firm i in period t; control_variablesit = variables to control for potentially correlated omitted effects; a0, a1, a2, …, an are parameter estimates; and γ is the error term.
CK use earnings changes and the market-to-book-value-of-equity ratio to proxy for
unexpected earnings and growth opportunities respectively. They limit their sample to NYSE-
listed firms with a minimum of three years of data. Their research design suffers from three
limitations. First, the random walk specification for earnings expectations assumes that all
earnings surprises are permanent. Ali and Zarowin (1992) show that estimated ERCs are biased
if a random walk specification is used when earnings have transitory components and
recommend inclusion of earnings levels as an additional proxy for unexpected earnings in such
instances. If earnings persistence is correlated with growth opportunities, then the use of a
random walk specification can result in a biased coefficient a2 in expression (1). This is because
measurement error in unexpected earnings, and the resulting bias in ERC, varies with IOS. A
second limitation of CK is the use of the MB-ratio as a proxy for growth opportunities. Ahmed
(1994) notes that the increase in ERC with IOS documented by CK may be driven by
associations between MB ratios and expected returns. Third, CK’s the selection criteria
potentially bias the sample in favor of large, successful firms. Their exclusion of NASDAQ-
listed firms may imply that nascent, high-growth companies are underrepresented in the sample.
Similar limitations characterize BW. First, they too use the random walk specification
for unexpected earnings. Second, they limit their sample to firms with multinational operations
for which a minimum of five years of stock returns are available. By excluding firms that have
domestic operations only or have existed for less than five years, these criteria also likely cause

7
the sample to under-represent small firms with high-growth potential. Finally, they use historical
sales growth rates to proxy for future growth expectations. Evidence in Baber, Janakiraman and
Kang (1996) suggests that relative to several other measures identified by them, past revenue
growth rate is a poor predictor of future growth rates.
The Amir and Lev (1996) study, being limited to the wireless communications industry,
focuses on a small, high-growth segment of the investment opportunities spectrum. Thus, their
findings about the lack of usefulness of financial information may not be generalizable even to
other high-growth industries and may be attributable to their small sample size. They do,
however, address the problem of potential measurement error in earnings changes as proxies for
unexpected earnings and CFO by including levels as additional explanatory variables in their
specifications.
Recognizing the possibility that the observed positive association between ERCs and the
MB-ratio may be attributable to relations between the MB-ratio and expected returns, Ahmed
(1994) uses a proxy comprised of non-market measures – R&D expenditures and the
replacement cost of plant, property and equipment. However, he provides no evidence to
validate this measure as a proxy for future growth opportunities. Furthermore, Ahmed uses the
seasonal random walk model to proxy for unexpected earnings. Thus, his results for the ERC-
IOS relations can also biased because of measurement error in unexpected earnings. Finally, he
limits his sample to manufacturing firms. If manufacturing firms enjoy substantially different
levels of growth opportunities relative to service and other non-manufacturing industries, then
Ahmed’s findings may be biased, especially if the nature of ERC-IOS relations varies with the
level of IOS.

8
How this study addresses limitations in prior studies
Three features of this study are designed to address the limitations identified above.
First, we require firms to have only two consecutive years’ data on Compustat and CRSP files in
order to be included in our sample. We include all firms with sufficient data except firms in
regulated industries – utilities (SIC 49) and financial institutions (SIC 60). We exclude these
industries in order to be consistent with Baber et al. (1996), whose measure we use to estimate
investment opportunities. Thus, our sample selection process is less restrictive than prior studies
and hence is more likely to include small, young firms.
Second, our investment opportunities measure, originally developed by Baber,
Janakiraman and Kang (1996), combines four commonly-used growth opportunities metrics –
the ratio of the market to book value of assets, firm growth rate, R&D intensity and investment
intensity. Two key features of this measure are noteworthy. First, the four underlying metrics
are similar to those used in previous studies investigating ERC-IOS relations. Specifically, the
market to book value of assets is similar to the market to book value of equity ratio used in CK.
The R&D and investment intensity measures are similar to the R&D stock measure used by
Ahmed (1994) and the asset growth measure is similar to the revenue growth measure used in
BW. Second, these growth measures are not selected arbitrarily, but rather, through a step-wise
regression process that identifies them from a set of sixteen IOS metrics, based on their ability to
predict the intensity of investment activity over the following five years. This validation process
gives us greater confidence in our growth proxy than in those used in prior studies. We discuss
this measure in greater detail in the following section.
Finally, we use both earnings changes and levels as proxies for unexpected earnings.
Several prior studies recommend the inclusion of earnings levels as an explanatory variable in

9
addition to earnings changes to mitigate bias in the estimated ERC when earnings are transitory
(Ali and Zarowin, 1992; Brown et al., 1987; Easton and Harris, 1991). In subsequent analysis,
we use changes and levels of CFO and accruals to proxy for unexpected CFO and accruals when
we decompose unexpected earnings into these two components to examine the behavior of CRCs
and ARCs as IOS increase. As noted earlier, measurement error in the unexpected earnings
proxies can be correlated with IOS if persistence and IOS are correlated. If so, the use of
changes and levels can reduce measurement error and mitigate bias in relations between response
coefficients and IOS due to such error.
Predictions about how ERCs vary with IOS
A number of factors potentially affect how ERCs vary with IOS. First, CK argue that
current period abnormal earnings can help investors assess the potential for abnormal earnings
from future investments and hence the value of future investment opportunities. If the potential
for above normal earnings is greater from investment opportunities than from assets already in
place, then we expect ERCs to increase as investment opportunities increase relative to assets in
place. Above normal earnings potential can be lower for assets-in-place if competition erodes
their opportunities for such earnings more rapidly.
Second, firms need cash in order to exploit investment opportunities. Such cash needs
can be met from internal resources or through external financing. Under perfect and complete
markets, such financing choices do not affect investment decisions and therefore are not relevant
to firm value (Modigliani and Miller, 1958). However, market frictions such as information
asymmetries, agency costs and transaction costs cause the cost of external capital to be higher
than that from internal sources (Jensen and Meckling, 1976; Myers and Majluf 1984; Oliner and
Rudebusch 1992). In the presence of such cost differentials, the availability of internal

10
resources to finance investment opportunities increases firm value. This happens for at least two
reasons. First, investment projects that have positive net present values (NPVs) when financed
externally have even higher NPVs when lower-cost internal resources are used instead. Second,
some of the investment opportunities that are not viable (that is, have negative NPVs) if financed
externally become viable positive NPV projects when financed with lower cost internal funds.
We expect differences between the costs of internal and external financing to increase as
investment opportunities increase. This is because, holding internal financing constant, the level
of external financing increases as investment opportunities increase. External financing of
investment opportunities is typically not collateralized; therefore, the marginal cost of such
financing increases with the level of financing (Kaplan and Zingales 1997, p. 174; Hubbard
1998, p. 197). On the other hand, the opportunity cost of internal financing, being determined by
external credit and equity market rates, is unrelated to investment opportunities. If cost
differentials between internal and external financing increase with investment opportunities,
then, the marginal benefits – that is, the contribution to firm value – of an additional dollar of
internal financing increases with investment opportunities.
CFO is an important internal cash resource. Therefore, it follows from the above
discussion that unexpected changes in CFO can cause investors to reassess the extent that lower
cost internal resources are available to realize marginal investment opportunities or to substitute
for higher cost external capital, and hence, to revise stock prices. Such revisions will correlate
positively with unexpected CFO. Moreover, holding unexpected CFO constant, such
reassessments should be greater for large-IOS firms than for small-IOS firms. In other words,
stock price responses to unexpected CFO are predicted to increase with IOS.

11
However, as noted in the introduction, deductions from CFO of investment outlays for
R&D, advertising and other expenditures that potentially create intangible assets adds
measurement error to reported CFO. Lack of detailed disclosures about such expenditures makes
it difficult for investors to add back the deductions to CFO. As such outlays are likely to
increase with investment opportunities, we expect them to increasingly compromise the
informativeness of CFO as IOS increases.
Together, these two arguments suggest that, to the extent that earnings consist of CFO,
financing cost differentials cause ERCs to increase with IOS and mismeasurement of CFO
causes ERCs to decrease as IOS increases.
Accruals also potentially affect how ERCs vary with IOS. While there is strong
empirical evidence indicating that accruals are highly value-relevant for the average firm (Bowen
et al. 1987, Bernard and Stober, 1989), there is reason to believe that this property varies with
IOS. Dechow (1994) observes that accruals enhance the value-relevance of earnings by
addressing matching and timing problems in operating cash flows. This is achieved by accruing
non-cash assets and liabilities on the balance sheet from the date of the cash flows to the date on
which revenues or expenses are recognized. However, accruals appear to be most effective in
addressing matching and timing problems for investments in tangibles such as working capital,
and plant, property and equipment. This is because measurements involved in recording accruals
for such assets appear to be subject to less error than for intangibles.
Firms create investment opportunities through investment in specialized physical,
knowledge, brand and human capital (Smith and Watts 1992). A significant portion of such
investment – such as on research and development, advertising, market development, and
employee education and training – is intangible in nature. Even tangible assets used in such

12
contexts, for example, laboratory equipment, are likely to be highly specialized with few
alternative uses. Problems in identifying the amounts and timing of the returns on such
investments imply that the accrual and allocation across time-periods of the costs of such
investment can be quite arbitrary and subject to error and manipulation. Accounting standard-
setters have responded conservatively to these problems by requiring the immediate expensing of
such investments, particularly when they are intangible. Even in the instances when costs are
capitalized, as with tangible assets or purchased intangibles, the depreciation or amortization of
costs can be arbitrary. Both tangible assets and intangibles such as patents, copyrights or
trademarks may be impaired by competition or obsolescence long before the end of their
estimated useful lives. Alternatively, brand equity and market penetration achieved through such
investments can last for many years after the assets have been fully depreciated or amortized on
the balance sheet. Thus, estimates used in measuring accruals can be subject to considerable
error for firms investing to create investment opportunities. Therefore, the value-relevance of
accruals, and consequently ERCs, are likely to decline as investment opportunities increase
relative to assets-in-place.
We have identified several factors that potentially determine how ERCs vary with IOS.
Some are expected to cause ERCs to increase and others to cause them to decrease as IOS
increases. Prior studies have focused on one or a few of these factors and predicted monotonic
trends in ERC as IOS increases. However, when several factors are present, such trends are
likely only if one set of factors, either ERC-increasing or ERC-decreasing, dominate the other
over the entire range of IOS. If the dominant effect(s) vary with IOS, non-monotonic patterns
are likely to arise. Alternatively, if factors are uniformly offsetting across all IOS, no trend will

13
be detected. The inconsistent results of prior studies suggest that multiple factors influence how
ERCs vary with IOS.
Although we are unable to make unambiguous predictions about how ERCs vary with
IOS, it is clear from our discussions that the trend in security return responses to CFO as IOS
increases differs from that of return responses to accruals as IOS increases. The two factors that
influence how CRCs vary with IOS – the role of CFO as an internal resource and the
measurement error in CFO due to the inclusion of R&D and other expenditures – appear to have
opposing effects, and the net trend in CRCs as IOS increases remains an empirical question. On
the other hand, our discussion unambiguously predicts a decline in ARCs as IOS increases.
III. Research design, empirical proxies and model specifications
The primary ERC specification
Our primary empirical specification to investigate how ERCs vary with IOS follows
expression (1) in section II. Year and firm subscripts are suppressed.
CAR = b0 + b1 ∆E + b2 E + b3 IOS + b4 ∆E×IOS + b5 E×IOS + b6 ∆E×IOS2
+ b7 E×IOS2 + ∑C
bC control variableC + ∑Y
bY DY + ∑I
bI DI + ∈b (2)
where
CAR = the market-model-based cumulative residual stock return relative to the value-weighted NYSE, AMEX, NASD market index, aggregated over the one-year period beginning with the fourth month of the current fiscal year t; market model parameters are estimated over 250 trading days preceding the annual return window;
∆E (Earnings change) = change in reported income before extraordinary items (Compustat annual data item #18) from the previous fiscal year t-1 to the current year t, scaled by the beginning of period market value of equity (Compustat annual data item #24×#25); E (Earnings level) = reported income before extraordinary items for the current year t, scaled by the beginning of period market value of equity;
14
IOS = a measure of investment opportunities estimated as in Baber, Janakiraman and Kang (1996) from a factor analysis of the variables listed in Exhibit 1;
control variablesC = BETA, PERSIST and INTRATE and their interactions with ∆E and E; where BETA is a measure of systematic risk, estimated as the slope coefficient from a market-model regression of daily stock returns on the value-weighted NYSE, AMEX, NASD market index return over the one-year window beginning the fourth month of the fiscal year; PERSIST is a measure of earnings persistence, specified an indicator variable that takes the value of one when the earnings-to-price (Et-1/Pt-1) ratio at the beginning of fiscal year t is in the extreme four sample deciles and zero otherwise; INTRATE is the average 30-year treasury bond yield for year t; DY = six year dummy variables for 1990 through 1995; DI = twelve industry dummy variables representing 2-digit SIC code numbers 13, 20, 28, 33, 34, 35, 36, 37, 38, 48, 50 and 73;
b0, b1, b2, …, bI are parameter estimates; and ∈b is the error term.
Unexpected earnings proxies: Expression (2) includes current period earnings changes
∆E and earnings levels E as empirical proxies for unexpected earnings UE in expression (1).
Prior research, with the exception of Amir and Lev (1996), has typically assumed a random-walk
annual earnings process and used earnings changes only as the unexpected earnings process.
Following, Ali and Zarowin (1992), Brown et al. (1987) and others, we include earnings levels
as an additional unexpected earnings proxy to address measurement error in earnings changes
when earnings innovations are partly transitory. ERCs are estimated as the sum of the
coefficients on the two proxies.
Quadratic terms: We also include quadratic interaction terms ∆E×IOS2 and E×IOS2 to
allow the specification to reflect potential non-linear relations between ERCs and IOS. The
discussion in the previous section indicates that ERCs may increase or decrease with IOS

15
depending on which of several factors dominate. The inclusion of a quadratic term allows for
the possibility that the dominance of one or other factor may vary with the level of IOS.
IOS measure: Earlier, we noted several limitations of investment opportunities measures
used in prior studies. These included concerns that they may proxy for correlated omitted
variables (as in the case of the MB ratio), that they are weakly related to future realized growth
(as in the case of historical revenue growth rates) or that there is a lack of evidence to validate
them as predictors of future growth [as in the case of Ahmed’s (1994) R&D stock measure]. We
address such concerns by using an investment opportunities measure developed by Baber et al.
(1996). This measure is obtained by identifying through step-wise regression, a parsimonious set
of four growth opportunities proxies from an initial list of sixteen commonly-used variables.
These four measures are them aggregated into one using factor analysis and then validated by
demonstrating strong associations with future realized growth measures.4 This measure has
several advantages. First, the process of aggregation through factor analysis should help reduce
error in measuring the underlying investment opportunities construct relative to any individual
proxy. Second, the measure uses a parsimonious set of variables and a short time-series of data,
thus, minimizing loss of observations due to missing data Third, growth proxies included in the
measure include growth measures commonly used in previous research. Finally, the validation
of the measure by estimating correlations with realized future investment intensity and growth
rates gives us confidence about the construct validity of the measure. The four measures that
make up IOS are recent investment intensity (INVINT), recent asset growth rate (MVAGR), the
ratio of market-to-book values of assets (MKTBKASS), and R&D intensity (R&D). Definitions
of these variables are in Exhibit 1.
[Insert Exhibit 1 about here]

16
Factor loadings used to combine the four components into a single score can vary over
time and Baber et al.’s loadings may not apply to our data. Hence, we re-estimate loadings. The
estimation process yields an IOS mean (standard deviation) across all observations equal to zero
(one) by construction.5
Control variables: In addition to growth opportunities, prior research identifies risk,
earnings persistence and interest rate as determinants of earnings response coefficients
(Kormendi and Lipe 1987, Easton and Zmijewski 1989, Collins and Kothari 1989). If these
variables are correlated with growth opportunities, any documented associations between ERCs
and IOS may be spurious. We address such concerns by including BETA, PERSIST and
INTRATE as proxies for risk, earnings persistence and interest rates. Note that the interactions of
these variables with unexpected earnings measures )E and E must enter the specification in order
to control for the possibility that observed ERC variations with IOS are driven by these other
correlated determinants of ERCs. We follow CK in using systematic risk (Beta) as the measure
of risk and long-term government bond-yields to proxy for risk-free interest rates. We adopt Ou
and Penman’s (1989) binary measure of persistence based on price-earnings ratios because,
unlike alternative earnings time-series based measures, it uses only current data and does not
require a long time-series of earnings.
We include year and industry dummies in the specifications as controls for the mean
effects of any remaining correlated omitted variables and to address residual cross-correlations in
security returns that can bias test statistics (Bernard 1987).
Specification to investigate return responses to CFO and accruals
We examine the separate security return responses to CFO and accruals as IOS increases,
by disaggregating earnings changes and levels in expression (2) into CFO and accrual changes

17
and levels in expression (3). Note that the control variables in expression (3) include interactions
of BETA, PERSIST and INTRATE with changes and levels of CFO and accruals instead of
changes and levels of earnings as in expression (2).
CAR = c0 + c1 ∆CFO + c2 CFO + c3 ∆ACC + c4 ACC + c5 IOS + c6 ∆CFO×IOS
+ c7 CFO×IOS + c8 ∆ACC×IOS + c9 ACC×IOS + c10 ∆CFO×IOS2
+ c11 CFO×IOS2 + c12 ∆ACC×IOS2 + c13 ACC×IOS2
+ ∑'C
cC’ control variableC’ + ∑Y
cY DY + ∑I
cI DI + ∈c (3)
where
∆CFO (CFO change) = change in cash flows from operations (Compustat annual data item # 308) from the previous fiscal year t-1 to the current year t, scaled by the beginning of period market value of equity; CFO (CFO level) = cash flows from operations for the current year t, scaled by the beginning of period market value of equity; ∆ACC (Accruals change) = change in accruals from the previous fiscal year t-1 to the current year t, scaled by the beginning of period market value of equity; accruals are defined as net income before extraordinary items minus cash flows from operations; ACC (Accruals level) = accruals for the current year t, scaled by the beginning of period market value of equity; control variablesC’ = BETA, PERSIST and INTRATE and their interactions with ∆CFO, CFO, ∆ACC and ACC;
c0, c1, c2, …, cI are parameter estimates; ∈c is the error term; and
other variables are as defined in expression (2).
In addition to being a natural extension of the use of earnings changes and levels as
proxies for unexpected earnings, our use of CFO and accrual changes and levels as proxies for

18
unexpected CFO and accruals is motivated by two observations from prior studies. First,
Dechow (1994) documents large negative first-order serial correlations for both CFO and
accruals, thus indicating substantial mean reversion, and hence, the presence of transitory
elements in these earnings components. Second, Pfeiffer and Elgers (1999) demonstrate that the
inclusion of current and lagged levels – a procedure that is equivalent to the inclusion of changes
and levels – reduces bias in the estimated response coefficients.
IV. Sample selection and descriptive statistics For our sample firms, we require stock return data on the CRSP daily-returns file for at
least one complete year beginning the fourth month of a fiscal year in 1990 through 1996, and
for 250 trading days preceding each such year. We also require financial data to be available on
Standard and Poor’s Compustat. We begin with fiscal 1990 so that CFO is reported under
SFAS 95 for all firms in our sample.6 Following Baber et al. (1996) and Gaver and Gaver
(1993), we exclude firms in regulated industries, in particular, utilities (SIC 49) and financial
institutions (SIC 60). We also exclude firm-years with extreme values for IOS components,
INVINT, MVAGR, MKTBKASS and R&D, defined as values greater than 100, 5, 30, and 1,
respectively. The objective is to exclude observations for which IOS is likely to have large
measurement error. Following Easton and Harris (1991) and Cheng et al. (1996), we exclude
observations with values greater than 1.50 or less than -1.50 for earnings and CFO changes and
levels scaled by beginning of period market value of equity. After deleting outliers identified
using Belsley, Kuh and Welsch (1980) diagnostics, 18,108 observations remain in our sample.
Data are adjusted for stock dividends and splits.
[Insert Tables 1 and 2 about here]

19
Descriptive statistics are in Panel A of Table 1. Pair-wise correlations are in Panel B.
Comparisons of sample statistics with Dechow (1994) indicate somewhat lower earnings and
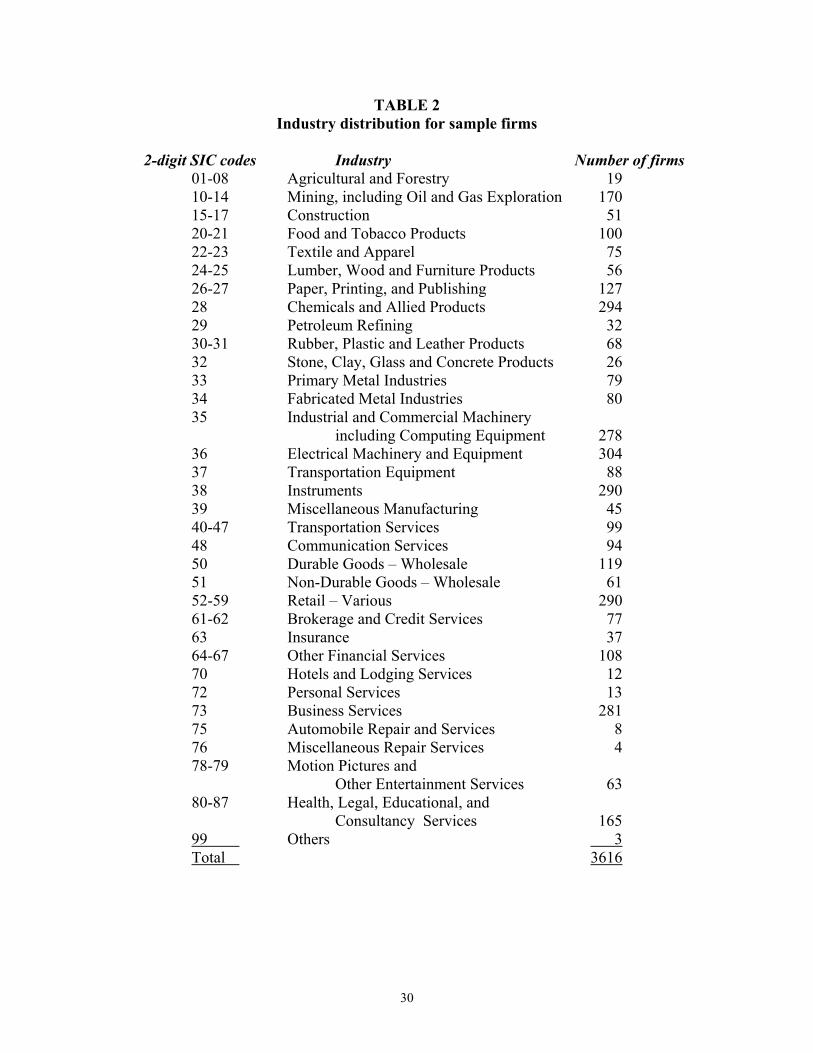
CFO levels (lower means and medians) for our sample observations.7 The 2-digit SIC Industry
distribution for the sample is in Table 2.
V. Results
The primary ERC specification
Table 3 presents results for two restricted versions of expression (2) [Models 1 and 2] and
the full version [Model 3]. Model 1 includes earnings changes only (∆E), as a main effect and in
interactions with IOS and the control variables BETA, PERSIST and INTRATE. In addition to
these variables, Model 2 includes earnings levels (E) and its interactions with IOS and the three
control variables. Neither model includes ∆E interactions with IOS2. We present these
specifications for comparison with CK and other prior studies, and to demonstrate the
implications for observed ERC-IOS relations of using earnings changes as unexpected earnings
proxies and specifying such relations as linear. All three models include year and industry
dummy variables as in expression (2).
In Model 1, the coefficient of ∆E indicates the ERC for firms with zero values for IOS.
Since zero is the mean value of IOS by construction, these are firms with average investment
opportunities (see section III). Coefficient α1 indicates that ERC is positive and significant (p ≤
0.05) for the average firm, consistent with a large volume of prior evidence. Coefficient α4 on
the ∆E×IOS interaction suggests that ERCs increase with IOS, consistent with CK and BW.
However, this result – that ERCs increase with IOS – is not replicated when earnings
levels E and interactions are included in the specification in Model 2. In this specification, the

20
ERC of the average firm is indicated by the sum β1+β2 of the coefficients of the main effects ∆E
and E. The coefficient sum is 1.007, positive and significant (p ≤ 0.05), and about 18% larger
than the estimate from Model 1. The coefficient sum β4+β5 of the interaction terms ∆E×IOS and
E×IOS is negative (-0.025) but not statistically significant. Thus, the effect of including earnings
level E in the specification is to increase estimated ERCs by greater amounts for low-IOS firms
than for high-IOS firms. This suggests that the ERC estimates from Model 1 are biased
downwards to a greater extent for low-IOS firms than for high-IOS firms. This would be the
case if earnings have a larger transitory component for low-IOS firms; that is, if earnings
persistence and IOS are positively correlated. Observed correlations between earnings
persistence and IOS for our sample are indeed positive and significant (0.074, p ≤ 0.01), thus
validating our concern that the use of random-walk earnings expectation models biases estimated
relations between ERCs and IOS.
Model 2 imposes linearity, and hence, monotonicity on the estimated ERC-IOS relation.
However, our discussion in section III identifies some factors that potentially cause increases in
ERCs with IOS and others that cause declines. Unless one or the other set of factors dominate
over the entire range of IOS values, ERC-IOS relations are likely to be non-monotonic. In such
circumstances, a non-linear model specification is preferable, because a linear specification picks
up only the average trend across all observations and not the change in trend as the independent
variable (IOS) changes. Moreover, when the underlying functional relationship is non-linear, the
estimated slope from a linear model will vary across samples, to the extent that samples represent
different parts of the population.
Model 3, which follows expression (2), includes two interaction terms )EΗIOS2 and
EΗIOS2, which allow the ERC-IOS relation, as represented by the sum of the coefficients of


23
return responses to accruals decline as IOS increases, consistent with the premise that accrual
informativeness is increasingly impaired by conservatism and other accounting deficiencies as
IOS increases.
In Model 5, Ν1 + Ν2 indicates the CRC for the average (zero IOS) firm and has a value of
1.084, positive and significant (p ≤ 0.05), and comparable to the corresponding estimate in
Model 4. Similarly, Ν3 + Ν4, which indicates the ARC for the average firm, is 0.802 and is
comparable to the estimate from Model 4. Coefficients sums Ν6 + Ν7 and Ν8 + Ν9, representing
the rates of change of CRC and ARC with IOS, are positive and negative with values of 0.290
and –0.161 respectively. CRC increases with IOS while ARC decreases, as in Model 4.
Coefficients sums Ν10 + Ν11 and Ν12 + Ν13 indicate the rate of change of the CRC-IOS and the
ARC-IOS relations with IOS. The former is negative (-0.055) and significant (p ≤ 0.05), but the
latter is not significantly different from zero. Thus, the rate of increase in the sensitivity of
return reponses to CFO slows down as IOS increases but the rate of decline in return responses
to accruals does not change materially. The partial derivative of the expression (Ν1 + Ν2 +
Ν6IOS + Ν7 IOS + Ν10 IOS2 + Ν11IOS2) with respect to IOS indicates the rate at which the CRC-
IOS relation changes with IOS. Setting it equal to zero, we find that, ceteris paribus, CRCs
reach a maximum for IOS equal to about 5.3 and then decline. This value of IOS is in the top
one percentile of the IOS distribution for our sample. Thus, CRC-IOS relations increase with
IOS except for extremely high-IOS firms.
CFO and accrual informativeness and the nature of assets acquired
Table 5 reports results for Model 6. This model modifies expression (3) in two ways.
First, it includes a binary variable D as a main effect and in interaction with the unexpected CFO
measures, the unexpected accrual measures, the IOS measure and their interactions. D is coded

24
one for firms that have high levels of expenditures on intangibles relative to tangibles – defined
as the ratio of R&D and advertising expenditures to capital expenditures – and zero otherwise.
We specify D by partitioning observations with non-zero R&D-plus-advertising-expenses-to-
capital-expenditures ratio into three groups. D equals one for observations in the highest group
and equals zero for observations in the lowest group. Observations in the middle group are
excluded for this estimation. Finally, observations with zero R&D-plus-advertising-expenses-to-
capital-expenditures ratio are assigned D equal to zero. Thus, observations with D coded as one
have more intensive investments in intangibles than observations with D coded zero.
The full specification of the model is in Table 5. We do not include interactions with
IOS2 in this specification in order to mitigate multicollinearity. The coefficient sum 616 + 617 (3rd
column and 2nd row from the bottom of the table) is positive and significant (0.243, p ≤ 0.10),
indicating that CRCs increase at a faster rate with IOS for when investment is more intangible
intensive. The coefficient sum 618 + 619 (3rd column and last row) is negative and significant (-
0.264, p ≤ 0.05), indicating that ARCs decline at a faster rate with IOS for when investment is
more intangible intensive. Thus, the informativeness of CFO increases and that of accruals
declines at a faster rate for firms with more intangible intensive investments as IOS increases. If
information asymmetries and measurement error in accruals are greater for firms investing in
intangibles, then these findings lend additional support for our explanations for CRC-IOS and
ARC-IOS relations.
Conclusions
(Under construction)

25
References
Ahmed, A. 1994. Accounting earnings and future economic rents: An empirical analysis. Journal of Accounting and Economics 17: 377-400. Ali, A. 1994. The incremental information content of earnings, working capital from operations, and cash flows. Journal of Accounting Research 32: 61-74. Ali. A., and P. Zarowin. 1992. The role of earnings levels in annual earnings-returns studies. Journal of Accounting Research 30: 286-296. Amir, E., and B. Lev. 1996. Value-relevance of nonfinancial information: The wireless communications industry. Journal of Accounting and Economics 22: 3-30. Baber, W. R., S. N. Janakiraman, and S-H. Kang. 1996. Investment opportunities and the structure of executive compensation. Journal of Accounting and Economics 21: 297-318. Belsley, D., E. Kuh, and R. Welsch. 1980. Regression diagnostics: Identifying influential data and sources of collinearity. New York, NY: Wiley. Bernard, V. L. 1987. Cross-sectional dependence and problems in inference in market-based accounting research. Journal of Accounting Research 25: 1-48. Bernard, V. L., and T. L. Stober. 1989, The nature and amount of information in cash flows and accruals. The Accounting Review 64: 624-652. Bodnar, G. M., and J. Weintrop. 1997. The valuation of the foreign income of US multinational firms: A growth opportunities perspective. Journal of Accounting and Economics 24: 69-97. Bowen, R. M., D. Burgstahler, and L. A. Daley. 1987. The incremental information content of accruals versus cash flows. The Accounting Review 62: 723-747. Brown, L. D., P. A. Griffin, R. L. Hagerman, and M. E. Zmijewski. 1987. An evaluation of alternative proxies for the market's assessment of unexpected earnings. Journal of Accounting and Economics 9: 159-193. Cheng, C. S. A., C-S. Liu, and T. F. Schaefer. 1996. Earnings permanence and the incremental information content of cash flows from operations. Journal of Accounting Research 34: 173-181. Collins, D. W., and S. P. Kothari. 1989. An analysis of inter-temporal and cross-sectional determinants of earnings response coefficients. Journal of Accounting and Economics 11: 143-181. Dechow, P. 1994. Accounting earnings and cash flows as measures of firm performance: The role of accounting accruals. Journal of Accounting and Economics 18: 3-42.

26
Easton, P. D., and T. S. Harris. 1991. Earnings as an explanatory variable for returns. Journal of Accounting Research 29: 19-36. Easton, P. D., and M. E. Zmijewski. 1989. Cross-sectional variation in the stock market response to accounting earnings announcements. Journal of Accounting and Economics 11: 117-141. Gaver, J. J. and K. M. Gaver. 1993. Additional evidence on the association between the investment opportunity set and corporate financing, dividend, and compensation policies. Journal of Accounting and Economics 16: 125-160. Hubbard, R. G. 1998. Capital-market imperfections and investment. Journal of Economic Literature: 193-225. Jensen, M. C., and W. H. Meckling. 1976. Theory of the firm: Managerial behavior, agency costs and ownership structure. Journal of Financial Economics 3: 305-360. Johnson, M. F. and D-W. Lee. 1994. Financing constraints and the role of cash flow from operations in the prediction of future profitability. Journal of Accounting, Auditing and Finance 9: 619-652. Kaplan, S. N. and L. Zingales. 1997. Do investment-cash flow sensitivities provide useful measures of financing constraints? The Quarterly Journal of Economics 112: 169-215. Kormendi, R. C. and R. Lipe. 1987. Earnings innovations, earnings persistence, and stock prices. Journal of Business 60: 323-345. Modigliani, F. and M. Miller. 1958. The cost of capital, corporation finance and the theory of investment. American Economic Review 48: 261-297. Myers, S. C., and N. S. Majluf. 1984. Corporate financing and investment decisions when firms have information that investors do not have. Journal of Financial Economics 13: 187-221. Oliner, S. D., and G. D. Rudebusch. 1992. Sources of the financing heirarchy for business investment. The Review of Economics and Statistics 74: 643-654. Oppong, A. 1980. Information content of annual earnings announcements revisited. Journal of Accounting Research 18: 574-584. Ou, J., and S. Penman. 1989. Accounting measurement, price-earnings ratio, and the information content of security prices. Journal of Accounting Research 27: 111-144. Pfeiffer, R. J., and P. T. Elgers. 1999. Controlling for lagged stock price responses in pricing regression: An application to the pricing of cash flows and accruals. Journal of Accounting Research 37: 237-249.

27
Smith, C., and R. Watts. 1992. The investment opportunity set and corporate financing, dividend, and compensation policies. Journal of Financial Economics 32: 263-292.


29
TABLE 1 Descriptive Statistics and Correlations
(n=18,108) Panel A: Descriptive Statistics
Variable Mean Standard Deviation
Minimum 25% Median 75% Maximum
CAR -0.061 0.582 -1.000 -0.423 -0.146 0.158 4.563Ret 0.170 0.550 -0.945 -0.157 0.081 0.366 4.846∆E 0.012 0.180 -1.410 -0.026 0.008 0.039 1.496E 0.018 0.170 -1.478 -0.000 0.053 0.087 1.392∆CFO 0.011 0.192 -1.466 -0.041 0.008 0.061 1.490CFO 0.108 0.194 -1.393 0.023 0.091 0.173 1.494∆ACC 0.000 0.241 -2.214 -0.060 -0.004 0.051 2.450ACC -0.089 0.216 -2.351 -0.138 -0.048 -0.000 1.938IOS 0.004 0.997 -1.939 -0.579 -0.266 0.246 14.664
Panel B: Correlationsa
Variable CAR Ret ∆E E ∆CFO CFO ∆ACC ACC IOS CAR 1.000 0.609 0.149 0.077 0.100 0.145 0.031 -0.070 -0.139Ret 0.622 1.000 0.255 0.239 0.097 0.162 0.113 0.042 -0.064∆E 0.148 0.388 1.000 0.489 0.164 0.148 0.616 0.251 -0.033E 0.161 0.407 0.521 1.000 0.116 0.299 0.273 0.516 -0.056∆CFO 0.113 0.136 0.246 0.151 1.000 0.512 -0.675 -0.369 -0.007CFO 0.224 0.244 0.192 0.417 0.472 1.000 -0.298 -0.663 -0.242∆ACC 0.003 0.120 0.408 0.206 -0.639 -0.283 1.000 0.482 -0.018ACC -0.117 0.023 0.165 0.230 -0.369 -0.665 0.494 1.000 0.174IOS -0.180 -0.079 -0.056 -0.126 0.004 -0.334 -0.033 0.294 1.000
aPearson (Spearman) correlations are reported above (below) the diagonal. Neither correlation between the pairs, )CFO and IOS, and ∆ACC and CAR, is statistically significant at conventional levels. Both correlations are significant at the 0.05 level or better for all other pairs. Ret is the raw return for the one-year window beginning the fourth month of the fiscal year. )E
and )CFO are changes in earnings before extraordinary items (#18) and changes in cash flows from operations (#308) respectively for firm i in year t. E and CFO are the levels of earnings and cash flows from operations respectively for firm i in year t. )ACC (ACC) is computed as )E
minus )CFO (E minus CFO). Changes and levels of earnings, operating cash flows, and accruals are deflated by the beginning of period market value of equity (#24×#25). Compustat data item numbers are in parentheses. IOS is a measure of the size of a firm’s investment opportunity set and is estimated, as a common factor extracted from the four variables listed in exhibit 1, as in Baber et al. (1996).
30
TABLE 2 Industry distribution for sample firms
2-digit SIC codes Industry Number of firms 01-08 Agricultural and Forestry 19 10-14 Mining, including Oil and Gas Exploration 170 15-17 Construction 51 20-21 Food and Tobacco Products 100 22-23 Textile and Apparel 75 24-25 Lumber, Wood and Furniture Products 56 26-27 Paper, Printing, and Publishing 127 28 Chemicals and Allied Products 294 29 Petroleum Refining 32 30-31 Rubber, Plastic and Leather Products 68 32 Stone, Clay, Glass and Concrete Products 26 33 Primary Metal Industries 79 34 Fabricated Metal Industries 80 35 Industrial and Commercial Machinery including Computing Equipment 278 36 Electrical Machinery and Equipment 304 37 Transportation Equipment 88 38 Instruments 290 39 Miscellaneous Manufacturing 45 40-47 Transportation Services 99 48 Communication Services 94 50 Durable Goods – Wholesale 119 51 Non-Durable Goods – Wholesale 61 52-59 Retail – Various 290 61-62 Brokerage and Credit Services 77 63 Insurance 37 64-67 Other Financial Services 108 70 Hotels and Lodging Services 12 72 Personal Services 13 73 Business Services 281 75 Automobile Repair and Services 8 76 Miscellaneous Repair Services 4 78-79 Motion Pictures and Other Entertainment Services 63 80-87 Health, Legal, Educational, and Consultancy Services 165 99 Others 3 Total 3616


32
The specifications also include six year dummy variables DY for 1990 through 1995, and twelve industry dummy variables DI representing 2-digit SIC code numbers 13, 20, 28, 33, 34, 35, 36, 37, 38, 48, 50 and 73. Firm and year subscripts have been suppressed for all variables.
***, **, * indicate two-tailed significance at the 0.01, 0.05, and 0.10 levels for individual coefficients and coefficient sums.


36
the upper (lower) third are classified as having high (low) R&D+Advertising Expenses-to-Capital Expenditures ratios. Observations in the middle third are excluded. Compustat data item numbers are in parentheses. The specifications include control variables as described in Table 3. They also include six year dummy variables DY for 1990 through 1995, and twelve industry dummy variables DI representing 2-digit SIC code numbers 13, 20, 28, 33, 34, 35, 36, 37, 38, 48, 50 and 73. Firm and year subscripts have been suppressed for all variables. ***, **, * indicate two-tailed significance at the 0.01, 0.05, and 0.10 levels respectively for all individual coefficients and coefficient sums.
1 We follow Myers (1977) in viewing a firm as a combination of assets-in-place and investment
opportunities (or options).
2 Previous studies typically either do not investigate explanations for the value-relevance of
earnings components or only focus on CFO as an alternate signal for earnings. Examples of such
studies include Rayburn (1986), Bowen, Burgstahler and Daley (1987), Bernard and Stober
(1989) and Cheng et al. (1996).
3Some prior studies such as, Rayburn (1986), Bowen, Burgstahler and Daley (1987), Bernard
and Stober (1989) and Cheng et al. (1996) consider the value-relevance of CFO to investors.
However, with one exception, they do not examine the moderating effect of investment

37
opportunities, and typically explain the value-relevance of CFO in terms of its role as a
information signal that complements earnings and not as a source of internal cash for investing.
4 Specifically, the factor score computed for year t is highly correlated with t+1 through t+5
realized investment intensity, revenue growth and asset growth, where investment intensity and
asset growth rate are as defined in Exhibit 1 and revenue growth rate is defined similarly to asset
growth rate.
5As a check on whether our IOS measure captures differences across firms on each of the
underlying components, we partition the sample at the median IOS and test for differences across
the two subsets on the four components. All four test-statistics are statistically significant in the
predicted directions (p # 0.01).
6SFAS 95 requires adoption effective July 1988. Thus, 1989 is the first fiscal year for which all
firms in our sample report CFO under the new standard. We need CFO changes, therefore we
begin our analysis with fiscal 1990.
7Such evidence raises concerns that our findings are limited to periods of poor financial
performance. Later, in section 5.2.3, we discuss sensitivity tests designed to address such
concerns.