kth royal institute of technology - … · department of chemical engineering and technology ......
TRANSCRIPT
KTH ROYAL INSTITUTE OF TECHNOLOGY
School of Chemical Science and Engineering Department of Chemical Engineering and Technology
MASTER OF SCIENCE THESIS IN CHEMICAL ENGINEERING
Design of a Solvent Recovery System in a Pharmaceutical Manufacturing Plant
Author Supervisor Examiner Mr. Shashank Bhandari Mr. Kenneth Jansson Dr. Matthäus U. Bäbler (AstraZeneca) (KTH)
Stockholm, Sweden June 16, 2016
Abstract
In this work, solvent recovery in pharmaceutical industries has been studied. Solvents play a crucial
role in the Active Pharmaceutical Ingredient (API) manufacturing and are used in large quantities.
Most of the industries incinerate the waste solvents or send it to waste management companies for
destruction to avoid waste handling and cross-contamination. It is not a cost effective method and also
hazardous to the environment. This study has been performed at AstraZeneca’s API manufacturing
plant at Sodertalje, Sweden. In order to find a solution, a solvent recovery system is modeled and
simulated using ASPEN plus and ASPEN batch modeler. The waste streams were selected based on
the quantity and cost of the solvents present in them. The solvent mixture in the first waste stream was
toluene-methanol in which toluene was the key-solvent whereas in the second waste stream,
isooctane-ethyl acetate was the solvent mixture in which isooctane was the key-solvent. The solvents
in the waste stream were making an azeotrope and hence it was difficult to separate them using
conventional distillation techniques. Liquid-Liquid Extraction with water as a solvent followed by
batch distillation was used for the first waste stream and Pressure Swing Distillation was used for the
second waste stream. The design was optimized based on cost analysis and was successful to deliver
96.1% toluene recovery with 99.5% purity and 83.6% isooctane recovery with 99% purity. The purity
of the solvents was decided based on the quality conventions used at AstraZeneca so that it can be
recovered and recycled in the same system. The results were favorable with a benefit of €335,000 per
year and preventing nearly one ton per year carbon dioxide emissions to the environment. A
theoretical study for the recovery system of toluene-methanol mixture was performed. The proposed
design was an integration of pervaporation to the batch distillation. A blend of polyurethane-
poly(dimethylsiloxane) (PU-PDMS) membrane was selected for the separation of methanol and
toluene mixture. The results of preliminary calculations show 91.39% toluene recovery and 72%
methanol recovery with desired purity.
1
Table of Contents Abstract .................................................................................................................................................... 1
1 Introduction .......................................................................................................................................... 3
1.1 Background ................................................................................................................................... 4
1.2 Problem Definition ......................................................................................................................... 5
1.3 Limitations .................................................................................................................................... 6
2 Methodology ........................................................................................................................................ 7
3 AstraZeneca .......................................................................................................................................... 8
3.1 History .......................................................................................................................................... 8
4 Solvents’ System at Snäckviken ............................................................................................................. 9
4.1 Key-Solvents ............................................................................................................................... 10
5 Stream 1: Toluene and Methanol .......................................................................................................... 12
5.1 Vapour Liquid Equilibrium ........................................................................................................... 12
5.2 Liquid-Liquid Extraction ............................................................................................................... 13
5.3 Liquid-Liquid Extraction Design.................................................................................................... 15
5.3.1 One-Stage ............................................................................................................................. 16
5.3.2 Two-Stage ............................................................................................................................. 18
5.3.3 Process description ................................................................................................................ 21
5.4 Batch Distillation .......................................................................................................................... 22
5.5 Batch Distillation Design .............................................................................................................. 24
6 Stream 1: Results and Discussion ......................................................................................................... 27
6.1 Mass and Energy Balance ............................................................................................................. 27
6.2 Analysis....................................................................................................................................... 29
7 Stream 2: Isooctane and Ethyl acetate ................................................................................................... 32
7.1 Extractive Distillation ................................................................................................................... 34
7.2 Pressure Swing Distillation ............................................................................................................ 34
7.3 Pressure Swing Distillation Design ................................................................................................ 36
7.3.1 Process Description ................................................................................................................ 39
8 Stream 2: Results and Discussions ........................................................................................................ 41
8.1 Mass and Energy Balance ............................................................................................................. 41
8.2 Analysis....................................................................................................................................... 42
9 Alternate Separation Method ................................................................................................................ 45
9.1 Pervaporation ............................................................................................................................... 45
9.2 Characteristics of Pervaporation Membranes................................................................................... 46
9.3 Integration of Pervaporation with Batch Distillation ........................................................................ 48
9.4 Previous Research Work on Pervaporation ..................................................................................... 49
9.5 Design Calculations and Results .................................................................................................... 50
10 Conclusion ........................................................................................................................................ 54
References .............................................................................................................................................. 56
2
1 Introduction
As we are moving towards global industrialization, the demand for energy is increasing rapidly. In
response to this, societies, organization and companies are trying to be more sustainable. They are
finding ways to recycle, recover and reduce by-products and waste by e.g. process integration and
process intensification such as to eventually become energy self-sufficient. The focus of this project is
on pharmaceutical industries. Their biggest concern is to produce high purity, consistent quality and
high yields APIs. This requires a reliable, robust and very effective system of manufacturing in order
to fulfill such demands. The other concerns such as safety, operations and environmental impacts
related to the manufacturing of such chemicals are also very important. Due to these high priority
components, the other components such as process of solvent selection and recovery are always
undervalued and are of least concern in many pharmaceutical industries.
In any typical API manufacturing process, the amount of solvent used is almost 80-90% of the total
mass utilized [1]. Generally, the manufacturing process of APIs is complex and contains multiple
mixed solvent waste streams. It is mainly a mixture of organic and aqueous phases. Separation and
recovering solvent from the waste is a very tedious process since many of them form azeotropes. Due
to such problems, instead of separating them, the other option practiced is incineration and
destruction. This however comes at a cost, as best described by: “We pay for the solvent, we pay for
the capital to manage it and we pay to burn it“[1].
Another issue faced by the pharmaceutical industries is the toxicity level of few useful solvents such
as tetrahydrofuran and dichloromethane. In GlaxoSmithKline (GSK), dichloromethane is the biggest
contributor on mass basis in the list of chemicals of concern [1]. Since last few years their efforts in
reducing the usage of it is not significant. It is because, to produce a certain API, the minimum
amount of solvent required cannot be changed after a certain level. Therefore, the major challenge
was to find a replacement of dichloromethane or to find a way to reduce the volume of batch reactor
by using a suitable type or style of reactor [1]. Few dipolar aromatic solvents have excellent solvation
properties but it is very difficult to find a replacement for such solvents. Also, dichloromethane is not
miscible with water and it forms organic and aqueous phase in the waste stream and the separation
process is complicated. It has very high BOD/COD ratio if discharged into the Waste Water
Treatment Plant [1]. Due to the above issues, it is clear that more emphasis should be given in
reducing the consumption of solvent and the best possible ways to recover and reuse. Reducing the
solvent in the process based on the chemistry is difficult and not significant [1].
The focus of pharmaceutical companies is mainly on Research and Development (R & D) and that is
one of the reasons why some other sections of the company are always undervalued. The company
3
uses solvents in enormous quantities. These solvents are usually toxic in nature and are not fit for
sending to a waste water treatment plant. The other option is to send it to a waste management
company which is not economical. The biggest percentage of waste in any pharmaceutical company
comes from solvent waste and the best way to reduce it is to reuse it. It requires separating solvents
from the waste using separation techniques such as distillation, stripping, membrane separation etc.
Few separation techniques are explained in the latter section of this report.
The purpose of any pharmaceutical industry is to invent drugs that help patients to live healthier and
longer. It is also important to have minimum impact on the environment while bringing drugs to the
patients. In the last few years, pharmaceutical industries became aware about green engineering. They
have shown significant interest in waste management, quality management as well as productivity
improvement in both the Research and Development (R&D) and manufacturing sector [2].
1.1 Background
AstraZeneca is Sweden’s biggest pharmaceutical company and a very well-known name in the global
market. Its total revenue is over 26 billion US dollars in 2014. The company has nearly 57,500
employees worldwide. Its business is spread over 100 countries. In Europe, the major manufacturing
sites are located mainly in Sweden and in the UK. In Sweden, the biggest production unit is located in
Södertälje. [3]
The API production at the Snäckviken site in Södertälje is facing a major challenge in solvent
recovery. The solvent recovery is done only for one solvent whereas rest of the other solvents from
the process goes to SAKAB (a waste management company) for destruction. As discussed earlier,
destruction is a very expensive process and hence uneconomical. It also causes emission of Green
House Gases (GHG).
One of the major reasons why solvent recovery is not usually performed in pharmaceutical
manufacturing is because of the problem of cross contaminations. Solvent recovery was performed at
the Snäckviken site until early 90s. It was done in a solvent recovery plant which is called as “The
church” in local terminologies. The major solvents were recovered by five batch distillation columns.
After a plant visit by the Food and Drug Administrative (FDA), it was recommended to stop solvent
recovery since it can cause cross contaminations. The reason was the use of a single solvent recovery
plant for the recovery of all the solvents and then using the recovered solvents for the manufacturing
of APIs. The recovered solvents may have traces of other chemicals to contaminate the API. Due to
strict quality compliance in API manufacturing, the solvent recovery was stopped. The other reason of
not continuing solvent recovery at the Snäckviken site was the complicated system design. Most of
4
the used-solvent mixtures in pharmaceutical industries form an azeotrope. Separation of azeotropic
mixture requires a complex system design hence most of the time it is avoided.
Now, with the growing awareness of sustainability in the manufacturing plants, this master’s thesis
was performed to investigate the challenges of solvent recovery at the Snäckviken manufacturing site
in Södertälje.
1.2 Problem Definition
The purpose of the project was to reuse the used-solvents by recovering them from the waste stream
without cross-contamination. It will help in following ways:
Cost reduction by recovering the solvent as well as by not sending the used-solvents to the
waste management companies for the destruction.
Reduction in carbon footprint by recovering the solvents.
Less waste to handle by recovering high amount of solvents from the waste stream.
It increases the overall sustainability of the process.
The project was divided into three major parts:
The first part was to study the existing API manufacturing system with the overview of usage of
solvents in the process. The purpose of this section was to get familiar with the process and narrow
down the research by choosing the key-solvents. The research period was restricted to 20 weeks hence
instead of focusing on reducing all the solvents in the plant, only two key-solvents were studied based
on the cost and the amount of the solvent used in API manufacturing. The recovery of key-solvents
has a major impact on reducing the overall amount of waste solvents.
The second part was to find the best separation method that can be used to separate and purify the
key-solvents from the respective waste streams. It also involved designing the system based on the
chosen separation method. The system was to be designed by using existing equipment at the solvent
recovery plant. The purpose of this section was to optimize the recovery of key-solvents while
keeping the purity as required in the process. It also included optimizing the process based on the
economical calculations.
The third and final part was to study alternative separation methods that do not rely on existing
equipments and can be suitable for separating the key-solvents from the waste stream. It also involved
theoretical studies for designing a dedicated internal solvent recovery system for separation of key-
5
solvents in the respective API manufacturing plant. The purpose of this section was to find a cheaper
and more efficient option than the design proposed in the second part.
1.3 Limitations
The project was restricted to 20 weeks of full-time work hence only two solvents were considered for
the study. The design was based on computer simulation software and not on experimental studies
therefore it may vary in practical conditions. The waste-streams were assumed to be free from
impurities and only consist of key-solvents to simplify the calculations. It is required to do further
studies for the separation steps needed before the proposed design to remove the impurities. Economic
analysis gives the general idea of the system and not the real figures of the cost since it was based on
few assumptions discussed in the latter section of the report. Discussion on alternative separation
methods, i.e. pervaporation is limited to theoretical studies.
6
2 Methodology
The methodology used for this project was ASPEN plus v.8 and ASPEN batch modeler v.8. ASPEN
Technology is the leading supplier of software to the process industries. They offer various software
packages that help to optimize the manufacturing process. It allows users to develop process models
and then simulate it without any complex calculations. It can be used to solve various chemical
engineering problems. It can carry out simple problems such as calculating thermodynamic properties
of a mixture to complex problems such as predicting the steady-state behavior of a large scale process
plant.
ASPEN plus allows users to build a process model based on the requirement of the process. It begins
with specifying the components, choosing the appropriate method for calculations, creating a flow-
sheet and specifying operating conditions. After building the process model, ASPEN plus simulates
the model at steady state. It gives the results of all the streams and units used in the process flow-
sheet. The results are based on the model developed by the user. It is a very effective tool for
predicting the behavior of the process at steady state.
ASPEN batch modeler is mostly used in pharmaceutical industries to predict the behavior of batch
processes. It allows the user to choose between batch column and batch reactor. The user can then
build the model based on process requirements. It begins with specifying the components, choosing
the appropriate method and specifying the operating conditions. It deals with non-steady state
operations therefore it helps to predict the non-steady state behavior of the process. It gives the result
of all the components of the output stream at different time.
The problem was identified and defined based on the study of the process. The problem was then
solved using the ASPEN software packages described above. The results were discussed based on
different cases and then conclusions were drawn.
7
3 AstraZeneca
AstraZeneca is an innovation-driven, global biopharmaceutical company with operations in more than
hundred countries. Its innovative medicines are used by millions of patients worldwide. It is well
known for inventing medicines in areas including “cardiovascular, metabolic, respiratory,
inflammation, autoimmune, oncology, infection and neuroscience-diseases.”[4]. According to the
annual report of 2014, the company has nearly 57500 employees across the world with 33% in
Europe, 29% in America, 38% in Asia, Africa and Australia. The net cash flow from operating
activities is 7.1 billion USD whereas core operating profit is 6.9 billion USD [5]. After 2007, it has
adopted a major program of downsizing for cost reduction and shifted its focus on its core business to
adapt with the changing market environment. Like any other pharmaceutical company, AstraZeneca’s
focus is also on Research and Development to sustain in the competitive market. New innovation and
inventions are very important to maintain its place in the tough business environment [3]. Around 4.9
billion USD is invested in R&D across 5 countries whereas manufacturing plants are in 16 different
countries [5].
3.1 History
AstraZeneca was formed when two pharmaceutical companies Astra AB and Zeneca Group merged in
the year 1999. Its headquarters is in London. Astra AB was founded in 1913 in Södertälje, Sweden.
Zeneca Group was formed in the year 1993 when the British ICI divided into two divisions [6]. One
of the divisions was pharmaceutical and the other was agrochemical business which later resulted in
the formation of two separate companies.
Both the companies have their own success stories and histories but they shared the same fundamental
values: “a passion for science and a clear vision of the pharmaceutical industry” [6]. After combining
their immense resources and highly talented employees, a new story of innovation started.
8
4 Solvents’ System at Snäckviken
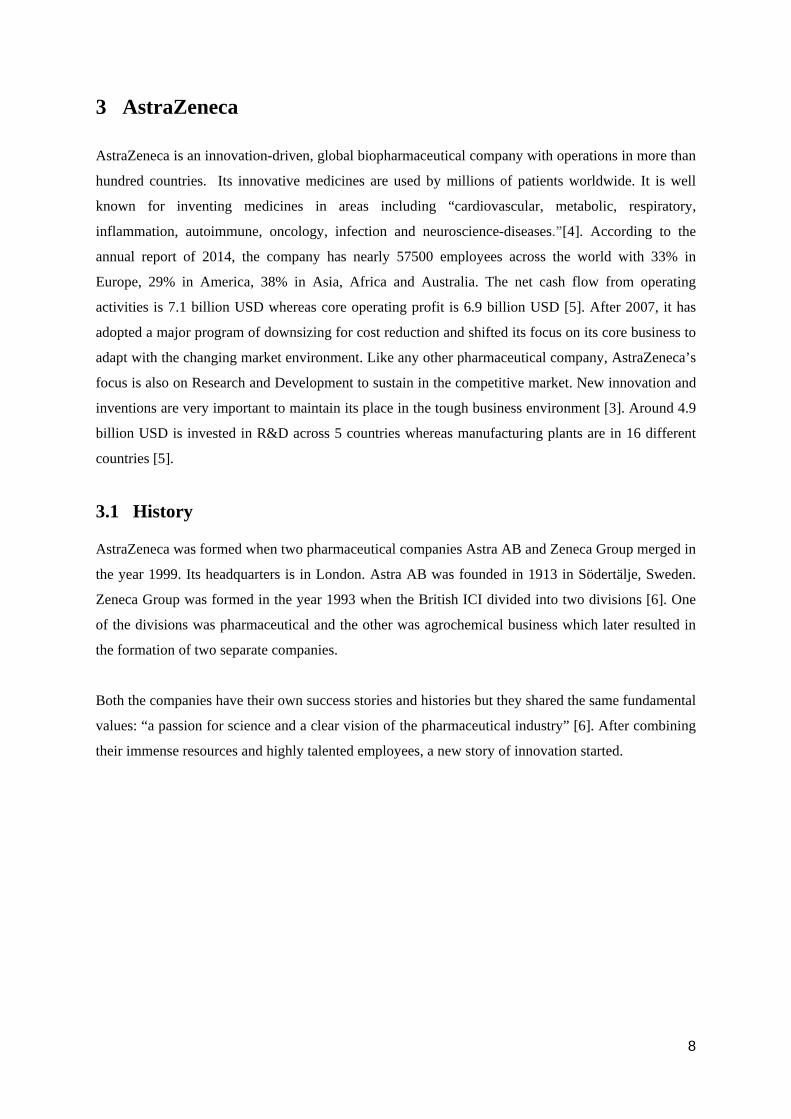
The present solvents’ system at Snäckviken site of AstraZeneca is schematically shown in figure 1.
Figure 1: Solvent system at Snäckviken
The solvents are unloaded at the tank farm area and transferred to the delivery tanks. After the lab
testing is approved, the solvents are then transferred to the supply tanks. Supply tanks for each solvent
are connected to the respective API manufacturing unit. Currently, only acetone used in
manufacturing of Metoprolol is recycled as seen from figure 1. All the other solvents after being used
in the respective units are sent to the unclean solvent tanks. After the lab analysis of unclean solvents,
they are sent to a waste management company called SAKAB for destruction. The charges levied by
SAKAB are based on the calorific value of the solvents.
The unclean acetone after being used in the Metoprolol manufacturing process is sent to the unclean
solvent tank. From there it is transferred to the batch distillation column (K2) for recovering acetone
using simple batch distillation. After recovering acetone at the desired purity, it is transferred to the
quarantine tank. Lab testing is performed to ensure its specifications. After the lab results are
approved, acetone is then sent to the recycle tank and from there it can be reused in the Metoprolol
manufacturing process.
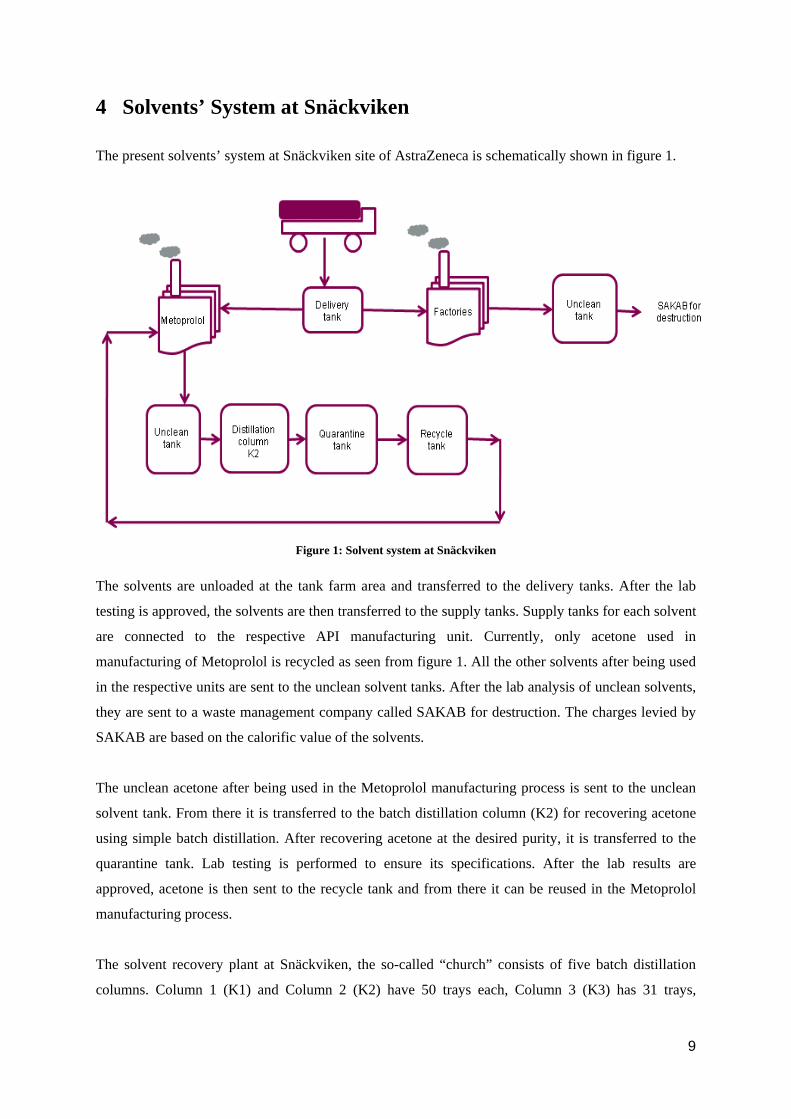
The solvent recovery plant at Snäckviken, the so-called “church” consists of five batch distillation
columns. Column 1 (K1) and Column 2 (K2) have 50 trays each, Column 3 (K3) has 31 trays,
9
Column 4 (K4) has 36 trays and column 5 (K7) has 31 trays. As discussed earlier, only column 2
(K2) is currently in use for recovering acetone which makes the other columns available for this
project. The outline of the solvent recovery plant is described in figure 2.
Figure 2: Existing solvent recovery system at Snäckviken
4.1 Key-Solvents
The amount and the cost of all the solvents used in the Snäckviken plant were calculated and two
solvents were chosen based on their quantity and cost. The detailed information about these two
solvents was given by AstraZeneca and is described in table 1:
Table 1: Solvent waste
Total Waste Solvents Cost/Annum Quantity (tons) CO2(tons) on complete combustion Toluene 2,018,726 SEK 183.19 613.28
Methanol 618,843 SEK 134.53 184.98 Ethyl acetate 451,846 SEK 46.53 93.07
Isooctane 2,146,770 SEK 43.86 135.42 5,236,187 SEK 408.11 1026.74
As seen from table 1, toluene was chosen based on its high quantity whereas isooctane was chosen
based on its high cost. The stream that contains toluene was named Stream 1 whereas the stream that
contained isooctane was named Stream 2. The second main component in Stream 1 was methanol
while 2-Phenyl-2 Propanol was present in low quantity; other components were assumed to be zero.
The other solvent in Stream 2 was ethyl acetate whereas rest of the impurities was assumed to be zero.
The recovery of toluene and methanol from Stream 1 can save nearly 2.6 million SEK per year and
the recovery of isooctane and ethyl acetate from Stream 2 can also save nearly 2.6 million SEK per
10
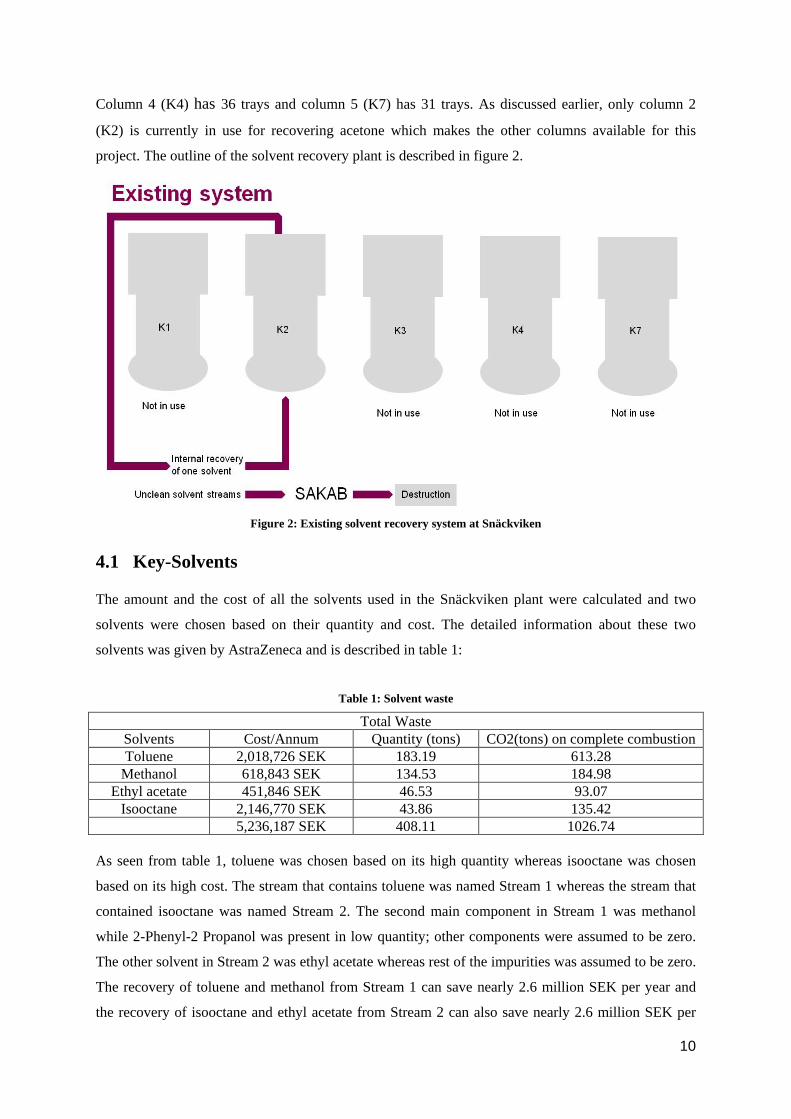
year. The successful recovery of both the solvents therefore could save about 5.2 million SEK per
year. The expected savings from each solvent are shown in figure 3.
Figure 3: Expected savings from each solvent
As seen from figure 3, the key-solvents toluene and isooctane cover almost 80% of the total savings
whereas the remaining 20% savings are of the other two solvents. This implies that the priority should
be given to the recovery of key-solvents toluene and methanol.
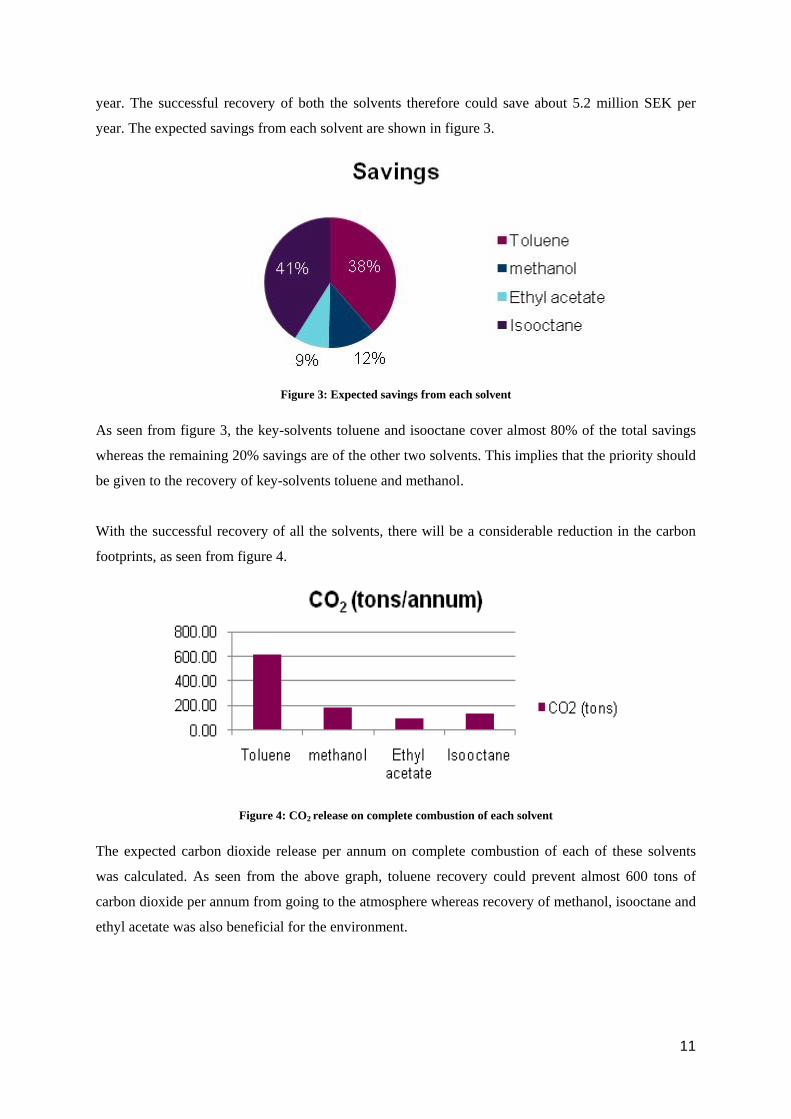
With the successful recovery of all the solvents, there will be a considerable reduction in the carbon
footprints, as seen from figure 4.
Figure 4: CO2 release on complete combustion of each solvent
The expected carbon dioxide release per annum on complete combustion of each of these solvents
was calculated. As seen from the above graph, toluene recovery could prevent almost 600 tons of
carbon dioxide per annum from going to the atmosphere whereas recovery of methanol, isooctane and
ethyl acetate was also beneficial for the environment.
11
5 Stream 1: Toluene and Methanol
The required purity of toluene used at AstraZeneca is 99.5 mole%. Separation of the key-solvent
toluene from stream 1 can be performed by various techniques. The aim was to find a technique that
was simple, efficient and cost effective to recover toluene at the desired purity. The stream 1 was
having two liquids with different boiling points. The first possible separation technique to use for this
system was distillation. As discussed earlier, there are four batch distillation columns available at the
solvent recovery plant and therefore it could be an economical option.
5.1 Vapour Liquid Equilibrium
It was decided to use distillation for this system. To check the feasibility of distillation, it was
important to check the Vapor-Liquid Equilibrium (VLE) for the toluene-methanol binary mixture
before making the final decision. The VLE of the binary mixture was calculated in ASPEN plus using
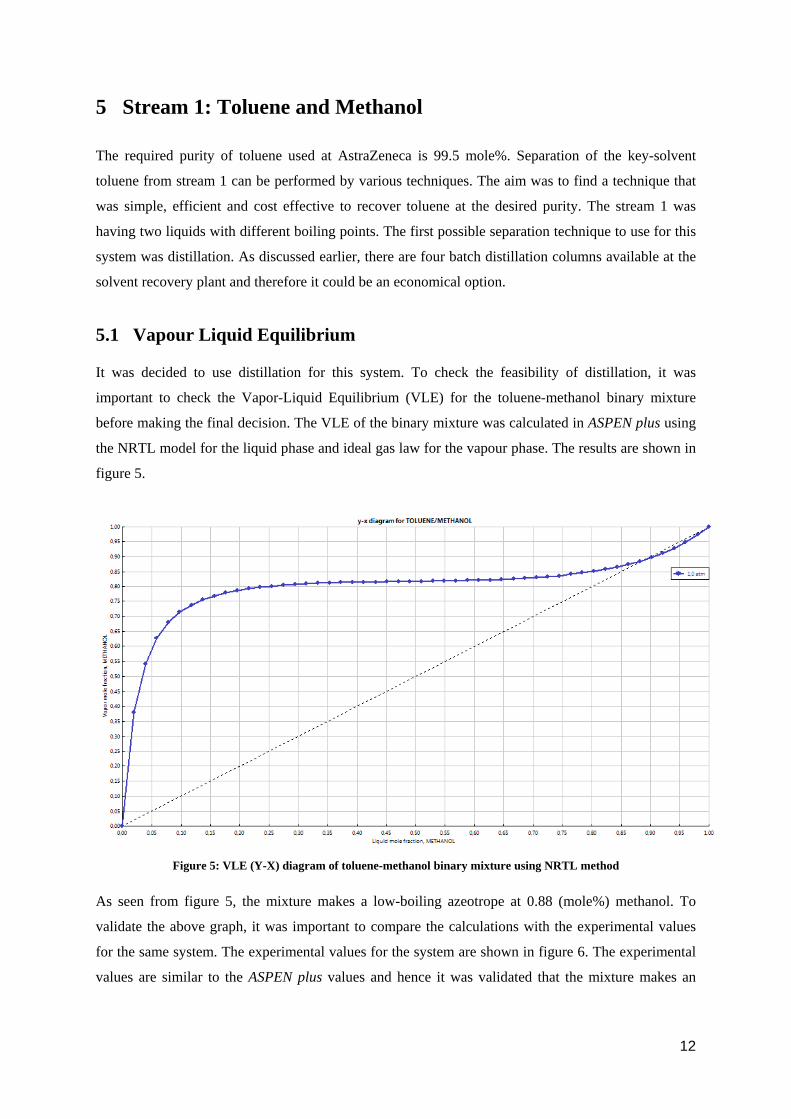
the NRTL model for the liquid phase and ideal gas law for the vapour phase. The results are shown in
figure 5.
Figure 5: VLE (Y-X) diagram of toluene-methanol binary mixture using NRTL method
As seen from figure 5, the mixture makes a low-boiling azeotrope at 0.88 (mole%) methanol. To
validate the above graph, it was important to compare the calculations with the experimental values
for the same system. The experimental values for the system are shown in figure 6. The experimental
values are similar to the ASPEN plus values and hence it was validated that the mixture makes an
12
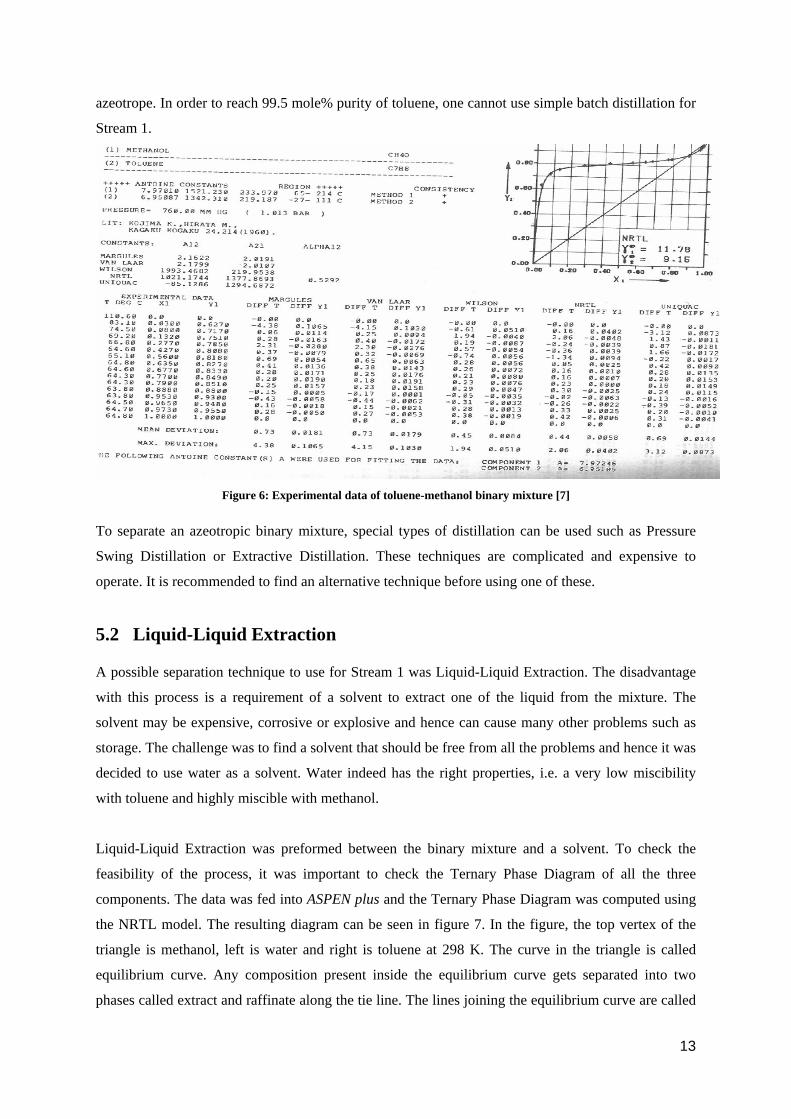
azeotrope. In order to reach 99.5 mole% purity of toluene, one cannot use simple batch distillation for
Stream 1.
Figure 6: Experimental data of toluene-methanol binary mixture [7]
To separate an azeotropic binary mixture, special types of distillation can be used such as Pressure
Swing Distillation or Extractive Distillation. These techniques are complicated and expensive to
operate. It is recommended to find an alternative technique before using one of these.
5.2 Liquid-Liquid Extraction
A possible separation technique to use for Stream 1 was Liquid-Liquid Extraction. The disadvantage
with this process is a requirement of a solvent to extract one of the liquid from the mixture. The
solvent may be expensive, corrosive or explosive and hence can cause many other problems such as
storage. The challenge was to find a solvent that should be free from all the problems and hence it was
decided to use water as a solvent. Water indeed has the right properties, i.e. a very low miscibility
with toluene and highly miscible with methanol.
Liquid-Liquid Extraction was preformed between the binary mixture and a solvent. To check the
feasibility of the process, it was important to check the Ternary Phase Diagram of all the three
components. The data was fed into ASPEN plus and the Ternary Phase Diagram was computed using
the NRTL model. The resulting diagram can be seen in figure 7. In the figure, the top vertex of the
triangle is methanol, left is water and right is toluene at 298 K. The curve in the triangle is called
equilibrium curve. Any composition present inside the equilibrium curve gets separated into two
phases called extract and raffinate along the tie line. The lines joining the equilibrium curve are called
13
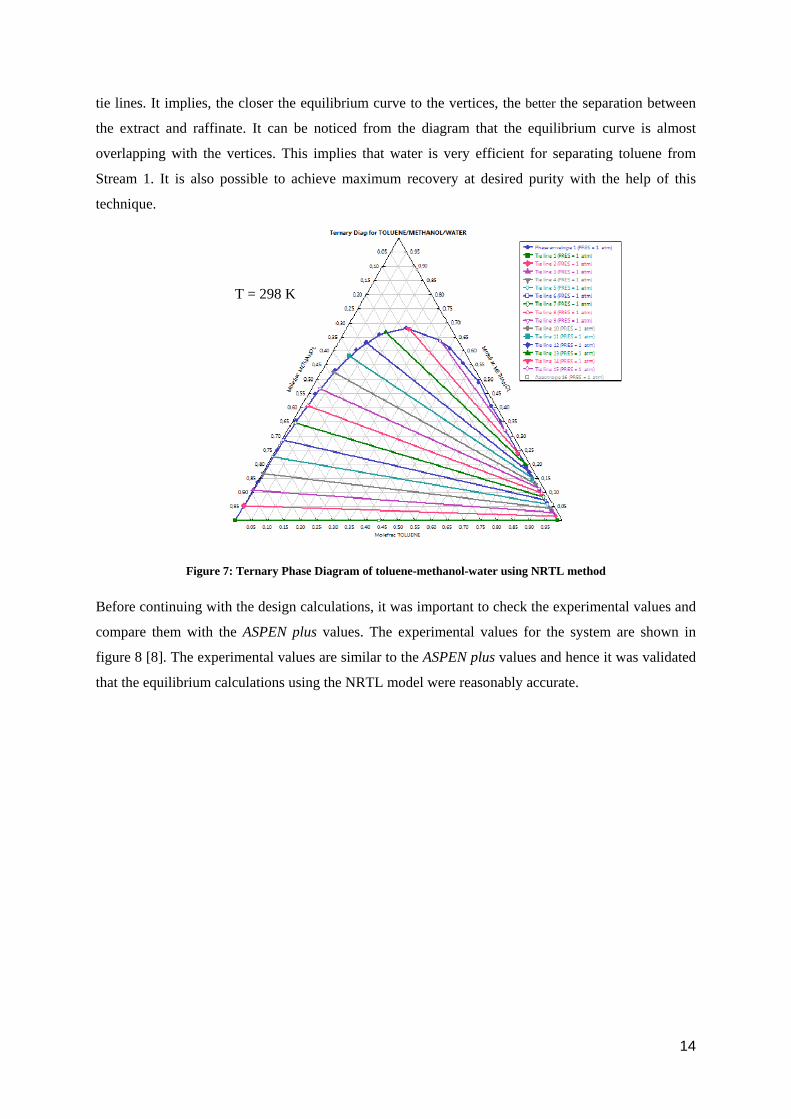
tie lines. It implies, the closer the equilibrium curve to the vertices, the better the separation between
the extract and raffinate. It can be noticed from the diagram that the equilibrium curve is almost
overlapping with the vertices. This implies that water is very efficient for separating toluene from
Stream 1. It is also possible to achieve maximum recovery at desired purity with the help of this
technique.
Figure 7: Ternary Phase Diagram of toluene-methanol-water using NRTL method
Before continuing with the design calculations, it was important to check the experimental values and
compare them with the ASPEN plus values. The experimental values for the system are shown in
figure 8 [8]. The experimental values are similar to the ASPEN plus values and hence it was validated
that the equilibrium calculations using the NRTL model were reasonably accurate.
T = 298 K
14
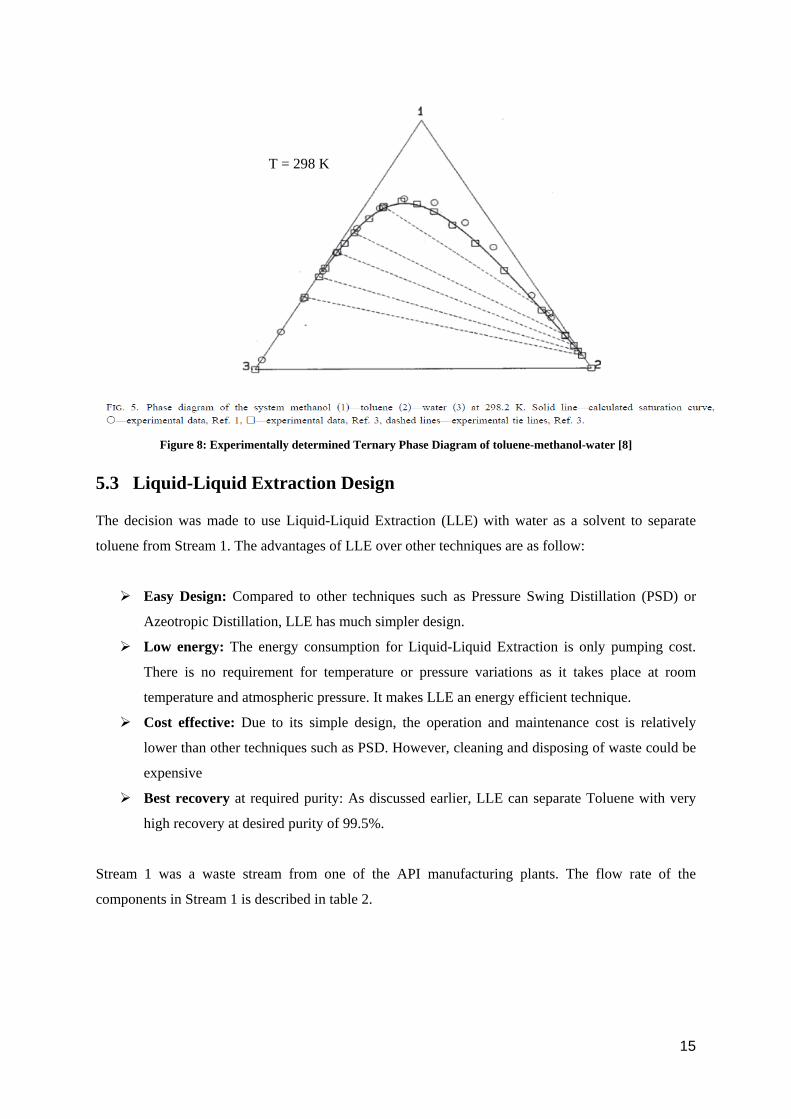
Figure 8: Experimentally determined Ternary Phase Diagram of toluene-methanol-water [8]
5.3 Liquid-Liquid Extraction Design
The decision was made to use Liquid-Liquid Extraction (LLE) with water as a solvent to separate
toluene from Stream 1. The advantages of LLE over other techniques are as follow:
Easy Design: Compared to other techniques such as Pressure Swing Distillation (PSD) or
Azeotropic Distillation, LLE has much simpler design.
Low energy: The energy consumption for Liquid-Liquid Extraction is only pumping cost.
There is no requirement for temperature or pressure variations as it takes place at room
temperature and atmospheric pressure. It makes LLE an energy efficient technique.
Cost effective: Due to its simple design, the operation and maintenance cost is relatively
lower than other techniques such as PSD. However, cleaning and disposing of waste could be
expensive
Best recovery at required purity: As discussed earlier, LLE can separate Toluene with very
high recovery at desired purity of 99.5%.
Stream 1 was a waste stream from one of the API manufacturing plants. The flow rate of the
components in Stream 1 is described in table 2.
T = 298 K
15
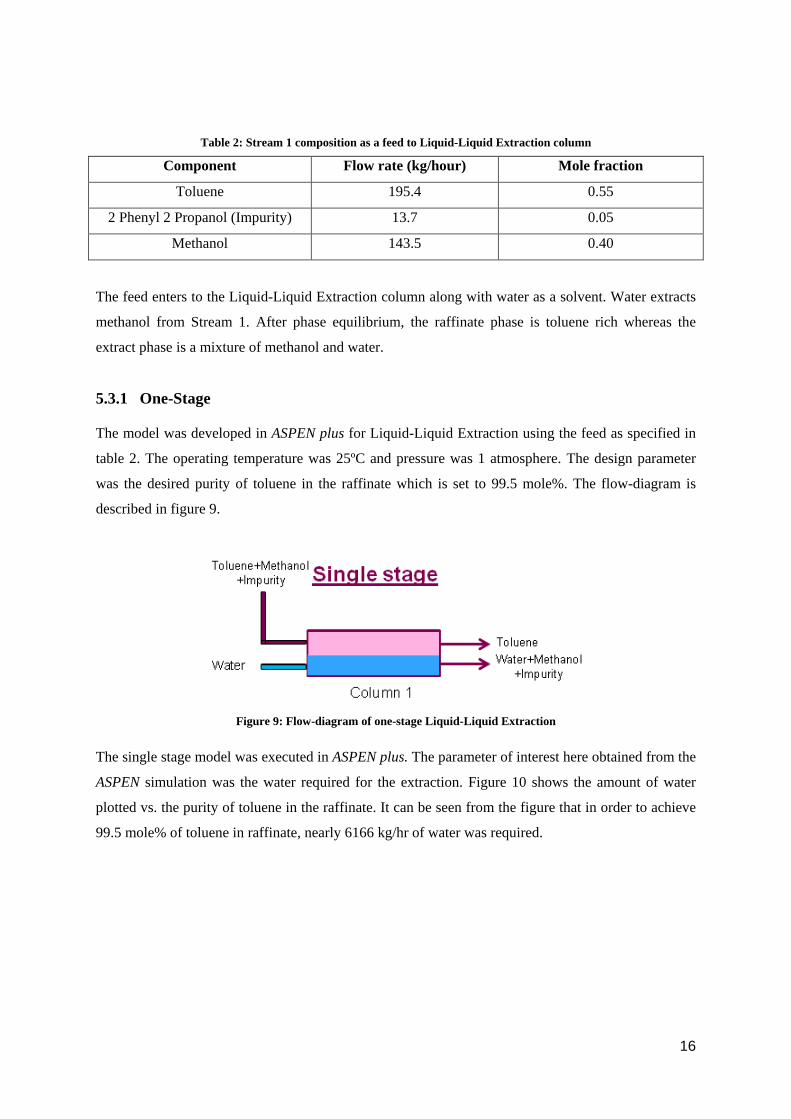
Table 2: Stream 1 composition as a feed to Liquid-Liquid Extraction column
Component Flow rate (kg/hour) Mole fraction
Toluene 195.4 0.55
2 Phenyl 2 Propanol (Impurity) 13.7 0.05
Methanol 143.5 0.40
The feed enters to the Liquid-Liquid Extraction column along with water as a solvent. Water extracts
methanol from Stream 1. After phase equilibrium, the raffinate phase is toluene rich whereas the
extract phase is a mixture of methanol and water.
5.3.1 One-Stage
The model was developed in ASPEN plus for Liquid-Liquid Extraction using the feed as specified in
table 2. The operating temperature was 25ºC and pressure was 1 atmosphere. The design parameter
was the desired purity of toluene in the raffinate which is set to 99.5 mole%. The flow-diagram is
described in figure 9.
Figure 9: Flow-diagram of one-stage Liquid-Liquid Extraction
The single stage model was executed in ASPEN plus. The parameter of interest here obtained from the
ASPEN simulation was the water required for the extraction. Figure 10 shows the amount of water
plotted vs. the purity of toluene in the raffinate. It can be seen from the figure that in order to achieve
99.5 mole% of toluene in raffinate, nearly 6166 kg/hr of water was required.
16
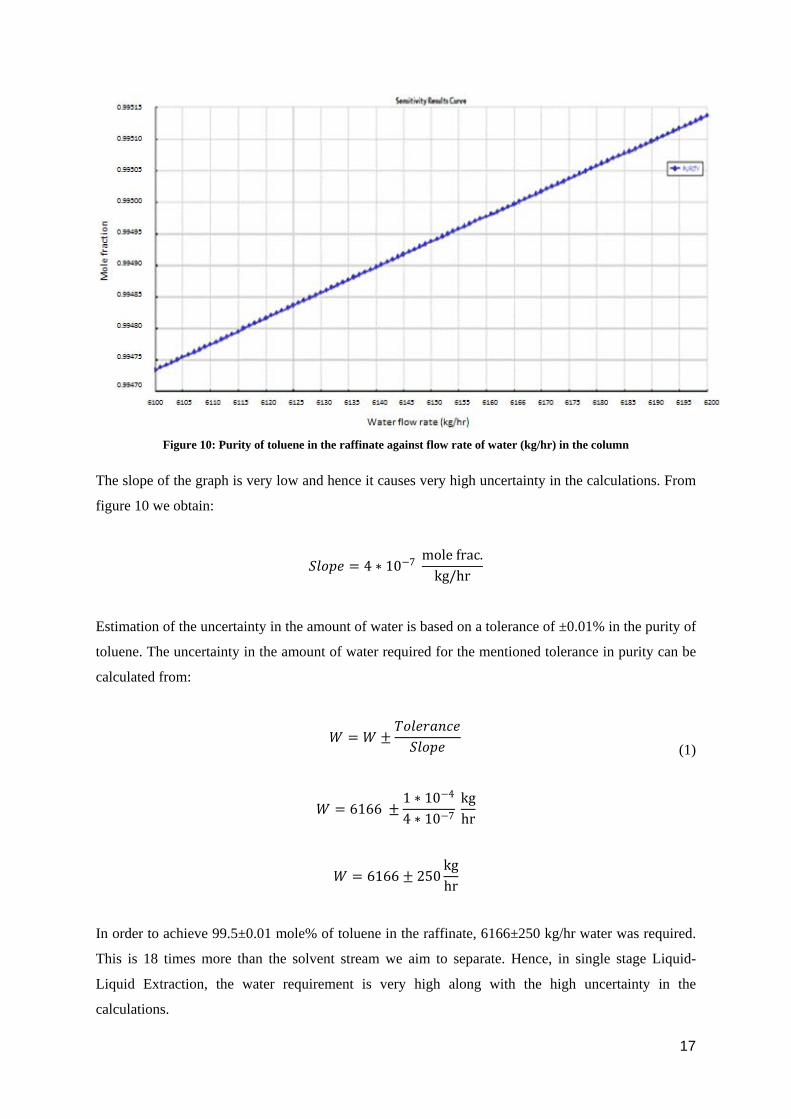
Figure 10: Purity of toluene in the raffinate against flow rate of water (kg/hr) in the column
The slope of the graph is very low and hence it causes very high uncertainty in the calculations. From
figure 10 we obtain:
𝑆𝑆𝑆𝑆𝑆𝑆𝑆𝑆𝑆𝑆 = 4 ∗ 10−7 mole frac.
kg/hr
Estimation of the uncertainty in the amount of water is based on a tolerance of ±0.01% in the purity of
toluene. The uncertainty in the amount of water required for the mentioned tolerance in purity can be
calculated from:
𝑊𝑊 = 𝑊𝑊 ±
𝑇𝑇𝑆𝑆𝑆𝑆𝑆𝑆𝑇𝑇𝑇𝑇𝑇𝑇𝑇𝑇𝑆𝑆𝑆𝑆𝑆𝑆𝑆𝑆𝑆𝑆𝑆𝑆
(1)
𝑊𝑊 = 6166 ±1 ∗ 10−4
4 ∗ 10−7 kghr
𝑊𝑊 = 6166 ± 250kghr
In order to achieve 99.5±0.01 mole% of toluene in the raffinate, 6166±250 kg/hr water was required.
This is 18 times more than the solvent stream we aim to separate. Hence, in single stage Liquid-
Liquid Extraction, the water requirement is very high along with the high uncertainty in the
calculations.
17
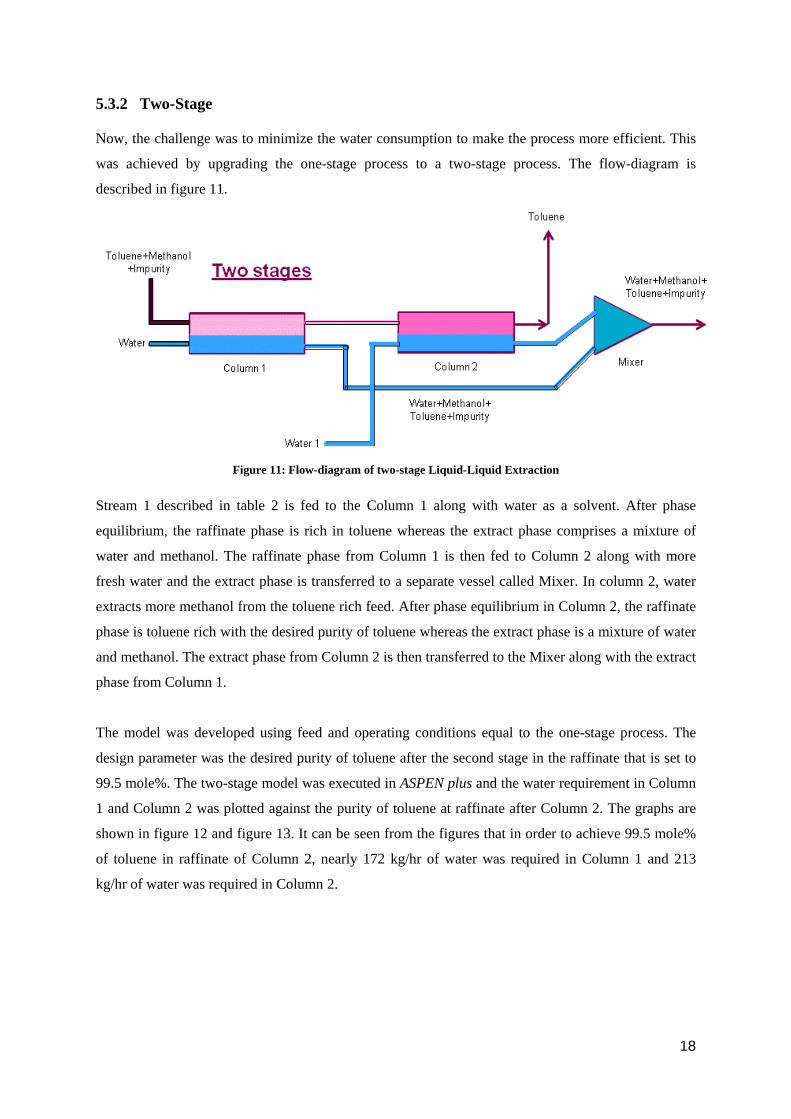
5.3.2 Two-Stage
Now, the challenge was to minimize the water consumption to make the process more efficient. This
was achieved by upgrading the one-stage process to a two-stage process. The flow-diagram is
described in figure 11.
Figure 11: Flow-diagram of two-stage Liquid-Liquid Extraction
Stream 1 described in table 2 is fed to the Column 1 along with water as a solvent. After phase
equilibrium, the raffinate phase is rich in toluene whereas the extract phase comprises a mixture of
water and methanol. The raffinate phase from Column 1 is then fed to Column 2 along with more
fresh water and the extract phase is transferred to a separate vessel called Mixer. In column 2, water
extracts more methanol from the toluene rich feed. After phase equilibrium in Column 2, the raffinate
phase is toluene rich with the desired purity of toluene whereas the extract phase is a mixture of water
and methanol. The extract phase from Column 2 is then transferred to the Mixer along with the extract
phase from Column 1.
The model was developed using feed and operating conditions equal to the one-stage process. The
design parameter was the desired purity of toluene after the second stage in the raffinate that is set to
99.5 mole%. The two-stage model was executed in ASPEN plus and the water requirement in Column
1 and Column 2 was plotted against the purity of toluene at raffinate after Column 2. The graphs are
shown in figure 12 and figure 13. It can be seen from the figures that in order to achieve 99.5 mole%
of toluene in raffinate of Column 2, nearly 172 kg/hr of water was required in Column 1 and 213
kg/hr of water was required in Column 2.
18
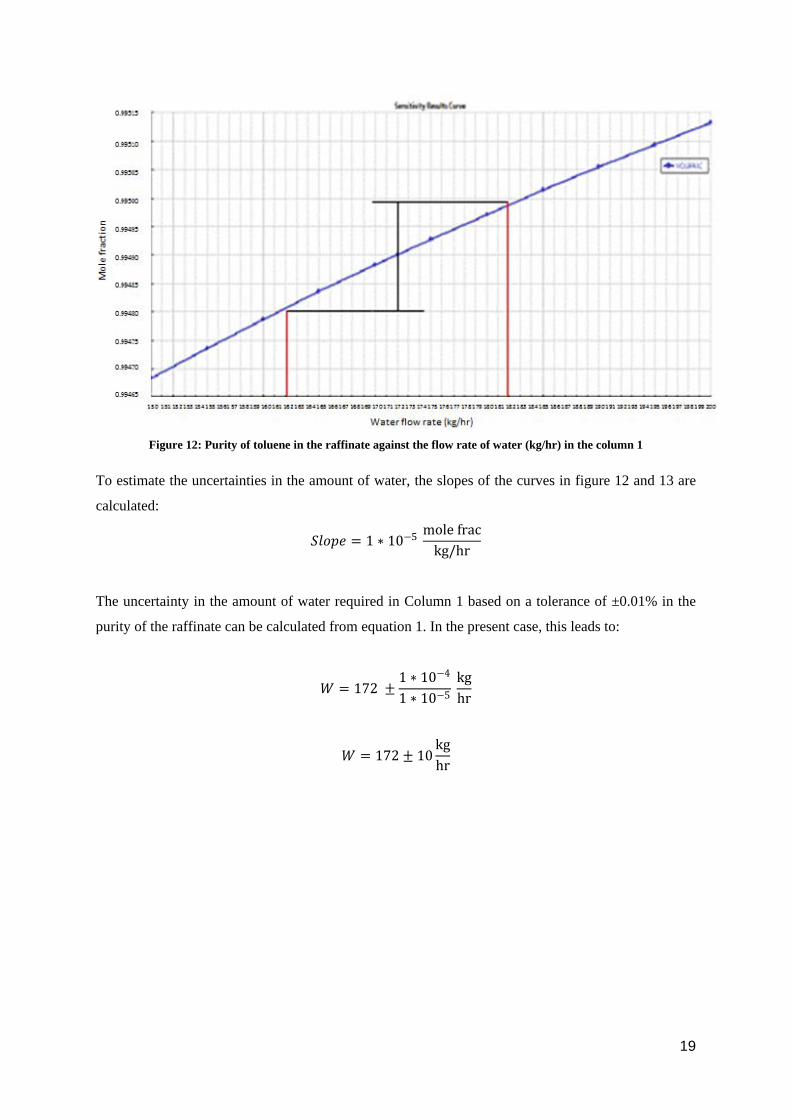
Figure 12: Purity of toluene in the raffinate against the flow rate of water (kg/hr) in the column 1
To estimate the uncertainties in the amount of water, the slopes of the curves in figure 12 and 13 are
calculated:
𝑆𝑆𝑆𝑆𝑆𝑆𝑆𝑆𝑆𝑆 = 1 ∗ 10−5 mole frackg/hr
The uncertainty in the amount of water required in Column 1 based on a tolerance of ±0.01% in the
purity of the raffinate can be calculated from equation 1. In the present case, this leads to:
𝑊𝑊 = 172 ±1 ∗ 10−4
1 ∗ 10−5 kghr
𝑊𝑊 = 172 ± 10kghr
19
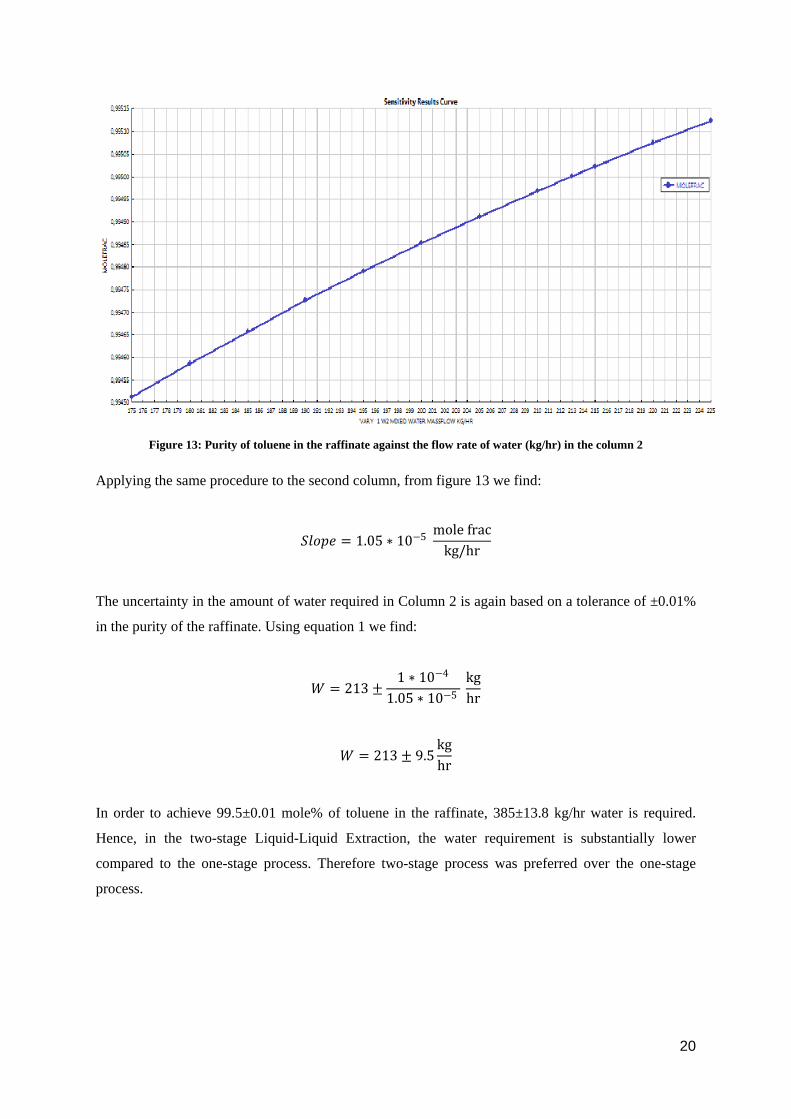
Figure 13: Purity of toluene in the raffinate against the flow rate of water (kg/hr) in the column 2
Applying the same procedure to the second column, from figure 13 we find:
𝑆𝑆𝑆𝑆𝑆𝑆𝑆𝑆𝑆𝑆 = 1.05 ∗ 10−5 mole frac
kg/hr
The uncertainty in the amount of water required in Column 2 is again based on a tolerance of ±0.01%
in the purity of the raffinate. Using equation 1 we find:
𝑊𝑊 = 213 ±1 ∗ 10−4
1.05 ∗ 10−5 kghr
𝑊𝑊 = 213 ± 9.5kghr
In order to achieve 99.5±0.01 mole% of toluene in the raffinate, 385±13.8 kg/hr water is required.
Hence, in the two-stage Liquid-Liquid Extraction, the water requirement is substantially lower
compared to the one-stage process. Therefore two-stage process was preferred over the one-stage
process.
20
5.3.3 Process description
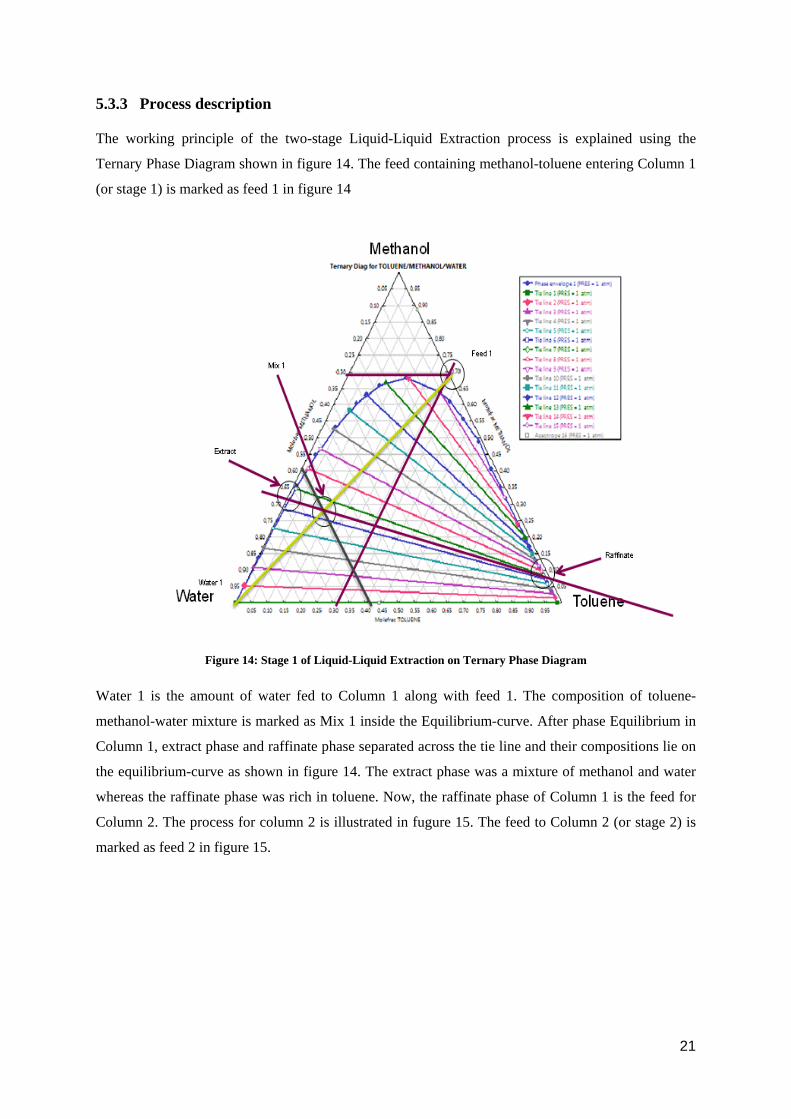
The working principle of the two-stage Liquid-Liquid Extraction process is explained using the
Ternary Phase Diagram shown in figure 14. The feed containing methanol-toluene entering Column 1
(or stage 1) is marked as feed 1 in figure 14
Figure 14: Stage 1 of Liquid-Liquid Extraction on Ternary Phase Diagram
Water 1 is the amount of water fed to Column 1 along with feed 1. The composition of toluene-
methanol-water mixture is marked as Mix 1 inside the Equilibrium-curve. After phase Equilibrium in
Column 1, extract phase and raffinate phase separated across the tie line and their compositions lie on
the equilibrium-curve as shown in figure 14. The extract phase was a mixture of methanol and water
whereas the raffinate phase was rich in toluene. Now, the raffinate phase of Column 1 is the feed for
Column 2. The process for column 2 is illustrated in fugure 15. The feed to Column 2 (or stage 2) is
marked as feed 2 in figure 15.
21
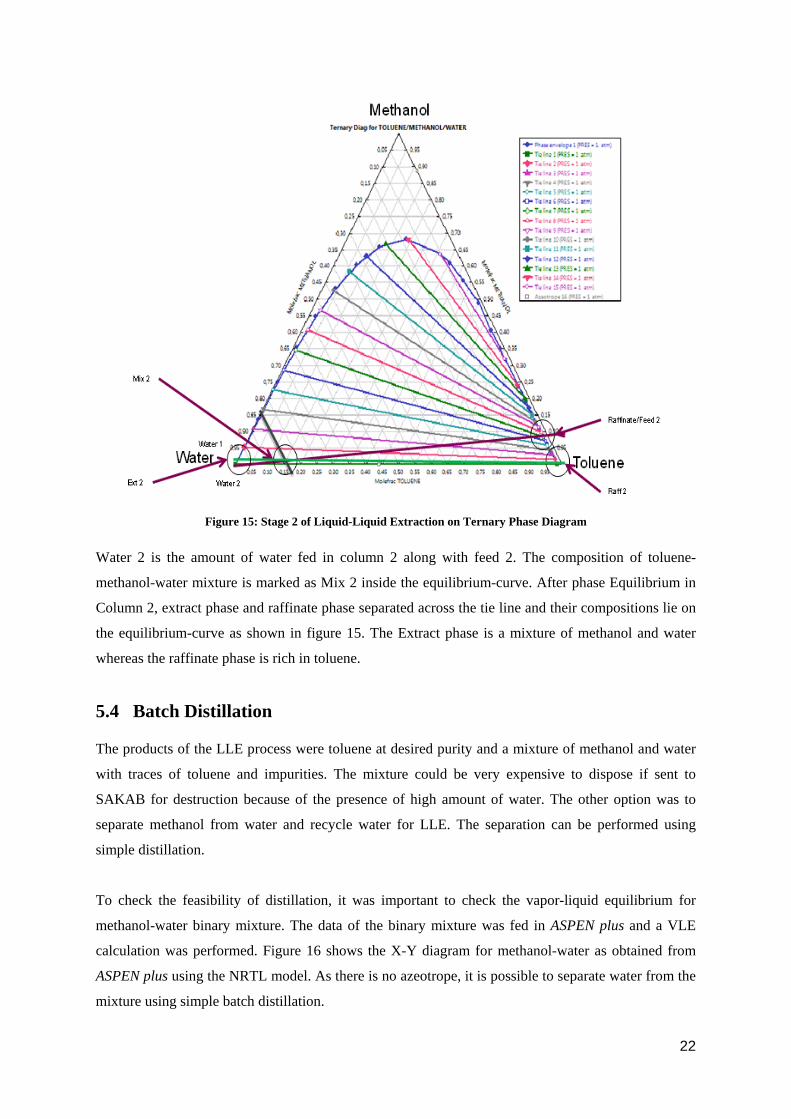
Figure 15: Stage 2 of Liquid-Liquid Extraction on Ternary Phase Diagram
Water 2 is the amount of water fed in column 2 along with feed 2. The composition of toluene-
methanol-water mixture is marked as Mix 2 inside the equilibrium-curve. After phase Equilibrium in
Column 2, extract phase and raffinate phase separated across the tie line and their compositions lie on
the equilibrium-curve as shown in figure 15. The Extract phase is a mixture of methanol and water
whereas the raffinate phase is rich in toluene.
5.4 Batch Distillation
The products of the LLE process were toluene at desired purity and a mixture of methanol and water
with traces of toluene and impurities. The mixture could be very expensive to dispose if sent to
SAKAB for destruction because of the presence of high amount of water. The other option was to
separate methanol from water and recycle water for LLE. The separation can be performed using
simple distillation.
To check the feasibility of distillation, it was important to check the vapor-liquid equilibrium for
methanol-water binary mixture. The data of the binary mixture was fed in ASPEN plus and a VLE
calculation was performed. Figure 16 shows the X-Y diagram for methanol-water as obtained from
ASPEN plus using the NRTL model. As there is no azeotrope, it is possible to separate water from the
mixture using simple batch distillation.
22
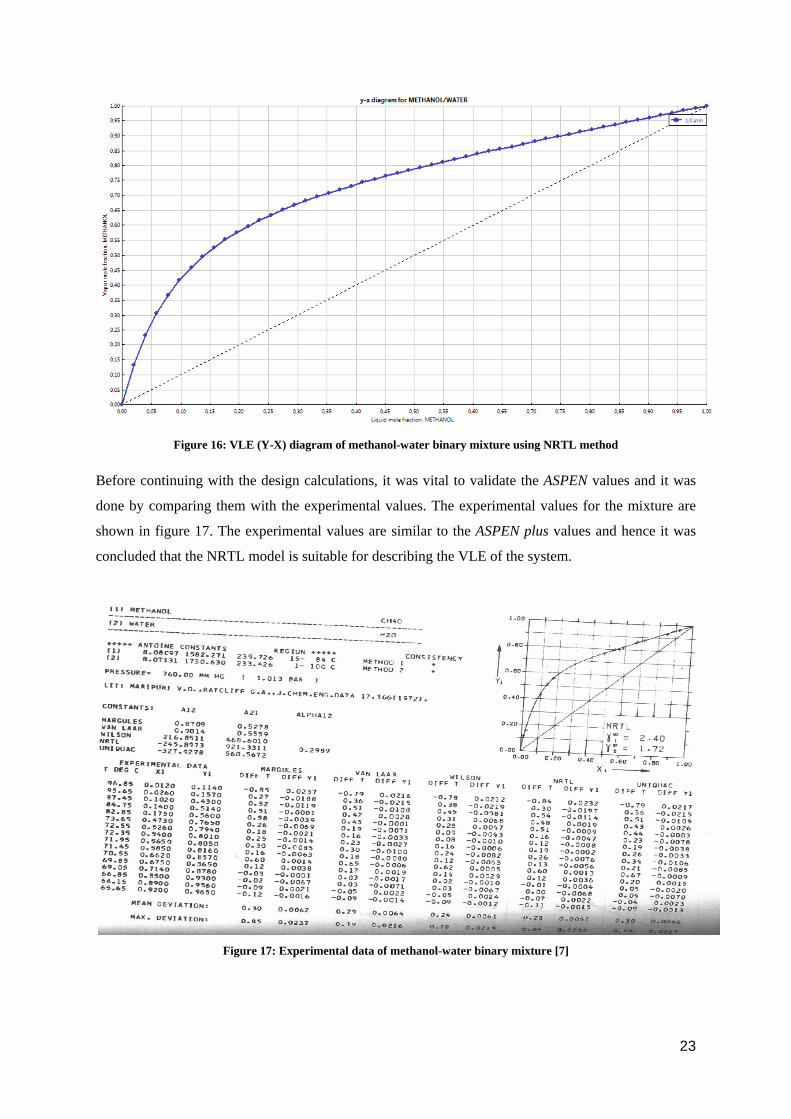
Figure 16: VLE (Y-X) diagram of methanol-water binary mixture using NRTL method
Before continuing with the design calculations, it was vital to validate the ASPEN values and it was
done by comparing them with the experimental values. The experimental values for the mixture are
shown in figure 17. The experimental values are similar to the ASPEN plus values and hence it was
concluded that the NRTL model is suitable for describing the VLE of the system.
Figure 17: Experimental data of methanol-water binary mixture [7]
23
5.5 Batch Distillation Design
The mixture of methanol and water from the Liquid-Liquid Extraction was fed into a batch distillation
column. To model a batch column, ASPEN batch modeler was used. The model was developed for
batch distillation using a mixture of methanol and water as the feed. The operating conditions are as
follows:
a) Constant Reflux Operation
b) Reflux ratio = 3
c) Medium temperature for heating the pot = 120ºC
d) Heat transfer coefficient of pot-heating medium = 0.5 kW/m2/K
e) Tray holdup = 2 kg/tray
f) Pressure drop = 0.1 atm
g) No. of trays = 30
h) Operating pressure = 1 atm
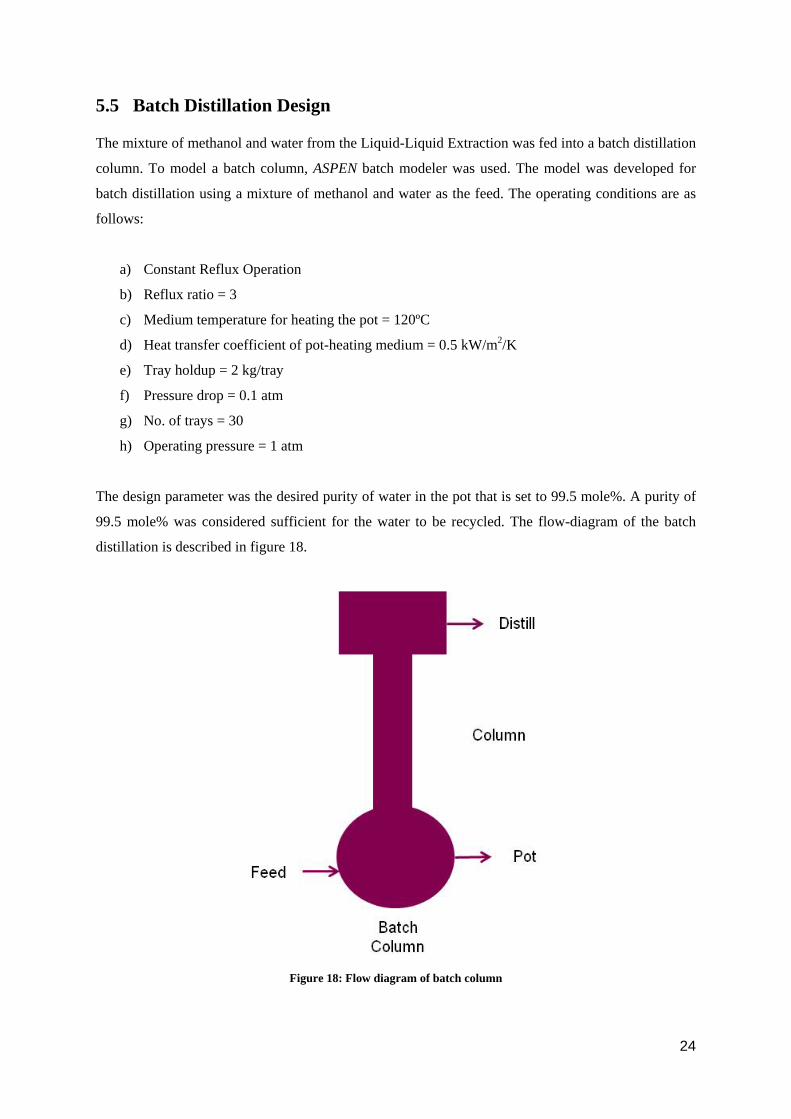
The design parameter was the desired purity of water in the pot that is set to 99.5 mole%. A purity of
99.5 mole% was considered sufficient for the water to be recycled. The flow-diagram of the batch
distillation is described in figure 18.
Figure 18: Flow diagram of batch column
24
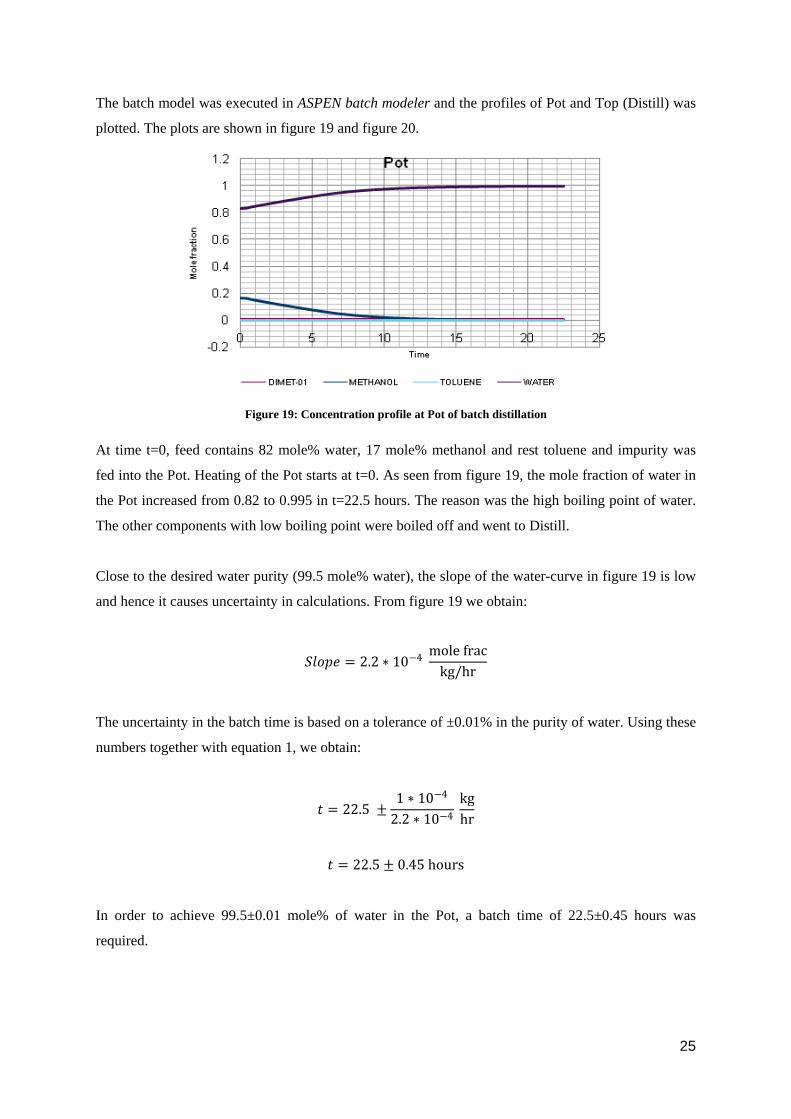
The batch model was executed in ASPEN batch modeler and the profiles of Pot and Top (Distill) was
plotted. The plots are shown in figure 19 and figure 20.
Figure 19: Concentration profile at Pot of batch distillation
At time t=0, feed contains 82 mole% water, 17 mole% methanol and rest toluene and impurity was
fed into the Pot. Heating of the Pot starts at t=0. As seen from figure 19, the mole fraction of water in
the Pot increased from 0.82 to 0.995 in t=22.5 hours. The reason was the high boiling point of water.
The other components with low boiling point were boiled off and went to Distill.
Close to the desired water purity (99.5 mole% water), the slope of the water-curve in figure 19 is low
and hence it causes uncertainty in calculations. From figure 19 we obtain:
𝑆𝑆𝑆𝑆𝑆𝑆𝑆𝑆𝑆𝑆 = 2.2 ∗ 10−4 mole frac
kg/hr
The uncertainty in the batch time is based on a tolerance of ±0.01% in the purity of water. Using these
numbers together with equation 1, we obtain:
𝑡𝑡 = 22.5 ±1 ∗ 10−4
2.2 ∗ 10−4 kghr
𝑡𝑡 = 22.5 ± 0.45 hours
In order to achieve 99.5±0.01 mole% of water in the Pot, a batch time of 22.5±0.45 hours was
required.
25
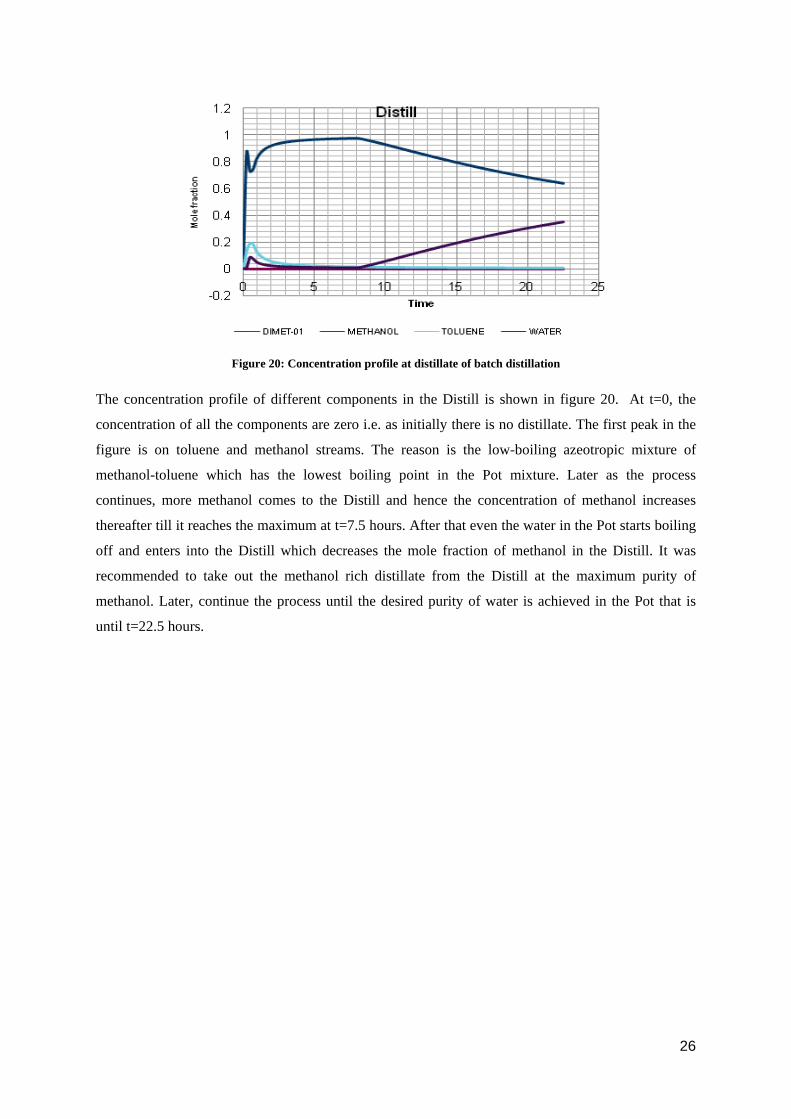
Figure 20: Concentration profile at distillate of batch distillation
The concentration profile of different components in the Distill is shown in figure 20. At t=0, the
concentration of all the components are zero i.e. as initially there is no distillate. The first peak in the
figure is on toluene and methanol streams. The reason is the low-boiling azeotropic mixture of
methanol-toluene which has the lowest boiling point in the Pot mixture. Later as the process
continues, more methanol comes to the Distill and hence the concentration of methanol increases
thereafter till it reaches the maximum at t=7.5 hours. After that even the water in the Pot starts boiling
off and enters into the Distill which decreases the mole fraction of methanol in the Distill. It was
recommended to take out the methanol rich distillate from the Distill at the maximum purity of
methanol. Later, continue the process until the desired purity of water is achieved in the Pot that is
until t=22.5 hours.
26
6 Stream 1: Results and Discussion
The results of the ASPEN simulations for Stream 1 are divided into two sections: Mass and Energy
Balance and Analysis. In the first section, the results obtained from the simulation are reported
whereas in the second section, the results from Stream 1 are discussed and analysed.
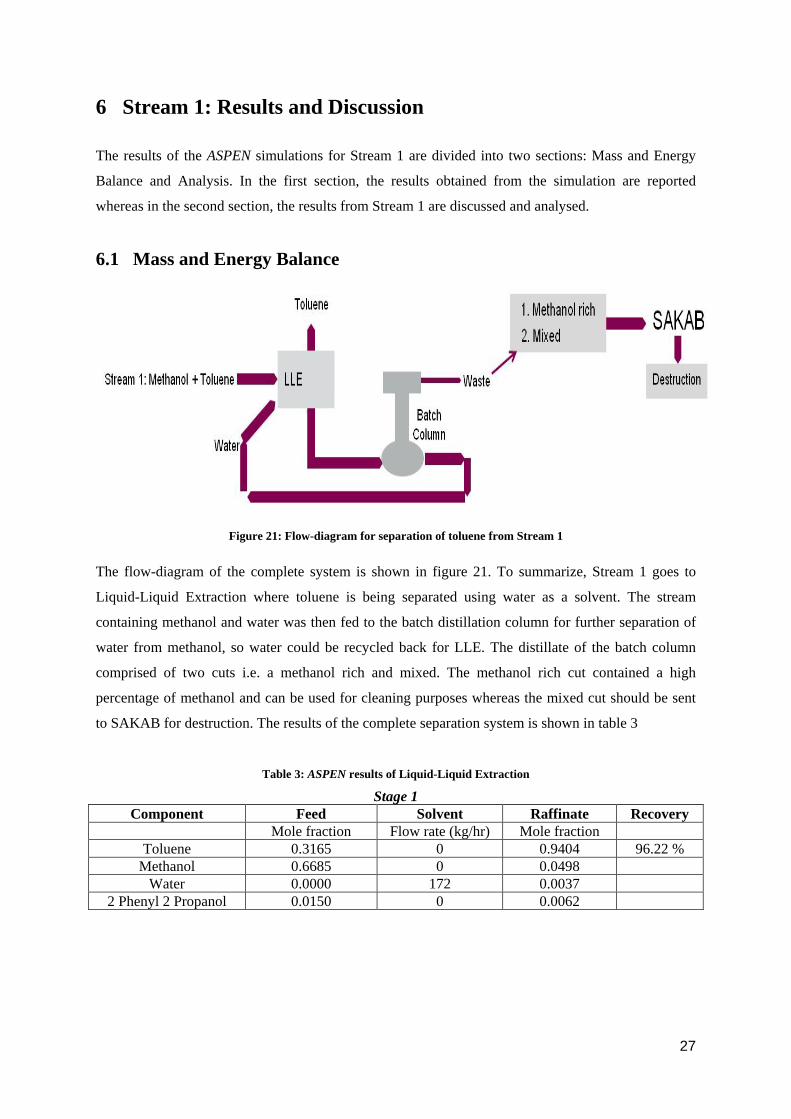
6.1 Mass and Energy Balance
Figure 21: Flow-diagram for separation of toluene from Stream 1
The flow-diagram of the complete system is shown in figure 21. To summarize, Stream 1 goes to
Liquid-Liquid Extraction where toluene is being separated using water as a solvent. The stream
containing methanol and water was then fed to the batch distillation column for further separation of
water from methanol, so water could be recycled back for LLE. The distillate of the batch column
comprised of two cuts i.e. a methanol rich and mixed. The methanol rich cut contained a high
percentage of methanol and can be used for cleaning purposes whereas the mixed cut should be sent
to SAKAB for destruction. The results of the complete separation system is shown in table 3
Table 3: ASPEN results of Liquid-Liquid Extraction
Stage 1 Component Feed Solvent Raffinate Recovery
Mole fraction Flow rate (kg/hr) Mole fraction Toluene 0.3165 0 0.9404 96.22 %
Methanol 0.6685 0 0.0498 Water 0.0000 172 0.0037
2 Phenyl 2 Propanol 0.0150 0 0.0062
27
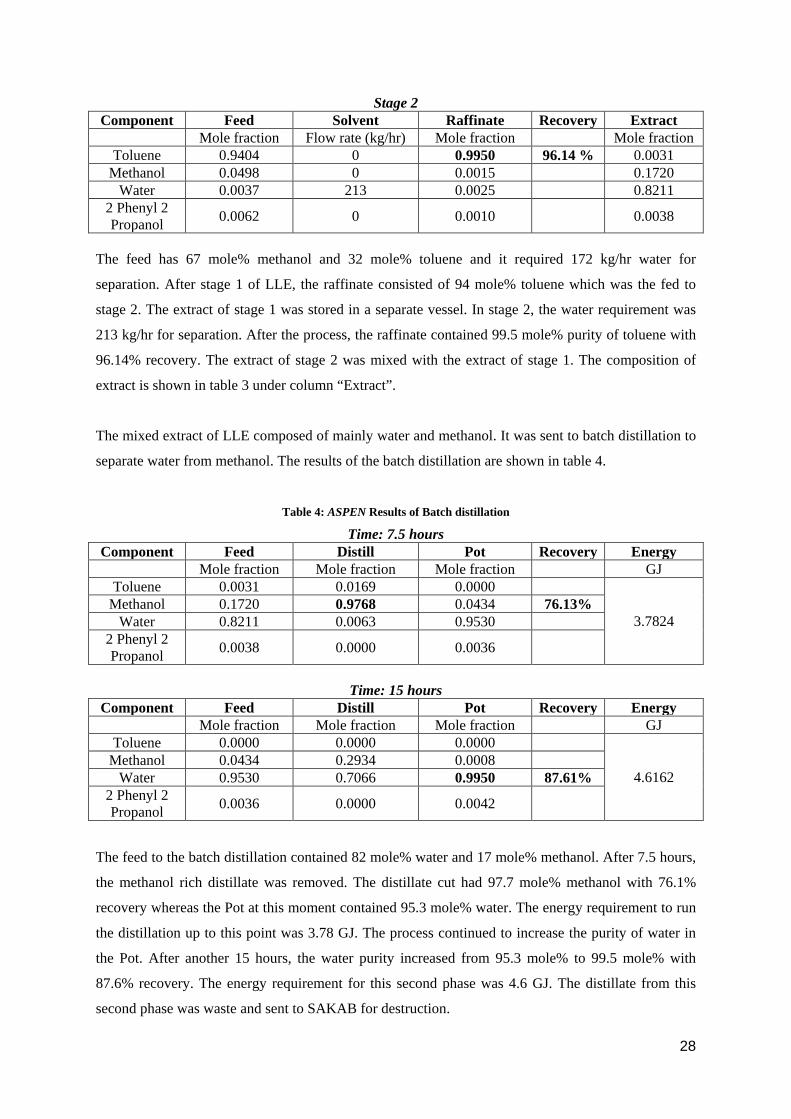
Stage 2 Component Feed Solvent Raffinate Recovery Extract
Mole fraction Flow rate (kg/hr) Mole fraction Mole fraction Toluene 0.9404 0 0.9950 96.14 % 0.0031
Methanol 0.0498 0 0.0015 0.1720 Water 0.0037 213 0.0025 0.8211
2 Phenyl 2 Propanol 0.0062 0 0.0010 0.0038
The feed has 67 mole% methanol and 32 mole% toluene and it required 172 kg/hr water for
separation. After stage 1 of LLE, the raffinate consisted of 94 mole% toluene which was the fed to
stage 2. The extract of stage 1 was stored in a separate vessel. In stage 2, the water requirement was
213 kg/hr for separation. After the process, the raffinate contained 99.5 mole% purity of toluene with
96.14% recovery. The extract of stage 2 was mixed with the extract of stage 1. The composition of
extract is shown in table 3 under column “Extract”.
The mixed extract of LLE composed of mainly water and methanol. It was sent to batch distillation to
separate water from methanol. The results of the batch distillation are shown in table 4.
Table 4: ASPEN Results of Batch distillation
Time: 7.5 hours Component Feed Distill Pot Recovery Energy
Mole fraction Mole fraction Mole fraction GJ Toluene 0.0031 0.0169 0.0000
3.7824 Methanol 0.1720 0.9768 0.0434 76.13%
Water 0.8211 0.0063 0.9530 2 Phenyl 2 Propanol 0.0038 0.0000 0.0036
Time: 15 hours
Component Feed Distill Pot Recovery Energy Mole fraction Mole fraction Mole fraction GJ
Toluene 0.0000 0.0000 0.0000
4.6162 Methanol 0.0434 0.2934 0.0008
Water 0.9530 0.7066 0.9950 87.61% 2 Phenyl 2 Propanol 0.0036 0.0000 0.0042
The feed to the batch distillation contained 82 mole% water and 17 mole% methanol. After 7.5 hours,
the methanol rich distillate was removed. The distillate cut had 97.7 mole% methanol with 76.1%
recovery whereas the Pot at this moment contained 95.3 mole% water. The energy requirement to run
the distillation up to this point was 3.78 GJ. The process continued to increase the purity of water in
the Pot. After another 15 hours, the water purity increased from 95.3 mole% to 99.5 mole% with
87.6% recovery. The energy requirement for this second phase was 4.6 GJ. The distillate from this
second phase was waste and sent to SAKAB for destruction.
28
6.2 Analysis
The analysis of the toluene-methanol separation system was done by considering the operation costs
of the process. The analysis also dealt with the feasibility of the system. The cost analysis was
performed based on four cases as shown in table 5.
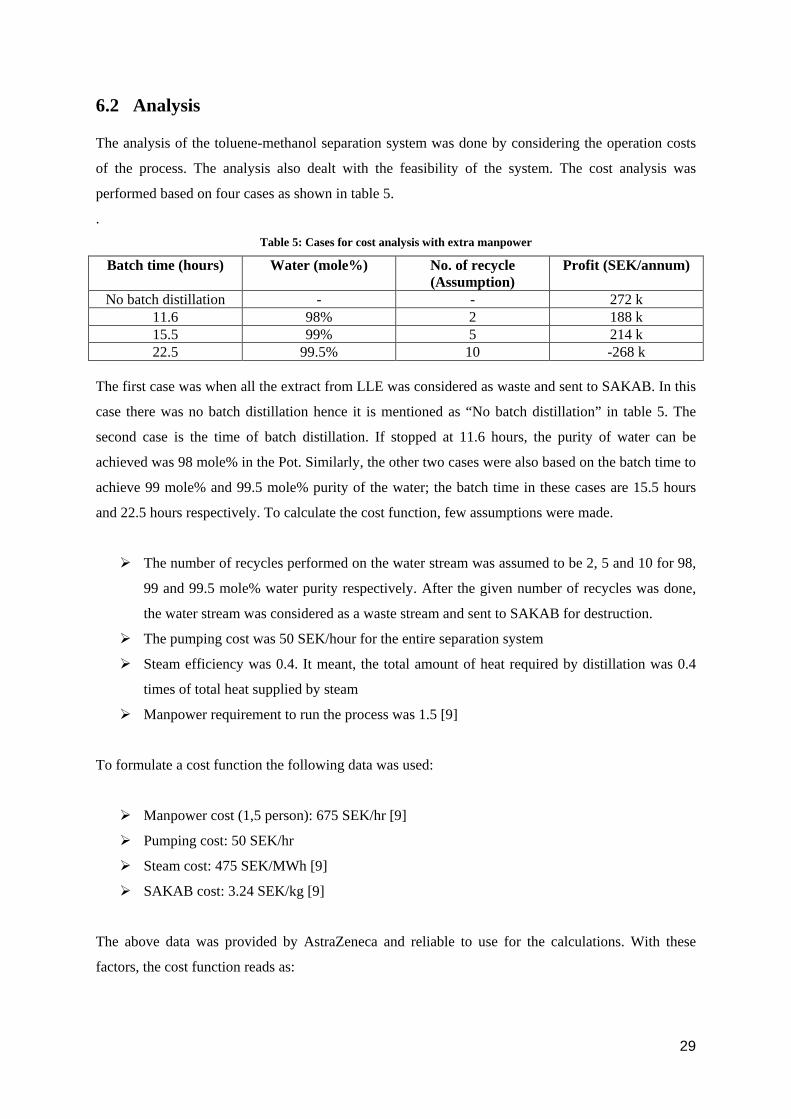
. Table 5: Cases for cost analysis with extra manpower
Batch time (hours) Water (mole%) No. of recycle (Assumption)
Profit (SEK/annum)
No batch distillation - - 272 k 11.6 98% 2 188 k 15.5 99% 5 214 k 22.5 99.5% 10 -268 k
The first case was when all the extract from LLE was considered as waste and sent to SAKAB. In this
case there was no batch distillation hence it is mentioned as “No batch distillation” in table 5. The
second case is the time of batch distillation. If stopped at 11.6 hours, the purity of water can be
achieved was 98 mole% in the Pot. Similarly, the other two cases were also based on the batch time to
achieve 99 mole% and 99.5 mole% purity of the water; the batch time in these cases are 15.5 hours
and 22.5 hours respectively. To calculate the cost function, few assumptions were made.
The number of recycles performed on the water stream was assumed to be 2, 5 and 10 for 98,
99 and 99.5 mole% water purity respectively. After the given number of recycles was done,
the water stream was considered as a waste stream and sent to SAKAB for destruction.
The pumping cost was 50 SEK/hour for the entire separation system
Steam efficiency was 0.4. It meant, the total amount of heat required by distillation was 0.4
times of total heat supplied by steam
Manpower requirement to run the process was 1.5 [9]
To formulate a cost function the following data was used:
Manpower cost (1,5 person): 675 SEK/hr [9]
Pumping cost: 50 SEK/hr
Steam cost: 475 SEK/MWh [9]
SAKAB cost: 3.24 SEK/kg [9]
The above data was provided by AstraZeneca and reliable to use for the calculations. With these
factors, the cost function reads as:
29
𝑇𝑇𝑆𝑆𝑡𝑡𝑇𝑇𝑆𝑆𝑆𝑆𝑇𝑇𝑆𝑆𝑇𝑇𝑇𝑇𝑡𝑡(𝑡𝑡) = 𝑅𝑅𝑆𝑆𝑇𝑇𝑆𝑆𝑅𝑅𝑆𝑆𝑇𝑇𝑅𝑅 −𝑀𝑀𝑇𝑇𝑇𝑇𝑆𝑆𝑆𝑆𝑀𝑀𝑆𝑆𝑇𝑇(𝑡𝑡) − 𝑃𝑃𝑃𝑃𝑃𝑃𝑆𝑆𝑇𝑇𝑇𝑇𝑃𝑃(𝑡𝑡) − 𝑆𝑆𝑡𝑡𝑆𝑆𝑇𝑇𝑃𝑃(𝑡𝑡) − 𝑆𝑆𝑆𝑆𝑆𝑆𝑆𝑆𝑆𝑆(𝑡𝑡) (2)
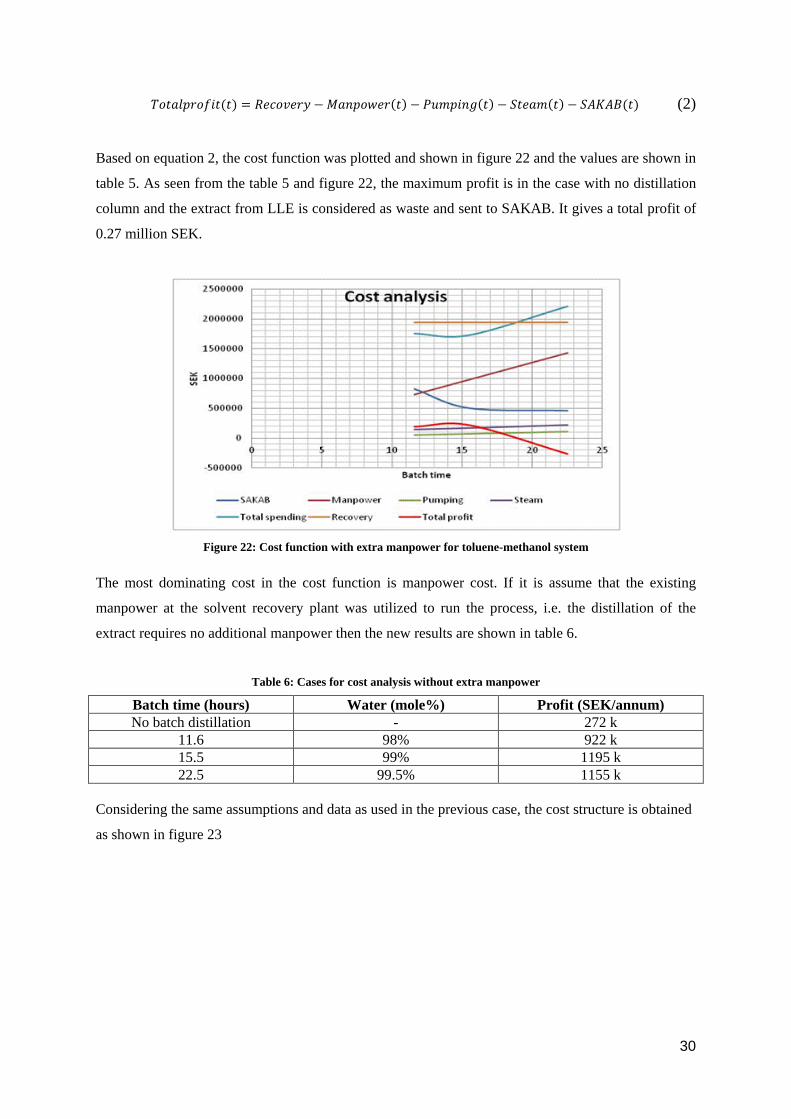
Based on equation 2, the cost function was plotted and shown in figure 22 and the values are shown in
table 5. As seen from the table 5 and figure 22, the maximum profit is in the case with no distillation
column and the extract from LLE is considered as waste and sent to SAKAB. It gives a total profit of
0.27 million SEK.
Figure 22: Cost function with extra manpower for toluene-methanol system
The most dominating cost in the cost function is manpower cost. If it is assume that the existing
manpower at the solvent recovery plant was utilized to run the process, i.e. the distillation of the
extract requires no additional manpower then the new results are shown in table 6.
Table 6: Cases for cost analysis without extra manpower
Batch time (hours) Water (mole%) Profit (SEK/annum) No batch distillation - 272 k
11.6 98% 922 k 15.5 99% 1195 k 22.5 99.5% 1155 k
Considering the same assumptions and data as used in the previous case, the cost structure is obtained
as shown in figure 23
30
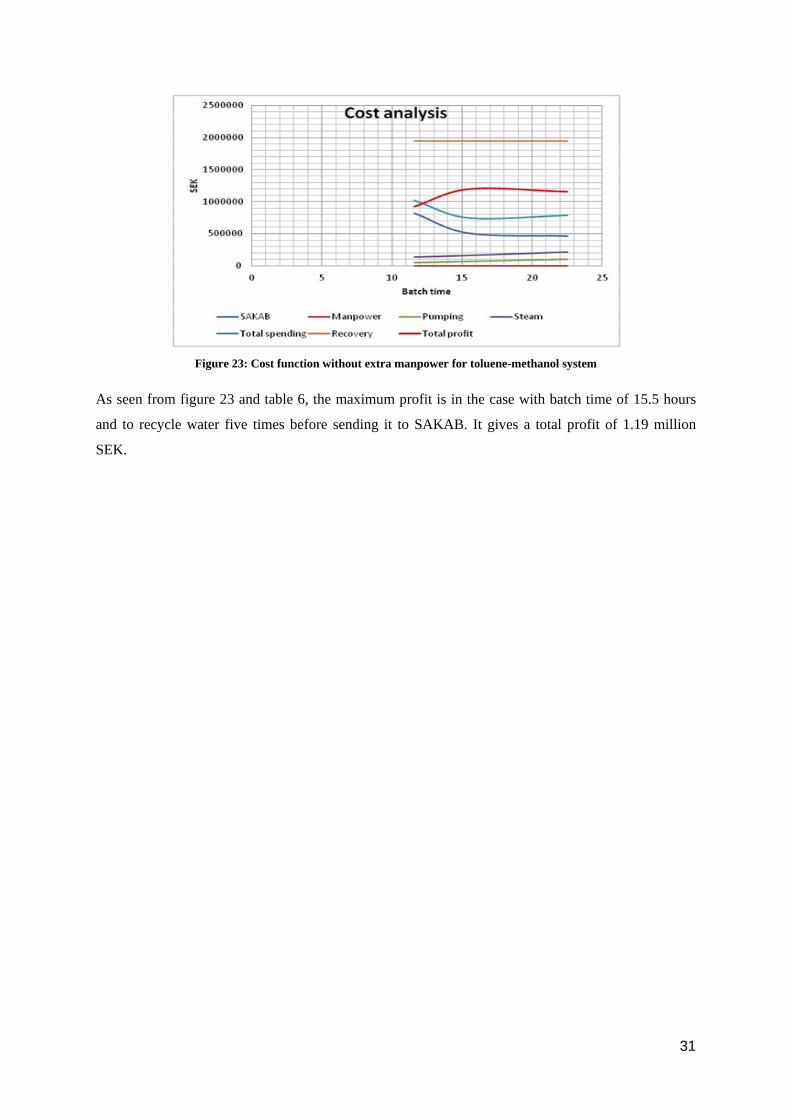
Figure 23: Cost function without extra manpower for toluene-methanol system
As seen from figure 23 and table 6, the maximum profit is in the case with batch time of 15.5 hours
and to recycle water five times before sending it to SAKAB. It gives a total profit of 1.19 million
SEK.
31
7 Stream 2: Isooctane and Ethyl acetate
The required purity of isooctane used at Snäckviken site is 99 mole% and ethyl acetate is 98 mole%.
Separation of key-solvent isooctane from Stream 2 can be performed by various techniques. The aim
was to find a technique that is simple, efficient and cost effective to recover Isooctane at the desired
purity. The stream 2 was having two liquids with different boiling points. The first possible separation
technique to use for this system was distillation. As discussed earlier, there are four batch distillation
columns available at the solvent recovery plant and therefore it can be an economical option.
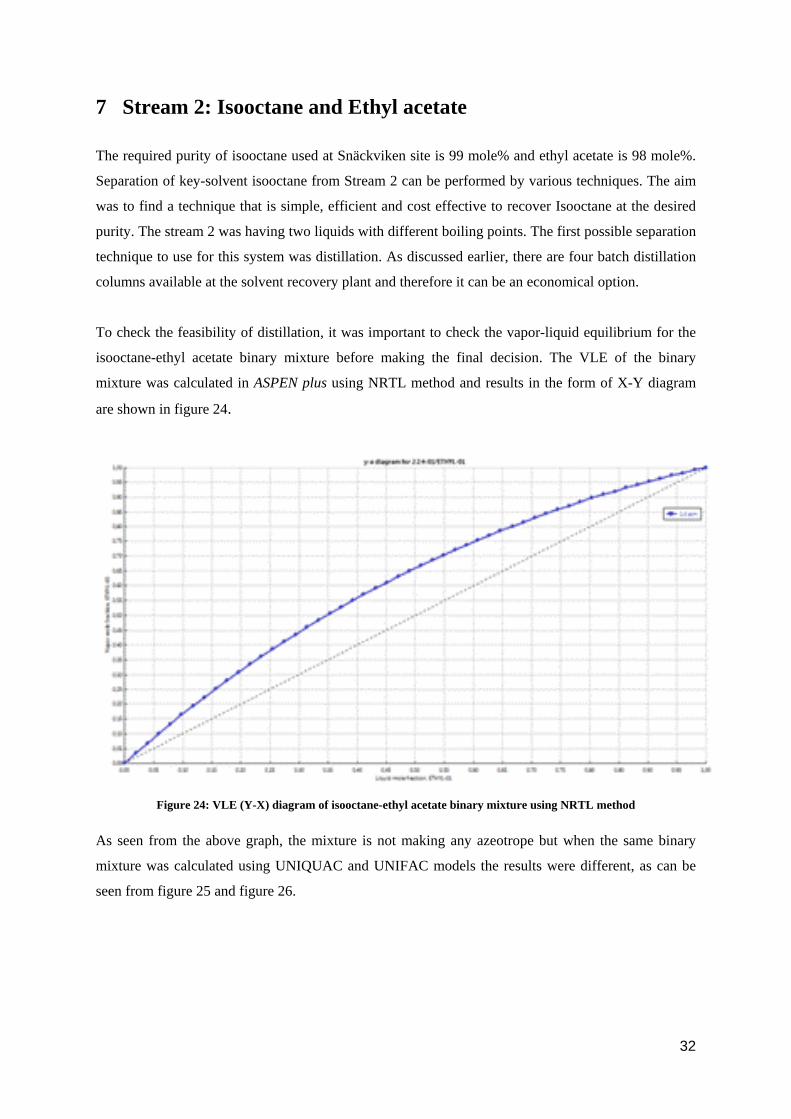
To check the feasibility of distillation, it was important to check the vapor-liquid equilibrium for the
isooctane-ethyl acetate binary mixture before making the final decision. The VLE of the binary
mixture was calculated in ASPEN plus using NRTL method and results in the form of X-Y diagram
are shown in figure 24.
Figure 24: VLE (Y-X) diagram of isooctane-ethyl acetate binary mixture using NRTL method
As seen from the above graph, the mixture is not making any azeotrope but when the same binary
mixture was calculated using UNIQUAC and UNIFAC models the results were different, as can be
seen from figure 25 and figure 26.
32
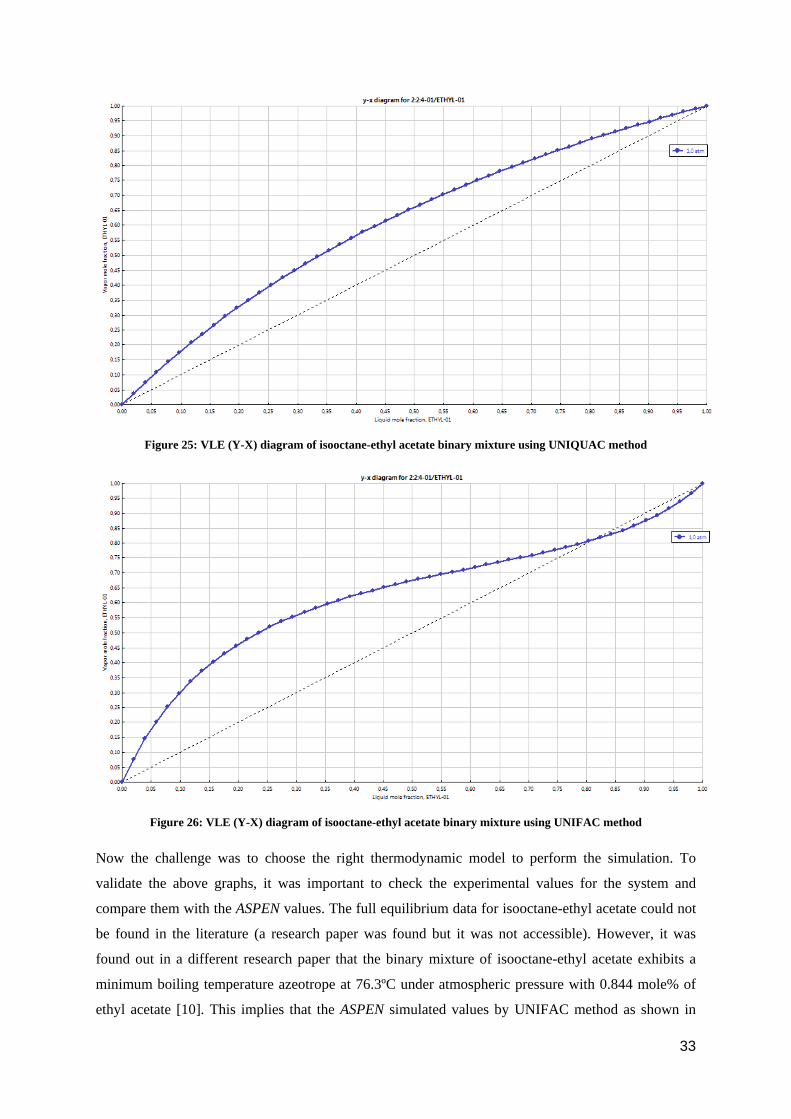
Figure 25: VLE (Y-X) diagram of isooctane-ethyl acetate binary mixture using UNIQUAC method
Figure 26: VLE (Y-X) diagram of isooctane-ethyl acetate binary mixture using UNIFAC method
Now the challenge was to choose the right thermodynamic model to perform the simulation. To
validate the above graphs, it was important to check the experimental values for the system and
compare them with the ASPEN values. The full equilibrium data for isooctane-ethyl acetate could not
be found in the literature (a research paper was found but it was not accessible). However, it was
found out in a different research paper that the binary mixture of isooctane-ethyl acetate exhibits a
minimum boiling temperature azeotrope at 76.3ºC under atmospheric pressure with 0.844 mole% of
ethyl acetate [10]. This implies that the ASPEN simulated values by UNIFAC method as shown in
33
figure 26 are similar to the experimental values. The binary mixture from UNIFAC method is also
making a minimum boiling azeotrope with 0.82 mole% of ethyl acetate. Two things were clear:
firstly, the UNIFAC model was the right model for the binary mixture of isooctane and ethyl acetate
and secondly, the binary mixture was making an azeotrope. In order to reach 99 mole% purity of
isooctane, one cannot use simple distillation.
To separate an azeotropic binary mixture, special types of distillation can be used such as Pressure
Swing Distillation or Extractive Distillation. Even though these techniques are complicated and
expensive to operate, they present an efficient way for separating isooctane from Stream 2.
7.1 Extractive Distillation
Extractive distillation for separating isooctane-ethyl acetate mixture was studied by Ooms et al [10].
Several entrainers were studied for this process. Two entrainers were selected that suited the best for
this process, namely methanol and acetonitrile. After using methanol as an entrainer, the purity of
isooctane was 67.5 mole% whereas after using acetonitrile as an entrainer, 90.2 mole% was achieved.
This implies that if Extractive Distillation was used, the maximum purity of isooctane that can be
achieved within a single distillation column was 90.2 mole% which was not desirable. [10]
7.2 Pressure Swing Distillation
Pressure Swing Distillation (PSD) was the next technique chosen for Stream 2. Before making the
final decision, it was important to see how the azeotropic point varies with pressure change. The
variation of the VLE with pressure is shown in figure 27.
34
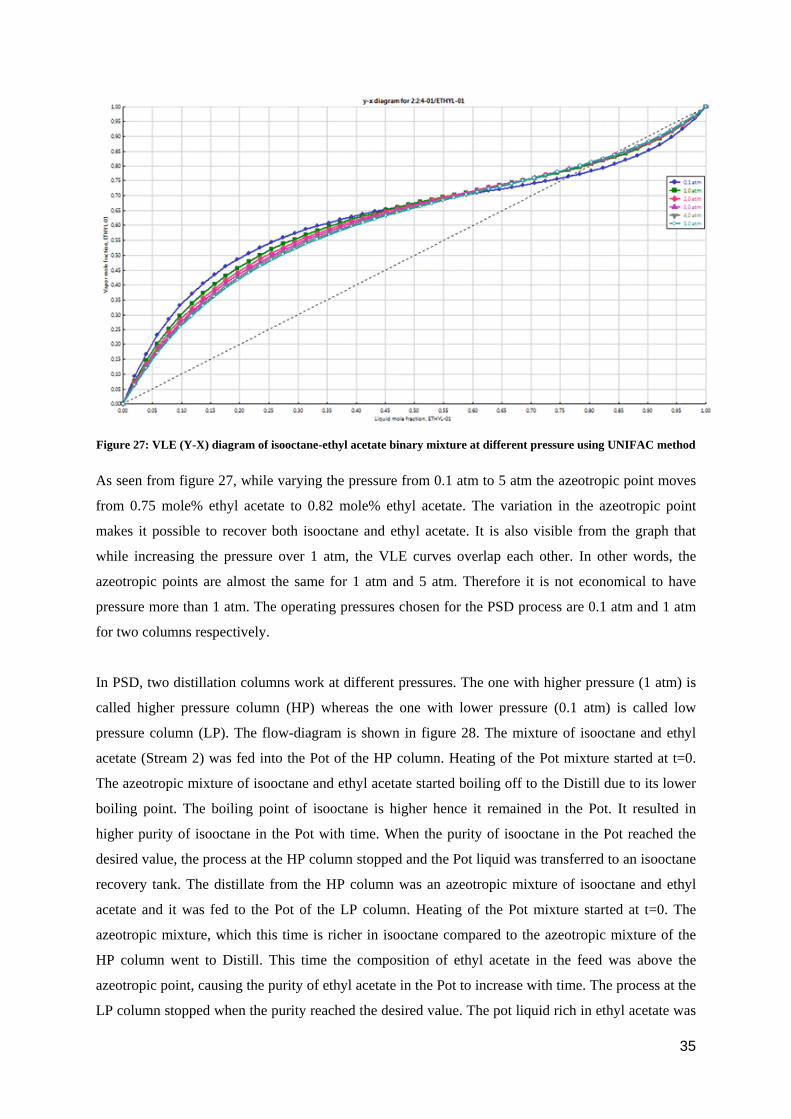
Figure 27: VLE (Y-X) diagram of isooctane-ethyl acetate binary mixture at different pressure using UNIFAC method
As seen from figure 27, while varying the pressure from 0.1 atm to 5 atm the azeotropic point moves
from 0.75 mole% ethyl acetate to 0.82 mole% ethyl acetate. The variation in the azeotropic point
makes it possible to recover both isooctane and ethyl acetate. It is also visible from the graph that
while increasing the pressure over 1 atm, the VLE curves overlap each other. In other words, the
azeotropic points are almost the same for 1 atm and 5 atm. Therefore it is not economical to have
pressure more than 1 atm. The operating pressures chosen for the PSD process are 0.1 atm and 1 atm
for two columns respectively.
In PSD, two distillation columns work at different pressures. The one with higher pressure (1 atm) is
called higher pressure column (HP) whereas the one with lower pressure (0.1 atm) is called low
pressure column (LP). The flow-diagram is shown in figure 28. The mixture of isooctane and ethyl
acetate (Stream 2) was fed into the Pot of the HP column. Heating of the Pot mixture started at t=0.
The azeotropic mixture of isooctane and ethyl acetate started boiling off to the Distill due to its lower
boiling point. The boiling point of isooctane is higher hence it remained in the Pot. It resulted in
higher purity of isooctane in the Pot with time. When the purity of isooctane in the Pot reached the
desired value, the process at the HP column stopped and the Pot liquid was transferred to an isooctane
recovery tank. The distillate from the HP column was an azeotropic mixture of isooctane and ethyl
acetate and it was fed to the Pot of the LP column. Heating of the Pot mixture started at t=0. The
azeotropic mixture, which this time is richer in isooctane compared to the azeotropic mixture of the
HP column went to Distill. This time the composition of ethyl acetate in the feed was above the
azeotropic point, causing the purity of ethyl acetate in the Pot to increase with time. The process at the
LP column stopped when the purity reached the desired value. The pot liquid rich in ethyl acetate was
35

transferred to the ethyl acetate recovery tank. The distillate from the LP column was then transferred
to the Pot of the HP column and the process continued until the maximum recovery of isooctane and
ethyl acetate was achieved.
Figure 28: Pressure Swing Distillation for isooctane and methanol mixture
7.3 Pressure Swing Distillation Design
The mixture of isooctane and ethyl acetate was fed into the batch distillation HP column. To model
the batch column, ASPEN batch modeler was used. The model was developed for batch distillation
using Stream 2 as feed. The operating conditions for the two columns are shown in table 7.
Table 7: Operating conditions of HP and LP batch columns
Operating conditions Column 1 (HP) Column 2 (LP) Type Constant reflux ratio Constant reflux ratio
Reflux ratio 4.3 3 Medium temperature 120°C 120°C
Heat transfer coefficient 0.5 kW/m2/K 0.5 kW/m2/K Tray holdup 1 kg/tray 1 kg/tray
Pressure drop 0.1 atm 0.1 atm No. of trays 30 30
Operating pressure 1 atm 0.1 atm
The design parameter for the HP column was the purity of isooctane at the Pot of HP column that is
set to 99% whereas the design parameter for the LP column was the purity of ethyl acetate at the Pot
of the LP column that is set to 98%.
36
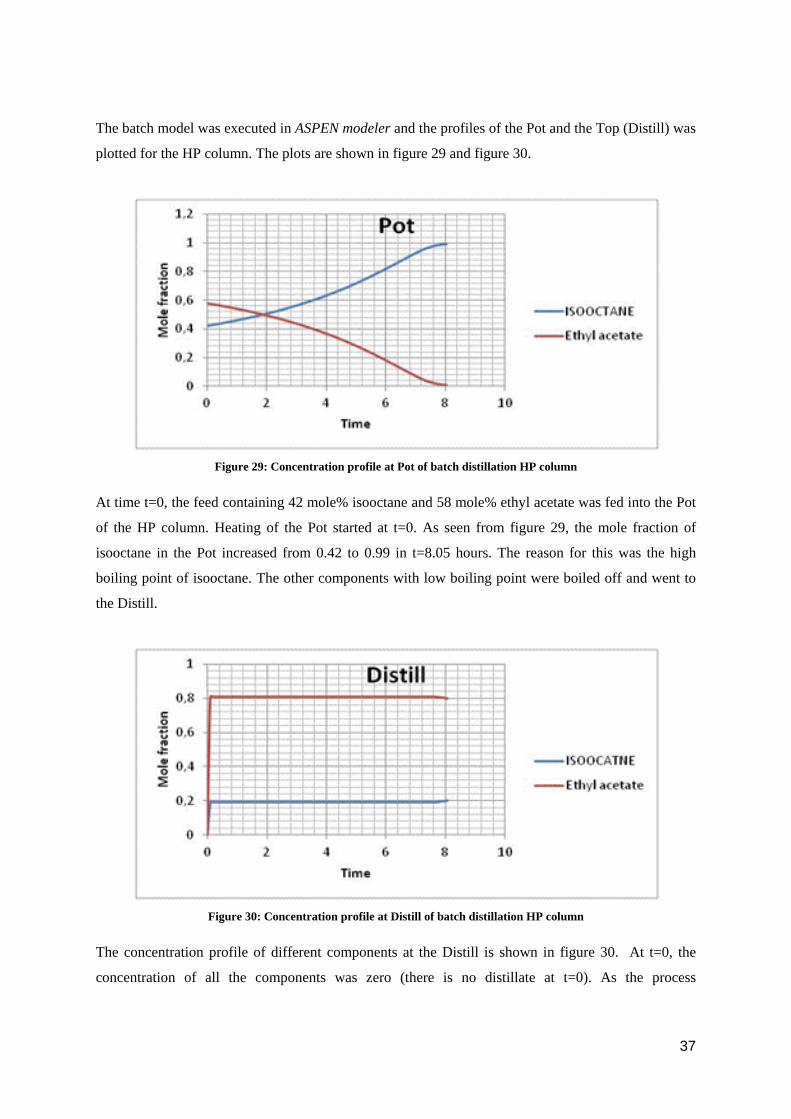
The batch model was executed in ASPEN modeler and the profiles of the Pot and the Top (Distill) was
plotted for the HP column. The plots are shown in figure 29 and figure 30.
Figure 29: Concentration profile at Pot of batch distillation HP column
At time t=0, the feed containing 42 mole% isooctane and 58 mole% ethyl acetate was fed into the Pot
of the HP column. Heating of the Pot started at t=0. As seen from figure 29, the mole fraction of
isooctane in the Pot increased from 0.42 to 0.99 in t=8.05 hours. The reason for this was the high
boiling point of isooctane. The other components with low boiling point were boiled off and went to
the Distill.
Figure 30: Concentration profile at Distill of batch distillation HP column
The concentration profile of different components at the Distill is shown in figure 30. At t=0, the
concentration of all the components was zero (there is no distillate at t=0). As the process
37
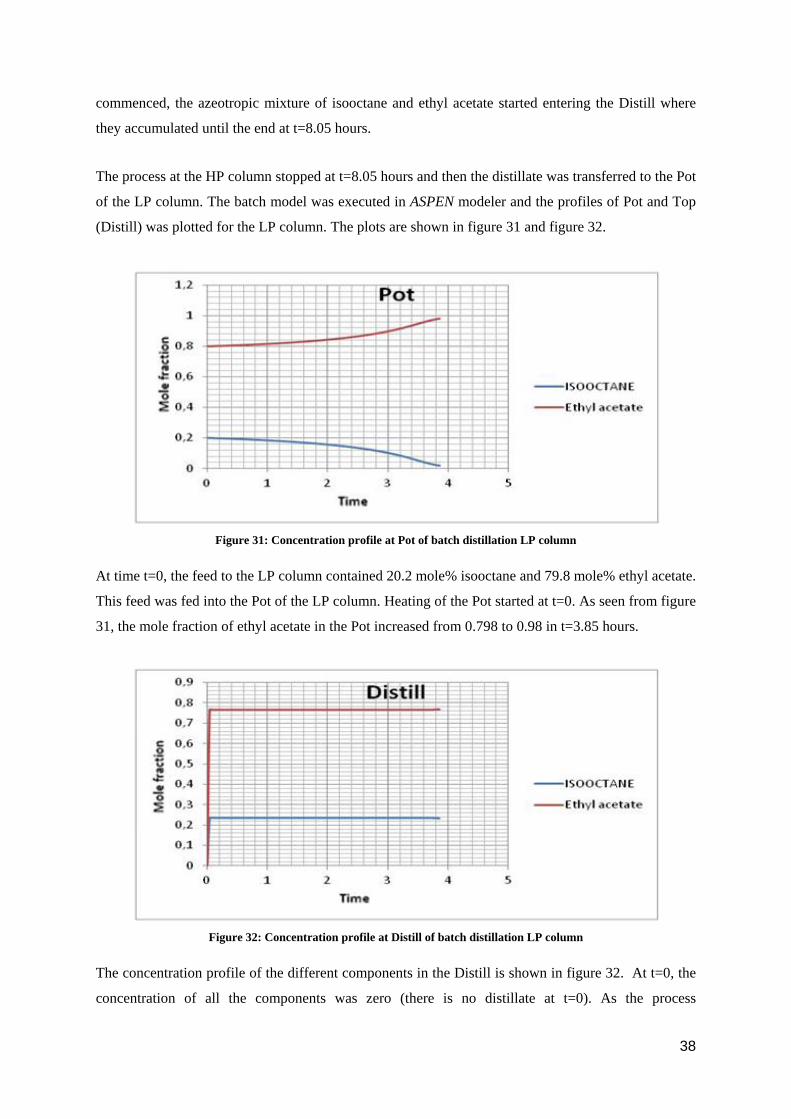
commenced, the azeotropic mixture of isooctane and ethyl acetate started entering the Distill where
they accumulated until the end at t=8.05 hours.
The process at the HP column stopped at t=8.05 hours and then the distillate was transferred to the Pot
of the LP column. The batch model was executed in ASPEN modeler and the profiles of Pot and Top
(Distill) was plotted for the LP column. The plots are shown in figure 31 and figure 32.
Figure 31: Concentration profile at Pot of batch distillation LP column
At time t=0, the feed to the LP column contained 20.2 mole% isooctane and 79.8 mole% ethyl acetate.
This feed was fed into the Pot of the LP column. Heating of the Pot started at t=0. As seen from figure
31, the mole fraction of ethyl acetate in the Pot increased from 0.798 to 0.98 in t=3.85 hours.
Figure 32: Concentration profile at Distill of batch distillation LP column
The concentration profile of the different components in the Distill is shown in figure 32. At t=0, the
concentration of all the components was zero (there is no distillate at t=0). As the process
38
commenced, the azeotropic mixture of isooctane and ethyl acetate started entering the Distill where
they accumulated until the end at t=3.85 hours.
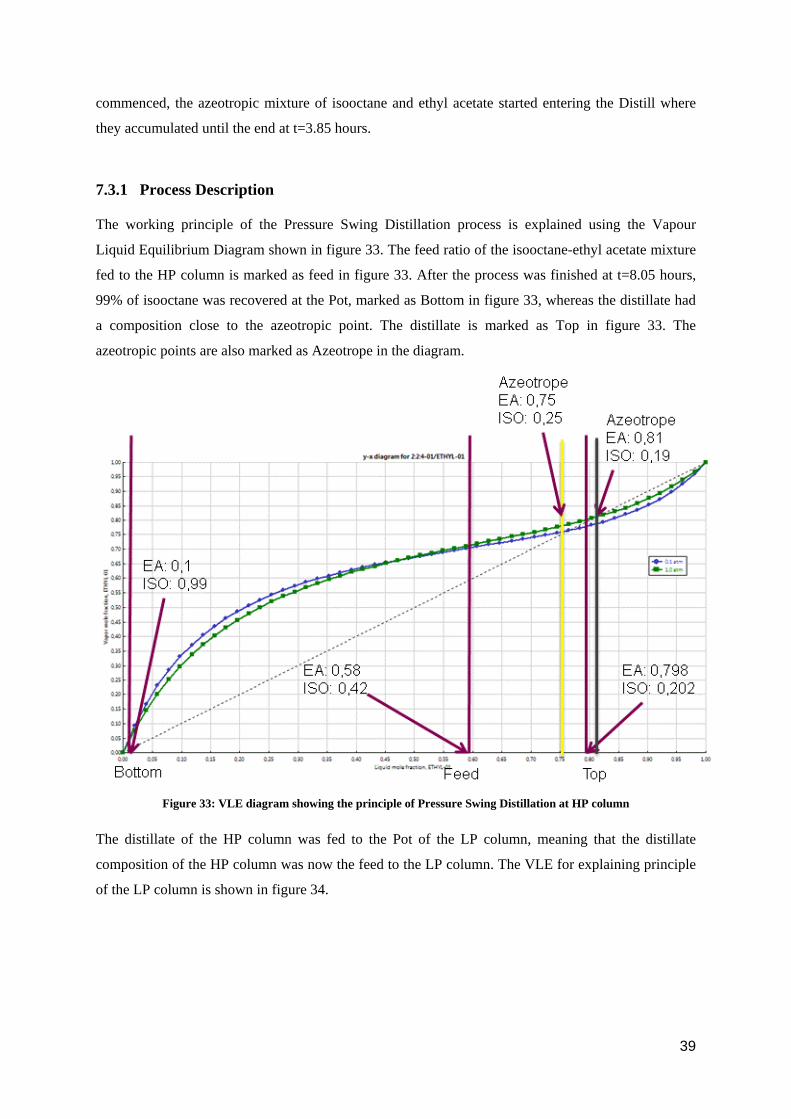
7.3.1 Process Description The working principle of the Pressure Swing Distillation process is explained using the Vapour
Liquid Equilibrium Diagram shown in figure 33. The feed ratio of the isooctane-ethyl acetate mixture
fed to the HP column is marked as feed in figure 33. After the process was finished at t=8.05 hours,
99% of isooctane was recovered at the Pot, marked as Bottom in figure 33, whereas the distillate had
a composition close to the azeotropic point. The distillate is marked as Top in figure 33. The
azeotropic points are also marked as Azeotrope in the diagram.
Figure 33: VLE diagram showing the principle of Pressure Swing Distillation at HP column
The distillate of the HP column was fed to the Pot of the LP column, meaning that the distillate
composition of the HP column was now the feed to the LP column. The VLE for explaining principle
of the LP column is shown in figure 34.
39
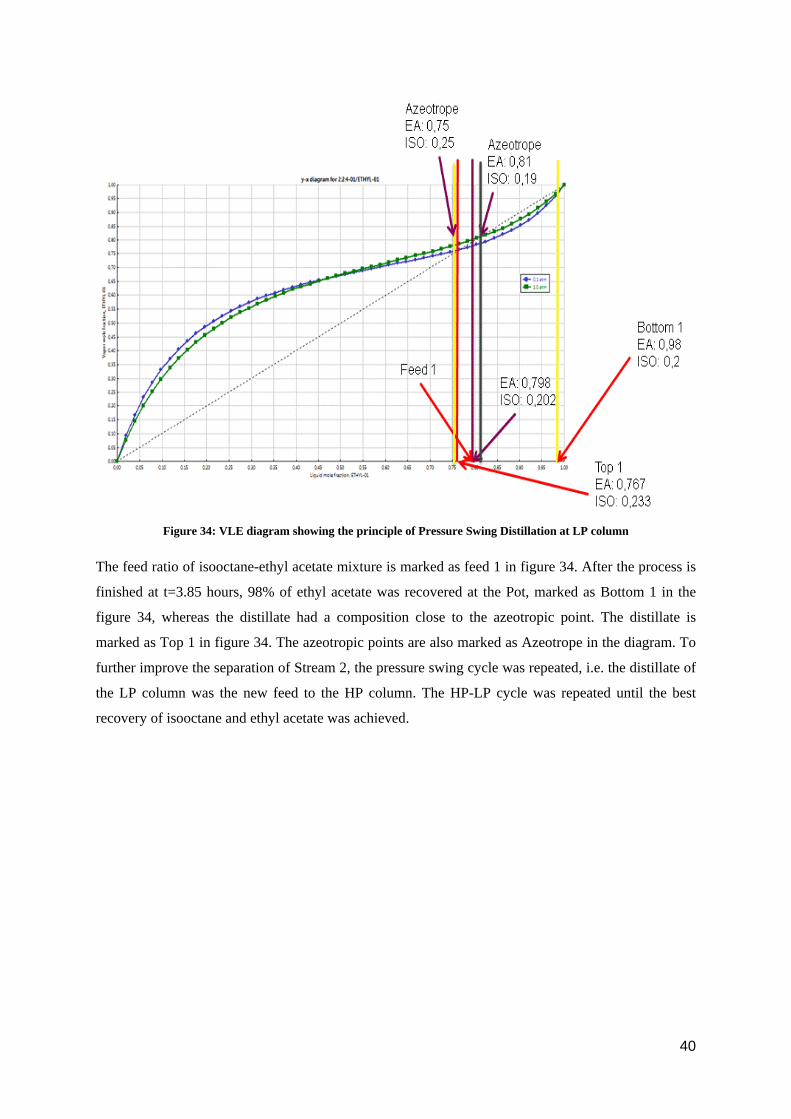
Figure 34: VLE diagram showing the principle of Pressure Swing Distillation at LP column
The feed ratio of isooctane-ethyl acetate mixture is marked as feed 1 in figure 34. After the process is
finished at t=3.85 hours, 98% of ethyl acetate was recovered at the Pot, marked as Bottom 1 in the
figure 34, whereas the distillate had a composition close to the azeotropic point. The distillate is
marked as Top 1 in figure 34. The azeotropic points are also marked as Azeotrope in the diagram. To
further improve the separation of Stream 2, the pressure swing cycle was repeated, i.e. the distillate of
the LP column was the new feed to the HP column. The HP-LP cycle was repeated until the best
recovery of isooctane and ethyl acetate was achieved.
40
8 Stream 2: Results and Discussion
The results of the ASPEN simulations for Stream 2 are divided into two sections: Mass and Energy
Balance and Analysis. In the first section, the results obtained from the simulation are reported
whereas in second section, the results from Stream 2 are discussed and analysed.
8.1 Mass and Energy Balance
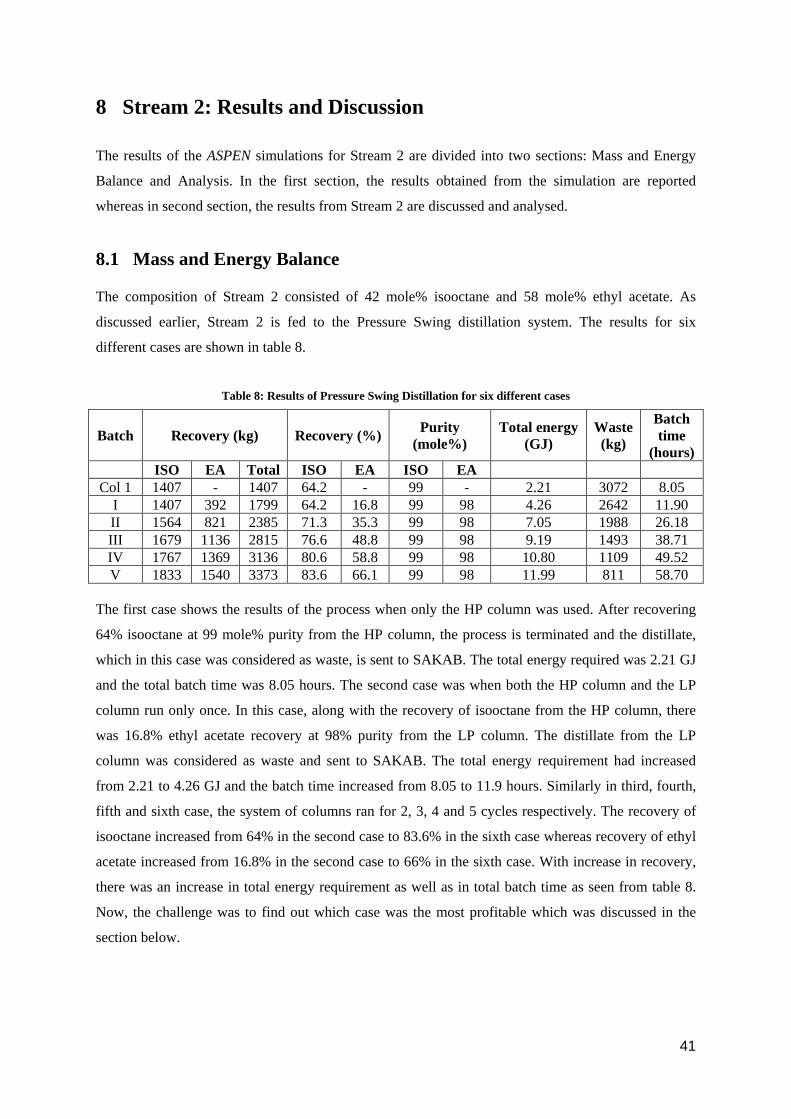
The composition of Stream 2 consisted of 42 mole% isooctane and 58 mole% ethyl acetate. As
discussed earlier, Stream 2 is fed to the Pressure Swing distillation system. The results for six
different cases are shown in table 8.
Table 8: Results of Pressure Swing Distillation for six different cases
Batch Recovery (kg) Recovery (%) Purity (mole%)
Total energy (GJ)
Waste (kg)
Batch time
(hours) ISO EA Total ISO EA ISO EA
Col 1 1407 - 1407 64.2 - 99 - 2.21 3072 8.05 I 1407 392 1799 64.2 16.8 99 98 4.26 2642 11.90 II 1564 821 2385 71.3 35.3 99 98 7.05 1988 26.18 III 1679 1136 2815 76.6 48.8 99 98 9.19 1493 38.71 IV 1767 1369 3136 80.6 58.8 99 98 10.80 1109 49.52 V 1833 1540 3373 83.6 66.1 99 98 11.99 811 58.70
The first case shows the results of the process when only the HP column was used. After recovering
64% isooctane at 99 mole% purity from the HP column, the process is terminated and the distillate,
which in this case was considered as waste, is sent to SAKAB. The total energy required was 2.21 GJ
and the total batch time was 8.05 hours. The second case was when both the HP column and the LP
column run only once. In this case, along with the recovery of isooctane from the HP column, there
was 16.8% ethyl acetate recovery at 98% purity from the LP column. The distillate from the LP
column was considered as waste and sent to SAKAB. The total energy requirement had increased
from 2.21 to 4.26 GJ and the batch time increased from 8.05 to 11.9 hours. Similarly in third, fourth,
fifth and sixth case, the system of columns ran for 2, 3, 4 and 5 cycles respectively. The recovery of
isooctane increased from 64% in the second case to 83.6% in the sixth case whereas recovery of ethyl
acetate increased from 16.8% in the second case to 66% in the sixth case. With increase in recovery,
there was an increase in total energy requirement as well as in total batch time as seen from table 8.
Now, the challenge was to find out which case was the most profitable which was discussed in the
section below.
41
8.2 Analysis
The analysis of the isooctane-ethyl acetate separation system was done by considering the operation
costs. The analysis also dealt with the feasibility of the system. The cost analysis was performed
based on six cases as shown in table 9.
Table 9: Cases for cost analysis with extra manpower
No. of batches Recovery (SEK) Operational cost (SEK) Profit (SEK/annum) Column 1 1378 k 278 k 1100 k
1 1454 k 327 k 1127 k 2 1691 k 521 k 1170 k 3 1865 k 693 k 1171 k 4 1996 k 842 k 1154 k 5 2094 k 969 k 1125 k
The cases shown in table 9 are identical to the cases discussed in the previous section. To calculate the
cost function, few assumptions were made.
After end of each case, the distillate left was considered as a waste stream and sent to
SAKAB for destruction.
The pumping cost was 50 SEK/hour for the entire separation system
Steam efficiency was 0.4. It means, the total amount of heat required by distillation was 0.4
times of total heat supplied by steam
Manpower requirement to run the process was 1.5 [9]
To calculate cost function the following data was used:
Manpower cost (1,5 person): 675 SEK/hr
Pumping cost: 50 SEK/hr
Steam cost: 475 SEK/MWh
SAKAB cost: 2.39 SEK/kg [9]
The above data was provided by AstraZeneca and reliable to use for the calculations.
With the assumptions and data at hand, the cost function is formulated as follows:
𝑇𝑇𝑆𝑆𝑡𝑡𝑇𝑇𝑆𝑆𝑆𝑆𝑇𝑇𝑆𝑆𝑇𝑇𝑇𝑇𝑡𝑡(𝑡𝑡) = 𝑅𝑅𝑆𝑆𝑇𝑇𝑆𝑆𝑅𝑅𝑆𝑆𝑇𝑇𝑅𝑅 −𝑀𝑀𝑇𝑇𝑇𝑇𝑆𝑆𝑆𝑆𝑀𝑀𝑆𝑆𝑇𝑇(𝑡𝑡) − 𝑃𝑃𝑃𝑃𝑃𝑃𝑆𝑆𝑇𝑇𝑇𝑇𝑃𝑃(𝑡𝑡) − 𝑆𝑆𝑡𝑡𝑆𝑆𝑇𝑇𝑃𝑃(𝑡𝑡) − 𝑆𝑆𝑆𝑆𝑆𝑆𝑆𝑆𝑆𝑆(𝑡𝑡) (3)
42
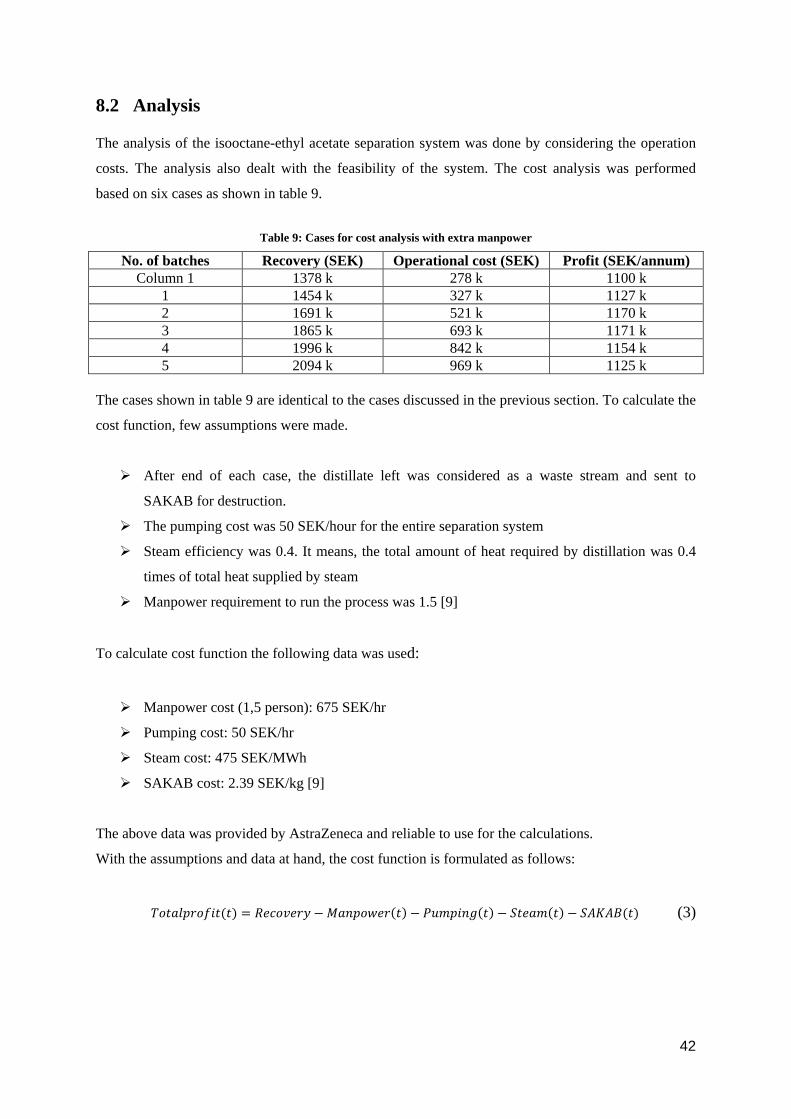
Except the recovery, all terms on the right hand side of equation 3 depend on the duration of each
particular case, i.e. the more cycles are run, the longer the time and hence, the more manpower,
pumping, steam and SAKAB cost is needed.
Based on Equation 3, the costs for the six cases were evaluated. Figure 35 shows a graph of the
different costs for the six cases; the values are shown in table 9. As seen from the table 9 and figure
35, the maximum profit was in the fourth case which was marked as “3”. It gives a total profit of 1.17
million SEK
Figure 35: Cost function with extra manpower for isooctane-ethyl acetate system
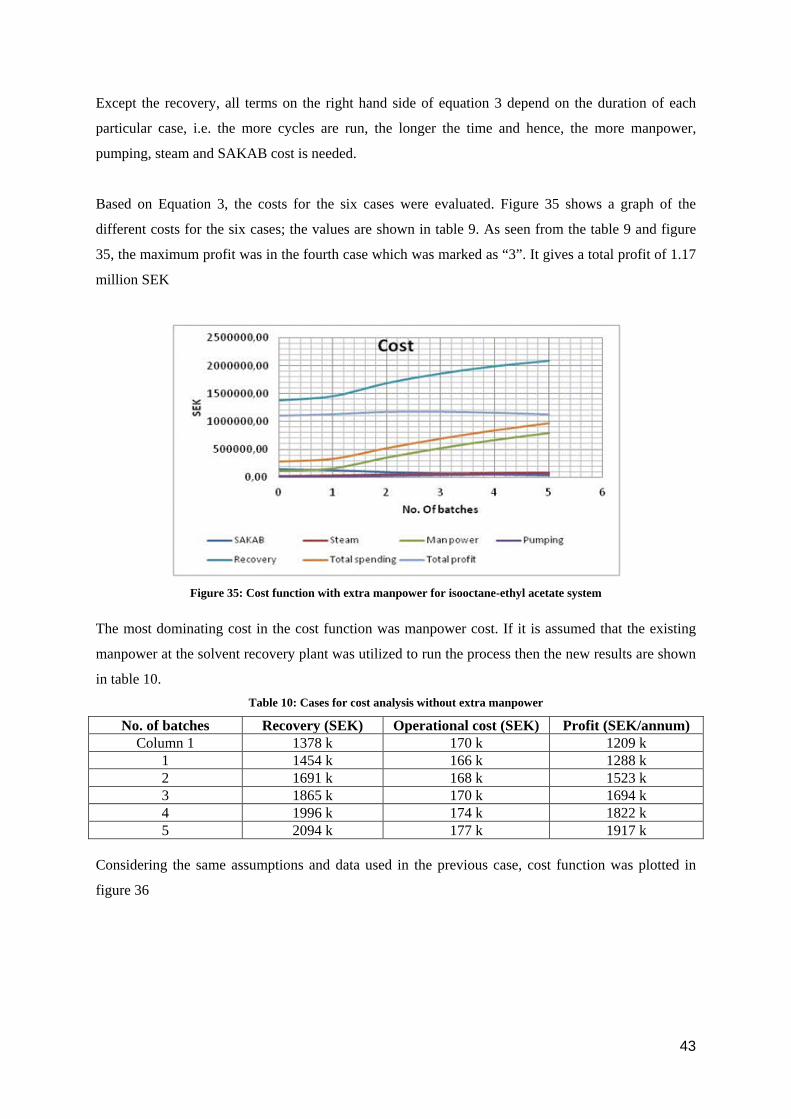
The most dominating cost in the cost function was manpower cost. If it is assumed that the existing
manpower at the solvent recovery plant was utilized to run the process then the new results are shown
in table 10. Table 10: Cases for cost analysis without extra manpower
No. of batches Recovery (SEK) Operational cost (SEK) Profit (SEK/annum) Column 1 1378 k 170 k 1209 k
1 1454 k 166 k 1288 k 2 1691 k 168 k 1523 k 3 1865 k 170 k 1694 k 4 1996 k 174 k 1822 k 5 2094 k 177 k 1917 k
Considering the same assumptions and data used in the previous case, cost function was plotted in
figure 36
43
Figure 36: Cost function without extra manpower for isooctane-ethyl acetate system
As seen from the figure 36 and table 10, the maximum profit was in the sixth case which was marked
as “5” in table 10. It gives a total profit of 1.9 million SEK.
44
9 Alternate Separation Method
The major problem in the solvent recovery of toluene and methanol using Liquid-Liquid Extraction
followed by batch distillation was the large amount of water in the waste stream. It was very
expensive to incinerate the waste or send it to SAKAB due to the high water content [9]. To overcome
this problem, there are other novel techniques for azeotropic separation that can be put into good use
here. Integration of pervaporation with batch distillation was investigated and the details of the
research are explained below.
9.1 Pervaporation
Pervaporation (PV) is defined as a process to separate a liquid mixture through a non-porous
permselective membrane by partially vaporizing it [11]. It is mostly used to separate azeotropic
mixtures or closed boiling points liquids [12]. The process has gained popularity because it is energy
efficient, easy to scale up, easy to integrate with other processes and has low carbon footprints [13].
The integration of distillation with pervaporation in alcohol-hydrocarbon separation shows as high as
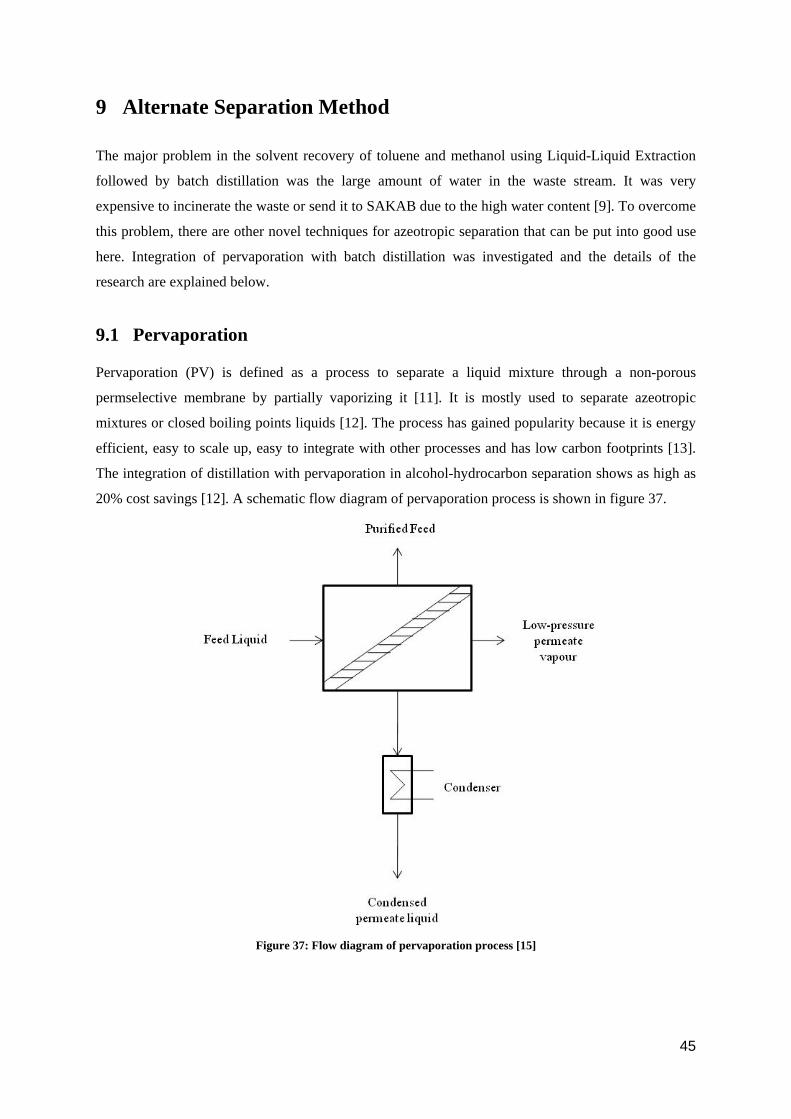
20% cost savings [12]. A schematic flow diagram of pervaporation process is shown in figure 37.
Figure 37: Flow diagram of pervaporation process [15]
45
In figure 37, the liquid feed enters along one side of the permselective membrane [11]. The relative
flow of the different components through the membrane is based on the selectivity of the membrane
[14]. Permeate evolved on the other side is in the vapour state which is kept under vacuum by
continuous pumping. [11] The driving force across the membrane is induced by the vapour pressure
difference between the heated liquid feed and the permeate vapour [15]. There are many ways to
maintain the vapour pressure difference across the membrane. In the laboratory, a vacuum pump is
installed to create a vacuum on the permeate side of the system. On an industrial scale, in order to
draw a vacuum on the permeate side most economically, the permeate vapour is cooled, causing it to
condense to create a partial vacuum [15]. The collected permeate vapour is condensed and the
resulting liquid is rich in the permeating component of the feed liquid. On the other hand, retentate
collected on the feed side of the membrane is depleted in the permeating component.
9.2 Characteristics of Pervaporation Membranes
Pervaporation is usually characterized by the selectivity (𝛼𝛼) of the membrane and the flux (𝑗𝑗) through
the membrane. The selectivity of a given membrane is often defined as the ratio of the mole fraction
of the components in the fluid on both the sides of the membrane. It is given by equation 4. Denoting
the mole fractions by X, the selectivity can be written as:
𝛼𝛼𝑇𝑇𝑗𝑗 =𝑋𝑋𝑇𝑇𝑆𝑆/𝑋𝑋𝑗𝑗𝑆𝑆𝑋𝑋𝑇𝑇𝑆𝑆/𝑋𝑋𝑗𝑗𝑆𝑆
(4)
Where subscript (𝑆𝑆) represents permeate side of the membrane and subscript (𝑆𝑆) represents feed side
of the membrane. The index 𝑇𝑇 and 𝑗𝑗 refers to the components [12].
The flux of component i through the membrane can be written as:
𝑗𝑗𝑇𝑇 =𝑃𝑃𝑇𝑇𝐺𝐺
𝑆𝑆(𝑆𝑆𝑇𝑇𝑆𝑆 − 𝑆𝑆𝑇𝑇𝑆𝑆 ) (5)
Where, 𝑃𝑃𝑇𝑇𝐺𝐺 is the permeability of the membrane, 𝑆𝑆 is the membrane thickness, 𝑆𝑆𝑇𝑇𝑆𝑆 and 𝑆𝑆𝑇𝑇𝑆𝑆 are the
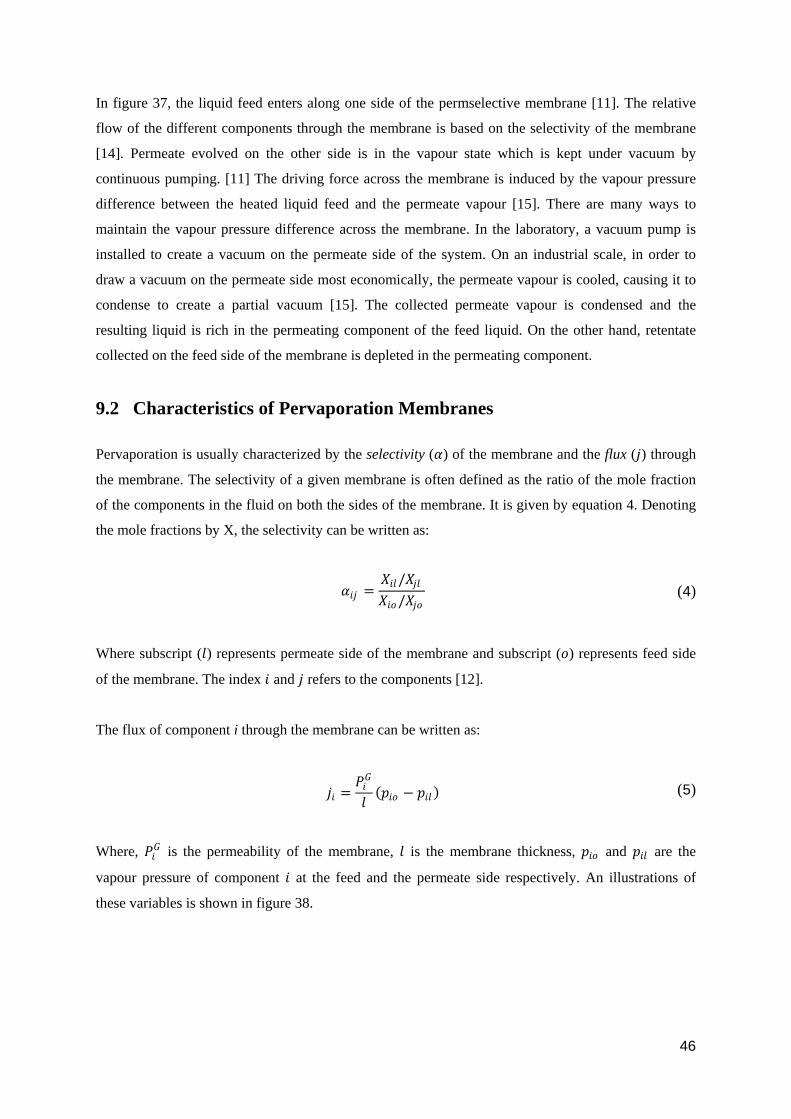
vapour pressure of component 𝑇𝑇 at the feed and the permeate side respectively. An illustrations of
these variables is shown in figure 38.
46
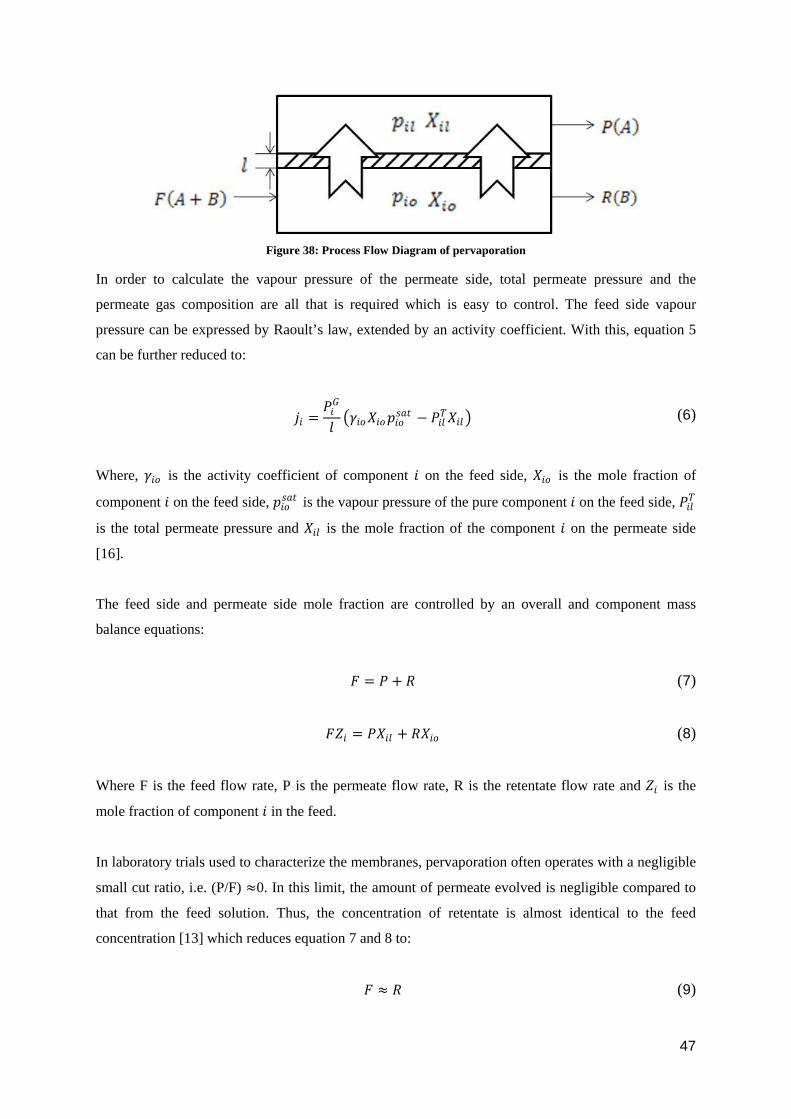
Figure 38: Process Flow Diagram of pervaporation
In order to calculate the vapour pressure of the permeate side, total permeate pressure and the
permeate gas composition are all that is required which is easy to control. The feed side vapour
pressure can be expressed by Raoult’s law, extended by an activity coefficient. With this, equation 5
can be further reduced to:
𝑗𝑗𝑇𝑇 =𝑃𝑃𝑇𝑇𝐺𝐺
𝑆𝑆�𝛾𝛾𝑇𝑇𝑆𝑆𝑋𝑋𝑇𝑇𝑆𝑆𝑆𝑆𝑇𝑇𝑆𝑆𝑠𝑠𝑇𝑇𝑡𝑡 − 𝑃𝑃𝑇𝑇𝑆𝑆𝑇𝑇𝑋𝑋𝑇𝑇𝑆𝑆 � (6)
Where, 𝛾𝛾𝑇𝑇𝑆𝑆 is the activity coefficient of component 𝑇𝑇 on the feed side, 𝑋𝑋𝑇𝑇𝑆𝑆 is the mole fraction of
component 𝑇𝑇 on the feed side, 𝑆𝑆𝑇𝑇𝑆𝑆𝑠𝑠𝑇𝑇𝑡𝑡 is the vapour pressure of the pure component 𝑇𝑇 on the feed side, 𝑃𝑃𝑇𝑇𝑆𝑆𝑇𝑇
is the total permeate pressure and 𝑋𝑋𝑇𝑇𝑆𝑆 is the mole fraction of the component 𝑇𝑇 on the permeate side
[16].
The feed side and permeate side mole fraction are controlled by an overall and component mass
balance equations:
𝐹𝐹 = 𝑃𝑃 + 𝑅𝑅 (7)
𝐹𝐹𝑍𝑍𝑇𝑇 = 𝑃𝑃𝑋𝑋𝑇𝑇𝑆𝑆 + 𝑅𝑅𝑋𝑋𝑇𝑇𝑆𝑆 (8)
Where F is the feed flow rate, P is the permeate flow rate, R is the retentate flow rate and 𝑍𝑍𝑇𝑇 is the
mole fraction of component 𝑇𝑇 in the feed.
In laboratory trials used to characterize the membranes, pervaporation often operates with a negligible
small cut ratio, i.e. (P/F) ≈0. In this limit, the amount of permeate evolved is negligible compared to
that from the feed solution. Thus, the concentration of retentate is almost identical to the feed
concentration [13] which reduces equation 7 and 8 to:
𝐹𝐹 ≈ 𝑅𝑅 (9)
47
𝐹𝐹𝑍𝑍𝑇𝑇 ≈ 𝑅𝑅𝑋𝑋𝑇𝑇𝑆𝑆 (10)
Now, with the control on the temperature on the feed side, approximation of equation 9 and 10 allows
us to measure the vapour pressure of the feed side and hence the flux of the components can be
measured.
9.3 Integration of Pervaporation with Batch Distillation
Pervaporation is a process with very low throughput. Therefore, in industries it is used to complement
distillation processes to “pass over” the azeotropic point. In case of an unequal feed, it is carried out
with the membrane which is selective to the component of lower concentration in the feed mixture. It
is done to minimize the amount of permeate required to recover a pure retentate [11]. The components
of the waste stream consisted of toluene, methanol and 2-phenyl-2-propanol. For simplifications, 2-
phenyl-2-propanol which was in a low quantity was neglected and the design was made for toluene-
methanol mixture. Figure 39 shows a schematic flow diagram of the process.
Figure 39: Integrated separation system of batch distillation and pervaporation
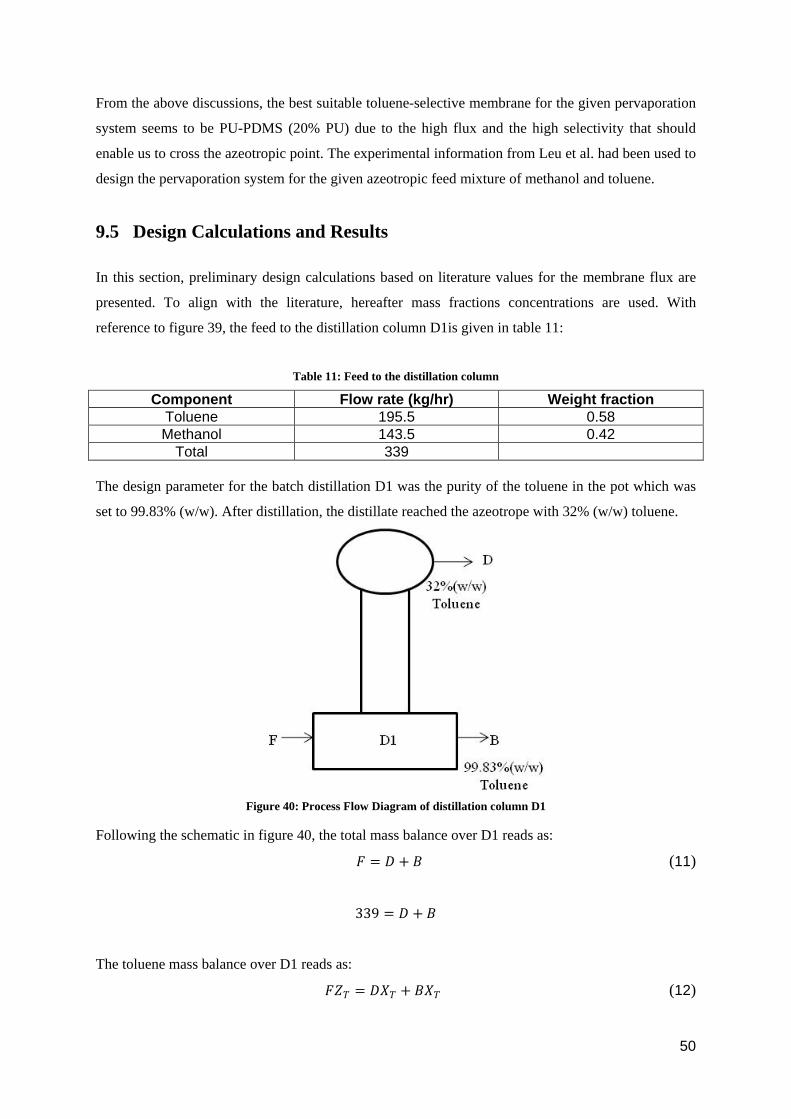
Following figure 39, the toluene-methanol mixture was fed into the batch distillation column D1 to
reach an azeotropic point in the distillate whereas in the pot, it was possible to achieve the required
purity of toluene. After distillation, the distillate was an azeotropic mixture at 32% (w/w) toluene [7].
The distillate was then fed to the pervaporation system equipped with a toluene-selective membrane
that enables to cross the azeotropic point. The permeate of the pervaporation, which is rich in toluene,
is then sent back to the distillation column D1 to increase the overall recovery of toluene whereas the
retentate is pure methanol
48
9.4 Previous Research Work on Pervaporation
There have been many studies on pervaporation. From 1917-1989, one study states that there were
more than 775 citations referred to pervaporation activities. Out of that, 37% were patents while the
rest consisted of technical writings [14]. Since the mixture of Toluene-Methanol is commonly
available in many pharmaceutical industries, there have been several studies performed on separating
them using pervaporation.
Pal and Pangarkar used Acrylonitrile-based copolymer membranes [17], Mandal and Pangarkar used
polyvinyl alcohol, cellulose acetate, cellulose triacetate, cellophane and blends of copolymer of
cellulose triacetate-acrylic acid [18], Bhat and Pangarkar used Polyimide membrane and blends of
acrylonitrile and hydroxyl ethyl methacrylate [19], Sommer and Melin studied the influence of
operation parameters on the separation of mixtures using pervaporation with Y-zeolite membranes
[20], Zhou et al. used the blends of polypyrole and hexafluorophosphate [21], Park et al. worked on
the blends of poly(acrylic acid) and poly(vinyl alcohol) [22] and Huang et al. worked on the
composites chitin membranes supported by porous poly (ether imide) substrate [23]. The common
attribute in all the above membranes is their higher affinity towards methanol.
The feed mixture to the pervaporation system in the case considered here contained 32% (w/w)
toluene at a constant pressure of 101.325 kPa. It was logical to use a membrane which was selective
to toluene since it is faster to remove a lesser component from the mixture. There are very few studies
on toluene-selective membranes for such separation. Mandal and Pangarkar have mentioned that
linear low density polyethylene (LLDPE) and poly(dimethylsiloxane) (PDMS) are the only toluene-
selective membrane materials in the presence of methanol. In their research using PDMS, the reported
toluene flux and selectivity for a 32% (w/w) toluene feed were 96.36 (kgμm/m2h) and 𝛼𝛼 = 2.67
respectively [18]. According to Leu et al., the common problem in using these membranes is the low
selectivity which can be overcome by blending polyurethane (PU) to PDMS. In their research, the
reported toluene flux and selectivity for 32% (w/w) toluene feed for PU-PDMS (20% PU) were
113.14 (kgμm/m2h) and 𝛼𝛼 = 3.66 respectively [13]. Patil and Aminabhavi used Mixed Matrix
Membranes (MMMs) of chitosan containing hydrophobic silicalite zeolite particles (10%). In their
research, the reported total flux and selectivity for 32% (w/w) toluene feed were 0.0286 (kgμm/m2h)
and 𝛼𝛼 = 44 respectively [23]. Garg et al. used a blend of polyimide (PI) and PDMS and the reported
toluene flux and selectivity for 32% (w/w) toluene feed were 1.4 (kgμm/m2h) and 𝛼𝛼 = 8 respectively
[12]. All the above experiments were conducted in the limit of negligible permeate-to-feed flow. In
this case, the experiments can be interpreted using equation 9 and 10.
49
From the above discussions, the best suitable toluene-selective membrane for the given pervaporation
system seems to be PU-PDMS (20% PU) due to the high flux and the high selectivity that should
enable us to cross the azeotropic point. The experimental information from Leu et al. had been used to
design the pervaporation system for the given azeotropic feed mixture of methanol and toluene.
9.5 Design Calculations and Results
In this section, preliminary design calculations based on literature values for the membrane flux are
presented. To align with the literature, hereafter mass fractions concentrations are used. With
reference to figure 39, the feed to the distillation column D1is given in table 11:
Table 11: Feed to the distillation column
Component Flow rate (kg/hr) Weight fraction Toluene 195.5 0.58 Methanol 143.5 0.42
Total 339 The design parameter for the batch distillation D1 was the purity of the toluene in the pot which was
set to 99.83% (w/w). After distillation, the distillate reached the azeotrope with 32% (w/w) toluene.
Figure 40: Process Flow Diagram of distillation column D1
Following the schematic in figure 40, the total mass balance over D1 reads as: 𝐹𝐹 = 𝐷𝐷 + 𝑆𝑆 (11)
339 = 𝐷𝐷 + 𝑆𝑆
The toluene mass balance over D1 reads as: 𝐹𝐹𝑍𝑍𝑇𝑇 = 𝐷𝐷𝑋𝑋𝑇𝑇 + 𝑆𝑆𝑋𝑋𝑇𝑇 (12)
50
339 ∗ 0.58 = 𝐷𝐷 ∗ 0.32 + 𝑆𝑆 ∗ 0.9983
By solving equation 11 and 12 we obtain:
𝐷𝐷 = 209 kg , 𝑆𝑆 = 130 kg
The bottom product in the pot was 130 kg with 99.83% (w/w) toluene. The total amount of distillate
was 209 kg with 32% (w/w) toluene. The distillate was fed into the pervaporation system equipped
with a PU-PDMS (20% PU) toluene-selective membrane. The pervaporation process was performed
in a batch mode. A regular batch time of 8 hours was considered for the calculations. This operation
time was chosen based on the number of hours in a shift in industries. A double jacket cooling water
system was used over the cell to maintain a constant temperature of 25°C. A steady pressure of 200
Pa at the downstream was applied. The thickness of the membrane was 213±37 µm. The flux in this
case was calculated by the initial conditions of the system and extrapolated for the entire system
during the complete operation of the process. As an approximation, the flux determined by Lue el at.
was used here and it is important to note here that this flux was obtained for the case (P/F)≈0.
According to the studies of Lue el at., the toluene flux reported for the given pervaporation system at
the above operating conditions was 113.14 kgμm/m2h with selectivity 𝛼𝛼 = 3.66. Divided by the
membrane thickness (𝑆𝑆 = 213 μm), effective membrane flux for toluene is obtained as 0.531 kg/m2h
[13]. The amount of toluene in the distillate is:
𝑇𝑇𝑆𝑆𝑆𝑆𝑃𝑃𝑆𝑆𝑇𝑇𝑆𝑆 = 𝐷𝐷 ∗ 𝑋𝑋𝑇𝑇
𝑇𝑇𝑆𝑆𝑆𝑆𝑃𝑃𝑆𝑆𝑇𝑇𝑆𝑆 = 209 ∗ 0.32 = 66.88 𝑘𝑘𝑃𝑃
The toluene transferred to the permeate through the membrane area of 1 m2 in 1 hour was 0.531 kg.
Number of 8 hours-shift required with different areas of the membrane to complete the process of
transferring 66.88 kg of toluene is shown in table 12:
Table 12: Number of shifts required for the different areas of the membrane to complete the process
Toluene Transferred (kg) No. of shifts Area (m2)
67.968 16 1
67.968 8 2
76.464 6 3
67.968 4 4
84.96 4 5
76.464 3 6
51
89.208 3 7
67.968 2 8
76.464 2 9
84.96 2 10
67.968 1 16
The composition of toluene in the permeate was calculated using the selectivity of the membrane.
Using equation 4 from above together with 𝛼𝛼 = 3.66 we obtain:
3.66 =𝑋𝑋𝑇𝑇𝑆𝑆/𝑋𝑋𝑗𝑗𝑆𝑆
0.32/0.68
1.722 =𝑋𝑋𝑇𝑇𝑆𝑆
1 − 𝑋𝑋𝑇𝑇𝑆𝑆
𝑋𝑋𝑇𝑇𝑆𝑆 = 0.632
The amount of permeate follows as:
𝑃𝑃 ∗ 𝑋𝑋𝑇𝑇𝑆𝑆 = 𝑃𝑃𝑡𝑡𝑆𝑆𝑆𝑆𝑃𝑃𝑆𝑆𝑇𝑇𝑆𝑆
𝑃𝑃 =66.880.632
𝑃𝑃 = 105.82 𝑘𝑘𝑃𝑃
The amount of retentate:
𝑅𝑅 = 209 − 105.82 = 103.18 𝑘𝑘𝑃𝑃
The total amount of permeate was 105.82 kg with 63.2% (w/w) toluene whereas the retentate was
103.18 kg of pure methanol. The permeate was fed into the batch distillation column to further
increase the recovery of toluene. The design parameter for this second batch distillation was the purity
of the toluene in the pot which is set to 99.83% (w/w). After distillation, the distillate reached the
azeotrope with 32% (w/w) toluene. A mass balance over batch distillation column D1 allows for
determining the distillate and bottoms for the second distillation.
Total mass balance over D1 reads as:
𝐹𝐹 = 𝐷𝐷 + 𝑆𝑆
52
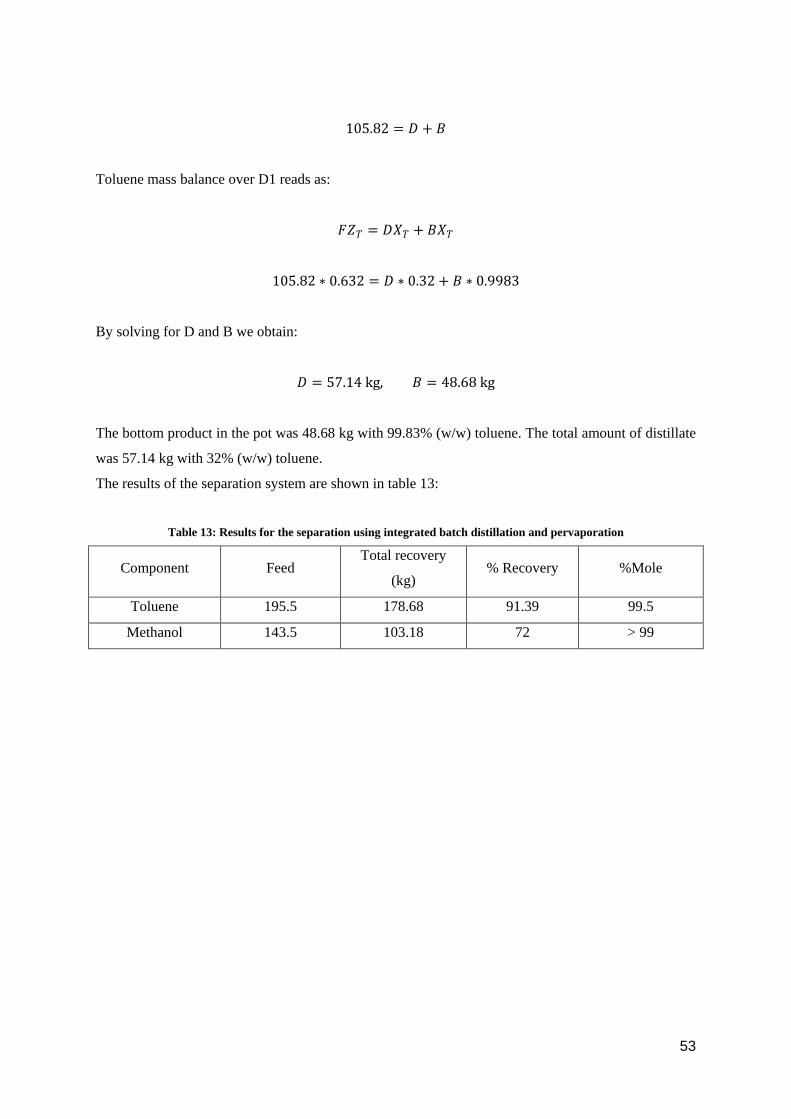
105.82 = 𝐷𝐷 + 𝑆𝑆
Toluene mass balance over D1 reads as:
𝐹𝐹𝑍𝑍𝑇𝑇 = 𝐷𝐷𝑋𝑋𝑇𝑇 + 𝑆𝑆𝑋𝑋𝑇𝑇
105.82 ∗ 0.632 = 𝐷𝐷 ∗ 0.32 + 𝑆𝑆 ∗ 0.9983
By solving for D and B we obtain:
𝐷𝐷 = 57.14 kg, 𝑆𝑆 = 48.68 kg
The bottom product in the pot was 48.68 kg with 99.83% (w/w) toluene. The total amount of distillate
was 57.14 kg with 32% (w/w) toluene.
The results of the separation system are shown in table 13:
Table 13: Results for the separation using integrated batch distillation and pervaporation
Component Feed Total recovery
(kg) % Recovery %Mole
Toluene 195.5 178.68 91.39 99.5
Methanol 143.5 103.18 72 > 99
53
10 Conclusion
With increasing competition in the pharmaceutical business, it is important for a company to adopt
sustainable processes. Three major strategies for sustainability are perused when it comes to
manufacturing industries: Social, Economical and Environmental. Even though quality is the prime
focus for any pharmaceutical company, in order to prosper in a competitive market, it is important to
adapt to using sustainable methods for long term benefits. In pharmaceutical industries, solvents play
a very crucial role in the manufacturing of APIs. A good sustainable practice to manage the solvents
is to reuse them instead of incineration. It is beneficial for all three strategies mentioned above.
At the Snäckviken site, two waste streams were studied to recover the key-solvents. The key-solvents
were chosen based on the cost and the amount of solvents present in the two waste streams. The first
stream was toluene and methanol in which toluene was the key solvent. The second stream was
isooctane and ethyl acetate in which isooctane was the key solvent.
Concerning the first stream, it was found out that the mixture of toluene and methanol makes an
azeotrope. The separation thus could not be achieved by a conventional distillation process. Therefore
Liquid-Liquid Extraction to recover toluene was investigated. Water was used as a solvent for the
process based on its property of extracting methanol from the mixture. Later, the feasibility of the
process was assessed using ASPEN plus modeling. The simulation was successful and desired
isooctane purity with high recovery was achieved. The methanol-water stream after the extraction
process was investigated using ASPEN batch modeler. The components are not making any
azeotrope; hence conventional distillation could be used for their separation. The simulation was
successful to achieve high purity water with good recovery so that it can be recycled. With the help of
this additional distillation step, the total waste was reduced by a considerable level. The feasibility of
the entire toluene-methanol separation system was assessed including Liquid-Liquid Extraction and
batch distillation. The feasibility was done based on four cases and two scenarios. The first scenario
considered extra manpower to run the process. In this scenario, the case with Liquid-Liquid
Extraction without batch distillation gave the maximum profit. In the second scenario, extra
manpower was not needed to run the process. In this scenario, the case where Liquid-Liquid
Extraction and batch distillation with batch time of 15.5 hours was used, gave the maximum profit.
Concerning the second stream, it was found out that the mixture of isooctane and ethyl acetate was
also making an azeotrope and hence the separation cannot be achieved by a conventional distillation
process. Therefore Pressure Swing Distillation to recover toluene was investigated. The feasibility of
the process was assessed using ASPEN batch modeler. The simulation was successful to achieve the
desired isooctane and ethyl acetate purity. But in order to achieve higher recovery, the process
54
required relatively high processing time as well as relatively high energy demand. The feasibility of
the entire isooctane-ethyl acetate separation system was assessed based on six cases and two
scenarios. The first scenario considered extra manpower to run the process. In this scenario, the case
where the cycle of HP and LP columns is run three times gave the maximum profit. In the second
scenario, extra manpower was not needed to run the process. In this scenario, the case where the cycle
of HP and LP columns is run five times gave the maximum profit.
A critical finding was that the waste stream produced in the separation of the first stream using
Liquid-Liquid Extraction with water as a solvent contained high amount of water. This made the
disposal of the waste expensive due to low calorific value of water. In order to avoid the use of water,
an integration of pervaporation with batch distillation was studied for the separation of methanol and
toluene. First, batch distillation was performed to recover toluene at the required purity. After that,
pervaporation was performed to break the azeotrope and recover methanol. Due to the lower
concentration of toluene in the feed to the pervaporation module, toluene-selective membranes were
investigated. A blend of Polyurethane-poly(dimethylsiloxane) (PU-PDMS) membranes was selected
for the pervaporation process due to high toluene flux. The number of hours required in order to
complete the process for different membrane areas was estimated. To further increase the recovery of
toluene, another batch distillation was performed with the permeate as a feed. The total recovery of
toluene from this system was 91.4 % with desired purity whereas the total recovery of methanol was
72% with desired purity.
55
References
[1] David J.C. Constable, C. J. Conzalez and R. K. Henderson (2007). Perspective on solvent use in the pharmaceutical Industry, Organic Process Research & Development, 11, 133-137 [2] C. J. Gonzalez, P. P. Quirinus, B. Broxterman, Bing-Shiou Yang, D. Ende, J. Baird, C. Bertsch, R. E. Hannah, P. Dell’Orco, H. Noorman, S. Yee, R. Reintjens, A. Wells, V. Massonneau and J. Manley(2011). A Perspective from Pharmaceutical and Fine Chemicals Manufacturers, Organic Process Reaseach & Development, 15, 900–911 [3] AstraZeneca (2014). Annual Report, internal document [4] AstraZeneca (2015). AstraZeneca to present comprehensive data from its diabetes portfolio and pre-clinical research at EASD 2015, internal document [5] AstraZeneca (2014). Introduction to AstraZeneca, internal document [6] AstraZeneca (2013). AstraZeneca’s history, internal document [7] Jurgen Gmeling, U Onken (1984). Vapor-Liquid equilibrium data collection, Dechema chemistry data series 1, vol. 1 [8] Adam Skrzecz, David Shaw, Andrzej Maczynski (1998). Ternary Alcohol – Hydrocarbon – Water Systems IUPAC-NIST Solubility data series 69, pp. 1011-1012 [9] Jansson, K. (2015-10-15). SHM Koordinator API och OS Admin, personal communication [10] Ooms, Tom and Vreysen, Steven and Van Baelen, Guy and Gerbaud, Vincent and Rodriguez-Donis, Ivonne (2014). Separation of ethyl acetate–isooctane mixture by heteroazeotropic batch distillation. Chemical Engineering Research and Design vol. 92 (n° 6), pp. 995-1004 [11] R.D. Noble and S.A. Stern (1995). Membrane Separation Technology Principles and Applications, Membrane Science and Technology Series 2 [12] Prabhat Garg, R.P.Singh, Veena Choudhary (2011). Selective polydimethylsiloxane/polyimide blended IPN pervaporation membrane for methanol/toluene azeotrope separation, Separation and Purification Technology 76, pp. 407-418 [13] Shingjiang Jessie Lue, Jia Shyang Ou, Chun Hung Kuo, Hsin Yi Chen, Tzu-Huai Yang (2010). Pervaporative separation of azeotropic methanol/toluene mixtures in polyurethane poly(dimethylsiloxane) (PU–PDMS) blend membranes: Correlation with sorption and diffusion behaviors in a binary solution system. Journal of Membrane Science 347, pp. 108-115 [14] Hubert L. Fleming, C. Stewart Slater (1992), Pervaporation, Membrane Handbook vol. 1, pp. 105-159 [15] Richard W. Baker, Pervaporation, Membrane Technology and Applications, third edition, pp. 379-416 [16] Richard W. Baker, J.G. Wijmans, Yu Huang (2010). Permeability, permeance and selectivity: A preferred way of reporting pervaporation performance data, Journal of Membrane Science vol. 348, Issues 1-2, pp. 346-352
56
[17] S.M. Pal, V.G. Pangarkar (2005). Acrylonitrile-based copolymer membranes for the separation of methanol from a methanol–toluene mixture through pervaporation, J. Appl. Polym. Sci. 96, pp. 243–252 [18] S. Mandal, V.G. Pangarkar (2001), Separation of methanol-benzene and methanol–toluene mixtures by pervaporation: effects of thermodynamics and structural phenomenon, J. Membrane Science 201, pp. 175–190 [19] A.A. Bhat, V.G. Pangarkar (2000), Methanol-selective membranes for the pervaporative separation of methanol–toluene mixtures, J. Membrane Science 167, pp. 187–201 [20] S. Sommer, T. Melin (2005), Influence of operation parameters on the separation of mixtures by pervaporation and vapor permeation with inorganic membranes. Purely organic systems, part 2, Chemical Engineering Science 60, pp. 4525–4533 [21] M. Zhou, M. Persin, J. Sarrazin (1996), Methanol removal from organic mixtures by pervaporation using polypyrrole membranes, J. Membrane Science 117, pp.303–309 [22] H.C. Park, R.M. Meertens, M.H. Mulder (1998), Sorption of alcohol–toluene mixtures in poly(acrylic acid)–poly(vinyl alcohol) blend membranes and its role on pervaporation, Ind. Eng. Chem. Res. 37, pp. 4408–4417 [23] Mallikarjunagouda B. Patil, Tejraj M. Aminabhavi (2008). Pervaporation separation of toluene/alcohol mixtures using silicalite zeolite embedded chitosan mixed matrix membranes. Separation and Purification Technology 62, pp. 128–136
57