kto-kogo: a cross-country study of the origins and...
TRANSCRIPT

Kto Kogo?: A Cross-Country Study of the Origins and Targets of Terrorism
Alan B. Krueger Princeton University and NBER
and
David D. Laitin
Stanford University
January 18, 2007
*We thank the Russell Sage Foundation for providing us a terrific origin from which to write this paper. We thank Ryan Quillan, Cathy Rampell and Grace Wong for research assistance. Krueger thanks the Lowenstein Foundation and Carnegie Scholars Program for financial support. Helpful comments were provided by seminar participants at the NBER.

I. Introduction A popular wisdom in the burgeoning literature on terrorism focuses on the
economic motivations of terrorists. “We fight against poverty,” President George W.
Bush explained in Monterrey Mexico on March 23, 2002, “because hope is an answer to
terror.” Stern (2003) also draws a direction connection between poverty and terrorism.
While poverty is an attractive answer to the question of “why terrorism?”, the data do not
lend much support for it. Macroeconomic shifts generally fail to map on to changes in
terrorist activity. For example, in the late 1990s and 2000, when terrorism reached new
heights against Israeli citizens, the typical Palestinian was reporting a rosier economic
forecast and unemployment was declining. Using a longer time-series, Berrebi (2003)
finds little correlation between economic conditions in the West Bank and Gaza Strip and
the number of terrorist incidents against Israel. An even more perplexing problem for the
poverty thesis arises on the micro-level. Several studies of individuals have failed to find
any direct connection between education, poverty, and the propensity to participate in
terrorism (Russell and Miller, 1983; Taylor, 1988; Hudson, 1999; Krueger and
Maleckova, 2003; Berrebi, 2003, Atran, 2003). If anything, those who participate in
terrorism tend to come from the ranks of the better off in society.
Those who claim a connection between poverty and terrorism could respond that
at least on the micro level, well-to-do citizens become terrorists out of public spiritedness
for their impoverished fellow citizens, and they are chosen by organizations to perform
these tasks due to their reliability and skill. Consider the anecdotal findings of Nasra
Hassan (2001), for example. She interviewed 250 militants and their associates involved
in the Palestinian cause from 1996-99. One Hamas leader told her, “Our biggest problem
2

is the hordes of young men who beat on our doors, clamoring to be sent [on suicide
missions]. It is difficult to select only a few.” And whom did they choose from these
hordes? She reports that, “None of them were uneducated, desperately poor, simple
minded or depressed. Many were middle class and, unless they were fugitives, held
paying jobs.” She also found, “two were the sons of millionaires.” Thus a “Robin Hood”
connection might be made linking poverty to terrorism. Individuals can become terrorists
because of poverty in their country, even if they are themselves not impoverished.
Moreover, the fact that terrorist organizations actively screen and recruit
members, perhaps choosing the elite from a long queue of applicants, may mask the role
that individuals’ personal economic circumstances play in the supply of terrorists (see
Bueno de Mesquita, 2003). That is, poverty may cause more individuals to want to
supply their services to be terrorists, but the organizations may not select them. If this is
the case, then the available micro evidence, which reflects both supply and demand
factors, may paint a misleading picture of the role of economic factors on the supply of
terrorists.
Cross-national studies of terrorism have the potential to identify the effect of
national economic conditions on terrorism, reflecting both the role of supply-side factors
(i.e., determinants of who volunteers) and demand-side factors (i.e., terrorist
organizations recruiting and screening participants). These studies are most relevant to
the question of how the equilibrium differs under different economic conditions. A small
literature has examined the correlates of participation in terrorism at the national level,
either using the country of origin of the terrorists (Krueger and Maleckova, 2003) or the
country where the event occurred (Piazza, 2003) as the unit of observation. Both types of
3

studies have found little correlation between economic factors, such as GDP per capita or
GDP growth, and the incidence of terrorism. Similarly, Abadie (2004) examines the
effect of terrorism risk from insurance ratings, including both domestic and international
terrorism. He finds that a country’s income per capital is unrelated to terrorism risk,
while political rights have a non-monotonic relationship with terrorism risk. Countries
with a high level of political rights or authoritarian rule had the lowest risk of terrorism in
his data.
Burgoon (2006) finds that welfare spending relative to GDP is inversely related to
the number of terrorist incidents occurring in a cross-section of countries and in a panel
of countries over time. His model also controls for government capacity, however, which
is a composite measure that largely reflects GDP per capita. Government capacity is
positively related to the number of terrorist incidents. Trade openness is unrelated to the
number of terrorist incidents. Li and Schaub (2004) estimate a similar model and control
for economic development. They interpret their estimates as indicting that economic
development discourages terrorism, but they also control for government capabilities,
which has a sizable positive impact on terrorism that likely offsets their claimed negative
effect of economic development. Their model is also hard to interpret because they
control for lagged terrorist incidents. Because most of the variability in income is cross
sectional and long lasting, controlling for lagged incidents clouds the interpretation of
income on terrorist incidents.
In this paper, we extend the previous literature by linking both the country of
origin and the target country of the terrorist event. As Lenin often reminded those who
briefed him on revolutionary affairs, the key pair of questions to ask is: “Kto kogo?”, or
4

“Who to whom?” Relying on our coding of the US State Department’s data on
international terrorism, and a new dataset on suicide attacks, we look not only at the
attacker, but also at the target. We find that controlling for political regime, there is little
economic foundation for terrorist origins (the kto). Rather, the economic story for
terrorism is in the characteristics of the target (the kogo). The data suggest that the origins
of terrorism are in countries that suffer from political oppression; the targets are countries
that enjoy a measure of economic success.
II. Datasets and Description of Terrorist Events
A. The Dataset on International Terrorist Incidents
We rely on two distinct datasets. The first is on international terrorism. In its
annual report, Patterns of Global Terrorism, the U.S. State Department tracks terrorist
incidents. According to the State Department, 9,737 international terrorist events took
place since 1981, with 1,953 of them occurring from 1997 through 2002.1 Specific
information is provided on 781 “significant” events from 1997 to 2002; the other events
in that period are judged to be insignificant.2 To qualify as “significant”, an event must
be judged by the US Government’s Incident Review Panel to result “in loss of life or
serious injury to persons, abduction or kidnapping of persons, major property damage,
and/or [be] an act or attempted act that could reasonably be expected to create the
conditions noted.” We have coded the 781 significant events into a dataset on the origins
and targets of terrorist attacks.
1 . Descriptive statistics are available at their website: http://www.state.gov/s/ct/rls/pgtrpt/2002/html/19997.htm. 2 There were actually 785 events, but 4 were excluded from our analysis because of missing information on the suspected origins of the perpetrators.
5

To define terrorism, the State Department reports that it relies on guidance from
Title 22 of the United States Code, Section 2656f(d), which it claims defines terrorism as
“premeditated, politically motivated violence perpetrated against noncombatant targets
by subnational groups or clandestine agents, usually intended to influence an audience.”3
The State Department further restricts its statistical efforts toward the identification of
"international terrorism," which means terrorism involving citizens or the territory of
more than one country.
Yet international terrorism is a tricky concept to define. The State Department
Global Terrorism report recognizes some of these problems. For example, in its early
years of reporting, Palestinians were defined as stateless people, and therefore their
attacks on other Palestinians in the territories occupied by Israel were counted as
international terrorism; but in later years, consistent with criteria for other intra-ethnic
violence, these events were re-coded as domestic terrorism, and were therefore
retroactively deleted from the earlier annual reports.
There are several additional coding problems that are not acknowledged.
Colombia since 1997 has had the second highest exposure to international terrorism
according the State Department data. However, some of these events appear from their
description in the State Department files as tactics to control the drug traffic rather than
“politically motivated violence” to “influence an audience.” A different problem arises
with India, the country with the largest number of incidents since 1997. Ninety percent of
these incidents are connected with an insurgency in Jammu and Kashmir against Indian
claims to sovereignty. To code these incidents as international terrorist events implies
3 Interestingly, the code itself does not include the phrase, “usually intended to influence an audience.”
6

(without full justification) that the perpetrators are from Pakistan.4 Most are surely from
Jammu and Kashmir, which the international community recognizes as India, and thus
these events do not quite properly fit into a dataset on international terrorism. A third
problem arises in West Africa. The long-standing civil wars in Sierra Leone and Liberia
have spilled over borders, especially into Guinea, and into Ivory Coast as well. Attacks
by armed bands from one of these countries, terrorizing villagers from another, is rarely
counted as international terrorism by the State Department. If they were counted as
assiduously as are FARC atrocities against foreigners in Colombia, the regional
breakdown of terrorism (and perhaps UN budgets seeking its eradication) likely would be
quite different.5
The data clearly have their limits.6 Nevertheless, we have some reasons to be
confident in our results. For one, these data correlate well with an independent data
source, Todd Sandler’s “Iterate” dataset. The correlation between our dataset and the
Iterate dataset aggregated to the level of the country where the event took place is 0.52.
The largest outlier is that the State Department codes many Indian events as international,
while Sandler’s dataset does not. Excluding India (which we will do as part of our
robustness tests) the State Department data and Sandler’s correlate at .90 at the level of
the place of the attacks, and at 0.89 at the country of origin. However, our reading of the
State Department vignettes and assigning a nationality to the target correlates only at .41
4 It is also possible (but not noted in the descriptions) that non-Indians were injured in the attacks, which would qualify them as international terrorism. 5 . For three examples of these African events -- only one of which is counted as international terrorism in the US Department of State dataset -- see US Committee for Refugees, September 13, 2000, at http://www.reliefweb.int/w/rwb.nsf/0/e59f7718ab26c29785256959006ccc16?OpenDocument (downloaded October 30, 2003). 6 Another limitation is that state-sponsored terrorism is excluded from the State Department data. Although we do not deny the existence of state-sponsored terrorism, we do not consider this a major limitation because modeling state-sponsored terrorism would require a different methodological approach than what we use in this paper.
7

with Sandler’s place-based data.7 The latter correlation suggests the importance of
disaggregating by target as well as origin. Nonetheless, the general similarity of the two
independently collected datasets gives some confidence in their external validity. Second,
to address the questions of “Kto, kogo?” (and not only the question of which regions are
most susceptible to terrorism), we see no obvious systematic biases in the State
Department dataset, and feel confident in relying on it to capture the differences between
the perpetrators and targets of terrorism.
We consequently rely on the US State Department dataset to analyze the “Who,
whom?” of international terrorism. Specifically, for each event, we coded the country of
origin of the terrorists, the name of the organization (if any) involved, the country where
the event occurred, the country of the primary target, whether the event involved a
suicide attack, and whether multiple perpetrators were involved.8 Thus, at the most basic
level, the unit of observation is a terrorist event, but we can aggregate the data to the
country of origin level, to the country of target level, or the cross-tabulation between all
potential origin and target countries. For example, the terrorist attacks of September 11,
2001 were coded as four separate events that occurred in the United States, that were
carried out mostly by Saudis, and that targeted Americans.9 We added to the dataset
several variables describing the country, such as GDP per capita, GDP growth, and
7 This correlation is for a sample that excludes India. If India is included, the correlation falls to 0.23. 8 We infer the target from the primary country of the victims. For 187 events, we also collected information on the “secondary target,” defined as the country of the second largest number of victims, but we do not analyze those data here. 9 We attributed three of the events to Saudi Arabia and one to the United Arab Emirates, because it is believed that 15 of the hijackers were from Saudi Arabia, two were from the United Arab Emirates, one was from Egypt and one from Lebanon. Attributing one of the events to people from the UAE was a judgment call that could be disputed, but we tried to adhere to a rule that assigned responsibility based on the country of origin of those directly involved in carrying out the attack. In the suicide database, the events of September 11 were coded as one attack originating from Saudi Arabia because al-Qaeda is mainly a Saudi-run terrorist organization.
8

measures of terrain, religious affiliation and literacy. These variables can be attached to
the dataset based on either the country of origin or target country.
Table 1 summarizes the State Department data, aggregated to the suspected
country of origin of the perpetrators. The data are presented in order of the total number
of events perpetrated by terrorists from each country. The number of events per
population in the origin country is also provided. (Most events involved multiple
perpetrators, but we do not take that into account in this table.) Many countries are not
associated with international terrorist events in this period, and they are not shown in the
table. India clearly has the largest number of events, but on a per capita basis India is
close to the mean, which is 0.26 per million people. Israel, Sierra Leone, and Angola are
associated with the largest number of per capita terrorist attacks.
In 87 percent of incidents, the country where the event took place was also the
suspected country of origin of the perpetrators. In only 46 percent of cases, however,
were the origin and the target countries the same, and in only 52 percent of cases were the
target country and the country where the event took place the same. In 44 percent of
cases, the target, place, and origin were all the same. (By definition, one might think this
should be zero, but the largest group affected by a terrorist attack may be the natives of
the country where the attack occurred, even though a foreigner was also a victim. In
addition, the State Department describes Kashmir attacks as perpetrated by Indians,
taking place in India, and targeting Indians; similarly, attacks by Palestinians against
Israelis are coded as originating in and targeting Israel.) Thus, perpetrators of
international terrorism tend to stay local, finding targets from foreign countries close to
home. Events like September 11th are the exception, not the rule; the murder of Wall
9

Street Journal reporter Daniel Pearl in February 2002 perpetrated in Pakistan, or the
suicide attacks on foreign housing in Riyadh, Saudi Arabia on May 13, 2003 are more
typical of the terrorist incidents in our database. A focus on international terrorism,
where origin and target are distinct, provides a valuable perspective on the who and
whom of terrorism.
B. Suicide Attack Dataset
The second dataset is exclusively on suicide attacks since 1980. A suicide attack
is a tactic in an insurgency in which the perpetrator of the attack will die with a
probability of one if the attack is a success (Berman and Laitin, 2005). In this paper, to
produce a broad set of cases that qualify as suicide attacks, we merge two suicide
datasets. The first is from Pape (2003, 357-60). The second is from the International
Policy Institute for Counter-Terrorism (ICT), at the Interdisciplinary Center Herzliya. In
the combined dataset, there are 236 recorded suicide attacks in eleven countries.10
As with the case of the State Department data archive on international terrorism,
this dataset is not without coding issues. Consider the case of Palestinian attacks on
Israelis, amounting to 42 percent of the events. Most datasets (including the State
Department’s) classify the perpetrators as coming from “the West Bank”. However, the
Palestinians are under the de facto control of Israel, and are fighting an insurgency either
to take control over all of Palestine (capture the center) or to build a Palestinian state on
some portion of current-day Israel. Suicide bombing is a tactic in the pursuance of one of
these goals, and the Palestinian attackers are therefore coded as having Israel as their
10 . This is available on the web at: [http://www.ict.org.il/]. The version we use was downloaded Sept. 12, 2003. For coding rules that went into the construction of this combined dataset, see Berman and Laitin, 2005.
10
country of origin. Israel is also the country in which these events have taken place and the
target. This decision seems well-justified, though not unambiguous (as it is possible to
view the suicide attackers coming from the incompletely sovereign Palestinian
Authority).
However, unlike terrorism which is often mired in ambiguities, suicide attacks are
rather simple to code, without much disagreement as to whether a particular incident
qualifies. While many could debate whether FARC kidnappings of Italian businessmen or
Liberian gangs shooting up Sierra Leonian villagers constitute international terror, there
is no dispute that FARC and the gangs associated with Charles Taylor do not perpetrate
suicide attacks.
For purposes of our “Kto, kogo?” questions the two datasets focus on somewhat
different contexts, but nonetheless complement each other. By definition, the dataset on
international terrorism will have an individual or group (the “who”) from one political
unit attacking a target (the “whom”) from another political unit. By contrast, in the
suicide attack dataset nearly all (187 out of 210) events involve a perpetrator and target
from the same country. In these cases, the relevant differences are in the ethnicity or
religion of the attackers as compared to the targets.
C. Brief Description of Events
Of the 781 terrorist events and the 236 suicide attacks in the two datasets, several
patterns are worth noting (see Table 2). First, as shown in row 1, terrorism and suicide
attacks are both mainly the product of organizational strategy rather than the efforts of
11

individual zealots or madmen.11 Therefore, explanations for terrorism cannot be adequate
without an account of why leaders in a hierarchy would send their cadres on such
missions. Organizations staff terrorist events, and seek to accomplish their goals through
the use of high-quality cadres, who would be more reliable to carry out the planned
missions than less skilled cadres. They are able to recruit even suicide missionaries
successfully, and here the explanation is consistent with Emile Durkheim’s classic study
of suicide, in religious organizations and armies, that is in places where “social
integration is too strong.” The result is what Durkheim calls “altruistic” suicide. People
prone to suicide are a constant across societies. Suicide rates vary, however, based on
both a social condition of low network solidarity (anomic suicide) and one of high
network solidarity (altruistic suicide). In this latter case, with socially dense networks, all
too many volunteer to give up their lives for the glory of their organizations.12
Second, as shown in rows 2 and 3, symbolic attacks on foreign property
(embassies or international organizations) are not everyday occurrences; nor are they
rare. It is interesting to speculate as to why (at least up till 2003 in Baghdad) suicide
missions had not been directed at international organizations at all, while these
organizations are subject to a significant number of terrorist events. We suggest that since
international organizations are immensely “soft” targets, along lines suggested by
Berman and Laitin (2005), it is not necessary to sacrifice the life of a cadre in order to
“hit” them.
11 See Kydd and Walter (2002), Gupta and Mundra (2003) and Berrebi and Klor (2003) for empirical and theoretical analyses of suicide bombings as strategic behavior on the part of Palestinian terrorist organizations. 12 Emile Durkheim [1897 (1951)] Suicide (New York: The Free Press), Book 2, chapter 4. See Azam (2003) for a recent attempt to model suicide bombers as being motivated by inter-generational altruism. See Wintrobe (2006) for an alternative explanation, where attackers are not altruistic, but consuming solidarity.
12

Third, as indicated on row 5, the probability that the perpetrator and target will be
from different religious groups is clearly different for international terrorism than it is for
suicide bombing. Taking a rough estimate of the world population for the world’s four
major religions (Muslim, Christian, Hindu and Buddhist) and a single category of Other
(that includes nearly all Chinese and all Jews), the probability that any two randomly
selected individuals in the world (with replacement) will be from different religions is
77.2%. Therefore, other things equal, international terrorism is only trivially more likely
to involve intra-religious parties than if it were randomly determined throughout the
world.13 By contrast -- but consistent with Berman and Laitin (2005) -- suicide attacks
are more likely to be inter-religious than would be expected from random selection of
pairs from the world’s population. Because suicide attacks in our data set often involve
people from the same country, arguably a better benchmark might be to compute the
chance of two randomly selected people within each country being from different
religions. In the average country in the world, 27.3% of people are from different
religions, so suicide attacks are far more likely to involve parties from different religions
than would be expected from randomness. This does not mean, however, that religious
differences are necessarily a motivation for suicide attacks.
Finally, as illustrated on row 6, the origin countries for terrorism and suicide
attacks are different, with only Israel in the top five of both datasets. The suicide origin
countries are richer. The mean log GDP per capita for the five leading terrorist sources in
13 The State Department dataset contains 28 suicide attacks. All of these involved religious differences between the parties. Therefore, eliminating suicide attacks would make the data show even higher rates of intra-religious killing than would be expected if it were random.
13

1980 was 7.56; and for the five leading suicide sources, it was 8.40.14 An examination of
the top five origin countries suggest a great amount of concentration and low level of
diffusion to other insurgencies of these technologies of warfare. The top five origin
countries account for 57% of the total cases in the terrorist dataset; they account for 96%
of the cases in the suicide dataset.
As to questions of “Kto, kogo?”, in the international terrorism dataset, as noted
earlier, in less than half of the cases (44%) is the country of origin, the place of the attack,
and the citizenship of the target the same. In less than half of the events as well, the
citizenship of the perpetrator and that of the target are the same.
Suicide attacks have a different profile, at least in part because the international
terrorist dataset purposefully excludes domestic terrorism. For the suicide attacks, in a
full 90% of the cases, the country of the attack, the country of the attacker, and the
country of the victims are the same. The perpetrators and the targets were of the same
country in 90% of the suicide events; the target and the country of attack were the same
in 92% of the events; and the perpetrator performed the suicide mission in his or her own
country in 95% of the cases.
III. Country-Level Analyses
In this section we analyze terrorism using the country of origin of the perpetrator,
country of the target, or the country where the event took place as the unit of observation.
This could be thought of providing an analysis of the margins of the matrix describing the
14 . Compare this to 7.0 for the mean logged GDP per capita in 1985 dollars (lagged by one year) for all countries that had a civil war onset. See Fearon and Laitin, replication dataset.
14
events: who, to whom and where, or as Lenin might ask, Kto? Kogo? Gde? We defer an
analysis of the joint probabilities – who, to whom – to section IV.
As an initial way to summarize the characteristics of the countries of those
involved in terrorism, Table 3 assigns country-level attributes to each terrorist incident,
and computes the average across incidents, using the country of origin, country of the
primary target, or country where the event occurred to match on the country attributes.
For example, in column (2) we merged on data based on the country of origin, and
computed the mean across incidents. This amounts to a weighted average of
characteristics -- such as GDP per capita, illiteracy, ethnic fractionalization, and political
and civil rights -- across countries, where the weights are the number of international
terrorist incidents attributed to citizens of each country. Column (3) presents the same
statistics excluding incidents originating in India and Colombia from the sample.
Column (4) presents results based on the target country of the attack, and column (5)
based on the country where the attack occurred. For a point of reference, column (1)
presents the weighted mean of the country attributes, using as weights the population of
the country.
To more easily spot the discrepancies between terrorists and the world population,
Figure 1 presents a “radar chart” depicting the ratio of the mean of the indicated variable
for terrorists based on their country of origin and the weighted-average person in the
world. Figure 2 presents the analogous ratio of the target country to the weighted-
average world population. If the terrorists come from countries that are on average no
different than the world population, the ratio would be one and the point would lie on the
unit circle in Figure 1. If the country characteristics differ between the terrorists’ home
15

and the world population, then the ratio will exceed one or be less than one. These radar
plots are just meant to be descriptive: they clearly have analytical problems. For
example, for some variables a ratio of 1.2 may indicate a more significant divergence
than a ratio of 2.4 for other variables. More importantly, the charts and table break down
the population on an endogenous variable – by conditioning on whether the individual
was a terrorist, rather than on the country characteristic – so in a real sense these charts
are equivalent to sampling on the dependent variable. Nevertheless, they still provide a
vivid description of how terrorists differ from the world population, or of how the targets
of terrorism differ from the world population, in terms of country-level characteristics.
Compared to the world population, the results indicate that terrorists are more
likely to come from low-income countries with low GDP growth (from 1990 to 2000).
The pattern is not monotonic in terms of income, however, as terrorists are over
represented among the poorest quartile of countries and the third quartile of countries.15
The terrorists are also more likely to come from countries’ characterized by anocracy and
political instability.16 Insofar as targets are concerned, the targeted individuals tend to
live in wealthier countries that are more stable, less anocratic, and more democratic than
the average person in the world. As for country of occurrence, it is a profile far closer to
that of the perpetrator’s country – poor, high illiteracy, and high infant mortality. In many
cases (Kashmir and Jammu, Bosnia, Kosovo, West Bank and Gaza, and Afghanistan), the
attacks occur against armies or army installations of what are perceived to be foreign or
15 The quartile GDP per capita cutoffs were not weighted by population. 16 Based on the coding of Fearon and Laitin (2003), using the Polity IV dataset, instability is a dummy variable that takes a value of 1 if the country had a three-or-greater change on the regime index in any of the three years prior to the country-year in question. Anocracy is another dummy variable that takes a value of 1 if the regime index for that year is between a -5 and a +5, on an index that spans from -10 (full autocracy) to +10 (full democracy).
16

“occupying” powers. When in future work the attacks against American installations in
Iraq in 2003 are analyzed, this pattern will be reinforced.
Table 4 and Figures 3 and 4 present the same information using data on suicide
attacks. (Recall that the suicide attacks span a longer time period. Nevertheless, for
comparison we have attached the same country characteristics used in Table 3.)17 The
figures for perpetrators and targets look remarkably similar because the target of most of
the suicide attacks resided in the same country as the perpetrator. The suicide attacks
tend to involve (both as targets and origins) people from wealthier countries than the
world average. In addition, people from stable, democratic countries are more likely to
be represented in suicide attacks, either as target or perpetrator, than the average person
in the world. Notice also that because Sri Lanka is primarily a Buddhist country,
Buddhism is over represented among both the country of perpetrators and targets.
Table 5 summarizes the data in a more conventional way, broken down by
country characteristics rather than the outcome variable. Specifically, using origin or
target countries as the unit of analysis, we computed the average number of terrorists per
person (in either the origin country or target country) by the indicated country
characteristic. In addition, we report the p-value from a chi-square test of the null
hypothesis that the characteristics are unrelated to participation in terrorism.18 These
results differ from the results underlying the radar charts in two important respects: first,
17 The dataset spans the period from 1980 to 2002, with the most recent suicide attack on November 22, 2002. 18 These tests require a word of explanation. Because the modal country has 0 events, a conventional test of the equivalence of the means is inappropriate. Consequently, we computed each test by estimating a separate Negative Binomial regression, where the dependent variable was the number of incidents attributable to each country and the independent variables were dummies for the indicated categories and log population, constraining the coefficient on log population to equal 1. Because the dependent variable in the Negative Binomial should be interpreted as the log of the number of events, these results do not correspond directly to the means reported in the table, but they do provide a valid test of the statistical significance of the characteristics.
17

it conditions on the explanatory variable; second, the unit of observation is a country,
rather than a person.
The results often give a different picture than the radar charts. Consider first
results for all international terrorist events by country of origin. A country’s GDP per
capita is unrelated to the number of terrorists originating from that country. A country’s
degree of civil liberties, by contrast, is associated with participation in terrorism:
countries with a lower level of civil liberties have a higher participation rate in terrorism,
on average. Thus, in contrast to the radar plots, low civil liberties are associated with
greater participation in terrorism, while economic factors are unrelated. If one is looking
for country characteristics that are causal determinants of terrorism, we think the Table 5
results are more relevant, although it is of course possible that the associations revealed
in the table do not represent causal relationships.
When the results are tabulated by the target country’s characteristics, a different
picture emerges. In column (2) we see that countries with higher GDP per capita are
more likely to be the target of terrorism (on a per capita basis), and civil liberties in the
target country do not bear a monotonic relationship with terrorism. In terms of political
rights, the contrast is even greater: countries that afford a low level of political rights are
more likely to be the springboards of terrorism and less likely to be the targets of
terrorism. A country’s terrain, ethnolinguistic fractionalization, religious
fractionalization, and political stability are all unrelated to the incidence of terrorism per
capita, either as a target or origin.
The right-hand part of Table 5 presents corresponding results for suicide attacks.
Because suicide attacks originated in only ten countries and targeted only 14 countries –
18

in a sample of 159 countries -- these results should be taken with a large grain of salt, and
the results by origin and target hardly differ.19 Nevertheless, the results provide a formal
comparison of what is often compared informally. These results clearly indicate that
wealthy countries are involved in suicide attacks, as either origins or targets. That there
are no countries in the bottom quartile of countries for GDP per capita shows powerfully
that (as argued by Berman and Laitin, 2005) suicide attacks are employed where the
standard conditions for insurgency (as adumbrated by Fearon and Laitin 2003) are
disfavored. By contrast, the origins of terrorism are more randomly distributed across the
quartiles of GDP per capita. This suggests that terrorism as well differs from standard
insurgency, though less so than suicide attacks. Countries that are not likely targets of
insurgencies (e.g., high-income countries) are likely targets of terrorism, however. The
right side of Table 5 shows as well that fast growing, stable countries are more likely to
be the origin and target of suicide attacks.
The influence of Sri Lanka, a majority Buddhist country, is again evidence on the
results by religion. Similarly the influence of Israel, a majority Jewish country (classified
here in Mixed/Other), has a high proportion of both origin and target. But as with Sri
Lanka, the perpetrators are not of the same religion as the majority in the country.
Religious fractionalization in a country, however, is unrelated to the incidence of suicide
attacks, although, as noted, a high proportion of the suicide attacks involve perpetrators
and victims from different religions.
19 In addition, the chi-square tests in some instances are very sensitive. For example, the differences by civil liberties are very similar for origin and target countries, yet the chi-square tests are very different.
19

Regression Models
We extended the bivariate comparisons in Table 5 by estimating a series of
Negative Binomial regression models, simultaneously controlling for several possible
determinants of terrorism. A sampling of our results is reported in Table 6. The
dependent variable is the number of international terrorist events traceable to each
country. The unit of observation is the country of origin in columns 1-2, the target
country in columns 3-4, and the country where the event took place in columns 5-6. The
explanatory variables in the first model are just log GDP per capita and log population; in
the second model we also include per capita GDP growth, the Freedom House Index of
Civil Liberties, and the percent of the population belonging to each of the world’s four
largest religions. The explanatory variables correspond to the country that defines the
unit of observation. We selected the variables shown in the table because, for the most
part, other variables that we included in the model were insignificant, or because there is
particular interest in the relationship between these variables and terrorism. (We did not
estimate corresponding models for suicide attacks because so few countries were
involved in these attacks.)
The results have no surprises compared to the bivariate comparisons in Table 5.
Quite sensibly, larger countries (in terms of population) are associated with more
terrorism, at the origin, target, and place unit of analysis. At either the origin or place-of-
occurrence levels, GDP per capita is insignificantly related to terrorism, but it is
positively related to terrorism at the target-country level. A paucity of civil liberties, by
contrast, is associated with more terrorism at the origin country and at the country where
the event is perpetrated, but not at the target country level. In this sense, the results
20

suggest that the genesis of terrorism involves political factors, while the targets are more
economic in nature. The disparate findings based on country of origin and target country
illustrate the importance of aggregating separately by origin and target.
We cannot reject that the shares affiliated with the various religions jointly have
no effect on terrorism, at any of the levels of analyses. No religion appears to have a
monopoly on terrorism; countries with very different religious faiths have all experienced
terrorism, as targets, origins and hosts.
An econometric issue of relevance for the estimates in Table 5 is whether the
Negative Binomial specification is appropriate. In particular, with so many countries
having a value of zero for the number of terrorist attacks (either in the origin or target
equation), one could wonder whether the Negative Binomial specification fits the data
well. An alternative specification is the zero-inflated negative binomial model, which
allows for a different process to determine countries with a zero value of the dependent
variable. Indeed, a Vuong test of the Negative Binomial versus the more general zero-
inflated negative binomial model raises questions about the specification: the p-value for
the test is 0.13 in column 1 and .002 in column 2. It is reassuring, however, that if we
dichotomize the dependent variable by setting it equal to one if the country was an origin
of international terrorism and zero if not, and then estimate a logit model, our main
conclusions regarding income and income growth are unaffected. In particular, if we
estimate such a model using the explanatory variables in column 2 of Table 5, both GDP
per capita and GDP growth have statistically insignificant and small effects. The civil
liberties variable, however, is also statistically insignificant in this logit specification.
21

IV. Kto, Kogo?: Characteristics of Origins and Targets
Our last set of analyses involves the matrix of who to whom: that is, we model the
cross tabulation of the origins and targets of terrorism. Each country is a potential origin
country for perpetrators who can attack any country in the world. Because we have a
maximum of 159 countries in our sample, and, without further structure, the full Kto,
kogo? analysis would involve a matrix with 159x159 = 25,122 cells, most of which
would be empty, we need to simplify the analysis. Here we focus on two important
dimensions of origin and target countries: their income and civil liberties.
First consider income. We divided the countries into income quartiles based on
GDP per capita. Specifically, we assigned all possible country pairs to cells based on
their GDP per capita, as potential targets and potential origins. Thus, instead of a
159x159 matrix, our data are reduced to a 4x4 matrix. In each cell, we tallied the number
of incidents perpetrated by people from a country in one income bracket against people
from a country of another income bracket. For every entry, we normalized the counts by
dividing by the geometric mean of the total population across countries in the two income
brackets. Note that this differs subtly from our analysis in Table 5 and 6, where we
weighted countries equally; here we weight countries by a combination of their size and
their potential target’s size. Conceptually, this formulation makes sense if the
characteristics of the countries (in this case, income) are relevant, but the borders are not
relevant. Mathematically, an entry in Table 7, Pij, is given by:
Pij = Cij / (Ni * Nj)^.5
where Cij is the number of incidents perpetrated by people from countries with an income
level falling in quartile “i” against people in countries with income levels falling in
22

quartile “j”, and Ni and Nj represent the aggregate number of people (in millions) in the
origin and target quartiles, respectively.20
Table 8 provides the analogous matrix where the countries were cross-categorized
into 3x3 cells based on their civil liberties index. That is, i refers to the civil liberties of
the originating countries (low, medium and high) and j refers to the civil liberties
available in the target countries (low, medium and high). Again, we pool all countries
that fall in the same civil liberties category, and normalize by the geometric mean of the
total population in each category.
Despite the (somewhat) different weighting and the added feature of cross-
classification, the results are similar to what we observed from Table 6. Terrorists from
most countries are particularly likely to strike at others in countries with about the same
income level, because a large number of the attacks target individuals in the country of
origin. For this reason, the diagonals of Figure 7 have large entries. But terrorists who
do not strike against targets in their own income brackets are much more likely to strike
against targets from higher-income countries than from lower-income countries. Indeed,
for terrorists from countries in the middle-income quartiles, targets in the highest-income
quartile are more likely to be affected by their terrorist acts than are targets from
countries in their own income quartile.
Countries with a high degree of civil liberties are unlikely to be origin countries
for terrorist acts. The lower- and (especially) middle-level countries in terms of civil
liberties are more likely to be origin countries for terrorism. Compared to Table 5, the
increase in source countries from those with a middle-level of civil liberties is a result of
20 The reason for the multiplicative formulation of population is that if terrorism were just random – i.e., Brownian motion, ignoring distance – then the number of events involving peoples from quartiles i and j would be proportional to the product of their populations.
23

the new aggregation (by countries within a civil-liberties category) and the different
scaling. Interestingly, countries with a high level of civil liberties appear to be somewhat
more likely a target in these tabulations.
V. Conclusion
Nearly six months after he articulated a naïve economic explanation for terrorism
and on the first anniversary of the al-Qa’ida attacks on American soil, President Bush
articulated a more nuanced view, closer to what the data reported in this paper show. He
wrote the following in The New York Times (Op-Ed, September 11, 2002): “Poverty does
not transform poor people into terrorists and murderers. Yet poverty, corruption and
repression are a toxic combination in many societies, leading to weak governments that
are unable to enforce order or patrol their borders and are vulnerable to terrorist networks
and drug cartels.”
The most salient patterns in the data on global terrorism that we presented suggest
that, at the country level, the sources of international terrorism have more to do with
repression than with poverty. The regression analysis showed that neither country GDP
nor illiteracy is a good predictor of terrorist origins. Past work suggests that at the
individual level, higher economic and social status lead to greater identification with
terrorist goals. Therefore, the well-to-do represent a fount of supply. On the demand side,
organizations (especially for attacks that require planning and coordination, with low
chances for defection) will want to recruit disciplined cadres who will more likely
succeed. Thus terrorist perpetrators are not necessarily poor. But those who are repressed
24
politically tend to terrorize the rich, giving international terrorist events the feel of
economic warfare.
Suicide attacks reveal much less on the interstate level. To be sure, in ten of the
twenty-three cases where the targets were of a different country than the perpetrators, the
targets were Americans, suggesting that when they do go international, suicide attackers
go after the rich and the powerful. (India is the only target country suffering from an
international suicide attack with a GDP/cap lower than the median, and this was a direct
assault on its Prime Minister). To the extent that we can eke out patterns from the
marginals (where perpetrator and target are different) in the suicide dataset, we see as
with international terrorism, the origins are more likely to be in countries that deny civil
liberties as compared to targets.
Several extensions of this research merit consideration. First, we need to dock the
suicide data with that of international terrorism to have a general terrorism dataset. We
then can construct a 150 x 150 matrix by country of origin and target, yielding a much
more precise picture of who terrorizes whom. We plan as well to link our findings with
systematic data on countries that sponsor and/or harbor terrorist organizations. Finally,
we have noted a relationship of political “occupation” and being a target for terrorist
attacks. This relationship merits further scrutiny.
To sum up, our data analysis up till now confirms the lesson that President Bush
has already learned, namely that the economic foundations of terrorism are at best only
indirect. More specifically, we have shown that on the margin, the kto are those who are
politically repressed and the kogo are those who are wealthy. The kto is political; the
kogo economic.
25

References
Abadie, Alberto. 2004. "Poverty, Political Freedom, and the Roots of Terrorism," NBER Working Paper 10859, Cambridge, MA. Atran, Scott. 2003. “Genesis of Suicide Terrorism,” Science 299:1534-1539. Azam, Jean-Paul. 2003. “Suicide-Bombing as Inter-Generational Investment,” forthcoming in Public Choice. Berman, Eli and David D. Laitin. 2005. “Hard Targets: Theory and Evidence on Suicide Attacks.” National Bureau of Economic Research. Working Paper 11740. Cambridge, MA. Berrebi, Claude. 2003. “Evidence About the Link Between Education, Poverty and Terrorism Among Palestinians,” mimeo. Princeton University. Berrebi, Claude and Esteban Klor. 2003. “On Terrorism and Electoral Outcomes: Theory and Evidence from the Israeli-Palestinian Conflict,” mimeo. Princeton University. Bueno de Mesquita, Ethan, “The Quality of Terror,” mimeo., Dept. of Political Science, Washington University, St. Louis, MO, 2003. Burgoon, Brian. 2006. “On Welfare and Terror: Social Welfare Policies and Political-Economic Roots of Terrorism.” Journal of Conflict Resolution, 4, vol. 50, pp. 176 - 203. Bush, George W. 2002. “Securing Freedom’s Triumph” The New York Times. September 11. Bush, George, W. 2002. “Remarks by the President at United Nations Financing for Development Conference, Cintermex Convention Center, Monterrey, Mexico. March 22. <http://www.whitehouse.gov/news/releases/2002/03/20020322-1.html>. Fearon, James and David Laitin. 2003. “Ethnicity, Insurgency, and Civil War,” American Political Science Review 97(1): 75-90. Gupta, Dipak and Kusum Mudra, “Suicide Bombing as a Strategic Instrument of Protest: An Empirical Investigation,” Mimeo., San Diego State University, 2003. Hassan, Nasra. 2001. “An Arsenal of Believers,” The New Yorker, November 19, pp. 36-41. Hudson, Rex A.. 1999. “The Sociology and Psychology of Terrorism: Who Becomes a Terrorist and Why?” Report prepared under Interagency Agreement by the Federal Research Division, Library of Congress, Washington, DC.
26

Krueger, Alan and Jitka Maleckova. 2003. “Education, Poverty, and Terrorism: Is There a Causal Connection?” Forthcoming in Journal of Economic Perspectives, 2003. Kydd, Andrew and Barbara Walter. 2002. “Sabotaging the Peace: The Politics of Extremist Violence,” International Organization 56 (2), Spring, pp. 263-96. Li, Quan and Drew Schaub. 2004. “Economic Globalization and Transnational Terrorism: A Pooled Time-Series Analysis,” Journal of Conflict Resolution, 4, vol. 48, pp. 230 - 258. Pape, Robert A. (2003) “The Strategic Logic of Suicide Terrorism” American Political Science Review 97(3): 343-61. Piazza, James A. 2003. “Rooted in Poverty?: Terrorism, Poor Economic Development and Social Change,” mimeo., Meredith College, Raleigh, North Carolina. Russell, Charles and Bowman Miller. 1983. “Profile of a Terrorist,” reprinted in Perspectives on Terrorism, Wilmington, Delaware: Scholarly Resources Inc., pp. 45-60. Stern, Jessica. 2003. Terror in the Name of God: Why Religious Militants Kill. New York: Ecco-HarperCollins. Taylor, Maxwell. The Terrorist. London: Brassey’s Defence Publishers, 1988. Wintrobe, Ronald. Rational Extremism. Cambridge: Cambridge University Press, 2006.
27

Table 1: Number of Terrorist Events Originating from Each Country and Events Per Million People
Country Events Events/MilSomalia 4 0.489South Africa 4 0.097Sudan 4 0.133U.K. 4 0.067Ecuador 5 0.410Iran 5 0.081Italy 5 0.087Jordan 5 1.088Spain 5 0.127Algeria 6 0.203Ethiopia 7 0.114Rwanda 7 0.864Sri Lanka 7 0.372Yugoslavia 7 0.660Georgia 9 1.654Saudi Arabia 9 0.457Burundi 10 1.527Uganda 10 0.476Greece 11 1.048Indonesia 11 0.054Tajikistan 11 1.795Russia 15 0.102Philippines 18 0.247Sierra Leone 21 4.347Pakistan 24 0.182Turkey 24 0.379Nigeria 26 0.215Israel 30 5.031Angola 41 3.306Yemen 49 2.952Colombia 97 2.377India 227 0.232
Country Events Events/MilAzerbaijan 1 0.126Belgium 1 0.098Cuba 1 0.090Germany 1 0.012Guinea 1 0.141Morocco 1 0.036Nicaragua 1 0.208Senegal 1 0.111Thailand 1 0.017Tunisia 1 0.107United Arab E. 1 0.367Zambia 1 0.103Bahrain 2 3.110Bangladesh 2 0.016Chad 2 0.275Chile 2 0.135El Salvador 2 0.331France 2 0.034Kuwait 2 1.072Liberia 2 0.675Macedonia 2 0.993Myanmar 2 0.043Peru 2 0.081Tanzania 2 0.062Uzbekistan 2 0.083Drc 3 0.062Egypt 3 0.049Iraq 3 0.135Afghanistan 4 0.159Bosnia 4 1.062Cambodia 4 0.348Lebanon 4 0.950
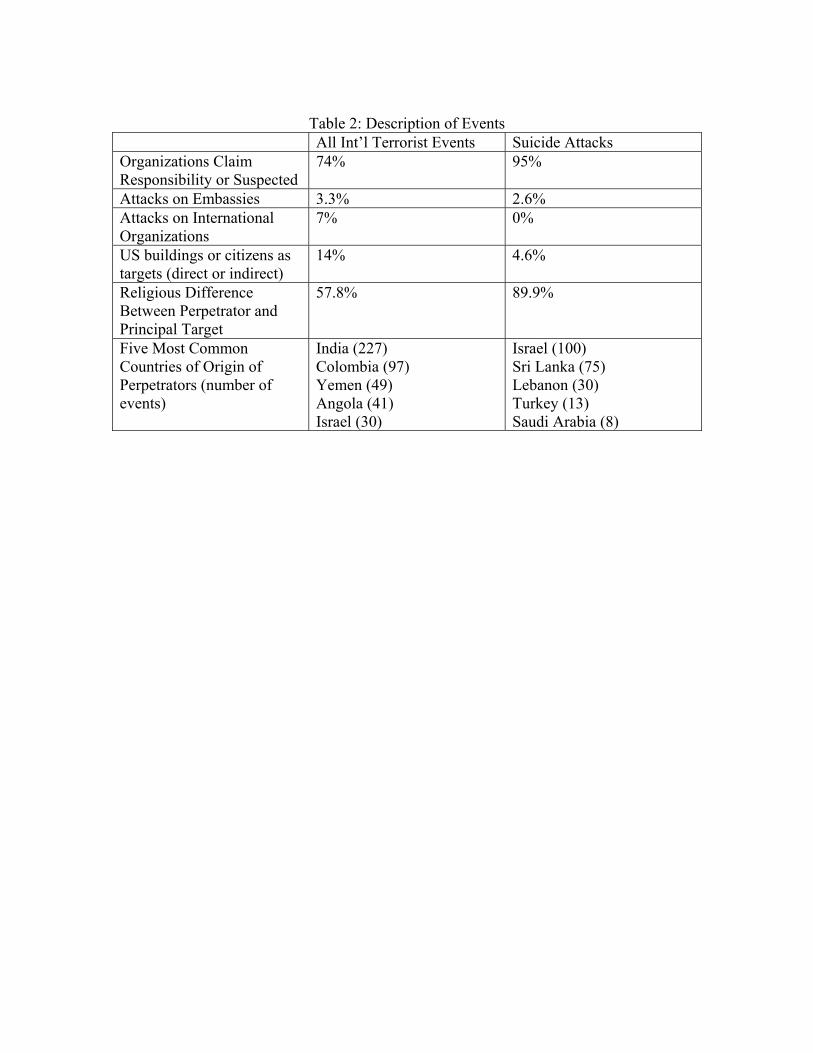
Table 2: Description of Events
All Int’l Terrorist Events Suicide Attacks Organizations Claim Responsibility or Suspected
74% 95%
Attacks on Embassies 3.3% 2.6% Attacks on International Organizations
7% 0%
US buildings or citizens as targets (direct or indirect)
14% 4.6%
Religious Difference Between Perpetrator and Principal Target
57.8% 89.9%
Five Most Common Countries of Origin of Perpetrators (number of events)
India (227) Colombia (97) Yemen (49) Angola (41) Israel (30)
Israel (100) Sri Lanka (75) Lebanon (30) Turkey (13) Saudi Arabia (8)

Table 3: All Events: Sample Means, Depending on Origin, Target or PlacePop-Wtd Perpetrator's Origin Targeted Country
Characteristic World Origin w/o India Countries of OccurrenceMean Countries & Colombia
GDP per capita ('97-01) 5,577 2,385 3,404 10,640 3,021Poor 0.32 0.53 0.40 0.39 0.53Lower Middle 0.37 0.18 0.30 0.08 0.16Upper Middle 0.15 0.20 0.14 0.15 0.21Rich 0.17 0.09 0.16 0.38 0.10GDP Growth '90-00 0.46 0.16 0.03 0.25 0.17Male Illiteracy Rate 0.17 0.22 0.20 0.16 0.22Female Illiteracy Rate 0.30 0.38 0.35 0.27 0.38Total Illiteracy Rate 0.23 0.29 0.25 0.21 0.29Infant Mortality (/1000) 43.99 61.57 65.59 40.94 61.54Population (Mil.) 481 315 43 378 321Freedom Hse Low Civil Rights 4.34 4.37 4.88 3.12 4.18Freedom Hse Low Pol Rights 4.04 3.64 4.49 2.25 3.45Freedom House Index 2.06 2.02 2.28 1.49 1.93Democ. Index (-10 to +10) 2.16 3.94 0.73 7.48 4.35Instability Dummy 0.07 0.13 0.23 0.06 0.12Anocracy 0.13 0.28 0.49 0.11 0.28Ethnic/Linguistic Fractionalization 0.46 0.62 0.49 0.57 0.63Ethnic Fractionalization 76.79 63.93 60.51 71.93 65.20Religious Fractionalizatoin 0.29 0.33 0.38 0.36 0.35Proportion Muslim 0.22 0.32 0.48 0.16 0.29Proportion Christian 0.30 0.31 0.33 0.43 0.35Proportion Budhist 0.07 0.01 0.03 0.02 0.02Proportion Hindu 0.15 0.24 0.00 0.27 0.24Oil Exporter (> 1/3 exp rev) 0.09 0.20 0.35 0.08 0.20Pct. Mountainous Terrain 21.95 22.86 24.80 18.29 21.64 Max. Sample Size 159 781 457 709 769
Note: 7% of events targeted international institutions.

Ratio of means Reference Line (Unit Circle)
Figure 1: Radar Plot for Origin Countries of Terrorists Relative to All Countries
0
1
2
3
4
GDP per capita
PoorLower Middle
Upper Middle
Rich
GDP Growth
Male Illiteracy Rate
Female Illiteracy Rate
Total Illiteracy Rate
Infant Mortality
Population (Mil.)
Low Civil RightsLow Pol Rights
Freedom House Index
Democ. Index Instability Dummy
Anocracy
Ethnic/Linguistic Frac
Ethnic Fractionalization
Religious Fractionalization
Muslim
Christian
Budhist
Hindu
Oil ExporterPct. Mountainous Terrain

Ratio of means Reference Line (Unit Circle)
Figure 2: Radar Plot of Targeted Countries of Terrorists relative to All Countries
0
1
2
3
4
GDP per capita
PoorLower Middle
Upper Middle
Rich
GDP Growth
Male Illiteracy Rate
Female Illiteracy Rate
Total Illiteracy Rate
Infant Mortality
Population (Mil.)
Low Civil RightsLow Pol Rights
Freedom House Index
Democ. Index Instability Dummy
Anocracy
Ethnic/Linguistic Frac
Ethnic Fractionalization
Religious Fractionalization
Muslim
Christian
Budhist
Hindu
Oil ExporterPct. Mountainous Terrain

Table 4: Suicides: Sample Means, Depending on Origin, Target or PlacePop-Wtd Perpetrator's Targeted Country
Characteristic World Origin Countries of OccurrenceMean Countries
GDP per capita ('97-01) 5,577 8125 9875 8,316Poor 0.32 0.01 0.02 0.03Lower Middle 0.37 0.33 0.33 0.33Upper Middle 0.15 0.20 0.14 0.19Rich 0.17 0.46 0.51 0.45GDP Growth '90-00 0.46 0.35 0.33 0.35Male Illiteracy Rate 0.17 0.06 0.06 0.07Female Illiteracy Rate 0.30 0.14 0.13 0.14Total Illiteracy Rate 0.23 0.10 0.09 0.10Infant Mortality (/1000) 43.99 15.50 14.76 16.95Population (Mil.) 481 34.90 50.70 40Freedom Hse Low Civil Rights 4.34 3.88 3.56 3.81Freedom Hse Low Pol Rights 4.04 2.76 2.32 2.68Freedom House Index 2.06 1.74 1.58 1.71Democ. Index (-10 - +10) 2.16 6.39 7.11 6.46Instability Dummy 0.07 0.00 0.01 0.02Anocracy 0.13 0.39 0.37 0.40Ethnic/Linguistic Fractionalization 0.46 0.34 0.36 0.36Ethnic Fractionalization 76.79 60.18 57.22 58.54Religious Fractionalization 0.29 0.36 0.37 0.37Proportion Muslim 0.22 0.36 0.31 0.35Proportion Christian 0.30 0.10 0.13 0.11Proportion Budhist 0.07 0.22 0.22 0.22Proportion Hindu 0.15 0.06 0.06 0.06Oil Exporter (> 1/3 exp rev) 0.09 0.06 0.03 0.05Pct. Mountainous Terrain 21.95 15.25 12.94 14.90 Max. Sample Size 159 236 236 236

Figure 3: Radar Plot: Origin Countries of Suicide Terrorists / All Countries
0
1
2
3
4
GDP per capita
PoorLower Middle
Upper Middle
Rich
GDP Growth
Male Illiteracy Rate
Female Illiteracy Rate
Total Illiteracy Rate
Infant Mortality
Population (Mil.)
Low Civil RightsLow Pol Rights
Freedom House Index
Democ. Index Instability Dummy
Anocracy
Ethnic/Linguistic Frac
Ethnic Fractionalization
Religious Fractionalization
Muslim
Christian
Budhist
Hindu
Oil ExporterPct. Mountainous Terrain
Ratio of means Reference Line
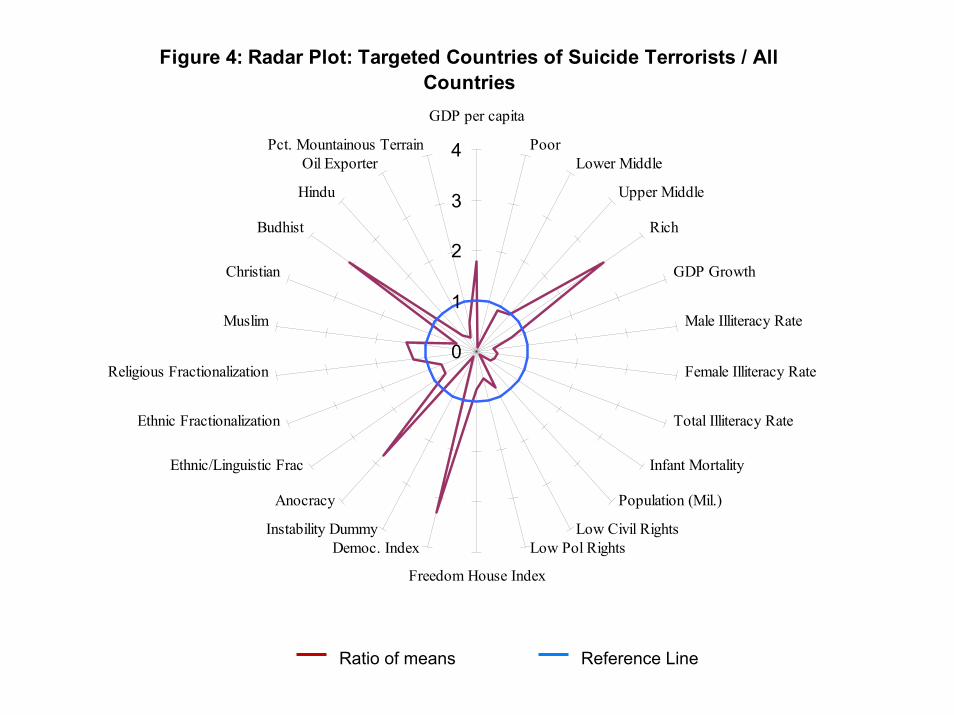
Figure 4: Radar Plot: Targeted Countries of Suicide Terrorists / All Countries
0
1
2
3
4
GDP per capita
PoorLower Middle
Upper Middle
Rich
GDP Growth
Male Illiteracy Rate
Female Illiteracy Rate
Total Illiteracy Rate
Infant Mortality
Population (Mil.)
Low Civil RightsLow Pol Rights
Freedom House Index
Democ. Index Instability Dummy
Anocracy
Ethnic/Linguistic Frac
Ethnic Fractionalization
Religious Fractionalization
Muslim
Christian
Budhist
Hindu
Oil ExporterPct. Mountainous Terrain
Ratio of means Reference Line
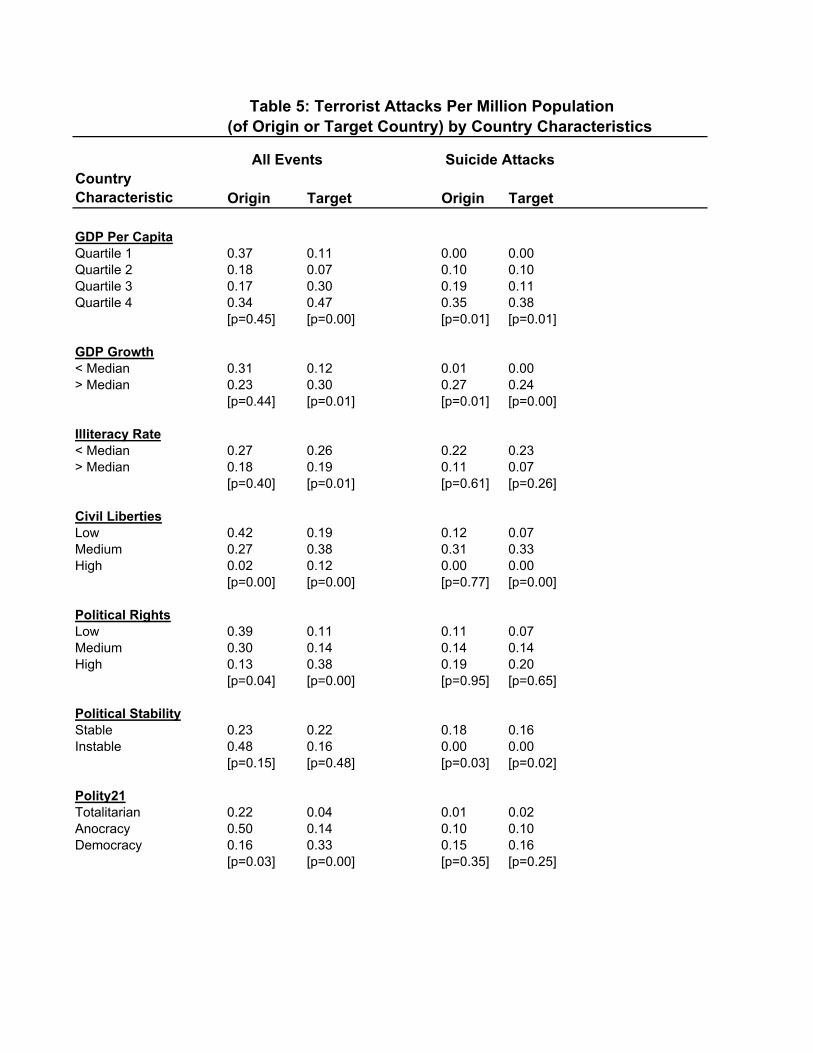
Table 5: Terrorist Attacks Per Million Population(of Origin or Target Country) by Country Characteristics
All Events Suicide AttacksCountry Characteristic Origin Target Origin Target
GDP Per CapitaQuartile 1 0.37 0.11 0.00 0.00Quartile 2 0.18 0.07 0.10 0.10Quartile 3 0.17 0.30 0.19 0.11Quartile 4 0.34 0.47 0.35 0.38
[p=0.45] [p=0.00] [p=0.01] [p=0.01]
GDP Growth< Median 0.31 0.12 0.01 0.00> Median 0.23 0.30 0.27 0.24
[p=0.44] [p=0.01] [p=0.01] [p=0.00]
Illiteracy Rate< Median 0.27 0.26 0.22 0.23> Median 0.18 0.19 0.11 0.07
[p=0.40] [p=0.01] [p=0.61] [p=0.26]
Civil LibertiesLow 0.42 0.19 0.12 0.07Medium 0.27 0.38 0.31 0.33High 0.02 0.12 0.00 0.00
[p=0.00] [p=0.00] [p=0.77] [p=0.00]
Political RightsLow 0.39 0.11 0.11 0.07Medium 0.30 0.14 0.14 0.14High 0.13 0.38 0.19 0.20
[p=0.04] [p=0.00] [p=0.95] [p=0.65]
Political StabilityStable 0.23 0.22 0.18 0.16Instable 0.48 0.16 0.00 0.00
[p=0.15] [p=0.48] [p=0.03] [p=0.02]
Polity21Totalitarian 0.22 0.04 0.01 0.02Anocracy 0.50 0.14 0.10 0.10Democracy 0.16 0.33 0.15 0.16
[p=0.03] [p=0.00] [p=0.35] [p=0.25]

Predominant ReligionMuslim 0.44 0.14 0.18 0.11Christian 0.21 0.28 0.00 0.00Buddhist 0.09 0.05 0.44 0.44Hindu 0.06 0.06 0.00 0.00Mixed/Other 0.31 0.32 0.61 0.65
[p=0.26] [p=0.01] [p=0.00] [p=0.00]
Mountainous Terrain< Median 0.27 0.19 0.23 0.25> Median 0.35 0.29 0.12 0.06
[p=0.41] [p=0.60] [p=0.61] [p=0.18]
< Median 0.22 0.21 0.30 0.26> Median 0.31 0.23 0.00 0.01
[p=0.47] [p=0.52] [p=0.00] [p=0.00]
< Median 0.23 0.23 0.17 0.17> Median 0.31 0.23 0.15 0.12
[p=0.52] [p=0.84] [p=0.96] [p=0.72]
Notes: Sample sizes range from 135 to 159 depending on characteristic.
The brackets report the p-value for an chi-square test of the hypothesis that the groups have equal effects from a Negative Binomial regression of the number of events on indicators for the specified groups and log population, constraining the coefficient on population to equal 1.
Ethnolinguistic Fractionalization
Religious Fractionalization

Table 6: Negative Binomial Regressions with Country-Level Data-Unit of Observation is Country of Origin of Terrorists, Prime Target of Terrorists, or Country Where the Event Occurred Dependent Variable: Number of International Terrorist Events Associated with Each Country, 1997-2002. _______________________________________________________________________________________
Terrorists’ Origin Prime Target Country Where Country Country Occurred___
Explanatory Variable (1) (2) (3) (4) (5) (6) _________________________________________________________________________________________ Intercept -9.65 -19.39 -13.97 -14.98 -8.28 -13.03 (2.83) (3.72) (1.56) (2.08) (2.27) (3.01) Log Population 0.74* 0.94* 0.76* 0.73* 0.64* 0.70* (0.16) (0.17) (0.08) (0.10) (0.12) (0.14) Log GDP per capita -0.17 0.23 0.31* 0.43 * -0.13 0.12 (0.12) (0.20) (0.08) (0.14) (0.11) (0.19) GDP Growth --- -0.42 --- -0.44 --- -0.05 (0.72) (0.58) 0.68 Civil Liberties Index --- 0.80* --- 0.17 --- 0.50* [1 to 7 (low civ lib)] (0.27) (0.16) (0.25) Proportion Muslim --- -0.35 --- -0.45 --- -0.52 (0.76) (0.50) (0.70) Proportion Buddhist --- -1.25 --- -1.11 --- 1.42 (1.16) (0.83) (1.02) Proportion Hindu --- 0.32 --- 1.34 --- 0.25 (1.59) (0.98) (1.36) Proportion Other --- 1.52 --- 0.88 --- 0.87 (0.91) (0.67) (0.90) P-Value for 3 religions --- 0.76 --- 0.23 --- 0.55 jointly equal 0 Pseudo-R-Square 0.05 0.09 0.13 0.14 0.05 0.07 Sample Size 150 138 150 138 150 138 __________________________________________________________________________________________
Standard errors in parentheses.

Table 7: Target Country's GDP per capita Quartile
Origin Ctry 1 2 3 4GDP Qrtl.
1 0.145 0.001 0.008 0.0622 0.003 0.022 0.015 0.0293 0.003 0.001 0.084 0.0884 0.002 0.002 0.002 0.065
* Entries are number incidents of international terrorism for the cell divided by the geometric mean of population (in millions) in the origin and target country quartiles.
Entries are number of incidents of international terrorism for the cell divided by the es
Table 8: Target Country Civil LibertiesOrigin Ctry Low Medium HighLow 0.036 0.018 0.073Medium 0.004 0.154 0.060High 0.001 0.001 0.021
*geometric mean of population (in millions) in the origin and target country civil liberticategories.