kuigmek: one who watches the river
TRANSCRIPT
Page 1
Please Note:
Observers, don’t forget to send in
your Freeze-up Forms! These
can now be completed on the
web at https://www.weather.gov/
aprfc/freezeForm, or let us know
if you need a paper copy. Also
note that the web form can be
submitted multiple times if you
want to submit the timing of
‘unsafe’, ‘freeze-up’, and other
events separately.
In This Issue:
Buckland Breakup Flood
August Storms in Juneau
Staff changes: Intro to Jess Sanow, Arleen and Ted retire, Jessica Cherry moves jobs Seward Area Field Work
New Gage at Emmonak
The Last Measurement of JT Evans: RIP
CoCoRaHS and Citizen Science
Water year review and freeze-up conditions
Drone Projects
Pacific Sector: March Floods
Alaska-Pacific River Forecast Center 6930 Sand Lake Road Anchorage, AK 99502-1845 907-266-5160 1-800-847-1739 http://weather.gov/aprfc [email protected]
Newsletter of the Alaska-Pacific River Forecast Center and Alaska’s NWS Service Hydrologists
Kuigmek: one who watches the river October 2021
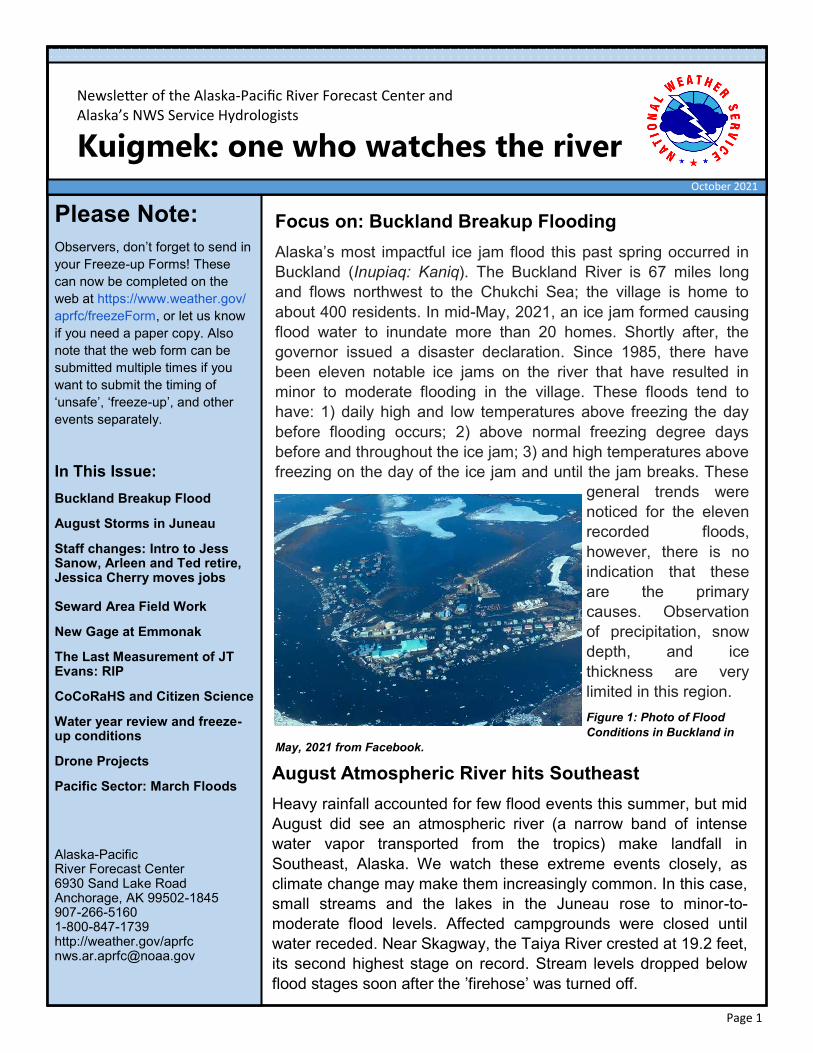
Focus on: Buckland Breakup Flooding
Alaska’s most impactful ice jam flood this past spring occurred in
Buckland (Inupiaq: Kaniq). The Buckland River is 67 miles long
and flows northwest to the Chukchi Sea; the village is home to
about 400 residents. In mid-May, 2021, an ice jam formed causing
flood water to inundate more than 20 homes. Shortly after, the
governor issued a disaster declaration. Since 1985, there have
been eleven notable ice jams on the river that have resulted in
minor to moderate flooding in the village. These floods tend to
have: 1) daily high and low temperatures above freezing the day
before flooding occurs; 2) above normal freezing degree days
before and throughout the ice jam; 3) and high temperatures above
freezing on the day of the ice jam and until the jam breaks. These
general trends were
noticed for the eleven
recorded floods,
however, there is no
indication that these
are the primary
causes. Observation
of precipitation, snow
depth, and ice
thickness are very
limited in this region.
Figure 1: Photo of Flood
Conditions in Buckland in
May, 2021 from Facebook.
August Atmospheric River hits Southeast
Heavy rainfall accounted for few flood events this summer, but mid
August did see an atmospheric river (a narrow band of intense
water vapor transported from the tropics) make landfall in
Southeast, Alaska. We watch these extreme events closely, as
climate change may make them increasingly common. In this case,
small streams and the lakes in the Juneau rose to minor-to-
moderate flood levels. Affected campgrounds were closed until
water receded. Near Skagway, the Taiya River crested at 19.2 feet,
its second highest stage on record. Stream levels dropped below
flood stages soon after the ’firehose’ was turned off.
Page 2
Staff Changes at the APRFC
We’ve had some changes around the office in recent months—even as much of our operations
remain virtual. This spring, Jess Sanow joined our group. Arleen Lunsford went part time this
summer and will retire in November. Ted Moran retired in September and Jessica Cherry moved
from the APRFC to assume the position of NOAA’s Regional Climate Services Director for Alaska.
Crane Johnson was promoted to the APRFC Hydrologist-in-Charge in October.
Jess Sanow, our new Hydrologist, made the long drive to Anchorage from
Colorado with her husband, dog, and 2 cats to join the team in February. Most
recently, Jess was working as a Hydrologist for the BLM White River Field
office in Western Colorado. Prior to that, Jess began her PhD at Colorado
State University in Watershed Sciences, focusing on shallow, seasonal
snowpack cover and is hoping to wrap up her degree this fall. Jess has also
worked for the USGS in Fort Collins, CO; Moab, UT; and Columbia, SC.
Although she has travelled and worked throughout the US, she always hoped
one day she’d end up in Alaska. Growing up in Idaho near the Tetons she
became accustomed to cold weather, deep snow, and big mountains and
knew AK would be a good fit. In her spare time Jess can be found hiking, backpacking, figure
skating, snowboarding, skiing, or cataloging her travels via scrapbook.
Arleen Lunsford, one of our most experienced hydrometeorologists,
joined the APRFC in 1994. Arleen received her BS in Astronomy and
Physics from the University of Maryland, College Park and her MS in
Meteorology from the University of Oklahoma, Norman. After graduate
school, she worked for Aeromet, a private company in Jenks, Oklahoma
before joining the APRFC. Arleen recounts her funniest experience was
back in the 1990s when (then Hydrologist-in-Charge) Jerry Nibler flew
several staff members down to see the Bradley Lake area in his
personal plane. Arleen said that Jerry didn’t fore-warn them to dress
appropriately, so Arleen made the trip in a summer dress and nylon
stockings. That might explain why we haven’t coaxed Arleen out on a
Riverwatch flight in recent years! Arleen’s hobbies include countless hours helping at the Adopt-a-
Cat shelter run by the Alaska Humane Society. She anticipates continuing this volunteer work and
getting back to sewing in her retirement.
Ted Moran, a Senior Hydrologist, who served more than nineteen years with
the USGS and the APRFC, will enjoy spending time with his family, hunting,
and playing his drumset in retirement. Ted earned his MS at Alaska Pacific
University and continued to help advise students there on topics of hydrology.
Look for announcements of several new hires in our next issue! Josh Walston,
a UAF graduate (MS), will join the APRFC in late October, and we are
currently recruiting for two Senior Hydrologists.

Page 3
Summer Field Work: Highlights in Seward and Moose Pass
Summer is when we get a chance to do whatever necessary fieldwork we can, including
resurveying of gages, making discharge measurements, and establishing new sites. Travel is still
very limited on account of the COVID-19 pandemic, but we were able to get to a few sites this
summer. Because of staff turnover, some of our hydrologists are unfamiliar with the location of
various gages and how readings—either from observers or automated sensors—may be impacted
by erosion, sand bars, backwater, and other effects. So getting forecasters out on gage visits is
also important for giving them the level of familiarity that results in better forecasts.
One of our automated technologies, the ultrasonic igage, measures the distance between where
it’s attached to a bridge and the surface of the water. We use that to calculate water stage. Over
time, small changes in the height of the Earth’s surface and movements of the bridges can lead to
changes in that difference. One good practice is for us to measure the vertical position of various
reference marks on the bridge relative
to a benchmark off the bridge. We are
also moving toward conversion of
these vertical datums (a reference
height of an object or point on the
Earth’s surface) from arbitrary
reference points to standards used
across agencies. Slope gage sites
measured by our observers also need
these vertical surveys repeated when
sites have experienced changes like
erosion or sediment deposition.
Figure 5: Johnse Ostman and Jess Sanow
talk to National Park Service officials at Exit
Creek explaining how the vertical surveys
relate to observer measurements performed
by NPS employees.
A visit to the staff gage at Trail River
near Moose Pass was also informative
for forecasters. It took a phone call to
our long time observer Celiene Turner
to find the gage on the remains of a
mid-river pier from a old bridge.
Celiene uses binoculars to take the
reading each morning. Any changes to
this site would require boat access. It
was great to meet Celiene and hear
from her about past high water and
flood events. We could not do this job
without our reliable observers!
Figure 6: Celiene Turner, Johnse Ostman,
and Jess Sanow at the Trail River gage near Moose Pass.

Page 4
New Gage at Emmonak
Emmonak is within the braided delta of the Yukon River on the North Fork, tidally affected, but not
subject to coastal flooding. Emmonak has had multiple hazard declarations in the past four
decades, primarily from river flooding, which prompted an impact assessment and development of
their Local Hazard Mitigation Plan (City of Emmonak, 2008).
NWS APRFC (Crane Johnson, Johnse Ostman)
visited Emmonak, AK in June, 2021 to introduce
ourselves and our program to Village Tribal and
City officials, establish a new river slope gage,
setup a local river observer, tie past flood survey
(2009) into current and common datums, and
survey flood stages and flood inundation bounds.
APRFC does not intend to develop a stage-
discharge rating for this location; the USGS gage
at Pilot Station is approximately 100 river miles
upstream. We believe APRFC efforts in the
region may contribute to early warning and better
situational awareness for the community during
flood events. Figure 7: Johnse Ostman and local
leader and new river observer, Paul Andrews, in
Emmonak.
The Last Measurement of JT Evans
In July we started noticing there were some missing measurements from the wire weight gage off
the Talkeetna railroad bridge, which was unusual. John Thomas ‘JT’ Evans was our reliable
observer for many years. He had an
unforgettable laugh and friendly demeanor.
Those who had met him in person in recent
years surely got to learn about the reality TV
coverage of JT’s unique greenhouse home.
In time we learned that JT passed on July 12,
2021 headed back home after taking his last
measurement from the bridge. We appreciate
his dedication and service to the APRFC.
Rest in Peace, JT.
Figure 8: JT Evans, Talkeenta.
CoCoRAHS: New Opportunities for Citizen Science
Are you a reader who is interested in getting involved in taking measurements for science research
and forecasting? Consider joining the Community Collaborative Rain, Hail, and Snow Network
(CoCoRAHS). You can go to the CoCoRAHS (https://www.cocorahs.org/)
or in Alaska contact [email protected]
Page 5
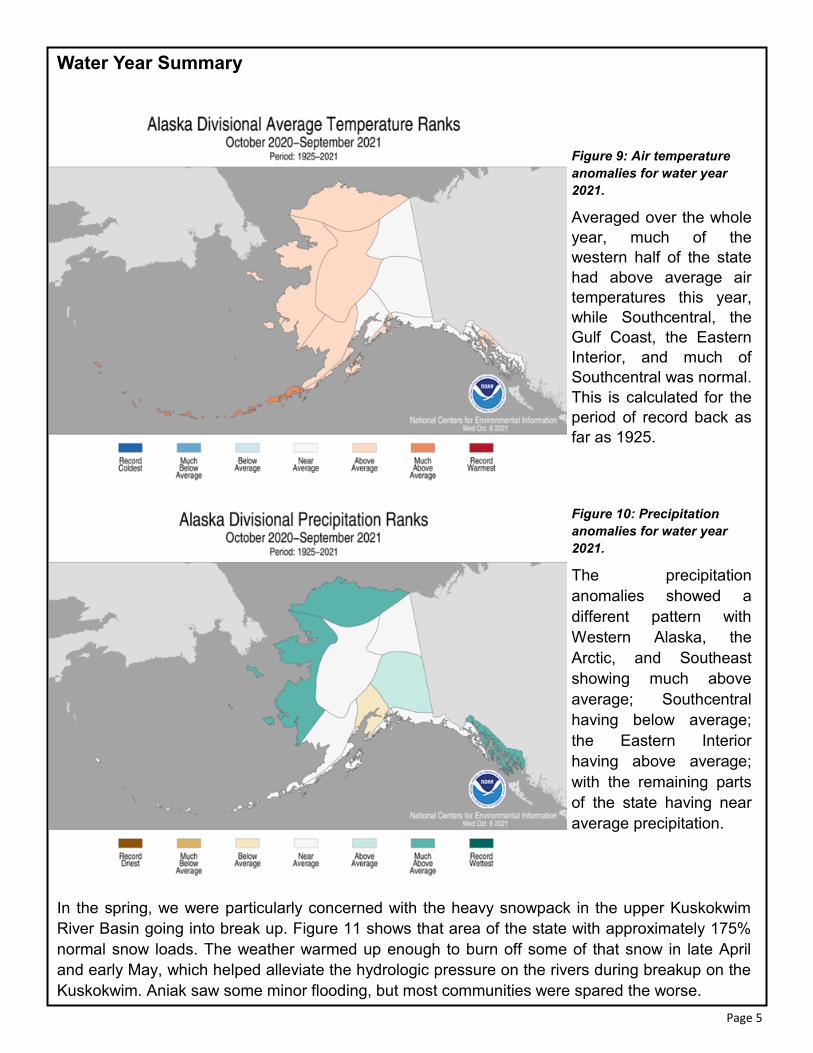
Water Year Summary
Figure 9: Air temperature
anomalies for water year
2021.
Averaged over the whole
year, much of the
western half of the state
had above average air
temperatures this year,
while Southcentral, the
Gulf Coast, the Eastern
Interior, and much of
Southcentral was normal.
This is calculated for the
period of record back as
far as 1925.
Figure 10: Precipitation
anomalies for water year
2021.
The precipitation
anomalies showed a
different pattern with
Western Alaska, the
Arctic, and Southeast
showing much above
average; Southcentral
having below average;
the Eastern Interior
having above average;
with the remaining parts
of the state having near
average precipitation.
In the spring, we were particularly concerned with the heavy snowpack in the upper Kuskokwim
River Basin going into break up. Figure 11 shows that area of the state with approximately 175%
normal snow loads. The weather warmed up enough to burn off some of that snow in late April
and early May, which helped alleviate the hydrologic pressure on the rivers during breakup on the
Kuskokwim. Aniak saw some minor flooding, but most communities were spared the worse.

Page 6
(Water Year Summary Continued)
Figure 11:
Snowpack
conditions at
the start of
April, 2021 from
snow courses
and Snotel
sensors.
Much of the
state had a
near normal
snowpack last
winter,
otherwise, and
Southeast was
richer in snow
than in other
recent years.
Figure 12:
USGS Gage
Status as of
early October,
2021
Despite
normal river
flows in the
Anchorage
area, parts of
the Kenai are
going into
freezeup in a
very dry
condition. The
Arctic rivers
are also going
into freeze up
below normal. Most of the rest of the state is normal.

Page 7
Low Levels at Bradley Lake
The dry summer on the Kenai impacted the lake levels even with the new Battle Creek Diversion.
Bradley Lake is the hydropower facility that provides electricity to the railbelt. The operators shared
the following graphic about lake levels with a few facts and caveats. Usable lake elevation begins
at 1,080’ elevation. In 2016,
levels were intentionally dropped
below 1,080’ for maintenance. In
2019, the ability for Bradley
energy to leave the Kenai
Peninsula was limited due to
scheduled maintenance and the
Swan Lake fire impacting the
transmission system through a
significant portion of the
year.The spillway elevation is at
1,180’. Lake level is a
representation of the total water
being stored by all of the project
participants, i.e. the Railbelt
utilities; thus elevation is
dependent upon both inflows and
utility use.
Figure 13: Bradley Lake Levels courtesy of Homer Electric Association.
Drone Projects
The APRFC got a few
opportunities to fly this
summer. Stay tuned for
future films and other
products from these efforts.
This season included flights
in Seward, Juneau, and
Cordova, as training and
currency flights in the
Anchorage area.
Figure 14: Jessica Cherry flies
the APRFC’s Uncrewed Aerial
System near Cordova in
August.

Page 8
Follow us on Social Media and find us on the web:
Pacific Sector: March Flooding
We never forget about our responsibilities in Hawaii, though the climate could not be more
different. This spring, Hawaii saw devastating floods in March from heavy rain on the islands.
Multiple homes were destroyed and one person was killed. Landslides, power outages, and road
and bridge damage were widespread. The Kaupakalua Dam was compromised and scheduled to
be removed. Thousands of people were ordered evacuated from their homes. Freshwater
supplies were impacted and public officials ordered water boiling requirements and conservation.
No stranger to heavy rain, this March 2021 was more extreme than usual in its intensity and
devastation. This occurred on top of the stress of the COVID-19 pandemic and economic
disruptions. We wish our Hawaiian friends plenty of Aloha this year.
Figure 15: Flooding photo by HawaiiNews on Instagram.