kwazulu-natal department of education and culture
TRANSCRIPT
Department of Education & Culture Master Strategic Plan 2003-2006
KWAZULU-NATAL DEPARTMENT OF
EDUCATION AND CULTURE
STRATEGIC PLAN MTEF 2003-2006

Department of Education & Culture Master Strategic Plan 2003-2006
CONTENTS
MASTER STRATEGIC PLAN
PART A: INTRODUCTION
Statement of Policy and Commitment by the MEC
Overview by the Chief Executive Officer
Departmental Overview
1. Legislative Mandate 2. Purpose Statement 2.1 Vision 2.2 Mission, goals and strategic objectives 2.3 Departmental Values 2.4 Strategic goals 3. Achievement of the strategic objectives 4. Description of the status quo 4.1 Service Delivery environment an challenges 4.2 Organisational environment and challenges 5. Description of strategic planning process PART B: THREE YEAR STRATEGIC PLAN 6. Measurable objectives, activities, performance measures and targets 7. Medium Term Revenue and Expenditure 7.1 Summary of Revenue 7.2 Summary of Expenditure 8. Co-ordination, co-operation and outsourcing plans 8.1 Interdepartmental linkages 8.2 Local government linkages 8.3 Public entities 8.4 Public-Private Partnerships PART C: BACKGROUND INFORMATION 9. Situational Analysis of the system as a whole 9.1 KZN Education profile 9.2 Factors affecting the demand for services 9.3 Factors affecting the supply of services 9.4 Demographic pressures an access issues 9.5 Institutional landscape

Department of Education & Culture Master Strategic Plan 2003-2006
9.6 Employees 9.7 Transfer to other institutions 10. Program 1 10.1 IT systems 10.2 Performance Management Systems 10.3 Financial Management 10.4 Audit queries 10.5 Plans for capital infrastructure and Asset Management 11. Program 2 11.1 Demographic pressures and access issues
Department of Education & Culture Master Strategic Plan 2003-2006
Page 1
POLICY STATEMENT BY THE MINISTER OF EDUCATION AND CULTURE A strategically managed organisation is characterised by clear strategic focus and direction enunciated in a vision and mission statement, which is given effect to by specific goals and programmes designed to propel the organisation towards the desired future state. In compiling this document, the department has reviewed its reason for existence, linking it with the current Budget of R11.7 billion and the three year medium term expenditure framework to strategic planning, thereby charting the way forward through to year 2005. This document will significantly clarify our strategic thrust as a Department and will give direction to a new and dynamic situation in the province. It would be impossible to undertake the accomplishment of the eight goals that we have identified in the strategic planning document without harnessing the energies and the co-operation of the stakeholders, such as the private sector, parents, communities, external donors, department of finance, school governing bodies and other statutory bodies linked to education in the province. Without their constant support and willingness to contribute and collaborate with us, it would be difficult to operate among them. The process of strategic planning and management is essentially a way of looking through the department into the future. All the participants have therefore had a taste of the future of the department. We look forward to their participation and hope that this strategic plan will have the necessary support of all the structures involved in implementing and operationalising it in all regions, districts, local circuits and schools throughout the province. ______________________ Dr L P H M Mtshali Minister of Education and Culture – KwaZulu-Natal
Department of Education & Culture Master Strategic Plan 2003-2006
Page 2
OVERVIEW BY THE CHIEF EXECUTIVE OFFICER Education remains an important sector in the South African economy since it has a direct impact on the ability of the Country to exploit new opportunities and thus contribute effectively to economic growth. The provisioning of education services is a complex task especially in an environment such as KwaZulu-Natal full of demographic disparities. Over the past years the Department has experienced a number of changes in legislation and policies, whilst such legislations are welcome it causes more complications when there are no corresponding resources to ensure effective implementation thus enabling the intended beneficiaries to benefit accordingly. The Department is operating under severe conditions of strain trying to give effect to the constitutional mandate to educate the Province. The Department faces a number of challenges, chief amongst them being:
• Backlog in the provisioning of classrooms • Lack of technological facilities to improve the quality of education in public schools • Dealing with the impact of HIV and Aids • Improving the Learner-Educator Ratio to be in line with the national one • Improving on the relationship with all the stakeholders in the Education Sector
The compulsory introduction of Grade R classes places strains on the Department. There are currently 1078 Grade R classes catering for 80 007 learners. By the year 2010 the number of classes will have to be increased to 5 970 to cater for 273 633 learners, representing a growth rate of 23.8% per annum over eight years, this requires careful planning. These challenges place an onerous responsibility on the Department to plan carefully and to implement a range of programmes covering all these issues. Most of the activities are reflected in this strategic plan and require first and foremost a strengthening of the institutional arrangements for co-operative governance; a modernisation of the business processes; an enhancement and continued reorientation of the departmental human and other resources; and a re-engineering of the organisational structure. I am certain that these challenges will be achieved through the collective and individual efforts of the management and staff of the Department of Education and Culture. _________________ Prof. C.R.M. Dlamini Chief Executive Officer
Department of Education & Culture Master Strategic Plan 2003-2006
Page 3
DEPARTMENTAL OVERVIEW 1. LEGISLATIVE MANDATE The South African Education System is characterised by a plethora of education legislation and policies. As such there are numerous pieces of legislation that governs the existence of the KwaZulu-Natal Department of Education and Culture. Within the framework of the Constitution, the MEC for Education has specific mandates imposed by the laws governing education to legislate and implement policies on various matters that concern education in the Province. Constitution of the Republic of South Africa Act, No. 108 of 1996 Bill of rights, especially regarding equality, freedom of association, labour relations, education, language and culture, just administrative action and access to courts as well as the provisions relating to public administration (basic values/principles and the public service). National Education Policy Act, No. 27 of 1996 National policy determination; consultation on legislation, monitoring and evaluation of education and co-ordination/consultative structures. South African Schools Act, No. 84 of 1996 Uniform norms and standards for learners, as well as uniform system for the organisation, governance and funding of schools. Employment of Educators Act, No. 76 1998 Employment of educators and the regulation of the conditions of service, discipline, retirement and discharge of educators. South African Council for Educators Act, 2000 Functioning of the council and registration of educators. Further Education and Training Act, No 98 of 1998 Establishment, governance and funding of FET institutions, registration of private FET institutions as well as quality assurance and quality promotion in FET. The Culture Affairs Act, No 65 of 1989 Is to promote, protect and conserve/preserve culture. The KwaZulu-Natal Heritage Act, No 10 of 1997 To promote awareness of the significance and value of cultural heritage resources while ensuring that cultural heritage management is integrated into economic, social and environmental activities in the province. Other than the legislation pertaining to the core function of the Department of Education, the Department complies with the legislation and policies surrounding the administration of the Public Service, inter alia:
• Public Service Act, 1994 • Labour Relations Act, 1999 • Employment Equity Act, 1999 • Public Finance Management Act, 1999

Department of Education & Culture Master Strategic Plan 2003-2006
Page 4
• Preferential Procurement Framework Act, 2000 and the KwaZulu-Natal Preferential Procurement Act, 2001

Department of Education & Culture Master Strategic Plan 2003-2006
Page 5
2. PURPOSE STATEMENT 2.1 Vision To become the leading department of education in the country through the provision of quality education and excellent service delivery. 2.2 Mission The provision of high quality education to ensure that the learners we develop make a difference wherever they are.
2.3 Departmental Values
The KwaZulu-Natal Department of Education and Culture subscribes to the following values:
2.3.1 Professionalism
Principally professionalism in respect of the manner in which we function in learning institutions and offices towards learners, colleagues, parents and other stakeholders.
2.3.2 Caring
Our concern for each other and especially the disadvantaged and disabled, for each individual and for the communities
2.3.3 Empathy
Our efforts to understand the needs of each individual, family and community for which we have responsibility.
2.3.4 Honesty
Our efforts to be truthful and transparent in our dealings and reports.
2.3.5 Integrity
Our efforts to establish and ensure consistent and sound policies, procedures and service.
2.3.6 Fairness
Our approach and efforts to facilitate redress, equity and equality
Department of Education & Culture Master Strategic Plan 2003-2006
Page 6
2.4 Strategic goals The strategic goals and associated objectives:
Goal 1: Provide high quality, relevant education to all learners, regardless of age, including ABET and which will equip them with knowledge, skills, values and attitudes to meet the challenges of the future
Strategic objectives:
• To implement a relevant curriculum to support life-long learning
• To provide for Educator capacity development for all phases
• To provide requisites resources to meet identified needs across the phases
Goal 2: Transform the Department into a high performance organisation focused on results and the quality of its service delivery.
Strategic objectives:
• To implement the effective performance measurement system throughout the Department
• To ensure that Batho Pele principles are implemented to achieve service excellence
• To ensure good corporate governance
Goal 3: Transform schools into self-reliant and effective learning institutions that are also vibrant centers of community life.
Strategic objectives:
• To create governance structures that are conducive to effective teaching and learning
• To develop schools to obtain Section 21 status
• To develop well-resourced GET & FET learning
• To develop programmes that will encourage community participation
Goal 4: Develop the professional quality of the teaching force and to promote effective leadership, governance and management at all levels with special reference to designated groups.
Strategic objectives:
• To ensure sustainable capacity building programme for educators
• To develop leadership, management and governance skills at all levels
• To ensure the implementation of the EEA
Department of Education & Culture Master Strategic Plan 2003-2006
Page 7
Goal 5: Provide and utilise resources to achieve redress and equity and to eliminate conditions of physical degradation in institutions.
Strategic objectives:
• To develop a plan to deal with infrastructure backlogs in schools
• To obtain and use effectively additional funding for non-personnel expenditure
Goal 6: Deal urgently and purposefully with the HIV and AIDS pandemic and other health and social threats/hazards.
Strategic objectives:
• To develop programs to counter the negative effects of HIV and AIDS in schools
• To ensure the integration of life-skills across the curriculum to combat HIV and AIDS and other health and social threats/hazards.
• To develop a management plan to deal with effected and affected
Goal 7: Promote participation and development in sport and recreation in the province.
Strategic objectives:
• To provide and improve sporting facilities in disadvantage groups
• To facilitate a wide variety of sport codes at schools
• To develop a pool of coaches, technical officials and facilitators of a high calibre
Goal 8: Provide support service to promote arts, culture, archives, libraries and museums in the province.
Strategic objectives:
• To promote integration of different cultures
• To develop cultural infrastructure, skills and resources
• To sustain recognised Arts and Culture organisations

Department of Education & Culture Master Strategic Plan 2003-2006
Page 8
3. ACHIEVEMENT OF THE STRATEGIC OBJECTIVES
The National Education Ministry’s “Call to Action” document outlines the Departments’ priorities for the 5-year period. It is within this milieu and context that the KwaZulu-Natal Department of Education and Culture has structured its Master Strategic Plan. Underpinning the entire TIRISANO process is the Government’s commitment to improving service delivery in order to increase access and improve the quality of education and training to even the most marginalised and dispossessed citizens of the country. This fundamental shift requires that all people involved in education, as a collective unit, reassess their thinking about education and training and determine whether it allows for:
• preparing and developing education for citizenship and nationhood; • celebrating the rich diversity and heritage of people; • developing skills and intellectual tools that are imperative to accommodate the rapid
changes in communication technology; • introducing innovations in the learning and teaching process based on the latest
technology; and • educating learners to make a contribution to the development of our country.
Against this backdrop, the Ministry of Education has identified 8 priorities that comprise the foundation for the development of a cohesive and vibrant education and training system that should propel South Africa into the new millennium. These priorities are to:
• Make provincial education systems work by making co-operative government work; • Break the back of illiteracy among adults and youth by 2005; • Make schools centres of community life; • End conditions of physical degradation in South African schools; • Develop the professional quality of our teaching force; • Ensure the success of active learning through outcomes based education; • Create vibrant further education and training systems to equip youth and adults to
meet the social and economic needs of the 21st century; and • Deal urgently and purposefully with the HIV/AIDS PANDEMIC in and through the
education and training systems.
Department of Education & Culture Master Strategic Plan 2003-2006
Page 9
These 8 priorities are intended to provide the basis for the transformation of the education and training system and cater for lifelong quality education and training. Further, these 8 priorities are organised into 5 core programme areas to enable the implementation plan. These are:
• School effectiveness and teacher professionalism; • Literacy; • Further education and training and higher education; • Organisational effectiveness of the national and professional departments of
education; and • HIV/AIDS.
It is through these core programmes that the realisation of the broader process of social and economic development should be achieved through developing people for citizenship and developing skills for employment. In the budget speech (28 February 2002), the KwaZulu-Natal Minister of Finance outlined the following provincial priorities:
• Eradication of poverty and inequality; • Dealing with the impact of HIV/AIDS and cholera; • Re-engineer and enhance integrated service delivery in government; • Investing in infrastructure; • Strengthening governance and human resource capacity; and • Safety and security.
The strategic goals and objectives developed by the Department of Education & Culture are consistent with the National and Provincial priorities whilst focusing on the core services of the Department. To monitor the progress towards the achievement of these strategic goals, measurable objectives and performance indicators will be used. The Department aims to achieve the set objectives within the ten programs as follows:
Program 1: The objective of this program is to provide overall management of the education system in accordance with the National Education Policy, Public Finance Management Act and other policies. Measurable objectives will include looking at the population of compulsory school going age and the availability of Further Education and Training to youth and adults above the compulsory school going age. During the course of the year the success will be measured by the percentage of the population of compulsory education age attending school, literacy rate, etc.
Department of Education & Culture Master Strategic Plan 2003-2006
Page 10
Program 2: Takes the bulk of the budget for the Department, as the objective is to provide public ordinary education from grade 1 to 12 in accordance with the South African Schools Act. The major activity is to ensure timeous and adequate provision of human, financial and physical (LSM) resources to schools. Critical for this program is the monitoring and management of the Budget in the light of the continuous challenges associated with the provision of teachers in line with learner: educator ratio that is agreed upon by all the stakeholders, especially the labour unions. The continuous need to provide substitute educators exert more pressure on the limited budget for this program.
Program 3: Aims at providing financial support to independent schools in accordance with the South African Schools Act. The progress made in this program will measured by the average real subsidy per learner and also the percentage of independent school learners receiving a state subsidy. The achievement of this objective is to a greater extent depended on the available budget.
Program 4: Providing public special schools with resources, like independent schools, the improvement in this program is much depended on the resources that are available, the major activity being the provision of accommodation for LSEN learners.
Program 5: Implementing Further Education and Training Act by mostly providing FET colleges with resources. The biggest challenge in this program is to increase participation by historically disadvantage groups in public FET institutions. This will require the Department to engage in to aggressive marketing strategies and to establish funds to assist the marginalised students. The progress on this program will be measured by the percentage of the marginalised students participating in further education and training.
Program 6: Provides Adult Basic Education and Training, mostly by providing ABET sites with resources. The challenge is to ensure that the existing ABET centers are fully operational and depending on the needs of the specific communities to establish new centers. The progress will be monitored utilising the percentage of illiterate adults in the Province.
Program 7: Deals with early childhood development at the Grade R and earlier levels, this requires the establishment of new sites and supporting the existing grade R sites.
Department of Education & Culture Master Strategic Plan 2003-2006
Page 11
4. DESCRIPTION OF THE STATUS QUO
4.1 Service delivery environment and challenges
The Department of Works is the landlord responsible for developing and maintaining most of the properties occupied by the Department. At present, 32% of all schools are judged to be in a physically poor condition. Further to this, there is a classroom backlog of some 14 667 which at present rate of construction, will only be made up in 9 years. Many schools are without basic utilities. This poses a critical challenge for the Department to achieve the set objectives. The Department of Education & Culture faces several risks should high levels of service delivery not be achieved, the most damaging of which could be court action by dissatisfied communities who believe they are not receiving the levels of education service for which the Constitution provides. The Department faces a particularly challenging task due to the scale of its operations and the remoteness of many rural schools. In provisioning for schools, a range of legislation must be complied with including the PFMA, Preferential Procurement Act and the SA Schools Act. Of great significance is the distinction between Section 20 and 21 schools, with Section 20 schools being reliant on the Department for their needs. Schools are also obliged to follow the Hierarchy of Needs, which prescribes the order in which fund allocations must be utilised.
In reviewing service delivery to schools, the goal is to ensure that schools have adequate supplies at the beginning of the academic year and also throughout the year. In many cases (particularly with respect to stationery and text books) the goal is not fully achieved, often due to problems with effective implementation of the procurement process (including tendering and other aspects). These include procurement processes that run late; proper interpretation of legislation; poor delivery by service providers and litigation. Electronic equipment that would generally be used in a school poses a particular challenge due to the absence of basic infrastructure that precludes the ordering and use of computers, science kits, etc. in schools in remote areas, this has a serious effect on the quality of education that the Department is able to provide. The Provincial Education Development Unit (“PEDU”) was established as a strategic intervention to facilitate and integrate projects funded from extra-budgetary sources. Significant work has been done to develop a database that has assisted in highlighting development needs. A number of projects such as RAIN (Resources and Information Network) have been successful in delivering support materials into classrooms. Other initiatives such as ICT (Information Communication Technologies) are dependent on basic infrastructure being in place first.

Department of Education & Culture Master Strategic Plan 2003-2006
Page 12
4.2 Organisational environment and challenges The Department has functioned with skeleton staff for a number of years, especially at the senior management level. The greatest challenge that the Department faces is to build capacity mainly by filling in vacant posts. The Department is currently re-structuring with a view to improve on efficiency and effectiveness. This will require the alignment of the human resource strategy with the Department’s strategic objectives. Because of the legacy of the past, the Department faces a challenge to build, deploy and sustain programmes that enhance and measure human resource capabilities to meet the current and future requirements of the Department and the needs of employees. Another challenge is to develop a system to reduce the impact of HIV and AIDS on educators and to counter the knock-on effects of teacher casualties on the effectiveness of education and training system. This will include the creation of systems to track the impact of HIV and AIDS so that proper and timely projections can be made. Coupled with this is the need to timeously identify those incapacitated by this pandemic and counsel them out of the Department smoothly. Broadly, on the service delivery side, the Department identified four main challenges:
• To continuously improve the efficiency of education delivery • Enhance district leadership, management and quality assurance • To render effective and efficient support to schools and teachers, and • To be more responsive to the needs and expectations of communities.
5. DESCRIPTION OF STRATEGIC PLANNING PROCESS The Department was assisted initially by MM&A to develop a baseline document from which senior management formulated the strategies for the medium term. Critical expertise was also solicited from Provincial Treasury and the Office of the Auditor-General. Senior management developed strategic objectives and critical activities that the Department needs to undertake. In order to derive realistic targets that are acceptable by all and to ensure that the Department works towards a shared vision, senior managers in each program were required to draft targets within their Components. The senior management met again to refine the targets set by individual program managers with their teams. During this session again the Office of the Auditor- General was invited to advise on the auditability of the information provided.
Department of Education & Culture Master Strategic Plan 2003-2006
Page 13
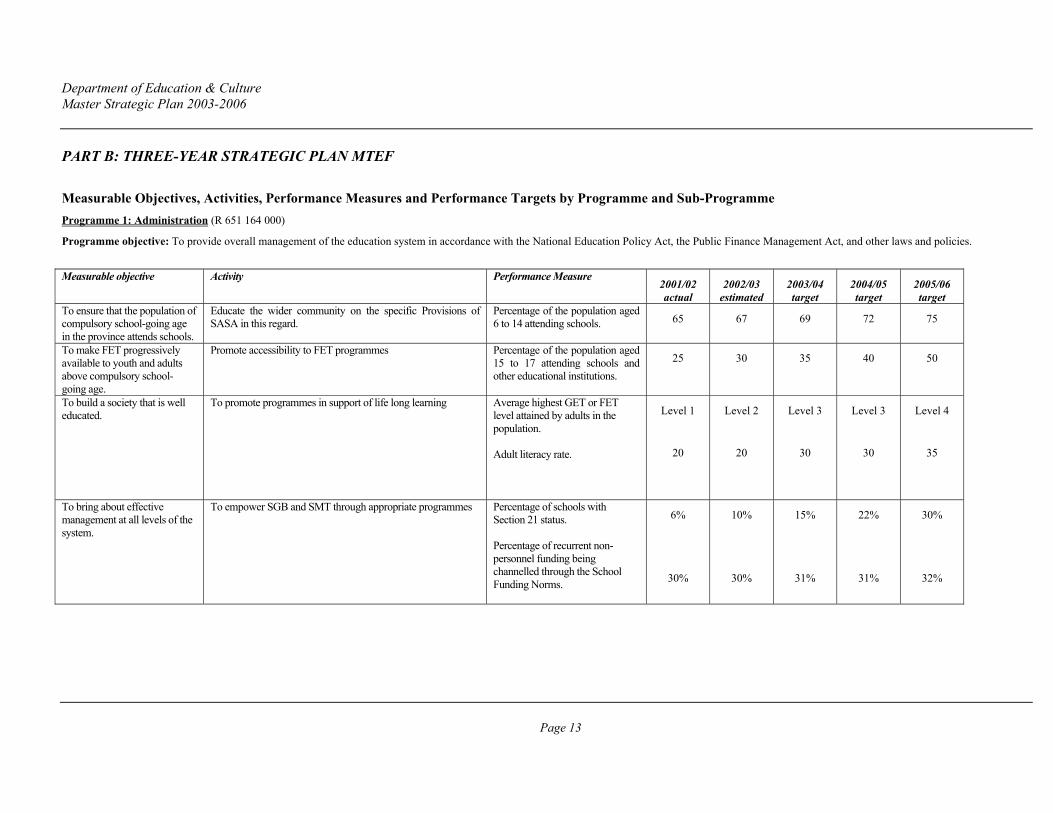
PART B: THREE-YEAR STRATEGIC PLAN MTEF Measurable Objectives, Activities, Performance Measures and Performance Targets by Programme and Sub-Programme Programme 1: Administration (R 651 164 000)
Programme objective: To provide overall management of the education system in accordance with the National Education Policy Act, the Public Finance Management Act, and other laws and policies.
Measurable objective Activity Performance Measure
2001/02 actual
2002/03 estimated
2003/04 target
2004/05 target
2005/06 target
To ensure that the population of compulsory school-going age in the province attends schools.
Educate the wider community on the specific Provisions of SASA in this regard.
Percentage of the population aged 6 to 14 attending schools. 65 67 69 72 75
To make FET progressively available to youth and adults above compulsory school-going age.
Promote accessibility to FET programmes
Percentage of the population aged 15 to 17 attending schools and other educational institutions.
25 30 35 40 50
To build a society that is well educated.
To promote programmes in support of life long learning
Average highest GET or FET level attained by adults in the population. Adult literacy rate.
Level 1
20
Level 2
20
Level 3
30
Level 3
30
Level 4
35
To bring about effective management at all levels of the system.
To empower SGB and SMT through appropriate programmes
Percentage of schools with Section 21 status. Percentage of recurrent non-personnel funding being channelled through the School Funding Norms.
6%
30%
10%
30%
15%
31%
22%
31%
30%
32%
Department of Education & Culture Master Strategic Plan 2003-2006
Page 14
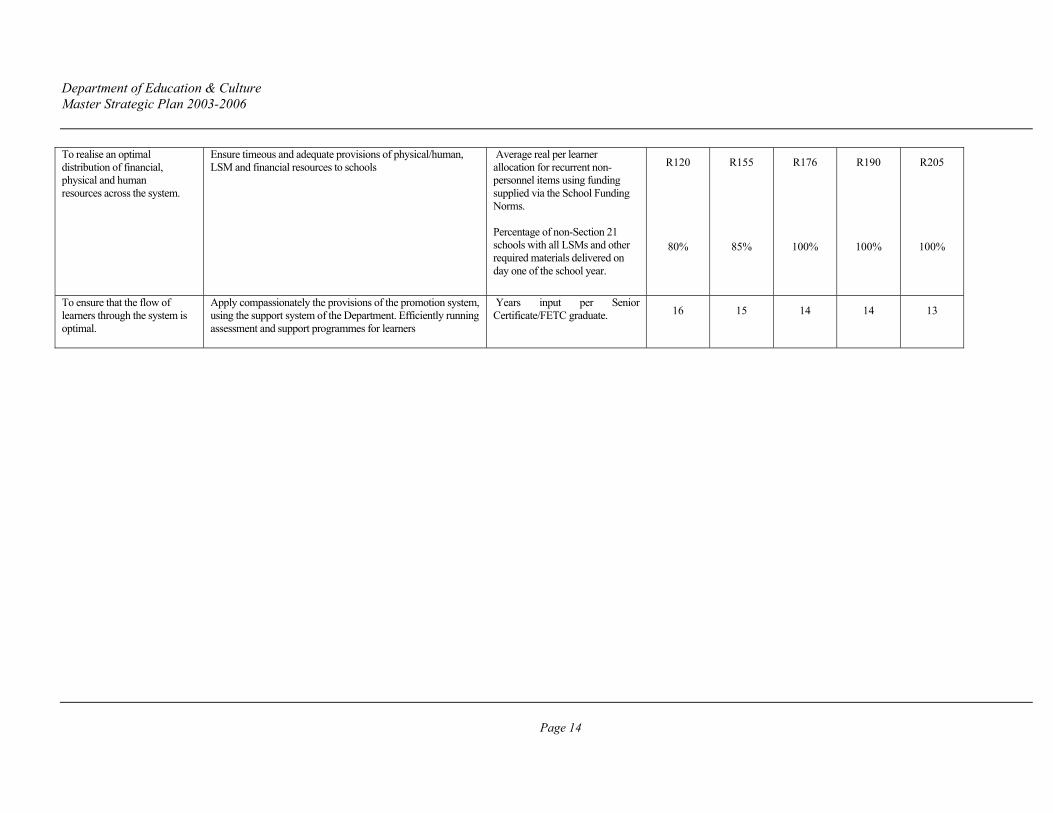
To realise an optimal distribution of financial, physical and human resources across the system.
Ensure timeous and adequate provisions of physical/human, LSM and financial resources to schools
Average real per learner allocation for recurrent non-personnel items using funding supplied via the School Funding Norms. Percentage of non-Section 21 schools with all LSMs and other required materials delivered on day one of the school year.
R120
80%
R155
85%
R176
100%
R190
100%
R205
100%
To ensure that the flow of learners through the system is optimal.
Apply compassionately the provisions of the promotion system, using the support system of the Department. Efficiently running assessment and support programmes for learners
Years input per Senior Certificate/FETC graduate. 16
15 14 14 13

Department of Education & Culture Master Strategic Plan 2003-2006
Page 15
Programme 2: Public ordinary school education (R10 047 334 000)
Programme objective: To provide public ordinary education from Grades 1 to 12 in accordance with the South African Schools Act.
Sub-programme 2.1: Public primary phase (R 6 205 745 000)
Programme objective: To provide specific public primary ordinary schools with resources required for the Grades 1 to 7 phase.
Measurable objective Activity Performance Measure 2001/02
Actual
2002/03
Estimated
2003/04
Target
2004/05
Target
2005/06
Target
To provide spaces in the public primary phase in accordance with policy.
Identify all schools where learning is taking place under trees or in unacceptable structures.
Number of spaces provided in the public primary phase.
Reduction in number of spaces in unacceptable conditions.
1.5 m
1.58 m 1.6 m 1.61 m 1.63 m
To provide educators at the public primary phase in accordance with policy.
Implement PPN in keeping with National Guidelines within Budgetary constraints
Number of educators provided at the public primary phase.
L:E ratio in the public primary phase.
41 600
1:36,1
43800
1:36,1
45 394
1:35,3
45 394
1:35,5
45 894
1:35,5
To put the basic infrastructure for primary schooling in place in accordance with policy.
Implement the Departments physical infrastructure plans Number of new classrooms built.
L:C ratio in the public primary phase.
Number of new toilets built.
Percentage of schools with a water supply.
Percentage of CAPEX budget spent on maintenance.
137
46
371
64
73
750
44
520
66
68
1 016
43,3
950
68
58
1 050
42,4
1040
72
50
1 050
41,6
1 100
74
45

Department of Education & Culture Master Strategic Plan 2003-2006
Page 16
To promote the participation of historically marginalised groups of learners.
Promote sufficient and appropriate learning facilities at primary level
Gender parity index in public primary schools.
Percentage of learners in public primary schools who are disabled.
Number of ordinary full-service schools per 100,000 learners at the primary phase.
F:M
0.94 : 1
0.6%
0
0.94 : 1
1,0%
0.5
0.95 : 1
1,5%
1
0.95 : 1
2,0%
2
0.96 : 1
2,6%
3.5
To foster a culture of effective learning and teaching.
Facilitate and promote all Stakeholders co-operation and participation at primary school level
Percentage of learner days lost due to learner absenteeism in the primary phase.
Percentage of working days lost due to educator absenteeism in the primary phase.
3%
10%
3%
10%
3%
8%
2.5%
6%
2%
3%
To develop the educator corps.
To provide educator development programmes Average hours of development activities per educator in the primary phase.
80 80 80 80 80
To ensure that the flow of learners through the primary phase is optimal.
Ensure quality teaching, learning, assessment and motivation
Repetition rate in the primary phase.
Dropout rate in the primary phase.
6,6%
5,2%
6,6%
5,2%
6,3%
4,5%
5.9%
4,0%
5,5%
3,0%
To attain the highest possible educational outcomes amongst learners.
Provide effective learning and teaching programmes Percentage of learners in Grade 3 attaining acceptable outcomes in numeracy, literacy and life skills.
Percentage of learners in Grade 6 attaining acceptable outcomes in numeracy, literacy and life skills.
91
91
92
92
93
93
94
94
95
95
Department of Education & Culture Master Strategic Plan 2003-2006
Page 17
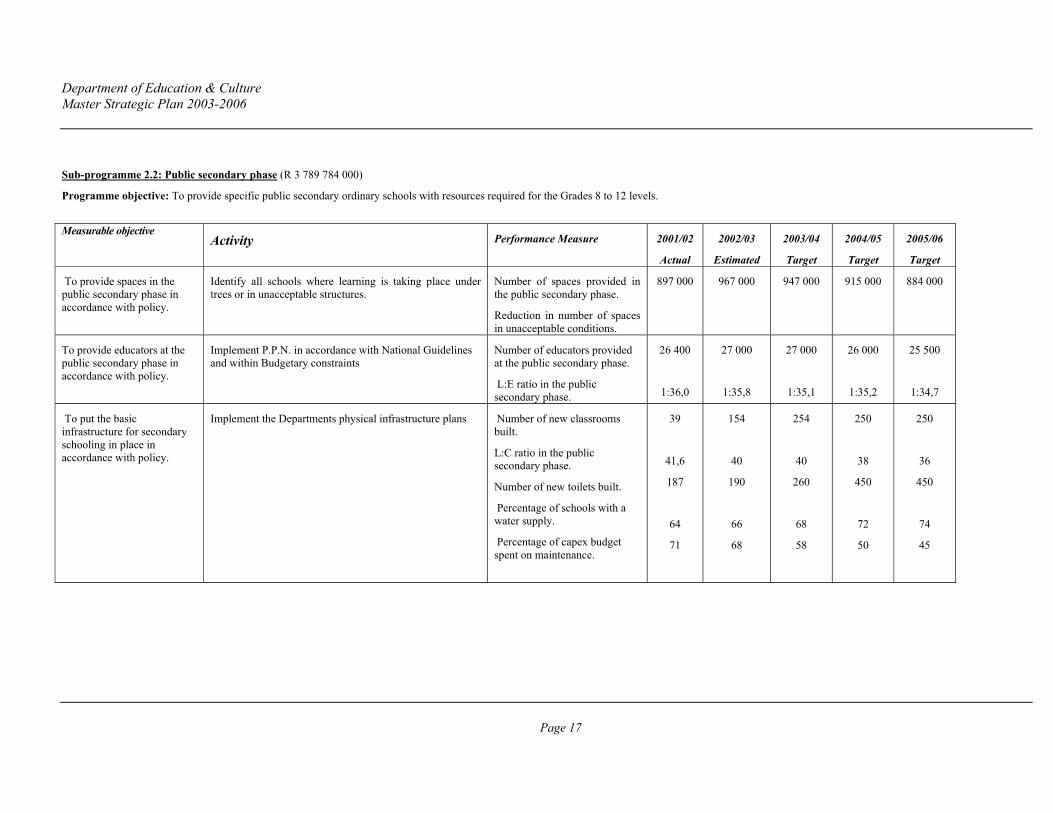
Sub-programme 2.2: Public secondary phase (R 3 789 784 000)
Programme objective: To provide specific public secondary ordinary schools with resources required for the Grades 8 to 12 levels.
Measurable objective
Activity Performance Measure 2001/02
Actual
2002/03
Estimated
2003/04
Target
2004/05
Target
2005/06
Target
To provide spaces in the public secondary phase in accordance with policy.
Identify all schools where learning is taking place under trees or in unacceptable structures.
Number of spaces provided in the public secondary phase.
Reduction in number of spaces in unacceptable conditions.
897 000 967 000 947 000
915 000
884 000
To provide educators at the public secondary phase in accordance with policy.
Implement P.P.N. in accordance with National Guidelines and within Budgetary constraints
Number of educators provided at the public secondary phase.
L:E ratio in the public secondary phase.
26 400
1:36,0
27 000
1:35,8
27 000
1:35,1
26 000
1:35,2
25 500
1:34,7
To put the basic infrastructure for secondary schooling in place in accordance with policy.
Implement the Departments physical infrastructure plans Number of new classrooms built.
L:C ratio in the public secondary phase.
Number of new toilets built.
Percentage of schools with a water supply.
Percentage of capex budget spent on maintenance.
39
41,6
187
64
71
154
40
190
66
68
254
40
260
68
58
250
38
450
72
50
250
36
450
74
45
Department of Education & Culture Master Strategic Plan 2003-2006
Page 18
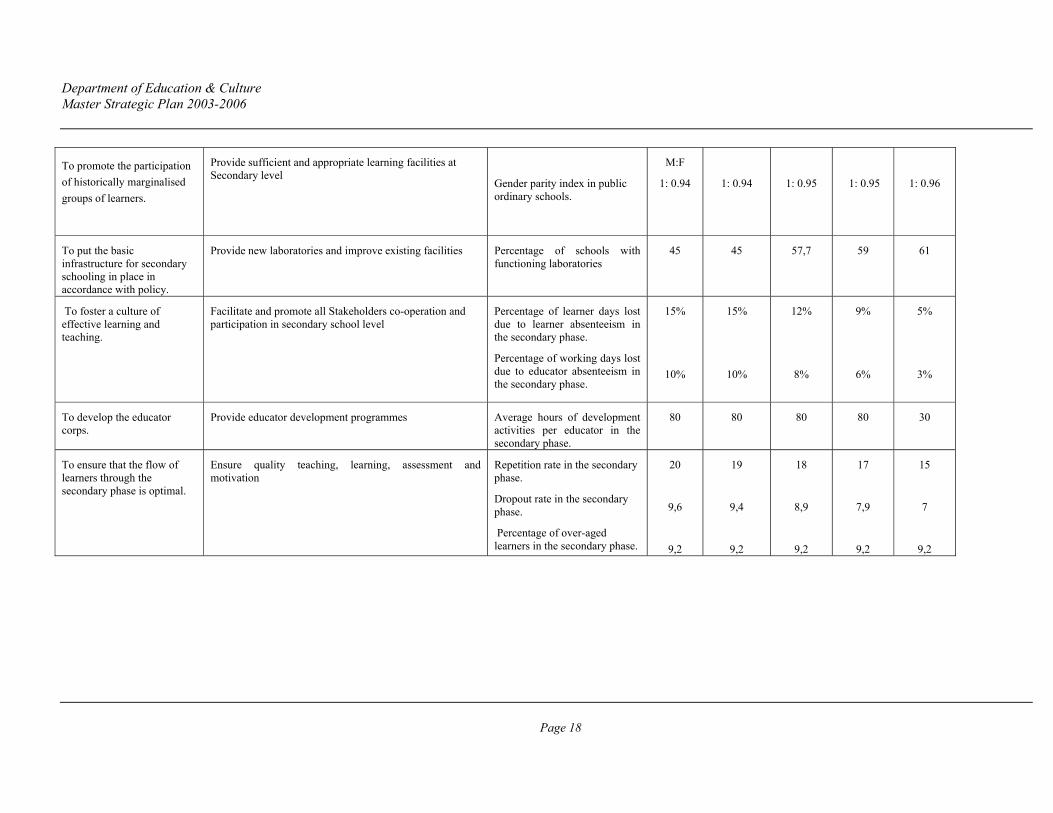
To promote the participation of historically marginalised groups of learners.
Provide sufficient and appropriate learning facilities at Secondary level
Gender parity index in public ordinary schools.
M:F
1: 0.94
1: 0.94
1: 0.95
1: 0.95
1: 0.96
To put the basic infrastructure for secondary schooling in place in accordance with policy.
Provide new laboratories and improve existing facilities Percentage of schools with functioning laboratories
45 45 57,7 59 61
To foster a culture of effective learning and teaching.
Facilitate and promote all Stakeholders co-operation and participation in secondary school level
Percentage of learner days lost due to learner absenteeism in the secondary phase.
Percentage of working days lost due to educator absenteeism in the secondary phase.
15%
10%
15%
10%
12%
8%
9%
6%
5%
3%
To develop the educator corps.
Provide educator development programmes
Average hours of development activities per educator in the secondary phase.
80 80 80 80 30
To ensure that the flow of learners through the secondary phase is optimal.
Ensure quality teaching, learning, assessment and motivation
Repetition rate in the secondary phase.
Dropout rate in the secondary phase.
Percentage of over-aged learners in the secondary phase.
20
9,6
9,2
19
9,4
9,2
18
8,9
9,2
17
7,9
9,2
15
7
9,2
Department of Education & Culture Master Strategic Plan 2003-2006
Page 19
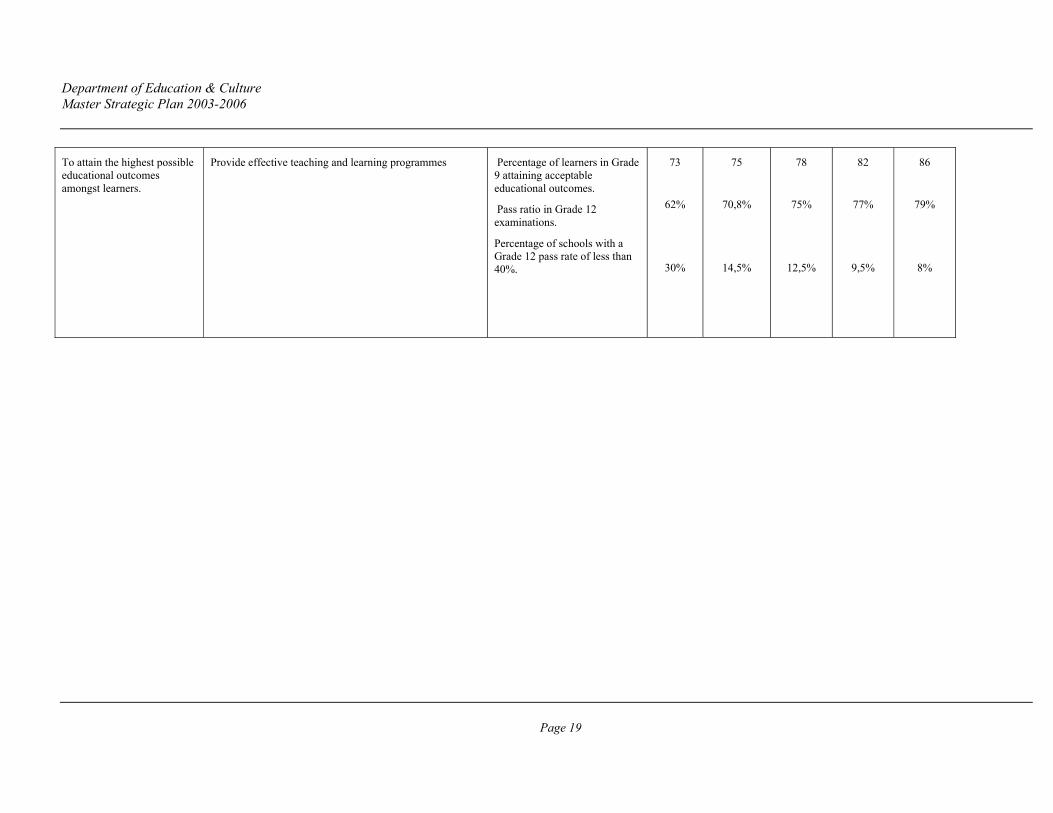
To attain the highest possible educational outcomes amongst learners.
Provide effective teaching and learning programmes Percentage of learners in Grade 9 attaining acceptable educational outcomes.
Pass ratio in Grade 12 examinations.
Percentage of schools with a Grade 12 pass rate of less than 40%.
73
62%
30%
75
70,8%
14,5%
78
75%
12,5%
82
77%
9,5%
86
79%
8%
Department of Education & Culture Master Strategic Plan 2003-2006
Page 20
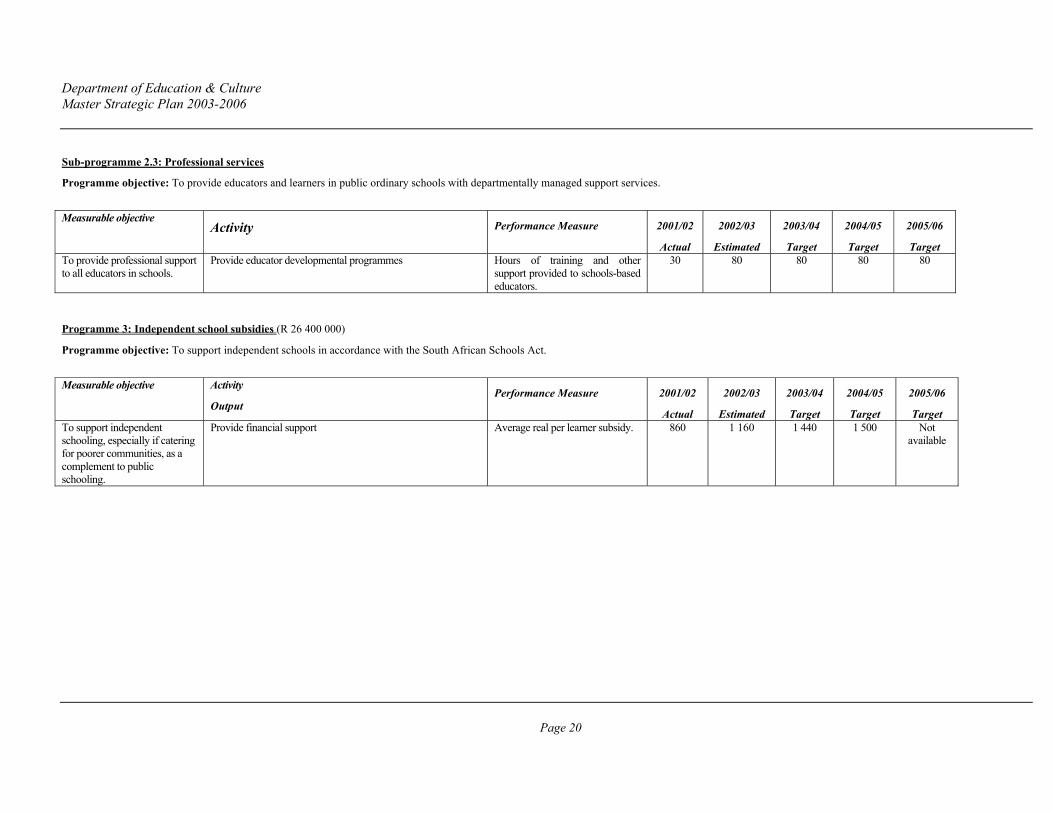
Sub-programme 2.3: Professional services
Programme objective: To provide educators and learners in public ordinary schools with departmentally managed support services.
Measurable objective
Activity Performance Measure 2001/02
Actual
2002/03
Estimated
2003/04
Target
2004/05
Target
2005/06
Target To provide professional support to all educators in schools.
Provide educator developmental programmes Hours of training and other support provided to schools-based educators.
30 80 80 80 80
Programme 3: Independent school subsidies (R 26 400 000)
Programme objective: To support independent schools in accordance with the South African Schools Act.
Measurable objective Activity
Output Performance Measure 2001/02
Actual
2002/03
Estimated
2003/04
Target
2004/05
Target
2005/06
Target To support independent schooling, especially if catering for poorer communities, as a complement to public schooling.
Provide financial support Average real per learner subsidy.
860
1 160
1 440 1 500
Not available
Department of Education & Culture Master Strategic Plan 2003-2006
Page 21
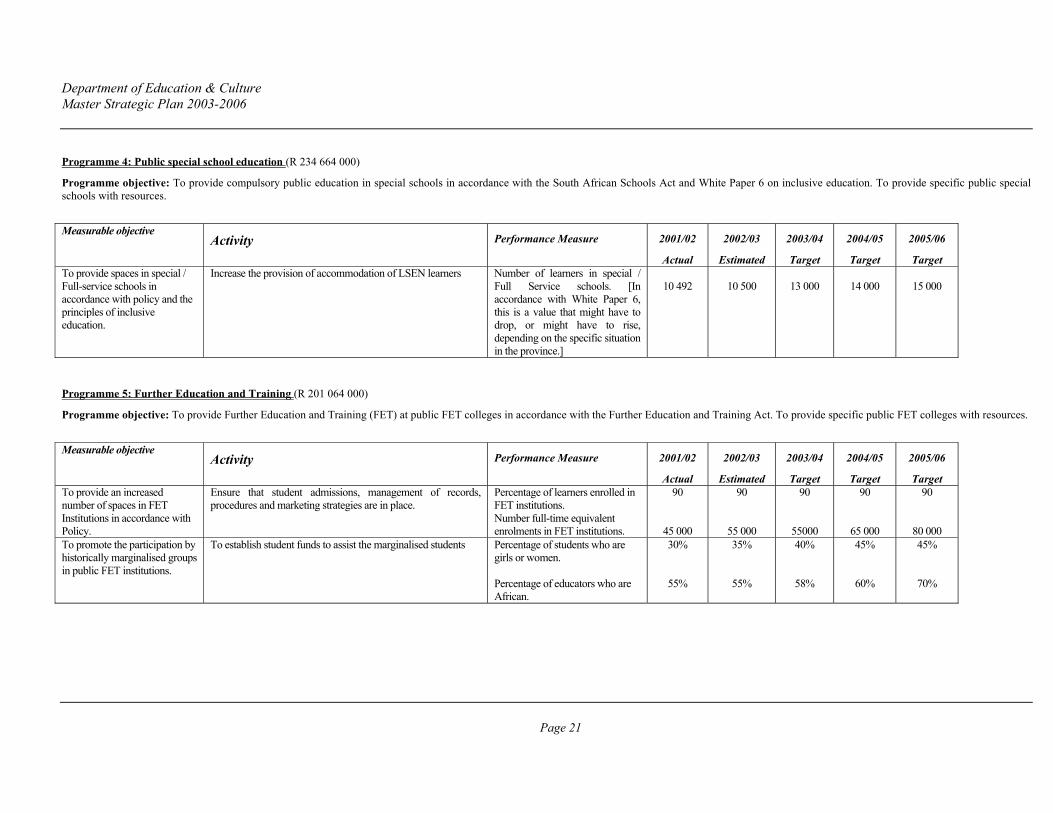
Programme 4: Public special school education (R 234 664 000)
Programme objective: To provide compulsory public education in special schools in accordance with the South African Schools Act and White Paper 6 on inclusive education. To provide specific public special schools with resources.
Measurable objective
Activity Performance Measure 2001/02
Actual
2002/03
Estimated
2003/04
Target
2004/05
Target
2005/06
Target To provide spaces in special / Full-service schools in accordance with policy and the principles of inclusive education.
Increase the provision of accommodation of LSEN learners Number of learners in special / Full Service schools. [In accordance with White Paper 6, this is a value that might have to drop, or might have to rise, depending on the specific situation in the province.]
10 492
10 500
13 000
14 000
15 000
Programme 5: Further Education and Training (R 201 064 000)
Programme objective: To provide Further Education and Training (FET) at public FET colleges in accordance with the Further Education and Training Act. To provide specific public FET colleges with resources.
Measurable objective
Activity Performance Measure 2001/02
Actual
2002/03
Estimated
2003/04
Target
2004/05
Target
2005/06
Target To provide an increased number of spaces in FET Institutions in accordance with Policy.
Ensure that student admissions, management of records, procedures and marketing strategies are in place.
Percentage of learners enrolled in FET institutions. Number full-time equivalent enrolments in FET institutions.
90
45 000
90
55 000
90
55000
90
65 000
90
80 000 To promote the participation by historically marginalised groups in public FET institutions.
To establish student funds to assist the marginalised students
Percentage of students who are girls or women. Percentage of educators who are African.
30%
55%
35%
55%
40%
58%
45%
60%
45%
70%
Department of Education & Culture Master Strategic Plan 2003-2006
Page 22
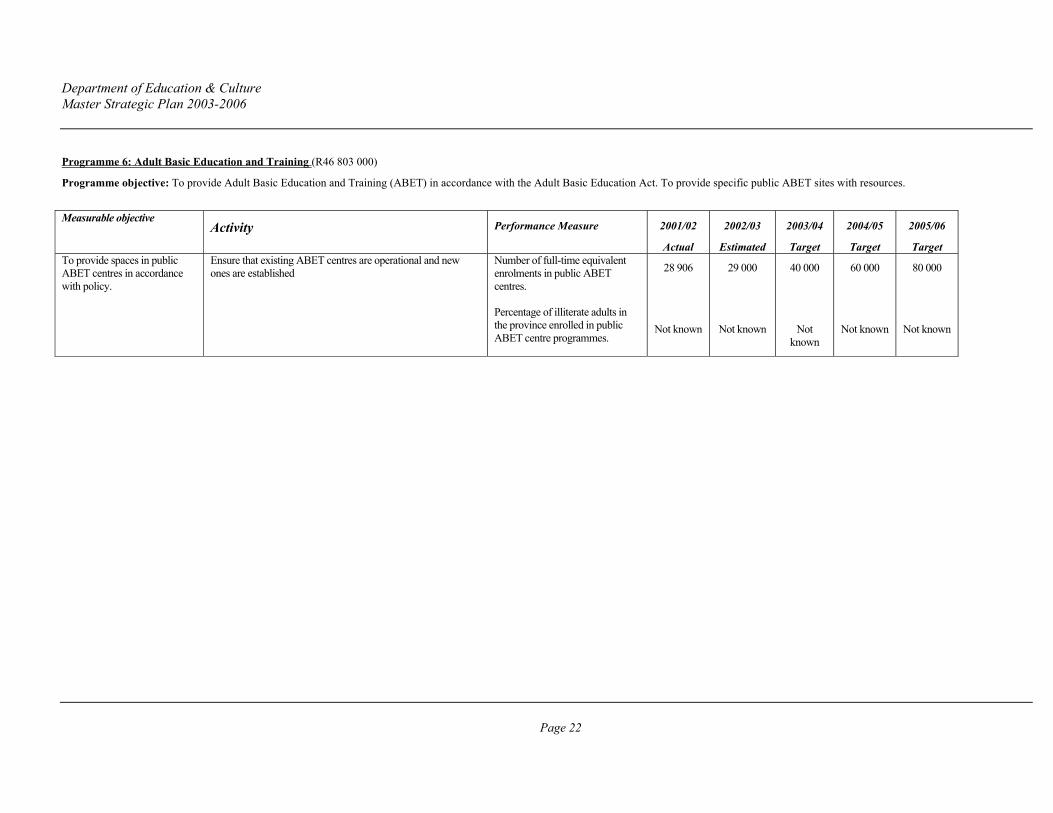
Programme 6: Adult Basic Education and Training (R46 803 000)
Programme objective: To provide Adult Basic Education and Training (ABET) in accordance with the Adult Basic Education Act. To provide specific public ABET sites with resources.
Measurable objective
Activity Performance Measure 2001/02
Actual
2002/03
Estimated
2003/04
Target
2004/05
Target
2005/06
Target To provide spaces in public ABET centres in accordance with policy.
Ensure that existing ABET centres are operational and new ones are established
Number of full-time equivalent enrolments in public ABET centres. Percentage of illiterate adults in the province enrolled in public ABET centre programmes.
28 906
Not known
29 000
Not known
40 000
Not known
60 000
Not known
80 000
Not known
Department of Education & Culture Master Strategic Plan 2003-2006
Page 23
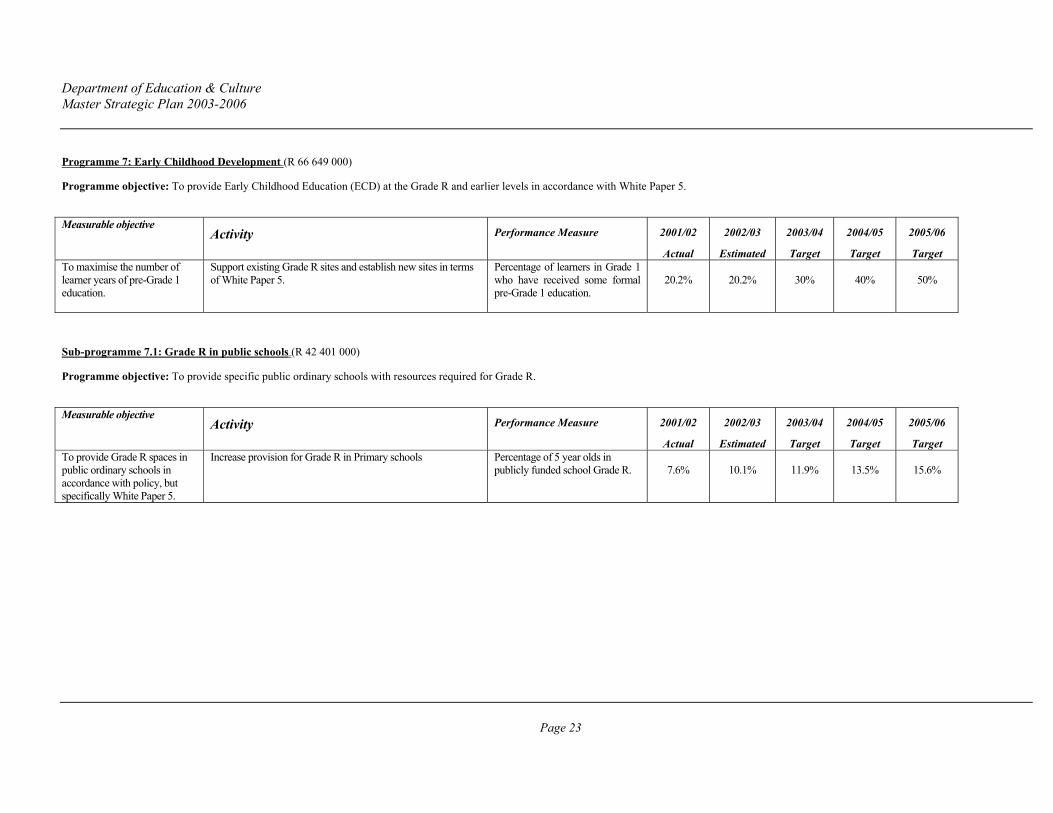
Programme 7: Early Childhood Development (R 66 649 000)
Programme objective: To provide Early Childhood Education (ECD) at the Grade R and earlier levels in accordance with White Paper 5.
Measurable objective
Activity Performance Measure 2001/02
Actual
2002/03
Estimated
2003/04
Target
2004/05
Target
2005/06
Target To maximise the number of learner years of pre-Grade 1 education.
Support existing Grade R sites and establish new sites in terms of White Paper 5.
Percentage of learners in Grade 1 who have received some formal pre-Grade 1 education.
20.2%
20.2%
30%
40%
50%
Sub-programme 7.1: Grade R in public schools (R 42 401 000)
Programme objective: To provide specific public ordinary schools with resources required for Grade R.
Measurable objective
Activity Performance Measure 2001/02
Actual
2002/03
Estimated
2003/04
Target
2004/05
Target
2005/06
Target To provide Grade R spaces in public ordinary schools in accordance with policy, but specifically White Paper 5.
Increase provision for Grade R in Primary schools
Percentage of 5 year olds in publicly funded school Grade R.
7.6%
10.1%
11.9%
13.5%
15.6%
Department of Education & Culture Master Strategic Plan 2003-2006
Page 24
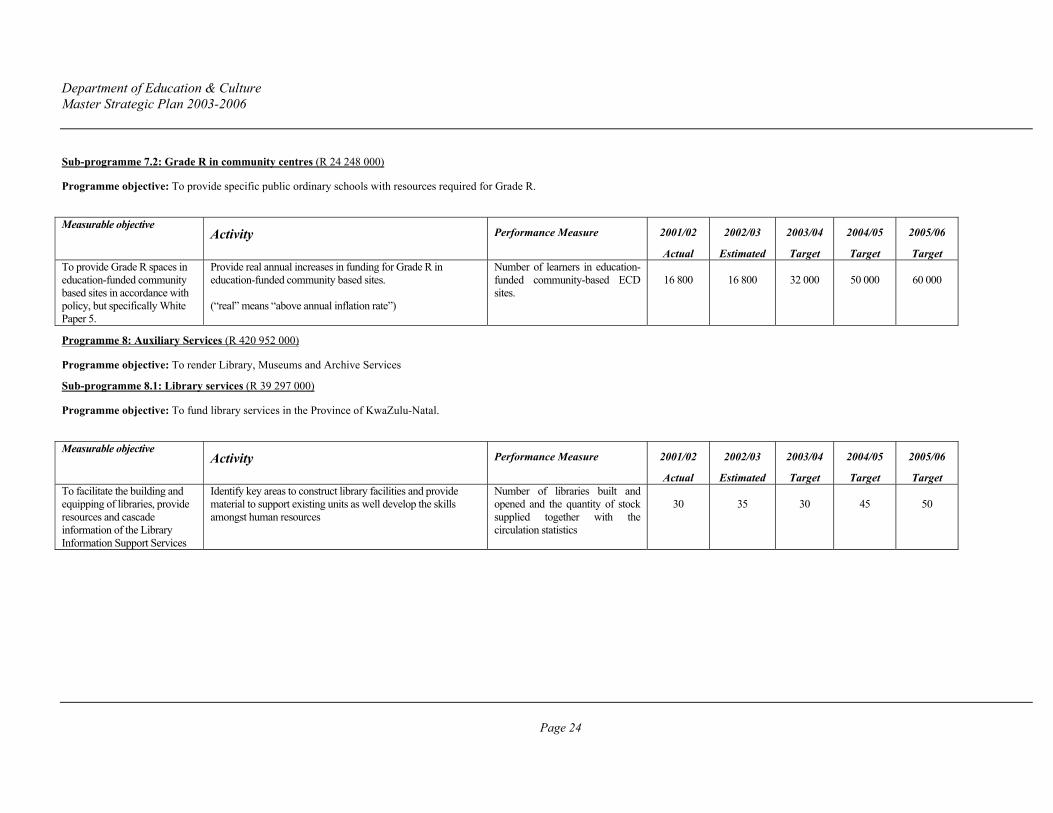
Sub-programme 7.2: Grade R in community centres (R 24 248 000)
Programme objective: To provide specific public ordinary schools with resources required for Grade R.
Measurable objective
Activity Performance Measure 2001/02
Actual
2002/03
Estimated
2003/04
Target
2004/05
Target
2005/06
Target To provide Grade R spaces in education-funded community based sites in accordance with policy, but specifically White Paper 5.
Provide real annual increases in funding for Grade R in education-funded community based sites. (“real” means “above annual inflation rate”)
Number of learners in education-funded community-based ECD sites.
16 800
16 800
32 000
50 000
60 000
Programme 8: Auxiliary Services (R 420 952 000)
Programme objective: To render Library, Museums and Archive Services
Sub-programme 8.1: Library services (R 39 297 000)
Programme objective: To fund library services in the Province of KwaZulu-Natal.
Measurable objective
Activity Performance Measure 2001/02
Actual
2002/03
Estimated
2003/04
Target
2004/05
Target
2005/06
Target To facilitate the building and equipping of libraries, provide resources and cascade information of the Library Information Support Services
Identify key areas to construct library facilities and provide material to support existing units as well develop the skills amongst human resources
Number of libraries built and opened and the quantity of stock supplied together with the circulation statistics
30
35
30
45
50
Department of Education & Culture Master Strategic Plan 2003-2006
Page 25
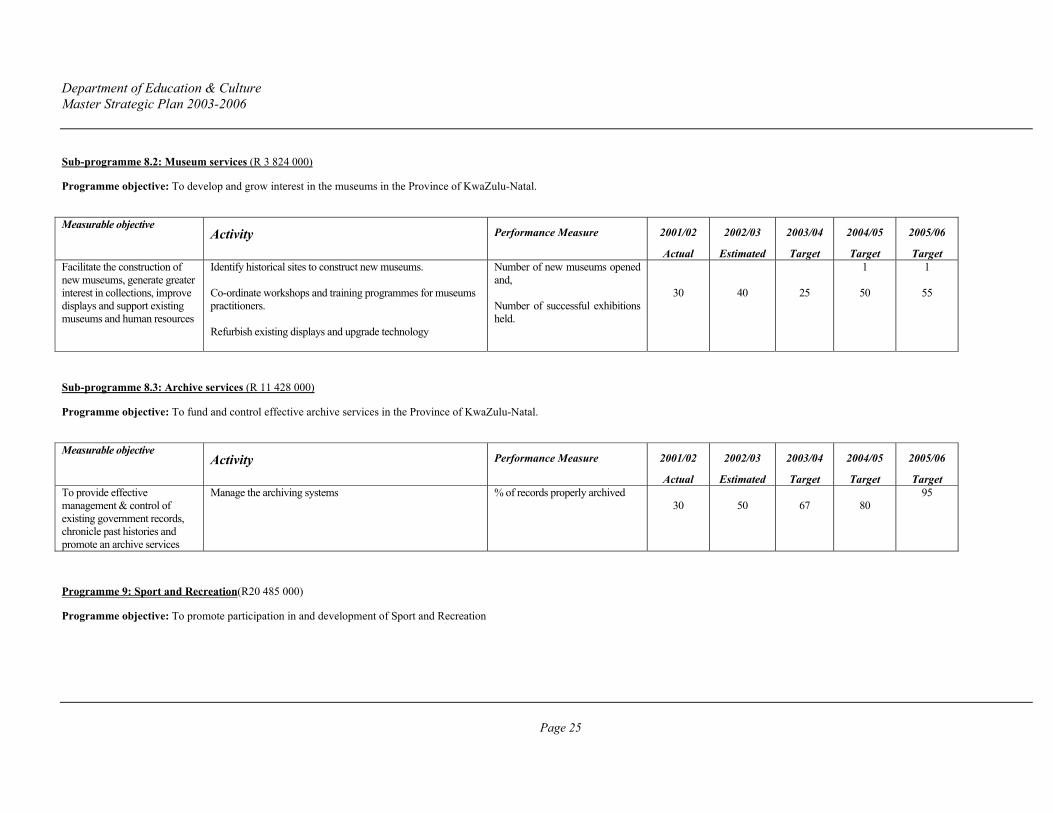
Sub-programme 8.2: Museum services (R 3 824 000)
Programme objective: To develop and grow interest in the museums in the Province of KwaZulu-Natal.
Measurable objective
Activity Performance Measure 2001/02
Actual
2002/03
Estimated
2003/04
Target
2004/05
Target
2005/06
Target Facilitate the construction of new museums, generate greater interest in collections, improve displays and support existing museums and human resources
Identify historical sites to construct new museums. Co-ordinate workshops and training programmes for museums practitioners. Refurbish existing displays and upgrade technology
Number of new museums opened and, Number of successful exhibitions held.
30
40
25
1
50
1
55
Sub-programme 8.3: Archive services (R 11 428 000)
Programme objective: To fund and control effective archive services in the Province of KwaZulu-Natal.
Measurable objective
Activity Performance Measure 2001/02
Actual
2002/03
Estimated
2003/04
Target
2004/05
Target
2005/06
Target To provide effective management & control of existing government records, chronicle past histories and promote an archive services
Manage the archiving systems
% of records properly archived 30
50
67
80
95
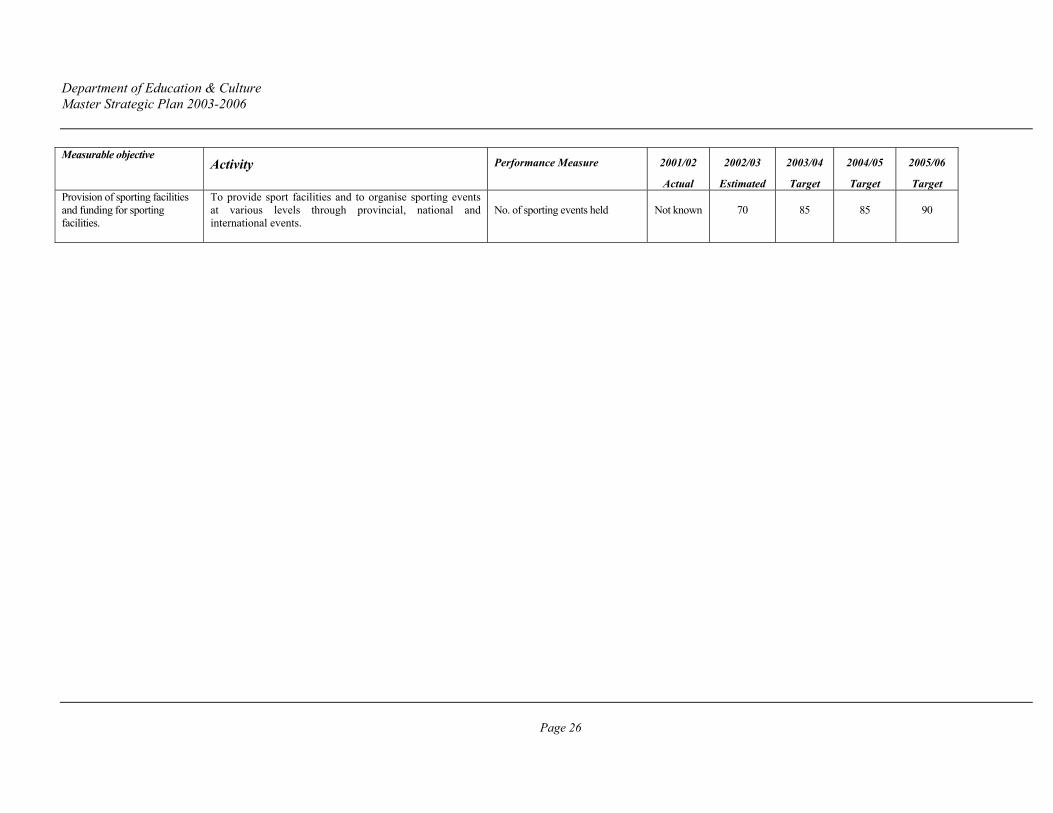
Programme 9: Sport and Recreation(R20 485 000)
Programme objective: To promote participation in and development of Sport and Recreation
Department of Education & Culture Master Strategic Plan 2003-2006
Page 26
Measurable objective Activity Performance Measure 2001/02
Actual
2002/03
Estimated
2003/04
Target
2004/05
Target
2005/06
Target Provision of sporting facilities and funding for sporting facilities.
To provide sport facilities and to organise sporting events at various levels through provincial, national and international events.
No. of sporting events held
Not known
70
85
85
90
Department of Education & Culture Master Strategic Plan 2003-2006
Page 27
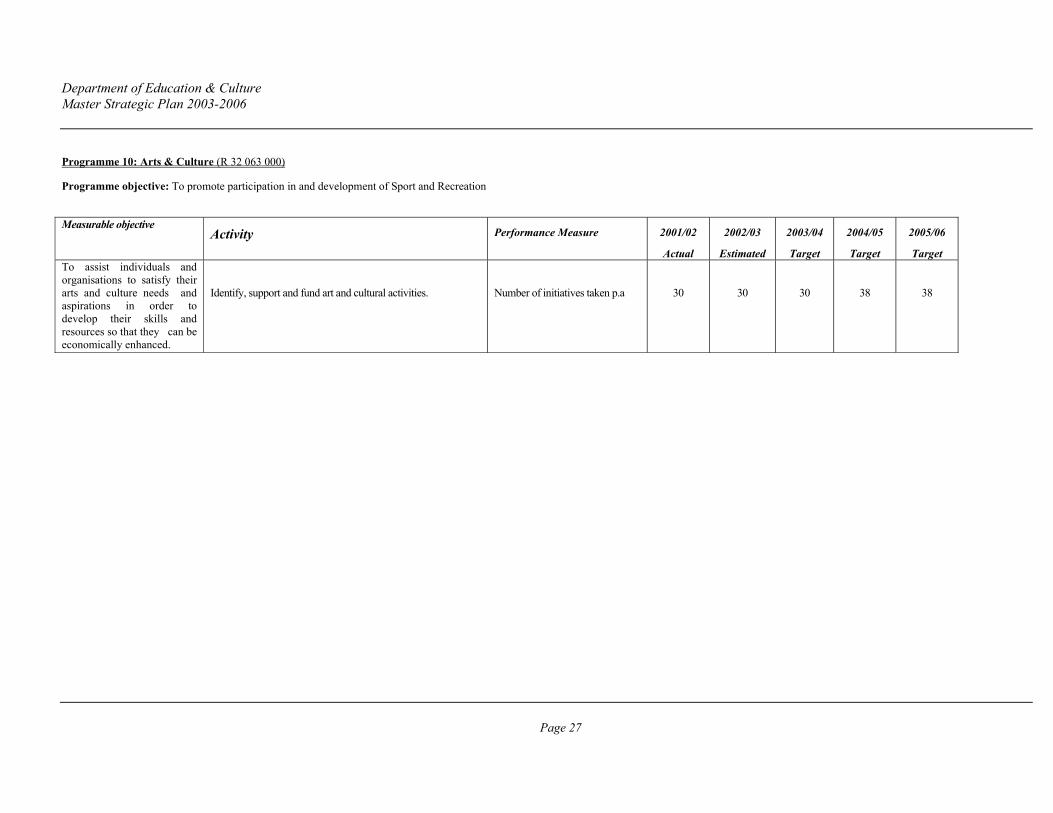
Programme 10: Arts & Culture (R 32 063 000)
Programme objective: To promote participation in and development of Sport and Recreation
Measurable objective
Activity Performance Measure 2001/02
Actual
2002/03
Estimated
2003/04
Target
2004/05
Target
2005/06
Target To assist individuals and organisations to satisfy their arts and culture needs and aspirations in order to develop their skills and resources so that they can be economically enhanced.
Identify, support and fund art and cultural activities.
Number of initiatives taken p.a
30
30
30
38
38

Department of Education & Culture Master Strategic Plan 2003-2006
Page 28
7. MEDIUM TERM REVENUES AND EXPENDITURES 7.1 Summary of Revenue
2001/02 R'000
2002/03 R'000
2003/04 MTEF R'000
2004/05 MTEF R'000
Voted by legislature 9 129 322 9 674 208 10 541 120 11 177 813
Conditional grants 136 438 224 898 295 568 327 656
Total 9 265 760 9 899 106 10 836 688 11 505 469
7.2 Summary of expenditure by programme
Programme Name 2001/02 actual R'000
2002/03 estimated
R'000
2003/04 target R'000
2004/05 target R'000
1 Administration 612 892 561 990 651 164 694 818
2 Public ordinary school education 7 840 864 8 677 302 10 047 334 10 661 677
3 Independent School 17 203 22 655 26 400 28 000
4 Special Schools Education 190 817 217 722 234 664 249 900
5 FET 135 617 152 755 201 064 214 398
6 ABET 27 599 40 923 46 803 49 659
7 Early Childhood Development 42 374 58 064 66 649 79 178
8 Auxiliary & Assoc. Services 262 402 347 314 420 952 444 701
9 Sport & Recreation 11 747 16 030 20 485 21 427
10 Arts & Culture 22 575 19 889 32 063 33 233
11 Teacher Training 96 194 26 075 0 0
Total expenditure 9 265 761 10 141 197 11 868 056 12 677 469

Department of Education & Culture Master Strategic Plan 2003-2006
Page 29
8. CO-ORDINATION, CO-OPERATION AND OUTSOURCING PLANS 8.1 Inter Departmental Linkages
Important Partnerships have been forged by the Department with the:
o Department of Health regarding HIV/AIDS and feeding schemes;
o Department of Works concerning projects identified by the Department for the delivery of sanitation facilities at schools, the electrification of schools and school building/extension/ maintenance programmes.
8.2 Local Government Linkages
There are limited linkages with local government in respect of Arts & Culture activities, such as libraries and museums; however, the Department is currently exploring other areas of mutual benefit, particularly in respect of HIV/AIDS.
The Department supports the rural development strategy outlined by National Government and is working to align Departmental structures to local government structures and has revised the demarcation to achieve this.
8.3 Public Entities
The Department is responsible for the payment of a subsidy towards Amafa Akwazulu–Natali (“Amafa”). Amafa is tasked with conserving, protecting and administering the heritage resources of the Province in terms of the KwaZulu-Natal Heritage Act. In addition, Amafa administers all National Monuments in the Province on an agency basis for the South African Heritage Resource Agency (SAHRA) in terms of a memorandum of understanding. This document also charges Amafa with the responsibility of administering all immovable properties in the Province owned by SAHRA.
8.4 Public – Private Partnerships
The Department has a number of relationships with private organisations through the Education Trust, generally to obtain funding and other resources. In any relationship with a private party, the Department retains complete control over the relationship and any outcomes of the relationship.
Department of Education & Culture Master Strategic Plan 2003-2006
Page 30
PART C: BACKGROUND INFORMATION
11. SITUATIONAL ANALYSIS OF THE SYSTEM AS A WHOLE 11.1 KZN Education Profile
Planning for the provision of education services is an intricate and a complex exercise. Effective and efficient planning requires synergy and the coordination of a number of internal and external stakeholders. The KwaZulu-Natal Department of Education and Culture has its own challenges emanating from the huge scale of operations involving 2,8 million learners and responsibility for managing 5 968 schools. The 5 968 schools are distributed over four regions covering 184 606 square kilometers. It is also responsible for adult basic education and training further education and training and early childhood development.
The following statistics represented below indicate some of the dynamics that impact upon the situation:
• Of the 8,5 million people in KwaZulu-Natal, about 61% are considered to be in rural areas (against a national average of 46%). There are significant difficulties in accessing rural schools.
• The number of schools accessible only by footpath or poor gravel road is 3 370 or 56%
• Twenty-three percent (23%) of the KwaZulu-Natal population has little or no education (against national average of 19%). This impacts on the ability of parents to contribute meaningfully to their children’s education
• Only 53% of schools have a telephone connection. • Sixty percent (60%) of schools have no power supply • Thirty-four percent (34%) of schools have no water on site • Three hundred and thirty-three (333) schools have no toilets at all while 3030 (51%)
use pit latrines.
Despite the challenges, the Department recorded a pass rate in the 2002 Senior Certificate Examinations of 70.2%, an improvement of 8% over the previous year. This achievement can be attributed to the commitment and dedication of educators, learners and management.
Factors affecting the demand for service delivery
The key factors affecting the demand for service delivery are:
• The largely rural nature of the province; • The lack of widespread infrastructure, including communications; • The prevalence of the HIV/AIDS pandemic; and • The widespread poverty arising from the rural nature of the province, the generally
depressed economy and the lack of previous comprehensive education facilities.
These factors require that the Department provide services over a wide area, often in sub-economic volumes and to parents who are not able to provide any educational support to the children. Consequently, the cost of service delivery is generally very high.

Department of Education & Culture Master Strategic Plan 2003-2006
Page 31
Factors affecting the supply of service delivery
• The largely rural nature of the province; • The lack of widespread infrastructure, including communications; • The prevalence of the HIV/AIDS pandemic; • Limited financial resources; • Compliance with legislation in respect of procurement; and • Internal capacity to deliver (in terms of the shortage in numbers and technical
expertise)
As noted above, these factors require that the Department provide services over a wide area, often in sub-economic volumes and to parents who are not able to provide any educational support to the children. Additionally, the distances from major centres are sufficiently large that it is difficult to provide cost-effective maintenance of buildings and equipment and comprehensive teaching facilities covering the full curriculum.
Department of Education & Culture Master Strategic Plan 2003-2006
Page 32
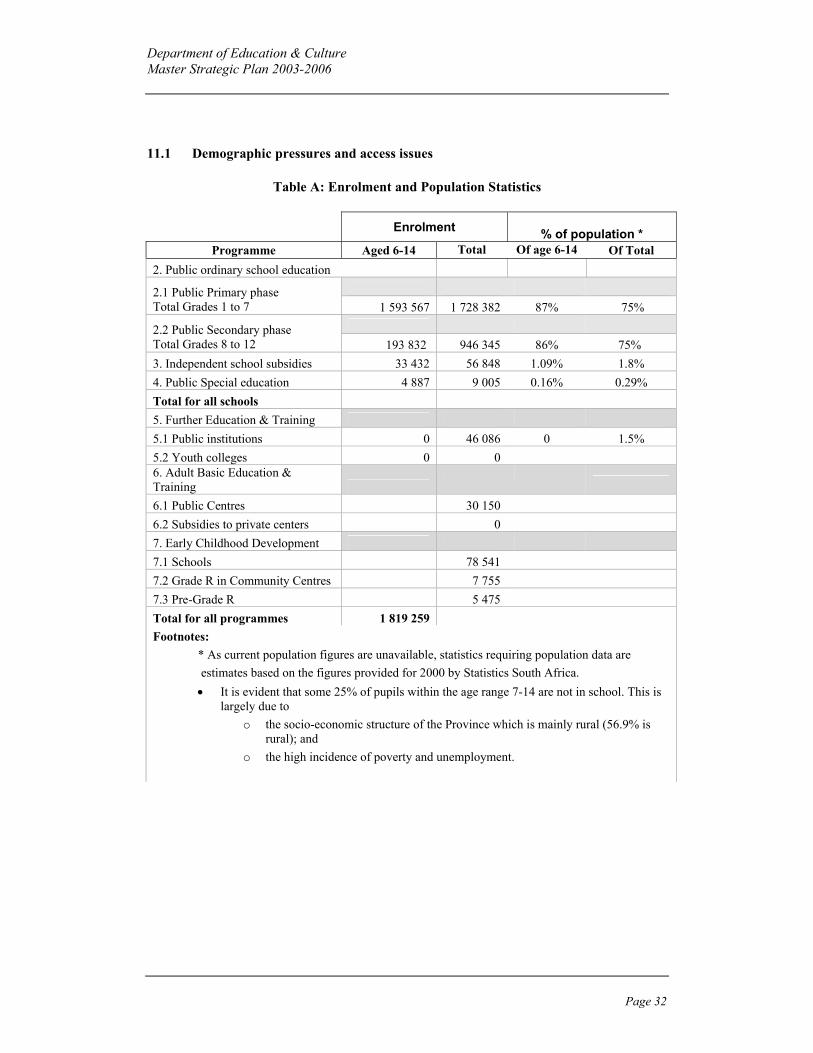
11.1 Demographic pressures and access issues
Table A: Enrolment and Population Statistics
Enrolment % of population *
Programme Aged 6-14 Total Of age 6-14 Of Total 2. Public ordinary school education
2.1 Public Primary phase Total Grades 1 to 7 1 593 567 1 728 382 87% 75%
2.2 Public Secondary phase Total Grades 8 to 12 193 832 946 345 86% 75% 3. Independent school subsidies 33 432 56 848 1.09% 1.8% 4. Public Special education 4 887 9 005 0.16% 0.29% Total for all schools 5. Further Education & Training 5.1 Public institutions 0 46 086 0 1.5% 5.2 Youth colleges 0 0 6. Adult Basic Education & Training
6.1 Public Centres 30 150 6.2 Subsidies to private centers 0 7. Early Childhood Development 7.1 Schools 78 541 7.2 Grade R in Community Centres 7 755 7.3 Pre-Grade R 5 475 Total for all programmes 1 819 259 Footnotes:
* As current population figures are unavailable, statistics requiring population data are estimates based on the figures provided for 2000 by Statistics South Africa. • It is evident that some 25% of pupils within the age range 7-14 are not in school. This is
largely due to o the socio-economic structure of the Province which is mainly rural (56.9% is
rural); and o the high incidence of poverty and unemployment.

Department of Education & Culture Master Strategic Plan 2003-2006
Page 33
11.2 Institutional Landscape
Table B : Number of institutions
Programme Public Institutions
Subsidised Private
Institutions
Non Subsidised
Private institutions
Total Institutions
2 Public ordinary school education 2.1 Public Primary phase 3 891 3 8912.2 Public Secondary phase 1 456 1 4562.3 Combined Schools 266 2663 Independent school subsidies 133 183 3164 Public Special education 55 9 645 Further Education and Training 9 95.1 Public institutions 9 95.2 Youth Colleges 0 06 Adult Basic Educ & Training 356 3566.1 Public centres 356 3566.2 Subsidies to private centres 0 07 Early Childhood Development 2 525 2 5257.1 Schools 1 989 1 9897.2 Gr R in Community Centres 07.3 Pre-GradeR 536 536
Total for all Programmes 8 598 133 192 8 883 *
* The 8 883 Total for all Programmes includes institutions which offer early childhood education as well as ABET. Some of the ABET as well as ECD classes are attached to Public Ordinary schools and are thus counted as two institutions. In fact the KZNDEC has 6 015 institutions.
Footnotes:
• All figures represent the situation in the school year 2002.
• Independent ordinary schools, which do not receive a subsidy, appear in the row for Programme 3, under “Non-subsidised private institutions”.
• The enrolment data for Programme 7 is the sum of the enrolment figures for sub-programme 7.1 and 7.3.
• The total for Programme 5 refers to Public Institutions only.
• No Youth Colleges.
Department of Education & Culture Master Strategic Plan 2003-2006
Page 34
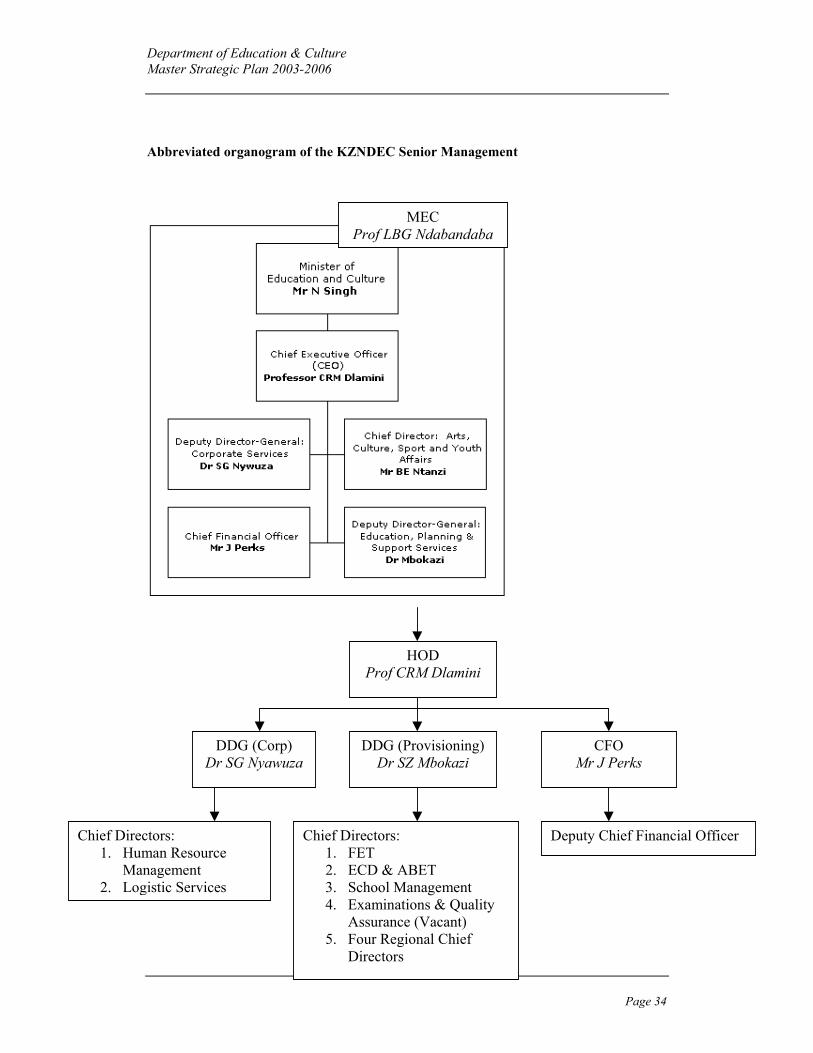
Abbreviated organogram of the KZNDEC Senior Management
MEC Prof LBG Ndabandaba
HOD Prof CRM Dlamini
DDG (Corp) Dr SG Nyawuza
DDG (Provisioning)Dr SZ Mbokazi
CFO Mr J Perks
Chief Directors: 1. Human Resource
Management 2. Logistic Services
Chief Directors: 1. FET 2. ECD & ABET 3. School Management 4. Examinations & Quality
Assurance (Vacant) 5. Four Regional Chief
Directors
Deputy Chief Financial Officer

Department of Education & Culture Master Strategic Plan 2003-2006
Page 35
This organogram will become effective from 1 April 2003 and is designed to improve efficiency of the Department. The Province has reduced the number of Regions from 8 to 4 with a view to bringing the service “closer to the people”. The entire process of restructuring is to be finalized by 31 March 2003.
11.3 BUDGETED RESOURCES
11.3.1 Physical Infrastructure The Province has a unique and complex population profile, this is reflected by the full spectrum of diverse communities ranging from the wealthiest and most privileged to the poorest and most disadvantaged communities. Spatial disparities are alarmingly evident. A similar pattern is found with the infrastructure in the Province, the Provincial profile is such that there is diverse population distribution ranging from metropolitan areas with very large informal settlements to small isolated rural communities. Some areas have the best of infrastructure whilst others have no water, no electricity or even roads and mostly worst of school buildings. With respect to school buildings, specifically where the Department of Public Works is the implementing agent, the number of school buildings classified “weak” or “very weak” is 1 896 or 32% of all schools. The backlog in the number of classrooms needed is 14 667. At current delivery rates this equates to a 9-year backlog. Other statistics show that: • Thirty-four percent (34%) of schools have no principal’s office • Seventy-seven percent (77%) of schools have no library • Eighty percent (80%) of schools have no strong room • Eighty-five percent (85%) of schools have no laboratory • Eighty-nine percent (89%) of schools have no computer rooms. As a consequence
75% are without computers, and
The compulsory introduction of Grade R classes places further strain on the Department. There are currently 1 078 Grade R classes catering for 80 007 learners. By the year 2010 the number of classes will have to be increased to 5 970 in order to cater for 273 633 learners. This represents an annual compounded growth rate of 23, 8% per annum over 8 years. This clearly requires careful planning.
The Department has the School Infrastructure Development Plan that covers the period of 2002/03 to 2007/08 financial year. The magnitude of the basic, essential infrastructure needs of the Department is such that the focus is exclusively on providing additional/replacement classrooms and toilets as well as water where possible (water tanks). Apart from being severely overcrowded, 2 950 of the most disadvantaged schools
Department of Education & Culture Master Strategic Plan 2003-2006
Page 36
have classrooms and toilets of completely inferior original construction, some dating as back as 1947. In such situations it is not economically viable to undertake repairs. Instead such structures need to be demolished and replaced. The infrastructure backlog, especially shortage of classrooms (14 000 classroom shortage) results in a situation where teachers are sometimes not gainfully employed, for instance, twenty educators in a school with only ten classrooms and enrolment of 750 learners. For this reason it is considered more critical to provide more classrooms in existing schools than to build new schools. Where possible and especially in the case of larger schools, additional ordinary classroom spaces are provided to be used as storage and office accommodation. The Plan envisages that only when the Department starts showing significant reductions in overcrowding and in the instances of highly unacceptable poor structures used as learning spaces, will increased funding be re-directed towards providing administration blocks, media centers and computer laboratories. In order to keep track of specific projects and to ensure that different areas are attended to and that all programs are properly managed, different activities are grouped into categories, such as, Building Program – referring to the construction of buildings. The Plan therefore has the following categories:
• Day-to- day Maintenance Program (school and non-school buildings) This refers to the small day-to-day maintenance jobs such as replacing broken cisterns, windows, repairing minor roof leaks, etc. This type of work is handled at the regional level rather than head office.
• Repair and Renovation Program This category is for projects of limited scope such as the complete replacement of a roof or the complete renovation and upgrading of a structurally sound school complex. Sometimes during the renovation exercise electricity is installed if it is seen to be viable and cost-effective.
• Sub-500 Program This category includes all the projects costing less than R500 000. It may be replacements, adding limited new classrooms to existing facilities (classrooms, toilets, offices, store rooms, fencing of schools for safety reasons and water program). The rationale behind limiting the value of these projects to R500 000 is to ensure that available budget/funds are spread as much as possible to the needy areas. Because the projects are relatively small, completion time is shorter and projects are ideally for emerging contractors.
• New Schools These are big projects that run over multiple years. Schools are distributed across the Province and in many cases new constructions are for replacement of buildings.
• Major Capital Works These are extensive additions to the existing schools often demolished and replacing irreparable structures. These projects cost far above R500 000 per project.
• Hiring and Purchase of land

Department of Education & Culture Master Strategic Plan 2003-2006
Page 37
These are very small programs with expenditure determined by existing agreements and specific needs from time to time. Table: School Infrastructure Improvement Budget for the School Infrastructure Improvement Program – 2002/03 to 2007/08 No. Program 2002/03
R’000 2003/04 R’000
2004/05 R’000
2005/06 R’000
2006/07 R’000
2007/08 R’000
Total R’000
1 Day-to-day Maintenance
80 000 111 000 145 000 150 000 100 000 110 0000 565 000
2 Repairs and Renovations
80 000 110 000 195 000 200 000 90 000 90 000 535 000
3 Major Capital Works -Sub 500 -New Schools -Additions
45 000 20 000 13 500
90 233 59 504 20 000
90 000 40 000 34 000
92 000 40 000 100 000
92 000 40 000 150 000
92 000 50 000 175 000
501 000 240 000 489 000
4 Non Schl Bld maintenance
24 000 30 118 32 513 35 064 34 000 36 000 192 895
5 Hiring 541 969 1 088 1 255 2 000 3 000 9 799 Total 263 041 421 824 543 671 617 499 502 000 556 000 2 484 579
Note:
• For 2002/3 figures are taken from the adjusted budget • For 2003/4 it is the approved infrastructure budget as per Budget Statement • Funding norms also provide additional funding directly to schools that may be used for daily maintenance with
the poorest schools receiving proportionally higher per capita allocations.
11.3.2 Employees
Table C: Resourcing Effected Via The Post Provisioning Norms
Programmes/purpose of posts
Total posts Learners L:E ratio
Posts top-sliced before model is run
2 238
Post distributed by Model • Primary phase 43 221 1 626 877 37.6
• Secondary phase 30 424 1 020 804 33.6
• Poverty redress 3 675.2
• Special school allocation
918
• FET 950
TOTAL 81 426 2 647 681 Total educator posts 73 645
Category PL 1 PL2 PL3 PL4
Educators 54 899 11 395 5 703 1648

Department of Education & Culture Master Strategic Plan 2003-2006
Page 38
Office based 0 319 314 353
Footnote: These figures represent the situation in the school year 2003 as planned. Top sliced posts include: 918 ELSEN, 900 grade R, 100 AD hoc and 320 substitutes. While the table above reflects 73 645 educator posts, some of these posts are vacant.
Department of Education & Culture Master Strategic Plan 2003-2006
Page 39
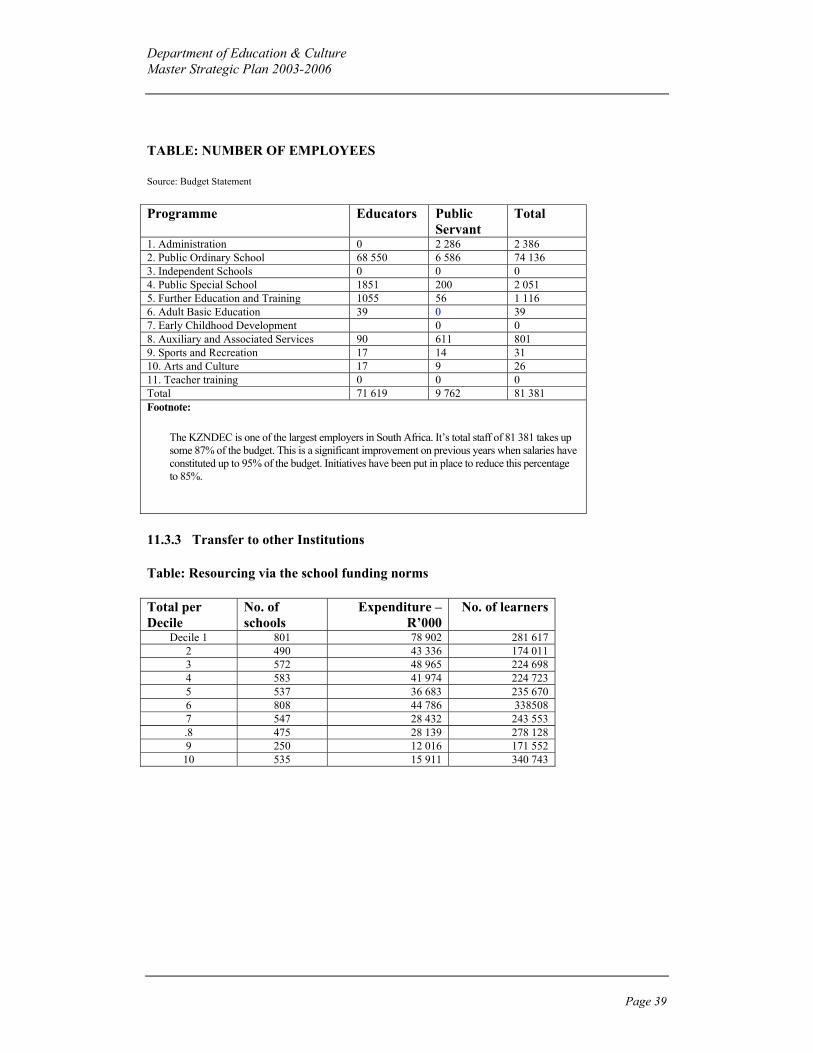
TABLE: NUMBER OF EMPLOYEES
Source: Budget Statement
Programme Educators Public Servant
Total
1. Administration 0 2 286 2 386 2. Public Ordinary School 68 550 6 586 74 136 3. Independent Schools 0 0 0 4. Public Special School 1851 200 2 051 5. Further Education and Training 1055 56 1 116 6. Adult Basic Education 39 0 39 7. Early Childhood Development 0 0 8. Auxiliary and Associated Services 90 611 801 9. Sports and Recreation 17 14 31 10. Arts and Culture 17 9 26 11. Teacher training 0 0 0 Total 71 619 9 762 81 381 Footnote:
The KZNDEC is one of the largest employers in South Africa. It’s total staff of 81 381 takes up some 87% of the budget. This is a significant improvement on previous years when salaries have constituted up to 95% of the budget. Initiatives have been put in place to reduce this percentage to 85%.
11.3.3 Transfer to other Institutions
Table: Resourcing via the school funding norms
Total per Decile
No. of schools
Expenditure –R’000
No. of learners
Decile 1 801 78 902 281 617 2 490 43 336 174 011 3 572 48 965 224 698 4 583 41 974 224 723 5 537 36 683 235 670 6 808 44 786 338508 7 547 28 432 243 553 .8 475 28 139 278 128 9 250 12 016 171 552 10 535 15 911 340 743

Department of Education & Culture Master Strategic Plan 2003-2006
Page 40
Table: Details Of Resourcing Effected Via The School Funding Norms
Status Poverty Decile
School Total expenditure
R’000
Learners Expenditure per learner
Rands S21 1 82 10 619 37 903 280 21 2 44 5 876 23 593 249 21 3 65 7 225 33 156 218 21 4 61 6 208 33 235 187 21 5 75 5 579 35 844 156 21 6 103 6 929 52 370 132 21 7 68 4 729 40 509 117 21 8 86 5 885 58 167 101 21 9 64 3 581 51 129 70 21 10 314 9 353 200 297 47 S20 1 719 68 282 243 714 280 20 2 446 37 461 150 418 249 20 3 507 41 739 191 542 218 20 4 522 35 767 191 488 187 20 5 462 31 103 199 826 156 20 6 705 37 857 286 138 132 20 7 479 23 703 203 044 117 20 8 389 22 254 219 961 101 20 9 186 8 435 120 423 70 20 10 221 6 558 140 446 47 Footnotes:
• All figures represent the situation in the school year 2002. • Financial figures represent actual expenditure, and not budgeted
amounts. • “Expenditure per learner” is “Total expenditure” divided by
“Learners”.
Department of Education & Culture Master Strategic Plan 2003-2006
Page 41
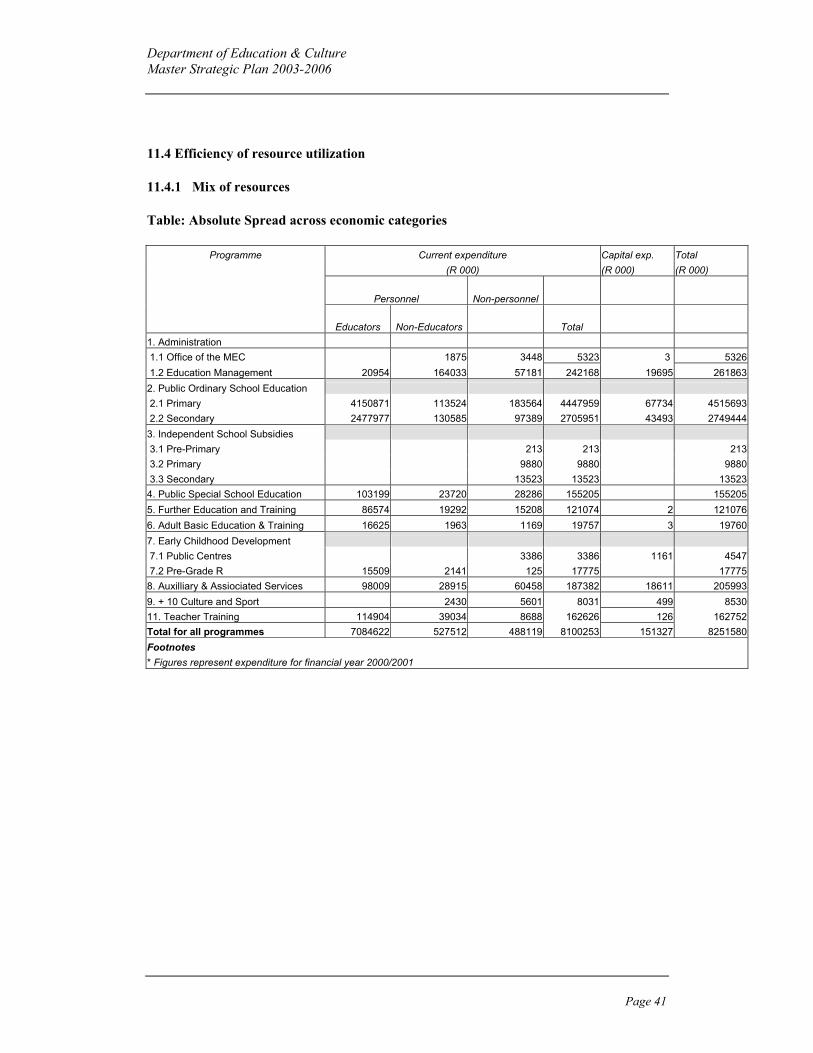
11.4 Efficiency of resource utilization
11.4.1 Mix of resources
Table: Absolute Spread across economic categories
Programme Current expenditure Capital exp. Total (R 000) (R 000) (R 000)
Personnel Non-personnel
Educators Non-Educators Total 1. Administration 1.1 Office of the MEC 1875 3448 5323 3 5326 1.2 Education Management 20954 164033 57181 242168 19695 2618632. Public Ordinary School Education 2.1 Primary 4150871 113524 183564 4447959 67734 4515693 2.2 Secondary 2477977 130585 97389 2705951 43493 27494443. Independent School Subsidies 3.1 Pre-Primary 213 213 213 3.2 Primary 9880 9880 9880 3.3 Secondary 13523 13523 135234. Public Special School Education 103199 23720 28286 155205 1552055. Further Education and Training 86574 19292 15208 121074 2 1210766. Adult Basic Education & Training 16625 1963 1169 19757 3 197607. Early Childhood Development 7.1 Public Centres 3386 3386 1161 4547 7.2 Pre-Grade R 15509 2141 125 17775 177758. Auxilliary & Assiociated Services 98009 28915 60458 187382 18611 2059939. + 10 Culture and Sport 2430 5601 8031 499 853011. Teacher Training 114904 39034 8688 162626 126 162752Total for all programmes 7084622 527512 488119 8100253 151327 8251580Footnotes * Figures represent expenditure for financial year 2000/2001

Department of Education & Culture Master Strategic Plan 2003-2006
Page 42
TABLE: PROPORTIONAL SPREAD ACROSS ECONOMIC CATEGORIES
Programme % Current expenditure % Capital exp. % Total
% Personnel % Non-
personnel
% Educators % Non-
Educators % Total 1. Administration 1.1 Office of the MEC 35.20 64.74 99.94 0.06 100 1.2 Education Management 8.00 62.64 21.84 92.48 7.52 1002. Public Ordinary School Education 2.1 Primary 91.92 2.51 4.07 98.5 1.50 100 2.2 Secondary 90.13 4.75 3.54 98.42 1.58 1003. Independent School Subsidies 3.1 Pre-Primary 100 100 100 3.2 Primary 100 100 100 3.3 Secondary 100 100 1004. Public Special School Education 66.50 15.28 18.22 100 1005. Further Education and Training 71.50 15.93 12.56 99.99 0.01 1006. Adult Basic Education & Training 84.13 9.93 5.92 99.98 0.02 1007. Early Childhood Development 7.1 Public Centres 74.47 74.47 25.53 100 7.2 Pre-Grade R 87.25 12.05 0.70 100 1008. Auxilliary & Assiociated Services 47.58 14.04 29.35 90.97 9.03 1009. + 10 Culture and Sport 28.49 65.66 94.15 5.85 10011. Teacher Training 70.60 23.98 5.34 99.92 0.08 100Total for all programmes Footnotes * Percentages represent expenditure for financial year 2000/2001

Department of Education & Culture Master Strategic Plan 2003-2006
Page 43
12. PROGRAM ONE
The hallmark of KwaZulu-Natal Department of Education and Culture’s approach to education has been a commitment to address two key priorities:
• Achieving equitable access to education; and
• Improving the quality of education provision.
The department is also committed to proper implementation of the principles of Employment Equity. Having adopted this approach, it became important for the department to realise the importance of competence and support services. Recognising this, the Department has commenced implementing formal performance definition and measurement procedures together with effective labour relations management. 12.1 IT Systems
The Department uses standard software as used throughout National and Provincial government except where specific requirements cannot be met by the use of standard systems. The most current versions of government provided software are not always used.
The Financial Systems currently in use are not fully integrated in real-time and interact with each other by means of interfaces. They have been designed to meet the needs of a cash based accounting system although commitment accounting is provided. There is a clear move towards accrual system of accounting. The ability of the current systems to deal with the accrual system of accounting is still to be determined, however, the Department will move from FMS to BAS during the 2003/04 financial year. SITA assumes responsibility for management and maintenance of all IT systems. 12.2 Performance Management Systems
The Department is currently implementing effective personnel performance definition, monitoring and management systems.
Department of Education & Culture Master Strategic Plan 2003-2006
Page 44
12.3 Financial Management
The KwaZulu-Natal Department of Education and Culture receives the second biggest budget nationally. The budget allocation to the Department for the 2002/3 financial period is approximately R10 billion. The following issues are critical to understanding the financial management of the department:
• Revenue is generally from either voted funds or conditional grants; internally
generated revenue is insignificant;
• The principal line of expenditure comprises personnel costs, which are managed against budgetary limits. The payment of staff salaries is processed through a government provided, computerised system known as Personnel and Salary Administration or “PERSAL”. The appointment of personnel and the authorisation of their salaries on PERSAL is undertaken by the Personnel Division. The Salary Section, at present, attends to changes to the salary information of an employee;
• The remaining expenditure is controlled through the use of commitment registers (which are manually controlled) and the budgets for each programme and sub-programme;
• The department has a Division known as ‘Risk Management and Internal Control’, which is primarily tasked with monitoring all expenditures and investigating abnormal financial and non-financial issues;
• Expenditure is managed primarily by extracting information from the Financial Management System;
• A number of the processes involved in the capturing and processing of financial data are manually based;
• Senior management reviews revenue and expenditure through their review of the monthly management accounts;
• Internal audit is outsourced to Provincial Treasury. The scope of their work is not restricted.
12.4 Audit Queries
Audit queries are addressed as and when they are received. They are dealt with from two perspectives:
• To quantify and resolve an existing problem; and
• To put effective procedures in place to prevent recurrence of identified issues.
Department of Education & Culture Master Strategic Plan 2003-2006
Page 45
12.5 Plans for Capital Investment and Asset Management
The Department is currently commencing a review to determine the future capital requirements in terms of buildings both for administration and education purposes. This will include the requirements for new buildings, improvement to existing property and the ongoing repairs and maintenance.
Long-term investment plans for assets with a relatively short life (for example: computer equipment and motor vehicles) are not planned in this category. Asset management in respect of fixed assets will be controlled through a central asset management database and depreciation according to Treasury practice notes will be applied.
Policies for accounts receivable and other non-fixed assets are presently being implemented. In addition, current asset and liability management through the monthly management accounts is being implemented at present.
Department of Education & Culture Master Strategic Plan 2003-2006
Page 46
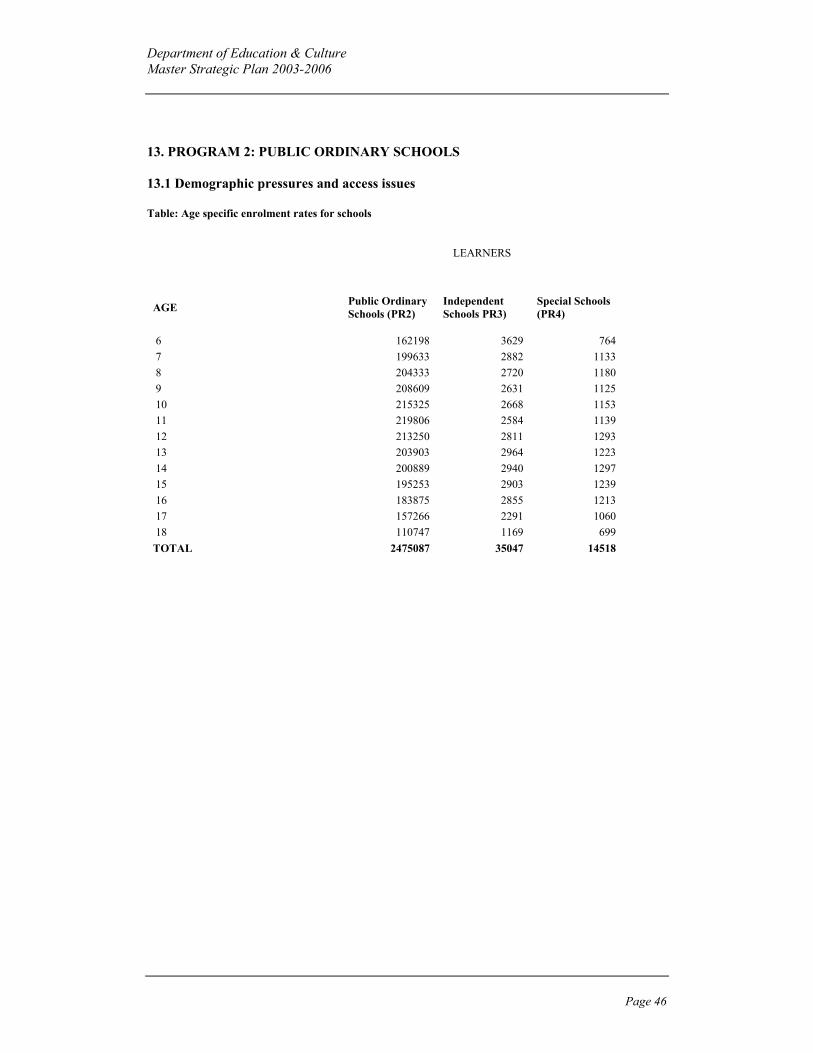
13. PROGRAM 2: PUBLIC ORDINARY SCHOOLS 13.1 Demographic pressures and access issues Table: Age specific enrolment rates for schools
LEARNERS
AGE Public Ordinary Schools (PR2)
Independent Schools PR3)
Special Schools (PR4)
6 162198 3629 764 7 199633 2882 1133 8 204333 2720 1180 9 208609 2631 1125 10 215325 2668 1153 11 219806 2584 1139 12 213250 2811 1293 13 203903 2964 1223 14 200889 2940 1297 15 195253 2903 1239 16 183875 2855 1213 17 157266 2291 1060 18 110747 1169 699 TOTAL 2475087 35047 14518

Department of Education & Culture Master Strategic Plan 2003-2006
Page 47
13.2 Budgeted Resources 13.2.1 Physical Infrastructure classrooms available for public ordinary schools 13.2.2 Employees
Table: Learner-Educator Ratios In Programme 2 Schools
LEARNERS EDUCATORS PUBLIC L:E Public Primary Phase Decile 1 223 456 6 267 35.7 Decile 2 125 969 3 423 36.8 Decile 3 Decile 4 155 928 4 136 37.7 Decile 5 190 497 4 890 38.9 Decile 6 140 565 4 073 34.5 Decile 7 125 327 3 133 40.0 Decile 8 164 572 4 797 34.3 Decile 9 110 452 2 612 42.3 Decile 10 173 335 4 172 41.5 Public Secondary Phase
Decile 1 82 968 2 573 32.2 Decile 2 54 941 1 771 31.0 Decile 3 110 025 3 396 32.4 Decile 4 86 741 2 595 33.4 Decile 5 114 056 3 404 33.5 Decile 6 101 248 3 011 33.6 Decile 7 87 702 2 548 34.4 Decile 8 153 445 4 468 34.3 Decile 9 94 754 2 712 34.9 Decile 10 134 928 3 946 34.2 Footnote: All figures represent the situation in the school as planned for academic year 2002.
Department of Education & Culture Master Strategic Plan 2003-2006
Page 48
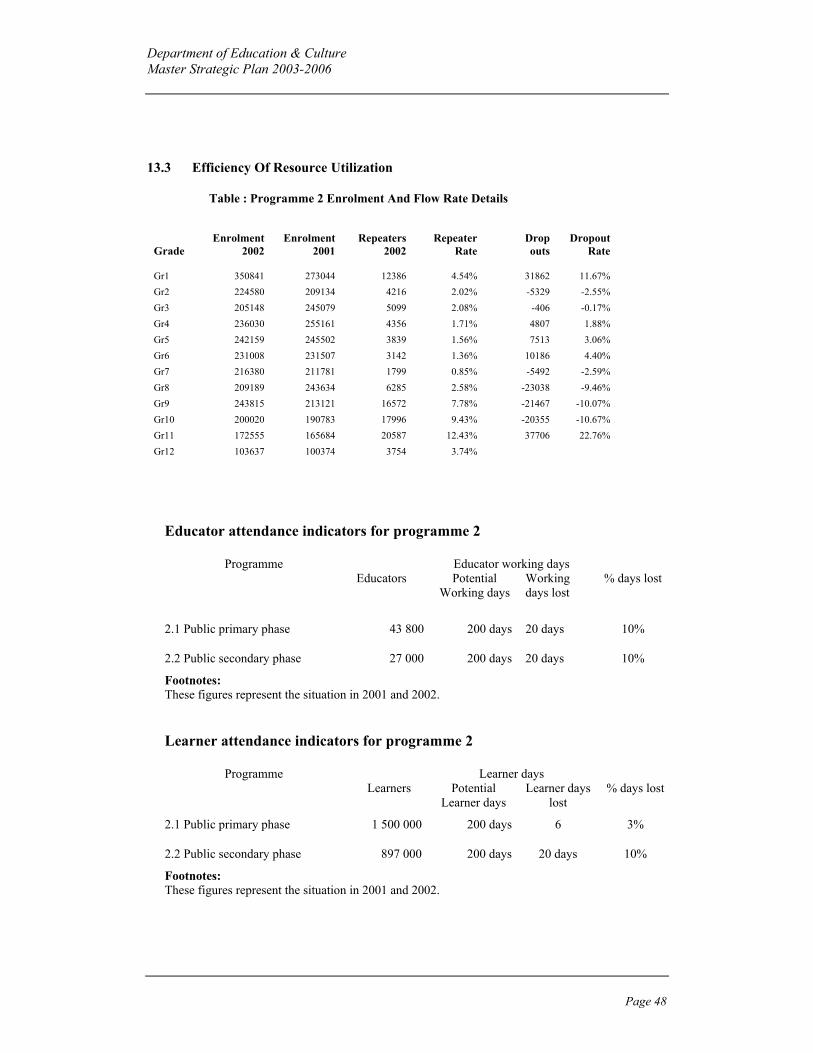
13.3 Efficiency Of Resource Utilization Table : Programme 2 Enrolment And Flow Rate Details
Grade Enrolment
2002 Enrolment
2001 Repeaters
2002 Repeater
Rate Drop outs
Dropout Rate
Gr1 350841 273044 12386 4.54% 31862 11.67% Gr2 224580 209134 4216 2.02% -5329 -2.55% Gr3 205148 245079 5099 2.08% -406 -0.17% Gr4 236030 255161 4356 1.71% 4807 1.88% Gr5 242159 245502 3839 1.56% 7513 3.06% Gr6 231008 231507 3142 1.36% 10186 4.40% Gr7 216380 211781 1799 0.85% -5492 -2.59% Gr8 209189 243634 6285 2.58% -23038 -9.46% Gr9 243815 213121 16572 7.78% -21467 -10.07% Gr10 200020 190783 17996 9.43% -20355 -10.67% Gr11 172555 165684 20587 12.43% 37706 22.76% Gr12 103637 100374 3754 3.74%
Educator attendance indicators for programme 2
Programme Educator working days Educators Potential
Working days
Working days lost
% days lost
2.1 Public primary phase 43 800 200 days 20 days 10%
2.2 Public secondary phase 27 000 200 days 20 days 10%
Footnotes: These figures represent the situation in 2001 and 2002.
Learner attendance indicators for programme 2
Programme Learner days Learners Potential
Learner days Learner days
lost % days lost
2.1 Public primary phase 1 500 000 200 days 6 3%
2.2 Public secondary phase 897 000 200 days 20 days 10%
Footnotes: These figures represent the situation in 2001 and 2002.