l ecture t wo : d emand ipem tohoku university managerial economics lecturer: jack wu period 2 and...
TRANSCRIPT

LECTURE TWO:DEMANDIPEM Tohoku UniversityManagerial EconomicsLecturer: Jack WuPeriod 2 and 3/ February 14 2011

RISING GASOLINE PRICES
Between September 2004 and September 2005, the monthly average retail price of gasoline jumped from $1.85 per gallon to $3.08 per gallon. Sales of full-size SUVs dropped 16.8% over the same time period (with a particularly sharp 42.5% drop for full-size GM SUVs).
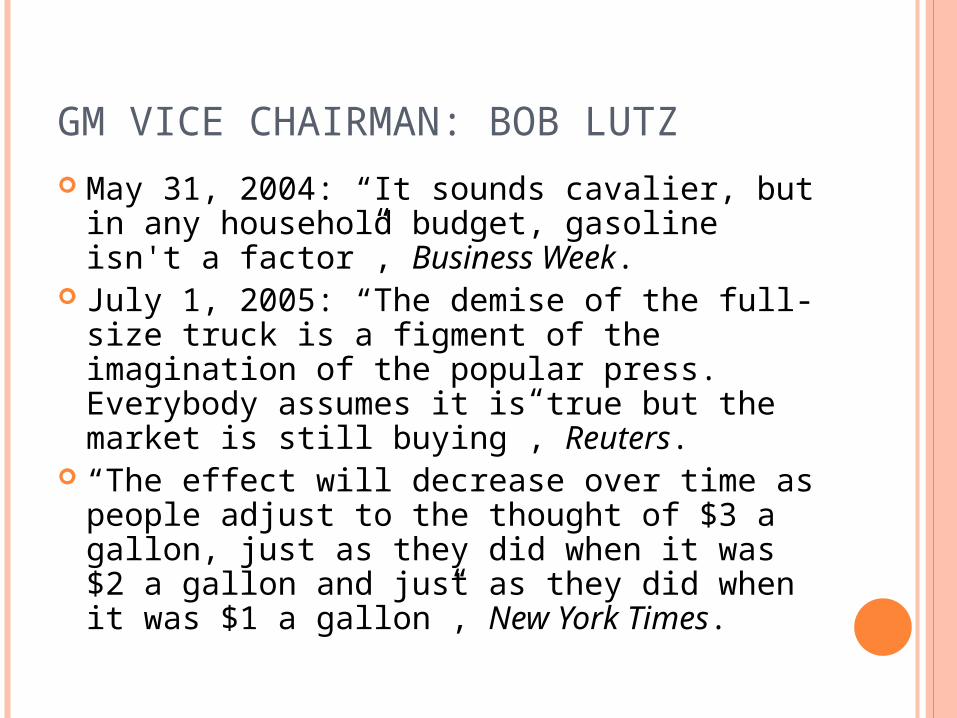
GM VICE CHAIRMAN: BOB LUTZ May 31, 2004: “It sounds cavalier, but in any
household budget, gasoline isn't a factor”, Business Week.
July 1, 2005: “The demise of the full-size truck is a figment of the imagination of the popular press. Everybody assumes it is true but the market is still buying”, Reuters.
“The effect will decrease over time as people adjust to the thought of $3 a gallon, just as they did when it was $2 a gallon and just as they did when it was $1 a gallon”, New York Times.
MANAGERIAL ECONOMICS QUESTIONS
How important are gasoline prices to the sales of SUVs and other types of automobiles?
How should the auto manufacturers respond to the increasing price of gasoline?
Are manufacturer incentives (i.e. price reductions) an effective response?
What are the combined effects of incentives and increasing gas prices?

MANAGERIAL ECONOMICS TOOL: DEMAND
We apply demand to show how the rising price of gasoline has caused decreases in large SUV sales, and how manufacturer incentives can offset these reductions.
INDIVIDUAL DEMAND CURVE
Definition: graph of quantity that buyer will purchase at every possible price Construction -- “Other things equal, how many would you buy at a price of ….?’’ vertical axis -- price horizontal axis -- quantity
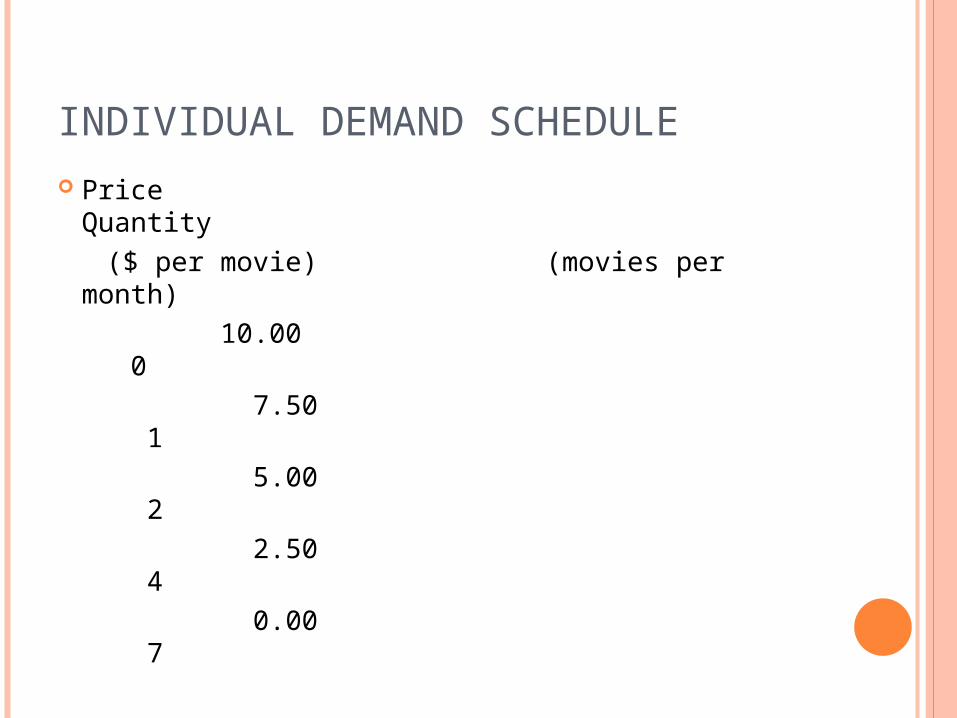
INDIVIDUAL DEMAND SCHEDULE
Price Quantity ($ per movie) (movies per month) 10.00 0 7.50 1 5.00 2 2.50 4 0.00 7

0
2.50
5
7.50
10
1 4 72
individual demand curve
Quantity (Movies a month)
Pri
ce (
$ p
er
movie
)
INDIVIDUAL DEMAND CURVE

INDIVIDUAL DEMAND SCHEDULE II
Price Quantity ($ per movie) (movies per month) 20.00 0 19.00 1 18.00 2 …. … 0.00 20
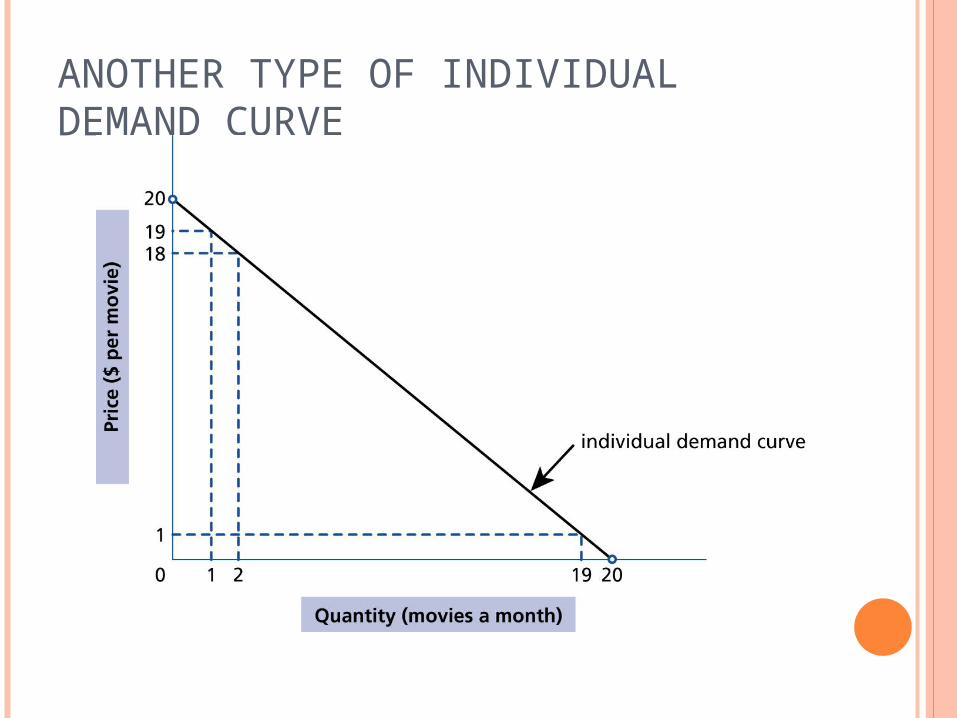
ANOTHER TYPE OF INDIVIDUAL DEMAND CURVE
TWO VIEWS
for every possible price, it shows the quantity demanded
for each unit of item, it shows the maximum price that the buyer is willing to pay
DEMAND CURVE: SLOPE
diminishing marginal benefit -- each additional unit of consumption/usage provides less benefit than the preceeding unit
demand curve slopes downward

CONSUMER DIFFERENCES
individual preferences different demand curves changes in consumer's preferences, eg, age different consumers

HOOVER, 1992
A negative price case:
Hoover’s special promotion -- two free air tickets (worth more than £400) for purchase of appliance over £100. promotion attracted over 100,000 customers Hoover incurred £48 million loss

DEMAND AND INCOME

DEMAND AND OTHER FACTORS
prices of related products substitutes complements
advertising

OTHER DEMAND FACTORS: SUBSTITUTES
Direct MBA education: Dartmouth / NYU / USC Transportation: American Airlines / British Airways
Functional MBA education – residential / distance learning Security: Lock and key / biometric / password Communication: airline / train / video-conferencing /

OTHER DEMAND FACTORS: COMPLEMENTS

CASE: RECORDED MUSIC
Argentina Canada
CD purchases 0.5 2.6
cassette purchases
0.2 0.4
GDP/capita $9,413 $19,831
CD price $13.80 $11.55
cassette price $ 7.80 $ 6.06

RECORDED MUSIC
Why the average Canadian bought more of both CDs and cassettes?
Why the ratio of CD to cassette purchases was relatively higher in Canada?

FOOTBALL: TO BROADCAST?
Live broadcasting of away games and attendance at home games are complements
Live broadcasting of home games and attendance at home games are both substitutes and complements

USED CARS
1990 1997/98
avg car age 7.5 yr 8.7 yr
median household income
up 29.9%
avg new car price up 48.4%

USED CARS
Reasons for the increasing demand for used cars:
_ fast rising price of new cars _ increasing quality of used cars _ auto manufacturer reduced frequency of
changing designs _ financial institutions began to offer more
favorable rates.

MARKET DEMAND
Price Joy Max Lucas Market
$10 0 0 0 0
$7.50 1 0 0 1
$5 2 1 0 3
$2.50 4 2 3 9
$0 7 6 4 17
Market demand = horizontal summation of individual demands

MARKET DEMAND: CONSTRUCTION

MARKET DEMAND: MACRO FACTORS
Income Average Distribution
Demographic Population Age structure Urban-rural
Cultural-social

MARKET DEMAND: MICRO FACTORS
Price Advertising R&D

0
2.50
5
7.50
10
1 2 4 7
c b e
h
j
g
d a
individual buyer surplus at $2.50 price
individual demand(marginal benefit) curve
Quantity (Movies a month)
Pri
ce (
$ p
er
movie
)
c
f
INDIVIDUAL BUYER SURPLUS

BUYER SURPLUS: INDIVIDUAL

GAINS FROM PRICE CUT
lower price on the quantity that he/she would have purchased at the original price (inframarginal units)
he/she can buy more (marginal units) Case: Student discount price for movie

PACKAGE DEAL
charge buyer just a little less than her/his total benefit
leave buyer with almost zero surplus

BUYER SURPLUS:TWO-PART PRICING
fixed payment usage charge
usage charge
fixed payment

BUYER SURPLUS: TWO-PART PRICINGBusiness Provider Fixed Fee Usage
Fee Broadband access, Hong Kong
PCCW Netvigator 3M Single User Plan
HK$298 per month (incl. 100 free hrs)
HK$2 per additional hr
Mobile telephone service, UAE
Etisalat Corporation, GSM Standard Service
125 dirham connection fee; 60 dirham per qtr
0.24/0.18 dirham per min (peak/
offpeak)
BUSINESS DEMAND, I
Business demands items as inputs into further production, not for consumption finished/semi-finished components -- raw materials and energy labor and other services capital

BUSINESS DEMAND, II
Demand for inputs depends on quantity of final output prices of complements and substitutes in
production

BUSINESS DEMAND CURVE
marginal benefit = increase in revenue arising from an additional unit of the input
diminishing marginal benefit downward-sloping demand

AUTOMATED TELLER MACHINES
increase in wages teller service became increasingly costly
banks used ATMs to substitute for tellers
compare use of ATMs in US vs India

GM: WHAT METAL TO USE?
aluminium vis-à-vis steel auto weight
fuel consumption emissions
price