la-7315 c*3 ‘.- .---- . ; - . i civ* -.-4.-a
TRANSCRIPT

.
ILA-731 5
C*3-. ,. ...—— ‘.- .---- . ; - .
..-. ----- CIV* -.-4.-A,.=, .,. .- -. . -. .- . ... . . . . . . . >.- .7. .-. s. . . . . . . ‘ --“.
REPRODUCTION ~
(6.—c
---—
COPY1S4 REPORT SECTION
—— —_ ..__
‘: ++
.-mm$?=”T.?4=f-w+w-w:@vY~ .—. . —.. —
~ ~. =s2--- # r.”..-. --.> ---- -.+ t-- w--d -L. . .~fmmam
.-. —— -
Concepts for Inventory Verification in
Critical Facilities
-.— ... . . . .. ,,. + .<, . .. . . ....’... . . . . . . . . . . . . . . . . . .. -:, .- ,., !_-, -=.-—
—— 1., . ,, . . . . . . . ., -k+.-.. . .+_-= ... _ . . .. . .-., -.=---z . ----- .-. .-—--- .—7. . .
,e.,-< ,.+ .,. e A--
--. —
!—— — —.— - . - — - . -m..-,---- . ..... % *----.-, --._.-—----- .-.,--, - -— . .. ---- ,___ .,._*
.
L%%LOSALAMOSSCIENTIFICLABORATORYPost Office Box 1663 Los Alamos, New Mexico 87545
.

An AffurnativeAction/EqualOpportunityEmployer
Work supported by the US Department of Energy,Office of Safeguardsand Security.
TM. r.wrt w.. prepared .s an .cc..nt of work spo.$.w.dby the Un$ted S1.1.s Govmnm. nt. N.tth.r lhe Umted St.tesnor the United St.les Department of Enemy. nor ..Y of Lhcitemployees, nor any of lhetr conw.ctm. subc(, ntr.cmrs. orCbetr .mpb’e e.. makes any warranlY. express .: tmph.d. orassume%.ny iced llabih Ly or responsib$isly for th. .ccutacv.comp]tte.ess. ?r usefulness of an. mfurm. tton. .W.r.t.s.product. or process dtscl.sed, or r.pr.svms that tts.- wouldmm mfrtntt pn.. tely owned tights.
UNITED STATES
DEPARTMENT OF EN ERGV
CONTRACT W-740 S-ENG. 36

ILA-7315
Uc-15Issued: December 1978
Concepts for Inventory Verification in
Critical Facilities
D. D. Cobb
J. L. SapirE. A. KernR. J. Dietz


EXECUTIVE SUMMARY
This report is the second in a series intended todevelop advanced safeguards concepts for specialnuclear materials (SNM) measurement and inven-tory verification in large, fast-critical- assemblyfacilities. It supersedes the report LA-7028-MS,“Preliminary Concepts for Materials Measurementand Accounting in Critical Facilities, ” which wasalso produced by the Los Alamos ScientificLaboratory (LASL) for the Department of Energy’sOffice of Safeguards and Security (DOE/SS). Thestudy of advanced safeguards for critical facilities ispart of a continuing effort to develop improved in-tegrated safeguards systems for a broad spectrum of
nuclear facilities. In these studies LASL providesconceptual designs for materials management (in-cluding fissile materials measurement and ac-counting) and Sandia Laboratories, Albuquerque
(SLA) provides designs concepts for physicalsecurity, materials containment, and surveillance.
The conceptual designs of advanced materialsmanagement systems presented in this report areintended to provide an effective inventory verifica-tion capability for critical facilities without dis-rupting the experimental programs. Because theproposed concepts have not been implemented in anactual facility, it is important to evaluate them on atrial basis to determine their safeguards effec-tiveness and operational acceptability. Only afterthe concepts have been evaluated thoroughly will itbe practical to consider their formal implementa-tion.
Large, fast-critical-assembly research facilities,used to simulate plutonium-fueled breeder reactors,are currently operating in several countries. Thelargest of these facilities can simulate fast-breederreactors of 1000 MWe with cores containing hun-dreds of kilograms of fuel. Such facilities typicallyare located in national nuclear research centers thatmaintain strict domestic safeguards including per-sonnel controls and other physical protectionmeasures.
Large critical facilities present a difficult problemfor the application of international safeguards
systems, which are based primarily on materials ac-counting complemented by containment and sur-veiHance. Several of these facilities may soon beplaced under International Atomic Energy Agency(IAEA) safeguards, thus emphasizing the inter-national aspects and the urgency of the problem ofsafeguarding critical facilities. LASL and SLA haveagreed to develop advanced safeguards concepts foruse by safeguards authorities and systemsdevelopers. The results of the SLA conceptual studyof containment and surveillance are reportedseparately in SAND 78-0168, “InternationalSafeguards for Fast Critical Facilities. ” The con-cepts include frequent inspector surveillance andunattended containment and surveillance instru-ments placed at the boundary of the MaterialsAccess Area (MAA).
The model facility developed as a reference forthis study is intended to represent a large, ex-perimentally active plutonium critical facility. Thecritical assembly is of the horizontal split-tabletype, consisting of a large matrix of steel tubesdivided into halves. Thin plates containing fuel andnonfuel mockup materials are placed in open metal“drawers” about 2 in. * square, which are inserted
into the matrix tubes. Automated fuel handling isavailable to insert and retrieve the reactor drawers.The final configuration is formed by bringing thereactor halves together and withdrawing poison-bearing control rods to reach criticality. Thereference reactor contains 1200-1600 kg ofplutonium distributed among 1600-2200 fueldrawers.
In facilities of this size, physical inventories aretedious and time-consuming, and they result in
.—*The British unit of length, inches (in.), is used frequently in thisreport for the dimensions of fabricated items; note that 1 in. =2.54 cm.
v

significant radiation exposure of the operating per-sonnel. For these reasons physical inventories areperformed relatively infrequently, perhaps an-nually. Conventional international inspections canbe expected to be even less thorough because ofnegotiated and economic restrictions on inspectoraccess and manpower. The major problem in
safeguarding these facilities then becomes one oftimely and independent verification of facility in-ventories, using limited resources and withoutserious disruption of reactor operations. The inven-tory verification methods that are proposed for themodel facility are sensitive to the diversion of asignificant quantity (8 kg of plutonium) within aperiod of 6 months with alarm limits set at the 3-6level of significance (false alarm rate of -1 in 1000)and with 95% probability of detection.
The maximum inspection effort for the modelfacility is more than 1000 man-days per year underthe safeguards conditions of the Non-ProliferationTreaty (NPT safeguards). This number is a functionof total SNM inventory and, while considerablysmaller for some fast-critical facilities of interest, itstill permits up to daily inspection. To satisfy theserequirements we have chosen to discard thetraditional onerous and time-consuming item inven-tory, based on counting thousands of individual fuelpieces, in favor of more frequent, rapid, collective-inventory techniques.
The inspection strategy developed in this study isconsistent with these constraints and comprises aspectrum of inspection and verification activitiesthat increase in intensity during importantoperational or inventory verification activities orwhen diversion is suspected. The first level of ac-tivity is routine, frequent inspection by one inspec-tor of the integrity of the containment area and thecontainment and surveillance systems. The inspec-tor also regularly monitors the experimentalprogram and the facility records and calibrates the
safeguards instruments. He seals vault canistersthat are not currently part of the dynamic inventoryand verifies their contents by nondestructive assay(NDA). These activities occur during normalfacility operations and do not significantly affect theroutine flow of materials. The inspector is available,on call, for special or abnormal operational situa-tions during this period and uses a portion of histime to prepare for the next level of activity: theroutine inventory verification.
Routine inventory verification involves two orthree inspectors and occurs at a negotiated interval,taken as 1-3 months for the model facility. The un-sealed portion of the vault inventory is sealed andverified using NDA measurements, and the in-tegrity of the sealed portion is checked. One meansfor reactor inventory verification is the statisticalsampling and NDA measurement of - 10°A of thereference reactor inventory. It is estimated that eachroutine sampling verification of the reference reac-tor could be completed within two consecutive 8-hshifts, using automated handling and NDAmeasurement of reactor drawers. It could bescheduled when the reactor is not operating, that is,on nights, holidays, or weekends. The statisticalsampling techniques, if repeatedly implemented atthe recommended frequency, provide adequateverification at the 8-kg detection level for diversionof whole-drawer quantities or individual fuel plates.
If diversion is limited to a very large number ofvery small removals, each one less than the smallestincrement of fuel in the facility inventory (1 in. ofplutonium fuel plate in the model facility), thedetection sensitivity is -20 kg at the 3-u alarmlimit, which is <2% of the reference reactor inven-tory. Such diversion strategies would require eithercovert machining of a large number of fuel plates orfalsification of the fuel manufacturer’s assay data.Those strategies would be very difficult for even afacility operator to implement; hence, they arejudged to be very unlikely.
This possibility and virtually all others are ad-dressed by periodically substituting an integralreactivity experiment for the statistical verificationplan. Reactivity measurements could be used toverify the gross fissile content of the entire reactor,in place. For this purpose it is necessary to returnthe reactor to one of several reference configurationshaving a precisely known reactivity and in-core in-ventory. The in-core inventory of a particularreference configuration can be determined by sam-
pling and measurement when the reference is first
established.While more sensitive (probably to <1 kg of
plutonium) and possibly less time-consuming thanthe statistical sampling verification, the reactivitymeasurement is vulnerable to a specious reactorconfiguration. However, the statistical samplingtechniques and the inspector’s presence along withsupplementary measurements of additional reactor
vi

parameters should provide adequate protectionfrom a deliberately misstated configuration. Es-tablishment of a suitable reference configuration isfacilitated by selecting from several candidate con-figurations the one that most closely resembles theworking configuration at some convenient time. It isestimated that the reference reactor could be re-turned to a reference configuration about four timesper year without undue disruption of the experimen-tal program.
A mix of sampling and reactivity verifications ofthe reference reactor inventory totaling eight peryear on the average is judged to be a reasonablecompromise for the model facility. For example, thiscould consist of six sampling and two reactivity orfour sampling and four reactivity verifications. Themixed verification strategy, especially if the type ofverification is not announced well in advance, hasimportant advantages, both as a psychologicaldeterrent and because the two strategies, statisticalsampling and integral reactivity, complement eachother in the manner described above.
The most intense level of activity is associatedwith the special inventory verification, which occursonly under extraordinary circumstances such aswhen the inspectorate is convinced that an at-tempted diversion has occurred and an intensiveinventory effort is warranted to determine the formand amount of missing material. Frequent inspec-tions and routine inventory verifications obviate theneed for complete inventories under normal cir-cumstances.
If a diversion is suspected, the inspectorate mustmake an assessment to determine the appropriateresponse. If a special inventory verification isnecessary, this would involve shutting down themodel facility and fielding a team of six or more in-spectors for a period estimated to be 7-14 days. Thefacility records are audited. All vault inventory sealsare inspected for integrity and the unsealed portionof the vault contents is verified by NDA. A 50%statistical sample of the reactor inventory may beverified by whatever techniques seem most ap-propriate to the inspection team for the particularalarm situation. Sampling at the S070 level providesa very high probability of detecting 8 kg or moremissing from the reactor. If no significant diversionis discovered, the reactor may be returned to a
reference configuration for the integral reactivity
check. If significant diversion is confirmed, the in-spection team may decide to complete the physicalinventory.
The effectiveness of these inspection strategiesagainst a variety of diversion strategies has beenassessed for the model facility by modeling andsimulating the operational procedures, thematerials transfers, and the sampling proceduresand measurements for a full year of operation usingactual operating data. For example, the probabilityof detecting 8 kg of plutonium missing from thereference reactor through routine inventory verifica-tion with a 10Y~bimonthly statistical sampling planis shown in the table below. The probability ofdetecting 8 kg missing either in individual plates orin whole-drawer amounts is near 95% after 6months, that is, after three samples totaling so~o ofthe inventory have been taken. Sampling about 30%of the reactor inventory every 6 months alsoprovides a 95% probability of detecting 8 kg.However, smaller samples taken more frequentlyprovide timely detection, and they do not require
shutting down the reactor for extended periods.Note that each 10% sample gives a 95% probabilityof detecting -30 kg missing from the reactor inven-tory, whereas six bimonthly 10% samples give a 95%probability of detecting the protracted diversion of-8 kg during 1 yr.
DetectionTime
(months)
CumulativeSamplingFraction
(%)
DetectionProbability
(90)
2468
1012
102030405060
61829397
>99>99
The following table shows detection sensitivitiescalculated for a proposed integral reactivity check ofseveral reference configurations. In all cases thedetection limits are considerably <1 kg ofplutonium out of an inventory of >1000 kg. Thereactivity technique, including supplementary
vii
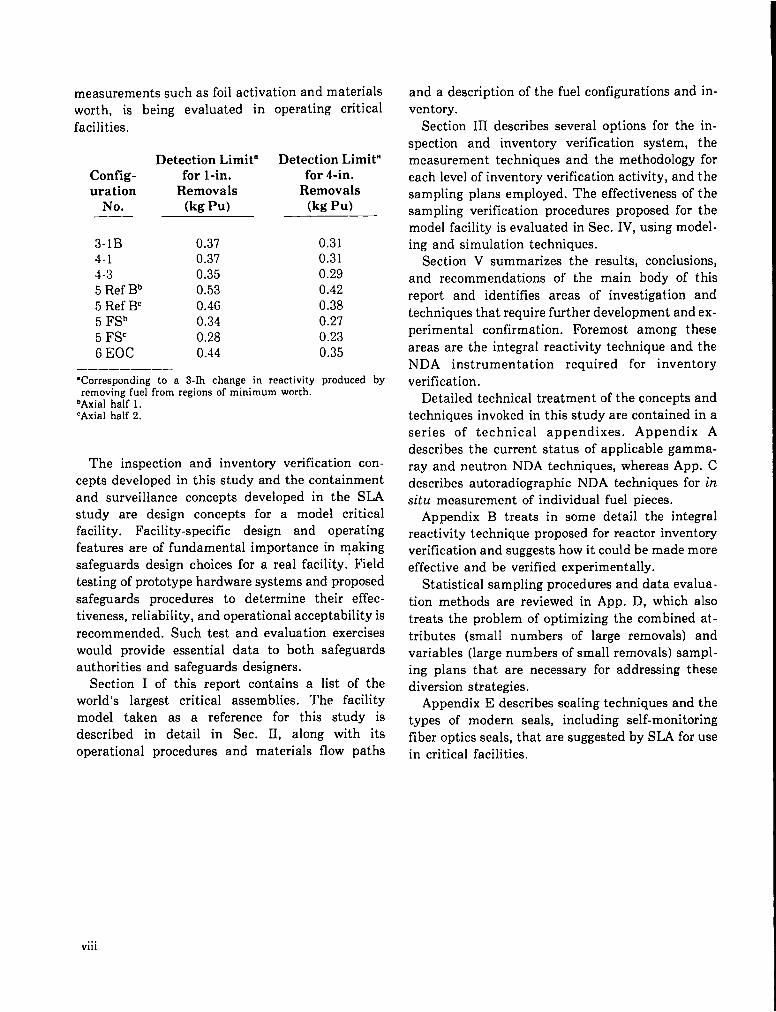
measurements such as foil activation and materialsworth, is being evaluated in operating criticalfacilities.
Detection Limit’ Detection Limit”Con fig- for l-in. for 4-in.uration Removals Removals
No. (kg Pu) (kg Pu)
3-lB4-14-35 Ref Bb5 Ref B’5 FSb5 FSC6 EOC
0.370.370.350.530.460.340.280.44
0.310.310.290.420.380.270.230.35
‘Corresponding to a 3-Ih change in reactivity produced byremoving fuel from regions of minimum worth.
bAxial half 1.CAxial half 2.
The inspection and inventory verification con-cepts developed in this study and the containmentand surveillance concepts developed in the SIAstudy are design concepts for a model criticalfacility. Facility-specific design and operatingfeatures are of fundamental importance in makingsafeguards design choices for a real facility. Fieldtesting of prototype hardware systems and proposedsafeguards procedures to determine their effec-tiveness, reliability, and operational acceptability isrecommended. Such test and evaluation exerciseswould provide essential data to both safeguardsauthorities and safeguards designers.
Section I of this report contains a list of theworld’s largest critical assemblies. The facilitymodel taken as a reference for this study isdescribed in detail in Sec. II, along with itsoperational procedures and materials flow paths
and a description of the fuel configurations and in-ventory.
Section HI describes several options for the in-spection and inventory verification system, themeasurement techniques and the methodology foreach level of inventory verification activity, and thesampling plans employed, The effectiveness of thesampling verification procedures proposed for themodel facility is evaluated in Sec. IV, using model-ing and simulation techniques.
Section V summarizes the results, conclusions,and recommendations of the main body of thisreport and identifies areas of investigation and
techniques that require further development and ex-perimental confirmation. Foremost among theseareas are the integral reactivity technique and theNDA instrumentation required for inventoryverification.
Detailed technical treatment of the concepts andtechniques invoked in this study are contained in aseries of technical appendixes. Appendix Adescribes the current status of applicable gamma-ray and neutron NDA techniques, whereas App. Cdescribes autoradiographic NDA techniques for insitu measurement of individual fuel pieces.
Appendix B treats in some detail the integralreactivity technique proposed for reactor inventoryverification and suggests how it could be made moreeffective and be verified experimentally.
Statistical sampling procedures and data evalua-tion methods are reviewed in App. D, which alsotreats the problem of optimizing the combined at-tributes (small numbers of large removals) andvariables (large numbers of small removals) sampl-ing plans that are necessary for addressing thesediversion strategies.
Appendix E describes sealing techniques and thetypes of modern seals, including self-monitoringfiber optics seals, that are suggested by SLA for usein critical facilities.
...VIII
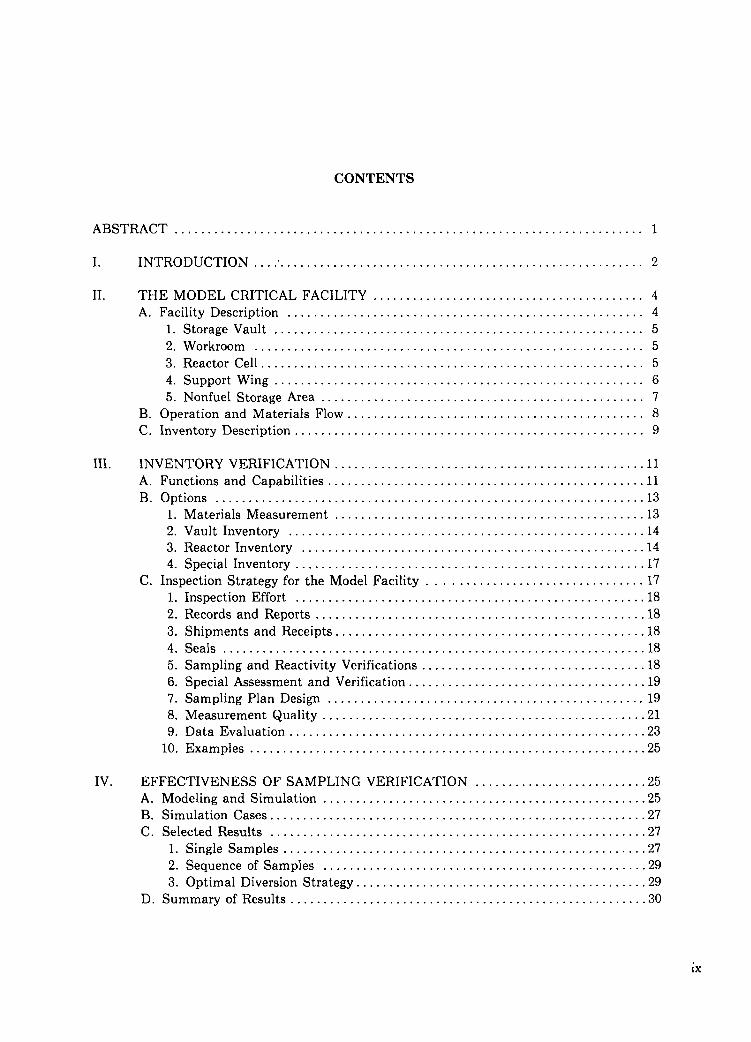
CONTENTS
ABSTRACT . . . . . . . . . . . . . . . . . . . . . . . . . . . . . . . . . . . . . . . . . . . . . . . . . . . . . . . . . . . . . . . . . . . . . . . 1
I. INTRODUCTION . . . . . . . . . . . . . . . . . . . . . . . . . . . . . . . . . . . . . . . . . . . . . . . . . . . . . . . . . . 2
II. THE MODEL CRITICAL FACILITY . . . . . . . . . . . . . . . . . . . . . . . . . . . . . . . . . . . . . . . . . 4A. Facility Description . . . . . . . . . . . . . . . . . . . . . . . . . . . . . . . . . . . . . . . . . . . . . . . . . . . . . . 4
I. Storage Vault . . . . . . . . . . . . . . . . . . . . . . . . . . . . . . . . . . . . . . . . . . . . . . . . . . . . . . . . 52. Workroom . . . . . . . . . . . . . . . . . . . . . . . . . . . . . . . . . . . . . . . . . . . . . . . . . . . . . . . . . . . 53. Reactor Cell . . . . . . . . . . . . . . . . . . . . . . . . . . . . . . . . . . . . . . . . . . . . . . . . . . . . . . . . . . 54. Support Wing . . . . . . . . . . . . . . . . . . . . . . . . . . . . . . . . . . . . . . . . . . . . . . . . . . . . . . . . 65. Nonfuel Storage Area.... . . . . . . . . . . . . . . . . . . . . . . . . . . . . . . . . . . . . . . . . . . . . . 7
B. Operation and Materials Flow . . . . . . . . . . . . . . . . . . . . . . . . . . . . . . . . . . . . . . . . . . ...8C. Inventory Description . . . . . . . . . . . . . . . . . . . . . . . . . . . . . . . . . . . . . . . . . . . . . . . . . . . . . 9
HI. INVENTORY VERIFICATION.. . . . . . . . . . . . . . . . . . . . . . . . . . . . . . . . . . . . . . . . . . . ...11A. Functions and Capabilities . . . . . . . . . . . . . . . . . . . . . . . . . . . . . . . . . . . . . . . . . . . . . ...11B. Options . . . . . . . . . . . . . . . . . . . . . . . . . . . . . . . . . . . . . . . . . . . . . . . . . . . . . . . . . . . . . . ...13
I. Materials Measurement.. . . . . . . . . . . . . . . . . . . . . . . . . . . . . . . . . . . . . . . . . . . ...132. Vault Inventory . . . . . . . . . . . . . . . . . . . . . . . . . . . . . . . . . . . . . . . . . . . . . . . . . . . ...143. Reactor Inventory . . . . . . . . . . . . . . . . . . . . . . . . . . . . . . . . . . . . . . . . . . . . . . . . . ...144. Special Inventory . . . . . . . . . . . . . . . . . . . . . . . . . . . . . . . . . . . . . . . . . . . . . . . . . . ...17
C. Inspection Strategy for the Model Facility . . . . . . . . . . . . . . . . . . . . . . . . . . . . . ...17I. Inspection Effort . . . . . . . . . . . . . . . . . . . . . . . . . . . . . . . . . . . . . . . . . . . . . . . . . . ...182. Records and Reports . . . . . . . . . . . . . . . . . . . . . . . . . . . . . . . . . . . . . . . . . . . . . . . ...183. Shipments and Receipts. . . . . . . . . . . . . . . . . . . . . . . . . . . . . . . . . . . . . . . . . . . . ...184. Seals . . . . . . . . . . . . . . . . . . . . . . . . . . . . . . . . . . . . . . . . . . . . . . . . . . . . . . . . . . . . . ...185. Sampling and Reactivity Verifications . . . . . . . . . . . . . . . . . . . . . . . . . . . . . . . ...186. Special Assessment and Verification . . . . . . . . . . . . . . . . . . . . . . . . . . ., . . . . . ...197. Sampling Plan Design . . . . . . . . . . . . . . . . . . . . . . . . . . . . . . . . . . . . . . . . . . . . . ...198. Measurement Quality . . . . . . . . . . . . . . . . . . . . . . . . . . . . . . . . . . . . . . . . . . . . . . ...219. Data Evaluation . . . . . . . . . . . . . . . . . . . . . . . . . . . . . . . . . . . . . . . . . . . . . . . . . . . ...23
10. Examples . . . . . . . . . . . . . . . . . . . . . . . . . . . . . . . . . . . . . . . . . . . . . . . . . . . . . . . . . ...25
Iv. EFFECTIVENESS OF SAMPLING VERIFICATION . . . . . . . . . . . . . . . . . . . . . . . ...25A. Modeling and Simulation . . . . . . . . . . . . . . . . . . . . . . . . . . . . . . . . . . . . . . . . . . . . . . ...25B. Simulation Cases . . . . . . . . . . . . . . . . . . . . . . . . . . . . . . . . . . . . . . . . . . . . . . . . . . . . . . ...27C. Selected Results . . . . . . . . . . . . . . . . . . . . . . . . . . . . . . . . . . . . . . . . . . . . . . . . . . . . . . ...27
I. Single Samples . . . . . . . . . . . . . . . . . . . . . . . . . . . . . . . . . . . . . . . . . . . . . . . . . . . . ...272. Sequence of Samples . . . . . . . . . . . . . . . . . . . . . . . . . . . . . . . . . . . . . . . . . . . . . . ...293. Optimal Diversion Strategy . . . . . . . . . . . . . . . . . . . . . . . . . . . . . . . . . . . . . . . . . ...29
D. Summary of Results . . . . . . . . . . . . . . . . . . . . . . . . . . . . . . . . . . . . . . . . . . . . . . . . . . . ...30
ix

v. RESULTS, CONCLUSIONS, AND RECOMMENDATIONS . . . . . . . . . . . . . . . . ...31A. Results and Conclusions . . . . . . . . . . . . . . . . . . . . . . . . . . . . . . . . . . . . . . . . . . . . . . . . ..3 IB. Recommendations . . . . . . . . . . . . . . . . . . . . . . . . . . . . . . . . . . . . . . . . . . . . . . . . . . . . . ...33
ACKNOWLEDGMENTS . . . . . . . . . . . . . . . . . . . . . . . . . . . . . . . . . . . . . . . . . . . . . . . . . . . . . . . . ...33
REFERENCES . . . . . . . . . . . . . . . . . . . . . . . . . . . . . . . . . . . . . . . . . . . . . . . . . . . . . . . . . . . . . . . . . ...34
APPENDIXA. NONDESTRUCTIVE ASSAY METHODSFOR FAST-CRITICAL FACILITIES . . . . . . . . . . . . . . . . . . . . . . . . . . . . . . . . . . . . . . . . . . . . ..A-lPARTI. SURVEY OF METHODS FOR PLUTONIUM
AND URANIUM FUELS . . . . . . . . . . . . . . . . . . . . . . . . . . . . . . . . . . . . . . . . . . . . . . . . . . ..’. .A-lPARTII. NEW APPROACHES TO RAPID NONDESTRUCTIVE
VERIFICATION OF PLUTONIUM FUELS . . . . . . . . . . . . . . . . . . . . . . . . . . . . . . . . . ..A-13
APPENDIXB. INTEGRAL REACTIVITY MEASUREMENTS . . . . . . . . . . . . . . . . . . . . . ..B-l
APPENDIX C. AUTORADIOGRAPHY . . . . . . . . . . . . . . . . . . . . . . . . . . . . . . . . . . . . . . . . . . . ..C-l
APPENDIX D. SAMPLING PLANSAND DATA ANALYSIS METHODSFOR INVENTORY VERIFICATION . . . . . . . . . . . . . . . . . . . . . . . . . . . . . . . . . . . . . . . . . . . . ..D-1
APPENDIX E. CHARACTERISTICS OFSEALS . . . . . . . . . . . . . . . . . . . . . . . . . . . . . . . . . ..E-1
I.
rI.
m.
IV.
v.
VI.
VII.
VIII.
Ix.
TABLES
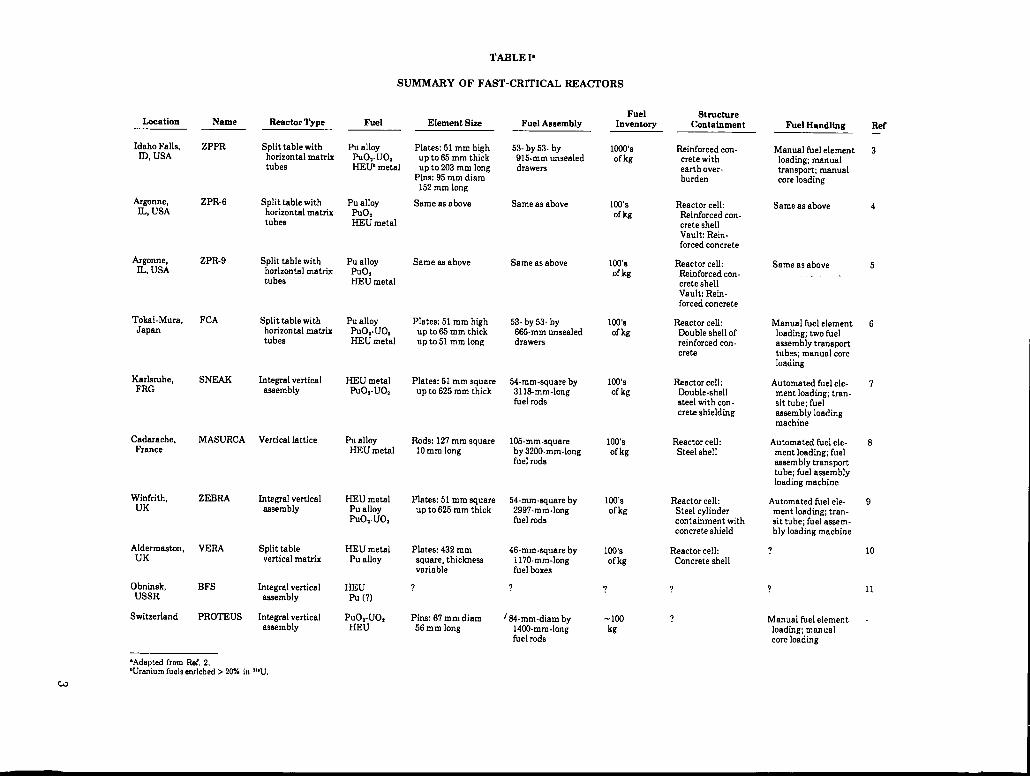
Summary of Fast-Critical Reactors . . . . . . . . . . . . . . . . . . . . . . . . . . . . . . . . . . . . . . . . . . 3
Fuel Plates in the Model Facility Inventory . . . . . . . . . . . . . . . . . . . . . . . . . . . . . . . . . 9
Vault Inventory with the Reactor Unloaded . . . . . . . . . . . . . . . . . . . . . . . . . . . . . . . . ...11
Fuel Drawers in a Reference Configuration . . . . . . . . . . . . . . . . . . . . . . . . . . . . . . . . ...11
Materials Measurement Techniques . . . . . . . . . . . . . . . . . . . . . . . . . . . . . . . . . . . . . . . ...15
Sample Sizes for a Reference Configuration . . . . . . . . . . . . . . . . . . . . . . . . . . . . . . . ...21
Probability of Detecting 8 kg of PlutoniumMissing from the ReferenceReactor with a Single Sample . . . . . . . . . . . . . . . . . . . . . 28
Probability of Detecting8 kg of PlutoniumMissing from the Reference Reactor . . . . . . . . . . . . . . . . . . . . . . . . . . . . . . . . . . . . . . . ...32
Detection Limits for Integral Reactivity
Checks of Eight Reference Configurations . . . . . . . . . . . . . . . . . . . . . . . . . . . . . . . . . ...33
A-I.
A-II.
A-III.
A-IV.
B-I.
D-I.
D-II.
D-III.
D-IV.
D-V.
D-VI.
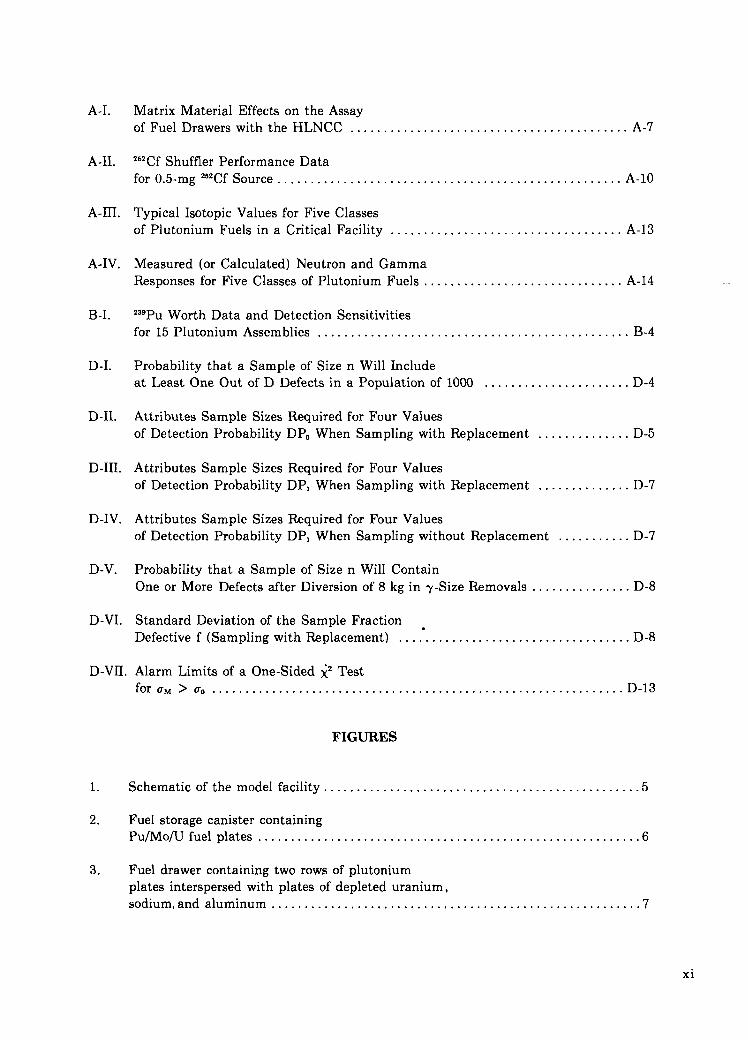
Matrix Material Effects on the Assayof Fuel Drawers with the HLNCC . . . . . . . . . . . . . . . . . . . . . . . . . . . . . . . . . . . . . . . . .. A-7
“2Cf Shuffler Performance Datafor 0.5-mg ‘2Cf Source . . . . . . . . . . . . . . . . . . . . . . . . . . . . . . . . . . . . . . . . . . . . . . . . . . ..A-10
Typical Isotopic Values for Five Classesof Plutonium Fuels in a Critical Facility . . . . . . . . . . . . . . . . . . . . . . . . . . . . . . . . . ..A-13
Measured (or Calculated) Neutron and GammaResponses for Five Classes of Plutonium Fuels . . . . . . . . . . . . . . . . . . . . . . . . . . . . ..A-14
2S’PUWorth Data and Detection Sensitivitiesfor 15 Plutonium Assemblies . . . . . . . . . . . . . . . . . . . . . . . . . . . . . . . . . . . . . . . . . . . . . ..B-4
Probability that aSample of Size n Will Includeat Least One Outof DDefects in aPopulationoflOOO . . . . . . . . . . . . . . . . . . . . ..D-4
Attributes Sample Sizes Required for Four Valuesof Detection Probability DPO When Sampling with Replacement . . . . . . . . . . . . . . D-5
Attributes Sample Sizes Required for Four Valuesof Detection Probability DPI When Sampling with Replacement . . . . . . . . . . . . . . D-7
Attributes Sample Sizes Required for Four Valuesof Detection Probability DPI When Sampling without Replacement . . . . . . . . . . . D-7
Probability that a Sample of Sizen Will ContainOne or More Defects after Diversion of 8 kg in -y-Size Removals . . . . . . . . . . . . . . . D-8
Standard Deviation of the Samde FractionDefective f(Sampling with Rep~acement) . . . ... . . . . . . . . . . . . . . . . . . . . . . . . . . . . . .D-8
D-VII. Alarm Limits of a One-Sided ~ Testfora~> a, . . . . . . . . . . . . . . . . . . . . . . . . . . . . . . . . . . . . . . . . . . . . . . . . . . . . . . . . . . . . .. D-13
FIGURES
1. Schematic of the model facility . . . . . . . . . . . . . . . . . . . . . . . . . . . . . . . . . . . . . . . . . . . . . ...5
2. Fuel storage canister containingPu/MoAJ fuel plates, . . . . . . . . . . . . . . . . . . . . . . . . . . . . . . . . . . . . . . . . . . . . . . . . . . . . . . ...6
3. Fuel drawer containing two rows of plutoniumplates interspersed with plates of depleted uranium,sodium, and aluminum . . . . . . . . . . . . . . . . . . . . . . . . . . . . . . . . . . . . . . . . . . . . . . . . . . . . . ...7
xi

4.
5.
6.
7.
8.
9.
10.
11.
12.
13.
14.
A-1.
A-2.
A-3.
A-4.
A-5.
A-6.
Assembly matrix with a few drawersprojecting from the matrix tubes . . . . . . . . . . . . . . . . . . . . . . . . . . . . . . . . . . . . . . . . . . . ...8
Matrix loader for automated fuel drawer handling . . . . . . . . . . . . . . . . . . . . . .
Materials flow in the model facility . . . . . . . . . . . . . . . . . . . . . . . . . . . . . . . . . . . . .
Typical plutonium fuel plates. . . . . . . . . . . . . . . . . . . . . . . . . . . . . . . . . . . . . . . . . .
Schematic cross section of the reference configuration . . . . . . . . . . . . . . . . . . . .
Schematic of the covert diversion sequence and theintegrated detection capability of the safeguards system . . . . . . . . . . . . . . . . . .
Regions of sampling-plan sensitivity that correspondto removing various amounts of plutonium from afuel drawer compared with the uniform sensitivityof integral reactivity measurements . . . . . . . . . . . . . . . . . . . . . . . . . . . . . . . . . ...4
. . . . . . 8
. . . . . . 9
. . . . . 10
. . . . . 12
. . . . . 12
. . . . . 24
Cross sectionsof the reference reactor
The increase in detection probabilityprovided by a series of monthly 10%
. . . . . . . . . . . . . . . . . . . . . . . . . . . . . . . . . . . . . . . . 26
samples of the reference reactor inventory . . . . . . . . . . . . . . . . . . . . . . . . . . . . . . . . . . ...29
Protracted diversion of 4kg of plutonium in whole-draweramounts plus 4 kg in I-in. -plate amounts by random removalsduring6 months of operation of the reference reactor . . . . . . . . . . . . . . . . . . . . . . . . ...30
Probability of detecting 8kgof plutonium missingfrom the reference reactor with sequences of5, 10, and30% samples . . . . . . . . . ...31
Measurement setup forafueld~awer . . . . . . . . . . . . . . . . . . . . . . . . . . . . . . . . . . . . . . ..A-1
Experimental configuration for gamma-raymeasurements on a fast-critical-assembly fuel drawer . . . . . . . . . . . . . . . . . . . . . . . ..A-2
Relative counting rate forthe414-keV gammaline as afunction of plutonium loading in the drawer . . . . . . . . . . . . . . . . . . . . . . ..A-2
Coincidence response versus plutonium loadingfor plates in a storage canister . . . . . . . . . . . . . . . . . . . . . . . . . . . . . . . . . . . . . . . . . . . . . ..A-5
Neutron coincidence counts per gram as a functionof plutonium loading for stacked plates . . . . . . . . . . . . . . . . . . . . . . . . . . . . . . . . . . . . ..A-6
Total neutron counts per gram as afunctionof plutonium loading for stacked plates . . . . . . . . . . . . . . . . . . . . . . . . . . . . . . . . . . . . ..A-6
xii

A-7
A-8.
A-9.
A-10.
B-1.
B-2.
B-3.
c-1.
c-2.
c-3.
c-4.
D-1.
D-2.
D-3.
D-4.
D-5.
Schematic of the “2Cf Shuffler system showing the neutronwell detector, the decoupling shield, and the dwell tank . . . . . . . . . . . . . . . . . . . . . . .A-9
Passive neutron coincidence results for theShuffler system applied to uranium-plutoniummixed-oxide fuel pellets . . . . . . . . . . . . . . . . . . . . . . . . . . . . . . . . . . . . . . . . . . . . . . . . . . .. A-10
Schematic of proposed neutronfgammarapid scanning instrument for reactor drawerscontaining plutonium fuel... . . . . . . . . . . . . . . . . . . . . . . . . . . . . . . . . . . . . . . . . . . . . . .. A-14
Relative thermal- (fast-) neutron backgroundsmeasured in a typical plutonium storage vault . . . . . . . . . . . . . . . . . . . . . . . . . . . . . .. A-15
Reference core reactivity loss in a largeplutonium assembly . . . . . . . . . . . . . . . . . . . . . . . . . . . . . . . . . . . . . . . . . . . . . . . . . . . . . . ..B-2
Radial reactivity worth of ’’’Puinvarious plutonium assemblies . . . . . . . . . . . . . . . . . . . . . . . . . . . . . . . . . . . . . . . . . . . . . . ..B-3
Axial reactivity worth of 2’9Pu invarious plutonium assemblies . . . . . . . . . . . . . . . . . . . . . . . . . . . . . . . . . . . . . . . . . . . . . . ..B-3
Composite print of autoradiographs fromfuel drawers in the reactor.. . . . . . . . . . . . . . . . . . . . . . . . . . . . . . . . . . . . . . . . . . . . . . . ..C-l
Autoradiograph of a storage canistercontaining twenty-four 4-in. plutonium fuel plates . . . . . . . . . . . . . . . . . . . . . . . . . ..C-2
Autoradiographof a partially filledstorage canister with a missing plate . . . . . . . . . . . . . . . . . . . . . . . . . . . . . . . . . . . . . . . ..C-3
Autoradiograph of a partially filled storage canister with a dummysolid stainless steel plate in the center of the right side . . . . . . . . . . . . . . . . . . . . . ..C-3
Probability of detecting attributesdefects for four sample sizes. . . . . . . . . . . . . . . . . . . . . . . . . . . . . . . . . . . . . . . . . . . . . . ..D-4
Attributes sample sizes for four valuesof detection probability . . . . . . . . . . . . . . . . . . . . . . . . . . . . . . . . . . . . . . . . . . . . . . . . . . . ..D-5
Probability of detecting attributesdefects for various sample sizes . . . . . . . . . . . . . . . . . . . . . . . . . . . . . . . . . . . . . . . . . . . ..D-6
Attributes sample sizes for four valuesof detection probability . . . . . . . . . . . . . . . . . . . . . . . . . . . . . . . . . . . . . . . . . . . . . . . . . . . ..D-6
Probability of occurrence of measuredvalues for hypotheses HO and Ha . . . . . . . . . . . . . . . . . . . . . . . . . . . . . . . . . . . . . . . . . . ..D-10
.. .X111
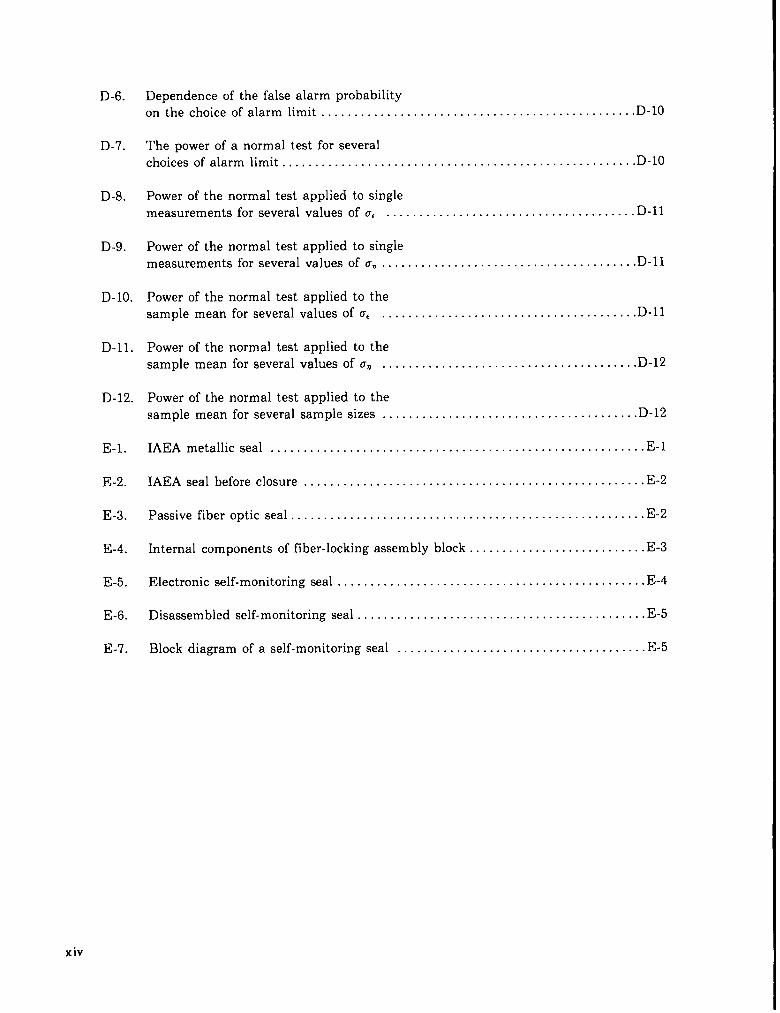
D-6. Dependence of the false alarm probabilityon the choice of alarm limit . . . . . . . . . . . . . . . . . . . . . . . . . . . . . . . . . . . . . . . . . . . . . . ..D-10
D-7. The power of anormal test for severalchoices of alarm limit.. . . . . . . . . . . . . . . . . . . . . . . . . . . . . . . . . . . . . . . . . . . . . . . . . . . ..D-10
D-8. Power of the normal test applied to singlemeasurements for several values ofa, . . . . . . . . . . . . . . . . . . . . . . . . . . . . . . . . . . . . ..D-11
D-9. Power of the normal test applied to singlemeasurements for several values ofa~ . . . . . . . . . . . . . . . . . . . . . . . . . . . . . . . . . . . . . ..D-11
D-10. Power of the normal test applied to thesample mean for several values ofa, . . . . . . . . . . . . . . . . . . . . . . . . . . . . . . . . . . . . . ..D-11
D-n. Power of the normal test applied to thesample mean for several values ofa~ . . . . . . . . . . . . . . . . . . . . . . . . . . . . . . . . . . . . . ..D-12
D-12. Power of the normal test applied to thesample mean for several sample sizes . . . . . . . . . . . . . . . . . . . . . . . . . . . . . . . . . . . . . ..D-12
E-1. IAEA metallic seal . . . . . . . . . . . . . . . . . . . . . . . . . . . . . . . . . . . . . . . . . . . . . . . . . . . . . . . ..E-l
E-2. IAEA seal before closure . . . . . . . . . . . . . . . . . . . . . . . . . . . . . . . . . . . . . . . . . . . . . . . . . . ..E-2
E-3. Passive fiberoptic seal . . . . . . . . . . . . . . . . . . . . . . . . . . . . . . . . . . . . . . . . . . . . . . . . . . . . ..E-2
E-4. Internal components of fiber-locking assembly block.. . . . . . . . . . . . . . . . . . . . . . . . ..E-3
E-5. Electronic self-monitoring seal . . . . . . . . . . . . . . . . . . . . . . . . . . . . . . . . . . . . . . . . . . . . . ..E-4
E-6. Disassembled self-monitoring seal . . . . . . . . . . . . . . . . . . . . . . . . . . . . . . . . . . . . . . . . . . ..E-5
E-7. Block diagram of a self-monitoring seal . . . . . . . . . . . . . . . . . . . . . . . . . . . . . . . . . . . . ..E-5
xiv
CONCEPTS FOR INVENTORY VERIFICATION IN CRITICAL FACILITIES
by
D. D. Cobb, J. L. Sapir, E. A. Kern, and R. J. Dietz
ABSTRACT
Materials measurement and inventory verification concepts forsafeguarding large critical facilities are presented. Inspection strategiesand methods for applying international safeguards to such facilities areproposed. The conceptual approach to routine inventory verification in-cludes frequent visits to the facility by one inspector, and the use of sealsand nondestructive assay (NDA) measurements to veri& the portion of theinventory maintained in vault storage. Periodic verification of the reactorinventory is accomplished by sampling and NDA measurement of in-corefuel elements combined with measurements of integral reactivity andrelated reactor parameters that are sensitive to the total fissile inventory. Acombination of statistical sampling and NDA verification with measure-ments of reactor parameters is more effective than either technique used byitself. Special procedures for assessment and veritlcation for abnormalsafeguards conditions are also considered. When the inspection strategiesand inventory verit3cation methods are combined with strict containmentand surveillance methods, they provide a high degree of assurance that anyclandestine attempt to divert a significant quantity of fissile material from acritical facility inventory will be detected. Field testing of specific hardwaresystems and procedures to determine their sensitivity, reliability, andoperational acceptability is recommended. The results obtained from con-ceptual studies and operational testing and evaluation exercises willprovide much needed information to safeguards authorities and to designersof future safeguards systems for large critical facilities. This work was per-formed as part of the Department of Energy, Office of Safeguards andSecurity Research and Development Program.
1

I. INTRODUCTION*
Fast-critical-assembly research facilities providea wide range of experimental data used for thedesign and development of breeder power reactors.Because of the inadequacy of basic nuclear data andthe complexity of detailed computational models,fast reactor design relies heavily on mockup criticalexperiments. These experiments are used to confirmthe general analytical methods and to providespecific information about critical mass, reactorkinetics and control, power distribution, sodiumvoid and Doppler coefficients, effects of designchanges, and other areas pertinent to the design of
safe, economical breeder reactors.1Large fast-critical research facilities are operating
in several countries (Table I) .2-11The two basic typesof large critical-assembly machines are the horizon-tal split table and the integral vertical. The horizon-tal split-table assembly consists of two approx-imately equal portions that move apart when thereactor is shut down. Fuel elements in the form ofopen “drawers” are loaded, usually manually, frombetween the halves into a horizontal matrix struc-ture.
In the integral vertical assembly, full-length, self-contained fuel elements are suspended from a gridplate. There is no provision to separate large por-tions of the assembly during shutdown; thenecessary shutdown margin is obtained bywithdrawing control elements. Automatedmachines typically are used to assemble fuel ele-ments and to load them into the reactor. During anexperimental program, individual fuel pieces areusually more accessible in a split-table assemblythan in an integral one.
Critical facilities typically are located in nuclearresearch centers that maintain strict nationalsafeguards including personnel controls and otherphysical protection measures. However, severalcritical facilities are coming under internationalsafeguards, which depend on materials accountingas the basic safeguards measure complemented bycontainment and surveillance activities. The ap-plication of international safeguards to suchfacilities is difficult because of the many small items
.——*The British unit of length, inches (in.), is used frequently in thisreport for the dimensions of fabricated items; note that 1 in. =2.54 cm.
distributed in reactor fuel elements and in storagecontainers.
For this reason, the Department of Energy’s Of-fice of Safeguards and Security (DOE/SS) has
tasked the Los Alamos Scientific Laboratory(LASL) and Sandia Laboratories, Albuquerque,(SLA) to develop advanced concepts forsafeguarding critical facilities, with specialemphasis to be placed on the international aspectsof the safeguards problem. DOE/SS also ad-ministers a related program, the US Program forTechnical Assistance to the International AtomicEnergy Agency (IAEA), through its International
Safeguards Project Office (ISPO) at the BrookhavenNational Laboratory.”
The initial LASL reportl’ presents preliminaryconcepts for improved materials measurement andaccounting and identifies several promising inven-tory verification techniques. A companion SLAreportz compares several approaches to safeguardingcritical facilities and selects a system concept thatincorporates daily surveillance and inspection byIAEA inspectors, containment and surveillance byunattended equipment placed at the boundary ofthe Material Access Area (MAA), routine inventoryverifications during normal operation, and specialinventory procedures when an abnormal safeguardscondition is encountered.
Of the 10 critical facilities listed in Table I, 3(FCA, SNEAK, and PROTEUS) are located in non-weapons states, and all 10 are located in states thateither are signatories of the Non-ProliferationTreaty (NPT) or have agreed in principle to thesafeguards provisions of the NPT. Therefore,guidance for this study is taken from the NPTsafeguards provisions, outlined in INFCIRC/15314and amplified in other IAEA technical documentsls-‘T and in consultations with IAEA personnel.
NPT safeguards include on-site inspections atnuclear facilities and independent verification ofspecial nuclear material (SNM) inventories. ‘Therecommended level of assuranceib’ia is at least a 95°/0probability of detecting the misappropriation of asignificant quurztity (8 kg Pu or 25 kg “W inuranium enriched to >20°/0). The minimum time re-quired to convert relatively pure, unirradiatednuclear materials to weapons-useable material is es-timated to be days to weeks,” and a safeguards ad-visory group18 has recommended that adequate
2
vIn
w1-
02m
0.e.
c-.
c-.
r-.

safeguards for critical facilities should be able todetect a significant-quantity diversion within 10days. At fast-critical facilities where the inventoryconsists of many thousands of small fuel pieces, theprompt detection of diversion must rely on stringentcontainment/surveillance measures backed up byless timely but quantitative verifications of the in-ventory to ensure that the containment/surveillancesystems are not being subverted or bypassed.
In this study we have assumed as a guideline thatthe inventory verification procedures (alone) for in-ternational safeguarding of critical facilities shouldbe capable of detecting a significant diversionwithin a period of 6 months with 95~0 probability. Itis assumed to be conceivable that a nonweaponsstate might attempt to acquire the fissile materialfor one or more nuclear explosive devices by covertdiversion of fuel from a critical facility inventory,employing various concealment strategies to escapedetection. Overt diversion is an abrogation of theNPT with immediate detection and internationalresponse.
Our approach is to develop inventory verificationconcepts with reference to a model plutoniumcritical facility having a split-table assembly. Thismodel facility is described in Sec. II and is similar tothe one assumed by SLA in Ref. 2. Although it doesnot represent a specific operating facility, the modelfacility incorporates features of operating facilitiesin sufficient detail to permit both development andevaluation of inventory verification concepts.
In Sec. III, several options for inventory verifica-tion are considered in terms of the overallsafeguards system concept and with regard to therequirements for effective IAEA safeguards and safeand efficient facility operation. We develop an ap-proach to inventory verification for the modelfacility. This approach incorporates sealing of fuelstorage containers, periodic sampling of the reactorinventory, and a combination of state-of-the-artsafeguards measurements including nondestructiveassay (NDA) techniques and measurements of in-tegral reactivity and related reactor parameters.
The effectiveness of sampling verifications of thereference reactor inventory is evaluated in Sec. IV.Modeling and simulation are used to obtain quan-titative estimates for the probability of detectingthe diversion of a significant quantity by variousstrategies. These diversion strategies are imposed on
the normal operation of the model critical facility bysimulating typical operations for a 1-yr period usingactual operating data including thousands of reactorloading changes.
Results and conclusions are presented in Sec. V.The conceptual approach to verifying the modelcritical facility inventory is summarized, andspecific areas requiring further development anddemonstration are identified.
Five technical appendixes are included. Each ap-pendix is a stand-alone, topical survey containingimportant technical data relevant to safeguardingfast-critical facilities. The topics surveyed are:gamma-ray and neutron NDA instruments andmethods (App. A), integral reactivity and relatedmeasurements (App. B), autoradiographic NDAtechniques (App. C), sampling plans and dataevaluation methods (App. D), and tamper-indicating seals (App. E).
II. THE MODEL CRITICAL FACILITY
The model critical facility developed as areference for this study is not intended to representany specific operating facility in detail. It has beenselected to be descriptive of the large plutoniumcritical facilities operated in the United States andabroad to simulate fast-breeder reactor cores. Themodel facility incorporates features of an operatingfacility in sufficient detail to permit us to developinventory-verification concepts. The informationupon which this model facility is based has beensupplied by Argonne National Laboratory (ANL)personnel.
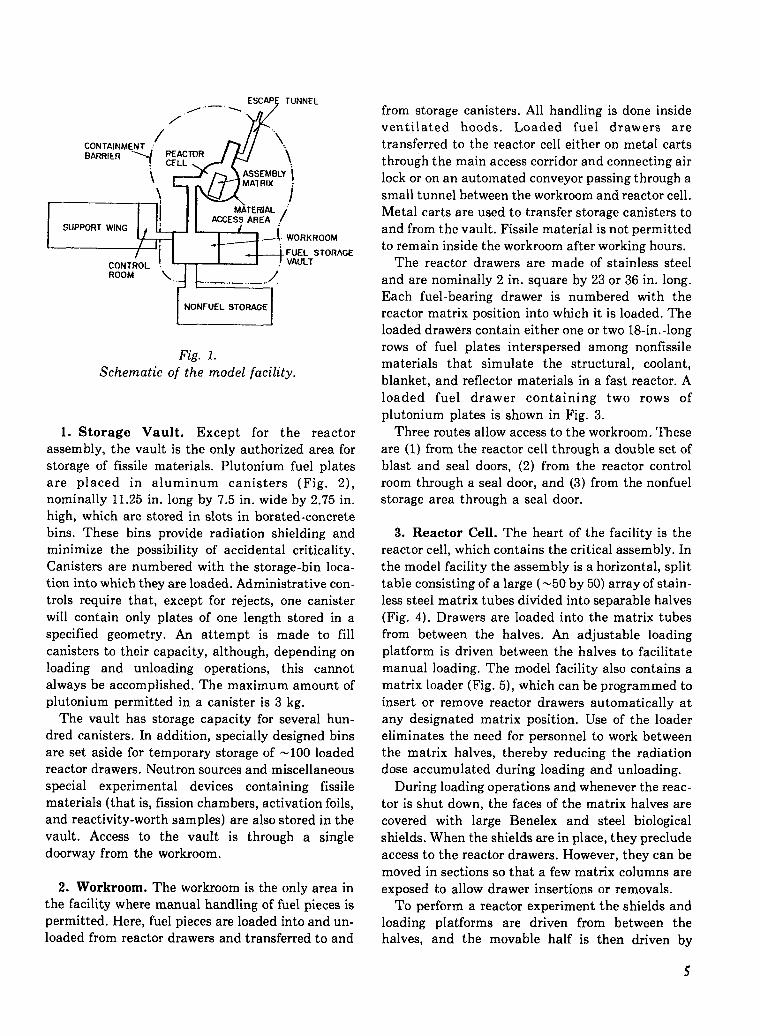
Figure 1 is a schematic of the model facility. Ma-jor functional areas are (1) the material access area(MAA), which includes the fuel storage vault, theworkroom, and the reactor cell; (2) the supportwing, which includes the reactor control room; and(3) the nonfuel storage area.
A. Facility Description
The Mfi is enclosed within a containmentbarrier having controlled access. Normally, all ofthe facility’s SNM is contained within the MAA.
4
ESCAP TUNNEL/..—. \
/ d
from storage canisters. All handling is done insideventilated hoods. Loaded fuel drawers are
CONTAINMENT :’
4
\., transferred to the reactor cell either on metal cartsBARRIER ‘~ ~fToR \ through the main access corridor and connecting air
\ ASSEMBLY IMA1 RIX lock or on an automated conveyor passing through a
\ K / small tunnel between the workroom and reactor cell.
-W,,,MAGECONTROL ‘.ROOM
b
~.. .._.. _.._../’
NONIWEL STORAGE
Fig. 1.Schematic of the model facility.
1. Storage Vault. Except for the reactorassembly, the vault is the only authorized area forstorage of fissile materials. Plutonium fuel platesare placed in aluminum canisters (Fig. 2),nominally 11.25 in. long by 7.5 in. wide by 2.75 in.high, which are stored in slots in berated-concretebins. These bins provide radiation shielding andminimize the possibility of accidental criticality.Canisters are numbered with the storage-bin loca-tion into which they are loaded. Administrative con-trols require that, except for rejects, one canisterwill contain only plates of one length stored in aspecified geometry. An attempt is made to fillcanisters to their capacity, although, depending onloading and unloading operations, this cannotalways be accomplished. The maximum amount ofplutonium permitted in a canister is 3 kg.
The vault has storage capacity for several hun-dred canisters. In addition, specially designed binsare set aside for temporary storage of -100 loadedreactor drawers. Neutron sources and miscellaneousspecial experimental devices containing fissilematerials (that is, fission chambers, activation foils,and reactivity-worth samples) are also stored in thevault. Access to the vault is through a singledoorway from the workroom.
2. Workroom. The workroom is the only area inthe facility where manual handling of fuel pieces ispermitted. Here, fuel pieces are loaded into and un-loaded from reactor drawers and transferred to and
Metal carts are used to transfer storage canisters toand from the vault. Fissile material is not permittedto remain inside the workroom after working hours.
The reactor drawers are made of stainless steeland are nominally 2 in. square by 23 or 36 in. long.Each fuel-bearing drawer is numbered with thereactor matrix position into which it is loaded. Theloaded drawers contain either one or two 18-in. -longrows of fuel plates interspersed among nonfissilematerials that simulate the structural, coolant,blanket, and reflector materials in a fast reactor. Aloaded fuel drawer containing two rows ofplutonium plates is shown in Fig. 3.
Three routes allow access to the workroom. Theseare (1) from the reactor cell through a double set ofblast and seal doors, (2) from the reactor controlroom through a seal door, and (3) from the nonfuelstorage area through a seal door.
3. Reactor Cell. The heart of the facility is thereactor cell, which contains the critical assembly. Inthe model facility the assembly is a horizontal, splittable consisting of a large (-50 by 50) array of stain-less steel matrix tubes divided into separable halves(Fig. 4). Drawers are loaded into the matrix tubesfrom between the halves. An adjustable loadingplatform is driven between the halves to facilitatemanual loading. The model facility also contains amatrix loader (Fig. 5), which can be programmed toinsert or remove reactor drawers automatically atany designated matrix position. Use of the loadereliminates the need for personnel to work betweenthe matrix halves, thereby reducing the radiationdose accumulated during loading and unloading.
During loading operations and whenever the reac-tor is shut down, the faces of the matrix halves arecovered with large Benelex and steel biologicalshields. When the shields are in place, they precludeaccess to the reactor drawers. However, they can bemoved in sections so that a few matrix columns areexposed to allow drawer insertions or removals.
To perform a reactor experiment the shields andloading platforms are driven from between thehalves, and the movable half is then driven by
5

t
—
.—..—..——
—— .
.-=. .’----- *- *“
.. ..
-.->“.. ...—
—.
._? y.-’.-’.. .
● —:.~.
i“ . ,“
,.-.-&&_::?- ;...- —----
——
-.. __...” -= - “.
Fig. 2.Fuel storage canister containing Pu/Mo/U fuel plates.
remote control against the stationary half. Final 4. Support Wing. The support wing houses thecriticality is reached by slowly removing poison- reactor control room, a computer room, staff offices,bearing control rods. The cell is vacated of all per- and an area for measuring irradiated foils. The sup-sonnel during reactor operation. port wing is outside the containment structure to
Access to the reactor cell is through a corridor facilitate access. Except for small irradiation foilsfrom the workroom to the cell or through an and fission chambers, SNM is not normally permit-emergency escape tunnel. Both routes contain clo- utedinside the support wing.ble sets of blast and seal doors.

Fig. 3.Fuel drawer containing two rows of plutonium platesuranium, sodium, and aluminum.
Reactor operations are monitored and controlledfrom the reactor control room. During loadingoperations and reactor experiments, a closed-circuittelevision display of the reactor matrix is availablein the control room. Fuel handling operations in the
workroom can be monitored by voice-phone com-munications.
A small computer is available for routine reactor
calculations and for storing SNM inventory data.The inventory data are updated from terminals inthe control room.
interspersed with plates of depleted
5. Nonfuel Storage Area. As is the supportwing, the nonfuel storage area is outside the con-tainment barrier. A fire and seal door controlsaccess between the nonfuel storage area and theworkroom inside the MAA. Although fissile materialis not normally handled in this area, shipments andreceipts of SNM may pass through.
All nonfuel mockup materials are stored in thenonfuel storage area, including several tonnes of
depleted uranium. Reactor drawers are loaded withthe nonfiel mockup materials and transferred either
7
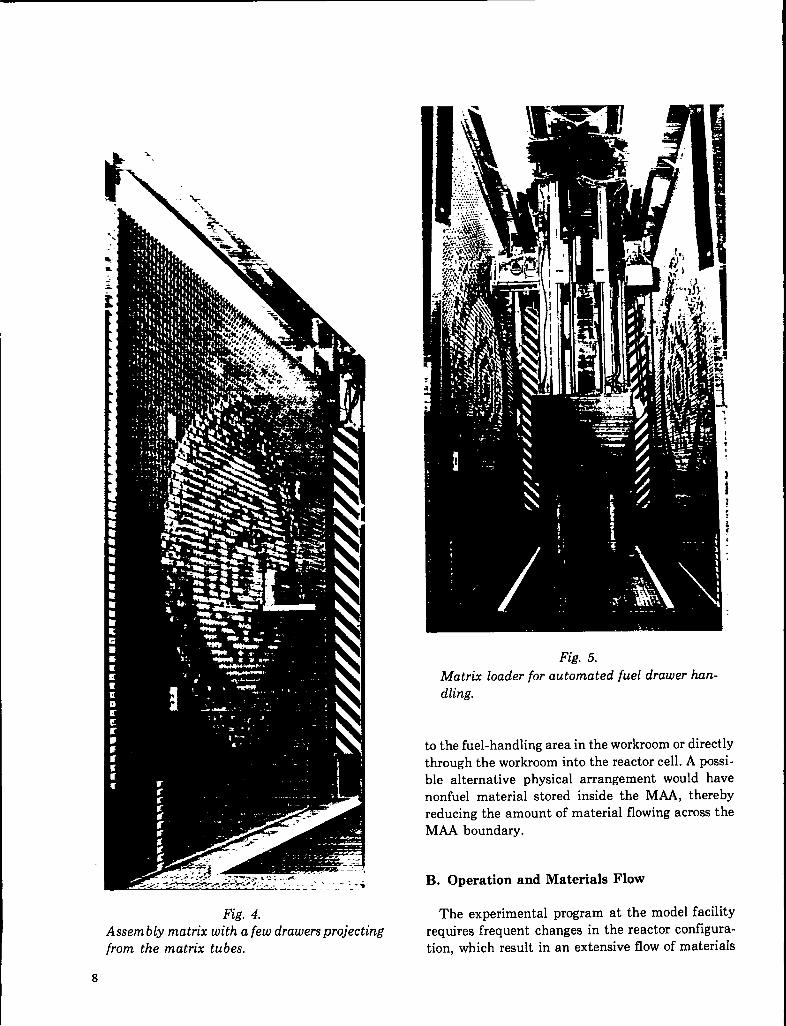
Fig. 5.
Matrix loader for automated fuel drawer han-
dling.
Fig. 4.Assembly matrix with a few drawers projectingfrom the matrix tubes.
8
to the fuel-handling area in the workroom or directlythrough the workroom into the reactor cell. A possi-ble alternative physical arrangement would havenonfuel material stored inside the MAA, therebyreducing the amount of material flowing across theMAA boundary.
B. Operation and Materials Flow
The experimental program at the model facilityrequires frequent changes in the reactor configura-tion, which result in an extensive flow of materials
,—————————————1
I
I1
1
I
,I
1.___ -— ——— ———l1
W&.I
J [X?m!.mt.,[ m!,,
I
1
1
1 I
I
I
1
; ‘TEnl&, ‘=- ‘R--— ——— ——— ———_ — __________ -1
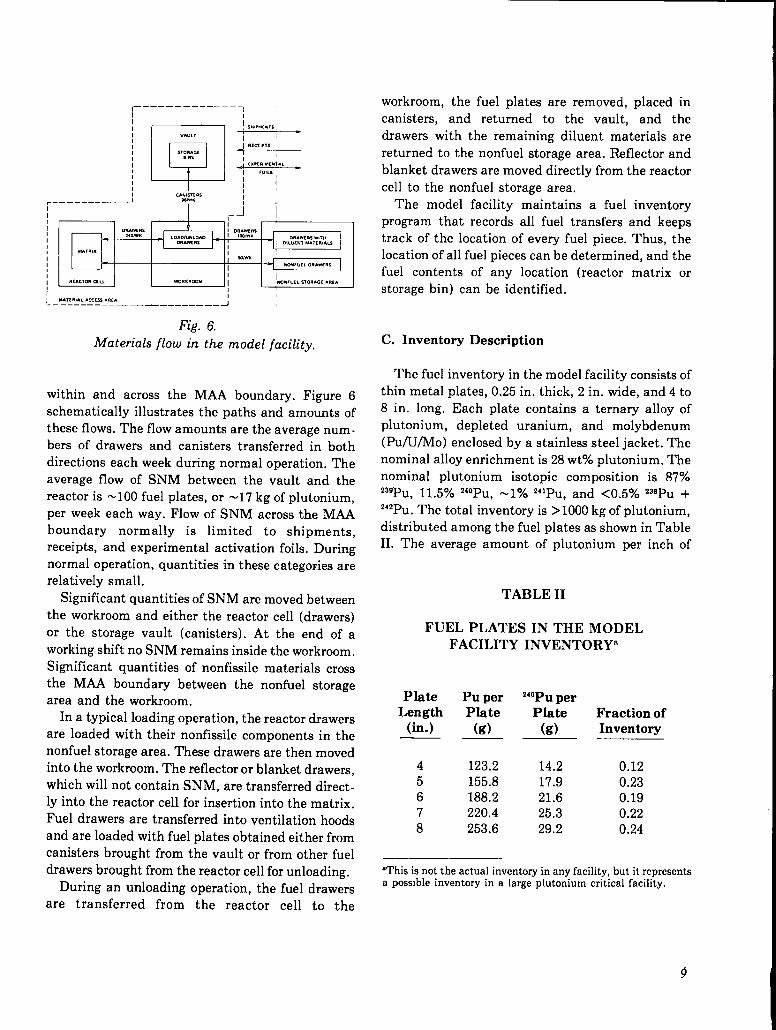
Fig. 6.
Materials flow in the model facility.
within and across the MAA boundary. Figure 6schematically illustrates the paths and amounts ofthese flows. The flow amounts are the average num-bers of drawers and canisters transferred in bothdirections each week during normal operation. Theaverage flow of SNM between the vault and thereactor is -100 fuel plates, or -17 kg of plutonium,
per week each way. Flow of SNM across the MAAboundary normally is limited to shipments,receipts, and experimental activation foils. Duringnormal operation, quantities in these categories arerelatively small.
Significant quantities of SNM are moved betweenthe workroom and either the reactor cell (drawers)or the storage vault (canisters). At the end of aworking shift no SNM remains inside the workroom.Significant quantities of nonfissile materials crossthe MAA boundary between the nonfuel storagearea and the workroom.
In a typical loading operation, the reactor drawersare loaded with their nonfissile components in thenonfuel storage area. These drawers are then movedinto the workroom. The reflector or blanket drawers,which will not contain SNM, are transferred direct-ly into the reactor cell for insertion into the matrix.Fuel drawers are transferred into ventilation hoods
and are loaded with fuel plates obtained either fromcanisters brought from the vault or from other fueldrawers brought from the reactor cell for unloading.
During an unloading operation, the fuel drawersare transferred from the reactor cell to the
workroom, the fuel plates are removed, placed incanisters, and returned to the vault, and thedrawers with the remaining diluent materials arereturned to the nonfuel storage area. Reflector andblanket drawers are moved directly from the reactorcell to the nonfuel storage area.
The model facility maintains a fuel inventoryprogram that records all fuel transfers and keepstrack of the location of every fuel piece. Thus, thelocation of all fuel pieces can be determined, and thefuel contents of any location (reactor matrix orstorage bin) can be identified.
C. Inventory Description
The fuel inventory in the model facility consists ofthin metal plates, 0.25 in. thick, 2 in. wide, and 4 to8 in. long. Each plate contains a ternary alloy ofplutonium, depleted uranium, and molybdenum(PufUfMo) enclosed by a stainless steel jacket. Thenominal alloy enrichment is 28 wt% plutonium. Thenominal plutonium isotopic composition is 877.Zwpu 11.5y0 Z40pu, - 10/~241Pu,and <0.5°A ‘S*PU +
24’Pu~The total inventory is >1000 kg of plutonium,distributed among the fuel plates as shown in TableII. The average amount of plutonium per inch of
TABLE II
FUEL PLATES IN THE MODELFACILITY INVENTORY8
PlateLength
(in.)
Pu perPlate
(g)
45678
123.2155.8188.2220.4253.6
240PuperPlate
(g)Fraction ofInventory
14.217.921.625.329.2
0.120.230.190.220.24
“This is not the actual inventory in any facility, but it representsa possible inventory in a large plutonium critical facility.
9
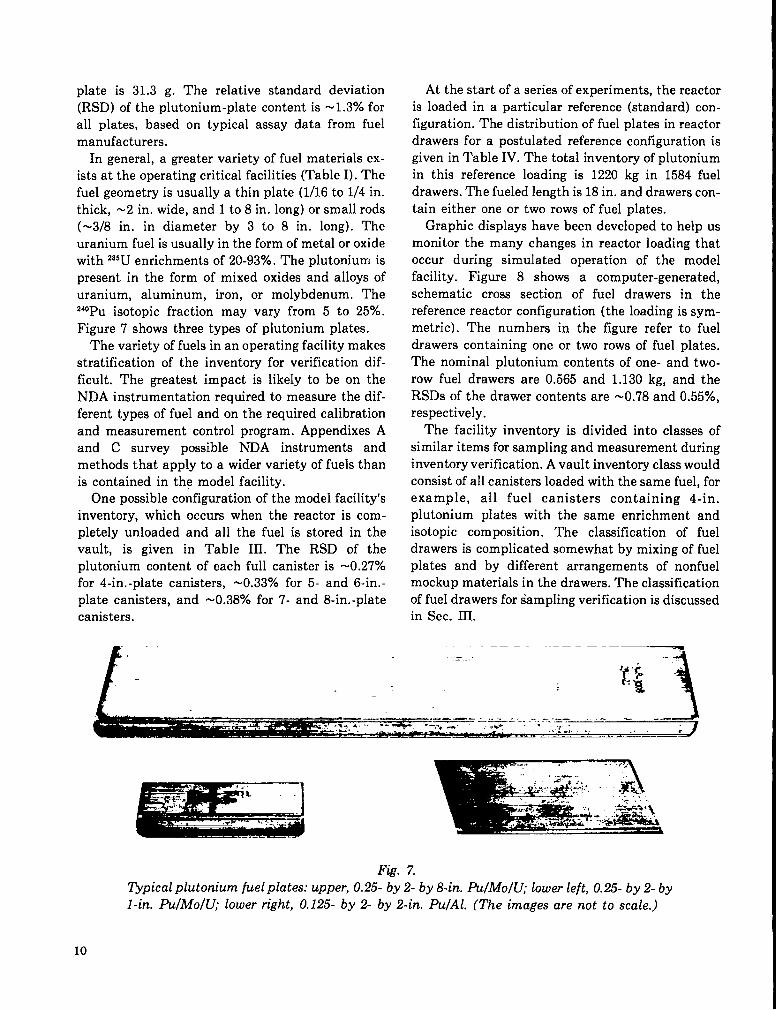
plate is 31.3 g. The relative standard deviation(RSD) of the plutonium-plate content is - 1.3% forall plates, based on typical assay data from fuelmanufacturers.
In general, a greater variety of fuel materials ex-ists at the operating critical facilities (Table I). Thefuel geometry is usually a thin plate (1/16 to 1/4 in.thick, -2 in. wide, and 1 to 8 in. long) or small rods
(-3/8 in. in diameter by 3 to 8 in. long). Theuranium fuel is usually in the form of metal or oxidewith 295Uenrichments of 20-93%. The plutonium ispresent in the form of mixed oxides and alloys ofuranium, aluminum, iron, or molybdenum. TheZ40pu isotopicfraction may vary from 5 to 250i0.
Figure 7 shows three types of plutonium plates.The variety of fuels in an operating facility makes
stratification of the inventory for verification dif-ficult. The greatest impact is likely to be on theNDA instrumentation required to measure the dif-ferent types of fuel and on the required calibrationand measurement control program. Appendixes Aand C survey possible NDA instruments andmethods that apply to a wider variety of fuels thanis contained in the model facility.
One possible configuration of the model facility’sinventory, which occurs when the reactor is com-pletely unloaded and all the fuel is stored in thevault, is given in Table III. The RSD of theplutonium content of each full canister is -0.27%for 4-in. -plate canisters, -0.33% for 5- and 6-in. -plate canisters, and -0.38% for 7- and 8-in. -platecanisters.
At the start of a series of experiments, the reactoris loaded in a particular reference (standard) con-figuration. The distribution of fuel plates in reactordrawers for a postulated reference configuration isgiven in Table IV. The total inventory of plutoniumin this reference loading is 1220 kg in 1584 fuel
drawers. The fueled length is 18 in. and drawers con-tain either one or two rows of fuel plates.
Graphic displays have been developed to help usmonitor the many changes in reactor loading thatoccur during simulated operation of the modelfacility. Figure 8 shows a computer-generated,schematic cross section of fuel drawers in thereference reactor configuration (the loading is sym-metric). The numbers in the figure refer to fueldrawers containing one or two rows of fuel plates.The nominal plutonium contents of one- and two-row fuel drawers are 0.565 and 1.130 kg, and theRSDS of the drawer contents are -0.78 and 0.55%,respectively.
The facility inventory is divided into classes ofsimilar items for sampling and measurement duringinventory verification. A vault inventory class wouldconsist of all canisters loaded with the same fuel, forexample, all fuel canisters containing 4-in.plutonium plates with the same enrichment and
isotopic composition. The classification of fueldrawers is complicated somewhat by mixing of fuelplates and by different arrangements of nonfuelmockup materials in the drawers. The classificationof fuel drawers for sampling verification is discussedin Sec. III.
—.- - -~
2!)~~.--—-....-...=..--.==A - -
--.:. -. .- .+? “ ,-..7,.- -. --- ,.
—k
Fig. 7.Typical plutonium fuel plates: upper, 0.25- by 2- by 8-in. Pu/MolU; lower left, 0.25- by 2- byl-in. PulMo/U; lower right, 0.125- by 2- by 2-in. Pu/Al. (The images are not to scale.)
10
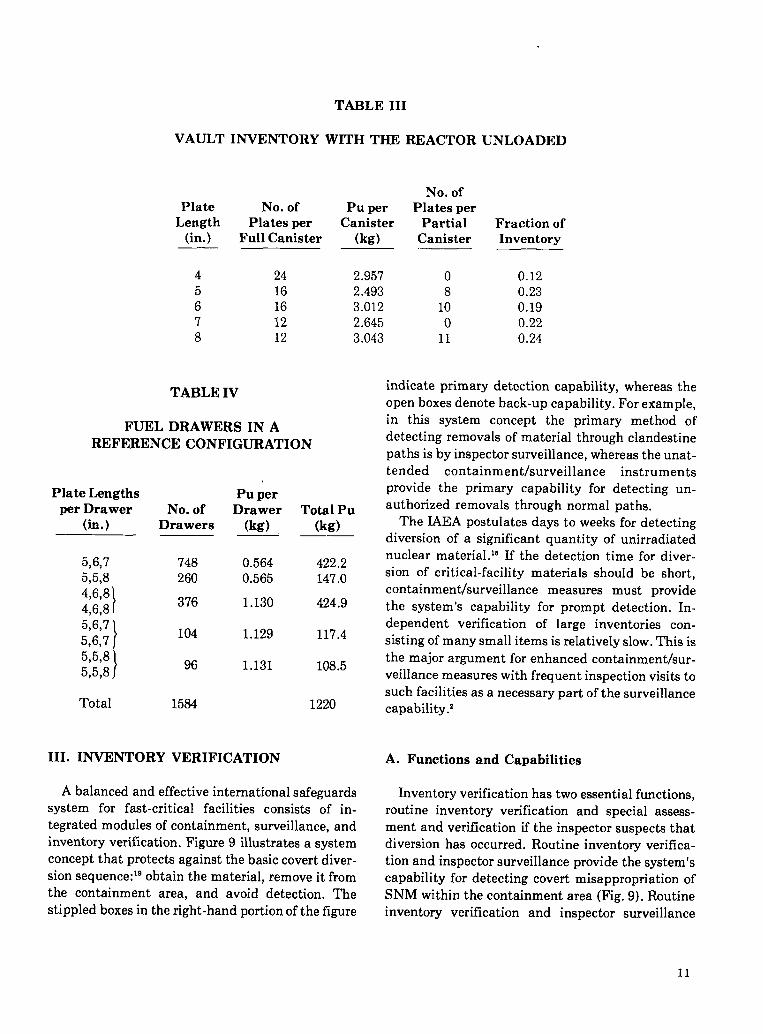
VAULT INVENTORY
Plate No. ofLength Plates per
TABLE III
WITH THE REACTOR UNLOADED
No. OfPu per Plates per
Canister Partial Fraction of(in.) Full Canister (kg) Canister Inventory
4 24 2.957 0 0.125 16 2.493 8 0.236 16 3.012 10 0.197 12 2.645 0 0.228 12 3.043 11 0.24
TABLE IV
FUEL DRAWERS IN AREFERENCE CONFIGURATION
Plate Lengths Pu perper Drawer No. of Drawer Total Pu
(in.) Drawers (kg) (kg)
5,6,7 748 0.564 422.25,5,8 260 0.565 147.04,6,84,6,8 }
376 1.130 424.9
5,6,75,6,7 }
104 1.129 117.4
5,5,85,5,8 }
96 1.131 108.5
Total 1584 1220
III. INVENTORY VERIFICATION
A balanced and effective international safeguardssystem for fast-critical facilities consists of in-tegrated modules of containment, surveillance, andinventory verification. Figure 9 illustrates a systemconcept that protects against the basic covert diver-sion sequence:lg obtain the material, remove it fromthe containment area, and avoid detection. Thestippled boxes in the right-hand portion of the figure
indicate primary detection capability, whereas theopen boxes denote back-up capability. For example,in this system concept the primary method ofdetecting removals of material through clandestinepaths is by inspector surveillance, whereas the unat-tended containment/surveillance instrumentsprovide the primary capability for detecting un-authorized removals through normal paths.
The IAEA postulates days to weeks for detectingdiversion of a significant quantity of unirradiatednuclear material.ls If the detection time for diver-sion of critical-facility materials should be short,containment/surveillance measures must providethe system’s capability for prompt detection. In-dependent verification of large inventories con-sisting of many small items is relatively slow. This isthe major argument for enhanced containment/sur-veillance measures with frequent inspection visits tosuch facilities as a necessary part of the surveillancecapability.2
A. Functions and Capabilities
Inventory verification has two essential functions,routine inventory verification and special assess-ment and verification if the inspector suspects thatdiversion has occurred. Routine inventory verifica-tion and inspector surveillance provide the system’scapability for detecting covert misappropriation ofSNM within the containment area (Fig. 9). Routineinventory verification and inspector surveillance
11

2 15 20 25 30 36
115
120
125
130
135
13737 40 45 50 55 61
Fig. 8.
Schematic cross section of a reference configuration.
INTENT
B,...,..........,..
..”.
,. !
, -.
. .
SWXESFU1 DWERS1ON
Fig. 9.
Schematic of the covert diversion sequenceand the integrated detection capability of thesafeguards system.
also must verify that the unattended contain-ment/surveillance instruments are not being subver-ted or bypassed.
The tradeoff between inspector surveillance andthe intensity of routine inventory verification must
be considered carefully because, in general, in-dependent verification procedures can seriously im-pede facility operations. Frequent inspectionsshould reduce inventory-verification requirements.
In this study we have used the detection of a
significant-quantity diversion within 6 months withat least 95’%0probability as a guideline for compar-ing routine inventory-verification options. Wepropose distributing the onerous effort required for aconventional physical inventory, based on piececounting and item identification, into more fre-quent, partial inventories using collective-measurement techniques. Each partial inventory re-quires considerably less inspection effort and inter-ference with the experimental program than does aphysical inventory. The overall verification objec-
tives are met by combining the resulta of the partialinventories. Each partial inventory provides
relatively timely detection, albeit with lowerassurance.
The special assessment and inventory functionsare well defined. If the inspector suspects that SNMhas been misappropriated from the facility inven-tory, he must make an assessment to determine theappropriate response. If the IAEA concludes that aspecial inventory is warranted, independentverification procedures must be available to provide
12
the Agency with accurate information concerningthe form and amount of missing material.Specifically, we assume that special verificationmethods and procedures must be available to deter-mine, with at least 95% probability, whether asignificant quantity of SNM has been diverted.
B. Options
The potential safeguards benefit of each optionfor inventory verification must be weighed againstthe required inspection effort, cost, and operator ac-ceptability. Under NPT safeguards’ the IAEA mustbe allo,wed to implement verification strategies thatcan detect the illicit removal of a significant quan-tity from the inventory by any combination of thefollowing diversion strategies:” (1) a few removals ofrelatively large quantities, including the possibilityof replacement with lower grade or inert materials;(2) many removals of relatively small quantitieswith or without replacement; and (3) recordsfalsification, including deliberate misstatements ofitem locations and content-s or of the operator’s un-certainty of the contents. On the other hand, theoperator must be assured that the impact ofverification procedures on his facility is kept withinacceptable limits with regard to additional radia-tion exposure of personnel, lost operating time, andadditional operating cost.
1. Materials Measurement. Because of themany fuel pieces in the inventory and their disposi-tion inside reactor fuel drawers and vault storagecontainers, inventory verification based on measur-ing individual fuel pieces is time consuming and ad-versely affects the productivity of the experimentalprogram. A complete physical inventory based onmanual piece counting takes many days to completeand causes significant radiation exposure of person-nel because of the large amount of fuel handling in-volved.
It is desirable, therefore, to inventory the fuel“collectively” in relatively large units and to in-tegrate these collective verification measures intothe normal facility operation without requiring ex-tended shutdown periods. For example, a physicalinventory might best be scheduled to coincide with
a complete reactor unloading so that all the fuelcould be inventoried collectively in vault storagecontainers, in parallel with other routine facility ac-tivities scheduled during the shutdown. Further-
more, the integration of routine inventoryprocedures, based on collective measurements, intothe experimental program would minimize disrup-tions and could obviate the need for physical inven-tories under normal conditions. Collective-
measurement techniques identified for verificationof critical-facility fuels include gamma-ray andneutron NDA, autoradiographic NDA, and integralreactivity and related reactor-parameter measure-ments.
NDA methods quantitatively determine theelemental and isotopic composition of uranium- andplutonium-bearing materials by detecting andrecording unique gamma-ray or neutron signatures.Instruments that are sufficiently reliable and ac-curate to satisfy safeguards needs have beendeveloped and demonstrated. Such instruments arecoming into routine use by IAEA inspectors,because they provide portable, or at least transpor-table, capability for making independent verifica-tion measurements. Appendix A presents a surveyof gamma-ray and neutron NDA instruments andmethods for possible application to critical-facilityfuels. Plutonium-bearing fuels can be assayed using“passive” methods that measure the naturally oc-curring gamma and neutron radiations. Enricheduranium fuels may require “active” methods inwhich induced-fission radiation is detected after in-terrogation by an external radiation source. In
general, NDA instruments should be optimized forthe specific application, such as fuel composition,geometry, and environment.
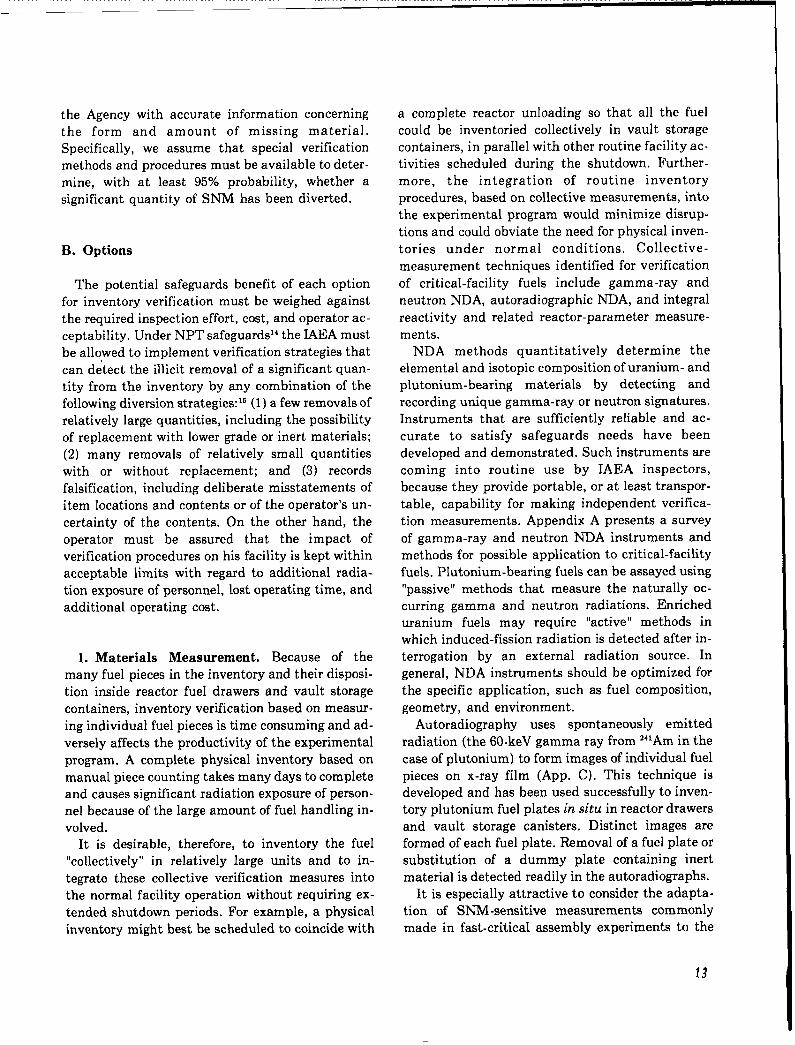
Autoradiography uses spontaneously emittedradiation (the 60-keV gamma ray from 24LAmin thecase of plutonium) to form images of individual fuelpieces on x-ray film (App. C). This technique isdeveloped and has been used successfully to inven-tory plutonium fuel plates in situ in reactor drawersand vault storage canisters. Distinct images areformed of each fuel plate. Removal of a fuel plate orsubstitution of a dummy plate containing inertmaterial is detected readily in the autoradiographs.
It is especially attractive to consider the adapta-tion of SNM-sensitive measurements commonlymade in fast-critical assembly experiments to the

routine verification of in-reactor inventory. Onepromising technique is the use of integral reactivityand related measurements (App. B), currently be-ing developed and evaluated for safeguards applica-tion. As the method is now conceived, the assemblyis returned periodically to a reference configuration,and the reactivity and other characteristicparameters of this reference are checked for changesindicating that a shift in the inventory has occurred.If the reactor inventory is unchanged, only the SNMinventory in vault storage remains to be verified toprovide a complete verification of the facility inven-tory. The operator normally establishes a newreference configuration each time the experimentalprogram requires a major loading change. Suchchanges might occur once or twice a year. To applythe reactivity technique, the inspector requires in-dependent verification of the SNM quantity anddistribution in each new reference configuration. Healso requires assurance that the operator has return-ed the reactor to the proper reference each time areactivity check is made. This assurance can be ob-tained by making supplementary measurementssuch as foil activation and material worth.
Table V is a summary of collective-measurementtechniques including the capabilities and Imitat-ions of each. The measurements are sensitive to dif-ferent properties and characteristics of the ~NMfuels. Although it may be possible to subvert anyone measurement technique, a combination of thesetechniques provides increased assurance andreduced vulnerability. The sensitivity, reliability,and operational acceptability of prototype hardwaresystems and proposed measurement proceduresmust be evaluated in operating critical facilities.The appropriate mix of measurement methods forany operating facility must be determined in thecontext of facility-specific design and operatingfeatures.
2. Vault Inventory. When SNM fuels are not in
use in the reactor, they are placed in speciallydesigned containers and stored in a secure vault,Tamper-indicating seals (App. E) can be used onthe vaqlt storage containers. The contents of eachcontainer can be verified by direct NDA measure-ment after sealing. This procedure substantiallyreduces the effort required for inventory verifica-tion.
The inspection effort required to maintain thevault inventory under seal depends on specificdesign features of the critical facility. In the modelfacility, a considerable fraction of the inventory of-ten resides in the vault, and 40-50 vault canistersare opened each week during normal operation. Inother facilities, most of the inventory is in the reac-tor, and fewer changes are made in the residualvault inventory. Generically, the inspector’s goal isto have the entire vault inventory sealed duringroutine reactor inventory verification so that the in-spection team can concentrate on verifying the reac-tor inventory, with only a check required of thesealed vault containers.
With this strategy, seals and verificationmeasurements are applied frequently to the un-sealed portion of the vault inventory. However,maintaining the vault inventory under continuousseal is not required; that is, each unsealed containerof SNM does not have to be resealed and measuredbefore it is placed in the vault. The only require-ment is that the entire vault inventory be sealedwhen the reactor inventory is verified. Because thevault is accessible during reactor operation, the ap-plication of seals and verification measurements tostorage containers during normal working hoursneed not interrupt the experimental program. Therequired effort would be smaller in less activefacilities and could be reduced in all facilities bysealing only that portion of the vault inventory notscheduled for near-term use in reactor experiments.
For a major loading change, inspectors are presentduring reactor unloading and reloading to monitorthe fuel handling and to verify the new reactorreference configuration. If the time between un-loading and reloading is relatively short (a fewdays), there is little benefit in sealing the vault in-ventory during the interim; that is, seals are appliedto the residual inventory in the vault only after thenew loading is complete.
3. Reactor Inventory. Timely reactor inventoryverification is the most difficult and challengingproblem in safeguarding fast-critical facilities.Reactor inventory verification requires considerableinspection effort and can make great impact onfacility operations. The inspector may be able tomonitor facility activities, especially the movementof fuel and the operator’s experimental data, which
14

MATERIALS
TABLE V
MEASUREMENT TECHNIQUES*
Measurement Type
Gamma spectroscopy
Passive neutronTotal counts
Passive neutronTotal and coincidencecounts
Active neutron
Autoradiography
Reactivity
Material worth
Foil activation
Capabilities
ISotopic ratios;fissile Pu enrichment.
Content of even Puisotopes; relativelysimple instrumentation.
Content of even Puisotopes; sensitive tochanges in geometry;corrections for backgroundand (a,n) reactions.
W-J content of HEU fuels;total fissile content ofmixed (U,PU) fuels; can beoperated in passive modefor Pu fuels.
Image of edge area of eachPu fuel piece; very fast;minimum fuel handling; rela-tively simple and inexpensive.
Total in-reactor inventory;very sensitive
Reactivity-compensatingchanges in fuel density,neutron spectrum, and powerprofile.
Reactivity-compensatingchanges in fuel density,neutron spectrum, and powerprofile.
Limitations
Significant self-attenua-tion; affected by gammabackground; marginal forHEU fuels; fuel handlingrequired.
Fissile Pu isotopes notmeasured directly; affectedby (a,n) reactions; affectedby neutron background; !ielhandling required; no HEUfuels.
Fissile Pu isotopes notmeasured directly; fuelhandling required; no HEUfuels.
External radiation sourcerequired; relatively bulkyand complex instrumenta-tion; fuel handling required.
Surface effect; may not beSNM specific; film process-ing and reading required.HEU fuels?
Relatively easy for opera-tor to subvert by itselfisupplementary measure-ments required; some fuelhandling required.
Supplementary to reactivitymeasurements.
Supplementary to reactivitymeasurements
‘See Appendixes A, B, and C.
15

contain much useful information concerning the in-ventory. However, even with continuous inspectorsurveillance, independent verification of the reactorinventory is necessary.
Options for reactor inventory verification fall intotwo categories,’* (1) those that require “in-line”verification of normal fuel transfers with contain-ment measures placed inside the MAA and (2) thosethat require periodic verification of the reactor in-ventory with containment measures placed at theMAA perimeter. The selection of the best combina-tion of options depends on the specific facility,
Category 1 options have several safeguards ad-vantages. For example, all the fuel entering andleaving the reactor can be measured using NDAtechniques. A unique measurement signature isassigned to each fuel element when it is loaded in-itially. Later, when the fuel element is unloadedfrom the reactor, it is remeasured and verified by asimple and very sensitive comparison of measure-ment signatures. If the critical-assembly machine or
the access paths to the reactor cell are sealed be-tween loading changes, direct verification of thereactor inventory would be necessary only infre-quently, for example, when the reactor is unloaded.
Category 1 procedures were practicable in a
facility such as one with a vertical assembly inwhich loading changes are relatively few and accessto fuel elements within the assembly is difficult.However, in an active facility with tlequent loadingchanges and relatively easy access to in-reactor fuelelements, such procedures impose a heavy burdenon both the inspector and the operator. On theaverage, more than 200 fuel drawers enter or -leavethe model facility’s reactor each week. If Category Iprocedures were applied to the model facility, at
least one inspector would have to be present duringall operating periods and the inspection effort wouldbe extremely intensive during a major loadingchange. If a component of the safeguards systemfailed, either operations would have to cease orsafeguards assurance would be seriously com-promised.
Category 2 options include all procedures forperiodic verification of the reactor inventory. Theyrange from, say, weekly sampling of the reactor in-ventory or weekly checks of integral reactivity to an-nual physical inventory by unloading the reactorand counting fuel pieces. For active critical facilities
such as the model facility, Category 2 options canprovide adequate verification of reactor inventorywithout obstructing normal materials-flow pathswith containment measures or unloading the reactorfor physical inventory. This is the safeguards-system concept illustrated by Fig. 9.
One means of verifying the reactor inventory is bysampling and NDA measurement of in-core reactordrawers (App. D). A summary of results frommodeling and simulation studies of sampling thereference reactor is given in Sec. IV. The effec-tiveness of many combinations of sample size andinventory frequency for various diversion strategieswas evaluated. The results show that a combinationof small samples provides essentially the samedetection capability as does a single large sample.This is true despite frequent and sometimes ratherlarge changes in the reactor inventory during the ex-
perimental program. For example, three 10% sam-ples or one 30% sample provide -95Y0 probability ofdetecting 8 kg of plutonium missing from thereference reactor. Thus, 10% bimonthly or 30%semiannual sampling verifications could satisfy theinventory verification guideline.
There is, in fact, a continuum of sample sizes andinventory frequencies that satisfy the guideline.However, a 6-month inventory period is judged to betoo long to provide adequate assurance that the con-tainment/surveillance measures are not being sub-verted. Furthermore, verifying 31)~oof the reactor in-ventory requires a rather intense inspection effortand a relatively long operating delay. Weekly inven-tories provide timely assurance and require arelatively small sampling effort (<5~0 of the reactorinventory). However, this sampling plan requires atime period each week, such as every weekend, dur-ing which the reactor is not operating, the inspec-tion team is available, the instrumentation iscalibrated and in place, and the vault inventory issealed, and therefore may be difficult to implement.
An inventory period of 1-3 months is judged to bea reasonable compromise, assuming that instru-ments are calibrated and maintained at the facilityunder tamper-indicating seal and that inspectorsare located nearby. Scheduling should be flexible tohave minimum impact on the experimentalprogram. For example, the inventory activity couldbe scheduled during weekends when the reactor nor-mally is not operating. The instruments should be
16

calibrated and installed before the time scheduled
for verification and the total time allotted in thereactor cell for measurements should be fixed. Ifproblems are encountered and the goals of theverification plan are not achieved during the allot-ted time, the time until the next routine verificationis not excessive.
The integral reactivity technique is anothermethod for routine reactor-inventory verification, Acombination of integral reactivity checks and sam-pling verifications provides better assurance thaneither technique provides by itself. With this com-bination, the inspector must verify the inventory ofeach new reference configuration established by theoperator, One approach is to measure a randomsampling of fuel during reloading of the reactor intoa new reference. Such measurements would con-stitute one of the routine sampling verifications.
Periodically, a sampling verification would bereplaced with a reactivity verification, in which thereactivity and other parameters of a reference con-figuration are checked. The choice of verificationmethod, sampling or reactivity, could be made on arandom basis. The schedule for reference reactivitychecks should be flexible to minimize the number ofloading changes required to return a reactor to aparticular reference. The reactor loading is muchcloser to a particular reference at certain points inthe experimental program than at other times, andreactivity checks could be scheduled at some ofthese points by random selection. During a long ex-
perimental program, the operator may establish aseries of reference configurations.
4. Special Inventory. A special inventory is re-quested by the IAEA if it is probable that SNM hasbeen misappropriated. The Agency’s decision isbased primarily on monitoring facility activities,records, and reports, and quantitative evidencefrom the containment, surveillance, and inventory-verification systems.
When an abnormal safeguards condition occurs,the inspector must make an assessment. If hesuspects that material has been diverted, he can useany of the routine inspection methods to confirm orallay his suspicions. Clearly, effective special in-spections must rely on effective techniques forroutine inspections.
If the Agency concludes that diversion probablyhas occurred and that a special inventory isnecessary, a special inspection team should beavailable on short notice for an intensive inspectionto determine the form and quantity of material mis-sing from the inventory. All sealed storage con-tainers in the vault are checked for seal integrity.The contents of unsealed containers are verified byNDA measurement, Sampling and measurement ofsoy. of the reactor inventory provides >$)i5~0
probability of detection for a missing significantquantity.
The 50% sample size is deduced as follows. A 30%sample provides -95% probability of detecting asignificant quantity for routine inventory. Ifevidence of diversion has been obtained already, alarger sample is required to provide the sameassurance. The situation is analogous to acceptingsome defects in an item inventory as long as thenumber does not exceed a specified limit (App. D).
The mix of measurement techniques to be usedduring a special inventory depends on the type ofdiversion suspected by the inspector (for example,removal of the entire contents of fuel drawers orreplacement of individual fuel plates by dummyplates). If diversion is discovered at any point in thesampling, the inspection team could proceed with acomplete check of the reactor inventory. If no diver-sion is found, there is high confidence that a signifi-cant quantity of SNM is not missing from the reac-tor, but surveillance and verification measurescould be increased, for example, by returning thereactor to a reference configuration for a reactivitycheck within a reasonably short period of time.
C. Inspection Strategy for the Model Facility
The following is a conceptual approach to inter-national inspections for the model critical facility.Specific elements of this approach depend onassumed design and operating features of the modelfacility such as the automated fuel-handlingcapability and the accessibility of reactor drawersfor NDA measurement. The inspection strategy forthe model facility is developed as an example. Theactual strategy developed for any real facility willdiffer in many respects.
17

1. Inspection Effort. Under NPT safeguards, themaximum routine inspection effort (Ref. 14,Article80) is 30@ man-days per year, where E is thefacility inventory in effective kilograms. (E isdefined in Article 104 as the weight of plutonium inkilograms plus the weight of HEW multiplied by thesquare of its enrichment.) For any large criticalfacility, the maximum annual inspection effort per-mitted under NPI’ is several hundred man-days.The model facility would have more than 10W man-days under NPT.
Frequent visits are made to the model facility by
one inspector to check the integrity of the materialscontainment,* to monitor facility records and experi-ments, and to perform other routine inspection
procedures such as sealing vault containers andcalibrating instruments. Two or three inspectors areneeded during short periods of more intense inspec-tion activity, for example, during routine verifica-tion of the reactor inventory. Under extraordinarycircumstances, a team of six or more inspectors is re-quired for a special inventory to complete it in I -2wk.
2. Records and Reports. Facilities under IAEAsafeguards must maintain accounting and operatingrecords that include source data and physical inven-tory procedures (Ref. 14, Articles 51-58). The.statemust submit reportszo to the IAEA (Ref. 14, Articles59-69) that describe inventory changes (monthly),
physical inventories, and materials balances. Thereports should be relatively simple for a criticalfacility because of the discrete-item and essentiallystatic nature of the inventory.
The facility records are audited, perhaps semian-nually, for internal consistency, bookkeeping errors,and to see that they agree with the reports transmit-ted to the IAEA. The records may be rejected if in-accuracies are discovered totaling to significant-quantity amounts.”
Checking of facility records is an integral part ofroutine inspection. The automated records systemat the model critical facility facilitates frequentchecking of records and monitoring of experimentalactivity. In addition, automated bookkeeping
minimizes the number of unintentional errors in thedata base. Graphic displays (Fig. 8) facilitate themonitoring of reactor loading changes.
3. Shipments and Receipts. The total inventoryin the model critical facility is normally static, andshipments or receipts of SNM are infrequent. Ifpossible, transfers between facilities under IAEAsafeguards are verified by evaluating shipper andreceiver measurement differences.15’21’22Shipmentsfrom a critical facility normally consist of fuelremoved from vault storage containers, whereasreceipts normally consist of similar fuel that isplaced in vault storage. Thus, verification of ship-ments and receipts should be relatively simple and
should not affect the experimental program if ade-quate inventory verification measures are im-plemented in the vault area.
4. Seals. The use of tamper-indicating seals andNDA verification measurements on vault storagecontainers facilitates inventory verification at themodel facility, The unsealed static portion of thevault inventory is sealed and verified weekly. Theentire vault inventory is sealed when the reactor in-ventory is verified.
The use of seals in no way denies access to thematerial. When material is needed for normal use,the operator or the inspector removes the seal andthe contents of that container become part of thebulk inventory that requires verification. Seals arealso applied to unattended containment/sur-veillance instruments, verification instruments, andstorage areas for calibration standards located at thefacility.
5. Sampling and Reactivity Verifications. Theinventory in the model facility reactor is verified bysampling or reactivity verifications randomlyscheduled at 1- to 3-month intervals. Reactordowntime during a routine verification is limited totwo 8-h shifts that can be scheduled during normalshutdown, that is, on nights and weekends.Automated fuel handling is used to minimize radia-tion exposure of personnel.
During a sampling verification, -1OYO of the reac-tor inventory is verified using a combination of NDAtechniques (Table V) to measure fuel in reactordrawers. Instruments are calibrated before installa-tion in the reactor cell.
The reactor can be loaded in a reference con-figuration for a reactivity verification about four
18

times per year without seriously disrupting the ex-
perimental program. One or two such verificationsare performed every 6 months when the reactorloading is near a reference configuration.
A major loading change occurs and a newreference is established every 6 months on theaverage. A routine sampling verification is per-formed to verify the fuel content of the newreference configuration. One or two additional sam-
pling verifications are performed every 6 months.In the model facility, therefore, the reactor inven-
tory is verified by a randomly selected combinationof sampling and reactivity verifications totaling 6 to10 (average of 8) annually. If eight routine verifica-tions occur during 1 yr, for example, they could in-clude six sampling and two reactivity or four sampl-ing and four reactivity verifications.
The period between routine verifications is no lessthan 1 nor more than 3 months. The maximum per-mitted reactor downtime for routine verification is 2shifts for each verification and a total of 20 shifts an-nually. This corresponds to a maximum of 8% ofreactor operating time assuming 250 operating shiftsannually. The actual downtime is reduced byscheduling some of the routine verification activitiesduring normal shutdown.
6. Special Assessment and Verification. Whenan abnormal safeguards condition occurs, the in-spector investigates the cause. Many abnormalitiesare caused by equipment malfunctions or by unin-tentional errors made by the operator or the inspec-tor. A few abnormalities are more difficult to ex-plain and require a more thorough investigation.
The available techniques and procedures for suchinvestigations include those used during routine in-spections. For example, if an abnormality is in-dicated by one of the unattended containment/sur-veillance instruments and the operator offers nosatisfactory explanation, the inspector can schedulea routine inventory verification. An abnormality dis-covered during routine inventory may be explainedor discounted by repeating measurements or by tak-ing additional samples. If a discrepancy is dis-covered when data from a routine inventory areanalyzed, the inspector can request that the entireinventory or any portion thereof be repeated.
If the inspector is convinced by his investigationsthat SNM has been diverted from the facility, the
international agency can request a special inspec-tion to determine the form and quantity of missingmaterial. A special inspection includes auditing thefacility records, checking the integrity of seals, andverifying the unsealed inventory in the vault and thereactor. The inspector develops a special inspectionplan based on his evidence concerning the diversionstrategy. This plan could include a samplingverification of 50y0 of the reactor inventory toprovide >%y. probability of detecting a missingsignificant quantity.
We estimate that a team of about six inspectorscould complete a special inspection of the modelfacility in 1-2 wk. The required time depends mainlyon what procedures are used to verify the reactor in-ventory; that is, a reactivity verification requiresmuch less time than unloading the reactor for acomplete inventory.
7. Sampling Plan Design. Statistical samplingprocedures and appropriate data evaluationmethods are reviewed in App. D. An acceptablesampling plan must be capable of detecting a fewrelatively large removals (so-called attributesdefects) or many relatively small removals (so-called variables defects), within a variety of conceal-ment strategies.
A combined attributes and variables samplingplan for verifying the reactor inventory is describedin App. D and the references therein. Such samplingplans have been developed previously for safeguardsapplications .22-2sThe boundary between attributesand variables defects is referred to as the attributeslimit. Attributes defects are detected by a single go-no-go measurement, whereas variables defects aredetected by a collective-analysis of many measure-ments.
Based on the sensitivity of similar NDA in-strumentation (App. A), the attributes limit forneutron NDA drawer measurements is expected tobe s 10% of the contents of a fuel drawer. Detection
of a few removals of quantities much larger than theattributes limit, such as the entire fuel contents ofdrawers, is difficult because very few such removalsare required to obtain a significant quantity. In themodel facility, 14 one-row or 7 two-row drawers con-tain 8 kg of plutonium out of a total of -1600 fueldrawers containing more than 1000 kg. Detection ofmany removals of amounts much smaller than the
19

attributes limit, such as individual fuel plates, is
also difficult because of intrinsic measurement andsampling uncertainties; that is, the detection ofmany small removals is based on analyzing the sam-ple verification measurements collectively, but themeasurement methods may not be sufficiently sen-sitive and the sample may not be a sufficiently ac-curate representation of the inventory.
A combined attributes-variables sampling plan ismost sensitive to many removals, each approx-imately equal in size to the attributes limit, becausetechniques for detecting both relatively large andrelatively small removals are effective near thislimit. An effective sampling plan must have ade-quate sensitivity to detect a significant-quantitydiversion obtained in a few large removals, eachmuch greater than the attributes limit, or in manysmall removals, each much less than the attributeslimit; that is, removals of whole-drawer contents orremovals of individual fuel plates. The desiredprobability of detecting a significant diversion inwhole-drawer removals primarily determines thesample size. Data evaluation techniques (Sec.111.C.9 and App. D) partially overcome the com-bined effects of measurement and sampling uncer-tainties on the detection of small removals.
To implement the sampling plan, the inventoryfirst must be stratified into classes based on the con-tents of the fuel containers and the characteristics ofthe measurement techniques. Fuel drawers areclassified for verification by NDA according to theamount of plutonium, the plutonium isotopic com-position, and the arrangement of fuel plates andnonfuel mockup materials within the drawer. Fuel-plate arrangement affects neutron signatures bychanging the neutron multiplication. The effect ofnonfuel materials on neutron signatures is producedmainly by the quantity of depleted uranium in thedrawer and its proximity to the fuel plates (App. A,Table A-I).
To estimate the number of fuel-drawer classesthat might be encountered in practice, we examinedactual reactor loadings in a plutonium criticalfacility during 1 yr of operation. All fuel drawerscontained one or two 18-in. rows of plutoniumplates, and fuel plates with three isotopic composi-tions were used. The drawers also contained variousamounts and arrangements of depleted uranium
and other nonfuel materials along the 18-in. fueledlength. Based on these differences, we identified sixclasses of one-row drawers and five classes of two-row drawers for the entire year of operation. The fuelplates were sufficiently uniform that differencesbased on plate length alone were not significant.The 11 classes contained several small subclasseswith some variation in the type and arrangement ofnonfuel materials. These differences were judged tobe minor in their effect on neutron signatures. Thus,the effort required to stratify the reactor inventoryfor measuring drawers by neutron counting does notappear to be excessive.
For illustration, a sampling plan is developed herefor the reference core loading described in Sec. LT.There are two classes of one-row drawers and threeclasses of two-row drawers (Table IV). For anydesired sampling fraction of the inventory, sample
sizes for each class are determined in two steps. Step1 is to determine the desired number of one- andtwo-row drawers in the sample. Let I = the totalreactor inventory (1220 kg Pu), f = the fraction of Ito be sampled, p = the average content of an 18-in.row of fuel plates (0.565 kg Pu), NI = the number ofone-row drawers in the reactor (1008), NZ = thenumber of two-row drawers in the reactor (576), andnl(n~) = the number of one- (two-) row drawers inthe sample.
The sample sizes n, and n, must satisfy the equa-tion
nl~ + n2(2~) = fl . (1)
In addition, n, and n, must be proportional to theamount of plutonium in one- and two-row drawers;that is,
nl/n2 = N1/(2N2) . (2)
Then step 1 is completed by solving Eqs. (1) and (2)for n, and n,.
Step 2 consists of finding the desired sample sizesof one- and two-row drawers for each class; these aredenoted by n,~ and n,,, where k and j identify classesof one- and two-row drawers, respectively. The classsample sizes must be proportional to the amount ofplutonium in the class; that is,
20
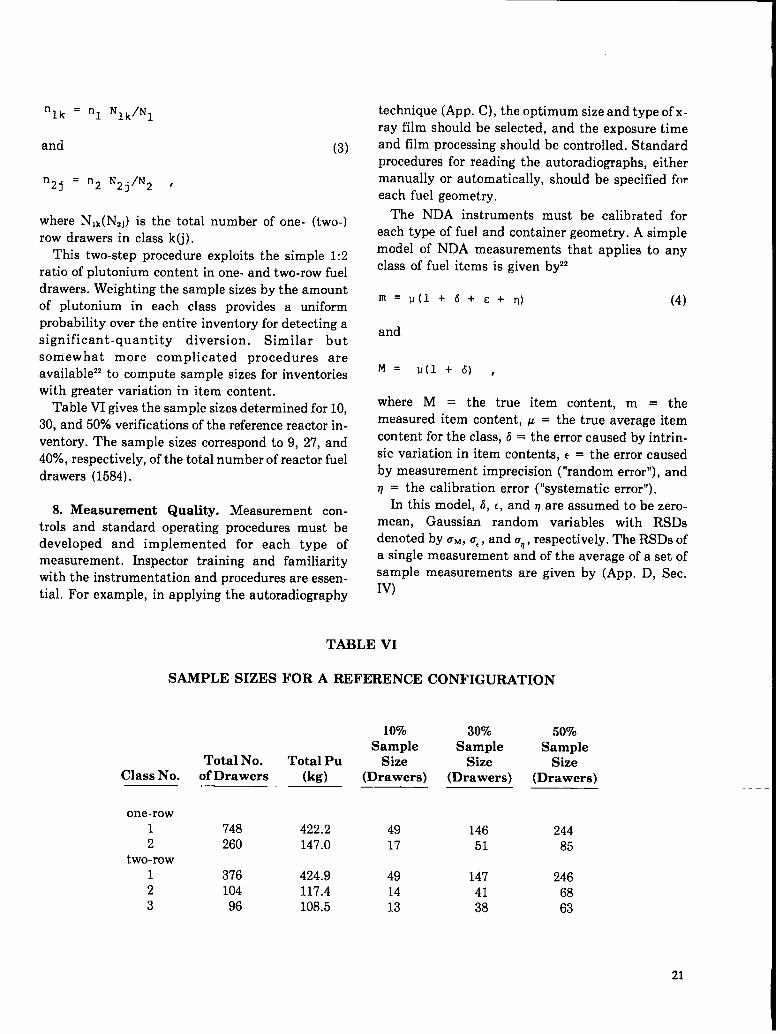
=n‘lk 1 ‘lk/Nl
and (3)
‘2j = n2 N2j/N2 ,
where Nl~(NzJ) is the total number of one- (two-)row drawers in class k(j).
This two-step procedure exploits the simple 1:2ratio of plutonium content in one- and two-row fueldrawers. Weighting the sample sizes by the amountof plutonium in each class provides a uniformprobability over the entire inventory for detecting asignificant-quantity diversion. Similar butsomewhat more complicated procedures areavailable22 to compute sample sizes for inventorieswith greater variation in item content.
Table VI gives the sample sizes determined for 10,30, and 50% verifications of the reference reactor in-ventory. The sample sizes correspond to 9, 27, and40~0, respectively, of the total number of reactor fuel
drawers (1584).
8. Measurement Quality. Measurement con-trols and standard operating procedures must bedeveloped and implemented for each type ofmeasurement. Inspector training and familiarityywith the instrumentation and procedures are essen-tial. For example, in applying the autoradiography
technique (App. C), the optimum size and type of x-ray film should be selected, and the exposure timeand film processing should be controlled. Standardprocedures for reading the autoradiographs, eithermanually or automatically, should be specifiedfnr
each fuel geometry.
The NDA instruments must be calibrated foreach type of fuel and container geometry. A simplemodel of NDA measurements that applies to anyclass of fuel items is given by22
ln=~(l+6+E+~) (4)
and
M= P(1 + 6) ,
where M = the true item content, m = themeasured item content, ~ = the true average item
content for the class, 6 = the error caused by intrin-sic variation in item contents, c = the error causedby measurement imprecision (“random error”), and
q = the calibration error (“systematic error”).In this model, b, c, and q are assumed to be zero-
mean, Gaussian random variables with RSDSdenoted by ISM,a,, and I.Tq,respectively. The RSDS ofa single measurement and of the average of a set of
sample measurements are given by (App, D, Sec.IV)
TABLE VI
SAMPLE SIZES FOR A REFERENCE CONFIGURATION
Total No.Class No. of Drawers
one-row1 7482 260
two-row1 3762 1043 96
Total Pu(kg)
1070Sample
Size(Drawers)
Z070
SampleSize
(Drawers)
422.2147.0
424.9117.4108.5
4917
491413
14651
1474138
5090Sample
Size(Drawers)
24485
2466863
21
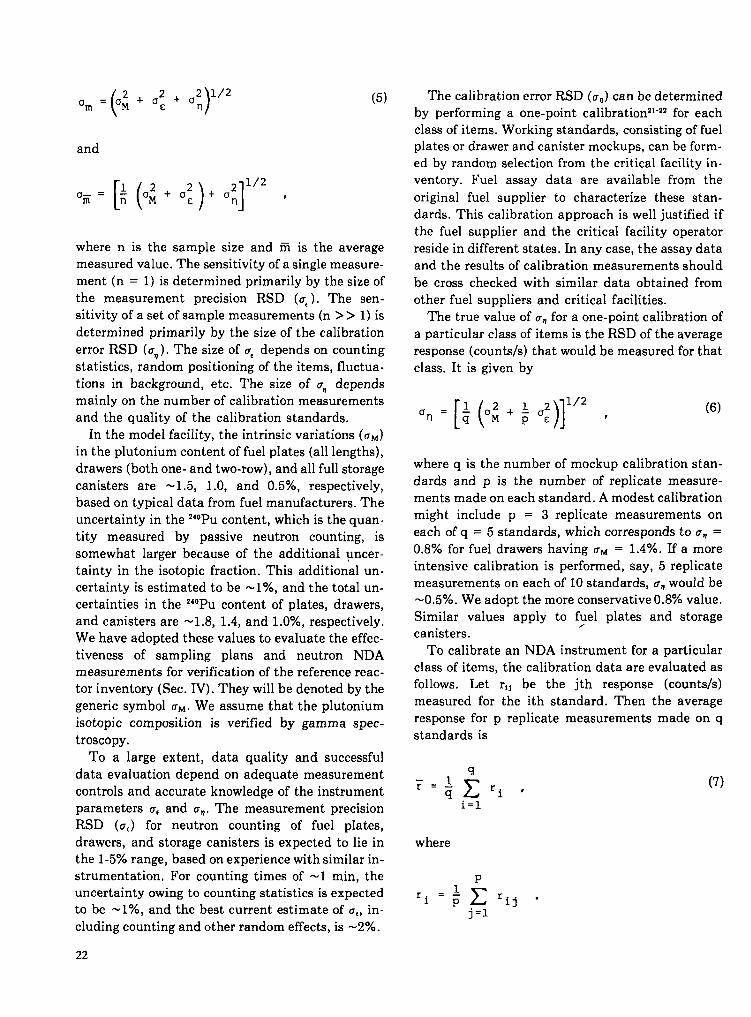
(2 2
)
~ ~2 1/2cJm=oM+a E n
(5)
and
.K= [: (.: + .;)+ .:]1/2 ,
where n is the sample size and iii is the averagemeasured value. The sensitivity of a single measure-ment (n = 1) is determined primarily by the size ofthe measurement precision RSD (u,). The sen-sitivity of a set of sample measurements (n >> 1) isdetermined primarily by the size of the calibrationerror RSD (an). The size of a, depends on countingstatistics, random positioning of the items, fluctua-tions in background, etc. The size of u~ dependsmainly on the number of calibration measurementsand the quality of the calibration standards.
In the model facility, the intrinsic variations (cr~)in the plutonium content of fuel plates (all lengths),drawers (both one- and two-row), and all full storagecanisters are -1.5, 1.0, and 0.5Y0, respectively,based on typical data from fuel manufacturers. Theuncertainty in the *’”Pu content, which is the quan-tity measured by passive neutron counting, issomewhat larger because of the additional uncer-tainty in the isotopic fraction. This additional un-certainty is estimated to be -1 Y., and the total un-certainties in the 240Pucontent of plates, drawers,and canisters are -1.8, 1.4, and 1.070, respectively.We have adopted these values to evaluate the effec-tiveness of sampling plans and neutron NDAmeasurements for verification of the reference reac-tor inventory (Sec. IV). They will be denoted by thegeneric symbol a~. We assume that the plutoniumisotopic composition is verified by gamma spec-troscopy.
To a large extent, data quality and successfuldata evaluation depend on adequate measurementcontrols and accurate knowledge of the instrumentparameters a, and an. The measurement precisionRSD (u,) for neutron counting of fuel plates,drawers, and storage canisters is expected to lie inthe 1-5% range, based on experience with similar in-strumentation, For counting times of -1 rein, theuncertainty owing to counting statistics is expectedto be - lYo, and the best current estimate of at, in-cluding counting and other random effects, is -2Y0.
The calibration error RSD (an) can be determinedby performing a one-point calibration’’-” for eachclass of items. Working standards, consisting of fuelplates or drawer and canister mockups, can be form-ed by random selection from the critical facility in-ventory. Fuel assay data are available from the
original fuel supplier to characterize these stan-dards. This calibration approach is well justified ifthe fuel supplier and the critical facility operatorreside in different states. In any case, the assay dataand the results of calibration measurements shouldbe cross checked with similar data obtained fromother fuel suppliers and critical facilities.
The true value of amfor a one-point calibration ofa particular class of items is the RSD of the averageresponse (counts/s) that would be measured for thatclass. It is given by
[(: 2 +~02 )11/2
‘O=qUMpc ? (6)
where q is the number of mockup calibration stan-dards and p is the number of replicate measure-ments made on each standard. A modest calibrationmight include p = 3 replicate measurements oneach of q = 5 standards, which corresponds to Cq =0.8% for fuel drawers having u~ = 1.4%. H a moreintensive calibration is performed, say, 5 replicatemeasurements on each of 10 standards, aq would be-0.5%. We adopt the more conservative 0.8% value.Similar values apply to f~el plates and storagecanisters.
To calibrate an NDA instrument for a particularclass of items, the calibration data are evaluated asfollows. Let r,, be the jth response (counts/s)measured for the ith standard. Then the averageresponse for p replicate measurements made on qstandards is
where
~firij.r.=—1
j=l
(7)
22

The sample variance of the calibration measure-ments is given by
The quantity
is the desired estimate of am,Note that an estimateof a, is obtained by making many replicate measure-ments on a single calibration standard, whereas anestimate of the quantity (ad + ~) is obtained bymeasuring many different standards.
The average response F [Eq. (7)] measured for aset of calibration standards representing a par-ticular class of items is an estimate of the responsethat would be measured for an item containing thenominal amount (~) of SNM. This estimate will beacceptable (unbiased) if the standards are trulyrepresentative of the class. For an unknown item
selected at random from the class, the measuredamount of SNM is given by
m = p(r/F) , (9)
where r is the response measured for the unknown.Thus, Eq. (9) is the one-point calibration equationfor the class. One calibration standard for each classshould be saved, preferably under seal at thefacility, for periodic checking of the instrumentresponse and calibration.
9. Data Evaluation. Several useful techniquesare described in App. D and the references thereinfor the evaluation of sample data. The samplemeasurements are examined for evidence of diver-sion in removals of various sizes. For example, adrawer having - 10% or more of the fuel removedshould be detectable on a go-no-go (attributes)basis, because the 4-u detection limit estimated forneutron NDA drawer measurements is - 10%. Theprobability of detecting a significant-quantitydiversion in such large removals is determined bythe sample size.
Statistical testing of the sample data (variablesanalysis) is required to detect a significant-quantitydiversion in removals <10% of the drawer contents.We divide this region into two subregions: thoseremovals that are <1O”A of the drawer contents butnot less than the smallest increment of fuel plate (1
in. of plate in the model facility), and thoseremovals that are <1 in. of plate (the bias region).
Note that 1 in. is the smallest increment of fuelplate that can be removed even though there are nol-in. plates in the model facility’s inventory. This isbecause an 8-in. plate could be replaced by a 7-in.plate, and so forth. Real facility inventories couldcontain 1-in. plates as well.
It is very important to extend the effectiveness ofthe sampling plan over the entire range of possibleremovals from whole-drawer contents down to thesmallest fuel increment. Diversion strategies thatinclude removing amounts less than the smallestfuel increment would be very difficult to implement,even for a facility operator. One might attempt tofalsify (bias) the fuel manufacturer’s assay data orremove the metal jackets and shave fuel from manyfuel-plate cores. However, no such strategy fordiverting a significant quantity is judged to becredible.
The desired overall balanced effectiveness of thesampling plan and the related verification measure-ments is illustrated in Fig. 10. The integral reac-tivity technique, shown for comparison, is uniform-ly effective against the same total diversion inremovals of any size. (It is not, however, uniformlysensitive to every location from which fuel may beremoved.) Note that a single 4-in. plate is -1OYO ofthe contents of a two-row drawer. The range of par-ticular interest, therefore, is removals of 1-4 in. offuel plate.
Autoradiography is effective in this region (atleast for plutonium-bearing fuel plates), but itshould be combined with other NDA techniques foradequate verification. Neutron NDA is not uniform-ly effective because its sensitivity is intrinsicallyproportional to the total amount of containedmaterial. Thus, those techniques for measurementand data evaluation that improve the detection sen-sitivity to 1- to 4-in. removals are most important.
One promising measurement technique (App. A,Part II) is to incrementally scan the neutron and
23

1.0
E~
EzoE 0.10n!lJ
ozwKt-Z2~ 0.03a
0.0
---- --
co$~swuw0
sd
----- ---
3ggilla
-1
szw------ -.
coaG
----- -.
----- --r2 ROWDRAWER
--- 4 In.PLATE
------ --- r I in.PLATE
------d.--~~pn
(p-mi)j2yum, (step 1)
where I.Iis the nominal drawer contents for a par-ticular class and am is the RSD of a single measure-ment, make p replicate measurements and test theaverage of these measurements (fiiJ to see if
(P -iili)>3p u___ (step 2)
This 3-u limit corresponds to a false alarm rate of-1 in 1000. The value of a= [not to be confused withthe RSD of the mean of a set of sample measure-ments given in Eq. (5)] is given by
(* 1/2
ufi=W+o 2
)P~M+ On”
(lo)
For example, if five replicate measurements areDRAWER
Fig. 10.Regions of sampling-plan sensitivity thutcorrespond to removing various amounts ofplutonium from a fuel drawer are comparedwith the uniform sensitivity of integral reac-tivity measurements.
gamma-ray signatures of plutonium fuel plates inreactor drawers. This technique could reduce the at-tributes limit to -1 in. of plate. Two data-testingprocedures have been identified (Sec. IV and App.D) that are particularly effective against removais ofsmall fuel increments. They are based on a modifiedtest for detecting measurement outliers and the X’test for detecting shifta in variance.
The outliers (OL) test is applied in three steps.(1) Search for drawer measurements that deviate
more than 2 a from the nominal value (that is, a dif-ference of -5%, if u~ = 1.4Y0, u, = 2Y0, and ISV=
0.8%). This is a low level of significance because -1in every 40 drawer measurements on the averagewill exceed this 2-rJ limit, even when there is nodiversion.
(2) For each 2-a outlier, make replicate measure-ments on the drawer and test the mean of thesemeasurements at the 3-IJ level of significance; thatis, if the ith drawer measurement (mJ satisfies
made, the 3-u= limit is ‘5.5~0 or -1 in, of platefrom a one-row drawer and -2 in, of plate from atwo-row drawer.
(3) The likelihood that a drawer with no fuel miss-ing will exceed the limits in steps 1 and 2 is -1 in1000. If a drawer exceeds both limits, the individualfuel plates are measured by NDA to see if a small in-crement of fuel is missing. The detection limit forNDA plate measurements is estimated to be -1 in.of plate.
Use of the x’ test is based on the observation thatrandom removals of small fuel increments will in-crease the variability in the drawer contents. Thismay be signaled by a significant shift (increase) inthe value of u~. The x’ test examines the samplemeasurements for such shifts. The test statistic is
C = (n-1) s~/[ (u: + U:)FI , (11)
where n is the sample size, s: is the sample
variance, and aM, a,, and # denote nominal values.Warning and action limits, say, at the 2,5 and 0,1%levels of significance (false alarm probabilities), canbe determined for any sample size using standardtables of the x’ distribution function. The testshould be sensitive if the variability in drawer con-tents becomes z 1.5 ~M.
The OL and x’ tests require accurate estimates forthe parameters a&f,a,, and an. (The sample mean is
24
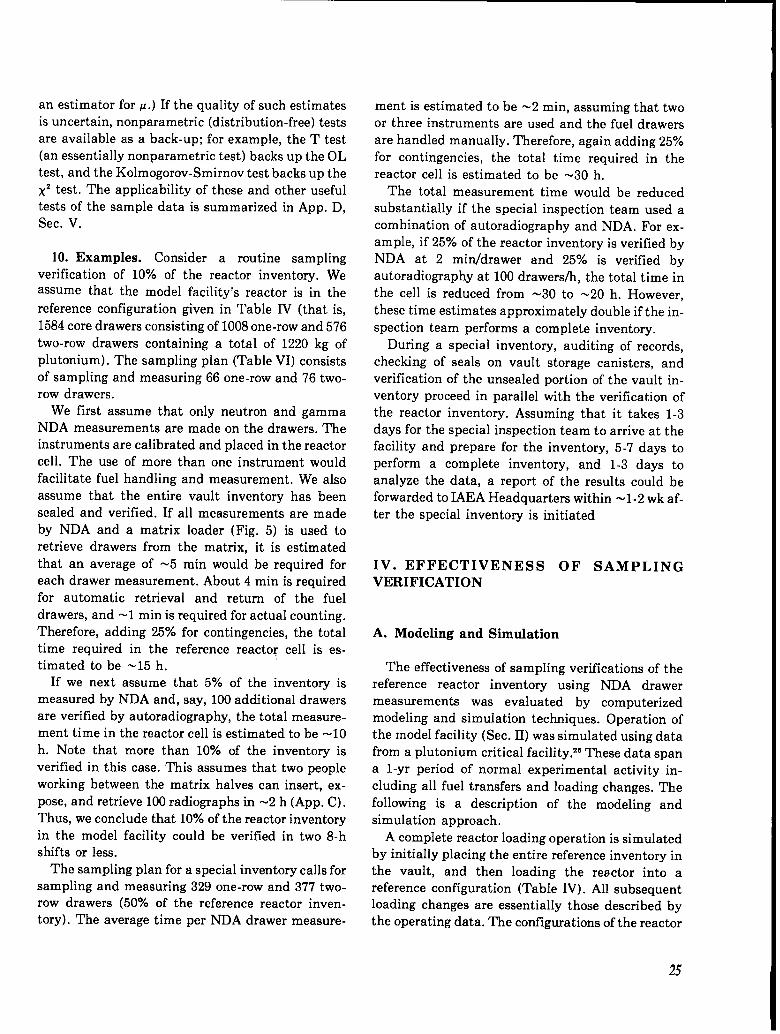
an estimator for ~.) If the quality of such estimatesis uncertain, nonparametric (distribution-free) testsare available as a back-up; for example, the T test(an essentially nonparametric test) backs up the OLtest, and the Kolmogorov-Smirnov test backs up theX2 test. The applicability of these and other usefultests of the sample data is summarized in App. D,Sec. V.
10. Examples. Consider a routine samplingverification of 10% of the reactor inventory. Weassume that the model facility’s reactor is in the
reference configuration given in Table IV (that is,1584 core drawers consisting of 1008 one-row and 576
two-row drawers containing a total of 1220 kg ofplutonium). The sampling plan (Table VI) consistsof sampling and measuring 66 one-row and 76 two-row drawers.
We first assume that only neutron and gammaNDA measurements are made on the drawers. Theinstruments are calibrated and placed in the reactorcell. The use of more than one instrument wouldfacilitate fuel handling and measurement. We alsoassume that the entire vault inventory has beensealed and verified. If all measurements are madeby NDA and a matrix loader (Fig. 5) is used toretrieve drawers from the matrix, it is estimatedthat an average of -5 min would be required foreach drawer measurement. About 4 min is requiredfor automatic retrieval and return of the fueldrawers, and -1 minis required for actual counting.Therefore, adding 25% for contingencies, the totaltime required in the reference reactor cell is es-timated to be -15 h.
If we next assume that 5~o of the inventory ismeasured by NDA and, say, 100 additional drawersare verified by autoradiography, the total measure-ment time in the reactor cell is estimated to be -10h. Note that more than 10% of the inventory isverified in this case. This assumes that two peopleworking between the matrix halves can insert, ex-pose, and retrieve 100 radiographs in -2 h (App. C).Thus, we conclude that 10% of the reactor inventoryin the model facility could be verified in two 8-hshifts or less.
The sampling plan for a special inventory calls forsampling and measuring 329 one-row and 377 two-row drawers (so”/o of the reference reactor inven-tory). The average time per NDA drawer measure-
ment is estimated to be -2 rein, assuming that twoor three instruments are used and the fuel drawersare handled manually. Therefore, again adding 25°4for contingencies, the total time required in thereactor cell is estimated to be -30 h.
The total measurement time would be reducedsubstantially if the special inspection team used acombination of autoradiography and NDA. For ex-ample, if 25Y. of the reactor inventory is verified byNDA at 2 rein/drawer and 25% is verified byautoradiography at 100 drawers/h, the total time inthe cell is reduced from -30 to -20 h. However,these time estimates approximately double if the in-
spection team performs a complete inventory.During a special inventory, auditing of records,
checking of seals on vault storage canisters, andverification of the unsealed portion of the vault in-ventory proceed in parallel with the verification ofthe reactor inventory. Assuming that it takes 1-3days for the special inspection team to arrive at thefacility and prepare for the inventory, 5-7 days to
perform a complete inventory, and 1-3 days toanalyze the data, a report of the results could beforwarded to IAEA Headquarters within -1-2 wk af-ter the special inventory is initiated
IV. EFFECTIVENESS OF SAMPLINGVERIFICATION
A. Modeling and Simulation
The effectiveness of sampling verifications of thereference reactor inventory using NDA drawermeasurements was evaluated by computerizedmodeling and simulation techniques. Operation ofthe model facility (Sec. II) was simulated using datafrom a plutonium critical facility.” These data spana l-yr period of normal experimental activity in-cluding all fuel transfers and loading changes. Thefollowing is a description of the modeling andsimulation approach.
A complete reactor loading operation is simulatedby initially placing the entire reference inventory inthe vault, and then loading the reactor into areference configuration (Table IV). All subsequentloading changes are essentially those described bythe operating data. The configurations of the reactor
25

and the storage vault are tabulated after eachloading change. Separate classes of reactor drawersare maintained for each plutonium-fuel type andfuel-drawer loading. The reference reactor inventoryvaries between 1200 and 1600 kg of plutonium dur-ing the year of simulated operation.
Figure 11 shows cross sections of the initialreference cotilguration (upper) and of the reactor
configuration 6 months after the initial referenceloading (lower). Each blue box containing a “1”denotes a one-row drawer (0.565 kg Pu), whereaseach red box containing a “2” denotes a two-rowdrawer (1.13 kg Pu). The inventory in the initialconfiguration is -1200 kg of plutonium contained in-1600 fuel drawers. Six months later, plutonium-bearing drawers have been inserted into the blanket
(a)
(b)
Fig. 11.Cross sections of the reference reactor: (a) initiul reference configuration; (b) configurationafter 6 months of operation.
26

region of the matrix during a series of experiments
designed to mock up plutonium breeding in theblanket material. At this time the reactor inventoryis -1600 kg of plutonium contained in -2200 fueldrawers. By the end of 1 yr of experiments, the reac-tor loading is very close to the initial reference con-figuration.
Computer-generated graphic displays like Fig. 11were used to track the reactor loading changes andto monitor the progress of the simulation runs. Ap-proximately 8000 fuel drawers were inserted into thereactor during the year.
B. Simulation Cases
Sampling plans that have been simulated rangefrom routine monthly sampling of 5% of the reactorinventory to special verification sampling of 50% ofthe inventory. All drawer measurements areassumed to be made by passive neutron NDAtechniques. The NDA measurements are simulatedusing the measurement model (Sec. IIf. C.8 andApp. D) with the following model parameters:
CM = 1.4% (“”Pu drawer-content RSD),
Isc = 2% (measurement-precision RSD),
and
u“ = 0.8% (calibration-error RSD) .
Therefore, the RSD of a single drawer measurementis 2.6°A and the attribute limit is -lOOA. Thesevalues are all judged to be reasonable estimates;however, operational testing and evaluation of ac-tual NDA instruments, developed and optimized forthis specific application, are required to verify theexpected performance.
Sample data are evaluated using the statisticaltests described in Sec. 111.C.9 and App. D.Specifically, the OL test, the x’ test, and the test ofthe mean (test for bias) are applied in every case. Inapplying the OL test, five replicate measurementsare made on each 2-a outlier, and the test is con-strained to satisfy the detection limit of 1 in. of plateestimated for NDA plate measurements; that is, ifthe OL test flags a drawer as a significant outlier(steps 1 and 2) and the drawer is missing 1 in. of fuel
plate, the probability of detecting this missing inch
of plate by measuring each fuel plate (step 3) istaken to be 50’%.. The X2 test is applied to drawer-class samples of size >20 to insure uniform applica-tion of the test and uniform interpretation of thetest results. The test of the mean is applied by sum-ming the partial inventory differences measured foreach drawer class, and then testing the significanceof the overall measured shift in the inventory. Boththe x’ test and the test of the mean are applied toeach routine inventory sample and to sequences ofconsecutive inventory samples. Sequences of sam-ples are tested because the inspector does not knowwhen a protracted series of diversions may begin.
Each test is applied at two levels of significance(that is, false alarm probability): a warning limitnear the 2% (one-sided) level and an alarm limitnear the O.l% level. The OL test has one additionallevel of significance corresponding to the I -in. detec-tion limit assumed for plate measurements. Theoverall rate of false indications of diversion forroutine 10% sampling, verified by numerous simula-tion runs, is <1 in 100 inventory periods; that is, afalse alarm is expected about once in 10 yr forroutine monthly verification sampling. A warninglimit is exceeded more frequently, averaging abouttwo per year. The false alarm rate encountered inpractice depends on strict measurement controlsand procedures. In this sense, the quoted false alarmrate may be difficult to maintain in practice.However, the measurement techniques and dataevaluation procedures indicate what type of diver-sion may be occurring, such as the removal of whole-drawer quantities or the replacement of individualplates by dummy plates. Based on this information,the inspector can search for unmistakable evidenceof a particular type of diversion, if such diversion isindicated.
C. Selected Results
1. Single Samples. Table VII shows theprobability of detecting that 8 kg of plutonium ismissing from the reference reactor inventory by 10,30, and 50% samples. Results are given for fourstrategies of removing the material to achieve thesame 8-kg diversion goal: (1) whole-drawer removalstotaling 4 kg from one-row and 4 kg from two-rowdrawers; (2) removals of 107. of drawer contents
27
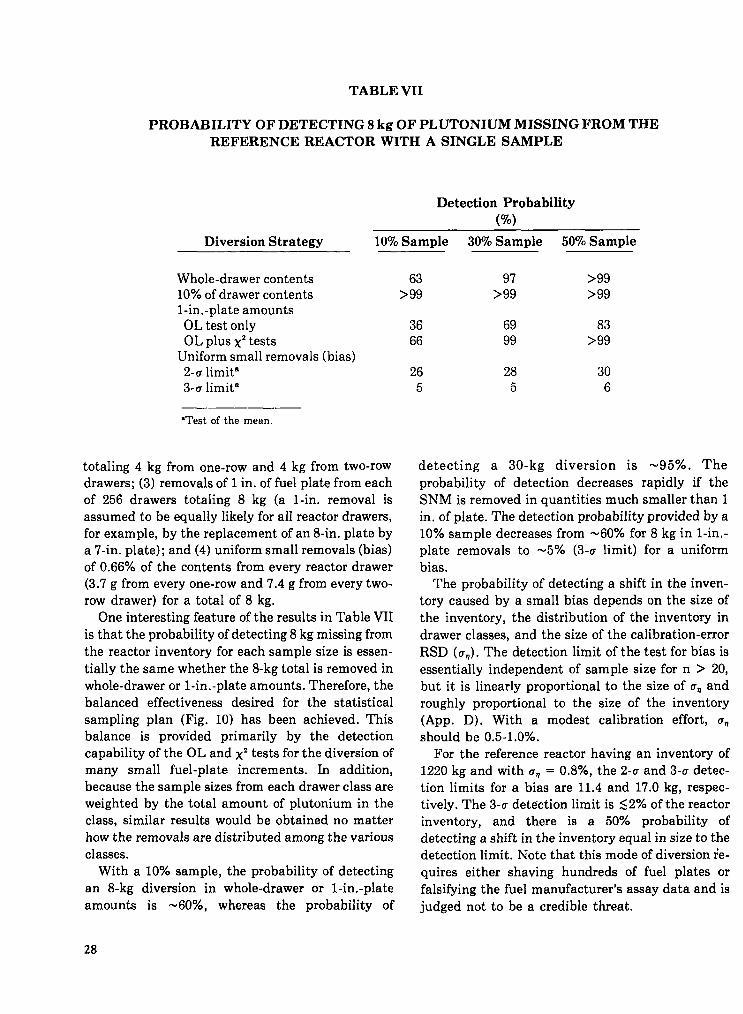
TABLE VII
PROBABILITY OF DETECTING 8 kg OF PLUTONIUM MISSING FROM THEREFERENCE REACTOR WITH A SINGLE SAMPLE
Detection Probability(%)
Diversion Strategy
Whole-drawer contents10% of drawer contentsI-in. -plate amountsOL test onlyOL plus x’ tests
Uniform small removals (bias)2-IJlimit’3-u limit’————‘Test of the mean.
totaling 4 kg from one-row and 4 kg from two-rowdrawers; (3) removals of 1 in. of fuel plate from eachof 256 drawers totaling 8 kg (a 1-in. removal isassumed to be equally likely for all reactor drawers,for example, by the replacement of an 8-in. plate bya 7-in. plate); and (4) uniform small removals (bias)of 0.66% of the contents from every reactor drawer(3.7 g from every one-row and 7.4 g from every two-row drawer) for a total of 8 kg.
One interesting feature of the results in Table VIIis that the probability of detecting 8 kg missing fromthe reactor inventory for each sample size is essen-tially the same whether the 8-kg total is removed inwhole-drawer or 1-in. -plate amounts. Therefore, thebalanced effectiveness desired for the statisticalsampling plan (Fig. 10) has been achieved. Thisbalance is provided primarily by the detectioncapability of the OL and X2tests for the diversion ofmany small fuel-plate increments. In addition,because the sample sizes from each drawer class areweighted by the total amount of plutonium in theclass, similar results would be obtained no matterhow the removals are distributed among the variousclasses.
With a 10% sample, the probability of detectingan 8-kg diversion in whole-drawer or 1-in. -plateamounts is -60%, whereas the probability of
109’0Sample 3070Sample 5070Sample
63 97 >99>99 >99 >99
36 69 8366 99 >99
26 28 305 5 6
detecting a 30-kg diversion is -95%. Theprobability of detection decreases rapidly if theSNM is removed in quantities much smaller than 1in. of plate. The detection probability provided by a10% sample decreases from -60Y0 for 8 kg in l-in, -plate removals to -570 (3-a limit) for a uniformbias.
The probability of detecting a shift in the inven-tory caused by a small bias depends on the size ofthe inventory, the distribution of the inventory indrawer classes, and the size of the calibration-error
RSD (an). The detection limit of the test for bias isessentially independent of sample size for n > 20,but it is linearly proportional to the size of a, androughly proportional to the size of the inventory(App. D). With a modest calibration effort, a,should be 0.5-1 .OYO.
For the reference reactor having an inventory of1220 kg and with cr, = 0.8Y0, the 2-u and 3-u detec-tion limits for a bias are 11.4 and 17.0 kg, respec-tively. The 3-u detection limit is 527. of the reactorinventory, and there is a 50% probability ofdetecting a shift in the inventory equal in size to thedetection limit. Note that this mode of diversion ie-quires either shaving hundreds of fuel plates orfalsi~ing the fuel manufacturer’s assay data and isjudged not to be a credible threat.
28

2. Sequence of Samples. Figure 12 shows the in-crease in the probability of detecting the diversionof 8 kg of plutonium, initially missing from thereference reactor inventory, during a series ofmonthly 10% samples. The detection probability isgiven for two diversion strategies: 8 kg removed inwhole-drawer amounts and 8 kg removed in l-in. -plate amounts. The Xztest and the test for bias havebeen applied to each sample separately and to con-secutive sequences of the samples in combination.For this reason, the detection probability increasesmore rapidly for l-in. -plate removals than forwhole-drawer removals.
After 6 months, the probability is at least 99% fordetecting either diversion strategy. This exceeds theguideline of detecting 8 kg missing in 6 months withat least 95% probability. After 3 months, theprobability is ’95% for both diversion strategies,which is about the performance obtained in 6months with bimonthly sampling of 10% of the in-ventory.
3. Optimal Diversion Strategy. It must beassumed that any group intending to divert SNMfrom a critical facility is knowledgeable about the
safeguards procedures. This knowledge is adeterrent., but it may also be used to advantage bythe diverters. It is shown in Ref. 24 that, if the ~etec-tion probability is the same for diverting equalamounts in large or small removals, the optimumdiversion strategy against the combined attributes-
)
c +>o “=
1.0
0.8
0.6
0.4
0.2
0.0123456
No. of Inventory Periods
(a)
variables sampling plan is to divert half the diver-sion goal in a few whole-item removals and half inmany small removals. This is approximately true fordiversion from the reference reactor inventory.Therefore, considering only routine samplingverification, a strategy of diverting 8 kg by removing4 kg in whole-drawer amounts and 4 kg in 1-in. -plateamounts is nearly optimal for the divertor, if thevery difficult scenario of diverting material inremovals much smaller than 1 in. of plate (that is,by a bias) is neglected.
To be successful, the diversion strategy also mustbe optimized to defeat the containment/surveillancemeasures and the optimum rate for removing thematerial covertly must be selected. The IAEA iden-tifies two broad categories of diversion referred to asabrupt and protracted. For protracted diversion, weassume that the divertor will want to avoid detec-tion by using the normal flows of material to maskhis repeated diversion attempts and that he mustexpend considerable time and effort in subvertingthe containment/surveillance measures to removethe material from the facility.
Therefore, we have simulated a strategy ofprotracted diversion of 8 kg of plutonium over 6months by taking 4 kg in random whole-drawerremovals and 4 kg in random 1-in. -plate removals.At the beginning of the simulation, no material ismissing from the reactor inventory. Based on theoverall diversion goal, probabilities are assigned fordiverting either the entire contents or 1 in. of plate
co.—
+c1
a)
%a
.>.-—.—
1.0
0.8
0.6
0.4
0.2
0.0
Fig. 1L.
I123456
No. of Inventory Periods
(b)
70
The increase in detection probability provided by a series of monthly 10% samples of thereference reactor; 8 kg of plutonium are missing (a) in whole-drawer amounts and (b) in 1-in. -plate amounts.
29
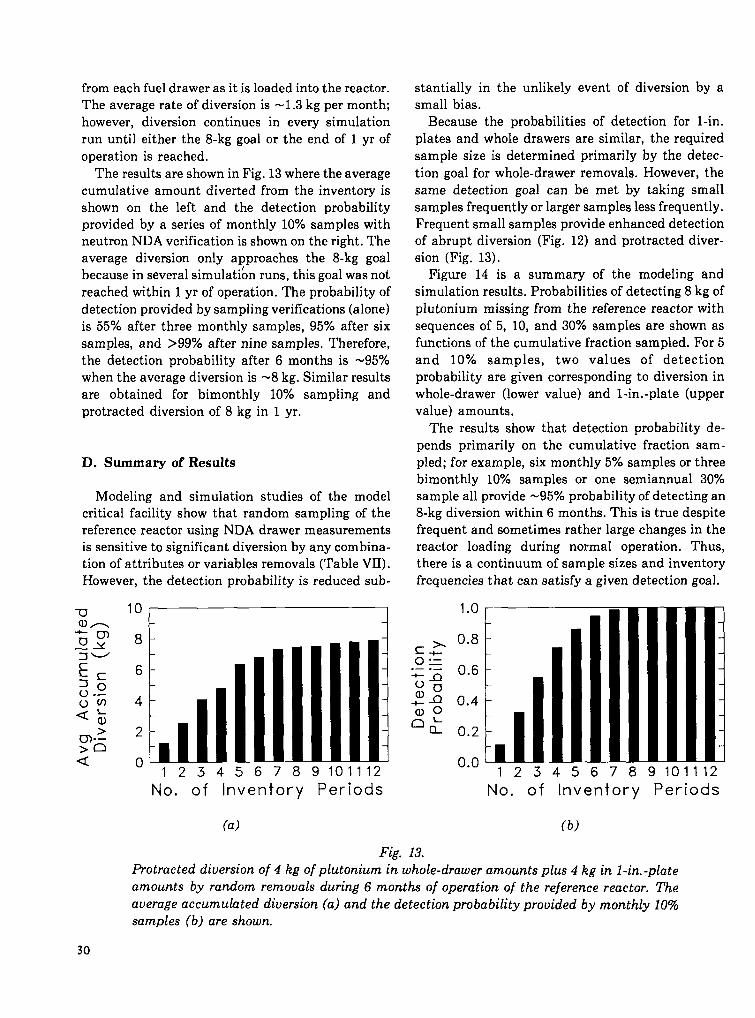
from each fuel drawer as it is loaded into the reactor.The average rate of diversion is -1.3 kg per month;however, diversion continues in every simulationrun until either the 8-kg goal or the end of 1 yr of
operation is reached.The results are shown in Fig. 13 where the average
cumulative amount diverted from the inventory isshown on the left and the detection probabilityprovided by a series of monthly 10% samples withneutron NDA verification is shown on the right. Theaverage diversion only approaches the 8-kg goalbecause in several simulation runs, this goal was notreached within 1 yr of operation. The probability ofdetection provided by sampling verifications (alone)is 55% after three monthly samples, 95~0 after sixsamples, and >99Y0 after nine samples. Therefore,the detection probability after 6 months is ‘95~0when the average diversion is -8 kg. Similar resultsare obtained for bimonthly 10% sampling andprotracted diversion of 8 kg in 1 yr.
D. Summary of Results
Modeling and simulation studies of the modelcritical facility show that random sampling of thereference reactor using NDA drawer measurementsis sensitive to significant diversion by any combina-tion of attributes or variables removals (Table VII).However, the detection probability is reduced sub-
-wOn
<“123456789101112
No. of Inventory Periods
(a)
stantially in the unlikely event of diversion by asmall bias.
Because the probabilities of detection for l-in.plates and whole drawers are similar, the required
sample size is determined primarily by the detec-tion goal for whole-drawer removals. However, thesame detection goal can be met by taking smallsamples frequently or larger samples less frequently.Frequent small samples provide enhanced detectionof abrupt diversion (Fig. 12) and protracted diver-sion (Fig. 13).
Figure 14 is a summary of the modeling andsimulation results. Probabilities of detecting 8 kg ofplutonium missing from the reference reactor withsequences of 5, 10, and 30~0 samples are shown asfunctions of the cumulative fraction sampled. For 5and 10% samples, two values of detectionprobability are given corresponding to diversion inwhole-drawer (lower value) and l-in. -plate (uppervalue) amounts.
The results show that detection probability de-pends primarily on the cumulative fraction sam-pled; for example, six monthly 5% samples or threebimonthly 10% samples or one semiannual 30%sample all provide ‘95Y0 probability of detecting an8-kg diversion within 6 months. This is true despitefrequent and sometimes rather large changes in thereactor loading during normal operation. Thus,there is a continuum of sample sizes and inventoryfrequencies that can satisfy a given detection goal.
1.0, .
0.6
0.4 I -r
‘--1234567891011 12
No. of Inventory Periods
(b)
Fig. 13.Protracted diversion of 4 kg of plutonium in whole-drawer amounts plus 4 kg in I-in. -plate
amounts by random removals during 6 months of operation of the reference reactor. Theaverage accumulated diversion (a) and the detection probability provided by monthly 10%samples (b) are shown.
30
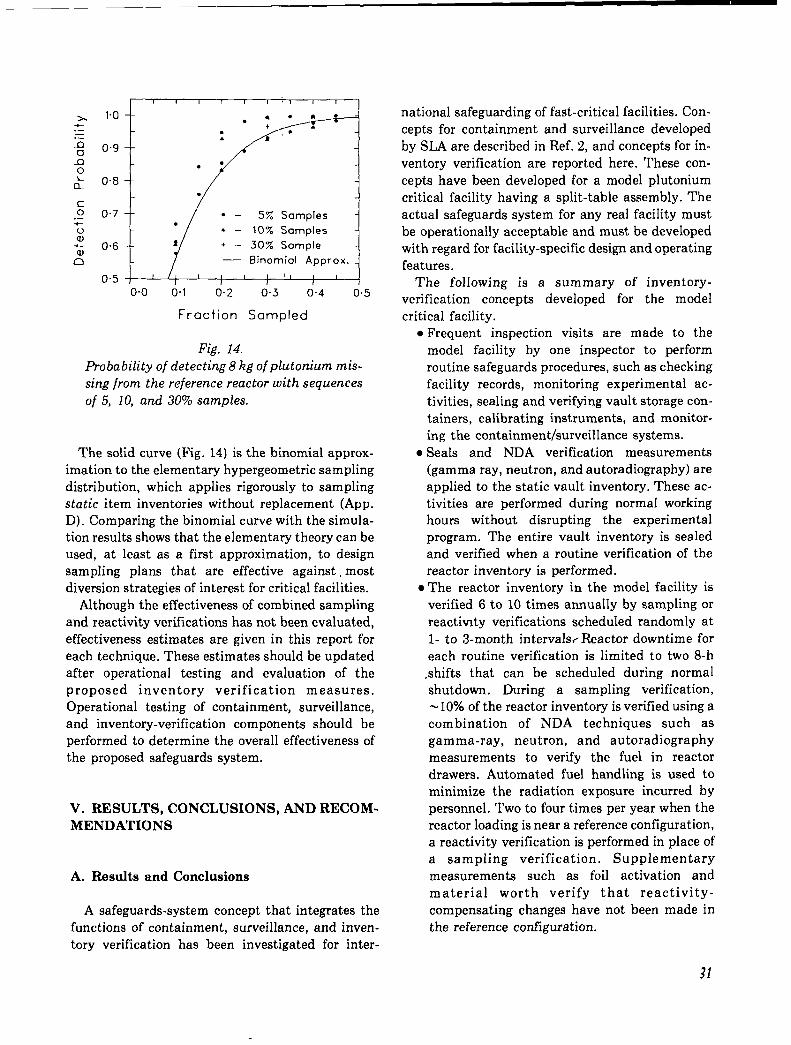
.--n0
-cl0k
1.0
0’9
0.8
0.7
0.6
0.5
I 1 , 1 r r , I I I
.ao.*
4+.
.
.
.
: + – 30% Sample
— Binomial Approx. _1 1
1 1
0.0 0.1 0.2 0,3 0-4 0.5
Fraction Sampled
Fig. 14.
Probability of detecting 8 kg of plutonium mis-sing from the reference reactor with sequencesof 5, 10, and 30% samples.
The solid curve (Fig. 14) is the binomial approx-imation to the elementary hypergeometric samplingdistribution, which applies rigorously to samplingstatic item inventories without replacement (App.D). Comparing the binomial curve with the simula-tion results shows that the elementary theory can beused, at least as a first approximation, to designsampling plans that are effective against. mostdiversion strategies of interest for critical facilities.
Although the effectiveness of combined samplingand reactivity verifications has not been evaluated,effectiveness estimates are given in this report foreach technique. These estimates should be updatedafter operational testing and evaluation of theproposed inventory verification measures.Operational testing of containment, surveillance,and inventory-verification components should beperformed to determine the overall effectiveness ofthe proposed safeguards system.
V. RESULTS, CONCLUSIONS, AND RECOM-MENDATIONS
A. Results and Conclusions
A safeguards-system concept that integrates thefunctions of containment, surveillance, and inven-tory verification has been investigated for inter-
national safeguarding of fast-critical facilities. Con-cepts for containment and surveillance developedby SLA are described in Ref. 2, and concepts for in-ventory verification are reported here. These con-cepts have been developed for a model plutoniumcritical facility having a split-table assembly. Theactual safeguards system for any real facility mustbe operationally acceptable and must be developedwith regard for facility-specific design and operatingfeatures.
The following is a summary of inventory-verification concepts developed for the modelcritical facility.
● Frequent inspection visits are made to the
model facility by one inspector to performroutine safeguards procedures, such as checkingfacility records, monitoring experimental ac-tivities, sealing and verifying vault storage con-tainers, calibrating instruments, and monitor-ing the containment/surveillance systems.
. Seals and NDA verification measurements(gamma ray, neutron, and autoradiography) are
applied to the static vault inventory. These ac-tivities are performed during normal workinghours without disrupting the experimentalprogram. The entire vault inventory is sealedand verified when a routine verification of thereactor inventory is performed.
. The reactor inventory in the model facility isverified 6 to 10 times annually by sampling orreactimty verifications scheduled randomly at
1- to 3-month intervals< Reactor downtime foreach routine verification is limited to two 8-hshifts that can be scheduled during normalshutdown. During a sampling verification,-1OYO of the reactor inventory is verified using acombination of NDA techniques such asgamma-ray, neutron, and autoradiographymeasurements to verify the fuel in reactordrawers. Automated fuel handling is used tominimize the radiation exposure incurred bypersonnel. Two to four times per year when thereactor loading is near a reference configuration,a reactivity verification is performed in place ofa sampling verification. Supplementarymeasurements such as foil activation andmaterial worth verify that reactivity-compensating changes have not been made inthe reference conllguration.
31
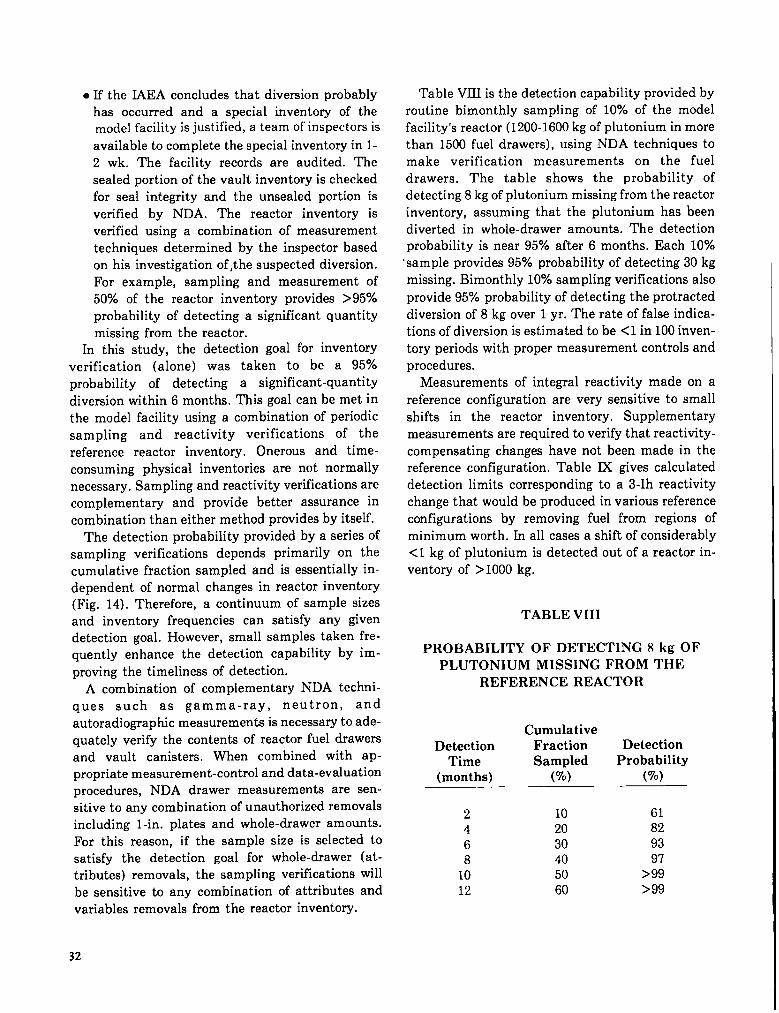
● If the IAEA concludes that diversion probablyhas occurred and a special inventory of themodel facility is justified, a team of inspectors is
available to complete the special inventory in 1-2 wk. The facility records are audited. Thesealed portion of the vault inventory is checkedfor seal integrity and the unsealed portion is
verified by NDA. The reactor inventory isverified using a combination of measurementtechniques determined by the inspector basedon his investigation of,the suspected diversion.For example, sampling and measurement of50% of the reactor inventory provides >95%probability of detecting a significant quantitymissing from the reactor.
In this study, the detection goal for inventoryverification (alone) was taken to be a 95~0probability of detecting a significant-quantity
diversion within 6 months. This goal can be met inthe model facility using a combination of periodicsampling and reactivity verifications of thereference reactor inventory. Onerous and time-consuming physical inventories are not normallynecessary. Sampling and reactivity veri.t3cations arecomplementary and provide better assurance incombination than either method provides by itself.
The detection probability provided by a series ofsampling verifications depends primarily on thecumulative fraction sampled and is essentially in-dependent of normal changes in reactor inventory(Fig. 14). Therefore, a continuum of sample sizesand inventory frequencies can satisfy any givendetection goal. However, small samples taken fre-quently enhance the detection capability by im-
proving the timeliness of detection.A combination of complementary NDA techni-
ques such as gamma-ray, neutron, andautoradiographic measurements is necessary to ade-
quately verify the contents of reactor fuel drawersand vault canisters. When combined with ap-propriate measurement-control and data-evaluationprocedures, NDA drawer measurements are sen-sitive to any combination of unauthorized removalsincluding l-in. plates and whole-drawer amounts.For this reason, if the sample size is selected tosatisfy the detection goal for whole-drawer (at-tributes) removals, the sampling verifications willbe sensitive to any combination of attributes andvariables removals from the reactor inventory.
Table VIII is the detection capability provided byroutine bimonthly sampling of 10% of the modelfacility’s reactor (1200-1600 kg of plutonium in morethan 1500 fuel drawers), using NDA techniques tomake verification measurements on the fueldrawers. The table shows the probability ofdetecting 8 kg of plutonium missing from the reactorinventory, assuming that the plutonium has beendiverted in whole-drawer amounts. The detectionprobability is near 95% after 6 months. Each 10%
osample provides 95% probability of detecting 30 kgmissing. Bimonthly 10% sampling verifications also
provide 95% probability of detecting the protracteddiversion of 8 kg over 1 yr. The rate of false indica-tions of diversion is estimated to be <1 in 100 inven-tory periods with proper measurement controls andprocedures.
Measurements of integral reactivity made on areference configuration are very sensitive to smallshifts in the reactor inventory. Supplementarymeasurements are required to verify that reactivity-compensating changes have not been made in thereference configuration. Table IX gives calculateddetection limits corresponding to a 3-Ih reactivitychange that would be produced in various referenceconfigurations by removing fuel from regions ofminimum worth. In all cases a shift of considerably<1 kg of plutonium is detected out of a reactor in-ventory of >1000 kg.
TABLE VIII
PROBABILITY OF DETECTING 8 kg OFPLUTONIUM MISSING FROM THE
REFERENCE REACTOR
DetectionTime
(months)
2468
1012
CumulativeFractionSampled
(%)
102030405060
DetectionProbability
(90)
61829397
>99>99
32
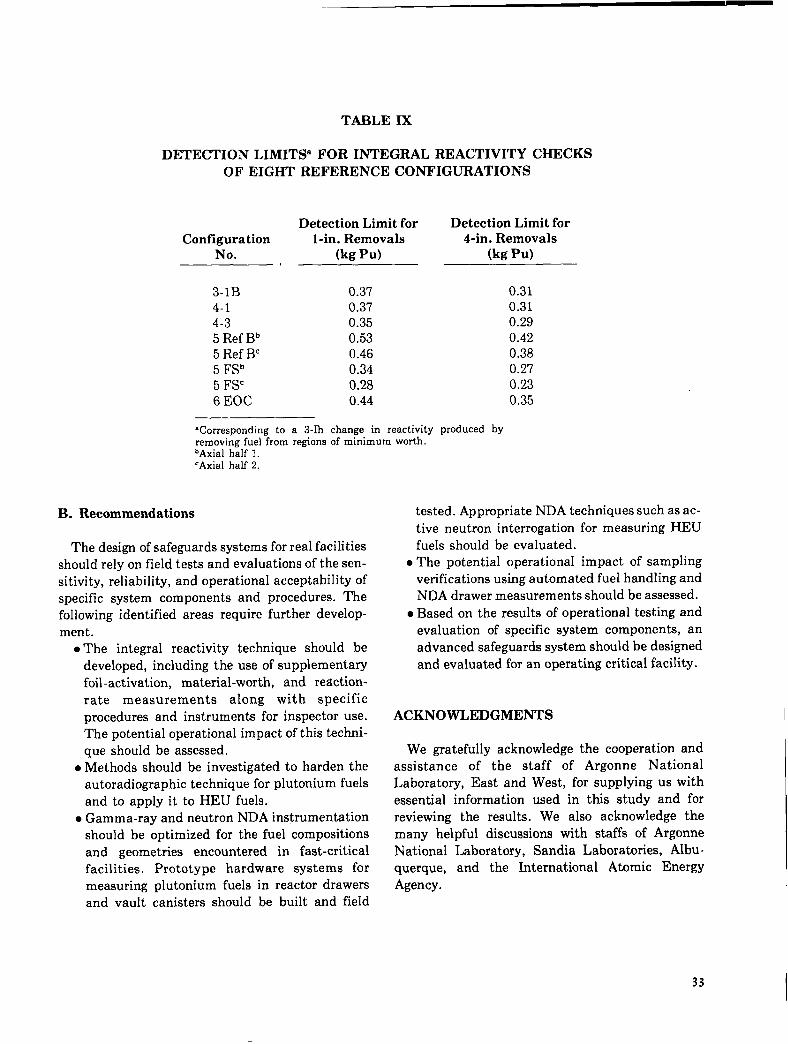
TABLE IX
DETECTION LIMITS’ FOR INTEGRAL REACTIVITY CHECKSOF EIGHT REFERENCE CONFIGURATIONS
B. Recommendations
Detection Limit forConfiguration l-in. Removals
No. (kg h)
3-lB4-14-35 Ref Bb5 Ref W5 FSb5 F%6 EOC
0.37
0.37
0.35
0.53
0.46
0.34
0.28
0.44
bAxial half 1.‘Axial half 2.
The design of safeguards systems for real facilitiesshould rely on field tests and evaluations of the sen-sitivity, reliability, and operational acceptability ofspecific system components and procedures. Thefollowing identified areas require further develop-ment.
● The integral reactivity technique should bedeveloped, including the use of supplementaryfoil-activation, material-worth, and reaction-rate measurements along with specificprocedures and instruments for inspector use.The potential operational impact of this techni-que should be assessed.
● Methods should be investigated to harden theautoradiographic technique for plutonium fuelsand to apply it to HEU fuels.
● Gamma-ray and neutron NDA instrumentationshould be optimized for the fuel compositionsand geometries encountered in fast-criticalfacilities. Prototype hardware systems formeasuring plutonium fuels in reactor drawersand vault canisters should be built and field
Detection Limit for4-in. Removals
(kg Pu)
0.310.310.290.420.380.270.230.35
produced by
tested. Appropriate NDA techniques such as ac-
‘Corresponding to a 3-Ih change in reactivityremoving fuel from regions of minimum worth.
tive neutron interrogation for measuring HEUfuels should be evaluated.
● The potential operational impact of samplingverifications using automated fuel handling andNDA drawer measurements should be assessed.
● Based on the results of operational testing andevaluation of specific system components, anadvanced safeguards system should be designedand evaluated for an operating critical facility.
ACKNOWLEDGMENTS
We gratefully acknowledge the cooperation andassistance of the staff of Argonne NationalLaboratory, East and West, for supplying us withessential information used in this study and forreviewing the results. We also acknowledge themany helpful discussions with staffs of ArgonneNational Laboratory, Sandia Laboratories, Albu-querque, and the International Atomic EnergyAgency.
33
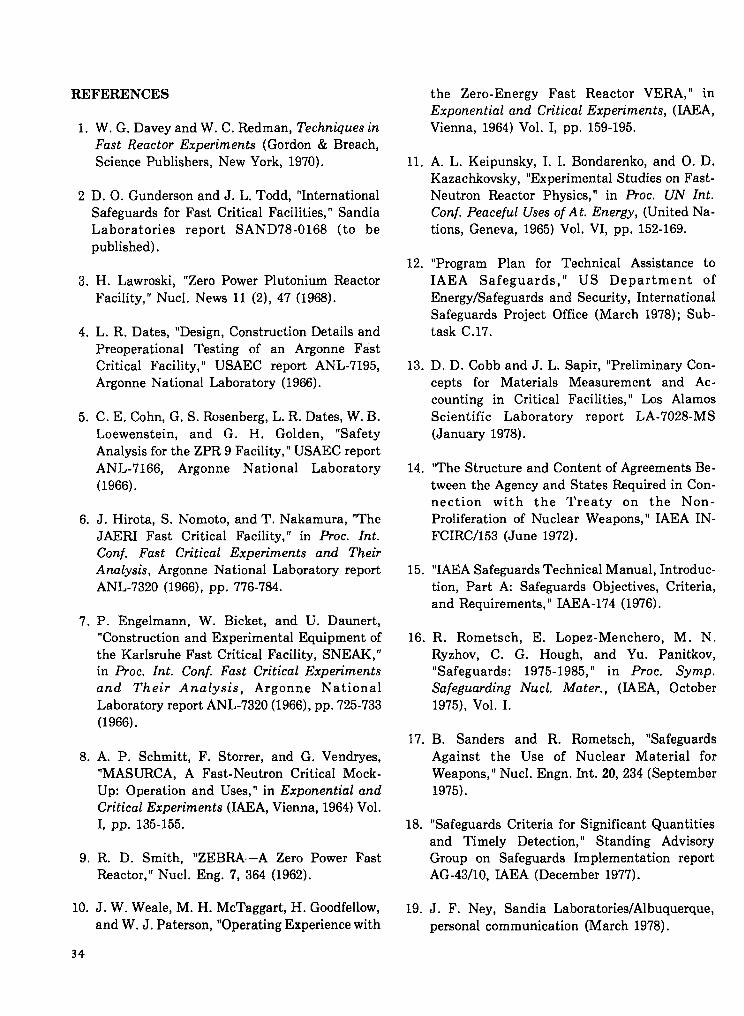
REFERENCES
1. W. G. Davey and W. C. Redman, Techniques inFast Reactor Experiments (Gordon & Breach,Science Publishers, New York, 1970).
2 D. O. Gunderson and J. L. Todd, “InternationalSafeguards for Fast Critical Facilities, ” SandiaLaboratories report SAND78-0168 (to bepublished).
3. H. Lawroski, “Zero Power Plutonium ReactorFacility, ” Nucl. News 11 (2), 47 (1968).
4. L. R. Dates, “Design, Construction Details andPreoperational Testing of an Argonne FastCritical Facility, ” USAEC report ANL-7195,Argonne National Laboratory (1966).
5. C. E. Cohn, G. S. Rosenberg, L. R. Dates, W. B.Loewenstein, and G. H. Golden, “SafetyAnalysis for the ZPR 9 Facility, ” USAEC report
ANL-7166, Argonne National Laboratory(1966).
6. J. Hirota, S. Nomoto, and T. Nakamura, “TheJAERI Fast Critical Facility, ” in Proc. Int.Conf. Fast Critical Experiments and TheirAnalysis, Argonne National Laboratory reportANL-7320 (1966), pp. 776-784.
7. P. Engelmann, W. Bicket, and U. Daunert,“Construction and Experimental Equipment ofthe Karlsruhe Fast Critical Facility, SNEAK, ”in Proc. Znt. Conf. Fast Critical Experimentsand Their Analysis, Argonne NationalLaboratory report ANL-7320 (1966), pp. 725-733(1966).
8. A. P. Schmitt, F. Storrer, and G. Vendryes,“MASURCA, A Fast-Neutron Critical Mock-Up: Operation and Uses, ” in Exponential andCritical Experiments (IAEA, Vienna, 1964) Vol.I, pp. 135-155.
9. R. D. Smith, “ZEBRA-A Zero Power FastReactor, ” Nucl. Eng. 7, 364 (1962).
10. J. W. Weale, M. H. McTaggart, H. Goodfellow,and W. J. Paterson, “Operating Experience with
the Zero-Energy Fast Reactor VERA, ” inExponential and Critical Experiments, (IAEA,Vienna, 1964) Vol. I, pp. 159-195.
11. A. L. Keipunsky, I. L Bondarenko, and O. D.Kazachkovsky, “Experimental Studies on Fast-Neutron Reactor Physics, ” in Proc. UN M.
Conf. Peaceful Uses of A t. Energy, (United Na-tions, Geneva, 1965) Vol. VI, pp. 152-169.
12. “Program Plan for Technical Assistance toIAEA Safeguards, ” US Department of
Energy/Safeguards and Security, InternationalSafeguards Project Office (March 1978); Sub-task C.17.
13. D. D. Cobb and J. L. Sapir, “Preliminary Con-cepts for Materials Measurement and Ac-counting in Critical Facilities, ” Los AlamosScientific Laboratory report LA-7028-MS(January 1978).
14. “The Structure and Content of Agreements Be-tween the Agency and States Required in Con-nection with the Treaty on the Non-Proliferation of Nuclear Weapons, ” IAEA IN-FCIRC/153 (June 1972).
15. “IAEA Safeguards Technical Manual, Introduc-tion, Part A: Safeguards Objectives, Criteria,and Requirements, ” IAEA-174 (1976).
16. R. Rometsch, E. Lopez-Menchero, M. N.
Ryzhov, C. G. Hough, and Yu. Panitkov,“Safeguards: 1975 -1985,” in Proc. Symp.Safeguarding NUCL Mater., (IAEA, October1975), Vol. I.
17. B. Sanders and R. Romeksch, “SafeguardsAgainst the Use of Nuclear Material forWeapons, ” Nucl. Engn. Int. 20, 234 (September1975).
18. “Safeguards Criteria for Significant Quantitiesand Timely Detection, ” Standing AdvisoryGroup on Safeguards Implementation reportAG-43/10, IAEA (December 1977).
19. J. F. Ney, Sandia Laboratories/Albuquerque,
personal communication (March 1978).
34

20. “Report Forms and Explanations for Their Use, ”Code 10, LAEA (September 30, 1976).
21. J. E. Imvett, Nuclear Materials Accountability,Management, Safeguards (American NuclearSociety, 1974).
22. J. L. Jaech, “Statistical Methods in NuclearMaterial Control, ” TID-26298, US GovernmentPrinting Office, Washington, DC (1973).
23. F. Brown, P. T. Good, J. B. Parker, A. E. Ross,and D. R. Terrey (UKAEA); A. Lumetti, E.Kerr, T. Otoms, and’ M. Sultan (IAEA),“progress in the Development of a System for
the Safeguards Inspection of the Fuel Store of aZero-Energy Test Reactor, ” Cos. 20, UK AtomicEnergy Authority (October 1970).
24. C. G. Hough, R. A. Schneider, K. B. Stewart, J.L. Jaech, and C. A. Bennett, “Example ofVerification and Acceptance of OperatorData—Low Enriched Uranium Fabrication, ”Battelle Pacific Northwest Laboratories reportBNWL-1852 (August 1974).
25. C. G. Hough and T. M. Beetle, “StatisticalMethods for the Planning of Inspections, ” inProc. Symp. Safeguarding NUCL Mater.,(IAEA, October 1975), Vol. I.
26. R. J. Forrester and H. A. McFarlane, ArgonneNational Laboratory-West, personal com-munication (March 1978).
35
—
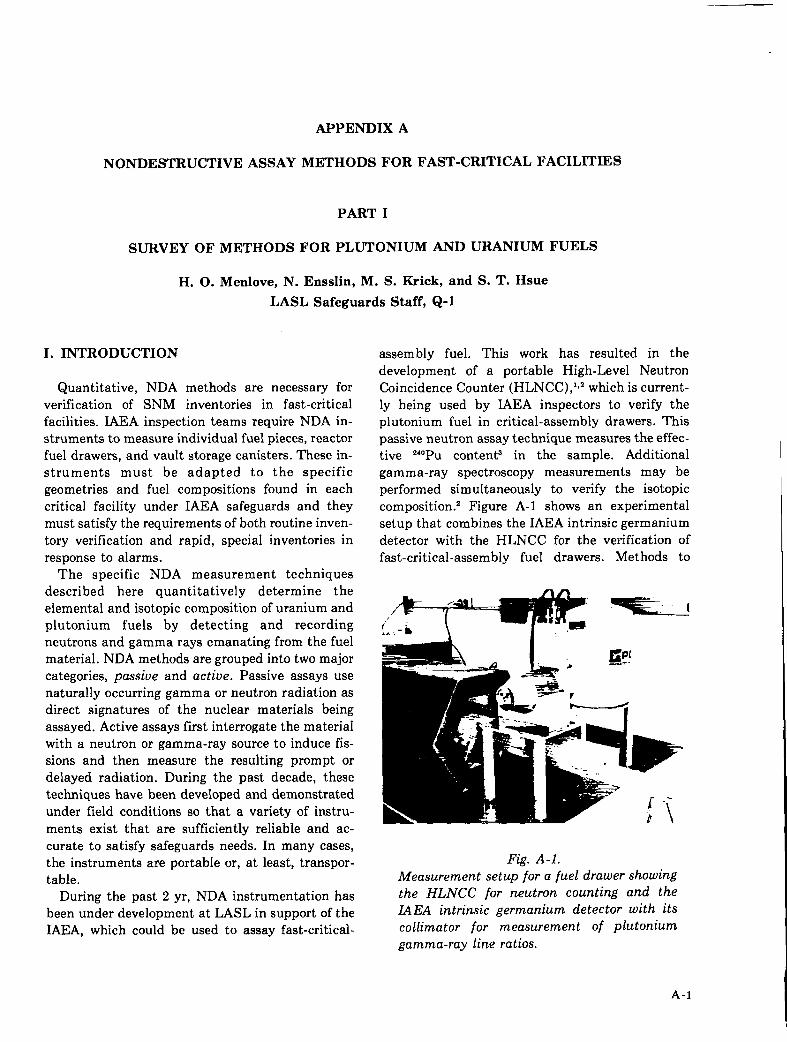
APPENDIX A
NONDESTRUCTIVE ASSAY METHODS FOR FAST-CRITICAL FACILITIES
SURVEY OF
H. O.
I. INTRODUCTION
Quantitative, NDAverification of SNM
PART I
METHODS FOR PLUTONIUM AND URANIUM FUELS
Menlove, N. Ensslin, M. S. Krick, and S. T. Hsue
LASL Safeguards Staff, Q-1
methods are necessary forinventories in fast-critical
facilities. IAEA inspection teams require NDA in-struments to measure individual fuel pieces, reactorfuel drawers, and vault storage canisters. These in-struments must be adapted to the specificgeometries and fuel compositions found in eachcritical facility under IAEA safeguards and theymust satisfy the requirements of both routine inven-tory verification and rapid, special inventories inresponse to alarms.
The specific NDA measurement techniquesdescribed here quantitatively determine theelemental and isotopic composition of uranium andplutonium fuels by detecting and recordingneutrons and gamma rays emanating from the fuelmaterial. NDA methods are grouped into two majorcategories, passive and active. Passive assays usenaturally occurring gamma or neutron radiation asdirect signatures of the nuclear materials beingassayed. Active assays first interrogate the materialwith a neutron or gamma-ray source to induce fis-sions and then measure the resulting prompt ordelayed radiation. During the past decade, thesetechniques have been developed and demonstratedunder tleld conditions so that a variety of instru-ments exist that are sufficiently reliable and ac-curate to satisfy safeguards needs. In many cases,the instruments are portable or, at least, transpor-table.
During the past 2 yr, NDA instrumentation hasbeen under development at LASL in support of theIAEA, which could be used to assay fast-critical-
assembly fuel. This work has resulted in thedevelopment of a portable High-Level NeutronCoincidence Counter (HLNCC) ,1” which is current-ly being used by MEA inspectors to verify theplutonium fuel in critical-assembly drawers. Thispassive neutron assay technique measures the effec-tive 24”Pu content’ in the sample. Additionalgamma-ray spectroscopy measurements may beperformed simultaneously to verify the isotopiccomposition.z Figure A-1 shows an experimentalsetup that combines the IAEA intrinsic germaniumdetector with the HLNCC for the verification offast-critical-assembly fuel drawers. Methods to
Fig. A-1.Measurement setup for a fuel drawer showingthe HLNCC for neutron counting and theL4EA intrinsic germanium detector with itscollimator for measurement of plutoniumgamma-ray line ratios.
A-I
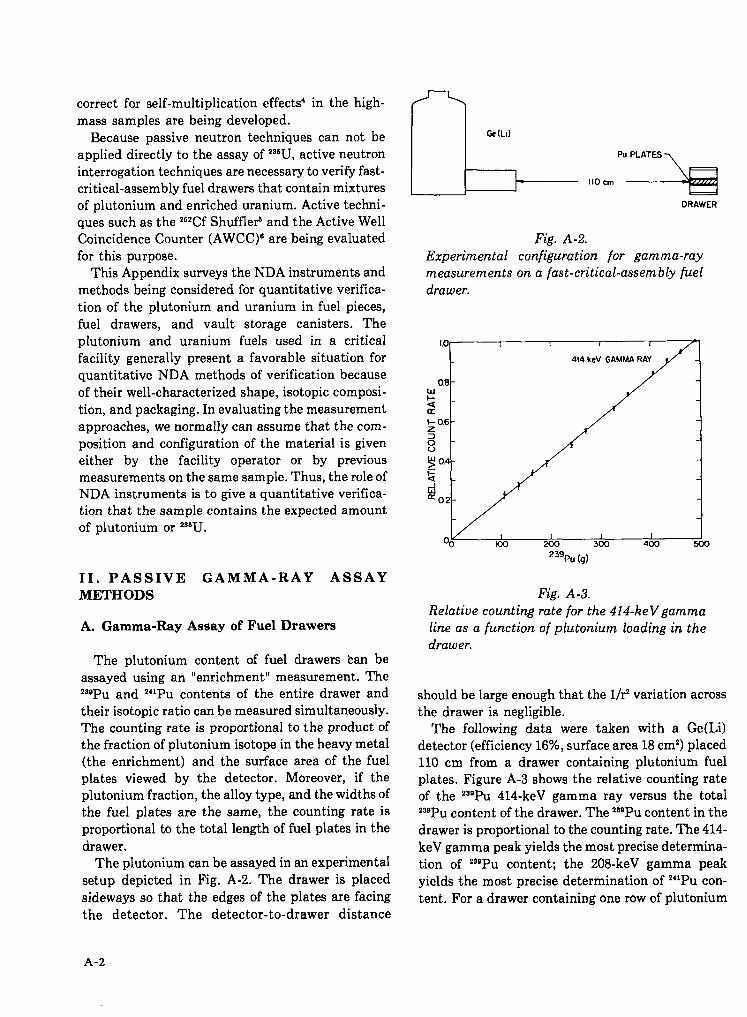
correct for self-multiplication effects’ in the high-mass samples are being developed.
Because passive neutron techniques can not be & ILI)
applied directly to the assay of ‘SW, active neutroninterrogation techniques are necessary to veri& fast-critical-assembly fuel drawers that contain mixtures =+- 0.’”>of plutonium and enriched uranium. Active techni- DRAWER
ques such as the 2s2CfShuffleP and the Active WellCoincidence Counter (AWCC)’ are being evaluated Fig. A-2.for this purpose. Experimental configuration for gamma-ray
This Appendix surveys the NDA instruments and measurements on a fast-critical-assembly fuelmethods being considered for quantitative verifica- drawer.tion of the plutonium and uranium in fuel pieces,fuel drawers, and vault storage canisters. Theplutonium and uranium fuels used in a criticalfacility generally present a favorable situation forquantitative NDA methods of verification becauseof their well-characterized shape, isotopic composi-tion, and packaging. In evaluating the measurementapproaches, we normally can assume that the comp-osition and configuration of the material is giveneither by the facility operator or by previousmeasurements on the same sample. Thus, the role ofNDA instruments is to give a quantitative verifica-tion that the sample contains the expected amountof plutonium or 29TJ.
II. PASSIVE GAMMA-RAY ASSAY
METHODS
A. Gamma-Ray Assay of Fuel Drawers
The plutonium content of fuel drawers tan beassayed using an “enrichment” measurement. ‘The2g9Puand 241Pu contents of the entire drawer and
their isotopic ratio can be measured simultaneously.The counting rate is proportional to the product ofthe fraction of plutonium isotope in the heavy metal
(the enrichment) and the surface area of the fuelplates viewed by the detector. Moreover, if theplutonium fraction, the alloy type, and the widths ofthe fuel plates are the same, the counting rate isproportional to the total length of fuel plates in thedrawer.
The plutonium can be assayed in an experimentalsetup depicted in Fig. A-2. The drawer is placedsideways so that the edges of the plates are facingthe detector. The detector-to-drawer distance
Lo
OB-w+<ab 0,6 -~
ou
~ 0.4 -
Gdao2 -
*39PU (g)
Fig. A-3.Relative counting rate for the 414-keVgammaline as a function of plutonium loading in thedrawer.
should be large enough that the l/F variation acrossthe drawer is negligible.
The following data were taken with a Ge(Li)detector (efficiency 16%, surface area 18 cm’) placed110 cm from a drawer containing plutonium fuelplates. Figure A-3 shows the relative counting rateof the 2g9Pu 414-keV gamma ray versus the total23’Pu content of the drawer. The 289Pucontent in thedrawer is proportional to the counting rate. The 414-keV gamma peak yields the most precise determina-tion of 2S’PU content; the 208-keV gamma peakyields the most precise determination of “lPu con-
tent. For a drawer containing one row of plutonium
A-2

plates, the precision at 1 u for a 200-s assay is 2.1%for 2“PU and 1.4% for 24’Pu; for a drawer containingtwo rows, the precision is 1.57. for 2“PU and 1.0% for241Pu.With some optimization of the detector sizeand detector-to-drawer distance, it should be possi-ble to reduce the assay time by a factor of 2 whilemaintaining these precision.
Several comments should be made concerningthis type of measurement. First, the counting rate isproportional to the product of the enrichment andthe total exposed area of the plate edges. If thedrawer contains fuel plates of different enrichments,the gamma emission rate alone cannot determinethe total length of the plutonium fuel plates.However, if the plutonium enrichment is the samefor all fuel plates in the drawer, the counting rate isproportional to the total length of the fuel plates.
Second, the 208-keV gamma ray arises not only from241Am decay. For equal241pu decay but also from
amounts of 241Pu and 241Am (14.35 yr after theseparation of americium), the americium decay con-tributes -3 .8% of the 208-keV gamma peak. Third,the plutonium mass fractions of the different fuelplates should be similar. If these assumptions aresatisfied and the 24’Am build-up is known, theplutonium content of the drawer can be measuredby gamma rays.
B. Gamma-Ray Assay of Storage Canisters
Plutonium fuel plates are stored in canisters orbirdcage containers. The plutonium content of thecanisters also may be assayed using the enrichmentmeasurement described for the fuel drawers. Thealuminum canister wall can be used to advantage inreducing the 60-keV 241Amgamma ray without sub-stantially attenuating the gamma rays fromplutonium. The counting time and the canister-to-detector distance can be reduced somewhat, com-pared with the assay of drawers.
With storage canisters, complications may arise ifportions of the side surfaces of the plates are alsoviewed by the detector. This increases the effectivesurface area and changes the counting rate.Nevertheless, the plutonium isotopic ratio of thematerial within the canister can still be measuredby gamma-ray assay.
C. Discussion
The plutonium fuel drawers and certain types ofstorage canisters can be assayed rapidly by gamma-ray measurements, The main advantage of thegamma-ray assay is that it uniquely identifies thefissile isotopes. Therefore, it can be used to deter-mine the isotopic ratios and, with proper calibra-tion, the isotopic content of the fuel containers. Theunique gamma signature of various plutoniumisotopes makes plate substitution difficult.However, the fuel plates are very dense and thegamma rays verify the enrichment of only the outersurface on the top edge of the plates. Investigationsare needed to determine the optimum assaygeometry and detector size for gamma-ray measure-ments of critical-facility fuels.
III. PASSIVE NEUTRON ASSAY METHODS
A. Introduction
Passive neutron verification of plutonium fuelplates can be performed by counting the total num-ber of neutrons emitted by the fuel or by countingthe neutrons emitted in coincidence by the spon-taneous fission of the even plutonium isotopes andby the induced fissions in plutonium or uranium.The total number of neutrons emitted by the fueldepends on the mass of the even isotopes ofplutonium (spontaneous fission neutrons), thechemical composition of the fuel [(a,n) reactionneutrons], and the total fissile mass and geometry ofthe fuel (neutron multiplication). On the otherhand, the neutron coincidence counting rate doesnot depend on chemical composition (except forsmall self-multiplication effects) or room neutronbackground fluctuations,
Measurements have been made withsimultaneous totals and coincidence counts ofplutonium fuel plates in a fuel drawer and in a vaultcanister to study the usefulness of passive neutroncounting for quantitative inventory verification.
A-3
B. Neutron Counters
Measurements were made in two thermal-neutroncoincidence counters, the Dual Range Counted(DRC) in its high-efficiency mode and the AWCC inits passive mode. These instruments consist of asample cavity surrounded by a polyethylene an-nulus to thermalize the neutrons from the sample.Several ‘He proportional counters are incorporatedin the polyethylene to detect the thermal neutrons.A polyethylene shield outside the detectors reducesthe neutron counting rate caused by room
background. The detector pulses are sent to a shift-register coincidence counting module,’ whichsimultaneously measures and records the totals andcoincidence counting rates.
The DRC was placed on its side for measurementof fuel drawers. The fuel canister does not fit insidethe sample cavity of the DRC and, therefore, it wasmeasured in the larger AWCC operated in thepassive mode. A coincidence counter designed forpermanent installation to assay plutonium fueldrawers would differ from the DRC used for the pre-sent measurements in three major ways. The samplecavity would be smaller in diameter and would belonger to provide a more uniform response along thelength of the drawer; the detector would be designedfor higher efficiency (30-40% compared to the pre-sent ‘u25~0); and the outer shielding would be in-creased to reduce room background.
C. Plutonium Fuel Plate Characteristics
Measurements were made with 15 plutonium fuelplates, 2.54-17.78 cm (l-7 in,) in length with 26-200g Pu. The isotopic composition was either 11.6% or8.7% 24’Pu. All fuel plates were Pu-U-MO alloy, 5 cm(2 in.) wide and 0.64 cm (1/4 in.) thick.
D. Counting Sensitivity
Individual plates with 11.6% 24”Pu were countedin the DRC. The totals counting rate, with a 64-Kscoincidence gate, was -290 cpslg ““Pu; the coin-cidence counting rate was -39 cps~g 240Pu.Therefore, a fuel drawer containing 1 kg ofplutonium at 11.6?4. 24’Pu will have a totals countingrate of -3.4 x 10’ cps and a coincidence counting
rate of -4.5 x 10³cps. For a 100-s measurement, thetotals count will be -3.4 x 10” and the coincidencecount will be -4.5 x 10s. The standard deviation,owing to counting statistics only, will be -0.05 and-0.9Y0 for the totals and coincidence counts, respec-tively.
E. Fuel Drawer Measurements
For a coincidence counter with 40% efficiency, thetotals counting rate would be -460 cpslg 24’Pu andthe coincidence counting rate would be -100 cpslg24’Pu. If the plutonium loading is assumed to be 12
glcm, a fuel drawer with two 46-cm rows of plateswould contain 1104 g Pu. At 11.6% 24’Pu, the Z’”Pucontent would be 128 g. The totals and coincidencecounts for a 100-s measurement would be -5.9 x 10°and -1.3 x 10’, respectively, with standard devia-tions owing to counting statistics of 0.04 and 0.5%,respectively.
The absence of a 2.54-cm (l-in.) length of fuelplate from the drawer would produce a count-rateshift of -3%, if multiplication effects are small andthe axial detector response is uniform. Lf 0.l% is anacceptable rejection probability for good drawers,then a 3% deviation is detectable with a probability>99% in 100s using coincidence counting, providedthat counting statistics are the dominant sources oferror. In practice, the nonuniformity of loading fordrawers of a given type is likely to provide thelimitation for the detection of deviations.
It is possible to rearrange the plutonium plates ina fuel drawer to increase the totals and coincidencecounting rates by placing two or more plates side-by-side to increase the neutron multiplication. Con-sequently, some fuel can be removed from a drawer,and the remaining fuel can be rearranged to producethe original totals counting rate or the original coin-cidence counting rate, However, it is not feasible toproduce both rates simultaneously, Measuring bothtotals and coincidences, therefore, allows the detec-tion of such an attempted subversion.
F. Fuel Canister Measurements
The discussion of the totals and coincidencecounting of fuel drawers applies about as well to
A -4

storage canisters. The primary differences are that adifferent size sample chamber is required for thecanisters (perhaps requiring a slightly lower ef-ficiency) and multiplication effects are larger in afilled canister than in a normally configured fuel
drawer. In general, there is more plutonium in thecanisters than in the drawers, resulting in a highercounting rate and better statistical precision. To thefirst order, multiplication increases the sensitivityto plate removals. That is, a 10% reduction inplutonium reduces the counting rate by more than10%. However, possible geometric variations mightovershadow this advantage. As with fuel drawers, arearrangement of the plates inside a canister to com-pensate for missing fuel would be detected by theratio of totals counts to coincidence counts.
To investigate absorption and multiplication ef-fects in a storage canister, a series of measurementswas performed in the AWCC operated in the passivemode. The plates were placed in the canister one ata time, and the individual results were summed tocorrespond to the higher loadings. In addition, thehigher loadings were obtained by loading severalplates, side by side, in alternating rows. The resultsof these measurements are shown in Fig. A-4. Thereis a small multiplication effect in the coincidenceresults, amounting to a factor of -1.10 for the 750-gplutonium loading. This effect will be considerably
300 1 I I 1 I I I I I I I I I I I/
290 - ● SUM OF INDIVIDUAL PLATES /
~ 260 – ● GROUP OF PLATES P/
~ 240 – /
: 220 - //
:200 - //
: 130 -z
/
: 160 - //
u 140 –
E 120 _
Ido 100 –zW 80 -0G 60 –g 40 -
u 20 -
00 100 200 300 400 500 600 700 800
PU (9)
Fig. A-4.
Coincidence response versus plutonium (8. 7%24”Pu) loading for plates in a storage canister.
larger for the fully loaded canister (>2 kgplutonium). The following section describes atechnique for correcting for such multiplication.
G. Multiplication
In passive neutron counting of fuel plates both thetotals and coincidence counts are affected by self-multiplication within the material. Self-rnultiplication manifests itself in the followingways.
(1) Spontaneous fission neutrons may induce fis-sions in the fissile isotopes. The fissions willincrease the observed fission multiplicityfrom F to MT, where M is the leakage mul-tiplication.
(2) If (a,n) reactions are present in the material,
the background of random events in thedetector will be higher. The totals count rateby itself will not be a direct measure of theamount of plutonium present. Also, neutronsfrom (a,n) reactions will induce fissions,thereby further increasing the totals countsand also contributing to the coincidencecounts.
For plutonium fuel that does not contain oxides,aluminum alloys, or other materials with high (ajn)cross sections, it is relatively easy to correct for theself-multi plication induced by spontaneous fission
[(1) above]. The ratio of coincident eventa to totalevents increases as the multiplication M increases.A correction factor can be calculated from this ratioand applied to the data. No free parameters are re-quired, but it is necessary to measure thebackground and the ratio of coincidence to totalevents for a small, nonmultipying sample. Figure A-5 illustrates the application of this correction to aseries of measurements in which plates of 11.6 and8.7% 24”Pu were added sequentially, side by side,into the counter. The uncorrected coincidencemeasurements deviated by more than 100% fromthe nominal (unmuitiplied) count rate per gram.The corrected data were within 5% of the nominalvalues. It should be possible to refine this techniqueto obtain results within 1-2% of nominal values.
For fuel plates in which significant (a,n) reactionsare present, such as with aluminum alloy fuel [(2)
above], it should still be possible to correct for self-multiplication because the ratio of (a,n) neutrons to
A-5
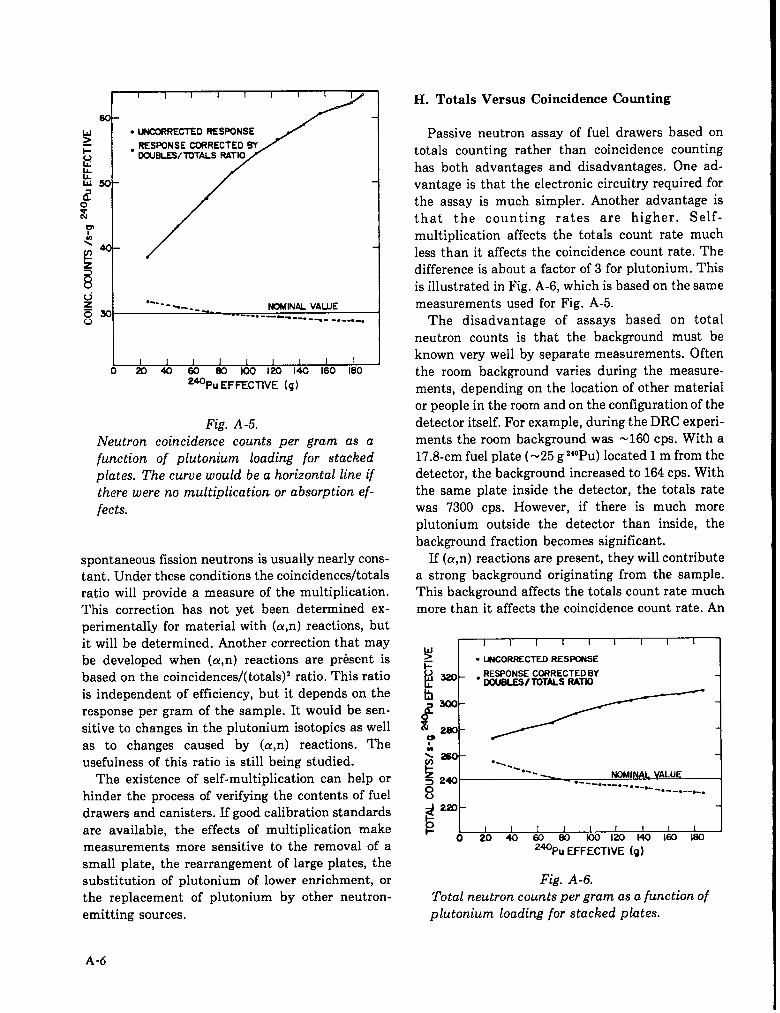
‘F----~0 W 100 120 140 160 180
‘aPu EFFECTIVE (g)
Fig. A-5.Neutron coincidence counts per gram as afunction of plutonium loading for stackedplates. The curve would be a horizontal line ifthere were no multiplication or absorption ef-fects.
spontaneous fission neutrons ia usually nearly cons-tant. Under these conditions the coincidences/totalsratio will provide a measure of the multiplication.This correction has not yet been determined ex-perimentally for material with (a,n) reactions, butit will be determined. Another correction that maybe developed when (a,n) reactions are present isbased on the coincidences/( totals)2 ratio. This ratiois independent of efficiency, but it depends on theresponse per gram of the sample. It would be sen-sitive to changes in the plutonium isotopics as wellas to changes caused by (a,n) reactions. Theusefulness of this ratio is still being studied.
The existence of self-multiplication can help orhinder the process of verifying the contents of fueldrawers and canisters. If good calibration standardsare available, the effects of multiplication makemeasurements more sensitive to the removal of asmall plate, the rearrangement of large plates, thesubstitution of plutonium of lower enrichment, orthe replacement of plutonium by other neutron-emitting sources.
H. Totals Versus Coincidence Counting
Passive neutron assay of fuel drawers based ontotals counting rather than coincidence countinghas both advantages and disadvantages. One ad-vantage is that the electronic circuitry required forthe assay is much simpler. Another advantage isthat the counting rates are higher. Self-multiplication affects the totals count rate muchless than it affects the coincidence count rate. Thedifference is about a factor of 3 for plutonium. Thisis illustrated in Fig. A-6, which is based on the samemeasurements used for Fig. A-5.
The disadvantage of assays based on totalneutron counts is that the background must beknown very well by separate measurements. Oftenthe room background varies during the measure-ments, depending on the location of other materialor people in the room and on the configuration of thedetector itself. For example, during the DRC experi-ments the room background was -160 cps. With a17.8-cm fuel plate (=25 g 24”Pu) located 1 m from thedetector, the background increased to 164 cps. Withthe same plate inside the detector, the totals ratewas 7300 cps. However, if there is much moreplutonium outaide the detector than inside, thebackground fraction becomes significant.
If (a,n) reactions are present, they will contributea strong background originating from the sample.This background affects the totals count rate muchmore than it affects the coincidence count rate. An
~ I ● UNCORRECTED RESPONSE I
~ + . RESPONSE CORRECTED BY00IBLES/ TOTALS RATIO 4
$260 –“----
k .-~ ----3 240
NOMINAL VALUE
g●--------- ------
.--. --.-O
~z?o -
E I I I I I 1 I I I
o 20 40 60 So KXJ1201401601S0
2WPU EFFECTIVE (g)
Fig. A-6.Total neutron counts per gram as a function ofplutonium loading for stacked plates.
A-6
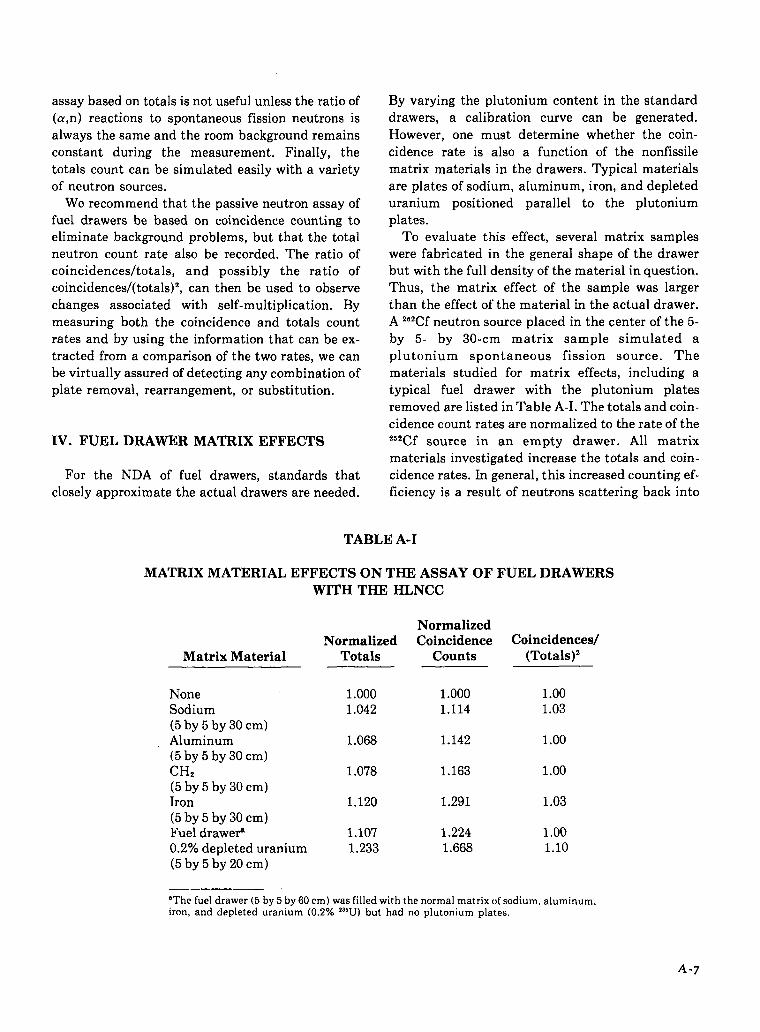
assay based on totals is not useful unless the ratio of(a,n) reactions to spontaneous fission neutrons isalways the same and the room background remainsconstant during the measurement. Finally, thetotals count can be simulated easily with a varietyof neutron sources.
We recommend that the passive neutron assay offuel drawers be based on coincidence counting toeliminate background problems, but that the totalneutron count rate also be recorded. The ratio ofcoincidencesltotals, and possibly the ratio ofcoincidences/( totals)2, can then be used to observechanges associated with self-multiplication. Bymeasuring both the coincidence and totals countrates and by using the information that can be ex-tracted from a comparison of the two rates, we canbe virtually assured of detecting any combination ofplate removal, rearrangement, or substitution.
IV. FUEL DRAWER MATRIX EFFECTS
For the NDA of fuel drawers, standards that
closely approximate the actual drawers are needed.
By varying the plutonium content in the standarddrawers, a calibration curve can be generated.However, one must determine whether the coin-cidence rate is also a function of the nonfissilematrix materials in the drawers. Typical materialsare plates of sodium, aluminum, iron, and depleteduranium positioned parallel to the plutoniumplates.
To evaluate this effect, several matrix sampleswere fabricated in the general shape of the drawerbut with the full density of the material in question.Thus, the matrix effect of the sample was largerthan the effect of the material in the actual drawer.A 2“Cf neutron source placed in the center of the 5-by 5- by 30-cm matrix sample simulated aplutonium spontaneous fission source. Thematerials studied for matrix effects, including atypical fuel drawer with the plutonium platesremoved are listed in Table A-I. The totals and coin-cidence count rates are normalized to the rate of thezszcf source in an empty drawer. All matrix
materials investigated increase the totals and coin-cidence rates. In general, this increased counting ef-ficiency is a result of neutrons scattering back into
TABLE A-I
MATRIX MATERIAL EFFECTS ON THE ASSAY OF FUEL DRAWERSWITH THE HLNCC
Normalized
Matrix Material
NoneSodium(5 by 5 by 30 cm)Aluminum(5 by 5 by 30 cm)CHz(5 by 5 by 30 cm)Iron(5 by 5 by 30 cm)Fuel drawer’0.2% depleted uranium(5 by 5 by 20 cm)
NormalizedTotals
1.0001.042
1.068
1.078
1.120
1.1071.233
Coincidence Coincidences/Counts (Totals)2
1.000 1.001.114 1.03
1.142 1.00
1.163 1.00
1.291 1.03
1.224 1.001.668 1.10
“Thefueldrawer(5by5by60cm) wasfilledwiththenormalmatrixof sodium.aluminum,iron,and depleteduranium(0.2”A “U) but had no plutoniumplates.
A-7

the detector instead of leaking from its ends. Thiseffect is expected to be negligible for a longer detec-tor. If the efficiency depended only on neutron scat-tering and moderation effects, the normalizedcoincidences/( totals)2 ratio would remain unitybecause the coincidence rate depends on the squareof the efficiency. This is true of all samples exceptthe depleted uranium, where fast-neutron mul-tiplication occurs. This multiplication effect in-creases the effective multiplicity, thereby increasingthe coincidence rate. The normalized coinci-dences/(totals)2 ratio increases to 1.10, signaling thiseffect.
Excluding the depleted uranium case, the matrixeffect of the drawer is similar to that of the othermatrix materials. A diversion involving loading adrawer with depleted uranium would be noticeablebecause of the significant weight increase.
We conclude that drawer standards should havethe same geometry and composition, includingmatrix materials, as the drawers to be assayed,whenever possible. However, to reduce the numberof standards required, small deviations in matrixmaterials can be allowed.
V. ACTIVE NEUTRON ASSAY METHODS
The preceding sections indicate that adequateverification of plutonium fuels is possible withpassive neutron and gamma-ray techniques.However, for ZS5Umetal fuel, the passive gamma-raY
signal is not very intense or penetrating, and thereare no significant passive neutron signatures. Thissection will survey some active neutron NDAtechniques that can be applied to the quantitativeverification of critical-assembly fuels.
A. The “2Cf Shuffler
The 2’2Cf ShuffleF was developed several yearsago for applications to a wide variety of SNM, andthe experience obtained using this instrument isdirectly applicable to critical-assembly fuels. The‘S’cf Shuffler uses fast- or thermal-neutron in-
terrogation, combined with delayed-neutroncounting. The 2s2Cf Shuffler repetitively transfersthe neutron source from the interrogation position to
a shielded position while the delayed neutrons arecounted. As shown in Fig. A-7, the a~say system in-cludes a source shield tank, a decoupling CHZshield, and an irradiation tank. The assay sample isirradiated inside a high-efficiency neutron wellcounter used to count the fission-delayed neutrons.For samples containing plutonium, this well counteralso can be used in the passive coincidence mode tocount the spontaneous fission neutrons. Theneutron detector consists of a CHZ matrix filled with25 aHe tubes.
The Shuffler system has been evaluated for assayof fuel rods, inventory samples, scrap and waste,uranium ore, irradiated fuel, and plutonium-uranium mixtures. For the plutonium-uraniummixtures, the combination of passive neutron coin-cidence counting and active neutron interrogationcan separate the *9W and plutonium components inthe assay. The system can assay samples with fissilecontent from a few milligrams up to severalkilograms, using thermal-neutron interrogation forthe low-mass samples and fast-neutron interroga-tion for the high-mass samples.
Because fuel drawers contain large amounts ofdepleted uranium, it is necessary to use neutron-spectrum tailoring material, as shown in Fig. A-7, toreduce the energy of the 2bzCf neutrons below thethreshold for ‘*U fission.
The performance characteristics of the Shufflersystem using a 0.5-mg 2s2Cfsource for ‘SW assay aregiven in Table A-II. Plutonium samples will haveslightly less response per gram because of the lowerdelayed-neutron yield compared with 2~’U. Becausethe uranium and plutonium fuel plates have a highfissile density, only fast-neutron interrogation willbe considered, to obtain adequate penetrability forquantitative verification.
For discussion and comparison, we define atypical fuel drawer as one containing 1 kg ofplutonium (11.6% 2’OPu) fuel plates or 1 kg ofuranium (93~0 enriched) fuel plates. The plates arepositioned in two rows, each 45.7 cm (18 in.) long.Factoring in the geometric differences between thefuel drawer and the small sample used for Table A-H, the expected count rate for a drawer of ‘“U platesis 6500 countds in the Shuffler system shown in Fig.A-7. Thus, after a l-rein measurement time, the ac-cumulated delayed-neutron counts would be-195 000 with a background of <1000 counts,
A-8

(---“-‘---. ..;:I
!!0, =sT_T
86 3.6mm
D.*I1 tank Shlold tonk
,, I
Irradlatlon tank::“
.
t.
I . . . . . ------- . .
-1j!!+@LlI He= dataclors (25) --J
I
I2.388m .~
poufca Irandakw motor
\ /252cf‘WK’ Tw p.mplc ch.mb.t
L1, / “ *–
M7 kw
fI
u 11’++ii’!d1 uh\ \
—
+
Fig. A-7.
Schematic of the 2’2Cf Shuffler system showing the neutron well detector, the decouplingshield, and the dwell tank. This size system corresponds to a 500-pg 2s2Cfsource and a 40-mg‘“U sensitivity for fast neutrons; a system designed specifically for fast-critical-assemblyfuel would be considerably smaller.
resulting in a statistical precision of *0.23’Yo (1 a).This precision will be degraded by additional errorcomponents from electronic instabilities andbackground fluctuations. Since a more reasonablegoal for the measurements is perhaps 17. precisionfor a l-rein assay, the intensity of the 2’2Cf sourceused for Table A-II could be reduced by an order ofmagnitude (that is to say, to 50 Kg), resulting in asmaller shield and a less costly system.
The application of the Shuffler system to uraniumand plutonium fuel mixtures introduces the
than one fissile component,and 24~Pu.To help unravel this
problem of morenamely, 2S5U,ZS9PU,
problem, the Shuffler’s well counter can be used as apassive neutron coincidence counter to determinethe effective 2’”Pu content, defined as
240pU(effective) = 240
??u + 1.69 242~u
+ 2.54 2381W. (A-1]
A-9
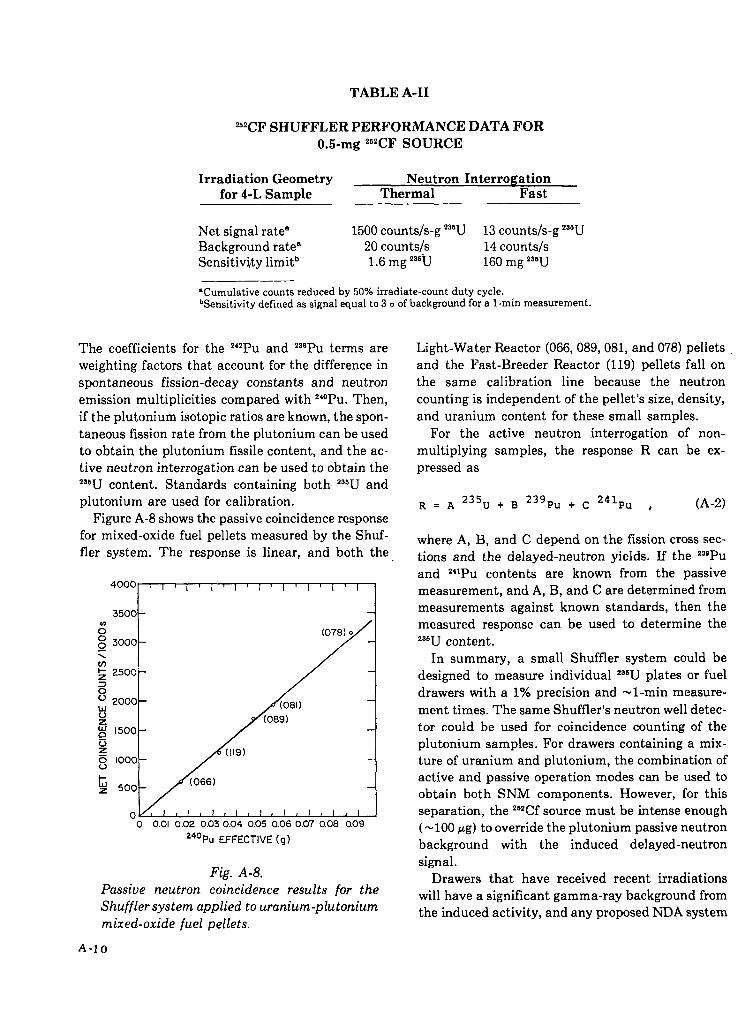
TABLE A-II
262CF SHUFFLER PERFORMANCE DATA FOR
0.5-mg 2S2CFSOURCE
Irradiation Geometry Neutron Interrogationfor 4-L Sample Thermal Fast
Net signal rate’ 1500 counts/s-g ‘“U 13 counts/s-g ‘W-JBackground rate” 20 countsls 14 countslsSensitivity limit” 1.6 mg ‘“U 160 mg ‘“U
‘Cumulativecountsreducedby 50%irradiate-countdutycycle.bSensitivitydefinedaasignalequalto 3 uof backgroundfora l-rein measurement.
The coefficients for the “*Pu and 2SaPuterms areweighting factors that account for the difference inspontaneous fission-decay constants and neutronemission multiplicities compared with ““Pu. Then,if the plutonium isotopic ratios are known, the spon-taneous fission rate from the plutonium can be usedto obtain the plutonium fissile content, and the ac-tive neutron interrogation can be used to obtain the‘“U content. Standards containing both ‘“U andplutonium are used for calibration.
Figure A-8 shows the passive coincidence responsefor mixed-oxide fuel pellets measured by the Shuf-fler system. The response is linear, and both the
A(078) .
o~0 0.01 0.02 0.030.04 0.05 0.060.07 0.08 0.09
240Pu EFFECTIVE (g)
Fig. A-8.Passive neutron coincidence results for theShuffler system applied to uranium-plutoniummixed-oxide fuel pellets.
Light-Water Reactor (066, 089,081, and 078) pelletsand the Fast-Breeder Reactor (119) pellets fall onthe same calibration line because the neutroncounting is independent of the pellet’s size, density,and uranium content for these small samples.
For the active neutron interrogation of non-multiplying samples, the response R can be ex-pressed as
R = A 23’U + B ‘“p” + C “% , (A-2)
where A, B, and C depend on the fission cross sec-tions and the delayed-neutron yields. If the 23ePuand Z41PUcontents are known from the Passive
measurement, and A, B, and C are determined frommeasurements against known standards, then themeasured response can be used to determine the‘“U content.
In summary, a small Shuffler system could bedesigned to measure individual ‘“U plates or fueldrawers with a 1% precision and -1 -rein measure-ment times. The same Shufflerts neutron well detec-tor could be used for coincidence counting of theplutonium samples. For drawers containing a mix-ture of uranium and plutonium, the combination ofactive and passive operation modes can be used toobtain both SNM components. However, for thisseparation, the 252Cfsource must be intense enough
(-100 pg) to override the plutonium passive neutronbackground with the induced delayed-neutronsignal.
Drawers that have received recent irradiationswill have a significant gamma-ray background fromthe induced activity, and any proposed NDA system
A-IO
must operate in this background. The 3He detectorsused in the passive neutron coincidence detectorsand the Shuffler system can operate in a gamma-rayfield up to - IRA-I. If the dose rates are above thislevel, the sample cavity can be lined with a few cen-timeters of lead to reduce the gamma dose. The leadwill not adversely affect the active or passiveneutron methods.
The Shuffler system, compared with other activeassay systems employing radioactive sources, israther large and requires the mechanical complexityof a neutron-source transfer mechanism. However,it covers a wider sample range, is less sensitive tosample matrix materials and gamma-raybackgrounds, and offers better precision and elec-tronic stability. In general, ‘He detectors are morestable and less temperature sensitive thanscintillator-photomultiplier detectors.
B. Other Active Neutron Assay Techniques
1. Active Well Coincidence Counter. TheAWCC’ was designed for the assay of enricheduranium samples ranging in 29GUmass from -100 gto 5 kg. The system uses a low-intensity ( w1O’ n/s)AmLi neutron source to interrogate the sample,which is located in the interior of a neutron wellcoincidence counter. The fission reactions inducedby the random AmLi neutron source give off coin-cidence neutrons that are counted in the shift-register coincidence circuit.7 Since the neutronenergy of the AmLi source is below the threshold for*“U fission, there is no significant contribution-fromthe depleted uranium.
The counting rates of the AWCC-type systems arelow (-0.2 counts/s-g), and the accidental pileup is alarge fraction of the induced activity, resulting in arelatively poor statistical precision. A 200-s countfor a l-kg 23’U canister gives a precision of about 3%(1 a). Thus, this counter is of primary interest wherea larger counting time is available. Also, this type ofcounter is not applicable to drawers containingplutonium-uranium mixtures because the passiveneutron coincidence signal from the plutoniumdominates the induced-neutron fission signal fromthe 33’U.
2. Random Driver. The Random Driver (RD)system8 is similar to the AWCC except that it uses
plastic scintillator detectors for coincidencecounting of the fast neutrons from induced-fissionreactions. The AmLi interrogation source strength islarger (-10’ n/s) for the RD system, and there is lessaccidental pileup of counts in the accidental chan-nel because of the short ( -40-ns) gate lengths,resulting in a somewhat better statistical precisionthan with the AWCC for the same counting time.Also, the RD system can measure mixtures ofplutonium and uranium fuel plates using a com-bination of passive and active modes of operation.
A typical neutron coincidence counting rate for al-kg 23’U sample is 80 counts/s, giving a statisticalprecision of -270 (1 a) for a l-rein counting time.The measurement times will be significantly longerfor mixtures of uranium and plutonium, dependingon the uranium fraction.
Drawers that have been irradiated recently in thereactor core will have a significant gamma-raybackground level. The plastic scintillator detectorsin the RD are very sensitive to gamma rays, and itmay not be possible to shield the instrument ade-quately from this background.
3. Neutron Generators. Sealed-tube neutrongenerators could be used as the neutron source forthe active verification of critical-assembly fuels.Generators are commercially available that produceeither 14-MeV neutrons from the (D,T) reaction or2-MeV neutrons from the (D,D) reaction. The yieldsfrom the (D,T) 14-MeV generators are typically 10’n/s, whereas the (D,D) 2-MeV yields are about twoorders of magnitude smaller.
Typical assay methods using these tubes inducefission reactions by operating the source in a pulsedmode and counting the induced prompt or delayedneutrons from the sample. For prompt neutroncounting, it is normally necessary to use thermal-neutron interrogation of the sample to separate theinterrogation neutrons from the induced signalneutrons. However, critical-assembly fuel plateshave a high fissile density, and thermal-neutron in-terrogation has the limitation of severe neutron self-shielding in the sample. This method should be usedonly for a qualitative screening of the fuel.
The fuel drawers often contain large quantities ofdepleted uranium, making it difficult to use 14-MeVneutron generators because fission reactions are in-duced in the ““U by the high-energy neutrons. Otherneutron sources we have considered have neutron
A-II
energies below the threshold for ‘W fission. A largequantity of neutron-spectrum tailoring materialsurrounding the 14-MeV neutron generator will helpreduce this problem. The (D, D) 2-MeV neutrongenerator has a lower energy, and the reduction of“W fission is less of a problem; however, theneutron yields are much lower.
A neutron-generator source yield of -108 n/swould give about the same counting rates as the 50-~g zbzcf source. This intensity is probably adequate
for pure uranium samples. However, plutonium anduranium mixtures likely will require a higher sourcestrength to override the neutron background fromthe plutonium. The expected counting precision andmeasurement times would be roughly the same asgiven in Sec. V.A for the 2’2Cf Shuffler of the samesource intensity. Neutron generators are difficult touse because they do not have the reliability andstability of operation of radioactive sources.
VL SUMMARY
Passive gamma-ray and neutron coincidencemethods are adequate for the rapid quantitativeverification of plutonium inventories in criticalfacilities. The passive gamma-ray measurement isuseful to confirm the 2SWPUand 241Puisotopic ratiosand to determine the length of plates in the con-tainer when the width and alloy mix are known. Forfuels that contain materials with a significant (a,n)yield, such as aluminum, the combination of totaland coincidence neutron counting could give acheck of the expected plutonium isotopic mixture.
When “W fuels are present, the 2’2Cf Shufflersystem seems to be the most promising active-neutron method. In the combination active-passivemode, the Shuffler system can be used to verify bothuranium and plutonium fuel.
The NDA measurements should be sensitive tothe following cases.
(1)
(2)
(3)
(4)
Removal of one or more fuel plates from a con-tainer or the substitution of plates containingonly a portion of the original loading such asthe top edge.Substitution of high- 2’OPu-content plates for
low- ‘40Pu-content plates.
Substitution of radioactive gamma-ray andneutron sources for the plutonium in the con-tainer.Alterations of the geometric configurationwithin the container to give a higher countingeftlciency or multiplication effect, thus mask-ing the removal of part of the plutonium.
The NDA verification should give a quantitativemeasure of the SNM for the expected configurationof the material. However, if SNM removal has beenmasked by any of the above cases, the instrumentsshould signal this irregularity. Passive neutroncounting takes care of (1), (3), and (4), whereasgamma-ray verification deals with (2), (3), and (4).Therefore, a combination of passive neutron andgamma-ray techniques (possibly in the same instru-ment) will give a high level of confidence in theverification. For plutonium fuels alloyed withaluminum, the (a, n) passive neutron yield makesthe neutron counting sensitive to (2), also.
A-12
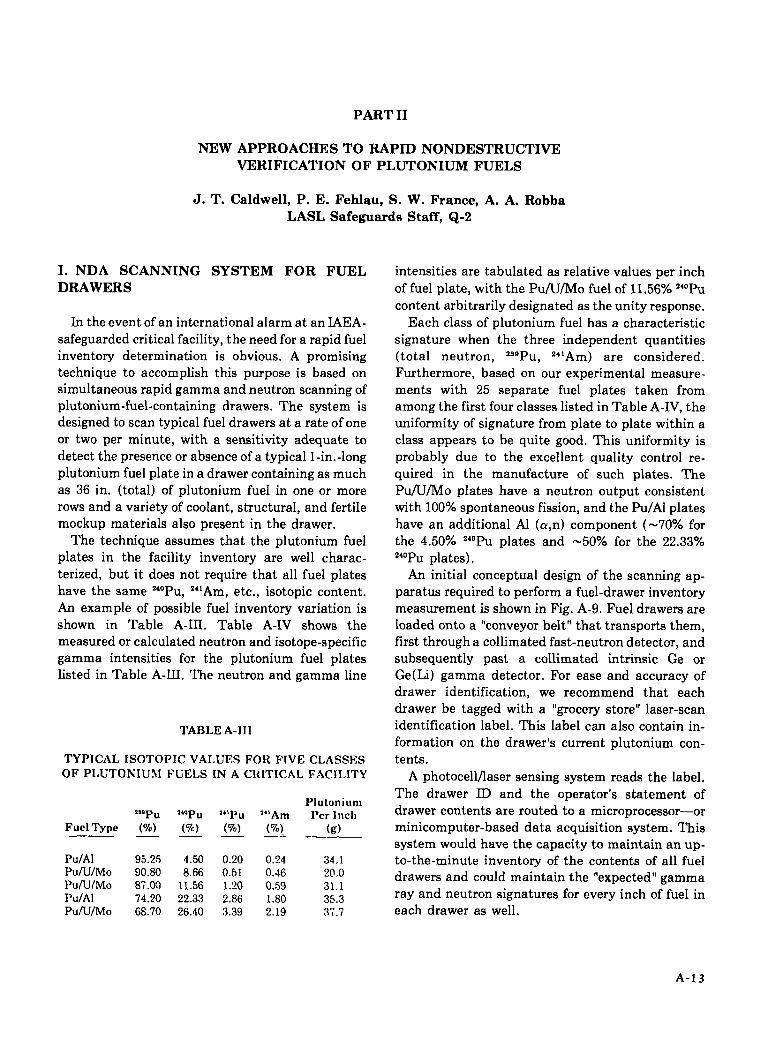
PART 11
NEW APPROACHES TO RAPID NONDESTRUCTIVEVERIFICATION OF PLUTONIUM FUELS
J. T. Caldwell, P. E. Fehlau, S. W. France, A. A. RobbaLASL Safeguards Staff, Q-2
1. NDA SCANNING SYSTEM FOR FUELDRAWERS
In the event of an international alarm at an IAEA-safeguarded critical facility, the need for a rapid fuelinventory determination is obvious. A promisingtechnique to accomplish this purpose is based onsimultaneous rapid gamma and neutron scanning ofplutonium-fuel-containing drawers. The system isdesigned to scan typical fuel drawers at a rate of oneor two per minute, with a sensitivity adequate todetect the presence or absence of a typical I-in. -longplutonium fuel plate in a drawer containing as muchas 36 in. (total) of plutonium fuel in one or morerows and a variety of coolant, structural, and fertilemockup materials also present in the drawer.
The technique assumes that the plutonium fuelplates in the facility inventory are well charac-terized, but it does not require that all fuel plateshave the same ‘OPu, “’Am, etc., isotopic content.An example of possible fuel inventory variation isshown in Table A-III. Table A-IV shows themeasured or calculated neutron and isotope-specificgamma intensities for the plutonium fuel plateslisted in Table A-III. The neutron and gamma line
TABLE A-lJI
TYPICAL ISOTOPIC VALUES FOlt FIVE CLASSES
OF PLUTCINIUM FUELS IN A CRITICAL FACII.ITY
Plutonium‘“PU lwp u 2“PU ‘“Am Pcr inch
Fuel Type (%) (%) (%) (%J (d—. _
Pu/Al 95.25 4.50 0.20 0.24 3441WUIMO 90.80 8.66 0.51 0.46 2@,oPuAJ/Mo 87.00 11.56 I.~o 0.59 31.1Pu/Al 74.20 22.33 2.86 1.80 3!5.3PUNIMO 68.70 26.40 3.39 2.I9 37.7
intensities are tabulated as relative values per inch
of fuel plate, with the Pu/U/Mo fuel of 11,5670 240Pucontent arbitrarily designated as the unity response.
Each class of plutonium fuel has a characteristicsignature when the three independent quantities(total neutron, 2“Pu, Z41Am) are considered.
Furthermore, based on our experimental measure-ments with 25 separate fuel plates taken fromamong the first four classes listed in Table A-IV, theuniformity of signature from plate to plate within aclass appears to be quite good. This uniformity isprobably due to the excellent quality control re-quired in the manufacture of such plates. ThePu/U/Mo plates have a neutron output consistentwith 100% spontaneous fission, and the Pu/Al plateshave an additional Al (a,n) component (-70% forthe 4.51)% 240Pu plates and -507. for the 22.33%240Puplates).
An initial conceptual design of the scanning ap-paratus required to perform a fuel-drawer inventorymeasurement is shown in Fig. A-9. Fuel drawers areloaded onto a “conveyor belt” that transports them,first through a collimated fast-neutron detector, andsubsequently past a collimated intrinsic Ge orGe(Li) gamma detector. For ease and accuracy ofdrawer identification, we recommend that eachdrawer be tagged with a “grocery store” laser-scanidentification label. This label can also contain in-formation on the drawer’s current plutonium con-tents.
A photocell/laser sensing system reads the label.The drawer ID and the operator’s statement ofdrawer contents are routed to a microprocessor—orminicomputer-based data acquisition system. Thissystem would have the capacity to maintain an up-to-the-minute inventory of the contents of all fueldrawers and could maintain the “expected” gammaray and neutron signatures for every inch of fuel ineach drawer as well.
A-I3

*
0.7 3m
TABLE A-IV
MEASURED (OR CALCULATED) NEUTRON AND GAMMA RESPONSESFOR FIVE CLASSES OF PLUTONIUM FUELS
““PU Relative TotalFuel Type (90) Neutrons per Inch
PufAl 4.50 0.73 * 0.07Pufu/Mo 8.66 0.47 * 0.05PuAJfMo 11.56 1.00 i 0.10PuIA1 22.33 3.17 + 0.32Pu/U/Mo 26.40 (2.75 + 0.28)
POLYETHYLENE SHIELDING
Relative Total 2S’PU(414 keV y/in.)
(1.26 + 0.13)(0.67 + 0.07)1.00 * 0.100.96 + 0.10
(0.95 * 0.10)
Relative Total ‘“Am(662 keV Y/in.)
(0.42 + 0.04)(0.49 * 0.05)1.00 * 0.103.44 * 0.30
(4.47 + 0.45)
12 EA NEUTRON DETECTOR TUBESWITH INTERNAL SLIT COLLIMATOR IN 47T CONFIGURATION
11
HVCHASSIS~ 2- in.-WlDE BELT &CONTROL PANEL7
PU PLATE g~ANNER
Fig. A-9.
Schematic of proposed neutron fgamma rapid scanning instrument for reactor drawers con-taining plutonium fuel.
As the scan proceeds, a comparison between theexpected and observed signatures is done on line. (Aleast squares residual analysis would be ap-propriate.) Pass or fail criteria based on a X-squareanalysis can be applied and the drawer’s status onthe test recorded. Drawers failing the test can befurther evaluated by off-line measurements and arunning status of the total inventory verification canbe maintained.
An initial mockup of the neutron portion of thisscan system has recently been built and measure-ments have been made on representative fuel sam-ples. Total collimated neutron detection efficienciesof ~ 4% have been obtained. In this co~lg~ation
the presence or absence of a l-in. piece of Pu plate ina double row of Pu plates 24 in. long was easily
A-14
determined using the least squares comparisonmethod and an equivalent scan rate of 1 in.fs.
The conveyor belt scan system lends itself readilyto a virtually automated fuel drawer veriilcationsystem. Hardware could be developed to interfacewith facility automatic matrix loading/unloadingsystems. While inspector and operator personnelwould certainly be present during the verificationprocess, the automated approach would result in aconsiderable reduction in personnel radiation dose.
The signatures in Table A-IV show that uniqueidentification of a unit plate does not require highprecision in any one characteristic measurement. Infact, there appear to be few instances in which thegamma-ray portion of the overall signature will berequired for unique identification. The crucial factor
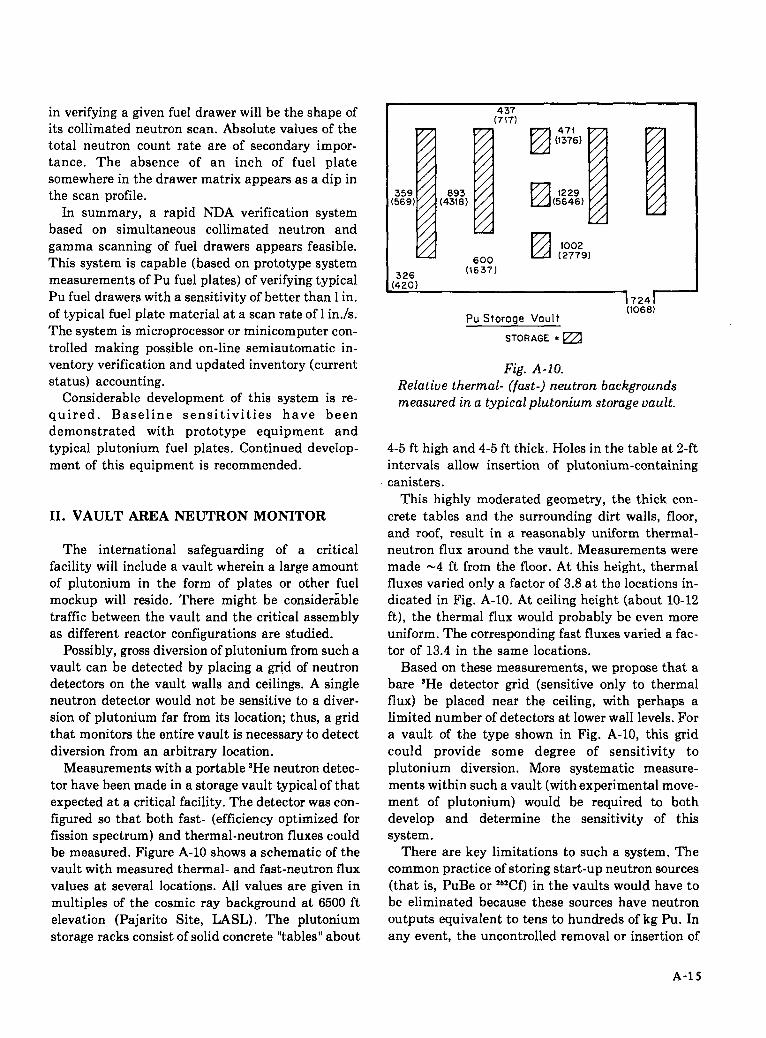
in verifying a given fuel drawer will be the shape ofits collimated neutron scan. Absolute values of thetotal neutron count rate are of secondary impor-tance. The absence of an inch of fuel platesomewhere in the drawer matrix appears as a dip inthe scan profile.
In summary, a rapid NDA verification systembased on simultaneous collimated neutron andgamma scanning of fuel drawers appears feasible.This system is capable (based on prototype systemmeasurements of Pu fuel plates) of verifying typicalPu fuel drawers with a sensitivity of better than 1in.of typical fuel plate material at a scan rate of 1in./s.The system is microprocessor or minicomputer con-trolled making possible on-line semiautomatic in-ventory verification and updated inventory (currentstatus) accounting.
Considerable development of this system is re-quired. Baseline sensitivities have beendemonstrated with prototype equipment andtypical plutonium fuel plates. Continued develop-ment of this equipment is recommended.
II. VAULT AREA NEUTRON MONITOR
The international safeguarding of a criticalfacility will include a vault wherein a large amountof plutonium in the form of plates or other fuelmockup will reside. There might be consideriibletraffic between the vault and the critical assemblyas different reactor configurations are studied.
Possibly, gross diversion of plutonium from such avault can be detected by placing a grid of neutrondetectors on the vault walls and ceilings. A singleneutron detector would not be sensitive to a diver-sion of plutonium far from its location; thus, a gridthat monitors the entire vault is necessary to detectdiversion from an arbitrary location.
Measurements with a portable ‘He neutron detec-tor have been made in a storage vault typical of thatexpected at a critical facility. The detector was con-figured so that both fast- (efficiency optimized forfission spectrum) and thermal-neutron fluxes couldbe measured. Figure A-10 shows a schematic of thevault with measured thermal- and fast-neutron fluxvalues at several locations. All values are given inmultiples of the cosmic ray background at 6500 ftelevation (Pajarito Site, LASL). The plutoniumstorage racks consist of solid concrete “tables” about
359569)
I
893(431s)
(717)
I
600
12zl47i
(1376)
❑ f229(5646)
!
Izl1002(2779)
326 (1637)
:420)
~?24~
Pu Storage Vault(106S)
STORAGE = ~
Fig. A-10.Relative thermal- (fast-) neutron backgroundsmeasured in a typical plutonium storage vault.
4-5 ft high and 4-5 ft thick. Holes in the table at 2-ftintervals allow insertion of plutonium-containingcanisters.
This highly moderated geometry, the thick con-crete tables and the surrounding dirt walls, floor,and roof, result in a reasonably uniform thermal-neutron flux around the vault. Measurements weremade -4 ft from the floor. At this height, thermalfluxes varied only a factor of 3.8 at the locations in-dicated in Fig. A-10. At ceiling height (about 10-12ft), the thermal flux would probably be even moreuniform. The corresponding fast fluxes varied a fac-tor of 13.4 in the same locations.
Based on these measurements, we propose that abare ‘He detector grid (sensitive only to thermalflux) be placed near the ceiling, with perhaps alimited number of detectors at lower wall levels. Fora vault of the type shown in Fig. A-10, this gridcould provide some degree of sensitivity toplutonium diversion. More systematic measure-ments within such a vault (with experimental move-ment of plutonium) would be required to bothdevelop and determine the sensitivity of thissystem.
There are key limitations to such a system. Thecommon practice of storing start-up neutron sources(that is, PuBe or ZGZCf)in the vaults would have to
be eliminated because these sources have neutronoutputa equivalent to tens to hundreds of kg Pu. Inany event, the uncontrolled removal or insertion of
A-15

such sources would totally circumvent the system.To be effective, this system would require strict con-trol over all removal and storage of plutonium and aknowledge of the type and neutron output ofmaterials being removed or stored. With strict entryand removal control, the system might have ex-cellent sensitivity. With proper calibration, fluxmeasurements at the +0.57. credibility level couldbe made routinely with ‘He tubes. If the vault’snominal storage capacity were 1000 kg Pu, thiscredibility level would translate roughly into a 5-kgPu sensitivity.
This system is not likely to be useful within thecritical-assembly area. Here, the flux is very sen-sitive to the multiplication condition and can varyby an order of magnitude during shutdown condi-tions, depending on shielding configurations, etc.
In summary, vault area plutonium monitoring ap-pears feasible using a grid of bare 3He neutronproportional counters attached to ceilings or walls.
Correlation of observed neutron count rates withchanges in the vault Pu inventory should be possibleat the +5-kg level in a 1000-kg total inventory.Further development of this system is recommen-ded.
REFERENCES
1.
2.
H. O. Menlove, N. Ensslin, M.L. Evans, and J.E. Swansen, “A Portable High-Level NeutronCoincidence Counter, ” in “Nuclear SafeguardsResearch, Program Status Report, May-August1976, ” Los Alamos Scientific Laboratory reportIA-6675-PR, p. 10 (January 1977).
J. L. Sapir, H. O. Menlove, W. L. Talbert, M. deCarolis, and N. Beyer, “Calibration of the IAEAHigh-Level Neutron Coincidence Counter forPlutonium Plates in ZPPR Drawers, ” in ‘Intense
3.
4.
5.
6.
7.
8.
Neutron Source Facility, January l-March 31,1976, ” Los Alamos Scientific Laboratory reportIA-6549-PR, pp. 4-5 (October 1976).
R. Sher, “Operating Characteristics of NeutronWell Coincidence Counters, ” BrookhavenNational Laboratory report BNL-50332 (1972).
N. Ensslin, M. L. Evans, H. O. Menlove, J.Sapir, and J. E. Swansen, “Thermal-NeutronCoincidence Counting of Large Plutonium Sam-pies, ” Trans. Am. Nucl. Sot. 27, 182 (1977).
H. O. Menlove and T. W. Crane, “A 2’2Cf BasedNondestructive Assay System for FissileMaterial, ” Nut. Instru. Methods, to be published(1978).
H. O. Menlove, N. Ensslin, C. R. Hatcher, E.Medina, and J. Foley, “Active Well CoincidenceCounter, ” in “Nuclear Safeguards Research andDevelopment Program Status Report,September-December 1977, ” I-m Alamos Scien-tific Laboratory report LA-7211-PR (August1978).
J. E. Swansen, N. Ensslin, M. S. Krick, and H.O. Menlove, “A New Shift Register for High-Count Rate Coincidence Applications, ” in“Nuclear Safeguards Research Program StatusReport, September-December 1976, ” Los AlamosScientific Laboratory repmt LA-6788-PR, pp. 4-6(June 1977).
N. Ensslin and D. M. Lee, “Random Driver forDYMAC, ” in “Nuclear Safeguards ResearchProgram Status Report, May-August 1977, ” LosAlamos Scientific Laboratory report LA-7030 -PR, p. 23-27 (March 1978).
A-16
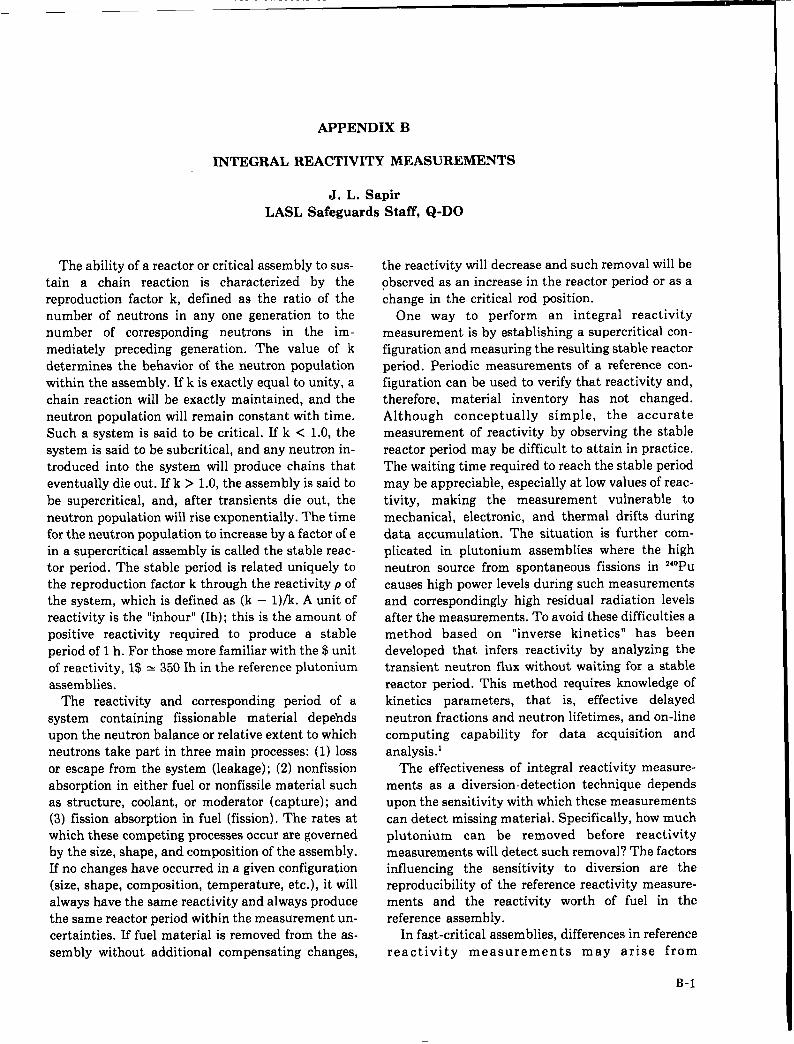
APPENDIX B
INTEGRAL REACTIVITY MEASUREMENTS
J. L. SapirLASL Safeguards Staff, Q-DO
The ability of a reactor or critical assembly to sus-tain a chain reaction is characterized by thereproduction factor k, defined as the ratio of thenumber of neutrons in any one generation to thenumber of corresponding neutrons in the im-mediately preceding generation. The value of kdetermines the behavior of the neutron populationwithin the assembly. If k is exactly equal to unity, achain reaction will be exactly maintained, and theneutron population will remain constant with time.Such a system is said to be critical. If k <1.0, thesystem is said to be subcritical, and any neutron in-troduced into the system will produce chains thateventually die out. If k >1.0, the assembly is said tobe supercritical, and, after transients die out, theneutron population will rise exponentially. The timefor the neutron population to increase by a factor of ein a supercritical assembly is called the stable reac-tor period. The stable period is related uniquely tothe reproduction factor k through the reactivity p ofthe system, which is defined as (k – I)/k. A unit ofreactivity is the “inhour” (Ih); this is the amount ofpositive reactivity required to produce a stableperiod of 1 h. For those more familiar with the $ unitof reactivity, 1$ = 350 Ih in the reference plutoniumassemblies.
The reactivity and corresponding period of asystem containing fissionable material depehdsupon the neutron balance or relative extent to whichneutrons take part in three main processes: (1) lossor escape from the system (leakage); (2) nonfissionabsorption in either fuel or nonfissile material suchas structure, coolant, or moderator (capture); and(3) fission absorption in fuel (fission). The rates atwhich these competing processes occur are governedby the size, shape, and composition of the assembly.If no changes have occurred in a given configuration(size, shape, composition, temperature, etc.), it willalways have the same reactivity and always producethe same reactor period within the measurement un-certainties. If fuel material is removed from the as-sembly without additional compensating changes,
the reactivity will decrease and such removal will beobserved as an increase in the reactor period or as achange in the critical rod position.
One way to perform an integral reactivitymeasurement is by establishing a supercritical con-figuration and measuring the resulting stable reactorperiod. Periodic measurements of a reference con-figuration can be used to verify that reactivity and,therefore, material inventory has not changed.Although conceptually simple, the accuratemeasurement of reactivity by observing the stablereactor period may be difficult to attain in practice.The waiting time required to reach the stable periodmay be appreciable, especially at low values of reac-tivity, making the measurement vulnerable tomechanical, electronic, and thermal drifts duringdata accumulation. The situation is further com-plicated in plutonium assemblies where the highneutron source from spontaneous fissions in ‘*”Pucauses high power levels during such measurementsand correspondingly high residual radiation levelsafter the measurements. To avoid these difficulties amethod based on “inverse kinetics” has beendeveloped that infers reactivity by analyzing thetransient neutron flux without waiting for a stablereactor period. This method requires knowledge ofkinetics parameters, that is, effective delayedneutron fractions and neutron lifetimes, and on-linecomputing capability for data acquisition andanalysis. 1
The effectiveness of integral reactivity measure-ments as a diversion-detection technique dependsupon the sensitivity with which these measurementscan detect missing material. Specifically, how muchplutonium can be removed before reactivitymeasurements will detect such removal? The factorsinfluencing the sensitivity to diversion are thereproducibility of the reference reactivity measure-ments and the reactivity worth of fuel in thereference assembly.
In fast-critical assemblies, differences in referencereactivity measurements may arise from
B-1
—

temperature variations, irreproducibility of table
closure and control rod positions, uncertainties inthe reactivity measurements, and unavoidablechanges in the core composition, particularly thedecay of fissionable 24’Pu. If the temperature of thereactor cell can be held relatively constant and theapproach to critical is always the same, uncertain-ties associated with temperature variations duringreference measurements should be relatively small.Experience at U.S. critical facilities indicates thatoverall reproducibility of reactivity measurementson the same assembly over a 1- or 2-day periodshould be better than 1 Ih, However, over a longertime period the decay of the fissionable isotope 24’Pu(13-yr half-life), present in small quantities in thefuel alloy, produces consistent and observable reac-tivity loss with time. Figure B-1 shows the results ofreactivity measurements made on a large plutoniumassembly over the course of several weeks.z Themeasured reactivity decreased by about 5 Ih. Eventhough the calculated rate of –0.234 Ihlday agreedwell with the measured decrease, the effect of 241Pudecay may produce significant uncertainties in long-term, reference criticality checks. In conjunctionwith a safeguards program, it will therefore be neces-sary to accumulate experimental data on referenceconfigurations to determine an accurate experimen-tal value of reactivity loss caused by 241Pudecay.
0.0 I
-Lo —
g
3 .2,0 .0x~; -3.0 —
f ~.“-
t CALCULATEDz -5,0 — I?ATE=O.234 lb/day
1-%
wK .6,0 —
-7.0 I I I I 1 I 4\ 104 8 12 16 20 24 28 32
TIME (DAYS)
Fig, B-1.Reference core reactivity loss in a largeplutonium assembly.
Based on a review of fast-critical experience anddiscussions with personnel at ANL,’ it appears thatin a program designed to use integral reactivitychecks for inventory verification, a discrepancy of-3 Ih between the expected and observed referencereactivity can be used to “trigger a safeguards alarm”(that is, require further investigation and ex-planation) without producing an excessive numberof false alarms. However, operational test andevaluation to establish an acceptable alarm limit arenecessary.
The amount of fuel that can be removed withinthe 3-Ih limit depends upon the reactivity worth offuel plates in the reference core. Although the worthof actual plates has not been measured, extensivemappings of the worths of small 2SePu (17. 240Pu)samples have been performed. We have reviewedsuch measurements performed from 1971 to 1977 inseveral plutonium assemblies, as reported in ANLprogress reports (ZPR-TM series). These assembliesgenerally had a core volume of 2400 to 2550 L andcontained -1050 kg of plutonium in N1550 coredrawers. Notable exceptions were Assembly 3-1A,which contained a 3350-L core, and Assembly 7,which incorporated blanket material within the coreregion and contained 1360 kg of plutonium.
The reactivity worth of 2’9Pu strongly depends onits location within the core. Typical radial traversestaken near the core midplane are shown in Fig. B-2for several of the assemblies. The data plotted in thefigure include the extreme values so that additionalpoints not plotted fall within the indicated band. Ingeneral, for a homogeneous, uniformly loaded, fastreactor core, the 29”PUworth will peak at the centerand monotonically decrease with increasing radius.In some of the configurations, perturbations owingto control rods, sodium experiments, or loadingvariations caused the worth to dip in the centralregion. However, in all cases the minimum worth oc-curred at the outer edge of the core.
Axial worth traverses of 2S’PUtaken at or near thereactor centerline are shown in Fig. B-3. Except for aconfiguration in Assembly 5 that simulated fuelslumping during a reactor disassembly accident, theaxial worth profiles exhibit the “classical” shapewith the minimum core worth occurring at the coreedge (axial position = 18 in.).
From Figs. B-2 and B-3 it is apparent that theminimum plutonium worth will occur at the outer-most corner of the core (in the outer drawers at the
B-2

110
100
90
izai=v
:40
33
.0.0
.~a6
● O6.
- & oa. o
++
++ +:
+
~oe00
● a0
0
00
0 ASSEMBLY4 PHASE1
● A~EMBLY 5 REF.& HALF1
q- + ASSEMBLY5 FUEL SLUMPED,HALF 1\
I o ASSEMBLY7 PHASEA
10
t
“O51O’152O253O 3s40
RADIALSAMPLEPOSITION,IN.
Fig. B-2.Radial reactivity worth ofplutonium assemblies.
core-axial blanket interface).
2’”Fu in various
Although measure-ments have not been made in this region, the worthsthere can be estimated by assuming separability ofthe radial and axial profiles. The data necessary todeduce the minimum plutonium worths are listed inTable B-I, for several assemblies. The approximateouter radial boundary of the core is listed in column2 of Table B-I, and the corresponding 23’Pu midplaneworth at the boundary, as obtained from Fig. B-2, islisted in column 3. Column 4 shows the ratio of theminimum-to-central axial worth as obtained fromthe data in Fig. B-3. The deduced corner worths(that is, the product of columns 3 and 4, assumingseparability) are listed in column 5. They range from5.2 Ihfkg in Assembly 5-Ref. B to 10.0 Ihfkg in thefuel slumped experiment (Assembly 5 FS).
These worths are essentially point values at thecore-axial blanket interface. Because actual plateswill extend into regions of higher worth, a moreuseful number to evaluate safeguards effectiveness
\
●
a ●
a
a
o●
o
8A & &o A
H
~
●n
oA
Oa
●
Ob
o
.*
O ASSEMBLY3 PHASE300
● ASSEMBLY4 PHASEI A
o ASSEM8LY4 PHASE3 \
>eo
20
t
\A
A ASSEMBLY5 FUELSLUMPED
OtI I I I
o 5 10 1s mAXIAL SAMPLEPOSITION,lN.
Fig. B-3.Axial reactivity worth of ‘“l% in variousplutonium assemblies.
would be the minimum worth averaged over thelength of a plate. These values are obtained byaveraging the appropriate area of the axial worthprofile, and they are given in Table B-I, columns 6and 7, for l-in. and 4-in. plates, respectively. Thecorresponding total amount of plutonium equivalentto a 3-Ih reactivity loss is shown in columns 8 and 9for 1- and 4-in. plates, respectively. Thus, inprevious assemblies for which we have data, ilitegralreactivity checks would have detected removal of0.28-0.53 kg of 2S’PUin the form of l-in. plates (12-24plates) and 0.23-0.42 kg of 2S9PUin 4-in. plates (2-4plates). These detection sensitivities are for removalof plutonium from minimum worth regions. Smalleramounts removed from other parts of the core wouldbe detectable. The 3-Ih limit represents acumulative limit; in other words, it corresponds tothe total amount of plutonium that could beremoved before positive detection, It does not mat-ter whether this amount of material is removed in
B -3

TABLE B-I
‘sol% WORTH DATA AND DETECTION SENSITIVITIES FOR 15 PLUTONIUM ASSEMBLIES
Core ‘“PUEdge Edge
Assembly Radius WorthNo. (in.) (Ih)— —
23-1A3-lB3-34-14-24-34-45 Ref. B’5 Ref. Bb5 FSa5 FSb6 EOC6 BOC7A
36.0 25.040.0 22.036.0 24.6-- --
37.0 25.037.0 21.037.0 26.737.0 31.937.0 20.837.0 20.837.0 22.837.0 22.837.0 25.837.0 21.039.4 21.8
“AxialHalf 1.bAxialHalf 2.‘Based on 3 Ih reactivityloss.
Min/MaxAxialWorth
----
0.310.310.30
--
0.30--
0.250.290.350.440.24
.-
‘“PUComerWorths(Ib/kg)
7.6
7.5
8.0
5.26.08.0
10.06.2
one large removal or in a series of small removals. Onthe other hand, these detection sensitivities cannotbe generalized to other fast-critical assemblies; eachcase must be evaluated separately.
The above discussion of the use of reactivitymeasurements to detect diversion assumed only thatplutonium fuel was removed from the assembly.There are, however, compensating methods that canincrease reactivity and thereby mask fuel removal.These methods include adding moderatingmaterials such as polyethylene, carbon, or berylliumto the core, or moving plutonium from low-worth tohigh-worth regions. The ease of accomplishing suchcompensating reactivity changes will depend uponthe knowledge and equipment available to thepotential divertor. Significant compensatingchanges would most likely require that the divertormake one or more criticality measurements to assurethat the final reactivity is within 3 Ih of the referencevalue, and hence avoid detection. In domestic
MinimumWorth
l-in.Plate
(Img)
8.1
8.0
8.5
5.76.58.8
10.86.8
MinimumWorth4-in.Plate
(Ih/kg)
9.8
9.6
10.2
7.28.0
11.113.28.6
Detection DetectionSensitivityc Sensitivityc
l-in. 4-in.Plate Plate
(kg 23’Pu) (kg ‘3’Pu)
0.37
0.37
0.35
0.530.460.340.280.44
0.31
0.31
0.29
0.420.380.270.230.35
facilities, administrative controls prohibit a singleinsider from performing such experiments. However,from the international viewpoint, it would berelatively simple for the facility operator to make thenecessary changes. Thus, the effectiveness and con-fidence associated with integral reactivity measure-ments would be higher for domestic inspections thanfor international ones. Monitoring of the facility’sexperimental program and reactivity measurementsby a permanent IAEA inspector would increase thetimeliness and effectiveness of international inspec-tions. In any case, the problems associated with in-tegral reactivity checks do not negate their use, butserve to emphasize the need for complementary andindependent verification techniques and samplingplans.
Gross changes in core composition such as the ad-dition of moderator or the rearrangement of fuel af-fects the neutron flux and other measurable reactorcharacteristics. Therefore, additional measurements
B-4
could be performed to determine whether suchchanges have been made. Measurements of reactorparameters such as neutron flux, control-rod worth,reactivity worths of spectrum-sensitive materials(for example, ‘“B or “’U), reaction rates, spectral in-dices, or neutron lifetime will yield information ongross core changes, even though the overall reac-tivity is maintained constant. The ease and sen-sitivity of these measurements will depend oncharacteristics of the specific facility under con-sideration.
LASL and Applied Physics Division of ANL havejointly outlined a study to investigate and quantifythe usefulness and sensitivity of reactor measure-ments as an inventory verification technique.’ Thestudy will determine the following:
● reactivity worth of fuel plates in various parts ofthe core with special emphasis on the outermostregions where the worth is lowest,
● effectiveness of moderating materials such as
polyethylene and graphite in masking fuelremoval, and
● sensitivity of complementary reactor measure-ments to detect compensating reactivitychanges.
To minimize the amount of reactor time required,the study will rely initially on calculations. Thecalculations will determine the distortions caused byfuel removal and compensating reactivity changesas a function of the amount of fuel removed and thedistance from the perturbation. The maximumamount of fuel that can be removed before the per-turbation is detected can then be estimated. Experi-ments will subsequently be performed to confirmand normalize the calculations. Special considera-tion will be given to the need for relatively simpleand independent verification techniques required byIAEA inspectors. The results of the study will bereported separately.
The IAEA is currently supporting similar researchprograms at the Spektr critical facility (small,highly enriched uranium, fast assembly) located atthe Lenin Scientific Research Institute inDimitrovgrad, USSR’O’ and at the Japanese FCAfacility,
REFERENCES
1. W. G. Davey and W. C. Redman, ‘Z’echrziques inFast Reactor Experiments, (Gordon & Breach,Science Publishers, Inc., New York, 1970) p. 58-61, 158-175.
2. R. C. Matlock, R. E. Kaiser, and J. M. Gasidlo,‘Reactivity Effects in Critical Facilities Due toFissile Isotope Decay, ” 1969 Winter Meeting ofthe American Nuclear Society, November 1969.
3. R. J. Forrester and G. K. Rusch, ArgonneNational Laboratory, personal communication,June 1977.
4. P. I. Amundson, Argonne National Laboratory,personal communication, March 1978.
5. V. M. Gryazev, “Development of Procedures andTechniques for Verifying the Quantity and Com-position of Nuclear Materials at the Spektr Fastand Thermal Neutron Critical Facility, ”translated from Russian, IAEA unpublished data(1974),
6. V. M. Gryazev, “Experiments with a NuclearMaterials Accounting and Control System on theSpektr Fast-Thermal Critical Assembly, ”translated from Russian, IAEA unpublished data(1976).
B-5

APPENDIX C
AUTORADIOGRAPHY
J. L. SapirLASL Safeguards Staff, Q-DO
Autoradiography uses spontaneously emittedradiation (the 60-keV gamma ray from 241Amin thecase of plutonium) to form images on x-ray film.ANL has developed and used this technique toverify plutonium plates in reactor fiel drawers andvault storage containers.1 Exposure time usingKodak AA film (industrial x-ray film) is -15 min forreactor drawers and -45 min for vault canisters.
In a fast-critical assembly there maybe sufficient
clearance between the contents of a drawer and thesupporting matrix above it to insert a strip ofprepackaged film without removing the drawer orthe fuel plates. Figure C-1 is a compositephotographic print of several autoradiographa per-formed on fuel drawers inside a fast-criticalassembly. * The drawer shown in Fig. C-1A containsa single row of standard 0.25-in-thick fuel plates.Figure C-lB shows a drawer containing two rows ofthree plates each. In both cases, the image of thefuel plate edges is clearly defined. Figure C-lCshows an autoradiograph of a drawer with no fuel init, but with a drawer containing fuel in the matrixposition above it. The absence of fuel is apparent.Although a very faint image of the fuel in the drawerabove is visible, the steel matrix wall attenuates thegamma radiation so that a significant image is notproduced.
For verification of plutonium plates inside storagecanisters, the film was placed beneath thealuminum canister without opening the canister orremoving it from its vault position. Figure C-2 showsa canister filled with twenty-four 4-in. plates. Eachplate image has a contribution from both direct andscattered radiation. The image of the 4 outsideplates is lighter than the 20 interior plates becauseplates with only 1 neighbor have less scattered
*Theautoradiographsin this appendixarephotographiccopiesof prints,whichwereinturnreproducedfromtheoriginalx rays.Becauseof reproductionlossesin the photographicsteps,infor-mationin these figures is not as well defined aa in the originalfilm. Comments in the text are based on viewing the original filmor the initial prints.
A
-—
.=
B c
.— --.—=—-==.—. .
-
.~. ——.
.—
Fig. C-1.Composite print of autoradiographs from fueldrawers in the reactor.
c-1

Fig. C-2.
Autoradiograph of a storage canister contaim”ng twenty-four 4-in. plutonium fuel plates.
radiation contributing to their image density.Figure C-3 shows a partially filled canister. The mis-sing plate (third from the bottom, left side) is easilydetected. Again the plate images on the outside areless dense. Figure C-4 shows the results of replacinga fuel plate with a stainless steel “dummy” (center,right side). An image of the dummy plate is formedby scattered radiation from its neighbors. However,because the dummy plate emits no radiation, its im-age is less dense than that of a normal fuel plate.Note that the images of the plates adjacent to thedummy are also less dense than normal becausethere is no scattered radiation from the dummy.Thus, the neighbors have about the same imagedensity as outside plates. The effect of substitutinglead or uranium plates for plutonium fuel plates is
the same as that shown for stainless steel. Substitu-tion of low-Z material such as aluminum will give aresult more nearly resembling a vacancy. Althoughradiographs of canisters are not quite as unam-biguous or as simple to interpret as radiographa offuel drawers, a trained inspector should be able toconfirm the number of fuel plates in a canister.
Autoradiography was used at a large, U.S. criticalfacility in May 1977 to verify the entire inventory of0.25-in. -thick plutonium fuel plates. At that timethe reactor was empty, and all plates were stored inthe vault. That exercise required 5 man-days to ex-pose and process the film and 1 day to read and in-terpret the film.
In November 1977, autoradiography was used toverify the contents of fuel drawers, in situ, at
c-2

!-
,- .- .—.— .-——
Fig. C-3.Autoradiograph of a partially filled storagecanister with a missing plate (left side, thirdposition from bottom).
another large U.S. facilit y.z A total of 386 drawerswere examined. The film placement, exposure, andremoval were performed by two people workingtogether for 6 h. The processing and subsequentfilm reading each required approximately 1 man-day. One of the people taking the inventory receiveda radiation dose of 80 mR, essentially all beta-gamma.
The operation was hampered by the presence insome drawers of oversized iron oxide plates, whichcaused a tight fit and prevented full insertion of thefilmstrip. It was estimated that by revising the in-sertion procedure based on experience gained during
the operation, the effort per drawer could bereduced by ‘50%. Thus, an experienced team oftwo people working between the assembly matrixhalves probably can insert, expose, and retrieve filmat an average rate of 80-100 fuel drawers per hour.
Autoradiography can confirm the presence ofplutonium fuel plates and detect missing plates,substitution of dummy (nonradioactive) plates, orsubstitutions of plates of a different length. Becauseit can be performed in place and in parallel, it is a
.-. ——
.——. —— —.—..
Fig. C-4.Autorudiograph of a partially filled storage canister with a dummy solid stainless steel platein the center of the right side.
c-3

relatively rapid inventory method and causes aminimum of interference with normal reactor opera-tions.
The technique, however, has some limitations.The need for processing the film before it can beread may pose a problem to the IAEA. Will the filmbe processed at the facility or outside the country?Taking the film back to Vienna for processing wouldseriously reduce the timeliness of this technique.
Because of the low gamma-ray energy andcorresponding high self-absorption,autoradiography is essentially a surface measureand does not verify total plutonium content.Furthermore, as presently applied, it does not uni-quely identify plutonium, but only identifies thepresence of a sufficiently intense radioactive source.These disadvantages should not negate the use ofautoradiography, but they should serve toemphasize that it must be used in conjunction withother, independent verification techniques.Autoradiography of plutonium-bearing fuelmaterial is being studied in the Program for U.S.Assistance to IAEA Safeguards (Subtask A.35).SThis subtask will investigate the applicability ofautoradiography to international safeguards andwill develop procedures for inspectors to implementthis technique.
Autoradiography of fuel drawers containingenriched uranium plates is not currently practicablebut may be in the future. The technique has beendemonstrated for uranium oxide fuel elements.’ Ex-
posure times to produce an equivalent image fromenriched uranium are -200 times longer than forplutonium. In addition, the high-energy beta radia-tion from the 234Padaughter of 23W contributes tothe image density and results in poor sensitivity to23SUconcentration. Use of filters to absorb the betaradiation and image-intensification screens toreduce exposure time are being studied by ANL.
REFERENCES
1. S. B. Brumbach and R. B. Perry,
“Autoradiographic Technique for Rapid Inven-tory of Plutonium-Containing Fast CriticalAssembly Fuel, ” Argonne National Laboratoryreport ANL-77-67 (October 1977).
2. S. B. Brumbach, Argonne National Laboratory,
personal communication, April 1978.
3. “Program for Technical Assistance to IAEA
Safeguards, ” Second Program Plan, UnitedStates Department of Energy/Safeguards &Security, Subtask A.35 (March 10, 1978).
4. S. B. Brumbach and R. B. Perry (ANL),“Autoradiographic Techniques for Rapid Inven-tory of Reactor Fuel, ” Trans. Amer. Nucl. Sot.27, 190 (1977) .
c-4

APPENDIX D
SAMPLING PLANS AND DATA ANALYSISMETHODS FOR INVENTORY VERIFICATION
D. D. CobbLASL Safeguards Staff, Q-4
I. INTRODUCTION
Statistical sampling plans and statistical techni-ques for data analysis are key elements of inspectionstrategies for verification of SNM inventories. In-spection strategies for verifying discrete item inven-tories have been developed during the past severalyears and have been reported in the safeguardsliterature. (See Refs. 1-4 and the references therein.)The purpose of a carefully designed inspectionstrategy is to detect the misappropriation of a goalquantity of SNM by any strategy of diversion.Diversion strategies include all combinations of thefollowing.
1. Relatively large (whole-item) removals, in-cluding the possibility of replacement withlower grade or inert material;
2. Relatively small (fractional) removals with orwithout replacement; and
3. Records falsification, including deliberate mis-statements of the inventory or of the uncer-tainty in the operator’s estimate of the inven-tory.
To implement a particular inspection plan, theinspection team first must examine the operator’sinventory records and stratify the inventory intoclasses of uniquely identified and similar items.This stratification depends on factors such as thephysical forms of SNM present in the inventory, thequantity of SNM in each item, the types ofmeasurements available to the inspectors, and thetotal planned inspection effort. Once items andclasses of items have been defined, the inspection ef-fort should be optimized to counter the variousdiversion strategies; in general, a more sophisticateddiversion strategy requires a more intensive inspec-tion effort for detection. For example, whole-itemremovals with replacement by inert material mightbe detected using a go-no-go measurement. Detec-tion of fractional removals might require more sen-
sitive measurements and more sophisticated dataanalysis techniques. On the other hand, it is likelythat more of the inventory must be examined todetect the diversion of a goal quantity of SNM inwhole-item removals than in fractional removalsbecause a smaller number of whole-item removals isrequired to reach the diversion goal.
Items are called defects if they contain eithermore or less SNM than the amount stated by theoperator. Relatively large item defect-s that aredetectable on a go-no-go basis are referred to asattributes defects. The go-no-go measurement iscalled an attributes measurement. Attributessampling consists of statistical sampling plans andthe associated measurements designed to detect at-tributes defects. Similarly, variables sampling isdesigned to detect relatively small item defects,referred to as variables defects, using quantitative(assay-type) measurements. In the sequel, wedescribe a combined attributes and variables sam-pling scheme ‘-’ applicable to verification of fuel in-
ventories in large critical facilities.A numerical example of the fuel-inventory
verification in a fictitious critical assembly il-lustrates the application. We assume that theassembly loading consists of similar fuel drawers,each containing the same number and types of f%elplates, and that the arrangement of the fuel platesand diluent materials is the same in each drawer.The inspection team regards each fuel drawer as anitem, and, in this idealized example, all the fueldrawers are lumped into a single class.
The operator’s inventory record indicates that thepopulation of fuel drawers in the reactor is N =1000. The matrix location of each drawer isspecified. Based on the fuel manufacturer’s originalassay data, the operator states that the averageamount of SNM in each drawer is A = 1 kg and thatthe variation from drawer to drawer in the amount
D-I

of SNM is a~ = + lYo. This variation is due to non-uniformities in manufacturing the fuel plates. Thus,the total SNM inventory to be verified is Nk = 1000kg, and the inspection strategy is designed to verifythis total inventory by examining the operator’svalues N, go, and co.
II. THE ATTRIBUTES LIMIT
An overlap region exists between what is to be
considered a large (attributes) defect and what is asmall (variables) defect. Clearly, this separation de-pends on the sensitivity of the verification measure-ments. An attributes defect discovered in a singleitem may be sufficient cause to reject the inventory.This imposes a severe penalty on the facility,
perhaps requiring shutdown and complete physicalinventory. Therefore, a sharp boundary, called theattributes limit (-y), is established between at-tributes and variables defects; that is, attributesdefects are those ~y~, whereas variables defectsare those < -yAO.The attributes limit is set at a levelsufficiently high that the probability of misidentify-ing an item as an attributes defect is essentially zero(go-no-go measurement). The value of 7 is usually~~o, where g is the standard deviation of a single
measurement.For example, consider the case in which an NDA
instrument is used to verify the quantity of SNM infuel drawers. A one-point calibration of this instru-ment is performed using mockup drawers as calibra-tion standards representative of the reactor loading.The actual (but unknown) mass of SNM to bemeasured in a particular fuel drawer is M. The pop-ulation of SNM in fuel drawers is assumed to be dis-tributed normally with mean w and relative stan-dard deviation (RSD) a~, Then M can be written as
M=lJ(l+ ~), (D-1)
where 6 is a zero-mean, Gaussian random variablewith RSD ah4.
Likewise, the measured value m can be written as
m=M(l+c+~)~ (D-2)
where c is the relative random error of measurementintroduced by the measurement imprecision and q isa relative systematic error introduced primarily bythe inaccuracy of calibration. It is assumed that cand q are both zero-mean, Gaussian randomvariables with RSDS a, and av, respectively.8 Com-bining the population and measurement models
[Eqs. (D-1) and (D-2)] gives, to first order in smallquantities,
m=p(l+d+c+ n), (D-3)
where the RSD of a single measurement is
um
= (u: + 0: + U;)liz . (D-4)
In our example, the following values are es-
timated for the RSDS: a~ = 17., a, = 2%, andaV = l%. The RSD of a single drawer measurementis am = 2.4%, and a reasonable choice for the at-tributes limit is ~ = 10%. Therefore, if a measure-ment indicates that the amount of SNM in a reactorfuel drawer differs by more than 10% from thenominal 1-kg amount, that drawer is an attributesdefect. On the other hand, if all measured dif-ferences are found to be <10%, the drawer measure-ments are analyzed collectively to decide if thesesmall differences are significant variables defects orare merely the result of expected random fluctua-tions. Note that we are assuming implicitly that thesame NDA instrument is used to look for both at-tributes and variables defects, but this need not bethe case.
III. ATTRIBUTES SAMPLING
A. Sampling Distributions
Consider a population of N items of which D aredefects. The ratio F = D/N is called the defectivefraction. A sample of n items is selected at randomfrom the population. The probability P(d/n) thatthe sample of size n contains a number d of the D
D-2
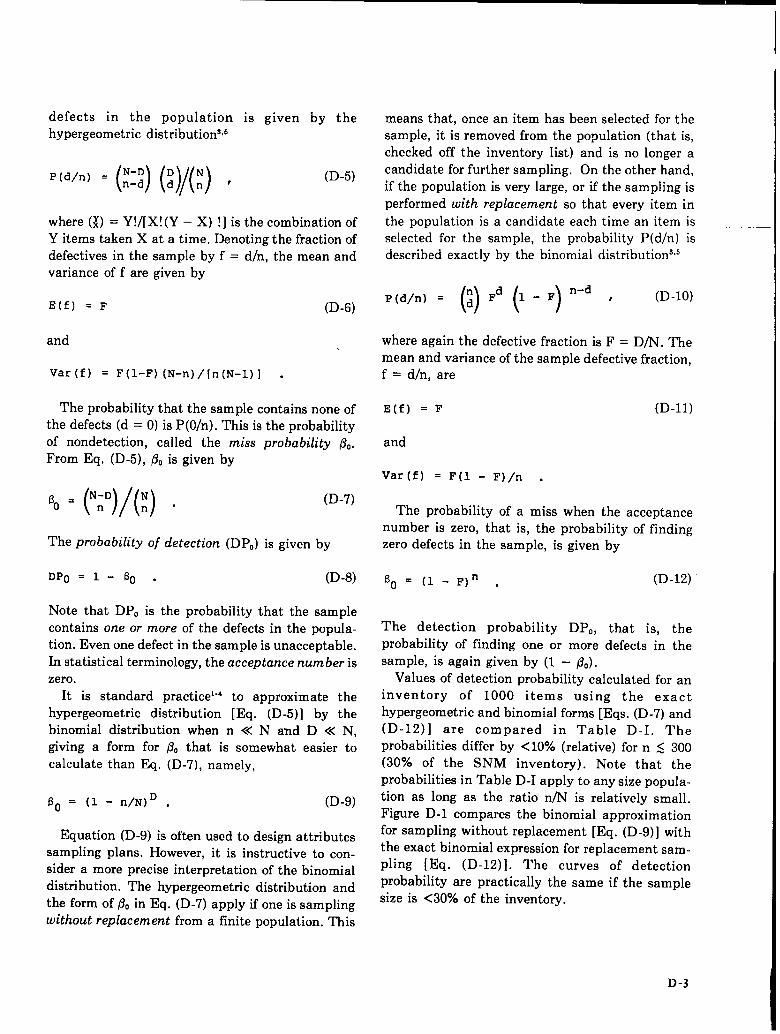
defects in the populationhypergeometric distribution’”
P(d/n) =(:::) (:y(:) r
is given by the
(D-5)
where (1) = Y!/[X! (Y – X) !] is the combination ofY items taken X at a time. Denoting the fraction ofdefective in the sample by f = din, the mean andvariance of f are given by
E(f) = F (D-6)
and .
Var (f) = F(l-F) (N-n) /[n(N-1)] .
The probability that the sample contains none ofthe defects (d = O) is P(O/n). This is the probabilityof nondetection, called the miss probability &.From Eq, (D-5), POis given by
,, = (y)/(q . (D-7)
The probability of detection (DPO) is given by
DPO= l-60. (D-8)
Note that DPO is the probability that the samplecontains one or more of the defects in the popula-tion. Even one defect in the sample is unacceptable.In statistical terminology, the acceptance number iszero.
It is standard practice’-’ to approximate thehypergeometric distribution [Eq. (D-5)] by thebinomial distribution when n << N and D << N,giving a form for /3, that is somewhat easier tocalculate than Eq. (D-7), namely,
60 = (1 - n/N)D . (D-9)
Equation (D-9) is often used to design attributessampling plans. However, it is instructive to con-sider a more precise interpretation of the binomialdistribution. The hypergeometric distribution andthe form of@, in Eq. (D-7) apply if one is samplingwithout replacement from a finite population. This
means that, once an item has been selected for thesample, it is removed from the population (that is,checked off the inventory list) and is no longer acandidate for further sampling. On the other hand,if the population is very large, or if the sampling isperformed with replacement so that every item in
the population is a candidate each time an item isselected for the sample, the probability P(d/n) isdescribed exactly by the binomial distributions”s
P(d/n) =N ‘d (1 - ‘) ‘-d ‘ ‘D-lO)
where again the defective fraction is F = D/N. Themean and variance of the sample defective fraction,f = d/n, are
E(f) = F (D-n)
and
Var (f) = F(l - F)/n .
The probability of a miss when the acceptancenumber is zero, that is, the probability of findingzero defects in the sample, is given by
~o ‘(1-F)* . (D-12)
The detection probability DPO, that is, the
probability of finding one or more defects in thesample, is again given by (1 – (3.).
Values of detection probability calculated for aninventory of 1000 items using the exacthypergeometric and binomial forms [Eqs. (D-7) and(D-12)] are compared in Table D-I. Theprobabilities differ by <10% (relative) for n S 300(30% of the SNM inventory). Note that theprobabilities in Table D-I apply to any size popula-tion as long as the ratio n/N is relatively small.Figure D-1 compares the binomial approximationfor sampling without replacement [Eq. (D-9)] withthe exact binomial expression for replacement sam-
pling [Eq. (D-12)]. The curves of detectionprobability are practically the same if the samplesize is <30~o of the inventory.
D-3

TABLE D-I
c0.—+val
E
1.0
0.8
0.6
0.4
0.2
0.0
PROBABILITY THAT A SAMPLE OF SIZE n WILL INCLUDE AT LEASTONE OUT OF D DEFECTS IN A POPULATION OF 1000
Sample Number of Defects, D
Size, Hypergeometric Distribution Binomial Distribution
n 1 2 5 10 1 2 5 10— —— — —— —
50 0.05 0.10 0.23 0.40 0.05 0.095 0.22 0.39100 0.10 0.19 0.42 0.68 0.095 0.18 0.39 0.63150 0.15 0.28 0.56 0.80 0.14 0.26 0.53 0.78200 0.20 0.36 0.68 0.91 0.18 0.33 0.63 0.87300 0.30 0.51 0.84 0.98 0.26 0.45 0.78 0.95400 0.40 0.64 0.93 1.00’ 0.33 0.55 0.865 0.98500 0.50 0.75 0.97 1.00 0.39 0.63 0.92 0.99600 0.60 0.84 0.99 1.00 0.45 0.70 0.95 1.00”800 0.80 0.96 1.00” 1.00 0.55 0.80 0.98 1.00
1000 1.00 1.00 l.OO 1.00 0.63 0.86 0.99 1.00
‘Probabilities >0.995 have been rounded to 1.00.
— With Replacement
Without Replacement
, , 1“0.00 o~02 0:04 0:06 0:08 0:10
Defective Fraction
Fig. D-1.Probability of detecting attributes defects forfour sample sizes; N = 1000, acceptance num-ber = O.
B. Attributes Sampling Plan
Consider the case in which the reactor inventoryis routinely sampled for verification. Ea;h n-sizesample is drawn without replacement, but it isreturned to the population before the nextscheduled sampling verification. We want toanalyze each sample for diversion and also to com-bine successive samples for analysis. This procedure
is justified if changes in the reactor inventory duringnormal operation are relatively small.
These considerations suggest the concept of amixed sampling plan in which items in each sampleare drawn without replacement, but samples fromsuccessive periods are combined with replacement.”It is easy to show that the miss probability ~, for themixed sampling plan is
(D-13)
where n is the size of each sample, q is the number ofsuccessive samples to be combined, and D is thenumber of attributes defects initially in the popula-tion. The total number of items sampled in qperiods is just qn.
Values of detection probability calculated usingthe hypergeometric form [Eq. (D-13)] differ by 1%or less (absolute) from corresponding values ob-tained using the binomial form [Eq. (D-12)] forreplacement sampling, at least over the parameterranges given in Table D-I. Therefore, using thebinomial form in Eq. (D-12) to compute samplesizes for routine attributes sampling guarantees thatthe samples are the same size as (or slightly larger
D -4
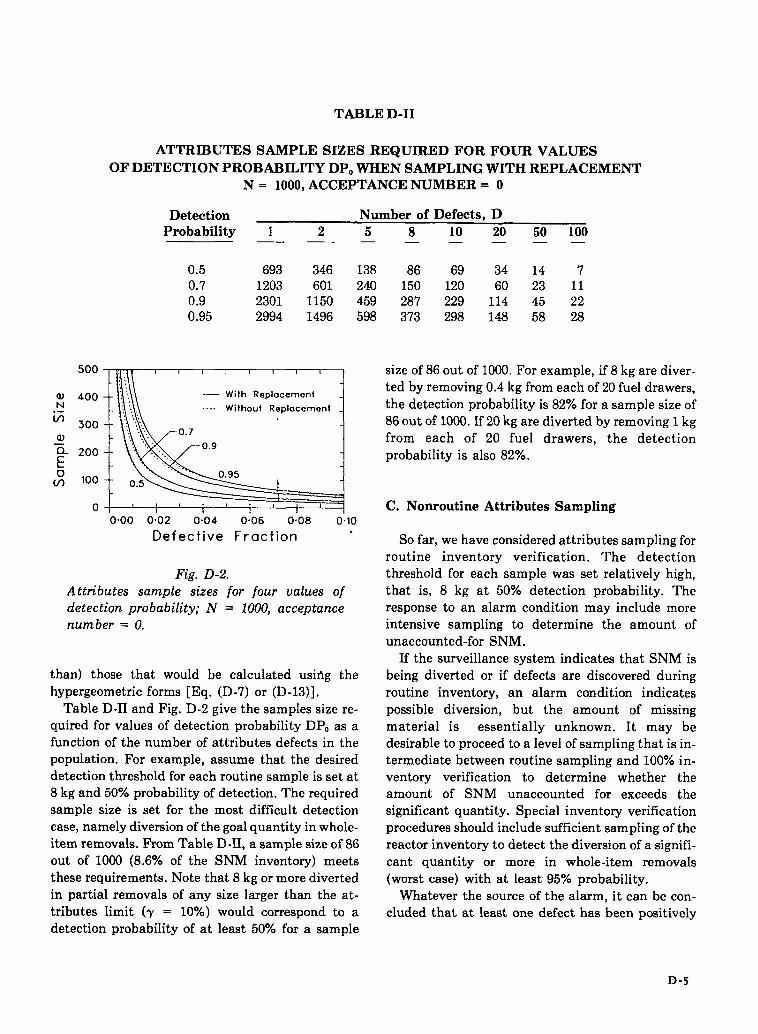
TABLE D-II
ATTRIBUTES SAMPLE SIZES REQUIRED FOR FOUR VALUES
OF DETECTION PROBABILITY DPO WHEN SAMPLING WITH REPLACEMENT
N = 1000, ACCEPTANCE NUMBER= O
Detection Number of Defects, DProbability 1 2 5 8 10 20 50 100—. —— . . _
0.5 693 346 138 86 69 34 14 70.7 1203 601 240 150 120 60 23 110.9 2301 1150 459 287 229 114 45 220.95 2994 1496 598 373 298 148 58 28
,!, , ,
With Replacement
Without Replacement
500-
N
z
(v
E: 100- - 0.5
0 , , ! , , , 11 , 4‘0.00 0;02 0:04 0:06 0:08 o~lo
Defective Fraction “
Fig. D-2.Attributes sample sizes for four values ofdetection probability; N = 1000, acceptancenumber = O.
than) those that would be calculated usifig thehypergeometric forms [Eq. (D-7) or (D-13)].
Table D-II and Fig. D-2 give the samples size re-quired for values of detection probability DPO as afunction of the number of attributes defects in thepopulation. For example, assume that the desireddetection threshold for each routine sample is set at8 kg and 50% probability of detection. The requiredsample size is set for the most difficult detectioncase, namely diversion of the goal quantity in whole-item removals. From Table D-II, a sample size of 86out of 10W (8.6% of the SNM inventory) meetsthese requirements. Note that 8 kg or more divertedin partial removals of any size larger than the at-tributes limit (~ = 10%) would correspond to adetection probability of at least 50% for a sample
size of 86 out of 1000. For example, if 8 kg are diver-ted by removing 0.4 kg from each of 20 fuel drawers,the detection probability is 82% for a sample size of86 out of 1000. If 20 kg are diverted by removing 1 kg
from each of 20 fuel drawers, the detectionprobability is also 82Y0.
C. Nonroutine Attributes Sampling
So far, we have considered attributes sampling forroutine inventory verification. The detectionthreshold for each sample was set relatively high,that is, 8 kg at 50% detection probability. Theresponse to an alarm condition may include moreintensive sampling to determine the amount ofunaccounted-for SNM,
If the surveillance system indicates that SNM isbeing diverted or if defects are discovered duringroutine inventory, an alarm condition indicatespossible diversion, but the amount of missingmaterial is essentially unknown. It may bedesirable to proceed to a level of sampling that is in-termediate between routine sampling and 100% in-ventory verification to determine whether theamount of SNM unaccounted for exceeds thesignificant quantity. Special inventory verificationprocedures should include sufficient sampling of thereactor inventory to detect the diversion of a signifi-cant quantity or more in whole-item removals(worst case) with at least 95% probability.
Whatever the source of the alarm, it can be con-cluded that at least one defect has been positively
D-5

identified already, and additional sampling is re-quired to search for more defects. In statistical sam-pling, we “accept” a single defect and look for ad-ditional defects before rejecting the inventory. Thesample size required for this intermediate level ofsampling depends on the probability that a sampleof size n will contain two or more defects; that is, theacceptance number equals one in this case. Thisprobability is given by
DPl=l-!31, (D-14)
where (31 = P(O/n) + P(l/n) is the probability of amiss; that is, the probability that a sample of size nwill contain either O or 1 defects.
From the binomial distribution for sampling withreplacement [Eq. (D-1O)], (3Iis readily found to be
81= (l-F)n [l+nF/(l -F)] . (D-15)
Jaechg gives the following approximate & form forsampling without replacement,
61 (1 - n/N)D [1 + nD/(N-D-n) ] . (D-16)
Curves of detection probability DP, are compared inFigs. D-3 and D-4 for sampling with and withoutreplacement. Tables D-III and D-IV give the samplesizes required for values of DPI when sampling froma population of 1000 items, respectively, with andwithout replacement.
c0.—+ua)
A’
1.0
0.8
0.6
0.4
0.2
0.0
— With Replacement
---- Without Replacement
10.00 0.02 0.04 0.06 0.08 0.10
Defective Fraction
Fig. D-3.I+obability of detecting attributes defects forvarious sample sizes; N = 1000, acceptancenumber = 1.
500 \ r 1 I 1 1 1 I 1 1J
N . Without Replacement.—
a)
: 100- -
0 [ I I I
0.00 0.02 0.04 0.06 0.08 0.10
Defective Fraction
Fig. D-4.Attributes sample sizes for four values ofdetection probability; N = 1000, acceptancenumber = 1.
For example, if an attributes defect is discoveredduring routine sampling and it is desired to deter-mine if 8 kg or more are missing from the reactorwith at least $ls~. probability, the required samplesize is 592 out of 1000 (59.2Y0 of the SNM inventory)when sampling with replacement and 472 out of1000 (47.2% of the inventory) when samplingwithout replacement. If an additional attributesdefect is discovered, the inspection team mustpresume that a relatively large quantity of SNM ismissing, and it then will complete the inventory. Ifanother defect is not found, there is strong evidencethat less than the significant quantity is missingfrom the reactor inventory.
IV. VARIABLES SAMPLING
Data analysis methods are described here for thedetection of relatively small, variables defects. Theemphasis is on application of standard statisticalmethods to the verification of inventories in largecritical facilities. Details of the statistical methodsare given in Refs. 2-5 and 7-11.
Each item defect is assumed to be sufficientlysmall that it is masked by the intrinsic uncertaintyin a single verification measurement. Thus, thebasic problem is to analyze collectively the assay-type measurements made on a statistical sample ofitems to decide whether a significant shift has oc-curred in the inventory.
D-6

TABLE D-III
ATI’RIBUTES SAMPLE SIZES REQUIRED FOR FOUR VALUES OFDETECTION PROBABILITY DP, WHEN SAMPLING WITH REPLACEMENT
N = 1000, ACCEPTANCE NUMBER= 1
Detection Number of Defects, DProbability 2 5 8 10 20 50 100—. __ __ _
0.5 839 336 210 168 84 34 170.7 1219 488 305 244 122 49 240.9 1944 777 485 388 193 77 380.95 2371 947 592 473 236 93 46
TABLE D-IV
A’ITRIBUTES SAMPLE SIZES REQUIRED FOR FOUR VALUES OFDETECTION PROBABILITY DP, WHEN SAMPLING WITHOUT REPLACEMENT
N = 1000, ACCEPTANCE NUMBER= 1
DetectionProbability
0.50.70.90.95
A. Sampling Error
2 5——
709 315838 424950 585976 659
Number of Defects, D8 10 20 50 100
—— —— .
203 164 84 35 18280 22a 119 50 25408 338 182 77 39472 396 218 93 48
A fundamental assumption concerning statisticalinferences made about population parameters (forexample, the mean and variance) from measure-ments made on a sample is that the sample isrepresentative of the population. Whether thisassumption is true depends on the samplingprocedure and the homogeneity of the population. Ifthe sample is not truly representative, estimates ofpopulation parameters based solely on samplemeasurements will be in error. This sampling erroris separate from the intrinsic errors of measurement,and all variables analysis techniques are degradedby it.
For variables sampling the greatest in-homogeneity in the inventory that need be con-sidered occurs when a significant quantity of SNMis diverted in removals at or just below the at-
tributes limit y; that is, a diversion strategy that at-tempts to attain a significant quantity of SNM inremovals of size -y will introduce the smallest num-ber of variables defects into the inventory and,hence, will produce the greatest inhomogeneity. Any
strategy of removals smaller than -y must introducemore defects into the inventory, making it relativelymore homogeneous. Note that the smaller ~ is, themore homogeneous the population will be for asignificant diverson in y-size removals.
The probability that a sample of size n will con-tain one or more defects is given by Eq. (D-12) forreplacement sampling. Table D-V shows the depen-dence of this probability on the parameters y and nfor a diversion of 8 kg in ~-size removals from an in-ventory of 1000 items each containing 1 kg of SNM.For example, the probability is >0.999 that a sam-ple of 86 out of 1000 will contain one or more defectsif 8 kg have been diverted in O.1-kg (lOOA)removals.
D-7
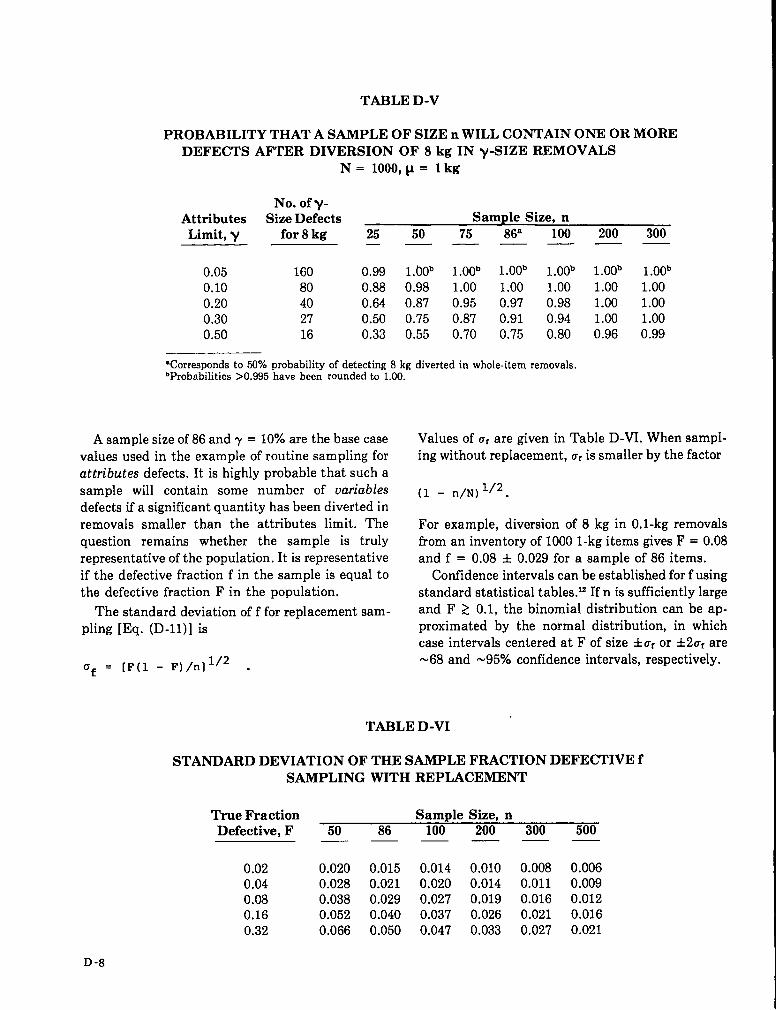
TABLE D-V
PROBABILITY THAT A SAMPLE OF SIZE n WILL CONTAIN ONE OR MOREDEFECTS AFTER DIVERSION OF 8 kg IN Y-SIZE REMOVALS
N= 1000, ~= lkg
No. ofy -Attributes Size Defects Sample Size, n
Limit, y for 8 kg 25 50 75 86’ 100 200 300—— —— —— —
0.05 160 0.99 l.oob 1.Oob l.oob l.oob 1.Oob 1.Oob0.10 80 0.88 0.98 1.00 1.00 1.00 1.00 1.000.20 40 0.64 0.87 0.95 0.97 0.98 1.00 1.000.30 27 0.50 0.75 0.87 0.91 0.94 1.00 1.000.50 16 0.33 0.55 0.70 0.75 0.80 0.96 0.99
“Corresponds to 50% probability of detecting 8 kg diverted in whole-item removals.bProbabilities >0.895 have been rounded to 1.00.
A sample size of 86 and -y = 10% are the base casevalues used in the example of routine sampling forattributes defects. It is highly probable that such asample will contain some number of variablesdefects if a significant quantity has been diverted inremovals smaller than the attributes limit. Thequestion remains whether the sample is trulyrepresentative of the population. It is representativeif the defective fraction f in the sample is equal tothe defective fraction F in the population.
The standard deviation off for replacement sam-pling [Eq. (D-n)] is
‘f =[F(l - F)/n] l/2 .
Values of a, are given in Table D-VI. When sampl-ing without replacement, ar is smaller by the factor
(1 - n/N) 1/2.
For example, diversion of 8 kg in O.1-kg removalsfrom an inventory of 1000 l-kg items gives F = 0.08and f = 0.08 A 0.029 for a sample of 86 items.
Confidence intervals can be established for f usingstandard statistical tables.lz If n is sufficiently largeand F z 0.1, the binomial distribution can be ap-proximated by the normal distribution, in whichcase intervals centered at F of size &UCor *2ur are-68 and -95% confidence intervals, respectively.
TABLE D-VI
STANDARD DEVIATION OF THE SAMPLE FRACTION DEFECTIVE fSAMPLING WITH REPLACEMENT
True FractionDefective, F
0.020.040.080.160.32
D -8
Sample Size, n50 86 100 200 300 500
—. —— —
0.020 0.015 0.014 0.010 0.008 0.0060.028 0.021 0.020 0.014 0.011 0.0090.038 0.029 0.027 0.019 0.016 0.0120.052 0.040 0.037 0.026 0.021 0.0160.066 0.050 0.047 0.033 0.027 0.021
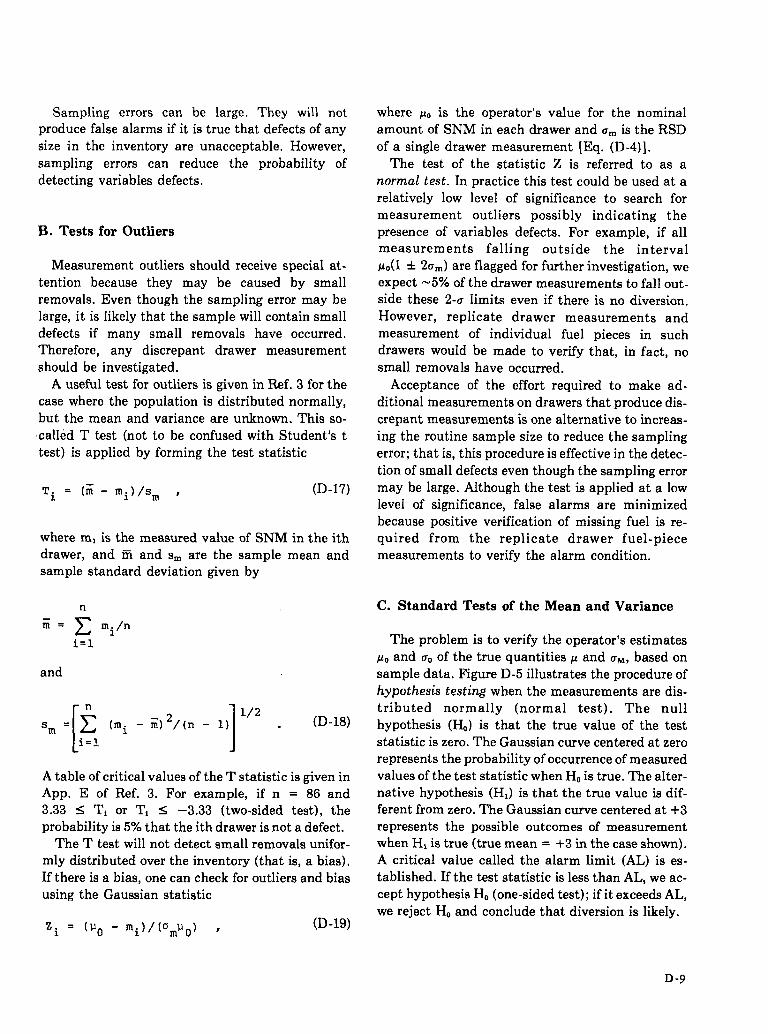
Sampling errors can be large. They will notproduce false alarms if it is true that defects of any
size in the inventory are unacceptable. However,sampling errors can reduce the probability ofdetecting variables defects.
B. Tests for Outliers
Measurement outliers should receive special at-tention because they may be caused by smallremovals. Even though the sampling error may belarge, it is likely that the sample will contain smalldefects if many small removals have occurred.Therefore, any discrepant drawer measurementshould be investigated.
A useful test for outliers is given in Ref. 3 for thecase where the population is distributed normally,but the mean and variance are unknown. This so-called T test (not to be confused with Student’s ttest) is applied by forming the test statistic
Ti = (; - mi)/sm , (D-17)
where ml is the measured value of SNM in the ithdrawer, and ~ and s~ are the sample mean andsample standard deviation given by
and
[ 1Sm = f (mi - iii)2/(.- 1) 1’2. (D-18)i=l
A table of critical values of the T statistic is given inApp. E of Ref. 3. For example, if n = 86 and3.33 5 T, or T1 < –3.33 (two-sided test), theprobability is 5% that the ith drawer is not a defect.
The T test will not detect small removals unifor-mly distributed over the inventory (that is, a bias),If there is a bias, one can check for outliers and biasusing the Gaussian statistic
Zi = (P. - mi)/(om?J~) J(D-19)
where ~0 is the operator’s value for the nominalamount of SNM in each drawer and u~ is the RSDof a single drawer measurement [Eq. (D-4)].
The test of the statistic Z is referred to as a
normal test. In practice this test could be used at arelatively low level of significance to search formeasurement outliers possibly indicating thepresence of variables defects. For example, if allmeasurements falling outside the interval
KO(l + z~m) are flagged for further investigation, weexpect -5Y0 of the drawer measurements to fall out-side these 2-u limits even if there is no diversion.However, replicate drawer measurements andmeasurement of individual fuel pieces in suchdrawers would be made to verify that, in fact, nosmall removals have occurred.
Acceptance of the effort required to make ad-ditional measurements on drawers that produce dis-crepant measurements is one alternative to increas-ing the routine sample size to reduce the samplingerror; that is, this procedure is effective in the detec-tion of small defects even though the sampling errormay be large. Although the test is applied at a lowlevel of significance, false alarms are minimizedbecause positive verification of missing fuel is re-quired from the replicate drawer fuel-piecemeasurements to verify the alarm condition.
C. Standard Tests of the Mean and Variance
The problem is to verify the operator’s estimatesPOand a. of the true quantities p and n~, based onsample data. Figure D-5 illustrates the procedure ofhypothesis testing when the measurements are dis-tributed normally (normal test). The nullhypothesis (~) is that the true value of the teststatistic is zero. The Gaussian curve centered at zerorepresents the probability of occurrence of measuredvalues of the test statistic when HOis true. The alter-native hypothesis (HJ is that the true value is dif-ferent from zero. The Gaussian curve centered at +3represents the possible outcomes of measurementwhen Hi is true (true mean = +3 in the case shown).A critical value called the alarm limit (AL) is es-tablished. If the test statistic is less than AL, we ac-cept hypothesis ~ (one-sided test); if it exceeds AL,we reject ~ and conclude that diversion is likely.
D -9

0“5
0“4
L3
0“2
0“1
–3 –2 –1
HO AL
x
MP
12
H,
\
FAP
/
~1
456
Deviation, Sigma Units
Fig. D-5.
Probability of occurrence of measured valuesfor hypotheses H, and H,.
If the measurement distributions for H, and H,are widely separated, the probability of a wrongdecision is very small. That is the case of go-no-go(attributes) measurement. If the difference isrelatively small, the distributions overlap ap-preciably and two types of incorrect decisions maybe made. We may conclude that there is diversionwhen, in fact, there ia none. This is referred to as anerror of type I. The probability of a type I error,
usually denoted by a, corresponds to the shadedarea in Fig. D-5 labelled FAP for “false alarmprobability. ” The other incorrect decision ia to con-clude that there is no diversion when, in fact, thereis. This is called an error of type II. The probabilityof a type II error, usually denoted by P, correspondsto the shaded area in the figure labelled MP for“miss probability. ”
The central problem in detection is to minimizethe value of/3 for an acceptable value of a. FigureD-6 shows the dependence of a on alarm limit for aone-sided normal test. Values of a for a two-sidedtest are just twice those shown. The value of a is of-ten called the level of significance of the test. Thepower of the testis the probability of detection (1 –f?). Figure D-7 shows the power of a normal test as afunction of the test statistic for several choices ofthe alarm limit, that is, at various levels ofsignificance. For example, if the alarm limit is set at2 u, the significance of a two-sided test is -5Y0. Ifdiversion occurs at the 2-u level, the corresponding
+.—=
z
0.5
0.4
0“3
0.2
0.1
0
N 1 1 I T 1
I I I
o 1 2 3u-
Alarm Level, Sigma Units
c0
Fig. D-6.
Dependence of the false alarm probability onthe choice of alarm limit.
1
0“5
oQ i 2 3 4 5
True Value, Sigma Units
Fig. D-7.
The power of a normal test for several choicesof alarm limit.
detection probability is 50%. Likewise, theprobability of detecting a diversion at the 4-a level is-98% .
1. !t’e8t of the Mean, u Unhnown. The standard
test in this case is Student’s t, in which the teststatistic is “e
t = (u. - m) /sm . (D-20)
The quantity S= is the standard deviation of thesample mean,
SE = sm/Ai . (D-21)
I
D-lo

The sample mean m and the sample standarddeviation s~ are given in Eq. (D-18). Values of the t-distribution are given in standard tables.’z The nor-mal approximation can be used for n P 20. For ex-ample, if n = 86 and the alarm limits of a two-sidedtests are +2 s=, the significance level of the test is-5%. Common practice to minimize false alarms isto establish warning limits at +2 S= and actionlimits at +3 s~ (0.25% level of significance).
Student’s t is a test for bias. It is degraded bybiases in the measurements. One source of measure-ment bias is the inaccuracy of calibration. If calibra-tion error is known to be significant and if it can betreated as a Gaussian random variable with knownmean and standard deviation (Sec. II), the followingnormal test of the mean will perform better thanStudent’s test,
2. Te8t of the Mea& u Known. The normal testfor bias uses the Gaussian statistic
y=(po _ m/(umPo) , (D-22)
where am is the RSD of the mean. Using themeasurement model of Sec. II, G is given by
(D-23)
where ~M is the true RSD of SNM in the fueldrawers, which the operator estimates to be a,, andu, and cr. are measurement-error RSDS, which areestimated by the inspection team. For example, ifn = 86, aO= lYo, a, = 2%, and an = 1%, the estimateof uc is 1.03%. A 2-u warning limit and a 3-IJaction
limit for deviations from the operator’s estimate ofthe mean pOwould be +2.06% and +s.~~o, respec-tively.
Examination of Eq. (D-23) indicates that am =u~ (that is, the RSD of a single drawer measure-
ment) if n = 1, and U= = IJqif n is sufficiently large.Thus, the sensitivity of the normal test to small
shifts in the mean is limited by the calibration-errorRSD an. In turn, an depends on the number k ofmockup fuel drawers used as calibration standards.If calibration error is the dominant source ofmeasurement systematic error, u“ is proportional toI/@i.
Figures D-8 through D-12 illustrate the power ofthe normal test for values of the parameters u,, an,
=.—no-ao&co.—+val
“wn
10 1 1
0.8- - 0.01
0.6- -
0.4- -
0.2- -
0.00.00 0.02 0.04 0.06 0-08 0-1o
Shift in the Mean
Fig. D-8.
Power of the normal test applied to singlemeasurements (n = 1) for several values of IS,(Gn = 1%).
c0.—
1.0 t
0-8- -
0.6- -
0.4- -
0.2-
0.00.00 0-02 0.04 0.06 0.08 0.10
Shift in the Mean
Fig. D-9.
Power of the normal test applied to singlemeasurements (n = 1) for several values of tTV(IJ, = 2%).
>.-.=m
:0
c0.—+val
1.0
0.8
0.6
0.4
0.2
0-0
0.01
I I
0.00 0.02 0.04 0.06 0.08
Shift in the Mean
Fig. D-10.
Power of the normal test applied to the samplemean for several values of u, (n = 25, n. = 1Yo).
.10
D-1 1

c0.—
+0a)
i)n
1.0
0.8
0.6
0.4
0.2
0.00.00 0.02 0.04 0:06 0:08 0.10
crease the power of the test; however, increasing thesample size does reduce the sampling error.
3. Test of the Variunce. The problem is to verifythe operator’s estimate a, of r~, the variation in theSNM content of the fuel drawers. If the measure-ments are distributed normally, the standard test isthe x’ test. The test statistic is
(D-24)
Shift in the Mean
Fig. D-Il.
Power of the normal test applied to the samplemean for several values of fsq(n = 25, ~, = 2%).
1.0
0.8
0.6
0.4I
0.2
0.0
I t 1
50
0.00 0.02 0.04 0.06 0.08 0.10
Shift in the Mean
Fig. D-12.Power of the normal test applied to the samplemean for several sample sizes (c, = 29o, Uq =1%).
and n. The dependence on u~ is similar to thedependence on a,. The alarm limits are set at +2 am(significance level of -5%). The probability ofdetection is plotted as a function of the fractionalshift in the population mean (KO – y)/pO. Thecorresponding shift in the inventory is N(PO – ~).Note that when the test is applied to single drawermeasurements (n = 1) its power primarily dependson the size of the measurement-precision RSD, u,(Figs. D-8 and D-9). When the test is applied tosample measurements (n >> 1), iti power primarilydepends on the calibration-error RSD, a, (Figs. D-10 and D-n). Figure D-12 shows that the power ofthe test is limited by the size of anso that continuingto increase the sample size (n ~ 50) does not in-
The statistic C is distributed as x’ with (n – 1)
degrees of freedom. It is independent of measure-ment bias. The mean and variance of C (underhypothesis H,) are given by
E(C) =n-1 (D-25)
and
Var (C) = 2(n - 1) .
A normal approximation applies if n ~ 20.7 Critical
points in the x’ distribution are given in Ref. 12.The sensitivity of the x’ test to shifts in CMde-
pends on the relative sizes of the parameters a, anda~. The RSD (a,) of the NDA verification measure-ment very likely will be larger than aObecause thevariation in the fuel’s SNM content is limited by thefuel manufacturer’s ability to meet stringentspecifications, as verified by accurate and precisedestructive-assay measurements.
The sample variance sZ is an estimate of thequantity (a# + ~)gz, where g and u~ are the true(but unknown) mean and MD of the fuel drawercontents. The X2test is likely to be insensitive when
aM < a.; that is, operator’s estimate is too large.For example, ifg = 1 kg, a, = 1%, and u, = 2%, then
the true value of the quantity (ad + ti)gz varies onlybetween 4 x 10⁻⁴ and 5 x 10⁻⁴, for aMin the range O SuM < aO.Therefore, when applying the X2 test at areasonable level of significance (5Y0 or less), the in-spection team probably cannot reject the operator’svalue aOas being too large, especially if it is derivedfrom the fuel manufacturer’s assay data. This is nota serious limitation if the fuel manufacturer and thecritical facility operator reside in different states. If
D-I2
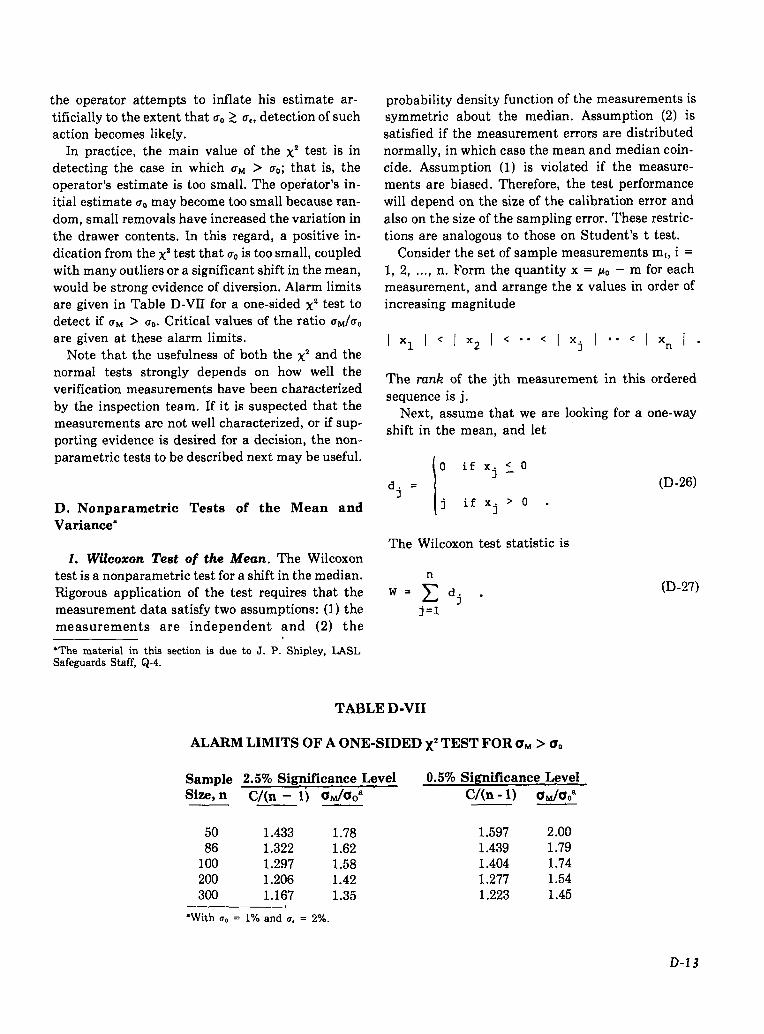
the operator attempts to inflate his estimate ar-
tificially to the extent that cr~> CJ,,detection of suchaction becomes likely.
In practice, the main value of the x’ test is indetecting the case in which cr~ > a,; that is, theoperator’s estimate is too small. The opeiator’s in-itial estimate aOmay become too small because ran-
dom, small removals have increased the variation inthe drawer contents. In this regard, a positive in-dication from the x’ test that u, is too small, coupledwith many outliers or a significant shift in the mean,would be strong evidence of diversion, Alarm limitsare given in Table D-VII for a one-sided X2 test todetect if a~ > cO. Critical values of the ratio @/~oare given at these alarm limits.
Note that the usefulness of both the # and thenormal tests strongly depends on how well theverification measurements have been characterizedby the inspection team. If it is suspected that themeasurements are not well characterized, or if sup-porting evidence is desired for a decision, the ncm-parametric tests to be described next maybe useful.
D. Nonparametric Tests of the Mean andVariance*
1. Wilcoxon Test of the Mean. The Wilcoxontest is a nonparametric test for a shift in the median.Rigorous application of the test requires that themeasurement data satisfy two assumptions: (1) themeasurements are independent and (2) the
*The material in th~ section is due to J. P. Shipley, I.ASLSafeguards Staff, Q-4.
probability density function of the measurements issymmetric about the median. Assumption (2) issatisfied if the measurement errors are distributednormally, in which case the mean and median coin-cide. Assumption (1) is violated if the measure-ments are biased. Therefore, the test performancewill depend on the size of the calibration error and
also on the size of the sampling error. These restric-tions are analogous to those on Student’s t test.
Consider the set of sample measurements m,, i =1, 2, .... n. Form the quantity x = go – m for eachmeasurement, and arrange the x values in order ofincreasing magnitude
lx11<lx21< ””<lxjl””<lxn 1.
The rank of the jth measurement in this ordered
sequence is j.Next, assume that we are looking for a one-way
shift in the mean, and let
IO ifxj~o
d. = (D-26)1
j ifx. >0.J
The Wilcoxon test statistic is
w= ~dj -j=l
TABLE D-VII
ALARM LIMITS OF A ONE-SIDED )(2TEST FOR CM > u,
Sample 2.59’o Signifkance Level 0.5% Significance LevelSize, n C/(n – 1) %JUO’ C/(n -1) utia,”— — —
50 1.433 1.78 1.597 2.0086 1.322 1.62 1.439 1.79
100 1.297 1.58 1.404 1.74200 1.206 1.42 1.277 1.54300 1.167 1.35 1.223 1.45
——— ,“With u, = l% and u, = 2%.
(D-27)
D-1 3

The mean and variance of W are given by
E(W) = n(n + 1)/4 (D-28)
and
Var (W) = n(n + 1/2) (n + 1)/12 .
A normal approximation applies if n is sufficientlylarge (n z 10) to be used to set alarm limits for thetest at desired levels of significance. For example, aone-sided test for a reduction in the mean whenn = 86 has 2- and 3-u limits of -464 and -697,respectively, and the levels of significance are *2.3and ‘uO.14~0, respectively.
A two-sided test of the mean is obtained byredefining dj,
-j ifx. <0,
d. = Oifx?=O, (D-29)1 1
+j ifxo>O.1
The corresponding levels of significance are approx-imately twice those for the one-sided test.
The simplicity of the Wilcoxon test argues for itsuse, at least as a back-up to the parametric tests ofthe mean, However, note that alarm limits set byusing the variance of W [Eq. (D-28)] will be in-correct if the measurements are correlated bysignificant errors in calibration.
2. The Kolmogorov-Smirnov Te8t of theVariance. This is a nonparametric test of the dis-tribution function (not necessarily Gaussian)postulated for the measurements. Consider the sam-ple measurements mt, i = 1, 2, .... n. Form the quan-tities x, =~ – m,. The null hypothesis m is that thex, are independent random variables described bythe cumulative normal distribution function @ with
zero mean and variance d = crt + ~. The alter-native hypothesis HI is either that the measure-ments are not distributed normally or that thevariance is not &.
The first step in applying the test is to form theempirical cumulative distribution function @n. Forany value of x in the range – CIJ< x < ~, @n(x) is thefraction of the n observations {xl} satisfying xl S x;that is
n
@n(x) = * ~ U(x - xi) ,
i=l
where
1 if(X-Xi)~O
U(x - xi) =Oif(x-xi)c O.
(D-30)
Note that On(x) is constant between observations.Thus, it need be calculated only at the n observationpoints,
n‘$n(xj) =: ~ U(xj - xi) ,
iel
(D-31)
where j = 1, 2, .... n.The test statistic is the maximum distance bet-
ween Q.(x) and @(x) at the observation points, asdefined by
1)= my p$n(xj) - ‘$(xj)l . (D-32)
Thus, to compute D, we must firat calculate thevalues of Q. and @ at all n observation points andthen find the maximum difference in absolutemagnitude. An approximate alarm limit at the alevel of significance is given by
‘a=[~ +]’” -(D-33)
For example, if n = 86, the alarm limit is -0.16 atthe 2.5~0 level of significance and ‘0.19 at the 0.5%level of significance.
In practice, the central limit theorem virtuallyguarantees that the sample measurements are dis-tributed normally if n z 20. Therefore, in the formgiven here, the test reduces to a test for shifts in thevariance analogous to the X2test. As for the X2test,if a good estimate of the measurement precisionRSD (a,) is available, the value of the test is insearching for an increase in the variation of SNMcontent (CM > Co).
D-14
V. SUMMARY
A combined attributes and variables samplingplan provides a detection capability for both largeand small removals from items in a critical-facility
inventory. Sample sizes for routine inventoryverification are set for the desired probability ofdetecting the diversion of a goal quantity of SNM inwhole-item removals. The binomial form forreplacement sampling [Eq. (D-12)] can be used tocalculate the sample size required for routine inven-tories and to combine any sequence of routine sam-ples taken during periods of normal reactor opera-tion. The sample size for a special inventory inresponse to an alarm can be calculated using theform given in Eq. (D-16) for sampling withoutreplacement when the acceptance number ia equalto 1. In case of a special inventory, the sample sizeshould be large enough to determine with aprobability >95?!. whether a significant quantity ofSNM has been diverted. This requires samplingabout 507. of the SNM inventory.
The detection of small removals from the inven-tory is complicated by the following effects: (1) sam-pling errors, especially in the relatively small sam-ples (-1OYO) proposed for routine inventory verifica-tion; (2) measurement errors, both in the precisionand accuracy of the measurement method; and (3)the intrinsic variability in the SNM content of theitems. The effect of sampling error can be circum-vented to some extent by applying the outliers andX2 tests. A battery of tests can be used to examinethe operator’s estimates of the mean and RSD, ~.and aO.These tests and comments concerning theiruse are summarized below. Additional tests that aresometimes useful, such as tests for the normality ofthe measurement data, are given in the references.A battery of such tests should be used to establishthe internal consistency of the sample data and ofthe decisions based on these data. Above all, the in-spection team must have a good working knowledgeof the instrumentation and of the proper calibrationand measurement procedures.
●Tests for Outlying Measurements. The sen-sitivity of the T test [Eq. (D-17)] is not degradedby measurement bias, but the test is not sen-sitive to uniform small removals. The sensitivityof the normal test of single measurements [Eq.
(D-19)] is degraded by measurement bias, but
some sensitivity to uniform small removals isretained. Measurement imprecision is likely to
be the dominant source of error in both tests.●Tests of the Operator’s Mean, gO. Significant
measurement bias may cause false alarms in the
Student’s t test [Eq. (D-20)] and in theWilcoxon test [Eq. (D-27)]. The sensitivity ofthe normal test of the mean [Eq. (D-22)] tosmall removals is limited by the presence ofmeasurement bias.
●Tests of the Operator’s RSD, aO.The X2test [Eq.(D-24)] and the Kolmogorov-Smirnov test [Eq.(D-32)] are primarily useful for detecting an in-crease in variability of the SNM item content.The sensitivity of both tests is limited by themeasurement imprecision.
REFERENCES
1.
2.
3.
4.
F. Brown, P. T. Good, J. B. Parker, A. E. Ross,and D. R. Terrey (UKAEA) and A. Lumetti, E.Kerr, T. Otoms, and M. Sultan (IAEA),“Progress in the Development of a System for
the Safeguards Inspection of the Fuel Store of aZero-Energy Test Reactor, ” United KingdomAtomic Energy Authority COS.20 (October1970).
C. G. Hough, R. A. Schneider, K. B. Stewart, J.L. Jaech, and C. A. Bennett, “Example ofVerification and Acceptance of Operator Data— Low Enriched Uranium Fabrication, ” Bat-telle Pacific Northwest Laboratories reportBNWL-1852 (August 1974).
J. L. Jaech, “Statistical Methods in NuclearMaterial Control, ” United States DOETechnical Information Center TID-26298(1973).
C. G. Hough and T. M. Beetle, “StatisticalMethods for the Planning of Inspections, ”LAEA-SM-201/99 in Proc. Syrnp. SafeguardingNuclear Materials, Vienna, October 1975 (Inter-national Atomic Energy Agency, 1976) Vol. Lpp. 561-580.
D-15

5. A. J. Duncan, Quality Control and IndustrialStatistics, 3rd ed. (Richard D. Erwin,Homewood, Illinois, 1965).
6. D. D. Cobb and J. L. Sapir, “Preliminary Ccm-cepts for Materials Measurement and Ac-counting in Critical Facilities, ” Los AlamosScientific Laboratory report LA-7028-MS(January 1978).
7. K. A. Brownlee, Statistical Theory andMethodology in Science and Engineering, 2nd
ed. (John Wiley & Sons, New York, 1965).
9. J. E. Lovett, Nuclear Materials Accountability,Management, Safeguards (American NuclearSociety, 1974).
10. M. L. Puri and P. K. Sen, NonparametricMethods in Multivariate Analysis (John Wiley& Sons, New York, 1971).
11. J. D. Gibson and J. L. Melsa, Introduction toNonparametric Detection with Applications
(Academic Press, New York, 1975).
12. A Hald, Statistical Tables and Formulas (JohnWiley & Sons, New York, 1952).
8. B. E. Cooper, Statistics for Experimentalists(Pergamon Press, Oxford, 1969).
D-16
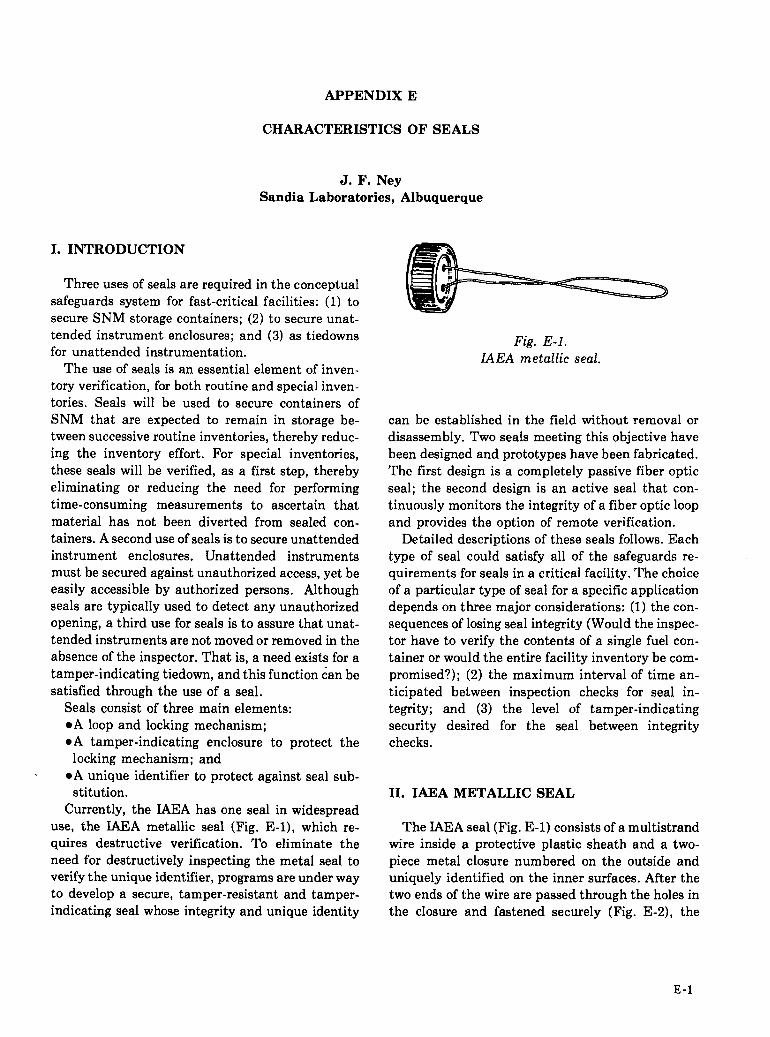
APPENDIX E
CHARACTERISTICS OF SEALS
J. F. NeySandia Laboratories, Albuquerque
I. INTRODUCTION
Three uses of seals are required in the conceptualsafeguards system for fast-critical facilities: (1) tosecure SNM storage containers; (2) to secure unat-tended instrument enclosures; and (3) as tiedownsfor unattended instrumentation.
The use of seals is an essential element of inven-tory verification, for both routine and special inven-tories. Seals will be used to secure containers ofSNM that are expected to remain in storage be-tween successive routine inventories, thereby reduc-ing the inventory effort. For special inventories,these seals will be verified, as a first step, therebyeliminating or reducing the need for performingtime-consuming measurements to ascertain thatmaterial has not been diverted from sealed con-tainers. A second use of seals is to secure unattended
instrument enclosures. Unattended instrumentsmust be secured against unauthorized access, yet beeasily accessible by authorized persons. Althoughseals are typically used to detect any unauthorizedopening, a third use for seals is to assure that unat-tended instruments are not moved or removed in theabsence of the inspector. That is, a need exists for atamper-indicating tiedown, and this function ;an besatisfied through the use of a seal.
Seals consist of three main elements:.A loop and locking mechanism;●A tamper-indicating enclosure to protect the
locking mechanism; and● A unique identifier to protect against seal sub-
stitution.Currently, the IAEA has one seal in widespread
use, the IAEA metallic seal (Fig. E-1), which re-quires destructive veriilcation. To eliminate theneed for destructively inspecting the metal seal toverify the unique identifier, programs are under wayto develop a secure, tamper-resistant and tamper-indicating seal whose integrity and unique identity
Fig. E-1.IAEA metallic seal.
can be established in the field without removal ordisassembly. Two seals meeting this objective havebeen designed and prototypes have been fabricated.The first design is a completely passive fiber opticseal; the second design is an active seal that con-tinuously monitors the integrity of a fiber optic loopand provides the option of remote verification.
Detailed descriptions of these seals follows. Eachtype of seal could satisfy all of the safeguards re-quirements for seals in a critical facility. The choiceof a particular type of seal for a specific applicationdepends on three major considerations: (1) the con-sequences of losing seal integrity (Would the inspec-tor have to verify the contents of a single fuel con-tainer or would the entire facility inventory be com-promised?); (2) the maximum interval of time an-ticipated between inspection checks for seal in-tegrity; and (3) the level of tamper-indicatingsecurity desired for the seal between integritychecks.
II. IAEA METALLIC SEAL
The IAEA seal (Fig. E-1) consists of a multistrandwire inside a protective plastic sheath and a two-piece metal closure numbered on the outside anduniquely identified on the inner surfaces. After thetwo ends of the wire are passed through the holes inthe closure and fastened securely (Fig. E-2), the
E-1

Fig. E-2.LIEA seal before closure.
closure halves are snapped together in an interlock-ing way. To verify the seal, it must be removed andopened at IAEA Headquarters. The connection ofthe wire is verified and the identification marks arecompared with the original records.
The top part of the closure is made of coppersheet, formed in the shape of a cylindrical cup (20.5mm in diameter and 7.4 mm high). The rim of thecup is folded inward and the teeth of the crown onthe bottom part catch on this folded rim when theseal is closed. The top is imprinted with the initialsIAEA and a serial number is imprinted on the out-side of the flat part.
The bottom part of the closure is formed by crim-ping an outer “shell” to an inner “crown.” The crownmaterial varies; it is brass in IAEA seals and steel inUS IRS seals. The shell is made of brass, formed inthe shape of a cylindrical cup 7.5 mm high and 21.8mm in diameter. The dished shell bottom haa two1.5-mm holes near the center. These holes havesharp edges pointing inward. The securing wirepasses through these holes.
Once the seal is applied, it is extremely difficultto open without breaking it. However, it is very sim-ple to remove an IAEA seal and replace it withanother seal that looks similar to the original one.To rule out this possibility, each IAEA seal bearsunique identification marks on the inside. Thesemarks are recorded by microphotography at IAEAHeadquarters before the seals are issued and theyare checked, also at Headquarters, when the sealsare brought back from the facility by an inspector.
Installation consists of looping the wire throughwhatever is to be secured, passing it through the twoholes in the seal, and tying a secure knot. Then thetwo halves of the closure are snapped together to en-close the knot. Care is taken to see that the length ofthe loop is not too long or too short and that the knotdoes not open easily or slip through the holes.
On a return visit to the facility, the inspector ex-amines the outside of the seal to see if it has beenmaintained. He also checks the integrity of the
serial number and for any possible contamination ofthe seal. If the seal shows no signs of tampering, theinspector cuts the wire, removes the seal, and in-stalls a new seal.
The seal is opened at Headquarters. The knot isexamined to see if it has remained intact, and thecomponent parts of the seal, especially the uniquemarks engraved on the inside of the seal, are re-examined with a microscope and are compared withthe photographic record.
III. PASSIVE FIBER OPTIC SEAL
The passive fiber optic seal (Fig. E-3) depends onthe optical continuity of a glass fiber optic bundle,consisting of -200 individual fibers, to insure the in-tegrity of the seal loop. The loop is closed in a plastichousing that captures the ends of the fibers whenthe seal is assembled and insures that the relativeposition of each glass fiber end does not change.
Fib.r.op)ic light GUido
g A~SomblyBlock
Fig. E-3.
Passive fiber optic seal.
E-2

The optical integrity and continuity of the fibersin the bundle of the seal loop are checked afterassembly by noting the transmission of lightthrough the fibers. The unique identity or “finger-print” of the seal is established, when the seal isassembled in the field, by illuminating part of thefiber bundle to produce a random pattern of darkand illuminated fibers at the bundle’s opposite end.The pattern is photographed with a portable, hand-held photomicrographic instrument. A direct com-parison of a negative made when the seal is assem-bled with a positive print made when the seal’s in-tegrity is being checked can provide a high level ofconfidence that a seal left unattended and unex-amined for a significant interval of time has notbeen compromised. For less demanding situations,the coordinates or relative positiona of a small num-ber of fibers can be recorded for future reference.
The seal employs either commercially available orspecially prepared glass or plastic optical fiber and ametal or plastic fiber-locking assembly block (Fig.E-3). This hexagonally shaped block holds the fiberbundle securely in place to prevent accidental dis-assembly. It includes internal components that in-
sure the complete, mutual interpenetration of thefibers at the bundle end.
The internal components (Fig. E-4) of the fiber-Iocking assembly block are designed to flatten thestripped fiber bundle ends into fan-shaped arrays offibers, so that the fibers from one end of the bundlemay easily intersect and pass randomly between thefanned fibers of the other end. The ends of the fibersbeyond the intersection will now appear in the twoopenings in the exit surface of the assembly block.
In routine use, the seals would be partially assem-bled during manufacture with one end of a fiberbundle permanently installed in the assemblyblock. The plastic jacket of the free end is precut,but not stripped. To complete the seal, the free endis passed through the item to be sealed and theprecut plastic jacket is stripped. The assemblyblock then is placed in the carriage of an assemblytool, and the stripped fiber bundle is inserted intothe block. The two collets in the block are pressedinto place with the tool, completing the sealingoperation,
The identity of the seal is established in the fieldby using a small hand-held microscope and il-luminator. All of the fiber ends are illuminated ex-
Fig. E-4.Internal components of fiber-locking assemblyblock.
cept those lying directly under a reticle containingat least one opaque line whose width is approx-imately equal to, or slightly larger than, twice thediameter of the optic fibers used in the fiber bundle.This reticle can be scanned across the illuminatedend of the fiber bundle or can be positionedprecisely over a small number of fiber ends using themicrometer movement incorporated in the indexingstage of the microscope. In this manner, the light-transmitting properties of every fiber in the bundlecan be checked. In addition, the reticle in theeyepiece of the microscope can be used to measurethe coordinates of a small set of individual fibers.Combining such data obtained from a small, well-dispersed number of fibers (-5) with the seal’sserial number is one method to identify a seal uni-quely, and thus to provide reasonable assurancethat substitution or counterfeiting of a seal would bedetected. Alternatively, a photomicrograph may betaken of the random pattern formed by all the fiberends in the field of view of the microscope using aPolaroid or other type of camera. The photographicprocedure is recommended where the highest level
E-3

I
Mrnlo 20 30 40 so 60 70 80 90 100 110 120 J 140 Id
Fig. E-5.Electronic self-monitoring seal.
of confidence is required and when it must be deter-mined that a seal left unattended and unexaminedfor a significant period of time has not been com-promised.
IV. ELECTRONIC SELF-MONITORINGSEAL
The self-monitoring seal (Fig. E-5) continuouslymonitors the integrity of the sealing device (fiber op-tic bundle) and displays the status, inviolate orbroken, in a simple manner. The status can be iden-tified by observing the seal’s optical display. Theobservation can be made by an IAEA inspector, by arepresentative of the facility operator (with the ob-servation reported to the inspector), or by remoteelectronic monitoring equipment that provides thestatus information to the authority.
The self-monitoring seal displays analphanumeric character that changes with time.The correct display sequences are known only to theIAEA. The time interval between changes in theseal display is the time within which the IAEA candetermine if a seal has been violated. This time in-terval can be from 1-32 h. ,
The seal is completely self-powered and self-contained. No action is required of the facilityoperator, except possibly reading the display. Thebatteries within the seal are adequate for 500 dis-
play changes or 6 months, whichever occurs first.
The seal may be installed to secure an area towhich the facility operator might need access in averifiable emergency situation. The seal is adap-table to these applications. A capability is beingdesigned into the seal to allow one, and only one,opening and reclosing of the seal. During the timethat the seal is removed, the sequence of seal dis-plays is different from the sequence that would haveexisted if the seal had not been removed. This newsequence is based in part on the time interval duringwhich the seal was removed. When the seal isreinstalled, a new sequence is generated and this
sequence is different from the sequence that wouldhave occurred had the seal not been removed andreinstalled. Recording and reporting of thesesequences allow determination of how long the sealwas open. Removal of the seal a second time im-mediately terminates the display-sequence genera-tion. Only the IAEA can restart the generation. TheIAEA can also reprogram the seal to generate otherunique display sequences and, thus, the sealbecomes reusable.
The seal consists of two major parts: a fiber opticsloop and an electronic monitor module that verifiesthe loop’s integrity. Figure E-5 shows a completelyassembled seal; Fig. E-6 shows the seal partially dis-assembled.
The monitor module is composed of four sub-systems (Fig. E-7): the loop-integrity sensor, therandom-display generator, the tamper-respondingcontainers, and the batteries.
The loop-integrity sensor uses an optical sourceand detector to determine the continuity of the fiberoptic bundle while the module and loop are at-tached. Detection of loss of this continuity either bydetaching the module or by violating the loopresults in a change of operation of the random-display generator that identifies the seal. The firstloss of continuity after the module is attachedcauses the random-display generator to produce adifferent identification sequence of displays, uniqueto the particular seal that was “opened.” By requir-ing the facility operator to record and report the seal
display, before and after opening, the IAEA canidentify the time interval during which the seal wasopen. When the loop-integrity sensor determinesthat the module has been reattached to the closedloop, the function of the random-display generator
E-4

..-
Fig. E-6.Disassembled self-monitoring seal.
~ —____________________ .
+.
f—-
–1
i RANDOM–
I DISPLAY i
GENERATOR IBATTERY I
/
I!
LOOP - I
ITAMPER - INTEGRITY IRESPONDING SENSOR I
&~ONTAINER
‘------1 r--l r-------~
Fig. E-7.Block diagram of a self-monitoring seal.
is changed again to produce a display sequence u-nique to the seal that has been opened and reclosed.If the loop integrity sensor detects a second openingof the loop, the generation of display sequences isstopped, and the display remains fixed at its currentoutput ,
The output of the random-display generator isone of four symbols. The single-character display
was selected to minimize the amount of informationto be stored and retrieved at the verificationauthority. With four possible display outputs (C, E,
8, O), the reporting of a correct single display enablesthe IAEA to state with 75~0 probability that the sealhas not been violated. For the reporting of twocorrect displays in sequence, the probability is93.7%. The following table shows the correspondingprobability at the number of consecutive correctreadings. The use of a single alphanumeric charac-
ter also prevents reporting errors caused bytransposition of characters.
Probability That SealNumber of Consecutive Is Not Violated
Correct Reports (%)
1 75.02 93.73 98.44 99.65 99.9
The random-sequence display generator, theloop-integrity sensor, and the batteries that powerthem are enclosed within a tamper-responding con-tainer. The response of the container to any attemptto gain physical access to these subsystems is in-terruption of the electrical circuit supplying energyfrom the batteries to the other two electronic sub-systems. I.mss of the programming information inthe random-display generator results when the sup-ply of energy is interrupted. From that moment on,the generator cannot produce the correct sequenceof displays. Without the tamper-responding en-closure, an adversary could gain electrical access tothe random-display generator, determine the
programming information, and predict the futuresequence of displays. With this information, an ad-versary could delay the verification authority’sknowledge that the seal had been violated.
The normal operational cycle for the self-monitoring seal would be as follows. The random-display generator is programmed by a special circuitor a digital computer and started at IAEA Head-quarters just before deployment to the facility.IAEA inspectors attach the module to the fiber opticseal and record the installed seal location and thedisplays before and after installation. The facility
E-5

operator can read and record the display at the in- tronic modules approaching the end of their
tervals requested by the IAEA and report the infor- operational phase because of battery life or the
mation at times selected by the IAEA, During each number of display changes, are replaced with
visit by the IAEA inspector to the facility, the seal’s reprogrammed modules containing fresh batteries.
point of application and integrity (correct display After the modules are removed, they are returned to
value) are determined. During these visits, elec- Headquarters to be reprogrammed and reused.
* U.S.GOVERNMENTPRINTINGOFFICE 1979 — 678-088
E -6

—.
.
Ul,,olidw $3.(10
00142s 4.00 126.1 SO 7.?5 251.27s 10.1502643S0
376400 I 3.004.s0
sol .52s 1s.25[S1.175 H.@3 .?76.300
0s147s
1 [.00 401 42s I 3.2s S26.550 I 5.50
S.ls 176. ?00 9.00 301 -32s l\.15 4264S0 14.00 551.573 16./?S
016.100 6.00 201.225 9.X .726.350 I2.on 451475 14.50 576-600 16.S0
101.12s 6.S0 22(,.2s1) 9.s0 151..175 I ?J(l 476.s00 ls[m Ml I .!119
N,>(< Ad,! \2.$0 lor cJ.lt Adllm..l 100.Iw!c ,nwuwm Imm 601 IW!C. up.