la polar - io - final · la polar 20 may 2013 page 3 investment highlights la polar, in our view,...
TRANSCRIPT

ANALYST CERTIFICATION AND REQUIRED DISCLOSURES BEGIN ON PAGE 42 Banco BTG Pactual S.A. does and seeks to do business with companies covered in its research reports. As a result, investors should be aware that the firm may have a conflict of interest that could affect the objectivity of this report. Investors should consider this report as only a single factor in making their investment decision.
Equity Research
Rating Neutral
12m Price Target CLP218.00/US$0.45
Price CLP184.00/US$0.38
RIC: LAPOLAR.SA, BBG: NUEVAPOL CI Trading Data and Return Forecasts
52-wk range CLP416.15-165.04/US$0.82-0.35
Market cap. CLP184bn/US$382m
Shares o/s (m) 998.6
Free float 100%
Avg. daily volume('000 Shares) 1,953
Avg. daily value (CLP m) 369.5
Forecast price appreciation +18.5%
Forecast dividend yield 0.0%
Forecast stock return +18.5% Stock Performance (CLP)
Isabel Darrigrandi
Chile - BTG Pactual
+562 2490 5093
Alonso Aramburu
New York – BTG Pactual US Capital LLC
+1 646 924 2471
Fabio Monteiro
Brazil – Banco BTG Pactual S.A.
+55 11 3383 2006
0
30
60
90
120
150
0.0
500.0
1,000.0
1,500.0
2,000.0
2,500.0
3,000.0
3,500.0
4,000.0
20-M
ay-1
0
20-A
ug-1
0
20-N
ov-
10
20-F
eb-1
1
20-M
ay-1
1
20-A
ug-1
1
20-N
ov-
11
20-F
eb-1
2
20-M
ay-1
2
20-A
ug-1
2
20-N
ov-
12
20-F
eb-1
3
20-M
ay-1
3
Price Target (CLP) Stock Price (CLP) Rel. IPSA
Rising from the ashes: the new (& improved) La Polar
We are staying on the sidelines for now, initiating coverage with a neutral
We are initiating coverage on Chilean department store operator La Polar with a PT
of CLP218, which represents 19% upside to current levels. While La Polar is firmly
out of crisis mode, the retailer faces tough competition (Falabella, Paris, Ripley) and
an adverse regulatory environment. So, though we believe in the new management
team and the turnaround plan, execution risk is keeping us on the side lines, for now.
Out of bankruptcy and fully funded for growth
After a high profile credit card & accounting scandal nearly drove the company out of
business in mid-2011, La Polar’s new leadership i) raised US$280mn in equity to fund
its business plan; ii) restructured its debt (to less than half, in PV); and iii) reached an
agreement with the consumer protection agency to end its class action lawsuit.
Overhaul of proprietary brands should drive 15% SSS growth in 2013
La Polar’s new apparel & design team wasted no time in giving the retailer’s
proprietary brands a major (and much needed) face lift. Store renovations (US$40mn
in capex over two years) should also help get more customers through the door. As a
result, we expect 15% SSS growth in 2013.
New product mix & improved sourcing to boost retail gross margins by 300 bps
Management plans to improve the product mix to favor those with higher gross retail
margins: i.e. more apparel (30%-50% margins), and less electronics (15%). Within
apparel, more proprietary brands (50% margins) and less 3rd party brands (30%). La
Polar has also made mayor changes to its sourcing process, which has already
reduced direct costs for proprietary apparel brands by roughly 20%.
Quarterly results this year could be a catalyst for the stock
We value La Polar using a blended PT based on a DCF and multiples analysis.
Looking at the comps (Hites & Ripley), La Polar does not look cheap, but in our view
a 10 yr DCF better captures the full impact of the turnaround story. Execution will be
key, so hitting targets in quarterly results this year could be a catalyst for the stock.
Valuation 12/2011 12/2012 12/2013E 12/2014E 12/2015E RoIC (EBIT) % NM (10.6) (4.2) 6.8 11.8 EV/EBITDA NM (7.8) (95.0) 14.1 8.8 P/E NM 1.1 (11.5) 17.5 12.7 Net dividend yield % NM 0.0 0.0 0.0 2.6 Financials (CLPmn) 12/2011 12/2012 12/2013E 12/2014E 12/2015E Revenues NM 381,910 439,914 554,894 636,887 EBITDA NM (51,391) (3,952) 26,946 44,234 Net Income NM 187,528 (15,967) 10,520 14,442 EPS (CLP) NM 187.79 (15.99) 10.54 14.46 Net DPS (CLP) NM 0.00 0.00 0.00 4.82 Net (debt) / cash NM (193,460) (191,844) (196,782) (206,267)
Source: Company reports, Bovespa, BTG Pactual S.A. estimates. / Valuations: based on the last share price of the year; (E) based on a share price of CLP184.00, on 17 May 2013.
Chile
Retailers, Apparel
Company Note
20 May 2013
La Polar
La Polar 20 May 2013 page 2
Table of contents
Investment highlights 3
Retail sector valuation multiples 7
Investment thesis – pros 9
Investment thesis – cons 20
Valuation 23
Ownership structure 25
Company overview 26
Brief history 26
Appendix 35
The new board of directors 35
The new management team 36
Lawsuits 37
New brands 38
Example of a re-launched brand – Zibel 40
La Polar 20 May 2013 page 3
Investment highlights
La Polar, in our view, is well out of crisis mode and firmly positioned to continue
executing on its turnaround strategy. We estimate that in 2013, La Polar’s Chile
operation will once again be in positive Ebitda territory as we expect i) improvements
to the product offering and stores layouts to drive 15% SSS growth; ii) changes in the
sourcing process to increase retail gross margins by 300 bps; and iii) a gross loan
book which we expect will increase by over 25%, as the last restrictions to the credit
operation finally were lifted in late 2012. On a consolidated basis, including Colombia,
La Polar should be able to reach a 5% Ebitda margin by 2014.
When the company first went into bankruptcy in mid-2011, urgent steps needed to be
taken if La Polar was going to remain a going concern. One by one, these “to do’s”
have been checked off the list:
i) The board of directors was replaced and new management was hired;
ii) A viable business plan was developed;
iii) An agreement with creditors was reached to restructure the debt,
including a grace period to delay amortizations;
iv) Roughly US$280mn was raised in cash through a new equity offering to
finance the capex and working capital requirements in the turnaround
strategy;
v) An agreement with the Chilean consumer protection agency was
reached which capped the company’s legal liabilities, with regards to
the consumer class action lawsuit, at US$40mn.
Once the immediate crisis was addressed, La Polar was able to focus on reviving its
core business: retail sales. One of the first steps was to completely revamp the
apparel department. A professional, 25 person design team was hired, higher margin
proprietary brands were updated and reenergized, purchasing budgets were
reoriented to favor a better product mix. The sourcing process was also brought into
the 21st century, with industry standard best practices like using spec sheets, which
allows the company to not only receive comparable quotes from a larger number of
manufacturers, but also to hold the manufacturer accountable for the product
delivered.
The summer season (which just ended in March) was the first to fully capture all of
these, and other, changes. As a result, we expect La Polar to easily deliver double
digit same store sales growth in 1Q13.
Looking forward, La Polar still has a lot of low hanging fruit that it can easily pick, in
our view. Most of the company’s department stores were neglected for years under
the previous administration, so the investment plan includes roughly US$40mn to
renovate over 60% of the stores in Chile in the next two years. We think the
renovations will make a major difference in luring customers through the door. Also,
the company is no longer hamstrung by the loan caps and other restrictions the

La Polar 20 May 2013 page 4
regulators had placed on its credit card operation in Chile, so La Polar should be able
to take advantage of pent up demand from existing customers. La Polar also now has
sufficient cash, in our view, to grow its credit card customer base and loan book back
to the point where it is closer in line with the rest of the industry.
Given that La Polar is a turnaround story, the stock faces significant execution risk.
Chile has a crowded retail market with several large, world-class department store
players –including Falabella, Cencosud (Paris and Johnson) and Ripley– each with a
proven retail track record and an established credit card operation. Then there are
smaller players, such as Hites, that primarily target consumers in the lower to middle
income segments, not to mention competition from various specialty store chains, like
Forus. In the past, La Polar focused almost exclusively on low to mid income
customers. If La Polar is going to achieve the goals set forth in the “Aconcagua Plan”
(management’s target for 2014), the company needs to take at least some market
share away from these incumbent players.
Table 1: La Polar’s Chile operation – BTG Pactual forecast compared to the Aconcagua Plan
Source: La Polar. BTG Pactual.
An even bigger challenge, in our view, will be growing the credit card operation, given
the current adverse regulatory environment and the increasing competition from
banks. Most other department stores in Chile are seeing the percentage of retail
sales realized with their proprietary credit cards, contract. We do think that La Polar
has pent up demand that should fuel growth, at least initially. La Polar has the same
number of active credit cards as Hites, for example, even though La Polar has 40
stores compared to 14 for Hites.
While we do expect La Polar to grow its loan portfolio, we do not think it will likely
grow as fast as management’s plan. In fact, the biggest difference between our
forecast and the Aconcagua Plan is the credit card operation. We keep financial
revenue to roughly 20% of retail revenue while the Aconcagua Plan has financial
revenue ramping up to 30% of retail revenue by 2014. According to our estimates,
this would require more working capital (to increase credit card receivables) than
what La Polar could currently fund, unless it went back to the capital markets. If
management were to surprise to the upside on its retail operating metrics (sales
growth per square meter, retail gross margins), then the company may generate
BTG Pactual BTG Pactual Aconcagua
2012A 2013E 2014E 2014E
Retail revenue (CLP$bn) 294 338 400 437
Sales (UF)/sqm/month 6.7 7.5 8.6 10.0
Sales (USD$)/sqm/month 320 358 412 480
Retail gross margin 22% 25% 27% 30.0%
Financial revenues/retail revenues 20% 19% 19% 30.0%
(Retail + Credit SG&A)/retail revenue 40% 34% 31% 30%
Provision/gross loans 12% 12% 12% 12%
(Retail + Credit Ebitda) /retail revenue -13.7% 1.7% 8.5% 10.0%
La Polar 20 May 2013 page 5
more cash than what we are forecasting, which it could then be used to grow its loan
book more aggressively.
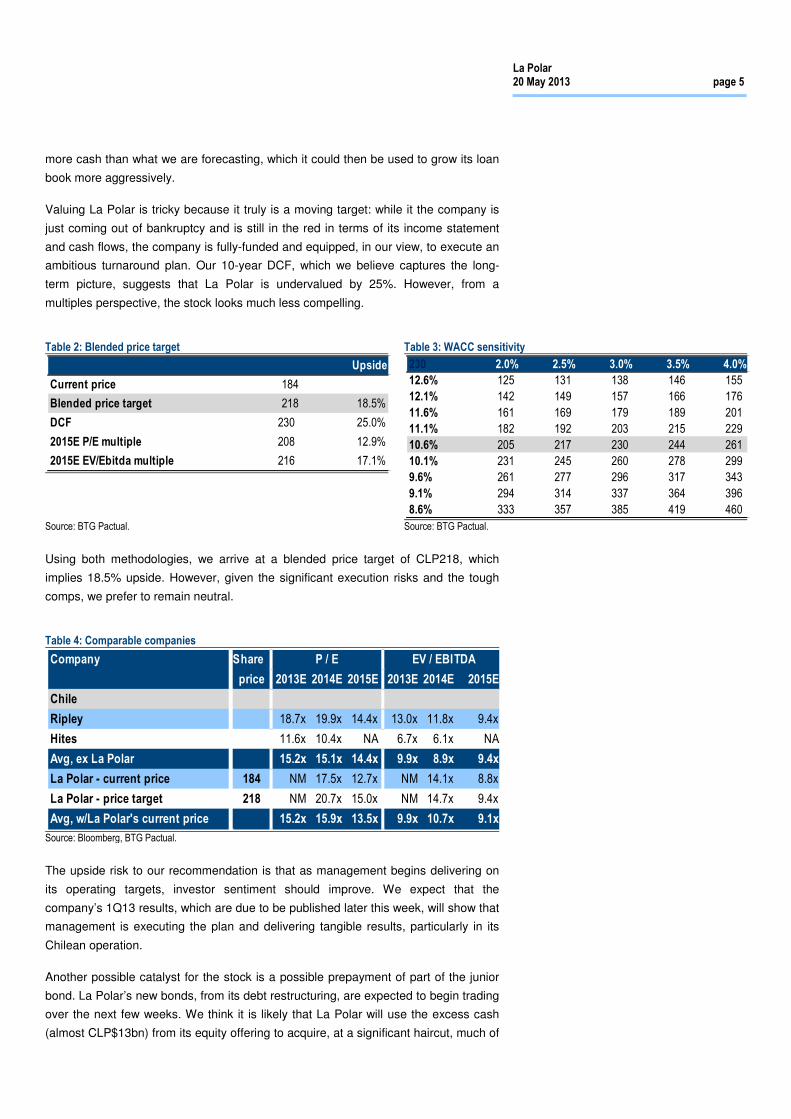
Valuing La Polar is tricky because it truly is a moving target: while it the company is
just coming out of bankruptcy and is still in the red in terms of its income statement
and cash flows, the company is fully-funded and equipped, in our view, to execute an
ambitious turnaround plan. Our 10-year DCF, which we believe captures the long-
term picture, suggests that La Polar is undervalued by 25%. However, from a
multiples perspective, the stock looks much less compelling.
Table 2: Blended price target
Table 3: WACC sensitivity
Source: BTG Pactual. Source: BTG Pactual.
Using both methodologies, we arrive at a blended price target of CLP218, which
implies 18.5% upside. However, given the significant execution risks and the tough
comps, we prefer to remain neutral.
Table 4: Comparable companies
Source: Bloomberg, BTG Pactual.
The upside risk to our recommendation is that as management begins delivering on
its operating targets, investor sentiment should improve. We expect that the
company’s 1Q13 results, which are due to be published later this week, will show that
management is executing the plan and delivering tangible results, particularly in its
Chilean operation.
Another possible catalyst for the stock is a possible prepayment of part of the junior
bond. La Polar’s new bonds, from its debt restructuring, are expected to begin trading
over the next few weeks. We think it is likely that La Polar will use the excess cash
(almost CLP$13bn) from its equity offering to acquire, at a significant haircut, much of
Upside
Current price 184
Blended price target 218 18.5%
DCF 230 25.0%
2015E P/E multiple 208 12.9%
2015E EV/Ebitda multiple 216 17.1%
230 2.0% 2.5% 3.0% 3.5% 4.0%
12.6% 125 131 138 146 155
12.1% 142 149 157 166 176
11.6% 161 169 179 189 201
11.1% 182 192 203 215 229
10.6% 205 217 230 244 261
10.1% 231 245 260 278 299
9.6% 261 277 296 317 343
9.1% 294 314 337 364 396
8.6% 333 357 385 419 460
Company Share P / E EV / EBITDA
price 2013E 2014E 2015E 2013E 2014E 2015E
Chile
Ripley 18.7x 19.9x 14.4x 13.0x 11.8x 9.4x
Hites 11.6x 10.4x NA 6.7x 6.1x NA
Avg, ex La Polar 15.2x 15.1x 14.4x 9.9x 8.9x 9.4x
La Polar - current price 184 NM 17.5x 12.7x NM 14.1x 8.8x
La Polar - price target 218 NM 20.7x 15.0x NM 14.7x 9.4x
Avg, w/La Polar's current price 15.2x 15.9x 13.5x 9.9x 10.7x 9.1x

La Polar 20 May 2013 page 6
its junior bond, reducing future financial (non-cash) expenses, improving the bottom
line and making the company more attractive from a P/E perspective, as well. Taking
out the junior bond would also make La Polar more attractive as a possible
acquisition target, given that any acquirer would have to value that debt at a much
lower discount rate.
Another possible catalyst for the stock is Colombia. Under La Polar current plan, the
Colombia operation –with only five stores— will not likely be cash flow positive for
another couple of years. A JV or partnership with a larger player could provide La
Polar with the means of reaching that goal much sooner (and free up cash for its
Chilean operation). We understand that La Polar is undergoing a search at this time.

La Polar 20 May 2013 page 7
Retail sector valuation multiples
Table 5: BTG Pactual Retail Comps – P/E
Source: Bloomberg, BTG Pactual.
Company Ticker Market Cap P / E Net Income Growth Dividend yield
(Local FX - mn) 2012E 2013E 2014E 2012E 2013E 2014E 2012E 2013E 2014E
Brazil
Lojas Renner LREN3.BZ 9,513 25.7x 21.5x 16.7x 9% 20% 28% 3% 3% 3%
Marisa AMAR3.BZ 5,571 26.7x 18.5x 14.3x 17% 45% 29% 1% 1% 1%
Hering HGTX3.BZ 6,856 21.3x 18.9x 16.4x 7% 12% 16% 4% 2% 4%
Le Lis Blanc LLIS3.BZ 1,572 31.5x 21.9x 17.3x -20% 44% 27% 1% 0% 1%
Arezzo ARZZ3.BZ 3,676 37.5x 31.0x 25.6x 7% 21% 21% 1% 1% 1%
Lojas Americanas LAME4.BZ 16,714 44.2x 32.2x 23.8x 14% 38% 35% 0% 1% 1%
Natura NATU3.BZ 21,674 23.9x 21.2x 18.5x 9% 13% 14% 5% 3% 4%
Hypermarcas HYPE3.BZ 10,572 33.6x 21.4x 17.1x >100% 57% 25% 0% 0% 1%
B2W BTOW3.BZ 1,698 NA NA NA NA NA NA 0% 0% 0%
Pao de Acucar PCAR4.BZ 28,947 29.1x 22.0x 18.3x 20% 27% 20% 1% 1% 1%
Magazine Luiza MGLU3.BZ 1,492 32.3x 11.4x 7.8x -7% NA 45% 0% 0% 0%
Raia Drogasil RADL3.BZ 7,368 47.9x 33.7x 25.0x 2% 42% 35% 0% 0% 1%
Brazil Pharma BPHA3.BZ 3,278 37.8x 22.3x 17.6x 3% 69% 27% 1% 1% 1%
IMC IMCH3.BZ 2,104 71.8x 25.8x 16.8x NA NA 54% 0% 0% 0%
Unicasa UCAS3.BZ 621 13.6x 13.9x 12.3x -26% 5% 13% 0% 2% 2%
Technos TECN3.BZ 1,782 24.0x 20.5x 16.6x 5% 17% 24% 2% 1% 1%
Brazilian Companies Average (ex-B2W) 33.4x 22.4x 17.6x 3% 32% 28% 1% 1% 2%
Mexico
Walmex WALMEXV.MM 644,593 27.7x 24.0x 21.0x -1% 25% 14% 0% 0% 0%
Soriana SORIANA.MM 90,504 25.1x 24.6x 25.8x 1% 11% -5% 1% 0% 0%
Chedraui CHDRAUIB.MM 45,179 30.1x 21.9x 19.1x -9% 49% 15% NM 0% 0%
Chile
Cencosud CENCOSUD.CI 7,351,831 24.3x 21.2x 17.1x -6% 32% 24% 1% 1% 1%
Falabella FALAB.CI 12,970,568 33.0x 24.6x 19.6x -7% 34% 25% 1% 1% 1%
Forus FORUS.CI 865,871 27.8x 24.6x 21.8x 10% 13% 13% 1% 1% 2%
Colombia
Almacenes Exito EXITO.CB 12,640,372 29.7x 26.0x 23.0x 12% 12% 13% -1% -1% -2%
Peru
InRetail INRETC1.PE 2,365 39.8x 33.0x 25.4x 30% 22% 30% 0% 0% 0%
LatAm (ex-Brazil) Companies Average 29.7x 25.0x 21.6x 4% 25% 16% NM 0% 0%
BTG Pactual Coverage Average 33.1x 23.4x 19.1x 3% 29% 24% NM 1% 1%
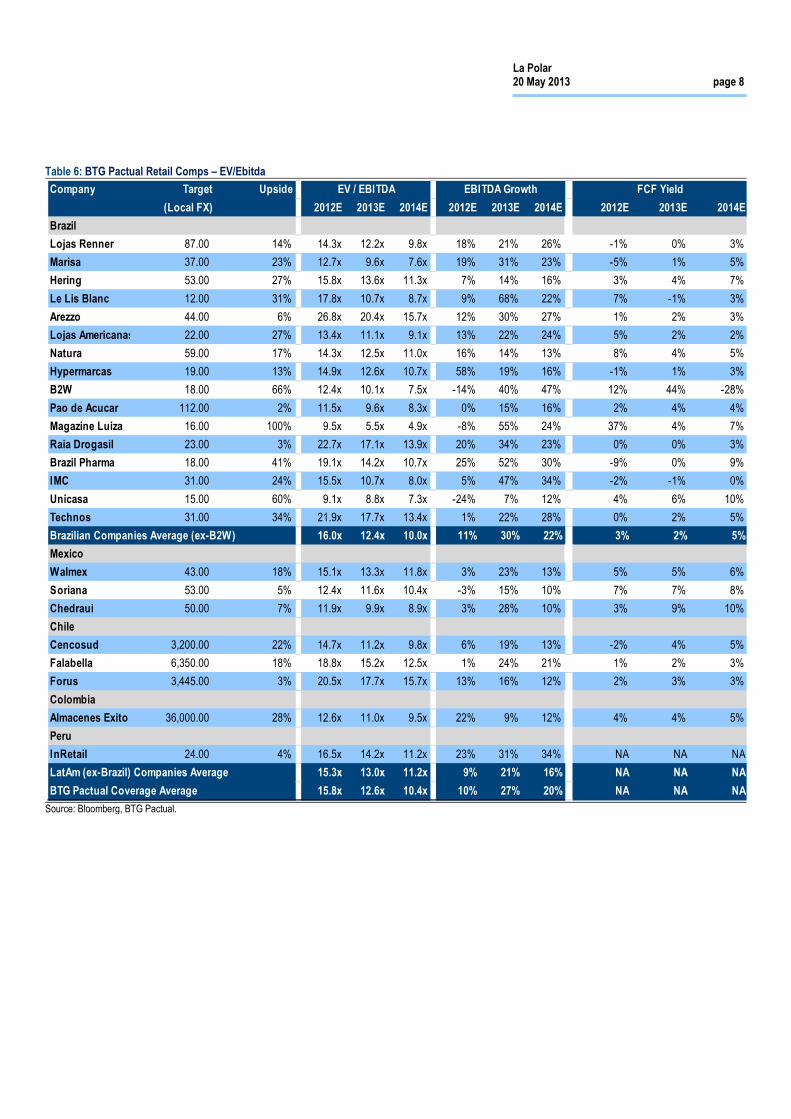
La Polar 20 May 2013 page 8
Table 6: BTG Pactual Retail Comps – EV/Ebitda
Source: Bloomberg, BTG Pactual.
Company Target Upside EV / EBITDA EBITDA Growth FCF Yield
(Local FX) 2012E 2013E 2014E 2012E 2013E 2014E 2012E 2013E 2014E
Brazil
Lojas Renner 87.00 14% 14.3x 12.2x 9.8x 18% 21% 26% -1% 0% 3%
Marisa 37.00 23% 12.7x 9.6x 7.6x 19% 31% 23% -5% 1% 5%
Hering 53.00 27% 15.8x 13.6x 11.3x 7% 14% 16% 3% 4% 7%
Le Lis Blanc 12.00 31% 17.8x 10.7x 8.7x 9% 68% 22% 7% -1% 3%
Arezzo 44.00 6% 26.8x 20.4x 15.7x 12% 30% 27% 1% 2% 3%
Lojas Americanas 22.00 27% 13.4x 11.1x 9.1x 13% 22% 24% 5% 2% 2%
Natura 59.00 17% 14.3x 12.5x 11.0x 16% 14% 13% 8% 4% 5%
Hypermarcas 19.00 13% 14.9x 12.6x 10.7x 58% 19% 16% -1% 1% 3%
B2W 18.00 66% 12.4x 10.1x 7.5x -14% 40% 47% 12% 44% -28%
Pao de Acucar 112.00 2% 11.5x 9.6x 8.3x 0% 15% 16% 2% 4% 4%
Magazine Luiza 16.00 100% 9.5x 5.5x 4.9x -8% 55% 24% 37% 4% 7%
Raia Drogasil 23.00 3% 22.7x 17.1x 13.9x 20% 34% 23% 0% 0% 3%
Brazil Pharma 18.00 41% 19.1x 14.2x 10.7x 25% 52% 30% -9% 0% 9%
IMC 31.00 24% 15.5x 10.7x 8.0x 5% 47% 34% -2% -1% 0%
Unicasa 15.00 60% 9.1x 8.8x 7.3x -24% 7% 12% 4% 6% 10%
Technos 31.00 34% 21.9x 17.7x 13.4x 1% 22% 28% 0% 2% 5%
Brazilian Companies Average (ex-B2W) 16.0x 12.4x 10.0x 11% 30% 22% 3% 2% 5%
Mexico
Walmex 43.00 18% 15.1x 13.3x 11.8x 3% 23% 13% 5% 5% 6%
Soriana 53.00 5% 12.4x 11.6x 10.4x -3% 15% 10% 7% 7% 8%
Chedraui 50.00 7% 11.9x 9.9x 8.9x 3% 28% 10% 3% 9% 10%
Chile
Cencosud 3,200.00 22% 14.7x 11.2x 9.8x 6% 19% 13% -2% 4% 5%
Falabella 6,350.00 18% 18.8x 15.2x 12.5x 1% 24% 21% 1% 2% 3%
Forus 3,445.00 3% 20.5x 17.7x 15.7x 13% 16% 12% 2% 3% 3%
Colombia
Almacenes Exito 36,000.00 28% 12.6x 11.0x 9.5x 22% 9% 12% 4% 4% 5%
Peru
InRetail 24.00 4% 16.5x 14.2x 11.2x 23% 31% 34% NA NA NA
LatAm (ex-Brazil) Companies Average 15.3x 13.0x 11.2x 9% 21% 16% NA NA NA
BTG Pactual Coverage Average 15.8x 12.6x 10.4x 10% 27% 20% NA NA NA

La Polar 20 May 2013 page 9
Investment thesis – pros
Corporate governance firmly in place
One of the first orders of business for La Polar’s new board of directors was to ensure
that a corporate governance structure was put into place to prevent a repeat of the
fraud that nearly brought down the company in 2011. The position of controller was
created with this goal in mind. The controller reports directly to the board, oversees
the transparency of internal reporting practices, and conducts the internal audit.
In the 2011 scandal, various board members claimed to not have known what was
going on with regards to the unilateral debt restructurings. La Polar’s new board
created various committees (retail, finance, audit, risk, Colombia and fraud
prevention) to make sure that in the future there would be no excuse for not being
informed. Each committee is composed of up to three board members and meets
with management on a regularly scheduled basis.
New, transparent provisioning methodology
La Polar’s new management introduced a new provisioning methodology for its loan
book based on widely accepted industry standards. The new methodology
establishes tranches, starting with non-delinquent loans, and then bases the groups
on length of delinquency (using 30-day intervals). As a loan passes from one tranche
to the next, provisions are increased accordingly. At 91 days, roughly 90% of the loan
has been provisioned. At 180 days, the entire loan and provision are written off as
bad debt.
Another important change is the greater transparency with regards to La Polar’s
receivables and provisioning practices. In its quarterly report, the company now
provides a clear and detailed breakdown of its loans and provisions by tranche so
that investors can monitor, quarter by quarter, the health of the loan book.
Healthy balance sheet should provide breathing room for turnaround
La Polar, which was insolvent just a few months ago, today has a healthy balance
sheet that in our view should give the company sufficient breathing room to execute
its turnaround strategy and return to positive cash flows. La Polar recently raised
CLP132.7bn (US$280mn) in cash in new equity and erased almost two thirds of its
debt (CLP296bn), when measured in present value, thanks to a major debt
restructuring. As a result, the company’s net debt to equity was 0.5x in 4Q12 with
CLP91bn in positive equity (US$190mn).
In our view, cash from the new equity should be sufficient to cover its working capital
and capex needs, as well as the client reimbursements agreed to in the class action
suit settlement. The new credit agreement provides a lenient amortization schedule
and low, nominal interest rate expenses in the first few years. A more detailed
account of the debt restructuring and the class action lawsuit settlement can be found
on pg. 31.

La Polar 20 May 2013 page 10
New, experienced management team and committed BOD
Given the extent and pervasiveness of the fraud and/or mismanagement, La Polar’s
board of directors decided early on to fire the entire top tier of executives at the
company. The new management team is comprised of experienced professionals,
primarily from the retail and finance industries. See appendix for details.
As already stated, La Polar’s board of directors meets with management on a regular
basis to monitor the company’s progress and to ensure that management follows the
regulations and policies established to protect the interests of shareholders and
clients. The BOD is made up of well-known business leaders and investors in Chile.
Back to the company’s roots: focus on the retail business
A central part of La Polar’s turnaround strategy is to make the retail business the
company’s core business once again. Under the previous management, La Polar’s
financial services division at one point came to represent roughly half of total
revenue. In 2012, revenue from credit cards represented 19% of retail revenue (16%
of total revenue). Management has stated that, going forward, financial services
revenue should reach, but not exceed, 30% of retail revenue (or 23% of total
revenue).
According to La Polar’s management, customers with the La Polar store credit card
purchase, on average, roughly four times more than customers without the card.
Management therefore views the credit card as important for customer loyalty. Today,
roughly 50% of La Polar’s retail sales are realized using the La Polar credit card.
Spotlight on “soft goods” should help gross retail margins
Like most department stores, La Polar’s products can be placed into two general
categories: i) “soft goods”, which at La Polar primarily include apparel, footwear,
accessories, cosmetics and toys; and ii) “hard goods”, which include home
appliances & décor, electronics and computing.
In Chile, retailers tend to sell home appliances and electronics (the bulk of the “hard
goods” category) at low prices and with thin gross retail margins (in the teens or lower
twenties, in the best cases). The retailers make up for the thin margins with the credit
card revenue that they generate by providing financing for those large-ticket items.
While a consumer may buy a flat screen TV in 12 installments, he or she is less likely
to do the same with the purchase of a T-shirt or a dress, so soft goods sales cannot
rely as much on credit card income. As a result, Chilean department store retailers do
not generally discount soft goods as deeply. Apparel, footwear and accessories,
therefore, generally have a gross retail margin in the range of 30% to 50%,
depending on whether or not the product is a non-exclusive, third-party brand or
proprietary brand.
In 2010, La Polar’s sales mix of soft and hard goods was approximately 51% and
49%. La Polar’s new management has already increased the share of soft goods
revenue to 55%, which has already improved the company’s overall gross margin
La Polar’s retail gross margins in Chile expected to improve, partly due to higher % of soft goods
2012A 2013E 2014E
Retail gross margin 22% 25% 27%

La Polar 20 May 2013 page 11
(and reduced its reliance on the riskier hard goods + financing business model).
Maintaining this mix should contribute to better margins in the future.
Chart 1: 2010 revenue mix
Chart 2: 2012 revenue mix
Source: La Polar, BTG Pactual. Source: La Polar, BTG Pactual.
Expect stronger growth and better margins from proprietary brands
As already mentioned, most department stores in Chile have a mix of i) proprietary
brands; ii) exclusively licensed brands; and ii) non-exclusive, third-party brands.
Within apparel/footwear/accessories, when we talk about “non-exclusive, third-party
brands” we refer to international staples, such as Nike or Levi’s, which are available
at most large department store chains. These brands are usually sourced locally,
either through a licensee, or directly through the local or regional branch of the
multinational brand. From the perspective of the department store chains, these
international brands generally provide the lowest direct gross retail margins.
Proprietary brands and exclusively licensed brands (depending on the terms of the
license) generally provide better retail gross margins.
In 2010, La Polar’s apparel revenue mix was roughly 43% proprietary/exclusive
brands and 57% non-exclusive, third-party brands. As already mentioned, for the
Chilean department store industry as a whole, proprietary brands have, on average,
higher retail gross margins (roughly 50%) than third-party brands (+/-30%). Retail
gross margins for La Polar’s proprietary brands in 2010 were roughly 40%, lower than
the industry standard.
La Polar’s strategy with its proprietary brands, therefore, has two components: i)
reverse the revenue mix so that proprietary brands represent 55% and non-exclusive
third-party brands, 45%, of apparel sales; and ii) increase its proprietary brands’
gross retail margins from 40% to 50%.
51%49%
soft goods hard goods
55%45%
soft goods hard goods

La Polar 20 May 2013 page 12
Chart 3: 2010 apparel revenue mix
Chart 4: Aconcagua plan - apparel revenue mix
Source: La Polar, BTG Pactual. Source: La Polar, BTG Pactual.
In order to improve sales for its proprietary brands, La Polar completely overhauled
its apparel department. To start with, La Polar’s in-house design team, under the prior
management, was made up of three people. Andres Molina, who was hired by
Lecaros as Apparel Manager in late 2011, beefed up the design team, hiring 25
experienced apparel designers poached from other Chilean retailers, and organized
them into four different groups: women’s, men, kids and home.
The next step was to take stock of the company’s brands. The first assessment was
that the company had too many brands and was prioritizing none of them. By
eliminating some lower-margin, underperforming brands, La Polar would be able to
focus its purchasing budget on fewer brands, better exhibit those brands on the retail
floor, and set up strategic advertising/marketing alliances with its top third-party brand
partners, all of which should improve sales.
Apart from the proprietary brands that La Polar had developed in-house over the
years, La Polar also had exclusive licenses with international brand owners. In some
cases, as with Soviet and Fiorucci, these licenses gave La Polar authority to use the
brand on products that La Polar designed and sourced directly, in exchange for a
royalty payment. Given the nature of these agreements, these brands had the
potential to deliver gross retail margins similar to those of proprietary brands (+/-
50%). The first brands that La Polar eliminated, therefore, were the international
brands that had the highest royalties, lowest margins and worst sales track record.
The company also eliminated several in-house brands that had little or no traction.
In parallel to this, La Polar’s new apparel department determined that many of the
company’s brands lacked a well-defined identity. As a result, the sourcing team had
been free to make interpretations, resulting in an inconsistent product offering. La
Polar’s new apparel team, therefore, put together a map of Chile’s three largest
department stores’ primary proprietary/exclusive brands, based on the gender, style,
budget and age group of each brand’s target customer. The brands were also
evaluated on a spectrum, with “fashion/trendy” at one end and “basics/perennial” at
the other.
43%57%
proprietary third party
55%45%
proprietary third party
Old design team: 3 people
New design team: 25 people
Old Polar: too many brands, prioritizing none of them
New Polar: focus purchasing budget on fewer brands, better exhibit those brands in the store, set up strategic alliances
Eliminate international brands with highest royalties and worst sales track record
Eliminate numerous in-house brands with little or no traction
Map out La Polar’s & competitors’ key brands
- Strategically define and re-launch existing brands
- Identify unattended segments and create brands to address those opportunities

La Polar 20 May 2013 page 13
The map helped La Polar determine i) how to best strategically position and re-launch
its top proprietary/licensed brands and ii) that the company needed to create a couple
of new brands to compete effectively with the country’s leading department stores.
With a clear view of the competitive landscape, La Polar’s design team went back
and precisely redefined each of the company’s key proprietary/licensed brands,
drawing up a manual for each one, with its identity, customer focus and strategy. The
brands were then grouped as either: i) low-to-mid-priced brands with more emphasis
on basics (Icono, Extralindas, Unanyme, Lisa, M&M, Chess and Ozono) or ii) mid-to-
high-priced brands with basics and fashion (Portman Club, Beverly Hills Polo Club,
Soviet, Fiorucci, Zibel, Lotto, Body Glove, Carven).
The company also launched two new brands. Alma was created to go head-to-head
with Tatienne, Umbrale and University Club, locally. Alma’s international “mirror”
brands include Free People, Rapsodia and Anthropologie. La Polar also created Mila
Jeans, a new brand inspired by international names such as Lucky Brand,
Abercrombie & Fitch, and American Eagle, on the international front, and was created
to compete against Lois and Robert Lewis, locally. See appendix for more on these
two brands.
The design cycle for each collection was also completely redefined, following industry
best practices that included sample trips to the U.S. and Europe, to make sure that
each of La Polar’s collections anticipates international trends that are relevant to the
brand. The commercial department, which is kept in the loop from the beginning of
the process, provides feedback to the design team for each collection.

La Polar 20 May 2013 page 14
Table 7: La Polar’s brand map – women’s wear
Source: La Polar, BTG Pactual. This brand map is not a comprehensive list of all of each store’s brands.
Women's Wear Falabella Paris Ripley La Polar
Basics & Fashion Basement Alaniz Marquis Zibel
Prices: Low/Medium Ziben Woman
Fashion Mango Zibel Woman
Prices: High Warehouse
Full figured women Stefano Cocci Viaressa Brigitte Naux Donna Erre
Stefano Cocci Woman VSS Woman Extra Lindas
Basics Newport Rainforest Aziz Unanyme
Prices: Low Regatta
Lifesty le University Club Greenfield Tatienne Alma
Prices: Medium/High Umbrale
Third-party , exclusivde brands Esprit Laura Ashley Dimensión Azul
Prices: High Elle Calv in Klein
Benetton Guess
Third-party , non-exclusive brands Wados Wados Fashion Wados
Prices: Medium/High Saville Row
Basics & Fashion Sybilla Opposite Index Icono
Prices: Low/Medium
Jeans Sybilla Foster Barbados Icono
Semi-basics & Fashion Americanino Fiorucci
Prices: Medium/High
Jeans Lee Lee Lee Lee
Third party , non-exclusive brands Ellus Ellus Ellus Ellus
Efesis Efesis Efesis Efesis
Wados Wados Wados Wados
Wrangler Wrangler Wrangler Wrangler
Levis Levis Lev is Lev is
Lifesty le - Fashion Mossimo Soviet
Prices: Medium/High
Lifesty le Lois Robert Lewis Mila
Semi-basics & Fashion
Prices: Medium/High
International, exclusivde brands Desigual Top Shop Pepe Jeans
Fashion Free People
Prices: High
Surf Doo Australia Aussie Body Glove
Billabong Rip Curl O'Neill
O'Neill Maui Girl
Roxy
Maui Girl
Contemporary
XL
Sportswear
Teens / Young Women
La Polar 20 May 2013 page 15
More basics in the mix should also improve retail sales and margins
The new apparel team also determined that La Polar’s apparel offering was too
heavily weighted towards fashion/trend products and too light on basics. The mix was
roughly 29% basics and 71% fashion, compared to 45% basics and 55% fashion for
the rest of the industry, according to their estimates.
The problem with this mix was twofold, according to La Polar’s new apparel manager,
Andres Molina. The fashion/trend product is generally a higher-cost item than a
“basic”. The apparel mix, therefore, contributed to La Polar’s higher-than-average
costs. The previous management tried to make up for this with higher initial price
points, which contributed to La Polar’s brands being less competitive compared to its
peers. Ultimately, La Polar’s apparel margins would suffer anyway when inventory
had to be liquidated at end-of-season sales.
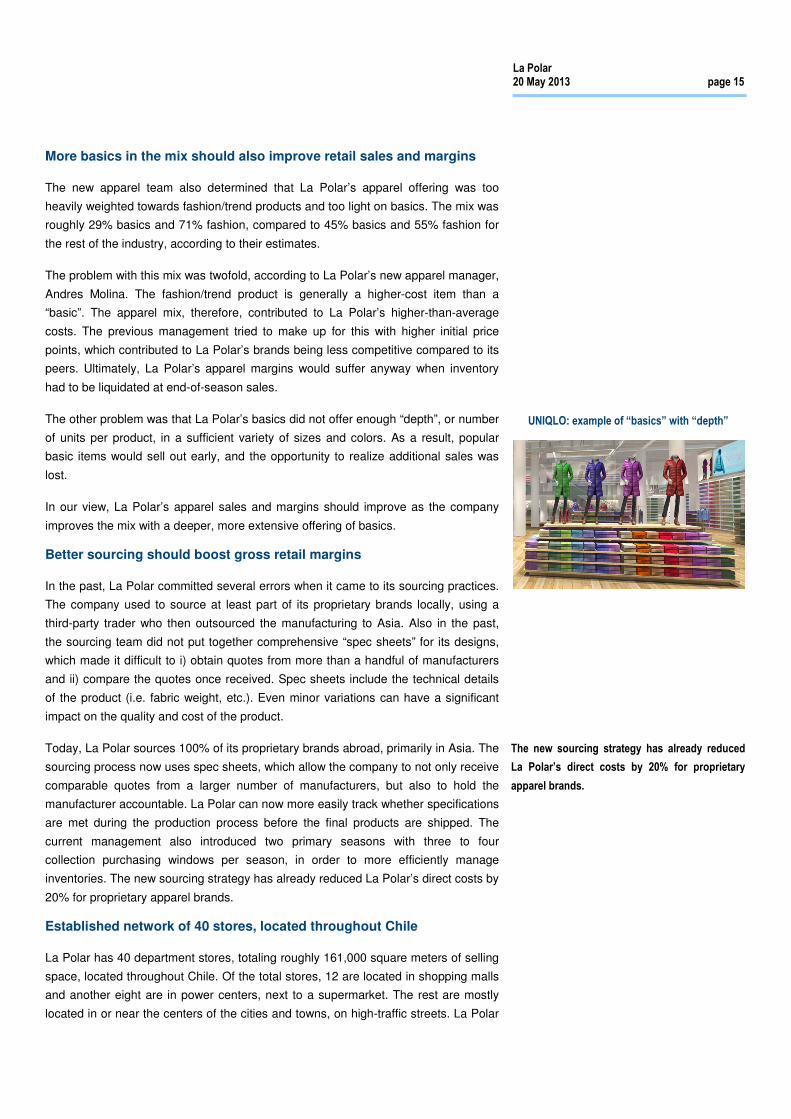
The other problem was that La Polar’s basics did not offer enough “depth”, or number
of units per product, in a sufficient variety of sizes and colors. As a result, popular
basic items would sell out early, and the opportunity to realize additional sales was
lost.
In our view, La Polar’s apparel sales and margins should improve as the company
improves the mix with a deeper, more extensive offering of basics.
Better sourcing should boost gross retail margins
In the past, La Polar committed several errors when it came to its sourcing practices.
The company used to source at least part of its proprietary brands locally, using a
third-party trader who then outsourced the manufacturing to Asia. Also in the past,
the sourcing team did not put together comprehensive “spec sheets” for its designs,
which made it difficult to i) obtain quotes from more than a handful of manufacturers
and ii) compare the quotes once received. Spec sheets include the technical details
of the product (i.e. fabric weight, etc.). Even minor variations can have a significant
impact on the quality and cost of the product.
Today, La Polar sources 100% of its proprietary brands abroad, primarily in Asia. The
sourcing process now uses spec sheets, which allow the company to not only receive
comparable quotes from a larger number of manufacturers, but also to hold the
manufacturer accountable. La Polar can now more easily track whether specifications
are met during the production process before the final products are shipped. The
current management also introduced two primary seasons with three to four
collection purchasing windows per season, in order to more efficiently manage
inventories. The new sourcing strategy has already reduced La Polar’s direct costs by
20% for proprietary apparel brands.
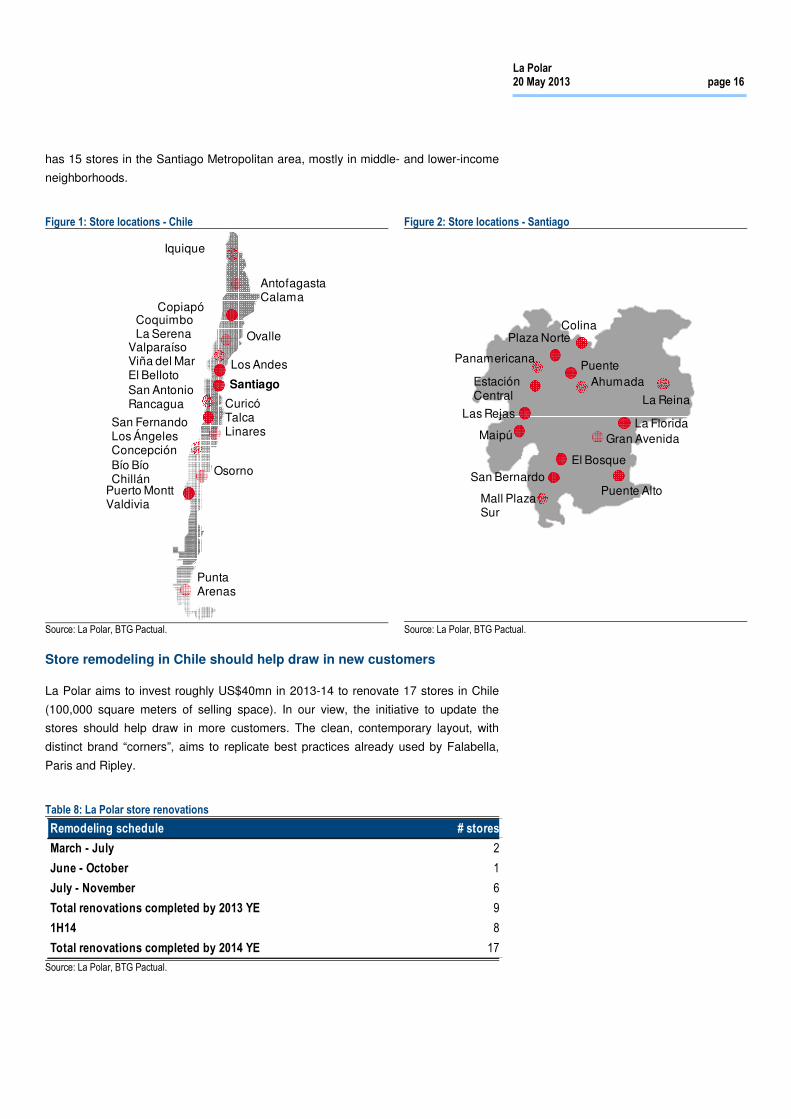
Established network of 40 stores, located throughout Chile
La Polar has 40 department stores, totaling roughly 161,000 square meters of selling
space, located throughout Chile. Of the total stores, 12 are located in shopping malls
and another eight are in power centers, next to a supermarket. The rest are mostly
located in or near the centers of the cities and towns, on high-traffic streets. La Polar
UNIQLO: example of “basics” with “depth”
The new sourcing strategy has already reduced
La Polar’s direct costs by 20% for proprietary
apparel brands.
La Polar 20 May 2013 page 16
has 15 stores in the Santiago Metropolitan area, mostly in middle- and lower-income
neighborhoods.
Figure 1: Store locations - Chile
Figure 2: Store locations - Santiago
Source: La Polar, BTG Pactual. Source: La Polar, BTG Pactual.
Store remodeling in Chile should help draw in new customers
La Polar aims to invest roughly US$40mn in 2013-14 to renovate 17 stores in Chile
(100,000 square meters of selling space). In our view, the initiative to update the
stores should help draw in more customers. The clean, contemporary layout, with
distinct brand “corners”, aims to replicate best practices already used by Falabella,
Paris and Ripley.
Table 8: La Polar store renovations
Source: La Polar, BTG Pactual.
Iquique
AntofagastaCalama
Punta Arenas
Copiapó
Osorno
Puerto MonttValdivia
CoquimboLa Serena Ovalle
ValparaísoViña del MarEl BellotoSan AntonioRancagua
Los Andes
Santiago
San FernandoLos ÁngelesConcepciónBío BíoChillán
CuricóTalcaLinares
ColinaPlaza Norte
EstaciónCentral
PuenteAhumada
Las Rejas
Maipú
Panamericana
La Reina
La FloridaGran Avenida
Puente AltoMall Plaza Sur
San BernardoEl Bosque
.
.
Remodeling schedule # stores
March - July 2
June - October 1
July - November 6
Total renovations completed by 2013 YE 9
1H14 8
Total renovations completed by 2014 YE 17

La Polar 20 May 2013 page 17
Figure 3: Estacion Central store before remodeling
Figure 4: Estacion Central store after remodeling
Source: La Polar, BTG Pactual. Source: La Polar, BTG Pactual.
Operating leverage from leases should help margins as sales increase
La Polar leases all of its stores. Shopping mall operators in Chile generally charge
their tenants the higher of i) a fixed fee in UF (the inflation adjusted currency linked to
the CLP) or ii) a variable fee based on a percentage of the store’s revenue. La Polar’s
stores currently pay a fixed lease in UF in all of the company’s shopping mall stores.
Given that this fixed amount was negotiated, for all of the stores, before the 2011
crisis, when La Polar had significantly higher sales per square meter, the delta with
regards to the variable lease should leave ample room for operating leverage as the
company increases its sales over the coming years.
Colombia, the new frontier
La Polar currently has five department stores in Colombia, with fully-funded plans to
open another nine by the end of 2015. La Polar is also evaluating another nine mall
development projects in Colombia that may present further growth opportunities.
When La Polar’s new management took over in mid-2011, the company had a
relatively clean slate in Colombia, given its short history and relatively few stores (four
at the time). The new administration, therefore, decided to directly target high-to-mid-
income customers going forward. La Polar hired Francisco Martinez, formerly
commercial director of Falabella Chile, to move to Colombia and lead the operation.
The first store that the new management opened was located in a posh neighborhood
in the city of Bucaramanga, in the Cacique mall. The Bucaramanga store was
designed with management’s new, more upscale and contemporary format.

La Polar 20 May 2013 page 18
Table 9: La Polar’s stores in Colombia
Table 10: Colombia store launch schedule
Source: La Polar, BTG Pactual. Source: La Polar, BTG Pactual.
La Polar’s current 3-year capex budget for Colombia is currently US$100mn, to
launch nine new stores and remodel the four stores that new management inherited
from the previous administration. Management estimates that the Colombia
subsidiary will breakeven with nine or ten stores in operation.
It is our understanding that La Polar has begun looking for a partner with financial
muscle, retail expertise, and local knowledge to accelerate its growth plans in
Colombia. We understand that an investment bank has been hired to facilitate the
search and evaluation process. Given that La Polar’s senior bond, to be issued in the
next few weeks, will be secured with shares of the Colombia subsidiary, La Polar
would likely have to initiate a capital increase at the subsidiary level for a new partner
to come in.
Figure 5: The Cacique mall
Figure 6: La Polar’s first store in Colombia designed by new management
Source: La Polar, BTG Pactual. Source: La Polar, BTG Pactual.
La Polar may repurchase part of its debt at a significant haircut
La Polar is evaluating the option of using up to CLP12.7bn from its equity increase to
repurchase part of the junior bond from its debt restructuring. In the equity offering
prospectus, La Polar stated that any cash raised in excess of CLP120bn could be
used for debt prepayment. The junior bond is expected to begin trading in the next
few weeks. The junior bond will be structured as a no-interest, inflation-adjusted bullet
Store City Date
Centro Mayor Bogota Oct-10
Carabobo Medellin Aug-11
Los Molinos Medellin Oct-11
Floresta Bogota Nov-11
Cacique Bucaramanga Nov-12
City Date
Yopal 4Q13
Palmira 4Q13
Cali 1Q14
Barranquilla 2Q14
Bogota 4Q14
Cali 4Q14
To be determined 2Q15
To be determined 4Q15
To be determined 4Q15
Colombia – locations of current and future stores
Barranquilla
Medellín
Cali
Yopal
BogotáBucaramanga

La Polar 20 May 2013 page 19
due in 2032 with a face value of CLP249bn. The present value of this bond is
estimated at roughly CLP18bn. Given IFRS accounting rules, La Polar must
recognize a financial expense for the junior bond that will increase each year as the
due date slowly approaches, even though there is no immediate cash outlay. Buying
back the bond would reduce La Polar’s financial expenses. In addition, the junior
bond, if left intact, would act as a poison pill for any would-be suitors, given that its
present value would likely increase if La Polar were acquired by a company with a
lower cost of capital. By eliminating the junior bond, La Polar is a more likely
acquisition target than if it is left in place, in our view. See page 31 for more details on
the debt restructuring.
Positive outlook for consumer should support retail sales
Our macroeconomics team has a generally positive midterm outlook for both Chile
and Colombia. Short-term, our macro team expects to see stronger GDP and private
consumption growth in Chile than in Colombia due to lower unemployment, higher
wage growth and consumer credit availability. Consumer confidence surveys in Chile
continue to score on the “optimistic” side of the scale.
Table 11: Real GDP growth, YoY
Table 12: Inflation (eop), YoY
Source: BTG Pactual. Source: BTG Pactual.
Private consumption in Colombia, on the other hand, is showing signs of a slowdown
in 2013, though our team expects growth to accelerate in 2014.
Table 13: Unemployment, %
Table 14: Private consumption growth, YoY
Source: BTG Pactual. Source: BTG Pactual.
2010 2011 2012 2013 2014
Chile 6.1% 6.0% 5.6% 5.4% 4.8%
Colombia 4.0% 6.6% 4.0% 3.9% 4.6%
2010 2011 2012 2013 2014
Chile 3.0% 4.4% 1.5% 2.4% 3.2%
Colombia 3.2% 3.7% 2.4% 2.4% 2.8%
2010 2011 2012 2013 2014
Chile 8.2% 7.1% 6.4% 6.5% 6.8%
Colombia 11.8% 10.9% 10.2% 10.3% 10.1%
2010 2011 2012 2013 2014
Chile 10.8% 8.9% 6.1% 6.4% 5.0%
Colombia 5.0% 5.9% 4.3% 3.7% 5.2%

La Polar 20 May 2013 page 20
Investment thesis – cons
La Polar faces tough competition from entrenched local players
La Polar’s business plan seeks to rebuild a company in what is an already crowded
and very competitive department store market (m2 per capita penetration in Chile is
the highest in Latam). La Polar is also targeting a higher-income customer (versus
the mid-to-low-income customer it targeted in the past) that is already served by
Falabella, Ripley and Paris (Cencosud), as well as local and international specialty
store retailers such as H&M, which opened its first store in Chile (at the Costanera
Center) this year.
While we believe that La Polar has ample space to improve its operating performance
in the initial stages of its turnaround strategy – driven by improved purchasing and
merchandising functions, a better product mix and store renovations – the longer-
term plan to achieve a strong competitive position and take market share away from
incumbent players involves significant execution risks, in our view. One of La Polar’s
main competitive strengths is the strategic location of its 40 stores in Chile. However,
many of those stores are also next to, or near, a Falabella, Paris or Ripley, even in
the mid-to-lower-income neighborhoods.
All three of these department store chains have proven business models that have
produced mostly consistent good results in recent years. These competitors are also
larger than La Polar, which translates into i) better economies of scale and ii) stronger
balance sheets. The cost of capital advantage can be particularly relevant in the
funding of the financial retail operation.
In addition, on the mid-to-lower-end of the spectrum, La Polar continues to face
competition from Hites and Johnson’s (Johnson’s was recently acquired by
Cencosud).
Chart 5: Department stores Chile – number of stores (2012)
Chart 6: Department stores Chile – square meters of selling space (2012)
Source: BTG Pactual. Source: BTG Pactual.
38
78
40 40
14
0
15
30
45
60
75
90
Falabella Paris + Johnson
Ripley La Polar Hites
253,595
377,190
252,042
161,000
86,994
0
100,000
200,000
300,000
400,000
Falabella Paris + Johnson
Ripley La Polar Hites

La Polar 20 May 2013 page 21
Chart 7: Department stores Chile – sqm/store (2012)
Chart 8: Department stores Chile – UF/sqm/month (2012)
Source: BTG Pactual. Source: BTG Pactual.
Chart 9: Department stores Chile – Retail revenue, CLPmn (2012)
Chart 10: Department stores Chile – Retail gross margin (2012)
Source: BTG Pactual. Source: BTG Pactual.
Chart 11: Department stores Chile – Active credit cards, millions (2012)
Chart 12: Department stores Chile – provisions/gross loans (2012)
Source: BTG Pactual. Source: BTG Pactual.
6,674
4,836
6,301
4,025
6,214
0
1,500
3,000
4,500
6,000
7,500
Falabella Paris + Johnson
Ripley La Polar Hites
16.1
8.7 9.9
6.7 7.0
0.0
3.0
6.0
9.0
12.0
15.0
18.0
Falabella Paris + Johnson
Ripley La Polar Hites
1,107,247
886,075
673,876
293,754
165,406
0
200,000
400,000
600,000
800,000
1,000,000
1,200,000
Falabella Paris + Johnson
Ripley La Polar Hites
29.0% 27.2% 26.4%22.1%
26.4%
0%
15%
30%
45%
Falabella Paris + Johnson
Ripley La Polar Hites
2.2
1.6
1.1
0.5 0.5
0.0
0.5
1.0
1.5
2.0
2.5
Falabella Paris + Johnson
Ripley La Polar Hites
4.6%
6.9%
12.0% 11.6%12.5%
0%
5%
10%
15%
Falabella Paris + Johnson
Ripley La Polar Hites

La Polar 20 May 2013 page 22
Challenging environment to grow retail credit card business
La Polar’s turnaround strategy aims to grow its credit card business by i) increasing
credit to existing customers with good credit histories and ii) issuing cards to new,
higher-income customers. As part of the fallout from the 2011 crisis, regulators
placed numerous restrictions on La Polar’s credit card operation. La Polar was
prohibited from issuing credit cards to new customers, and regulators set caps on
loans for existing customers, for example. The final restrictions were only lifted in late
2012, so we expect to see growth from pent-up demand in 2013. Additionally, La
Polar aims to launch a Visa or Mastercard branded card in 2013, which should help
reach more customers, especially within the mid-to-higher-income segments.
However, La Polar faces several challenges. The department store credit card market
is already crowded with large players: Falabella has 2.2mn active credit card
customers; Cencosud (Paris & Johnson) has 1.6mn; Ripley, 1.1mn. The retail credit
industry as a whole is also facing increasing competition from banks. In fact, usage of
store credit cards in department stores has been declining in recent years: from 62%
to 57% for Falabella and 55% to 51% for Paris between 2009 and 2012.
The regulatory environment has also become more difficult for retail credit card
operators, in large part due to the 2011 La Polar scandal. After news broke that La
Polar had unilaterally renegotiated loans, authorities passed the Ley Dicom, a “clean
slate” law that erased, on a one-time basis, the credit history of all the consumers in
Chile that had defaults of up to CLP2.5mn (roughly US$5,000). This perdonazo, or
“forgiveness” (which did not erase the debt, just the default credit history), was meant
to give consumers an opportunity to start afresh, since the Dicom credit bureau data
base can be accessed by anyone, including employers. However, the measure also
increased the credit risk for banks and retailers with credit businesses. As a result,
retailers were forced to tighten lending criteria.
Another challenge is the debate surrounding a new cap on interest rates. In Chile, the
government imposes a maximum rate that loan providers may charge. This maximum
interest rate depends on several factors, including the currency denomination, the
duration, and the size of the loan. Most of the consumer credit provided by the retail
industry is currently subject to a maximum interest rate of roughly 50% per year. The
government has stated that it intends to reduce this maximum rate to 35%, phased in
over time. The legislation regarding the interest rate caps has been modified a couple
of times already and may not go into effect until 2014. However, since retailers
charge, on average, higher interest rates than banks in Chile, it is highly likely, in our
view, that the retail sector will be more negatively impacted by the new legislation.
More recently, regulators have argued that it is illegal for department stores to
increase credit card fees without prior approval from the customer. Other regulatory
changes may be implemented in the coming months, such as a consolidated credit
database.
La Polar 20 May 2013 page 23
FX fluctuations could hurt margins
Given that virtually all of La Polar’s merchandise is imported in U.S. dollar
denominated purchases, a strong Chilean peso generally translates into better gross
margins. A weakening of the Chilean peso against the U.S. dollar, therefore, would
likely dampen gross margins.
Financial risk from credit card operation
While we think it is highly unlikely that La Polar will repeat the mistakes of its prior
management with regards to its loan book, external factors (such as a downturn in
the economy and a significant increase in unemployment) could result in higher
delinquency rates for the retail credit card industry overall. In such a scenario,
retailers with a higher percentage of lower income customers, like La Polar, may be
more exposed than department store operators with a greater share of high income
customers.
Valuation
We value La Polar with a blended price target based on our DCF and our multiple-
based analysis.
Table 15: Price target calculation
Source: Bloomberg, La Polar, BTG Pactual.
In our view, Ripley and Hites are the closest comparable companies to La Polar.
Falabella and Cencosud are multi-format retail operations (supermarket, home
improvement, as well as department store), with a very different revenue mix. Also,
both deserve a significant liquidity premium to La Polar, in our view.
Hites’s business model is retail + retail credit, with a similar customer base as La
Polar (at least historically). But Hites has a much smaller footprint in terms of number
of stores (14 compared to La Polar’s 40). Also, in April the Chilean consumer
protection agency Sernac presented Hites with a class action lawsuit (for allegedly
charging illegal fees to its credit card customers) and its stock is down over 20%
since. La Polar has already resolved its lawsuit with Sernac and we have no reason
to expect a new dispute. Ripley and La Polar both have 40 stores and La Polar’s
business plan aims to target a similar client base as Ripley’s, so we view Ripley as a
better comp.
2014E-23E DCF 230 33% 77
2015E P/E 14.4x 209 33% 70
2015E EV/Ebitda 9.4x 216 33% 72
218 Blended price target
183 Share price
19% Upside
Average daily trading volume
USD$mn
Cencosud 21.2
Falabella 10.7
Ripley 2.6
La Polar 1.7
Hites 1.0

La Polar 20 May 2013 page 24
Table 16: Comparable retail company multiples
Source: Bloomberg, BTG Pactual.
Our DCF is based on our forecast for the company’s consolidated operations in CLP.
We estimate a 10.6% WACC in CLP. Our pre tax cost of debt is based on the
weighted average discount rates used to value La Polar’s restructured debt.
Table 17: Free cash flow (CLPmn)
Table 18: WACC
Source: La Polar, BTG Pactual. Source: La Polar, BTG Pactual.
If La Polar successfully executes on its business plan, its WACC should decrease, in
our view, unlocking additional equity value.
Table 19: DCF valuation
Table 20: WACC sensitivity
Source: BTG Pactual. Source: BTG Pactual.
Company Share P / E EV / EBITDA
price 2013E 2014E 2015E 2013E 2014E 2015E
Chile
Ripley 18.7x 19.9x 14.4x 13.0x 11.8x 9.4x
Hites 11.6x 10.4x NA 6.7x 6.1x NA
Avg, ex La Polar 15.2x 15.1x 14.4x 9.9x 8.9x 9.4x
La Polar - current price 184 NM 17.5x 12.7x NM 14.1x 8.8x
La Polar - price target 218 NM 20.7x 15.0x NM 14.7x 9.4x
Avg, w/La Polar's current price 15.2x 15.9x 13.5x 9.9x 10.7x 9.1x
2012 2013 2014 2015
EBIT (58,516) (11,682) 18,796 34,511
(-) taxes - - - (6,902)
(+) depreciation 9,865 7,730 8,150 9,723
(-) capex (8,333) (23,348) (33,987) (16,667)
(+/-) change in WC 26,591 (60,497) (40,861) (25,316)
FCFF (30,393) (87,797) (47,901) (4,651)
Chile Colombia
Risk free rate 5.1% 5.5%
Expected return on the market 5.0% 5.0%
Beta 1.0 1.0
Cost of capital 10.3% 10.7%
Pretax cost of debt 13.8% 13.8%
Tax rate 20.0% 30.0%
Cost of debt 11.0% 9.7%
MV Equity 48.8% 48.8%
MV Debt 51.2% 51.2%
WACC per operation 10.7% 10.2%
2014-23 contribution 91.0% 9.0%
WACC - consolidated 10.6%
DCF - Perpetuity Based
NPV of cash flow 2014-2023 142,138
Perpetuity growth 3.0%
Perpetuity 211,315
EV @ 10.63% 353,453
Net Debt 2013E 124,243
Equity Value 229,210
Share Value (ChP/share) 230
Upside 25.4%
230 2.0% 2.5% 3.0% 3.5% 4.0%
12.6% 125 131 138 146 155
12.1% 142 149 157 166 176
11.6% 161 169 179 189 201
11.1% 182 192 203 215 229
10.6% 205 217 230 244 261
10.1% 231 245 260 278 299
9.6% 261 277 296 317 343
9.1% 294 314 337 364 396
8.6% 333 357 385 419 460

La Polar 20 May 2013 page 25
Ownership structure
La Polar does not have a controlling shareholder. In the 2012 equity raise, foreign
institutional investors acquired a roughly 25% stake in the company.
Chart 13: La Polar ownership structure, as of March 2013
Source: Superintendencia de Valores y Seguros (SVS), BTG Pactual. * Owned through CorpSeguros and CorpVida insurance companies.
25%
10%
7%5%3%
50%
Foreign institutional investors Alvaro Saieh *
AFP Habitat Moneda Asset Management
Sociedad de Rentas Massu Individual minority investors

La Polar 20 May 2013 page 26
Company overview
La Polar is the fourth largest department store operator in Chile, with 40 locations
totaling roughly 161,000 square meters of selling space. In addition, the company has
five department stores in Colombia. In both Chile and Colombia, La Polar provides
credit to customers through its credit card operation. In terms of department store
sales, the company has about a 9% market share in Chile.
Brief history
La Polar´s origins can be traced back to a tailor shop that opened for business circa
1920 near Santiago’s main railroad station. By the 1950’s, the company had evolved
into a general merchandise store, and by the 1980’s, the company began to adopt a
department store format and open new locations in Santiago. La Polar first began to
offer financing to customers, through a proprietary store credit card, in 1989. By
1990, the company had a dozen stores in Chile and 350,000 credit card holders.
In 1997, the company’s finances began to deteriorate. Chile suffered an economic
crisis, and La Polar, unable to navigate the turbulence, saw sales drop, credit card
default rates rise, and cash flow dry up. Unable to pay suppliers, the company’s
inventory levels plummeted, and by the end of 1998, sales were down by roughly
80% YoY, virtually paralyzing the operation.
In January 1999, with La Polar in bankruptcy court, the private equity firm Southern
Cross Group acquired 100% of the company’s fixed assets and brands, restructured
the debt, and re-launched the company as Comercial Siglo XXI S.A., while
maintaining the La Polar store brand. At the same time, Southern Cross replaced the
top management and recapitalized the company. Julian Moreno was the only top
executive from the prior administration that stayed on, reportedly due to his expertise
in consumer credit. Pablo Alcalde, who had worked in both the finance and retail
industries in Chile, was named CEO. By the end of August 1999, La Polar was back
up and running.
Between 2000 and 2003, La Polar’s sales, Ebitda, and net income grew at a CAGR
of 20%, 30% and 58%, respectively. In that period, the company opened 10 new
stores, more than doubling the square meters of selling space, for a total of 22 stores
(twelve in the Santiago Metropolitan area) with an average selling space of between
5,000 and 6,000 square meters each. La Polar doubled its share of Chile’s retail
market by year-end 2003, consolidating its position as the fourth largest department
store retail chain in Chile.

La Polar 20 May 2013 page 27
Table 21: Financial highlights (2000-03)
Table 22: Operating highlights (2000-03)
Source: La Polar, BTG Pactual. Source: La Polar, BTG Pactual.
During those first years under Southern Cross’ ownership, La Polar also expanded its
financial business. In late 2001, La Polar launched its first insurance products. The
next year, La Polar began to sign agreements with third-party shops and service
providers to extend the reach of its credit card. By the end of 2003, the company had
nearly 1.3mn credit card customers. The company launched its e-commerce website
in 2002.
In September 2003, La Polar went public, issuing 41,329,093 shares (20% of the
company’s equity) for CLP520 each on the Santiago Stock Exchange. The equity
offering raised a total of US32mn, which was to be used to expand operations in the
north of Chile, with the goal of reaching a total of 30 stores by 2006. The capital raise,
together with the company’s first (of many) securitized bond offering the year before,
significantly reduced leverage. By end-2003, Southern Cross’ stake in La Polar was
53.9%.
In the years that followed the IPO, La Polar continued to open stores, issue credit
cards to new clients, grow its financial and insurance businesses, and introduce new
brands. The company also continued to securitize a portion of its accounts
receivables through new bond offerings.
Table 23: Operating highlights (2004-10)
Source: La Polar, BTG Pactual.
2000-03
(CLPmn) 2000 2001 2002 2003 CAGR
Revenue 78,456 93,828 118,703 137,066 20%
YoY 53% 20% 27% 15%
Ebitda 7,320 9,575 13,809 16,145 30%
YoY 74% 31% 44% 17%
Ebitda mgn 9% 10% 12% 12%
Net income 2,139 3,586 5,238 8,407 58%
YoY 347% 68% 46% 61%
Net mgn 3% 4% 4% 6%
2000-03
2000 2001 2002 2003 CAGR
SQM 34,300 40,000 47,000 55,000 17%
YoY 31% 17% 18% 17%
Credit cards 485,000 660,000 1,014,000 1,273,000 38%
YoY 71% 36% 54% 26%
2004-10
2004 2005 2006 2007 2008 2009 2010 CAGR
Stores 24 26 33 35 40 40 43 10%
YoY 9% 8% 27% 6% 14% 0% 8%
SQM 70,000 81,000 110,750 130,000 153,000 153,000 154,100 14%
YoY 27% 16% 37% 17% 18% 0% 1%
Credit cards, issued (mn) 1.7 1.9 2.2 2.5 2.7 2.8 NA
YoY 34% 12% 16% 13% 8% 4% NA
Credit cards, active (mn) NA NA NA NA 1.6 1.7 1.7
YoY NA NA NA NA NA 1% 3%

La Polar 20 May 2013 page 28
Between 2004 and 2010, La Polar launched new proprietary brands, including a
brand aimed at teens called Icono (2005) and a brand for heavyset women called
Extra Lindas (2008). The company also received the exclusive license to sell several
international brands in Chile, including Body Glove, Beverly Hills Polo Club and
Soviet, among others.
In 2005, the company paid its first stock bonus to employees and inaugurated a new
58,500 square meter distribution center.
In October 2006, Southern Cross sold its controlling stake in La Polar through a
public auction in the Santiago Stock Exchange. Norberto Morita, a founding partner of
Southern Cross, stayed on as chairman of the board at La Polar, and Raul
Sotomayor, a partner at Southern Cross, also remained as a director.
In 2007, the company launched a new corporate logo and made significant
adjustments to its capital structure. La Polar successfully completed an offering of
15.9mn shares for US$70mn, with the purpose of financing the company’s future
growth and setting up a compensation plan (with 10% of the shares). That year, the
company also issued its fourth securitized bond, for a total of US$40mn, and its first
corporate bond, a 10-year note for UF7mn (US$250mn).
With the Chilean economy booming from 2004-07 (average annual real GDP growth
of 6.0%), La Polar reported sustained double-digit revenue, Ebitda, and net income
growth. Its net accounts receivables tripled in that four-year period, reflecting the
expansion of its credit card division.
Table 24: Financial highlights (2004-10)
Source: La Polar, BTG Pactual. Financials stated in Chilean GAAP up to 2009. In 2010 LaPolar begins to report in IFRS (and restates 2009).
But as the global subprime credit crisis gained momentum in the second half of 2008,
Chile’s economy began to feel the repercussions. Real GDP growth slowed from
5.2% the year before to 3.3%, average inflation for 2008 was nearly 9%, the CLP
depreciated 22% against the USD by year-end, and unemployment began to rise. In
2008, La Polar’s top line and net income decelerated sharply, but on the balance
sheet, net accounts receivable grew by over 55% YoY for the second year in a row.
After significantly outperforming the IPSA index from 2005-07, La Polar’s stock
underperformed in 2008.
Chilean GAAP IFRS 2004-10
(CLPmn) 2004 2005 2006 2007 2008 2009 2009 2010 CAGR
Revenue 180,807 240,210 303,071 379,386 445,534 440,876 472,541 540,190 20%
YoY 32% 33% 26% 25% 17% -1% 6% 14%
Ebitda 23,570 33,516 44,541 64,118 89,956 71,268 83,750 69,445 20%
YoY 46% 42% 33% 44% 40% -21% -7% -17%
Ebitda mgn 13% 14% 15% 17% 20% 16% 18% 13%
Net income 13,784 19,209 27,055 33,573 37,556 45,744 48,148 29,767 14%
YoY 64% 39% 41% 24% 12% 22% 28% -38%
Net mgn 8% 8% 9% 9% 8% 10% 10% 6%

La Polar 20 May 2013 page 29
Chart 14: La Polar historical stock performance
Chart 15: La Polar’s stock price compared to the IPSA Index
Source: Bloomberg, BTG Pactual. Source: Bloomberg, BTG Pactual.
In 2009, Chile’s macro environment deteriorated even further. The economy
contracted by 1% in real terms, the specter of deflation raised its head, and
unemployment averaged 9.7% for the year. For the first time in a decade, La Polar’s
top line and Ebitda contracted. The stock, however, resumed its upward trend, as
investors likely anticipated a quick recovery in Chile’s economy, which would favor
cyclical names like La Polar.
That same year, the company issued its first commercial paper for CLP30bn and
issued its fifth securitized bond for CLP34.5bn. In November of that year, the
company raised CLP67.4bn in another share offering and announced plans to enter
Colombia in 2010, with six stores in three years.
Also in 2009, Norberto Morita and Raul Sotomayor, of Southern Cross, stepped down
from the board of directors. Pablo Alcalde, CEO of La Polar since 1999, resigned in
order to replace Morita as chairman of the board. Nicolas Ramirez, the commercial
director, was promoted from the ranks to replace Alcalde as the new CEO.
In 2010, the company issued a second corporate bond, a 21-year note for UF5mn,
classified as A- by Feller Rate and A by Fitch Ratings. The funds were used to
restructure debt. The company also issued CLP30bn in commercial paper.
The fraud that triggered the 2011 La Polar crisis
On January 19, Ramirez resigned his post as CEO, citing “health issues”. He was
replaced by interim CEO Martin Gonzalez, who, until then, was the commercial
director at La Polar. On April 29, La Polar elected new members to its board of
directors, including Fernando Tisne, one of the founders and partners of Moneda
Asset Management.
In late May 2011, Chile’s Consumer Protection Agency (Sernac) presented a class
action lawsuit that alleged that La Polar’s clients had been victims of unilateral debt
restructurings. According to the press, immediately after learning about the Sernac
lawsuit, Tisne reportedly asked Alcalde to call an extraordinary meeting of the BOD.
After several meetings and conferring with management, on June 9 La Polar’s BOD
informed the Chilean securities regulatory authority (Superintendencia de Valores y
0
50
100
150
200
250
300
0
1,000
2,000
3,000
4,000
Dec
-05
Jun-
06
Dec
-06
Jun-
07
Dec
-07
Jun-
08
Dec
-08
Jun-
09
Dec
-09
Jun-
10
Dec
-10
Share price - CLP (LHS) Share count - mns (RHS)
-50%
0%
50%
100%
150%
200%
250%
Dec
-05
Jun-
06
Dec
-06
Jun-
07
Dec
-07
Jun-
08
Dec
-08
Jun-
09
Dec
-09
Jun-
10
Dec
-10
La Polar IPSA Index

La Polar 20 May 2013 page 30
Seguros, SVS) and the market that management had engaged, without the board’s
approval or knowledge, in credit practices that violated the company’s policies.
The credit practices in question consisted of taking past-due consumer loans and
credit card debt, applying penalties and commissions that the client had not agreed
to, and restating those loans as brand new loans. Again, all of this was done without
the client’s consent. The unilaterally “renegotiated” loans would then appear on La
Polar’s balance sheet as new, larger loans. The alleged practice would have
generated non-cash credit card revenue, inflated net receivables, and hidden losses
given that these loans, in reality, should have been recognized as delinquent. Many
of these credit card loans were unilaterally renegotiated more than once.
When the news hit the ticker, La Polar’s stock lost over 70% of its value in one day,
with further declines in the following days and months. Alcalde resigned as chairman
on June 10 (and later stepped down as a director in July). Over the next few days, La
Polar’s board hired new auditors to determine the true state of the loan book, among
other measures.
Chart 16: La Polar’s stock price and share count
Source: Bloomberg, BTG Pactual.
On June 17, the board informed the SVS that, according to revised estimates, La
Polar’s provision for bad debt for CLP118bn should be increased to CLP538bn in
order to properly reflect the true standing of the loan book. Recognizing a CLP420bn
loss would, in effect, push the company into bankruptcy.
The first steps toward a turnaround
On June 19, La Polar’s shareholders and creditors agreed to ask Cesar Barros, a
Stanford Ph.D. in Economics, with years of experience in banking and finance, to
step in as the new chairman of the board. Barros had previous experience with large-
scale turnarounds. When the ISA virus devastated salmon fisheries in the south of
Chile, Barros was appointed president of the Chilean Salmon Industry Association
0
200
400
600
800
1,000
1,200
0
500
1,000
1,500
2,000
2,500
3,000
3,500
4,000
Share price - CLP (LHS) Shares outstanding- mns (RHS)

La Polar 20 May 2013 page 31
(SalmonChile), and he successfully helped the group restructure its debts and return
to profitability.
On July 8, La Polar’s shareholders elected a new board of directors, keeping Barros
as chairman. Tisne, who reportedly played a major role in uncovering the fraud, was
asked to say on as a director, at least for the transition period.
At the same shareholders’ meeting, Barros informed that the following measures had
been taken: i) 15 top executives had been fired; ii) the company had hired a law firm
to file civil lawsuits against six former executives on behalf of shareholders; iii) the
company was in discussions with the consumer protection agency to find a solution to
the class action lawsuit; iv) the company was actively collaborating with investigators
from the securities authority; v) Deloitte had been hired to determine the true value of
the loan book; and vi) Ernst & Young was hired to conduct an extensive audit of the
company’s financial statements.
On July 28, the board announced that it had entered into formal negotiations with its
creditors, which primarily included local banks and pension funds, in order to
restructure the company’s debt. La Polar’s restructuring proposal was accepted by its
creditors in November. Liquidation of La Polar’s assets would have only recovered
roughly 7% of the debt owed by La Polar to its creditors, so keeping the company a
going concern was a strong argument in La Polar’s favor.
On July 29, respected retail industry veteran Patricio Lecaros was named CEO.
Lecaros worked at Ripley for 14 years, rising up to the rank of commercial vice
president. Among many other accomplishments, Lecaros led the initiative to launch
Ripley’s operations in Peru. Lecaros was CEO of Ripley Peru for five years.
In the following months, La Polar also hired an external consultant and Ph.D. in
Finance, Eduardo Walker, to study the impact on customers of the company’s
irregular credit practices. Walker’s investigation concluded that, of the over one
million customers whose debt was unilaterally restructured, roughly 80% of those
clients had not paid enough to cover the initial purchase. In other words, those clients
had not made excess payments with regards to penalties and commissions. The
investigation concluded that roughly 140,000 clients had overpaid as a result of the
unilateral restructurings.
Accomplishments since the early days of the crisis
Debt restructuring
On November 7, 2011, La Polar reached an agreement with its creditors to
restructure the company’s debt. The agreement was contingent on La Polar raising at
least CLP120bn (US$250mn) in cash in new equity.
In the creditors’ agreement, all of the outstanding unsecured debt (bank debt,
commercial paper & corporate bonds) would be combined and reissued as a senior
bond and a junior bond. The senior, or A bond, would represent 44% of the
unsecured debt, and the junior, or B bond, would represent the other 56%. The
securitized bonds (Patrimonio Separado 27, or PS 27) would be kept apart, given that
they had been secured with a portion of La Polar’s receivables.

La Polar 20 May 2013 page 32
The goal of the creditors’ agreement was to not overburden La Polar with large
amortization or interest expense payments in the first years of its turnaround.
Therefore, the senior bond was structured as a 10-year note (due in 2022),
denominated in Chilean pesos, with amortization of the principal beginning on
January 31, 2015. Interest expense payments would begin on July 31, 2013. The
junior bond was structured as a 20-year, no-interest bullet (due in 2032),
denominated in UF, an inflation-adjusted currency based on the Chilean peso.
The PS 27’s amortization payments are set to begin on January 31, 2018. The
interest expense payments are scheduled to start on July 31, 2013. The interest
expense rate will be the Chilean Central Bank 10-year note (BCP 10) plus 1%.
Given Chile’s IFRS accounting rules, La Polar’s restructured debt needed to be
accounted for at present value in 4Q12. The debt restructuring, therefore, generated
CLP296bn in non-operating, non-recurring, non-cash financial income in that period,
mostly from the reduction in value of the junior bond.
Table 25: Debt pre-restructuring (CLPbn)
Table 26: Debt post-restructuring (CLPbn)
Table 27: PV of restructured debt (CLPbn)
Source: La Polar, BTG Pactual. Source: La Polar, BTG Pactual. Source: La Polar, BTG Pactual.
La Polar estimated a discount rate for the senior and junior bonds by compiling a
sample of bonds in the U.S. with similar characteristics (credit rating, amortization
schedule, covenants), estimating their average spread over the U.S. 10-year
Treasury, and applying that spread to the Chilean 10-year Central Bank note (BCP
10).
Bank debt
Commercial paper
Corporate bonds
Unsecured debt 445
Securitzed bonds (PS 27)
Secured debt 25
Total debt 470
Senior bond 195.8
% of debt 44%
Junior bond 249.2
% of debt 56%
Subtotal 445
Securitzed bonds (PS 27)
Subtotal 25
Total debt 470
Senior bond 136
14.1% discount rate
Junior bond 18
18.1% discount rate
Subtotal 154
Securitized bonds (PS 27) - 9.6% discount rate
Subtotal 20
Total debt 174
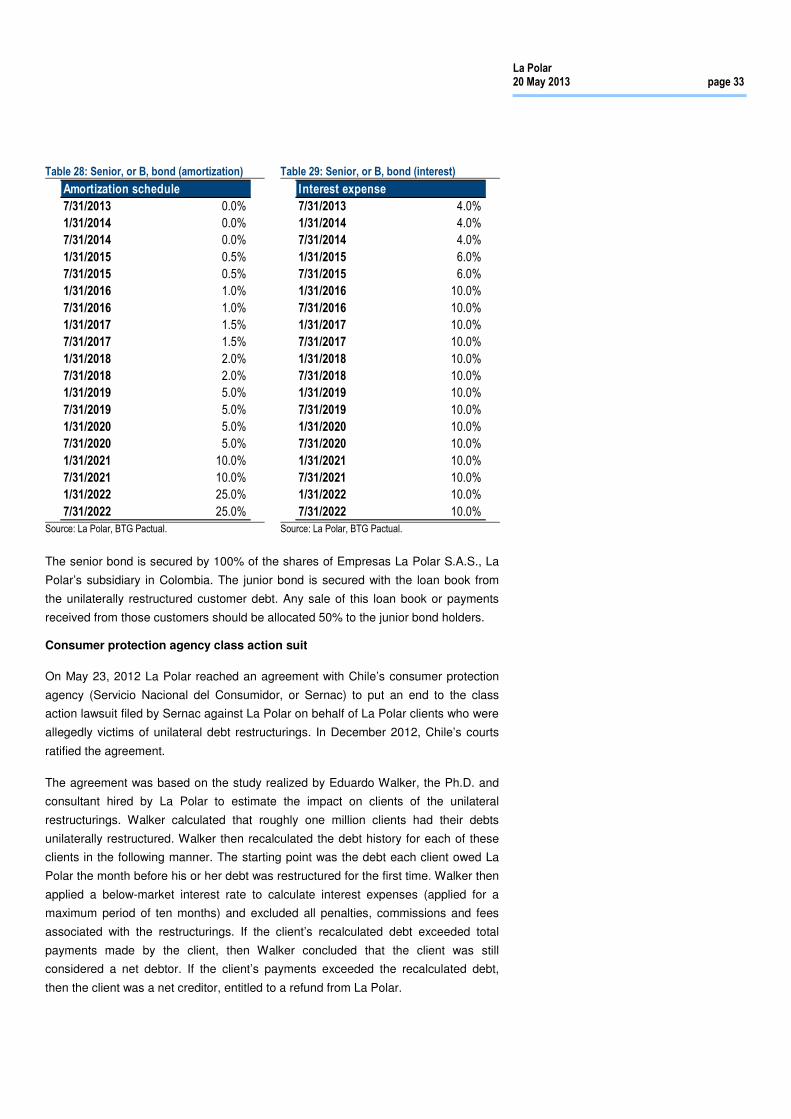
La Polar 20 May 2013 page 33
Table 28: Senior, or B, bond (amortization)
Table 29: Senior, or B, bond (interest)
Source: La Polar, BTG Pactual. Source: La Polar, BTG Pactual.
The senior bond is secured by 100% of the shares of Empresas La Polar S.A.S., La
Polar’s subsidiary in Colombia. The junior bond is secured with the loan book from
the unilaterally restructured customer debt. Any sale of this loan book or payments
received from those customers should be allocated 50% to the junior bond holders.
Consumer protection agency class action suit
On May 23, 2012 La Polar reached an agreement with Chile’s consumer protection
agency (Servicio Nacional del Consumidor, or Sernac) to put an end to the class
action lawsuit filed by Sernac against La Polar on behalf of La Polar clients who were
allegedly victims of unilateral debt restructurings. In December 2012, Chile’s courts
ratified the agreement.
The agreement was based on the study realized by Eduardo Walker, the Ph.D. and
consultant hired by La Polar to estimate the impact on clients of the unilateral
restructurings. Walker calculated that roughly one million clients had their debts
unilaterally restructured. Walker then recalculated the debt history for each of these
clients in the following manner. The starting point was the debt each client owed La
Polar the month before his or her debt was restructured for the first time. Walker then
applied a below-market interest rate to calculate interest expenses (applied for a
maximum period of ten months) and excluded all penalties, commissions and fees
associated with the restructurings. If the client’s recalculated debt exceeded total
payments made by the client, then Walker concluded that the client was still
considered a net debtor. If the client’s payments exceeded the recalculated debt,
then the client was a net creditor, entitled to a refund from La Polar.
Amortization schedule
7/31/2013 0.0%
1/31/2014 0.0%
7/31/2014 0.0%
1/31/2015 0.5%
7/31/2015 0.5%
1/31/2016 1.0%
7/31/2016 1.0%
1/31/2017 1.5%
7/31/2017 1.5%
1/31/2018 2.0%
7/31/2018 2.0%
1/31/2019 5.0%
7/31/2019 5.0%
1/31/2020 5.0%
7/31/2020 5.0%
1/31/2021 10.0%
7/31/2021 10.0%
1/31/2022 25.0%
7/31/2022 25.0%
Interest expense
7/31/2013 4.0%
1/31/2014 4.0%
7/31/2014 4.0%
1/31/2015 6.0%
7/31/2015 6.0%
1/31/2016 10.0%
7/31/2016 10.0%
1/31/2017 10.0%
7/31/2017 10.0%
1/31/2018 10.0%
7/31/2018 10.0%
1/31/2019 10.0%
7/31/2019 10.0%
1/31/2020 10.0%
7/31/2020 10.0%
1/31/2021 10.0%
7/31/2021 10.0%
1/31/2022 10.0%
7/31/2022 10.0%

La Polar 20 May 2013 page 34
This methodology concluded that roughly 860,000 clients were net debtors and
140,000 clients were net creditors. Walker concluded that these net creditor clients
were owed US$21mn in refunds. Of the net debtors, 520,000 clients had paid less
than 10% of their original debt, pre-unilateral restructurings.
Sernac, using Walker’s methodology with some adjustments, arrived at the
conclusion that La Polar’s net creditor clients should receive CLP17.5bn in refunds
plus CLP2.2bn as a bonus compensation (for a total of roughly US$41mn). Given that
La Polar had already voluntarily compensated clients for CLP3.7bn, the remainder to
be paid amounted to roughly CLP16bn (US$34mn). La Polar has provisioned roughly
US$40mn to provide compensation to these clients, and it began to reimburse clients
on January 14, 2013.
Sernac also estimated that the net debtor clients’ debt should be reduced by
CLP305.8bn (related to the interest expenses, penalties, fees and commissions tied
to the restructurings as well as a bonus compensation applied toward debt reduction),
which did not impact La Polar’s financial statements, as the company at this point had
already increased provisions in excess of this amount.
Equity raise
In October 2012, La Polar successfully issued 750mn new shares for a total of
CLP132.7bn, at an average price of CLP177 per share. The equity raise surpassed
the CLP120bn stipulated in the creditors’ agreement. In the prospectus, La Polar
stated that cash raised in excess of the CLP120bn could be used for prepayment of
debt.
La Polar 20 May 2013 page 35
Appendix
La Polar’s new board of directors
Cesar Barros – Chairman of the Board: PhD and MA in Economics, Stanford
University. Agriculture Engineer, Pontificia Universidad Catolica de Chile.
Georges de Bourguignon – Vice President: MBA, Harvard Business School.
Business Administration & Economics degree, Pontificia Universidad Catolica de
Chile.
Alberto Marraccini – President of Directors’ Committee: Business Administration
& Economics degree, Pontificia Universidad Catolica de Chile.
Juan Pablo Vega – Director: MBA, Kellogg School of Management. Civil Engineer,
Pontificia Universidad Catolica de Chile.
Jorge Id – Director: MBA, University of Chicago. Business Administration &
Economics degree, Universidad de Chile.
Aldo Motta – Director: MBA, Emory University. Business Administration &
Economics, Universidad Diego Portales.
Bernardo Fontaine – Director: Business Administration & Economics degree,
Pontificia Universidad Catolica de Chile.

La Polar 20 May 2013 page 36
La Polar’s new management team
Patricio Lecaros – CEO: Lecaros worked at Ripley for 14 years, rising up to the rank
of commercial vice president. Among many other accomplishments, Lecaros led the
initiative to launch Ripley’s operations in Peru. Lecaros was CEO of Ripley Peru for
five years. He holds a Business Administration and Economics degree from Pontificia
Universidad Catolica de Chile.
Gino Manriquez – Controller: Manriquez has over 20 years of experience in
finance, in Chile and abroad. Prior to joining La Polar, he worked at Chilean
brokerage house LarrainVial for five years. He also held positions at Corpbanca and
Dresdner Bank. He holds a Business Administration and Economics degree and MBA
from Pontificia Universidad Catolica de Chile.
Alvaro Araya – CFO: Araya worked at Chilean commodities company SQM for over
11 years. Before joining La Polar, he was the deputy finance officer at SQM. He holds
a Business Administration and Economics degree from Pontificia Universidad
Catolica de Chile and MBA from Emory University, in the U.S.
Ricardo Rubio – CTO: Rubio has over 27 years of experience in corporate IT
solutions. The past seven years he worked at the pharmaceutical retail chain
Salcobrand.
Andres Molina – Apparel Manager: Molina has 17 years of experience in the retail
industry. Prior to joining La Polar, he worked in the Apparel divisions of Ripley and
Hites. He holds a Business Administration and Economics degree from Universidad
Diego Portales in Chile.
Victor Wipe – Financial Retail Manager: Prior to joining La Polar, Wipe worked at
BBVA and CMR Falabella (Falabella’s credit card business). He holds a Business
Administration and Economics degree & MBA from Pontificia Universidad Catolica de
Chile and completed a Corporate Management Program at IESE Business School,
Spain.
Jose Tomas Larrain – Planning Manager: Before joining La Polar, Larrain was
deputy manager of Planning at Falabella Retail S.A. He holds an Engineering degree
from Pontificia Universidad Catolica de Chile.
Francisco Martinez – CEO Colombia: He joined La Polar in June 2012 from
Falabella Chile, where he had been commercial director. He holds a Business
Administration and Economics degree from the University of Chile.
The team also includes: Carlos Arredondo, Logistics Manager; Marcelo Acosta, Sales
Manager; Rodrigo Nazer, Marketing Manager; Rodrigo Karmy, Home & Electronics
Manager; Maria Olivia Brito, Head of HR; and Andres Escabini, in-house counsel,
among others.

La Polar 20 May 2013 page 37
Lawsuits
La Polar sued its former external accountants, PricewaterhouseCoopers Chile. La
Polar is asking for CLP31bn in compensation for PwC’s alleged gross negligence in
auditing La Polar’s financials before the scandal that unveiled the accounting fraud in
2011.
La Polar currently has civil lawsuits outstanding against Pablo Alcalde, Julian
Moreno, Maria Isabel Farah, Nicolas Ramirez, Pablo Fuenzalida and Ivan
Dinamarca.

La Polar 20 May 2013 page 38
New Brands
La Polar defines the Alma brand with the following adjectives: feminine, romantic,
original, charming, chic, versatile, relaxed and authentic. The brand favors natural,
light, comfortable fabrics, with warm colors. The general esthetic is rustic, vintage.
Age: 28 – 35 years old
The brand targets university students, entrepreneurs and young professionals.
Business segments: apparel, footwear, accessories, perfume, home
Price range: mid to high
Figure 7: Alma
Figure 8: Mirror brands
Source: La Polar, BTG Pactual. Source: La Polar, BTG Pactual.

La Polar 20 May 2013 page 39
Mila Jeans
La Polar defines the Mila Jeans brand with the following adjectives: youthful, classic,
natural, spontaneous. The brand focus is on sportswear, basics mixed with items that
make a fashion statement. Other adjectives that describe the esthetic: clean,
informal, comfortable.
Age: 18 – 25 years old
The brand targets high school and university students.
Business segments: apparel & footwear
Price range: mid to high
Figure 9: Mila Jeans
Figure 10: Mirror brands
Source: La Polar, BTG Pactual. Source: La Polar, BTG Pactual.

La Polar 20 May 2013 page 40
Example of a re-launched brand – Zibel
The following graphics show Zibel before (left) and after (right) La Polar’s new
apparel team gave the brand a mayor makeover.
Figure 11: Old Zibel
Figure 12: New Zibel
Source: La Polar, BTG Pactual. Source: La Polar, BTG Pactual.

La Polar La Polar 20 May 2013 page 41
La Pol ar
Income Statement (CLPmn) 12/2008 12/2009 12/2010 12/2011 12/2012 12/2013E 12/2014E 12/2015E Revenue 445,534 440,876 540,190 NM 381,910 439,914 554,894 636,887 Operating expenses (ex depn) (355,578) (370,523) (470,745) NM (433,301) (443,866) (527,947) (592,653) EBITDA (BTG Pactual) 89,956 70,353 69,445 NM (51,391) (3,952) 26,946 44,234 Depreciation (9,789) (9,471) (26,183) NM (7,125) (7,730) (8,150) (9,723) Operating income (EBIT, BTG Pactual) 80,167 60,882 43,262 NM (58,516) (11,682) 18,796 34,511 Other income & associates (21,512) 12,538 (5,451) NM 7,694 (2,387) (387) (387) Net Interest (13,401) (19,920) (3,458) NM 278,081 (5,998) (9,270) (16,071) Abnormal items (pre-tax) 0 0 0 NM 0 0 0 0 Profit before tax 45,254 53,500 34,353 NM 227,259 (20,067) 9,139 18,053 Tax (7,698) (7,756) (4,586) NM (39,730) 4,100 1,381 (3,611) Profit after tax 37,556 45,744 29,767 NM 187,528 (15,967) 10,520 14,442 Abnormal items (post-tax) 0 0 0 NM 0 0 0 0 Minorities / pref dividends (188) 33 0 NM 0 0 0 0 Net Income (local GAAP) 37,368 45,777 29,767 NM 187,528 (15,967) 10,520 14,442 Net Income (BTG Pactual) 37,368 45,777 29,767 NM 187,528 (15,967) 10,520 14,442 Tax rate (%) 17 14 13 NM 17 0 0 20 Per Share 12/2008 12/2009 12/2010 12/2011 12/2012 12/2013E 12/2014E 12/2015E EPS (local GAAP) 169.38 184.39 119.90 NM 187.79 (15.99) 10.54 14.46 EPS (BTG Pactual) 169.38 184.39 119.90 NM 187.79 (15.99) 10.54 14.46 Net DPS 46.00 45.32 56.00 NM 0.00 0.00 0.00 4.82 BVPS 1,027.91 1,303.53 1,424.90 NM 91.24 75.25 85.78 95.42 Cash Flow (CLPmn) 12/2008 12/2009 12/2010 12/2011 12/2012 12/2013E 12/2014E 12/2015E Net Income 37,368 45,777 29,767 NM 187,528 (15,967) 10,520 14,442 Depreciation 9,789 9,471 26,183 NM 7,125 7,730 8,150 9,723 Net change in working capital (113,864) (132,177) (5,517) NM 26,591 (60,497) (40,861) (25,316) Other (operating) (7,186) 66,411 (12,293) NM (34,425) 8,150 20,667 26,887 Net cash from operations (73,892) (10,518) 38,140 NM 186,820 (60,584) (1,523) 25,737 Cash from investing activities (15,839) (4,970) (15,438) NM (117,704) (23,348) (33,987) (16,667) Cash from financing activities 68,505 15,805 123,959 NM 86,533 (1,616) 4,938 4,671 Bal sheet chge in cash & equivalents (47,305) 25,333 5,301 NM 24,856 (77,311) (49,243) (10,424) Balance Sheet (CLPmn) 12/2008 12/2009 12/2010 12/2011 12/2012 12/2013E 12/2014E 12/2015E Cash and equivalents 50,250 75,582 80,884 NM 144,913 67,602 18,359 7,935 Other current assets 356,617 481,338 482,144 NM 181,645 229,000 286,400 323,457 Total current assets 406,866 556,921 563,028 NM 326,558 296,602 304,759 331,392 Net tangible fixed assets 72,267 64,709 69,320 NM 70,553 86,172 112,009 118,952 Net intangible fixed assets 5,885 1,893 32,027 NM 0 0 0 0 Investments / other assets 142,944 123,812 255,428 NM 42,466 29,719 31,072 31,879 Total assets 627,962 747,335 919,803 NM 439,577 412,493 447,840 482,224 Trade payables & other ST liabilities 71,012 63,556 58,845 NM 112,898 99,756 116,295 128,036 Short term debt 81,952 144,602 0 NM 15,861 11,617 13,573 19,530 Total current liabilities 152,964 208,158 58,845 NM 128,759 111,373 129,868 147,566 Long term debt 247,326 211,732 494,196 NM 177,599 180,227 183,208 186,737 Other long term liabilities 100 3,830 13,016 NM 42,106 45,746 49,096 52,625 Total liabilities 400,390 423,720 566,057 NM 348,463 337,346 362,173 386,928 Equity & minority interests 227,572 323,615 353,746 NM 91,114 75,147 85,667 95,295 Total liabilities & equities 627,962 747,335 919,803 NM 439,577 412,493 447,840 482,224
Company Profile:
La Polar is the fourth largest department store operator in Chile, with 40 locations totaling roughly 161,000 square meters of selling space. In addition, the company has five department stores in Colombia. In both Chile and Colombia, La Polar provides credit to customers through its credit card operation. In terms of department store sales, La Polar has about 9% market share in Chile.
Financial ratios 12/2011 12/2012 12/2013E 12/2014E 12/2015E EBITDA margin NM -13.5% -0.9% 4.9% 6.9% Operating margin NM -15.3% -2.7% 3.4% 5.4% Net margin NM 49.1% -3.6% 1.9% 2.3% RoE NM 78.8% -19.2% 13.1% 16.0% RoIC NM -10.6% -4.2% 6.8% 11.8% EBITDA / net interest NM 0.2x -0.7x 2.9x 2.8x Net debt / EBITDA NM -3.8x -48.5x 7.3x 4.7x Total debt / EBITDA NM -3.8x -48.5x 7.3x 4.7x Net debt / (net debt + equity) NM 68.0% 71.9% 69.7% 68.4%
Source: Company reports and BTG Pactual estimates. Valuations: based on the last share price of that year(E) based on share price as of 17 May 2013
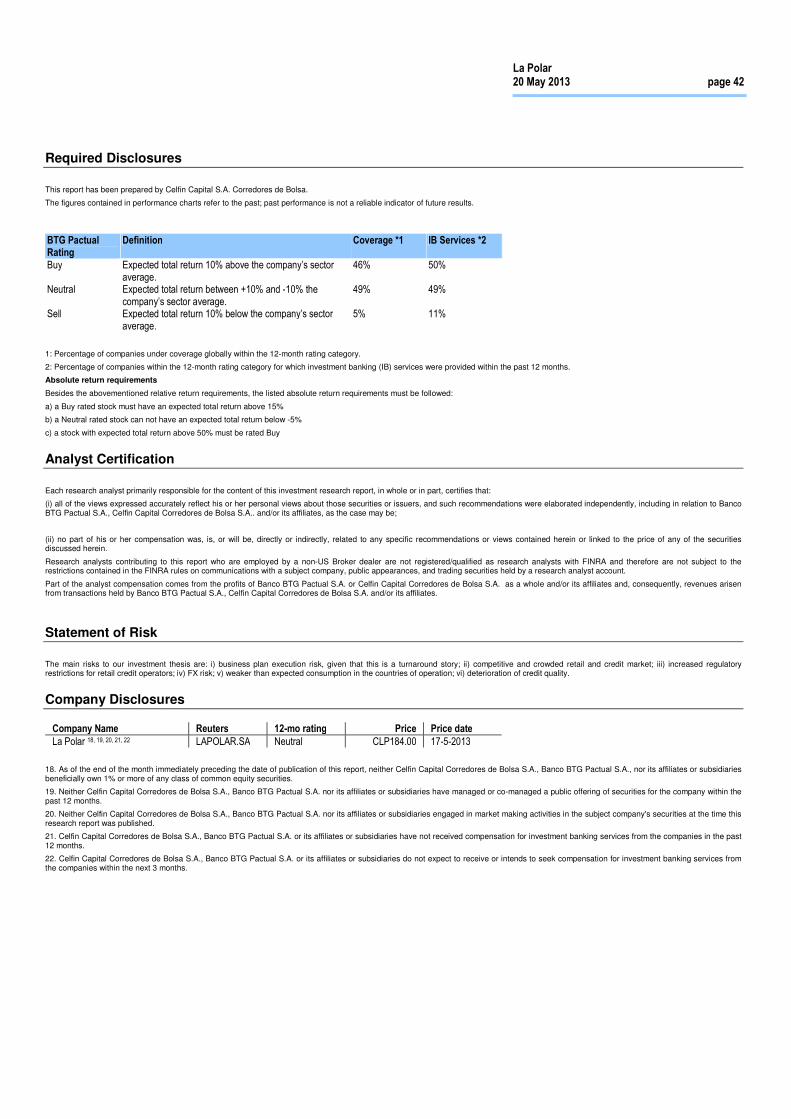
La Polar 20 May 2013 page 42
Required Disclosures
This report has been prepared by Celfin Capital S.A. Corredores de Bolsa.
The figures contained in performance charts refer to the past; past performance is not a reliable indicator of future results.
BTG Pactual Rating
Definition Coverage *1 IB Services *2
Buy Expected total return 10% above the company’s sector average.
46% 50%
Neutral Expected total return between +10% and -10% the company’s sector average.
49% 49%
Sell Expected total return 10% below the company’s sector average.
5% 11%
1: Percentage of companies under coverage globally within the 12-month rating category.
2: Percentage of companies within the 12-month rating category for which investment banking (IB) services were provided within the past 12 months.
Absolute return requirements
Besides the abovementioned relative return requirements, the listed absolute return requirements must be followed:
a) a Buy rated stock must have an expected total return above 15%
b) a Neutral rated stock can not have an expected total return below -5%
c) a stock with expected total return above 50% must be rated Buy
Analyst Certification
Each research analyst primarily responsible for the content of this investment research report, in whole or in part, certifies that:
(i) all of the views expressed accurately reflect his or her personal views about those securities or issuers, and such recommendations were elaborated independently, including in relation to Banco BTG Pactual S.A., Celfin Capital Corredores de Bolsa S.A.. and/or its affiliates, as the case may be;
(ii) no part of his or her compensation was, is, or will be, directly or indirectly, related to any specific recommendations or views contained herein or linked to the price of any of the securities discussed herein.
Research analysts contributing to this report who are employed by a non-US Broker dealer are not registered/qualified as research analysts with FINRA and therefore are not subject to the restrictions contained in the FINRA rules on communications with a subject company, public appearances, and trading securities held by a research analyst account.
Part of the analyst compensation comes from the profits of Banco BTG Pactual S.A. or Celfin Capital Corredores de Bolsa S.A. as a whole and/or its affiliates and, consequently, revenues arisen from transactions held by Banco BTG Pactual S.A., Celfin Capital Corredores de Bolsa S.A. and/or its affiliates.
Statement of Risk
The main risks to our investment thesis are: i) business plan execution risk, given that this is a turnaround story; ii) competitive and crowded retail and credit market; iii) increased regulatory restrictions for retail credit operators; iv) FX risk; v) weaker than expected consumption in the countries of operation; vi) deterioration of credit quality.
Company Disclosures
Company Name Reuters 12-mo rating Price Price date La Polar 18, 19, 20, 21, 22 LAPOLAR.SA Neutral CLP184.00 17-5-2013
18. As of the end of the month immediately preceding the date of publication of this report, neither Celfin Capital Corredores de Bolsa S.A., Banco BTG Pactual S.A., nor its affiliates or subsidiaries beneficially own 1% or more of any class of common equity securities.
19. Neither Celfin Capital Corredores de Bolsa S.A., Banco BTG Pactual S.A. nor its affiliates or subsidiaries have managed or co-managed a public offering of securities for the company within the past 12 months.
20. Neither Celfin Capital Corredores de Bolsa S.A., Banco BTG Pactual S.A. nor its affiliates or subsidiaries engaged in market making activities in the subject company's securities at the time this research report was published.
21. Celfin Capital Corredores de Bolsa S.A., Banco BTG Pactual S.A. or its affiliates or subsidiaries have not received compensation for investment banking services from the companies in the past 12 months.
22. Celfin Capital Corredores de Bolsa S.A., Banco BTG Pactual S.A. or its affiliates or subsidiaries do not expect to receive or intends to seek compensation for investment banking services from the companies within the next 3 months.
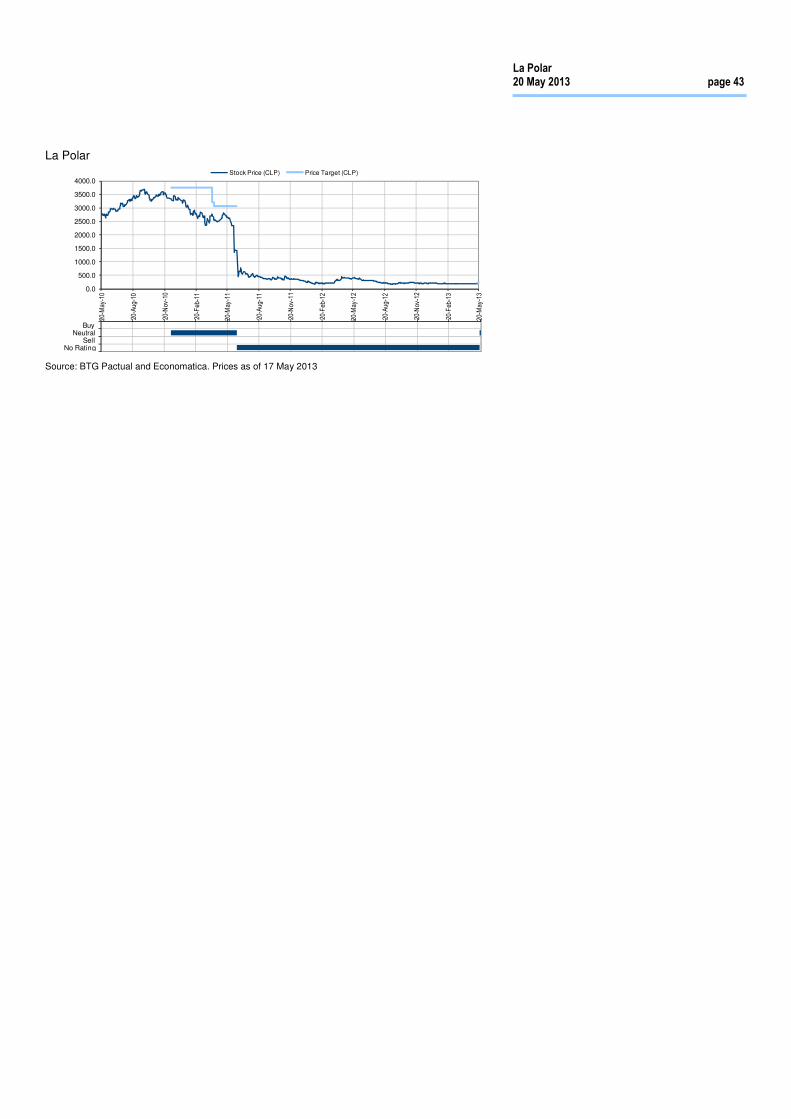
La Polar 20 May 2013 page 43
La Polar
Source: BTG Pactual and Economatica. Prices as of 17 May 2013
BuyNeutral
SellNo Rating
0.0
500.0
1000.0
1500.0
2000.0
2500.0
3000.0
3500.0
4000.0
20-M
ay-1
0
20-A
ug-1
0
20-N
ov-1
0
20-F
eb-1
1
20-M
ay-1
1
20-A
ug-1
1
20-N
ov-1
1
20-F
eb-1
2
20-M
ay-1
2
20-A
ug-1
2
20-N
ov-1
2
20-F
eb-1
3
20-M
ay-1
3
Stock Price (CLP) Price Target (CLP)
La Polar 20 May 2013 page 44
Global Disclaimer
This report has been prepared by Celfin Capital Corredores de Bolsa S.A. (“Celfin S.A.”), a Chilean broker dealer registered with Superintendencia Valores Y Seguros (SVS) in Chile, and is based in opinions from Celfin S.A., Banco BTG Pactual S.A. and its affiliates.
Celfin S.A.’s acquisition by Banco BTG Pactual S.A. (“BTG Pactual S.A.”), a Brazilian regulated bank, was approved by the Brazilian Central Bank on November 14th, 2012 and responsible for the distribution of this report in Chile and Peru.
Bolsa y Renta S.A. Comisionista de Bolsa (“Bolsa y Renta S.A.”) is a Colombian broker dealer register with the Superintendencia Financeira de Colombia and is responsible for the distribution of this report in Colombia. Bolsa y Renta S.A. acquisition by BTG Pactual S.A. was approved by Brazilian Central Bank on December 21st, 2012.
BTG Pactual US Capital LLC (“BTG Pactual US,”), a broker-dealer registered with the U.S. Securities and Exchange Commission and a member of the Financial Industry Regulatory Authority and the Securities Investor Protection Corporation is distributing this report in the United States.
BTG Pactual US assumes responsibility for this research for purposes of U.S. law. Any U.S. person receiving this report and wishing to effect any transaction in a security discussed in this report should do so with BTG Pactual US at 212-293-4600, 601 Lexington Ave. 57th Floor, New York, NY 10022.
This report is being distributed in the United Kingdom and elsewhere in the European Economic Area (“EEA”) by BTG Pactual Europe LLP (“BTG Pactual UK”), which is authorized and regulated by the Financial Services Authority of the United Kingdom. This report may also be distributed in the United Kingdom in the United Kingdom and elsewhere in the EEA by BTG Pactual S.A. and/or BTG Pactual US. BTG Pactual UK has not: (i) produced this report, (ii) substantially altered its contents, (iii) changed the direction of the recommendation, or (iv) disseminated this report prior to its issue by BTG Pactual US. BTG Pactual UK does not distribute summaries of research produced by BTG Pactual US.
References herein to BTG Pactual include BTG Pactual S.A., BTG Pactual US Capital LLC, BTG Pactual Europe LLP, Celfin S.A. and Bolsa y Renta S.A.
This report is for distribution only under such circumstances as may be permitted by applicable law. This report is not directed at you if BTG Pactual is prohibited or restricted by any legislation or regulation in any jurisdiction from making it available to you. You should satisfy yourself before reading it that BTG Pactual is permitted to provide research material concerning investments to you under relevant legislation and regulations.
Nothing in this report constitutes a representation that any investment strategy or recommendation contained herein is suitable or appropriate to a recipient’s individual circumstances or otherwise constitutes a personal recommendation. It is published solely for information purposes, it does not constitute an advertisement and is not to be construed as a solicitation, offer, invitation or inducement to buy or sell any securities or related financial instruments in any jurisdiction. Prices in this report are believed to be reliable as of the date on which this report was issued and are derived from one or more of the following: (i) sources as expressly specified alongside the relevant data; (ii) the quoted price on the main regulated market for the security in question; (iii) other public sources believed to be reliable; or (iv) BTG Pactual 's proprietary data or data available to BTG Pactual. All other information herein is believed to be reliable as of the date on which this report was issued and has been obtained from public sources believed to be reliable. No representation or warranty, either express or implied, is provided in relation to the accuracy, completeness or reliability of the information contained herein, except with respect to information concerning Banco BTG Pactual S.A., its subsidiaries and affiliates, nor is it intended to be a complete statement or summary of the securities, markets or developments referred to in the report. In all cases, investors should conduct their own investigation and analysis of such information before taking or omitting to take any action in relation to securities or markets that are analyzed in this report.
BTG Pactual does not undertake that investors will obtain profits, nor will it share with investors any investment profits nor accept any liability for any investment losses. Investments involve risks and investors should exercise prudence in making their investment decisions. BTG Pactual accepts no fiduciary duties to recipients of this report and in communicating this report is not acting in a fiduciary capacity. The report should not be regarded by recipients as a substitute for the exercise of their own judgment. Opinions, estimates, and projections expressed herein constitute the current judgment of the analyst responsible for the substance of this report as of the date on which the report was issued and are therefore subject to change without notice and may differ or be contrary to opinions expressed by other business areas or groups of BTG Pactual as a result of using different assumptions and criteria. Because the personal views of analysts may differ from one another, Banco BTG Pactual S.A., its subsidiaries and affiliates may have issued or may issue reports that are inconsistent with, and/or reach different conclusions from, the information presented herein. Any such opinions, estimates, and projections must not be construed as a representation that the matters referred to therein will occur. Prices and availability of financial instruments are indicative only and subject to change without notice.
Research will initiate, update and cease coverage solely at the discretion of BTG Pactual Investment Bank Research Management. The analysis contained herein is based on numerous assumptions. Different assumptions could result in materially different results. The analyst(s) responsible for the preparation of this report may interact with trading desk personnel, sales personnel and other constituencies for the purpose of gathering, synthesizing and interpreting market information. BTG Pactual is under no obligation to update or keep current the information contained herein, except when terminating coverage of the companies discussed in the report. BTG Pactual relies on information barriers to control the flow of information contained in one or more areas within BTG Pactual, into other areas, units, groups or affiliates of BTG Pactual. The compensation of the analyst who prepared this report is determined by research management and senior management (not including investment banking). Analyst compensation is not based on investment banking revenues, however, compensation may relate to the revenues of BTG Pactual Investment Bank as a whole, of which investment banking, sales and trading are a part.
The securities described herein may not be eligible for sale in all jurisdictions or to certain categories of investors. Options, derivative products and futures are not suitable for all investors, and trading in these instruments is considered risky. Mortgage and asset-backed securities may involve a high degree of risk and may be highly volatile in response to fluctuations in interest rates and other market conditions. Past performance is not necessarily indicative of future results. If a financial instrument is denominated in a currency other than an investor’s currency, a change in rates of exchange may adversely affect the value or price of or the income derived from any security or related instrument mentioned in this report, and the reader of this report assumes any currency risk.
This report does not take into account the investment objectives, financial situation or particular needs of any particular investor. Investors should obtain independent financial advice based on their own particular circumstances before making an investment decision on the basis of the information contained herein. For investment advice, trade execution or other enquiries, clients should contact their local sales representative. Neither BTG Pactual nor any of its affiliates, nor any of their respective directors, employees or agents, accepts any liability for any loss or damage arising out of the use of all or any part of this report. Notwithstanding any other statement in this report, BTG Pactual UK does not seek to exclude or restrict any duty or liability that it may have to a client under the “regulatory system” in the UK (as such term is defined in the rules of the Financial Services Authority).
Any prices stated in this report are for information purposes only and do not represent valuations for individual securities or other instruments. There is no representation that any transaction can or could have been effected at those prices and any prices do not necessarily reflect BTG Pactual internal books and records or theoretical model-based valuations and may be based on certain assumptions. Different assumptions, by BTG Pactual S.A., BTG Pactual US, BTG Pactual UK, Celfin S.A. and Bolsa y Renta S.A. or any other source, may yield substantially different results.
This report may not be reproduced or redistributed to any other person, in whole or in part, for any purpose, without the prior written consent of BTG Pactual and BTG Pactual accepts no liability whatsoever for the actions of third parties in this respect.
Additional information relating to the financial instruments discussed in this report is available upon request.
BTG Pactual and its affiliates have in place arrangements to manage conflicts of interest that may arise between them and their respective clients and among their different clients. BTG Pactual and its affiliates are involved in a full range of financial and related services including banking, investment banking and the provision of investment services. As such, any of BTG Pactual or its affiliates may have a material interest or a conflict of interest in any services provided to clients by BTG Pactual or such affiliate. Business areas within BTG Pactual and among its affiliates operate independently of each other and restrict access by the particular individual(s) responsible for handling client affairs to certain areas of information where this is necessary in order to manage conflicts of interest or material interests.
Any of BTG Pactual and its affiliates may: (a) have disclosed this report to companies that are analyzed herein and subsequently amended this report prior to publication; (b) give investment advice or provide other services to another person about or concerning any securities that are discussed in this report, which advice may not necessarily be consistent with or similar to the information in this report; (c) trade (or have traded) for its own account (or for or on behalf of clients), have either a long or short position in the securities that are discussed in this report (and may buy or sell such securities), with the securities that are discussed in this report; and/or (d) buy and sell units in a collective investment scheme where it is the trustee or operator (or an adviser) to the scheme, which units may reference securities that are discussed in this report.
United Kingdom and EEA: Where this report is disseminated in the United Kingdom or elsewhere in the EEA by BTG Pactual UK, this report is issued by BTG Pactual UK only to, and is directed by BTG Pactual UK only at, persons who are professional clients or eligible counterparties, each as defined in the rules of the Financial Services Authority (together, referred to as “relevant persons”).
Where this report is disseminated in the UK by BTG Pactual, this report is issued only to and directed only at persons who (i) have professional experience in matters relating to investments falling within Article 19(5) of the Financial Services and Markets Act 2000 (Financial Promotion) Order 2005 (as amended, the "Financial Promotion Order"), (ii) are persons falling within Article 49(2)(a) to (d) ("high net worth companies, unincorporated associations etc") of the Financial Promotion Order, (iii) are outside the United Kingdom, or (iv) are persons to whom an invitation or inducement to engage in investment activity (within the meaning of section 21 of the Financial Services and Markets Act 2000) in connection with the issue or sale of any securities may otherwise lawfully be communicated or caused to be communicated (all such persons together being referred to as "relevant persons"). This report is directed only at relevant persons and must not be acted on or relied on by persons who are not relevant persons. Any investment or investment activity to which this report relates is available only to relevant persons and will be engaged in only with relevant persons.
Dubai: This research report does not constitute or form part of any offer to issue or sell, or any solicitation of any offer to subscribe for or purchase, any securities or investment products in the UAE (including the Dubai International Financial Centre) and accordingly should not be construed as such. Furthermore, this information is being made available on the basis that the recipient acknowledges and understands that the entities and securities to which it may relate have not been approved, licensed by or registered with the UAE Central Bank, Emirates Securities and Commodities Authority or the Dubai Financial Services Authority or any other relevant licensing authority or governmental agency in the UAE. The content of this report has not been approved by or filed with the UAE Central Bank or Dubai Financial Services Authority.
United Arab Emirates Residents: This research report, and the information contained herein, does not constitute, and is not intended to constitute, a public offer of securities in the United Arab Emirates and accordingly should not be construed as such. The securities are only being offered to a limited number of sophisticated investors in the UAE who (a) are willing and able to conduct an independent investigation of the risks involved in an investment in such securities, and (b) upon their specific request. The securities have not been approved by or licensed or registered with the

La Polar 20 May 2013 page 45
UAE Central Bank or any other relevant licensing authorities or governmental agencies in the UAE. This research report is for the use of the named addressee only and should not be given or shown to any other person (other than employees, agents or consultants in connection with the addressee's consideration thereof). No transaction will be concluded in the UAE and any enquiries regarding the securities should be made with BTG Pactual CTVM S.A. at +55 11 3383-2638, Avenida Brigadeiro Faria Lima, 3477, 14th floor, São Paulo, SP, Brazil, 04538-133.