lab 5 cell membrane structure and function final
TRANSCRIPT

Lab 5: Cell Membrane Structure and FunctionMarch 2, 2010AnneMarie Kemp
Purpose: To perform several different experiments that demonstrate cell membrane function – for example, selective permeability of membranes, diffusion and osmosis – and to observe how substances move between the internal and external portions of a cell through the cell membrane. By observing these functions, we will be able to more fully understand the dynamics of the cell membrane.
Background/Theory:
Eukaryotic cells have a variety of different parts, called “organelles”. These organelles are uniquely designed to perform very specific functions within the cell. The surrounding cell membrane is what “holds” the cell together and keeps the organelles separate and distinct from the external environment. The cell membrane also permits substances to move between that external environment and the internal cell environment. Because not every substance will pass through the cell membrane, the cell membrane is considered “semi-permeable.” Different factors influence the permeability of a substance through the cell membrane, including the size of the molecule and its polarity.
Another important aspect of these experiments is demonstrating in more detail how the process of diffusion works. Diffusion occurs when molecules in a solution move from areas of high concentration (where there are a lot of those molecules present) to areas of lower concentration (where fewer molecules are present), which results in a more even distribution of molecules within that solution. A specific type of diffusion is osmosis, which explains the movement of water through a cell membrane. Because water molecules are small, they can pass freely through a cell membrane, unlike other larger, polar molecules. Even though water is polar (slightly negative oxygen, slightly positive hydrogen), it’s the size of the water molecule that makes it diffuse easily. The polar nature of water also influences how water is “attracted” to other molecules introduced into a solution, which demonstrates a unique phenomenon of “osmotic pressure” – when the solution becomes visibly unequal in volume on either side of the membrane.
In our second experiment, we will be using a dialysis bag to act as the cell membrane and observe what can and cannot pass through it – demonstrating selective permeability and tonicity. Using different substances - iodine, water, glucose and starch – we are to make hypotheses about what we think will happen with each in regards to their ability to cross the cell membrane.
I hypothesize that: Starch: The starch molecule is too large and too polar to pass through the membrane. It will instead
increase the amount of solution in the bag, lowering the overall amount of water in the beaker. Glucose: While a fairly low concentration of glucose, the water will still be “attracted” to the larger,
polar glucose molecule and move to through the membrane into the bag. However, since the glucose molecule is smaller than the starch molecule, I think that some glucose will also pass from the bag to the beaker.
1

Water? Water molecules are smaller than glucose or starch and are attracted to those larger molecules, so some binding will occur, which will move the solution from the beaker to the bag. However, the water can also pass freely between the two locations (bag and beaker) so it might begin to equalize over time.
Lugol’s solution (I2Kl)? I believe that the Lugol’s is there more for the color, to show us what’s going on with the experiment. It’s attracted to the starch in the dialysis bag – Lugol’s, as we learned in Lab 3, will bind with starch molecules, which is what will show us the osmosis process.
Pre-Lab Activity:(See Tables 1 and 2, attached; p. x)
Observations from Pre-lab activity:1. What happens to the SA/V ration as x gets larger? There is an inverse relationship between
the length of the side of the cell (x) and the “surface area to volume” ratio (y). As x increases, y decreases.
2. Thinking back to the Scientific Method Lab, what kind of correlation is shown here? A negative correlation.
3. What kind of surface are to volume ratio is ideal for efficient exchange of materials between a cell and its environment? A high surface-to-volume ratio facilitates the most efficient exchange.
2

I. Osmosis in Hypotonic and Hypertonic solutions using a Chicken Egg as a Cell Model
Procedure/Materials/Methods: In our first experiment, we will use a shell-less egg as an example of a large cell and observe the processes of diffusion and osmosis. Shell-less eggs will be soaked in different concentrations of glucose solution, distilled water and an unknown solution and weighed at 15-minute intervals to record what if any changes in the weight of the shell-less occurs.
Supplies:6 shell-less chicken eggs (NOTE: shell removed by soaking egg in vinegar for several weeks)6 250ml plastic beakers2 250mL glass beakersWeigh boatScaleDistilled waterSucrose solutions: 10%, 20%, 30% 40% and unknown (NOTE: Solutions are pre-prepared)Paper towelsCalculator
To begin: Label plastic beakers #1-6 using colored tape and Sharpie Set tare weight on scale to 0 with weigh boat on scale
1. Remove shell-less egg from the container provided. Gently dry the egg on paper towels.2. Weigh the egg using a weigh boat and record weight at 0 minutes on Table III (be sure that the scale
is set to 0 with weigh boat in place). 3. Place each egg in a labeled beaker.4. Cover egg in beaker #1 with distilled water until the egg is covered.5. Cover eggs in beakers #2-6 with sucrose solutions and unknown solution.6. After 15 minutes, remove the egg from beaker #1. Dry gently with paper towels and weigh the egg in
the weigh boat (be sure scale is set to 0 with weigh boat in place). Record the egg’s weight in Table 3.
7. Repeat Step 6 for each egg every 15 minutes for a total of 75 minutes.8. Calculate the relative weight change for each egg at each 15 minute interval. Record the relative
weight at each interval in Table 4.
To calculate relative weight: Relative weight at time 15 = recorded weight at time 15 minutes minus recorded weight at time 0
(initial weight). Relative weight at time 30 = recorded weight at time 30 minus recorded weight at time 0. And so on for each time interval (remember – subtract weight at time 0 from each recorded weight at
each time interval).
9. Plot a graph of relative weight change vs. time (Figure 1) where time is on the x axis. Graph will have six lines.
10. Plot graph of total weight change (last column in Table 4) of the eggs except for the unknown solution egg against the concentration of the solution.
11. Using this graph (a version of a standard curve), determine which solute concentration(s) are: ISOTONIC, HYPOTONIC, and HYPERTONIC to the contents of the chicken eggs. Record findings in your results.
3

12. Determine the concentration of the unknown solution and record in Results.
Clean up notes for Part I experiment (Lab Manual, p. 68):1. Drain liquid waste into designated waste containers (there are different containers for different
wastes).2. Discard eggs in the appropriate containers in the hood.3. Return solutions to their proper tray on the cart.4. Place any items to be washed in the dish tub in the hood.5. Return clean supplies to their proper location in the classroom.6. Wipe bench top with disinfectant (found under sink). Carefully wipe scale.7. Collect and remove all personal belongings. Leave classroom in good shape for the next class.
II. Selective Permeability of Membranes – a dialysis bag model
Procedure/Materials/Methods: For this lab we will be investigating the “selectivity” of the cell membrane using dialysis tubing as the “membrane”. One certain molecules and substances can pass through the cell membrane. Using different solutions – water, glucose, starch, and iodine – we will observe how the cell membrane allows or prevents different substances from passing through.
Supplies:Pre-cut 6” strip of dialysis tubing, soaked in water to soften (about 1 minute is sufficient)250 mL beakerA length of dental floss10% glucose solution1% boiled starch solutionLugol’s solutionDistilled waterScale
1. Using the pre-cut and pre-soaked strip of dialysis tubing, form a “bag” by tying off one end with a knot and opening the other end.
2. Fill the bag with equal parts of the glucose and starch solutions.3. Tie off the other end of the bag with dental floss.4. Carefully rinse of excess solution on outside of bag so as not to interfere with test results.
Include rinsing the tied-off end, where solution may also have collected.5. Weigh the bag (grams) and record starting weight.6. Place bag in 250mL beaker. Fill the beaker with distilled water. 7. Add enough Lugol’s solution to the beaker to turn it visibly yellow.
4

8. Observe setup for approximately 1 hour.9. Make observations as to what you “see” first – what has happened to the solution in the bag? In
the beaker? What has happened with the Lugol’s solution? Record observations in 10. Weigh dialysis bag and record. Compare to initial weight.11. Perform the Benedict’s test for carbohydrates with the water in the beaker.
a. Add 5mL of Benedict’s reagent to a test tube.b. Add 3-5 mL of beaker solution to the test tube using a disposable pipette.c. Place the test tube in a glass beaker half-filled with tap water.d. Heat on hot plate to near boiling (approx. 3 minutes once water in beaker has reached the
near-boiling state).12. Make observations and record in Observations & Results section.
III. Molecular movement (diffusion) Supplies:2 250 mL glass beakersIce cold water (in fridge)Hot plate (to boil water)Food coloring
1. Set glass beaker filled with water on hot plate first. (NOTE: Do not fill glass beaker from fridge until your hot water has reached boiling so as not to lower water temperature).
2. Once your hot water has reached the boiling point, fill other glass beaker with ice cold water from fridge (no ice in beaker).
3. Allow the contents of each beaker to come to a rest on the table.4. Carefully drop a few grains of FD&C food coloring in the center of each beaker.5. Observe what happens with the colored water.6. Record observations in Discussion section & Results section.
IV. Investigating diffusion using an agar cube as a cell model.Agar, is a jello-like substance that is made up of galactose (type of sugar) and red algae. Agar is an excellent medium for growing bacteria and is widely used in laboratories and for biology experiments. (Wikipedia, retrieved 3/24/10). The agar in this lab contains “phenolphthalein”, a pH indicator that turns bright pink when in contact with solutions with a pH of 10 or greater (Lab Manual, p. 67). For this experiment, NaOH (sodium hydroxide) is the solution with a pH of 10 or greater. The cubes of agar will be our “cells” and the NaOH the “nutrients” coming into the cell through the cell membrane. In this experiment, we will observe how the size and surface area of the cell influences the degree to which nutrients move across the cell’s membrane into the cell (Lab Manual, p. 67).
Supplies:Prepared agarKnife2-50 mL beakersSodium hydroxide (NaOH) solutionPaper towelGloves
5

Procedure:1. Use a knife to cut two cubes of prepared agar: one 3x3x3 cm and one 1x1x1 cm. 2. Record exact measurements of the cubes.3. Place cubes into beaker.4. Carefully pour sodium hydroxide solution over the cubes. Do not let solution get on skin!5. Allow cubes to soak for 1 minute.6. Carefully pour the NaOH solution off the cubes into a disposal beaker under the hood.7. Rinse cubes with distilled water.8. Pour off water, place cubes on paper towel.9. Cut cubes in half to observe how the pink has penetrated the agar (which represents how nutrients
come into cells).10. Sketch observations in Observations/results section of lab report.
Clean up notes for Part II-IV experiments (Lab Manual, p. 68):1. Drain liquid waste into designated waste containers (there are different containers for different
wastes).2. Discard dialysis tubing, agar etc. in the appropriate containers in the hood.3. Return reagents to their proper tray on the cart.4. Allow hot plates to cool and then return them to proper storage place.5. Place boiling chips on a piece of paper toweling to dry. Return to container on cart.6. Place any items to be washed in the dish tub in the hood.7. Return clean supplies to their proper location in the classroom.8. Wipe bench top with disinfectant (found under sink). Carefully wipe scale.9. Return goggles to sanitizing cabinet.10. Collect and remove all personal belongings. Leave classroom in good shape for the next class.
6
Observations & Results
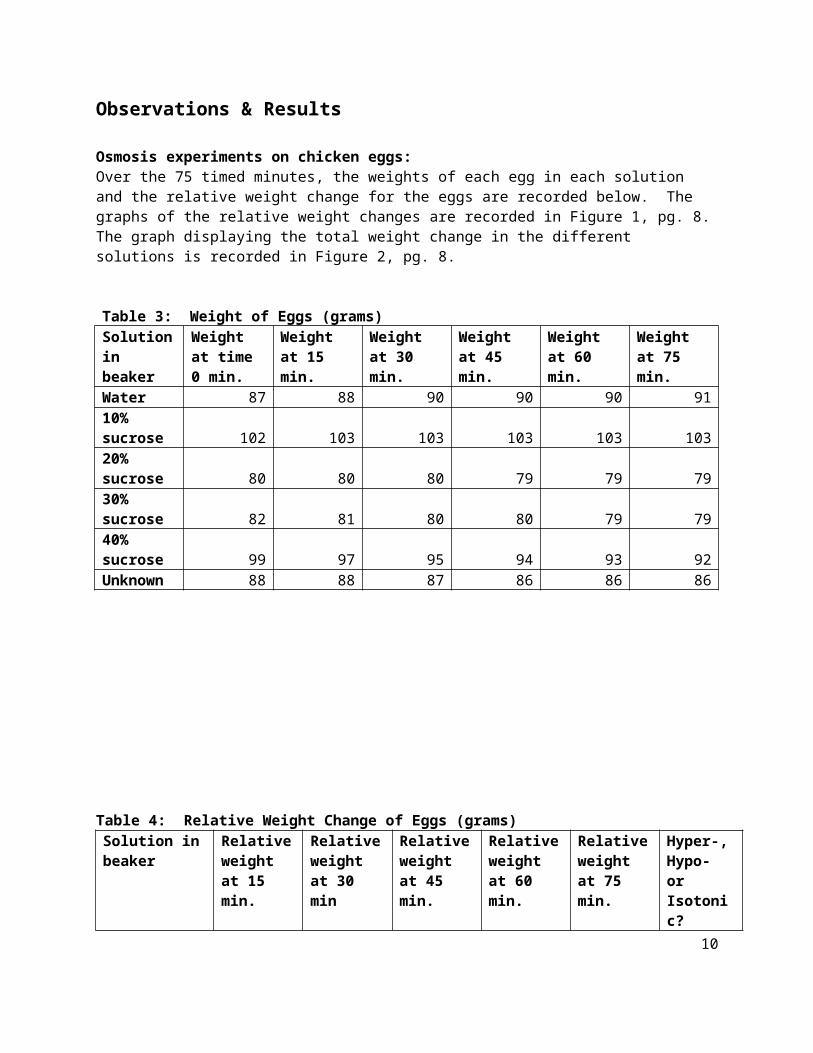
Osmosis experiments on chicken eggs:Over the 75 timed minutes, the weights of each egg in each solution and the relative weight change for the eggs are recorded below. The graphs of the relative weight changes are recorded in Figure 1, pg. 8. The graph displaying the total weight change in the different solutions is recorded in Figure 2, pg. 8.
Table 3: Weight of Eggs (grams)Solution in beaker
Weight at time 0 min.
Weight at 15 min.
Weight at 30 min.
Weight at 45 min.
Weight at 60 min.
Weight at 75 min.
Water 87 88 90 90 90 9110% sucrose 102 103 103 103 103 10320% sucrose 80 80 80 79 79 7930% sucrose 82 81 80 80 79 7940% sucrose 99 97 95 94 93 92Unknown 88 88 87 86 86 86
Table 4: Relative Weight Change of Eggs (grams)Solution in beaker
Relative weight at 15 min.
Relative weight at 30 min
Relative weight at 45 min.
Relative weight at 60 min.
Relative weight at 75 min.
Hyper-, Hypo- or Isotonic?
Water 1 3 3 3 4 Hypotonic10% sucrose 1 1 1 1 1 Isotonic20% sucrose 0 0 -1 -1 -1 Hypertonic30% sucrose -1 -2 -2 -3 -3 Hypertonic40% sucrose -2 -4 -5 -6 -7 HypertonicUnknown 0 -1 -2 -2 -2 Hypertonic
7

Figure 1. Relative Weight Change of Eggs (grams) over time.
-8
-6
-4
-2
0
2
4
6
0% 10% 20% 30% 40% 50%
Concentration of solution (% sucrose)
To
tal
wei
gh
t ch
ang
e (g
ms)
Knownconcentrations
Unknown solution
Figure 2. Total weight change of eggs in different sucrose solutions.
8

Sketches for Agar test:
The larger of the two agar cubes has what appears to be a “white” center – in other words, the pink solution did not completely penetrate the entire cube. The smaller cube shows greater saturation but based on how dark the pink is on the outside of the cube versus the inside of the cube, it’s still not an equal saturation from inside to outside. Upon measurement, both cubes show approximately 0.3 cm of penetration of the bright pink solution.
Which cell would be most efficient at moving nutrient molecules in and waste molecules out? Based on the results of the calculations from the pre-lab activity, the surface-area-to-volume ratio is greater the smaller the cube (cell).
Where do cubes fall on pre-lab graph of x vs. SA/V? Our larger cube was not exactly equal in length, width and height; there was a 0.5 cm. discrepancy. The larger cube should fall about where the 2x2x2 calculation is on the graph; the smaller cube where the 1x1x1 calculation is on the graph.
Does answer to “which cell” question correspond with answer to 5c in pre lab? Yes.
Observations from selective permeability experiment: What test can you do to the water in the beaker to test for carbohydrates? Benedict’s
What will the I2Kl react with? Starch
Weight of dialysis bag: Initial: 17 gm After 1 hour: 17 gm
Results of Benedict’s test on beaker water: We observed a change in the Benedict’s solution on the beaker water – the contents of the test tube turned a rusty orange color – indicating the presence of carbohydrate in the solution.
Selective permeability experimentThe water/iodine solution in beaker was relatively unchanged; there were a few small “globs” of blue starchy substance floating in the beaker due to what we think was residue on the inside of the tied end of the bag. The glucose/starch solution in bag turned dark blue.
9
The results of the experiments on the dialysis bag compare to my hypotheses as follows:
I hypothesized that: The starch molecule is too large and too polar to pass through the membrane and will instead increase
the amount of solution in the bag, lowering the overall amount of water in the beaker. This was incorrect; the weight of the bag was unchanged. I further hypothesized that the beaker water will be “attracted” to the larger, polar glucose molecules in the bag and pass through the membrane into the bag. However, since the glucose molecule is smaller than the starch molecule, I think that some glucose will also pass from the bag to the beaker. The result of this hypothesis is partially correct; the Lugol’s solution did pass from the beaker water into the dialysis bag, as indicated by the contents of the bag turning bright blue. However, some blue “globs” did appear in the beaker water likely due to an error in the procedure (not carefully washing the bag).
Water molecules are smaller than glucose or starch and are attracted to those larger molecules, so some binding will occur, which will move the solution from the beaker to the bag. However, the water can also pass freely between the two locations (bag and beaker) so it might begin to equalize over time. The hypothesis regarding the passing of water between the bag and the beaker is correct – as evidenced by the change in color of the starch solution in the dialysis bag. Equilibrium was also achieved; the weight of the bag was unchanged.
I hypothesized that the Lugol’s was part of the experiment for color only, to show us what’s going on with the experiment. It’s attracted to the starch in the dialysis bag – Lugol’s, as we learned in Lab 3, will bind with starch molecules, which is what will show us the osmosis process. This was correct; the starch in the bag did change color.
Observations for molecular movement (diffusion) experiment:The food coloring diffused immediately in the hot water. The food coloring in the cold water diffused very slowly.
10

Discussion/Conclusions
Osmosis experiments on chicken eggsFigure 1 shows that the greater the percentage of sucrose in the solution, the more weight the egg “lost” over time. This phenomenon “leveled off” at a 10% sucrose solution. The distilled water showed a very small weight gain in the egg over time.
According to our text, “when considering the behavior of a cell in a solution, both solute concentration and membrane permeability must be considered.” (Campbell et.al., p. 133). “Tonicity” is the ability of a solution to cause a cell to gain or lose water. The solutions we used in this experiment were different concentrations of sucrose, an unknown solution, and distilled water. The sucrose solutions caused the egg to lose water. The higher the concentration of sucrose, the more water the egg lost. A solution that causes the loss of water is called a “hypertonic” solution. An “isotonic” solution would cause the water to flow between the egg and the beaker at the same rate – in this experiment, the 10% solution. Distilled water entered the egg faster than the egg could move water out. Both hypertonic and hypotonic solutions are dangerous to a cell over time; it will either shrivel up and die or burst. According to Figure 1, the 10% sucrose solution was the most stable environment for the egg.
This experiment demonstrated two important things: 1) that the sucrose molecules were too big to penetrate (“permeate”) the “cell” (egg); and 2) the concentration of sucrose impacted the “tonicity” of the solution.
What conclusions can be drawn from the selective permeability of membranes experiment? One of the main conclusions is that the starch did not pass from the “cell” (dialysis bag) to the extracellular environment (beaker). I think the only reason any blue solution appeared in the beaker was because we had a small leak in the dialysis bag – leading me to conclude that tying off a dialysis bag with dental floss is a difficult task. I would also conclude that the Lugol’s infused water did pass from the beaker to the bag, as evidenced by the dramatic color change; the Lugol’s reacts with starch as we learned in Lab 3.
The results of the Benedict’s test (testing for glucose solution in bag) showed the presence of glucose in the beaker water. That could have been due to the leak or to diffusion; a repeat of the experiment under more carefully controlled conditions is recommended. I favor diffusion as the explanation for the presence of glucose in the beaker water because the weight of the bag did not change.
Explain phenomena observed in molecular movement (diffusion) experiment for both cold and hot water.The phenomena observed in molecular movement experiment on hot water showed high average kinetic energy in the water, explaining why the food coloring diffused so quickly. The opposite of this is true in the cold water – lower average kinetic energy of the water resulted in slower diffusion of the food coloring.
11