lab 8: microwave propagation in rectangular waveg- uides
TRANSCRIPT

Lab 8: Microwave Propagation in Rectangular Waveg-
uides
Goal
Study electromagnetic wave propagation in waveguides
Objectives
1. Generation of Microwaves using Klystron tube
2. Observe Transverse Electric (TE) modes in rectangular wave guide
3. Measurement of the rectangular wave guide wavelength
Expectations
1. You are expected to take detailed notes during each step outlined in the procedure thatcan be used during the lab report write-up.
2. You are expected to provide a neat table of the data that you measured where youclearly label what each data set is and include units for all measured quantities.
3. You are expected to clearly record the measured values of any components that youuse.
4. You are expected to clearly record the detail related to images captured by the oscillo-scope.
5. You are expected to make your final plots in a program such as Excel. Make sure thatyour data points appear clearly on the plots, that all axes are clearly labeled and haveunits.
6. If it is possible to compare your measurements with an expectation or a prediction, youare expected to do so in your lab report
7. You are expected to answer the questions encountered in this manual as well as discussexercises given during the lectures in your lab write up.
Introduction to Concepts
Waveguides are used to transfer electromagnetic power efficiently from one point in space toanother. A rectangular hollow waveguide with conducting walls is shown in Figure 1 wherea and b are the inner side lengths (a > b) The wave is assumed to propagate in the positivez direction.
There are two modes of electromagnetic waves supported by a rectangular waveguide.The mode depends on the longitudinal (along the direction of wave propagation) componentof the electric (E) or magnetic (B) fields. If Ez = 0 and Bz 6= 0 then a transfer electric wave
1
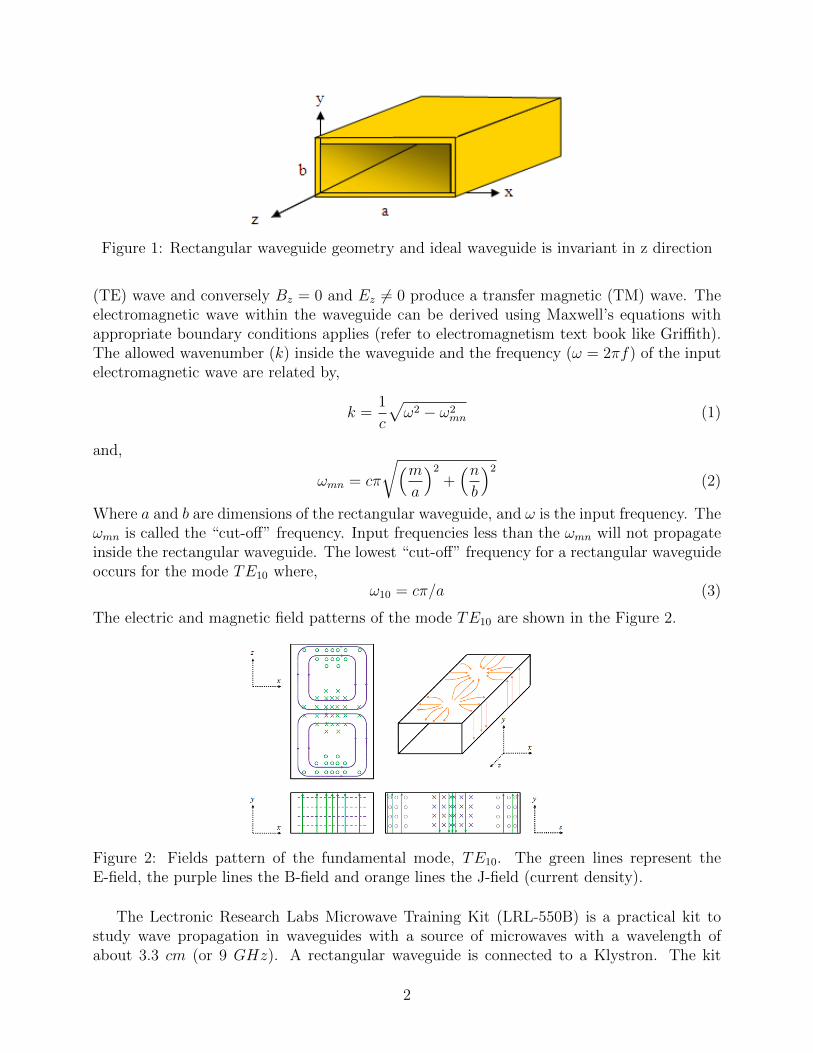
Figure 1: Rectangular waveguide geometry and ideal waveguide is invariant in z direction
(TE) wave and conversely Bz = 0 and Ez 6= 0 produce a transfer magnetic (TM) wave. Theelectromagnetic wave within the waveguide can be derived using Maxwell’s equations withappropriate boundary conditions applies (refer to electromagnetism text book like Griffith).The allowed wavenumber (k) inside the waveguide and the frequency (ω = 2πf) of the inputelectromagnetic wave are related by,
k =1
c
√ω2 − ω2
mn (1)
and,
ωmn = cπ
√(ma
)2+(nb
)2(2)
Where a and b are dimensions of the rectangular waveguide, and ω is the input frequency. Theωmn is called the “cut-off” frequency. Input frequencies less than the ωmn will not propagateinside the rectangular waveguide. The lowest “cut-off” frequency for a rectangular waveguideoccurs for the mode TE10 where,
ω10 = cπ/a (3)
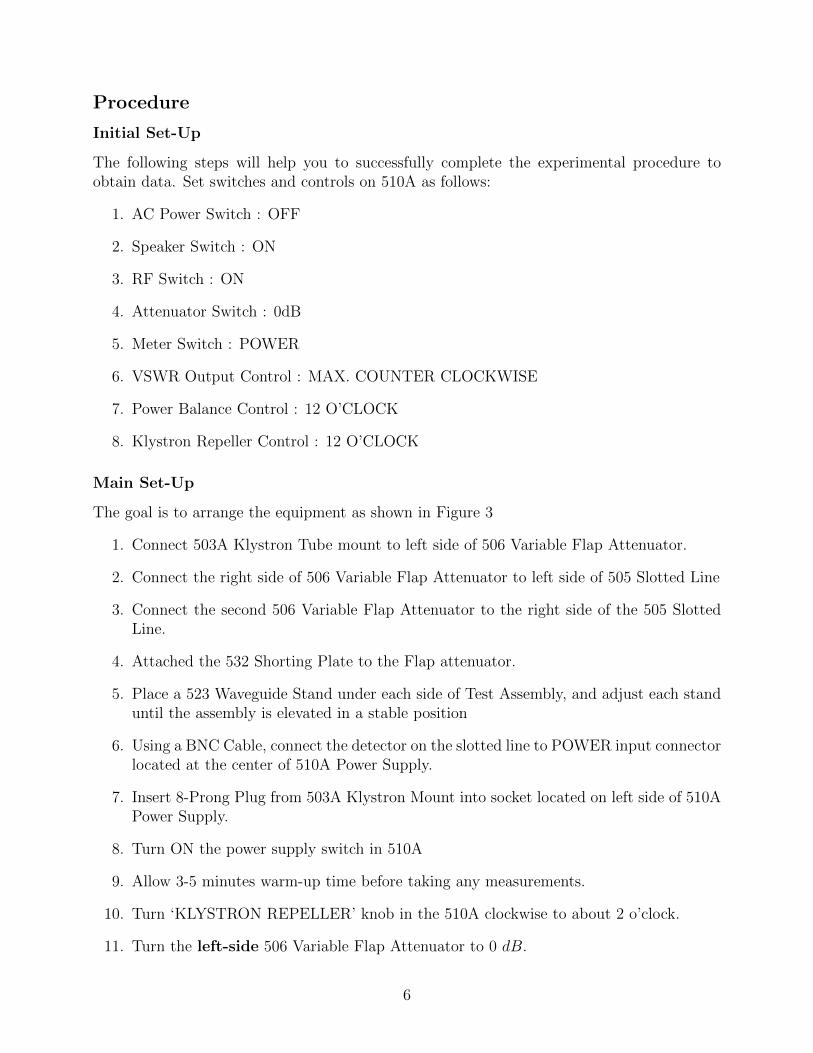
The electric and magnetic field patterns of the mode TE10 are shown in the Figure 2.
Figure 2: Fields pattern of the fundamental mode, TE10. The green lines represent theE-field, the purple lines the B-field and orange lines the J-field (current density).
The Lectronic Research Labs Microwave Training Kit (LRL-550B) is a practical kit tostudy wave propagation in waveguides with a source of microwaves with a wavelength ofabout 3.3 cm (or 9 GHz). A rectangular waveguide is connected to a Klystron. The kit
2

can be used to access the mode of operation of the waveguide and the cut of frequency. Theexperimental apparatus is shown in Figure 3. On left, the microwave source is attached tothe wave guide. Then an attenuator waveguide is connected to the source. Purpose of it isto attenuate the transmitted EM intensity. Then a waveguide with a intensity detector isattached. A custom-made waveguide with a detector to prob EM wave intensity inside the
Figure 3: The experimental apparatus. The rectangular waveguide is connected to themicrowave source
waveguide as shown in Figure 4 is attached to monitor EM waves. The detector has an outputproportional to the square of the input. A cross sectional view of the detector is shown inFigure 5. The detector will change the RF signal to a DC current read using the meter locatedin the main power supply (see Figure 6). Then another attenuator waveguide is connectedto the source. Purpose of it is to attenuate the reflected EM intensity. The waveguide isterminated with a reflector. The experiment setup is configured to produce standing waveswithin the waveguide.
PLEASE READ CAUTIONS CAREFULLY BEFORE CONTINU-ING
• Klystrons get extremely hot when in use and must not be handled whilehot! Serious burns can result.
• Klystron mount, power supplies, and Klystron tube plate caps have highvoltages present when in use: Exercise extreme CAUTION!, Shock or deathcan result.
3

Figure 4: The slotted waveguide and the detector. The movable detector can probe alongthe waveguide and scan along the vertical coordinate.
• RF power levels in this kit are not harmful, but a human eye may be damagedby low levels of radiation
• Do not look into any waveguide at any time when units are on.
Preliminary Lab Questions
1. Calculate the cut-off frequency and cut-off wavelength for TEmn modes m,n = 0, 1, 2given a = 2.286 cm and b = 1.016 cm and tabulate the result.
2. If the input frequency to the rectangular waveguide is 9.0 GHz, using the cut-off fre-quencies you computed in above step, show that the only possible TEmn mode for thewaveguide is TE10 mode.
3. Using the equation 1 compute the wavenumber for the waveguide if input frequency tothe rectangular waveguide is 9.0 GHz and for TE10 mode.
4. Given the wavenumber k = 2πλ
, calculate the wavelength and frequency for the waveg-uide if input frequency to the rectangular waveguide is 9.0 GHz
5. The detector described in the Figure 5 reads the square of the input electric fieldamplitude. Find a relation for the distance between two maxima or minima and thewavelength of the electromagnetic wave?
4

Figure 5: The slotted waveguide and the detector: (a). Cutaway Sketch of a Slotted Sectionwith Probe, Carriage, and Detector (b). Equivalent Detector Circuit
Figure 6: The Klystron power supply, the signal amplifier and the DC current meter includedin the unit 510A
Equipment and Parts
All equipments and parts are supplied with the Lectronic Research Labs Microwave TrainingKit (LRL-550B)
1. Microwave source (510A) - 1
2. Klystron tube (503A) - 1
3. Waveguide attenuators (506) - 2
4. Slotted line with probe and detector (505) - 1
5. Short circuit terminator (532) - 1
6. Waveguide stands (523) - 2
5
Procedure
Initial Set-Up
The following steps will help you to successfully complete the experimental procedure toobtain data. Set switches and controls on 510A as follows:
1. AC Power Switch : OFF
2. Speaker Switch : ON
3. RF Switch : ON
4. Attenuator Switch : 0dB
5. Meter Switch : POWER
6. VSWR Output Control : MAX. COUNTER CLOCKWISE
7. Power Balance Control : 12 O’CLOCK
8. Klystron Repeller Control : 12 O’CLOCK
Main Set-Up
The goal is to arrange the equipment as shown in Figure 3
1. Connect 503A Klystron Tube mount to left side of 506 Variable Flap Attenuator.
2. Connect the right side of 506 Variable Flap Attenuator to left side of 505 Slotted Line
3. Connect the second 506 Variable Flap Attenuator to the right side of the 505 SlottedLine.
4. Attached the 532 Shorting Plate to the Flap attenuator.
5. Place a 523 Waveguide Stand under each side of Test Assembly, and adjust each standuntil the assembly is elevated in a stable position
6. Using a BNC Cable, connect the detector on the slotted line to POWER input connectorlocated at the center of 510A Power Supply.
7. Insert 8-Prong Plug from 503A Klystron Mount into socket located on left side of 510APower Supply.
8. Turn ON the power supply switch in 510A
9. Allow 3-5 minutes warm-up time before taking any measurements.
10. Turn ‘KLYSTRON REPELLER’ knob in the 510A clockwise to about 2 o’clock.
11. Turn the left-side 506 Variable Flap Attenuator to 0 dB.
6

12. Move probe on slotted line (505) to get a maximum deflection on the DC ammeter.
13. Adjust ‘POWER BALANCE’ knob in the 510A to obtain a maximum DC ammeterreading. Note : Turning knob clockwise increases meter reading; counter-clockwisedeceases reading.
14. Move the probe on slotted line (505) for a minimum reading.
15. Adjust the right-side 506 Variable Flap Attenuator for a reading of about 1/4 scale.(Note : You can also leave the 506 Variable Flap Attenuator at the maximum attenua-tion, 24 dB)
16. Slowly move the probe along the slotted line and measure locations of minima and max-ima (node and anti-node). Use the entire available slotted line range. Sometime themicrowave signal strength drifts or change due to Klystron power fluctua-tions. Therefore you may need to restart your measurements if such changesoccur.
17. Repeat your measurements to collect two runs (trials) F
18. Tabulate node and anti-node locations and intensity readings. F
19. Using consecutive measurements of node locations calculate the wavelength of the elec-tromagnetic wave travelling inside the waveguide (Use your knowledge of standing wavesto relate distance between nodes to its wavelength) F
20. Using consecutive measurements of anti-node locations calculate the wavelength of theelectromagnetic wave travelling inside the waveguide (Use your knowledge of standingwaves to relate distance between nodes to its wavelength) F
21. Assuming the standing wave travels at speed of light, calculate the frequency of thestanding wave travelled in the waveguide F
22. Perform this calculation for all your trials F
23. Find the average and standard deviation for wavelength and frequency of the standingwave travelled in the waveguideF
24. Using the necessary equation derived at the “Preliminary Lab Questions” calculate theexpected waveguide wavelength for mode numbers n = 0, 1, 2 and m = 0, 1, 2 given theinput microwaves are 9 GHz F
25. Does any of wavelength measurements closely match to the expected waveguide wave-length for mode numbers n = 0, 1, 2 and m = 0, 1, 2 F
26. Does your results agree with calculations? Use standard deviation and percent error todetermine this F
27. Using the equation 1 and the wavelength you measured, calculate the input wavelengthto the waveguide F
7

28. Using the input wavelength to the waveguide you just calculated in the above step,calculate the input frequency of the waveguide F
29. Does your results agree with the actual input microwave wavelength and frequency?Use standard deviation and percent error to determine this F
8