lab manual - chandigarh university
TRANSCRIPT

University School of Business
Lab Manual
On
Subject Name: Computer Application for Business
Lab
Subject Code: BAP-608
Mr. Sunil Sharma

Contents of Lab Manual
Semester: I
Name of the course and subject MBA/ Computer Applications for Business
Section
C
S. No. ITEM Annexure/Page no.
1 Scheme of Examination
2 Syllabus of the subjects
3 List of experiments as per curriculum
4 List of additional experiments

Vision and Mission of the Department
Vision of the Department
To create excellence in business management for nurturing value driven business leaders with
analytical and entrepreneurial mindset to foster innovative ideas in order to transform the world
and serve the society.
Mission Statements of the Department
M1 :Design a unique competency directed and industry relevant curriculum with outcome
oriented teaching learning process facilitated by world class infrastructure.
M2 :Enhance students’ cognitive, research, analytical, ethical and behavioral competencies
through programs that equip them to meet global business challenges in the professional
world.
M3 :Facilitate student centric sound academic environment with co-curricular and extra-
curricular activities to groom and develop future ready business professionals.
M4 : Design a transparent evaluation system for objective assessment of the program learning.
M5 :Align meaningful interactions with the academia, industry and community to facilitate
value driven holistic development of the students.
M6 :Develop ethical and socially responsible entrepreneurial attitude for harnessing the
environmental opportunities through creativity and innovation for a vibrant and sustainable
society.
Program Educational Objectives (PEOs)
Program Educational Objectives (PEOs) are the broad statements that describe career and
professional accomplishments that graduates will attain within a few years of graduation. After
successful completion of MBA program from Chandigarh University, the graduates will:
PEO1: Make significant impact as successful management professionals with a sound business
and entrepreneurial acumen leading to a promising career in the various management domains.
PEO 2: Develop the professional competence for astute decision making, organization skills,
planning and its efficient implementation, research, data analysis and interpretation with a
solution finding approach.
PEO 3: Be known for their team player qualities to handle diversity and the leadership skills to
make sound decisions while working with peers in an inter-disciplinary environment with people
of cross-cultural attributes

PEO 4: Be adaptable to new technology, innovations and changes in world economy that
positively impacts and contributes towards industry, academia and the community at large.
PEO 5: Be responsible citizens with high ethical conduct that will empower the business
organizations with high integrity, moral values, social effectiveness and legal business
intelligence.
University School Business CHANDIGARH UNIVERSITY, GHARUAN
Scheme of MBA BATCH (2018-2020)
Ist Semester
Subject
Code Subjects L T P Cr
BAT- 601 Accounting for Managers 3 2 0 4
BAT- 602 Fundamentals of Management and Organizational
Behaviour 4 0 0 4
BAT- 603 Managerial Economics 4 0 0 4
BAT- 604 Quantitative Techniques for Managers 3 2 0 4
BAT- 605 Marketing Management 4 0 0 4
PCT- 610 Professional Business Communication 3 0 0 3
PCP- 611 Professional Business Communication (LAB) 0 0 2 1
BAT- 608 Computer Applications for Business 2 0 2 4
BAT- 609 Supply Chain Management 3 0 0 3
TOTAL CREDITS IN SEMESTER 31
TOTAL NO. OF SESSIONS 35

SYLLABUS
BAT-608
Computer Applications for Business L T P C
Total Contact Hours : 60 Hours 2 0 2 4 MBA
Prerequisite Basic knowledge of Computers
Marks:100
Internal :40 External : 60
Course Objective
To understand the basics of a computer system, Computer networks and use of MS-office tools.
To develop an intuitive sense of how computers work and how they can be used to make work
more efficient.
Unit Course Outcome
1 Students will be able to know about the introduction of Computer Hardware Software
types its classification of computer various components of internet and its usage in
business
2 Student will be able to know the Computer Networks its Types ,Network
Topologies,OSI & TCP/IP Model in details
3
The students would acquire the MS-Word related skills which would enable them to do
several essential activities which are a part of their Business Management curriculum
like CV Writing, summer training report writing etc. Students will acquire the knowledge
in Data analysis using Excel, Power Point Presentation styles.
Content of the Syllabus
Unit-I
An Introduction to Computer Hardware and Software: Essential Components of Computers
Hardware, Firmware, Live-ware, Software-Types of Software, Relationship between hardware
and software, Classification of computer system, Number System. System Software-Translators,
interpreter, compiler, assemblers, linkers. Operating system- Overview and function of operating
system.
Case Studies: A study of Classification of Computers, Comparative Study of Operating
Systems.
Unit-II
Telecommunication and Networks: Telecommunications Media, Introduction to Networking
,Classification of Networks Network Topologies, Network types: LAN, MAN, WAN, Network
Architectures-The OSI Model, TCP/IP The Internet, Intranet and Extranets: Operation of the
Internet, Services provided by Internet, World Wide Web, Intranets and Extranets, IP
Addressing.

Introduction to E-commerce: Electronic Commerce Models, Value Chains in Electronic
Commerce, Types of E-Commerce, Advantage & disadvantages of E-Commerce-Commerce in
India.
Case Studies: A study of Computer Network Topologies, A study on E-Commerce
WEBSITES”
Unit-III
Software Packages for Office Applications- Word Processing using MS Word, Spreadsheets
using MS Excel, Presentations using MS Power Point
MS-Word: Word Basics, Rand () function, Working with fonts, Aligning text, Line spacing,
Page Numbering, Headers & Footers, Headers & Footers on even pages & odd pages, Drop Cap,
Page orientation, Page background, Bullets & Numbering, Printing Documents Drawing
features, Mail Merge,
Tables &Lists: Creating table, Adding rows & columns, Merging & splitting of cells, Using
formulas in tables, Converting text to table & vice versa, Lists and its various Types of List
MS-Excel: Excel basics, Worksheet vs. Workbook, Inserting and deleting worksheet, Rename
worksheet, Auto fill, Wrap text, merging of cells, Using filter, Sorting Data, Cell addressing,
Using formulas, Paste special, Cell referencing, Working of If function, Printing worksheets,
Inserting charts.
MS-PowerPoint: Basics, Different views of slide, apply design templates, Inserting header and
footer, slide transition, adding animation, Inserting charts, Action Buttons.
Case Studies: A comparative study of Word, Excel and PowerPoint, Creating A presentation on
a given topic
Text Books –
1. P. K. Sinha, Computer Fundamentals, BPB, New Delhi.
2. Sanjay Saxena, “A First Course in Computers”, Vikas Publication
3. K.Bajaj & D.Nag E-Commerce, The Cutting Edge of Business, TataMcGraw
4. Tally. Erp 9 Training Guide ,Asok K Nadhani, BPB publications
5. Using SPSS for Windows, Data Analysis and Graphics, Kristin Volkl and Susan
Gerber
Reference Material –

1. V.Rajaraman, Fundamentals of Computer, PHI Learning.
2. Peter Norton, Introduction to computers , Tata McGraw Hill, New Delhi.
BAT-608 Computer Applications for Business Lab
USB
Program Outcome A b c d e f g h i j k
Mapping of Course
outcome with Program
outcome
Category
BS
ES PD PC PE OE Project/
Training
Approval Date of meeting of the Board of Studies : 29-03-2018
NOTE FOR THE PAPER SETTER
The syllabus has been divided into three units. Paper setter will set 3 questions from each
unit and 1 compulsory question spread over the whole syllabus consisting of 5 short answer
questions. Compulsory question will be placed at number one. Candidate shall be required to
attempt 6 questions in all including compulsory question and selecting not more than 2
questions from each unit. All questions carry equal marks.

Content of the Syllabus (Unit-3)
MS WORD: Adding text, editing text, finding and replacing text, formatting text, character/line/paragraph
spacing, working with styles and text indentation.
Saving document with and without password.
Working with page layout, page setup i.e. setting margins, changing page size, changing page
orientation and applying page background.
Printing a document.
Inserting page numbers, headers and footers, footnote, endnote, date and time, pictures, objects,
shapes etc.
Creating bulleted and numbered lists.
Working with tables, paragraphs and columns.
Reviewing (track changes, adding comments etc.) and proof reading a document i.e. spellscheck
grammar etc.
Creating and working with table of content.
Mail merge.
MS EXCEL:
Entering data, formatting data i.e. applying borders, various formats (currency formats,
number formats etc.), fonts etc.
Creating custom lists, using auto fill, find and replace and editing text (cut, copy, paste and paste
special).
Working with formulae and functions.
Applying conditional formatting to data.
Sorting and filtering data (auto and advanced filter).
Performing Subtotals.
What-if-analysis using goal seek, scenarios and solver.
Pivot tables and data tables (one and two table input).
Working with charts (2D and 3D).
Adding comments,password protection to the workbook.
Working with page layout and printing options.
MS POWERPOINT:
Creating and formatting slides in a presentation.
Create a master slide with a logo, footer, and font.
Add notes to each slide.
Insert a graphic or picture.
Implement a background.

Place a text box in the title slide with your name.
Insert transitions for each slide.
Applying various effects (custom animation and transitional effects) in a presentation.
LIST OF EXPERIMENTS AS PER CURRICULUM
Laboratory Name programming LAB
Room No. 409,410
Semester: I
Subject Name: Computer Applications for Business Lab
Subject Code: BAP-608
Sr. No.
Experiment Name Objective of experiment
Observations (Parameters to be recorded)
Sample Reading taken by faculty (Yes/No) (Signature of Faculty/Coordinator)
1 How to use mail merge using
an Excel spreadsheet To learn the
basic usage
of mail
merging
Yes Yes
2 How to change text format in
ms word
To
understand
the basic
formatting
details of
msword
Yes Yes
3 How to change page margins
in MSword
To
understand
the basic
requirements
need for
page setting
in ms word.
Yes Yes
4 How to add bullets in MS-
Word
To learn the
importance
of indexing
Yes Yes
5 How to create a graph using
spreadsheets
To
understand
the use of
spreadsheets.
Yes Yes
6 To create a formula in cell C2
that multiplies a value entered
in cell A2 by a value in cell
To learn the
applications
of basic
Yes Yes

B2, formulas
7 To create a two data series
chart in Excel
To learn the
various
types of
chats
Yes Yes
8 How to work with Master Slide To discover the impact of master slide
Yes Yes
9 Create a power-point slide
using various features.
To discover
the features
of power-
point.
Yes Yes
10 How to Add or change an
effect for a picture
To learn
giving
effects using
power-point
Yes Yes

Experiment-1 How to use mail merge using an Excel spreadsheet
Step 1: Prepare data in Excel for mail merge
The most important step in the mail merge process is to set up and prepare your data. You'll use
your Excel spreadsheet as the data source for the recipient list.
Here are some tips to prepare your data for a mail merge. Make sure:
Column names in your spreadsheet match the field names you want to insert in your mail
merge. For example, to address readers by their first name in your document, you'll need
separate columns for first and last names.
All data to be merged is present in the first sheet of your spreadsheet.
Data entries with percentages, currencies, and postal codes are correctly formatted in the
spreadsheet so that Word can properly read their values.
The Excel spreadsheet to be used in the mail merge is stored on your local machine.
Step 2: Start the mail merge
1. In Word, choose File > New > Blank document.
2. On the Mailings tab, in the Start Mail merge group, choose Start Mail Merge, and then
choose the kind of merge you want to run.

3. Choose Select Recipients > Use an Existing List.
4. Browse to your Excel spreadsheet, and then choose Open.
5. If Word prompts you, choose Sheet1$ > OK.
Edit your mailing list
You can limit who receives your mail.
1. Choose Edit Recipient List.
2. In the Mail Merge Recipients dialog box, clear the check box next to the name of any
person who you don't want to receive your mailing.
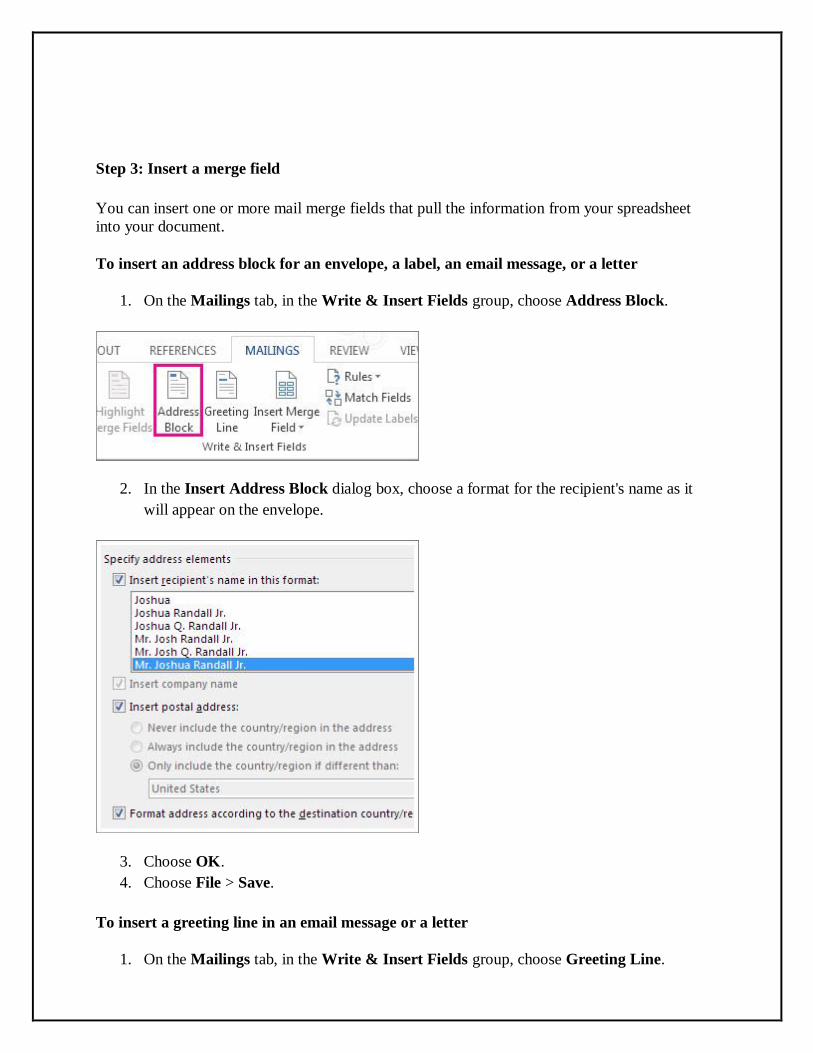
Step 3: Insert a merge field
You can insert one or more mail merge fields that pull the information from your spreadsheet
into your document.
To insert an address block for an envelope, a label, an email message, or a letter
1. On the Mailings tab, in the Write & Insert Fields group, choose Address Block.
2. In the Insert Address Block dialog box, choose a format for the recipient's name as it
will appear on the envelope.
3. Choose OK.
4. Choose File > Save.
To insert a greeting line in an email message or a letter
1. On the Mailings tab, in the Write & Insert Fields group, choose Greeting Line.

2. In the Insert Greeting Line dialog box, do the following:
o Under Greeting line format, change the salutation if necessary by choosing the
greeting (Dear is the default), the format for the recipient name, and the ending
punctuation (a comma is the default).
and
o Under Greeting line for invalid recipient names, choose an option in the
salutation list.
3. Choose OK.
4. Choose File > Save.
To insert data from your spreadsheet in an email message or a letter
1. On the Mailings tab, in the Write & Insert Fields group, choose Insert Merge Field.
2. In the Insert Merge Field dialog box, under Fields, choose a field name (column name
in your spreadsheet), and then choose Insert.
3. Repeat step 2 as needed, and choose Close when done.
4. Choose File > Save.
For more information about adding fields from your spreadsheet to the merge document,
see Insert mail merge fields. And if you're interested in learning more about options for setting
up email message, see Email merge in Word.
Step 4: Preview and finish the mail merge
After you insert the merge fields you want, preview the results to confirm that the content is
okay. and then you're ready to complete the merge process.
1. On the Mailings tab, choose Preview Results.

2. Choose the Next or Previous record button to move through records in your data
source and view how the records will appear in the document.
3. In the Finish group, choose Finish & Merge, and choose Print Documents or Send E-
mail Messages.
Step 5: Save your mail merge
When you save the mail merge document, it stays connected to your data source. You can reuse
the mail merge document for your next bulk mailing.
Open the mail merge document and choose Yes when Word prompts you to keep the
connection.

Experiment-2 How to change text format in ms word
To change the font size:
1. Select the text you want to modify.
2. Click the drop-down arrow next to the Font Size box on the Home tab. A drop-
down menu appears.
3. Select the desired font size from the menu. Alternatively, you can type the value
you want and then press Enter on your keyboard.
You can also use the Grow Font and Shrink Font commands to change the size.
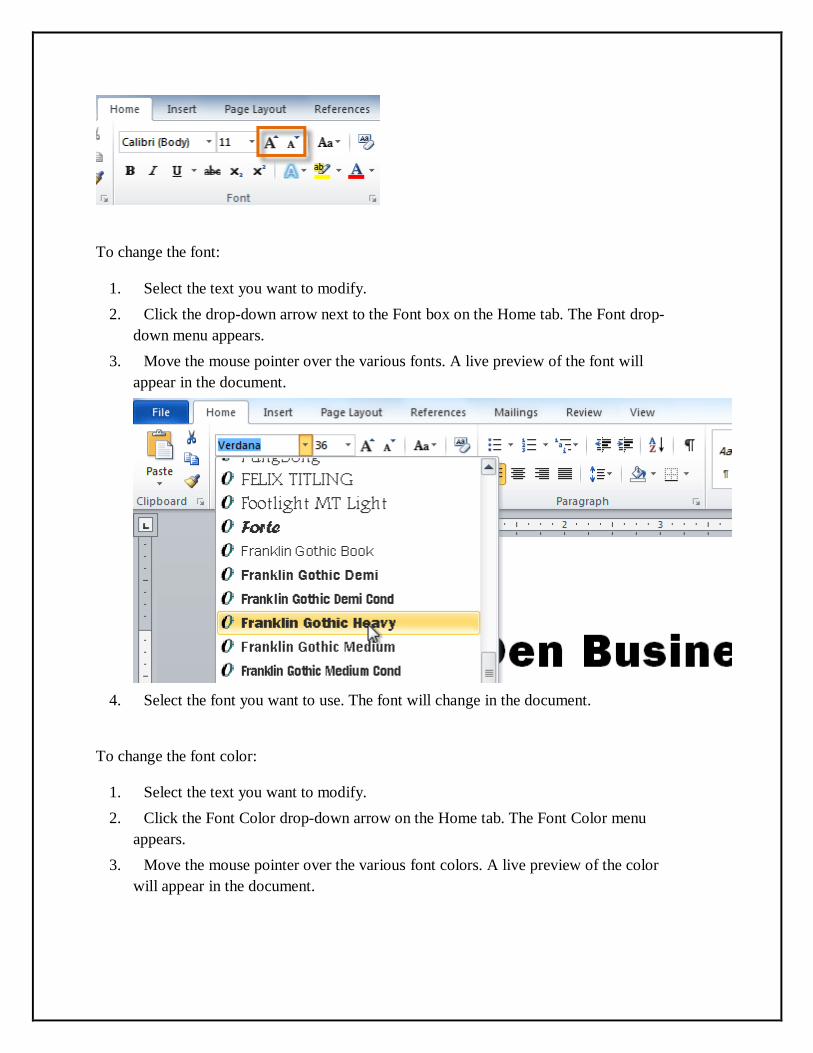
To change the font:
1. Select the text you want to modify.
2. Click the drop-down arrow next to the Font box on the Home tab. The Font drop-
down menu appears.
3. Move the mouse pointer over the various fonts. A live preview of the font will
appear in the document.
4. Select the font you want to use. The font will change in the document.
To change the font color:
1. Select the text you want to modify.
2. Click the Font Color drop-down arrow on the Home tab. The Font Color menu
appears.
3. Move the mouse pointer over the various font colors. A live preview of the color
will appear in the document.

4. Select the font color you want to use. The font color will change in the document.
Your color choices aren't limited to the drop-down menu that appears. Select More
Colors at the bottom of the list to access the Colors dialog box. Choose the color you
want, then click OK.
To highlight text:
1. From the Home tab, click the Text Highlight Color drop-down arrow.
The Highlight Color menu appears.
2. Select the desired highlight color.
3. Select the text you want to modify. It will then be highlighted.

4. To switch back to the normal cursor, click the Text Highlight Color command.
To use the bold, italic, and underline commands:
1. Select the text you want to modify.
2. Click the Bold, Italic, or Underline command in the Font group on the Home tab.
To change text case:
1. Select the text you want to modify.
2. Click the Change Case command in the Font group on the Home tab.
3. Select the desired case option from the list.

To change text alignment:
1. Select the text you want to modify.
2. Select one of the four alignment options from the Paragraph group on
the Home tab.
o Align Text Left: Aligns all selected text to the left margin
o Center: Aligns text an equal distance from the left and right margins
o Align Text Right: Aligns all selected text to the right margin
o Justify: Aligns text equally on both sides and lines up equally to the right
and left margins; used by many newspapers and magazines

Experiment-3 How to change page margins in MSword
If you are changing the margins for a whole document that is divided into sections, press
CTRL+A to select the entire document before you begin.
1. On the Page Layout tab, in the Page Setup group, click Margins.
2. Do one of the following:
o Click the margin type that you want. For the most common margin width,
click Normal.
o Click Custom Margins, and then in the Top, Bottom, Left, and Right boxes,
enter new values for the margins.

Change the default margins
You can change the default margins that Microsoft Office Word uses for all new blank
documents.
After you select a new margin for the document, click Margins in the Page Setup group
again, and then click Custom Margins.
In the Page Setup dialog box, click Default.
The new default settings are saved in the template on which the document is based. Each new
document based on that template automatically uses the new margin settings.
NOTE: The new default margin setting will not appear in the gallery list of margin settings.
Change line spacing
If a line contains a large text character, graphic, or formula, Microsoft Office Word increases the
spacing for that line.
1. Select the paragraph for which you want to change the line spacing.
2. On the Home tab, in the Paragraph group, click Line Spacing.
3. Do one of the following:
o To apply a new setting, click the number of line spaces that you want.
For example, if you click 1.0, the selected text is single-spaced.
o To set more precise spacing measurements, click Line Spacing Options, and then
select the options that you want under Line spacing.
Line spacing options
Single This option accommodates the largest font in that line, plus a small amount of extra
space. The amount of extra space varies depending on the font that is used.
1.5 lines This option is one-and-one-half times that of single-line spacing.
Double This option is twice that of single line spacing.

At least This option sets the minimum line spacing that is needed to fit the largest font or
graphic on the line.
Exactly This option sets fixed line spacing that Word does not adjust.
Multiple This option sets line spacing that is increased or decreased from single spacing by a
percentage that you specify. For example, setting line spacing to 1.2 will increase the space by
20 percent.
Move text or undo changes
Move or copy text and graphics
1. Select the item you want to move or copy.
2. Do one of the following:
o To move the item, press CTRL+X.
o To copy the item, press CTRL+C.
3. If you want to move or copy the item to another document, switch to that document.
4. Click where you want the item to appear.
5. Press CTRL+V.To adjust the format of the items that are pasted, click the Paste
Options button that appears just below your pasted selection, and then click the
option that you want.
Experiment-4: How to add bullets in MS-Word?
1. Position the insertion point where you want the bullet to appear.
2. Choose Symbol from the Insert menu. ...
3. Use the Font drop-down list to select the font you want to use for the bullet.
4. Double-click on the bullet character you want inserted.
5. Click on Close.

Experiment-5: How to create a graph using spreadsheets?
Enter your data into the spreadsheet. For example, in a graph showing the amount of money
spent over the course of a day where "X" is the time of day and "Y" is the amount of money
remaining:
A1 would say "Time".
B1 would say "Money".
A2 and down would have different times of the day (e.g., "12:00" in A2, "13:00" in A3,
etc.).
B2 and down would have decreasing amounts of money corresponding to the time in the
A column (e.g., "$20" in B2 would mean one had 20 dollars at noon, "$15" in B3 would
mean one had 15 dollars at one o'clock, etc.).
Click the top left cell. If you're following the above template, this will be the A1 cell. Doing so
will select it.
Hold down ⇧ Shift and click your data's bottom right cell. Performing this action will
highlight all of your data.
Click the Insert tab. You'll see this option in the green section of the top of the Excel window,
to the right of the Home tab.

Click Recommended Charts. It's toward the middle of the group of options near the top of the
window.
Click a chart option. You can choose from a list of recommended charts based on your data, or
you can click the All Charts tab at the top of this window to select one of Excel's many graph
variants.
Click OK. It's in the bottom right corner of the Recommended Charts window. Doing so will
create a chart from your selected data in the format of your choosing.
You can edit the graph's title by clicking it and then typing in a new title.
Experiment-6: To create a formula in cell C2 that multiplies a value entered in cell A2 by a
value in cell B2
1. Select cell C2.
2. Type = (equal sign).
3. Select cell A2 in the worksheet by using the mouse or the keyboard.
This action places the cell reference A2 in the formula in the cell.

To start the formula, type =, and then select cell A2.
4. Type * (Shift+8 on the top row of the keyboard).
5. Select cell B2 in the worksheet by using the mouse or the keyboard.
This action places the cell reference B2 in the formula.
6. Press Enter.
Excel displays the calculated answer in cell C2 and the formula =A2*B2 in the Formula bar.

Experiment-7: To create a two data series chart in Excel of data given below
Select the cell range A4:A8, C4:D8.
Click the Chart Wizard button and accept the default options in the sequence of four dialog
boxes. Your chart should look as shown below.
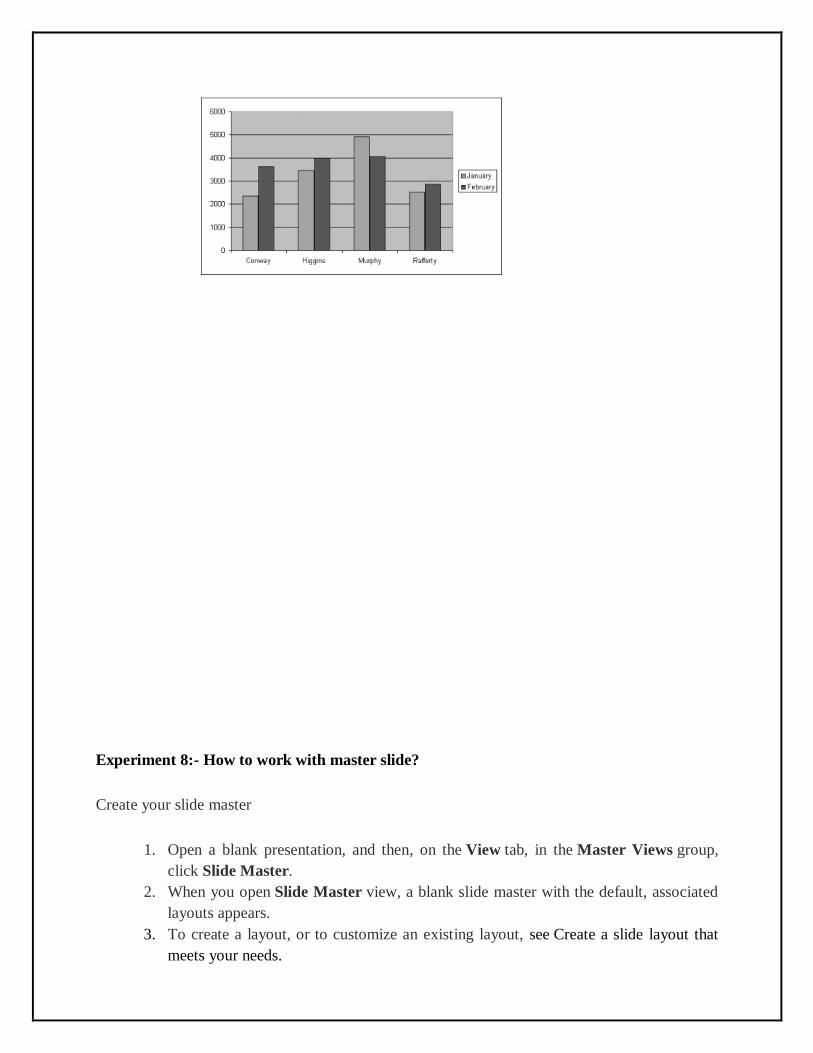
Experiment 8:- How to work with master slide?
Create your slide master
1. Open a blank presentation, and then, on the View tab, in the Master Views group,
click Slide Master.
2. When you open Slide Master view, a blank slide master with the default, associated
layouts appears.
3. To create a layout, or to customize an existing layout, see Create a slide layout that
meets your needs.

4. To add or modify placeholders in your layouts, see Add one or more content
placeholders to a layout or Change or delete a placeholder.
5. To remove any of the built-in slide layouts that accompany the default slide master, in
the slide thumbnail pane, right-click each slide layout that you want to delete, and
then click Delete Layout on the shortcut menu.
6. To apply a design or theme-based colors, fonts, effects and backgrounds, see Apply a
theme to add color and style to your presentation or Apply multiple themes to a
presentation.
7. To set the page orientation for all of the slides in your presentation, on the Slide
Master tab, in the Page Setup group, click Slide Orientation, and then click
either Portrait or Landscape.
8. On the File tab, click Save As.
9. In the File name box, type a file name.
10. In the Save as type list, click PowerPoint Template, and then click Save.
11. On the Slide Master tab, in the Close group, click Close Master View.
Experiment 9:- Create a powerpoint slide using various features.
Step 1: Open Microsoft PowerPoint.
Step 2: Go to File at the top of the screen and click New. A box that says “New Presentation”
should appear on the right side of your screen.

Step 3: In the “New Presentation” dialog box, click on “From Design Template.” You may then
scan through design templates and choose one that you like.
Step 4: Slide Design Select a design template by clicking on the template you like. You may
choose a different color for your template by clicking on “Color Schemes” in the “New
Presentation” dialog box. 1
Step 5: Slide Layout Change the Slide Layout. You may change the slide layout (how
information is presented in the slide) by going to the top of the screen and clicking on “Format”
– “Slide Layout.” A box will appear on the right side of your screen (where “New Presentation”
appeared) labeled “Slide Layout.” You may select a design by clicking on it.
Step 6: Adding Text Enter your text by clicking and then typing in the box titled “Click to Add
Text” or “Click to Add Title.”
Step 7: Adding Pictures You may add pictures by clicking on the box that says “Click to add
content.” Inside that box, there will be a smaller box with six icons. Click on the icon that looks
like a photograph of a mountain. A new window will open, allowing you to browse for a picture
on your computer or a CD. Once you find your picture, click on it and then click “Insert.”
Step 8: Resizing Pictures You may change the size of your picture by clicking on the picture.
The picture will then have black lines around it with small bubbles or boxes in the corners. Place
your mouse over the bubbles or boxes and click. Holding the mouse pointer down, drag the
picture to the size you want.
Experiment 10:- How to Add or change an effect for a picture
1. Click the picture that you want to add an effect to.
2. Under Picture Tools, on the Format tab, in the Picture Styles group, click Picture Effects.
LIST OF ADDITIONAL EXPERIMENTS:
Laboratory Name Programing LAB
Room No. 409,410

Semester: I
Subject Name: Computer Applications for Business
Lab
Subject Code: BAP-608
Sr. No.
Experiment Name Objective of experiment
Observations (Parameters to be recorded)
Sample Reading taken by faculty (Yes/No) (Signature of Faculty/Coordinator)
1 How to review spell checker
and grammer in Ms-word
To learn spell
checking Yes Yes
2 How to print a document in
Ms-word
To learn how
to print a
document
Yes Yes
3 How to insert headers and
footers in MS-WORD
To learn the
application of
headers and
footers
Yes Yes
4 Create what if analysis using
scenrios
To learn what
if analysis Yes Yes
5 How to create a pivot table in
MS-Excel.
To learn the
creation of
pivot table
Yes Yes
6 How to access filtering in
MS-Excel.
To learn filters
in excel Yes Yes
7 How to add notes in MS-
Powerpoint.
To learn the
adding of notes
Yes Yes
8 How to implement a
backgraound in Ms-
Powerpoint.
To learn the
application of
background
implementation
Yes Yes
9 how to change the orientation
of a single page in word
To learn single
page
orientation
Yes Yes
10 How to set tabs in MS-word
To learn the
seting of tabs Yes Yes

Experiment 1: How to review spell checker and grammar in Ms-word
By default, Word will use in-line spell checking. Words you misspell will appear with a red
squiggly underline — just right-click the word you meant to type to correct each typo.
Of course, Word doesn’t know every word that exists — especially names of things. To have
Word ignore a “misspelling” that is actually correct for the current document, select Ignore All.
If you plan on using the word a lot, click Add to Dictionary and Word will remember the word in
the future.

Experiment 2: How to print a document in MS-Word.
Preview your document
1. On the File menu, click Print.
2. To preview each page, click the forward and backward arrows at the bottom of the page.
If the text is too small to read, use the zoom slider at the bottom of the page to enlarge it.
3. Choose the number of copies, and any other options you want, and click the Print button.

Print specific pages
1. On the File menu, click Print.
2. To print only certain pages, print some of the document’s properties, or print tracked
changes and comments, click the arrow under Settings, next to Print All Pages (the
default), to see all your options.

3. To print only certain pages, do one of the following:
o To print the page shown in preview, select Print Current Page.
o To print consecutive pages like 1 -3, select Custom Print and enter the first and
last page numbers in the Pages box.
o To print individual pages and a range of pages (like page 3, and pages 4-6) at the
same time, select Custom Print, and enter the page numbers and ranges separated
by commas (e.g. 3, 4-6).

Experiment 3: How to insert headers and footers in MS-word.
1. Double-click anywhere on the top or bottom margin of your document. In our example,
we'll double-click the top margin.
2. The header or footer will open, and a Design tab will appear on the right side of
the Ribbon. The insertion point will appear in the header or footer.

3. Type the desired information into the header or footer. In our example, we'll type the
author's name.
4. When you're finished, click Close Header and Footer. Alternatively, you can press
the Esc key.

5. The header or footer text will appear.

Experiment 4: Create what-if-analysis using scenerios
What-If Analysis in Excel allows you to try out different values (scenarios) for formulas. The
following example helps you master what-if analysis quickly and easily.
Assume you own a book store and have 100 books in storage. You sell a certain % for the
highest price of $50 and a certain % for the lower price of $20.
Create Different Scenarios
But what if you sell 70% for the highest price? And what if you sell 80% for the highest price?
Or 90%, or even 100%? Each different percentage is a different scenario. You can use the
Scenario Manager to create these scenarios.
Note: You can simply type in a different percentage into cell C4 to see the corresponding result
of a scenario in cell D10. However, what-if analysis enables you to easily compare the results of
different scenarios. Read on.
1. On the Data tab, in the Forecast group, click What-If Analysis.

2. Click Scenario Manager.
The Scenario Manager dialog box appears.
3. Add a scenario by clicking on Add.
4. Type a name (60% highest), select cell C4 (% sold for the highest price) for the Changing cells
and click on OK.

5. Enter the corresponding value 0.6 and click on OK again.
6. Next, add 4 other scenarios (70%, 80%, 90% and 100%).
Finally, your Scenario Manager should be consistent with the picture below:

Note: to see the result of a scenario, select the scenario and click on the Show button. Excel will
change the value of cell C4 accordingly for you to see the corresponding result on the sheet.
Scenario Summary
To easily compare the results of these scenarios, execute the following steps.
1. Click the Summary button in the Scenario Manager.
2. Next, select cell D10 (total profit) for the result cell and click on OK.
Result:


Experiment 5: how to create a pivot table in MS-Excel.
1. Click a cell in the source data or
table range.
2. Go
to Insert > Tables > Recommen
ded PivotTable.
3. Excel analyzes your data and
presents you with several options,
like in this example using the
household expense data.
1. Click a cell in the source data or table range.
2. Go to Insert > Tables > PivotTable.
If you're using Excel for Mac 2011 and earlier, the PivotTable
button is on the Data tab in the Analysis group.
3. Excel will display the Create PivotTable dialog with
your range or table name selected. In this case, we're
using a table called "tbl_HouseholdExpenses".

4. Select the PivotTable that looks
best to you and press OK. Excel
will create a PivotTable on a new
sheet, and display the PivotTable
Fields List.
4. In the Choose where you want the PivotTable
report to be placed section, select New Worksheet,
or Existing Worksheet. For Existing Worksheet,
you'll need to select both the worksheet and the cell
where you want the PivotTable placed.
5. If you want to include multiple tables or data sources
in your PivotTable, click the Add this data to the
Data Model check box.
6. Click OK, and Excel will create a blank PivotTable,
and display the PivotTable Fields list.

Experiment6: how to access filtering in MS-Excel.
To filter data:
Click the Filter command on the Data tab. Drop-down arrows will appear beside each
column heading.
Click the drop-down arrow next to the heading you would like to filter. For example, if
you would like to only view data regarding Flavors, click the drop-down arrow next
to Category.

Uncheck Select All.
Choose Flavor.
Click OK. All other data will be filtered, or hidden, and only the Flavor data is visible.
To clear one filter:
Select one of the drop-down arrows next to a filtered column.
Choose Clear Filter From...


Experiment 7: how to add notes in MS-PowerPoint.
1. From the Normal View, click on the notes area at the bottom of the screen and start typing:
This method works fine when you have just a couple of lines to add as notes.
2.If you want to add longer notes, you can click on the View menu > Notes Page. In the Notes
View each page corresponds to a slide in your presentation and includes a reduce image of the
slide. You can insert text, drawings and even pictures in the Notes view in the same exact way
that you do in Slide View.
Experiment 8: how to implement a backgraound in Ms-Powerpoint.
To make this the background for a PowerPoint presentation, the image needs to be inserted into
your presentation.
1. Click the slide that you want to add a background picture to. To select multiple slides,
click a slide, and then press and hold CTRL while you click the other slides.
2. On the Design tab, in the Background group, click Background Styles, and then
click Format Background.
3. Click Fill, and then click Picture or texture fill.
4. To insert a picture from a file, click File, and then locate and double-click the picture that
you want to insert.
5. Do one of the following:
To use the picture as a background for the slides that you selected, click Close.
To use the picture as a background for all of the slides in your presentation,
click Apply to All.

Experiment 9: how to change the orientation of a single page in word
Use different orientations in the same document
1. Select the pages or paragraphs whose orientation you want to change.
2. Click Page Layout > Page Setup Dialog Box Launcher.
3. In the Page Setup box, under Orientation, click Portrait or Landscape.
4. Click the Apply to box and click Selected text.
Experiment 10: How to set tabs in MS-word
1. Click the cell where you want to set a tab stop.
2. Click Left Tab at the left end of the horizontal ruler until it changes to display the
type of tab you want.
3. Select one of the following types of tabs:
A Left Tab stop sets the left end of the text line. As you type, the text fills toward the right.
A Center Tab stop sets the position at the middle of the text line. As you type, the text
centers on this position.
A Right Tab stop sets the right end of the text line. As you type, the text fills toward the left.

A Decimal Tab stop aligns numbers around a decimal point. Without regard to the number of
digits, the decimal point remains in the same position. (When you use this type of tab stop, you
must align the numbers around a decimal character. You cannot use any other type of
character — such as a comma, a hyphen, or an ampersand symbol.)
A Bar Tab places a solid vertical line through selected text. Unlike other tabs, the bar tab is
added to the text as soon as you click the ruler. If you don't clear the bar tab stop before you print
your document, the vertical line is printed.