lab on a chip - wheeler microfluidics laboratorymicrofluidics.utoronto.ca/papers/hepatic...
TRANSCRIPT

Lab on a Chip
Publ
ishe
d on
02
July
201
4. D
ownl
oade
d on
31/
07/2
014
13:0
5:04
.
PAPER View Article OnlineView Journal | View Issue
3290 | Lab Chip, 2014, 14, 3290–3299 This journal is © The R
a Institute of Biomaterials and Biomedical Engineering, University of Toronto,
164 College St., Toronto, ON, M5S 3G9, Canada. E-mail: [email protected];
Fax: +1 (416) 946 3865; Tel: +1 (416) 946 3864bDonnelly Centre for Cellular and Biomolecular Research, 160 College St.,
Toronto, ON, M5S 3E1, Canadac Department of Chemical Engineering and Applied Chemistry, 200 College St.,
Toronto, ON, M5S 3E5, CanadadDepartment of Chemistry, University of Toronto, 80 St George St., Toronto, ON,
M5S 3H60, Canada
† Electronic supplementary information (ESI) available. See DOI: 10.1039/c4lc00531g
Cite this: Lab Chip, 2014, 14, 3290
Received 4th May 2014,Accepted 20th June 2014
DOI: 10.1039/c4lc00531g
www.rsc.org/loc
Hepatic organoids for microfluidic drugscreening†
Sam H. Au,ab M. Dean Chamberlain,abcd Shruthi Mahesh,ab Michael V. Seftonabc
and Aaron R. Wheeler*abd
We introduce the microfluidic organoids for drug screening (MODS) platform, a digital microfluidic
system that is capable of generating arrays of individually addressable, free-floating, three-dimensional
hydrogel-based microtissues (or ‘organoids’). Here, we focused on liver organoids, driven by the need
for early-stage screening methods for hepatotoxicity that enable a “fail early, fail cheaply” strategy in
drug discovery. We demonstrate that arrays of hepatic organoids can be formed from co-cultures of
HepG2 and NIH-3T3 cells embedded in hydrogel matrices. The organoids exhibit fibroblast-dependent
contractile behaviour, and their albumin secretion profiles and cytochrome P450 3A4 activities are better
mimics of in vivo liver tissue than comparable two-dimensional cell culture systems. As proof of principle
for screening, MODS was used to generate and analyze the effects of a dilution series of acetaminophen
on apoptosis and necrosis. With further development, we propose that the MODS platform may be a
cost-effective tool in a “fail early, fail cheaply” paradigm of drug development.
Introduction
The current drug development paradigm is unsustainable. Ofinvestigational new drugs (INDs) that enter Phase II (PhII)and Phase III (PhIII) clinical trials, 66% and 30% fail to tran-sition into the next stage of development respectively,representing a significant loss of capital investment andopportunity (i.e., resources that could have been directedtowards successful candidates, instead).1 It is widely recog-nized that a solution to this problem is to identify and elimi-nate INDs that are unlikely to pass clinical trials early in thedevelopment process – i.e., “fail early, fail cheaply”.2 Toaccomplish this, the US Food and Drug Administration hasstressed the need for in vitro screening tools that are capableof predicting toxicity and efficacy,3 which together accountfor roughly 96% of PhII and PhIII attrition.1 In the currentparadigm, eight key in vitro assays are routinely used in earlydrug development4 and have been designed to be compatible
with conventional two-dimensional (2D) multiwell plates androbotic platforms for high-throughput IND screening. But thehigh rates of PhII and PhIII attrition suggests that theseassays are ineffective in predicting in vivo clinical responses.This problem is particularly relevant for liver activity, asdrug-induced hepatotoxicity is the most common cause ofwithdrawal of drugs from the market.5
A widely used method for improving the predictiveness ofin vitro assays is to grow cells in an environment that betteremulates that of cells in vivo. For example, liver cells havebeen cultured in 3D self-assembled spheroid aggregates6–8 orsuspended within hydrogels,9–11 which greatly improves thedegree of liver-specific function and enzymatic activity.8,9,11
Although these methods have great promise, one of thereasons they have not been implemented routinely in thepharmaceutical industry is that the formation and addressingof these in vivo-like tissue constructs requires significantmanual manipulation and skill; they are for the most partnot well-suited for automated screening.
The tedium of 3D liver microtissue model assays can beaddressed using microfluidics. For example, microfluidicliver cell assays have been reported that rely on 3D cellaggregates,12–14 polylactic acid scaffolds,15 microfibers,16 com-partmentalized micronetworks,17,18 and cell-laden hydrogels.19
When compared with traditional 2D liver cell culture, thesesystems have significant advantages for increasing metabolicfunction,12,18 reconstituting native liver cell organization14
and studying interactions of liver cells with other celltypes.13,15,17,19 However, as noted by Toner and coworkers,18
oyal Society of Chemistry 2014

Lab on a Chip Paper
Publ
ishe
d on
02
July
201
4. D
ownl
oade
d on
31/
07/2
014
13:0
5:04
. View Article Online
a “fundamental limitation” of such systems is their inabilityto address individual constructs or wells within a singledevice. Stated a different way, all of the microfluidic systemsfor 3D liver cell culture that we are aware of12–19 are “singlepot” techniques, in which all of the cells in a given device areexposed to the same conditions. This limits the applicabilityof these tools for screening activities (e.g., the evaluation ofmultiple INDs at different concentrations).
With these limitations in mind, we introduce a newmethod called microfluidic organoids for drug screening(MODS). MODS allows for the generation and culture of threedimensional micro-scale “organoids” containing liver cells,followed by analysis in an individually addressable format,enabling the evaluation of multiple IND candidates or con-centrations on an automated device. MODS relies on digitalmicrofluidics (DMF), an electrodynamic method of micro-scale (nanoliter to milliliter volumes) fluid manipulation.20,21
DMF has recently been applied to live cell applicationsincluding the culture and analysis of cell lines,22–25 micro-organisms,26 cells in hydrogels,27,28 and primary cells.29
Importantly, a recent report confirmed that DMF actuationunder typical operating conditions causes no observabledetrimental effects on mammalian cell gene expression andDNA integrity.30
In comparison to the microfluidic methods for analyzing3D liver constructs reported previously,12–19 MODS is uniquein the ability to address each tissue construct individually,allowing for the evaluation of different conditions simulta-neously. Moreover, MODS allows for the automation of time-consuming processes such as the generation of mixtures andthe formation of serial dilution series, all on devices with nomoving parts and valve-less fluid manipulation. Furthermore,inexpensive DMF devices have recently been formed frompaper31, which suggests that future manifestations of MODSand related techniques may be useful for efficient screeningof lead drug candidates rapidly and with low cost.
Materials and methods
Unless specified otherwise, general-use and cell-culturereagents were purchased from Sigma-Aldrich (Oakville, ON).Parylene-C dimer was obtained from Specialty CoatingSystems (Indianapolis, IN). Teflon-AF 1600 was from DuPont(Wilmington, DE), and A-174 silane was from GE Silicones(Albany, NY). SU-8 3035 and SU-8 developer were from Micro-chem Corp. (Newton, MA). Photomasks were printed with20 000 dpi resolution by Pacific Arts and Design (Toronto,ON). All working solutions were supplemented with 0.06%(wt/v) Pluronic F88 (BASF Corp., Florham park, NJ, USA) tolimit fouling.30,32 Unless specified otherwise, all experimentswere replicated three times or more.
Device fabrication and operation
Digital microfluidic devices were fabricated in the Universityof Toronto Nanofabrication Centre (TNFC). Glass substrates
This journal is © The Royal Society of Chemistry 2014
bearing patterned chromium electrodes (used as bottomplates of DMF devices) were formed by photolithography andetching as described previously.33 After patterning, the sub-strates were primed for Parylene-C coating by immersingthem in silane solution (isopropanol, DI water, and A-174,50 : 50 : 1 v/v/v) for 15 min, allowing them to air-dry and thenwashing with isopropanol. After priming, substrates werecoated with Parylene-C (6.9 μm) by evaporating 15 g of dimerin a vapor deposition instrument (Specialty Coating Systems).SU-8 retention barriers were formed by pre-heating thesubstrates on a hot-plate at 95 °C for 5 minutes before spincoating ~5 mL SU-8 3035 for 10 s at 500 rpm followed imme-diately by a second 30 s spin at 1000 rpm. SU-8 coated sub-strates were ramp heated (~3 °C min−1) on a hot-plate from65 °C to 95 °C for 20 min before ramp cooling (~3 °C min−1)to 65 °C. Substrates were exposed through a negative photo-mask for 10 seconds and then ramp heated on a hot-platefrom 65 °C to 95 °C for 5 min before ramp cooling to 65 °C.Substrates were developed for 10 min in SU-8 developer,washed with isopropanol, dried with nitrogen gas and bakedat 170 °C for 10 min. Finally, a 235 nm layer of Teflon-AF wasspin-coated (1% in Fluorinert FC-40, 2000 rpm, 60 s) and thesubstrates were post-baked on a hot-plate (160 °C, 10 min).Unpatterned top plates were formed by spin-coating indiumtin oxide (ITO) coated glass substrates (Delta Technologies,Stillwater, MN) with Teflon-AF (235 nm, as above). Devices wereassembled with a patterned bottom plate and an unpatternedtop plate joined by spacers formed from Scotch® double-sidedtape (3M Canada, London, ON) (~180 μm thick). Dropletswere manipulated by applying 220 Vpp, 5 kHz sinusoidalpotentials to bottom-plate electrodes relative to the top-plateelectrode using the DropBot open-source automated high-voltage switching system.34
Fig. 1 depicts the device geometry. Briefly, the bottom-plate device design comprises 65 electrodes, including a2 × 17 array of 2.2 × 2.2 mm electrodes, five “large” reservoirs(10.0 × 6.5 mm) and four “small” reservoirs (8.4 × 4.0 mm).Each large reservoir is connected to the array by two 2.2 ×2.2 mm electrodes, while each small reservoir is connected tothe array by four 1.5 × 1.5 mm electrodes. The 1.5 × 1.5 mmelectrodes serve as “organoid culture regions”, each with anSU-8 retention barrier. Each retention barrier features eitherfifteen 200 × 100 × 70 μm rectangular SU-8 pillars or fourteen50 × 200 × 70 μm oval SU-8 pillars separated by 50 μm inter-pillar gaps.
Cell handling and preparation
HepG2 cells and NIH-3T3 cells were maintained separately infeed media [50/50 DMEM/F12 with 8% fetal bovine serum (FBS),2% calf serum (CS), 100 IU mL−1 penicillin and 100 μg mL−1
streptomycin] by passaging every 3–4 days. For use informing organoids, the two cell types were trypsinized with0.25% trypsin–EDTA for 5 minutes at 37 °C followed byresuspension in separate centrifuge tubes in feed media at4.0 × 107 cell mL−1 concentrations. Collagen–cell suspensions
Lab Chip, 2014, 14, 3290–3299 | 3291

Fig. 1 Microfluidic organoids for drug screening (MODS). (A) Photograph of a MODS device. (B) Photomicrograph of the organoid culture regiondefined by a retention barrier (scale bar represents 0.75 mm). (C) Top-view (top) and side-view (bottom) schematics of MODS device. (D) Generalorganoid droplet exchange procedure (GODEP) for reagent/dye exchange and sample extraction. See online ESI† for a detailed examination ofdroplet mixing efficiency.
Lab on a ChipPaper
Publ
ishe
d on
02
July
201
4. D
ownl
oade
d on
31/
07/2
014
13:0
5:04
. View Article Online
were prepared on ice in 1.5 mL microcentrifuge tubes bycombining and mixing the solutions listed in Table 1 from3D collagen cell culture kits using pipette aspiration (Millipore,Inc., Billerica, MA).
Organoid formation and reagent exchange
Device top and bottom plates were washed separately with70% ethanol and allowed to air dry in a laminar flow hoodprior to assembly with spacers. 6.0 μL aliquots of collagen–cell suspensions were electrodynamically loaded onto smallreservoirs and 315 nL droplets were dispensed onto 1.5 ×1.5 mm driving electrodes adjacent to SU-8 retention barriers.The droplets were allowed to gel (forming organoids) for1 hour at 37 °C/5% CO2. The organoids were then “fed” withfeed media using a process that that we call the “general
3292 | Lab Chip, 2014, 14, 3290–3299
Table 1 Liver organoid components. Volumes (μL) of components used to cre
ComponentCo-culture0.9 mg mL−1 collagen
Mono-cultu0.9 mg mL−
Collagen I 80 805× DMEM 20 20Feed media 166 18110% (wt/v) F88 1.8 1.8Neutralization buffer 2.5 2.54.0 × 107 HepG2 mL−1 15 154.0 × 10⁷ NIH-3T3 mL−1 15 0
organoid droplet exchange procedure” (GODEP), which isdepicted in Fig. 1D. GODEP delivers fresh media or reagentsto organoids and removes spent media from devices for subse-quent analysis. Briefly, in a typical GODEP, 12 μL aliquots offeed media (or other reagents, as described below) are loadedinto 10.0 × 6.5 mm reservoirs and then 1.36 μL droplets aredispensed onto the 2.2 × 2.2 mm electrode array. Up to fourof these droplets are independently delivered to organoid-containing droplets, and the merged contents are mixed byactuation across five linear electrodes in the organoid cultureregion (see the online ESI† for an analysis and discussion ofmixing in GODEP). Media in excess of 630 nL (equivalent tothe volume associated with two 1.5 × 1.5 mm electrodes) arethen dispensed from merged droplets for extraction either towaste or for subsequent analysis from the edge of the deviceusing a blunt tip 24 gauge needle connected to a 1 mL syringe.
This journal is © The Royal Society of Chemistry 2014
ate collagen–cell suspensions which gel to become organoids
re1 collagen
Co-culture1.5 mg mL−1 collagen
Mono-culture1.5 mg mL−1 collagen
80 8020 2061 701.1 1.12.5 2.59.1 9.19.1 0

Fig. 2 Liver organoid contractility and viability. (A) Photomicrographs of representative organoids cultured on MODS platform on day 0 (top)and day 4 (bottom) after gel formation. Organoids were seeded with HepG2 cells (2 × 10⁶ cell mL−1) with or without NIH-3T3 fibroblasts(2 × 10⁶ cell mL−1 each) in low (0.9 mg mL−1) or high (1.5 mg mL−1) density collagen. Scale bar represents 200 μm. (B) Photomicrographs of repre-sentative organoids cultured on a DMF platform 4 days after gel formation in brightfield (top), stained for viability with calcein-AM (green, middle)and stained for cell death with ethidium homodimer-1 (red, bottom). Organoids were seeded with HepG2 cells (2 × 10⁶ cell mL−1) with or withoutNIH-3T3 fibroblasts (2 × 10⁶ cell mL−1 each) in low (0.9 mg mL−1) or high (1.5 mg mL−1) density collagen. Scale bar represents 100 μm.
Lab on a Chip Paper
Publ
ishe
d on
02
July
201
4. D
ownl
oade
d on
31/
07/2
014
13:0
5:04
. View Article Online
Viability and contractility assays
Liver organoids were formed on device, incubated at37 °C/5% CO2 and maintained by feeding with feed mediausing GODEP (as described above) every day for four days.On the fourth day, PBS droplets containing 5.86 μM calcein
This journal is © The Royal Society of Chemistry 2014
AM and 11.72 μM ethidium homodimer-1 (Life Technologies,Inc., Burlington, ON, Canada) were merged with organoiddroplets (to final concentrations of 4 μM and 8 μM respec-tively). Merged droplets were mixed and excess media splitfrom organoid cultures. Organoids were incubated at roomtemperature for 30 minutes before washing with PBS droplets
Lab Chip, 2014, 14, 3290–3299 | 3293
Lab on a ChipPaper
Publ
ishe
d on
02
July
201
4. D
ownl
oade
d on
31/
07/2
014
13:0
5:04
. View Article Online
using GODEP and analyzed using microscopy (Leica DM2000,Leica Microsystems Canada).
Albumin analysis
Liver organoids were formed and maintained as above exceptthat droplets containing spent media were removed fromdevices during GODEP on days 1–4 and frozen in 0.6 mLmicrocentrifuge tubes at −80 °C until analysis. Albumin levelswere quantified using a human albumin enzyme-linkedimmunosorbent assay (ELISA) Kit (Abnova Corporation,Taipei, Taiwan) following the manufacturer's recommendedguidelines. The measured albumin levels were dilution-adjusted by multiplying the values by 3.16 [the ratio of themerged droplet volume (1.99 μL) to that of the cultureorganoids volume (0.63 μL)] to obtain the concentration ofalbumin in organoid culture droplets.
Enzymatic activity assay
Liver organoids were formed in the same manner as above asHepG2 & NIH-3T3 co-culture constructs. GODEP was used tointroduce feed media containing reagents and remove anequal volume of excess liquid to organoid cultures daily.Three populations of organoids were treated for three consec-utive days: control, induced, and induced-inhibited. Controlorganoids were fed on days one and two with 1.36 μL feeddroplets containing 1.46% (v/v) ethanol (to a final concentra-tion in the organoid droplet of 1.0 %). Induced and induced-inhibited organoids were fed on day one with 1.36 μL feeddroplets containing 14.6 mM dexamethasone and 1.46% (v/v)ethanol (to concentrations in the organoid droplet of10.0 mM and 1.0%, respectively) and on day two with feeddroplets containing 10.0 mM dexamethasone and 1.0%ethanol. Control and induced organoids were fed on daythree with 1.36 μL feed droplets containing 0.146% (v/v) etha-nol (to 0.10% final concentrations in the organoid droplets).Induced-inhibited organoids were fed on day three with1.36 μL feed droplets containing 14.6 mM ketoconazole and0.146% (v/v) ethanol (to concentrations in the organoid drop-let of 10.0 mM and 0.10%, respectively). For all conditions,one hour after the feeding on day three, 1.36 μL droplets offeed media containing 14.6 mM Vivid® BOMR dye (LifeTechnologies, Inc.) were added to each organoid culture toobtain a final dye concentration of 10.0 mM.
Two-dimensional macro-scale assays were performed forcomparison. On day zero, 50 μL aliquots of PBS containing0.1 mg mL−1 neutralized collagen I were dispensed into eachwell of tissue culture treated polystyrene flat-bottom 96well plates (Corning, Inc.), incubated at 37 °C/5% CO2 for60 minutes, aspirated dry and allowed to air dry for30 minutes in a laminar biosafety cabinet. 1.0 × 10⁵ HepG2cells and 3.0 × 10⁴ NIH-3T3 cells were seeded into 100 μLfeed medium per well and incubated at 37 °C/5% CO2. Analo-gous three-day control, induced, and induced-inhibited con-ditions were defined and implemented as for DMF (asabove). In place of GODEP, each feed was implemented byaspirating the well contents and replacing them with 100 μL
3294 | Lab Chip, 2014, 14, 3290–3299
aliquots of the new contents (to the same final concentra-tions as described above).
For both microscale and macroscale cultures, the fluores-cence intensity was measured immediately upon adding thedye and every 15 minutes afterwards for 1 hour, with incuba-tion at 37 °C/5% CO2 between time-points, using a Pherastarmultiwell plate reader (BMG Labtech) at 530/620 nm wave-length excitation/emission. Fluorescent intensity was normal-ized to the starting intensity for each culture droplet orculture well by baseline subtracting untreated controls. Enzy-matic activity was estimated by the rate at which the fluores-cent intensity increased over time.
Hepatotoxicity assay
Liver organoids were formed in the same manner as aboveexcept NIH-3T3s were excluded. After incubation at 37 °C/5%CO2 for 24 h, a dilution series of droplets was formed on chipand merged with organoid cultures to final acetaminophen(acetyl-para-aminophenol or APAP) concentrations of 0, 5.0,10.0 and 20.0 mM. Briefly, two 10.0 × 6.5 mm reservoirs wereloaded with 12 μL of feed media containing either 2.93%(v/v) ethanol or 29.3 mM APAP and 2.93% ethanol. One1.36 μL droplet of each concentration was dispensed, and thetwo droplets were merged and mixed by linear actuationacross four 2.2 × 2.2 mm electrodes 5 times. The mixed drop-let was split into two droplets of equal volume (eachcontaining 14.7 mM APAP). A second 1.36 μL droplet ofAPAP-free feed media was dispensed and merged with one ofthe droplets containing 14.7 mM APAP, and subsequentlymixed and split (as above) to form two droplets of equalvolumes (each containing 7.3 mM APAP). One droplet con-taining 7.3 mM APAP was delivered to waste and then oneadditional 1.36 μL droplet was dispensed from each reservoir,leaving four 1.36 μL droplets of feed media containing 0, 7.3,14.7 and 29.3 mM APAP. These droplets were then deliveredto organoids using GODEP, forming final concentrations of0, 5.0, 10.0 and 20.0 mM APAP. Organoids were then culturedfor 24 hours at 37 °C/5% CO2 before trinuclear staining byGODEP with 1.36 μL droplets of PBS containing 11.72 μMHoescht 33342 (Life Technologies), 11.72 μM ethidiumhomodimer-1 and 7.33 μM NucView488 (Biotium, Inc.,Hayward, CA, USA) with organoid culture droplets to obtainfinal concentrations of 8.00, 8.00 and 5.00 μM respectively.Excess media was removed and organoids were incubated at37 °C/5% CO2 for 60 minutes before washing with PBS drop-lets using GODEP and analyzed using a Nikon A1R confocalmicroscope system (Nikon Canada, Mississauga, Canada)by laser excitation at 408, 488 and 562 nm through a total of22–23 z-dimension slices (spaced 10 μm apart) per organoid.For each condition conducted in duplicate, three predeterminedphotomicrographs of each organoid were selected for quanti-tation from (a) the center of the z-stack, (b) 40 μm above thecenter, and (c) 40 μm below the center. All photomicrographswere manually examined to ensure that no nuclei were countedmultiple times. CellProfiler software (Broad Institute, Cambridge,MA, USA) was used to quantify the number of positive stained
This journal is © The Royal Society of Chemistry 2014

Lab on a Chip Paper
Publ
ishe
d on
02
July
201
4. D
ownl
oade
d on
31/
07/2
014
13:0
5:04
. View Article Online
cells on each channel using two class Otsu Global thresholdingand weighted variance with a threshold correction factor of 0.7.
Results and discussionDevice design and operation
Microfluidic organoids for drug screening (MODS) is a newsystem that allows for the generation, culture and analysis ofthree dimensional liver-like microtissues. Each organoid is afree-floating 3D construct (~100–1000 μm diameter post-contraction) containing a hydrogel matrix and one or moretypes of cells (described in detail below). In contrast to allother microfluidic/liver techniques that we are aware of,12–19
in MODS, each organoid is individually addressable, andthus can be used to probe the effects of an array of differentconditions (e.g., different INDs or different concentrations ofIND) on individual trackable constructs over time. The MODSsystem relies on electrodynamic digital microfluidic (DMF)fluid manipulation, and a typical device is shown in Fig. 1A.
In developing MODS, we determined that a key require-ment was the ability to work with free-floating microtissuesto allow for cell-driven contraction and remodeling. Thispresents a challenge for fluid exchange – in all previous DMFmethods for working with mammalian cells, fluids wereexchanged for cells adhered to a device surface22–24 orembedded in an adhered matrix.27,28 To accommodate fluidexchange for free-floating microtissues, the MODS systemwas designed to include arrays of microposts that serve as reten-tion barriers to confine organoids to predetermined locations.Rectangular and oval microposts were evaluated and were foundto be equally effective at organoid confinement (data not shown).However, oval microposts more consistently permitted dropletsto merge across the posts (Fig. 1D “step 3”) (data not shown)and were subsequently used for most experiments. The onlyprevious report of this type of physical barrier in a DMF systemthat we are aware of was reported by Mousa et al.,35 who usedthe barriers for an unrelated purpose (to aid in partitioningnon-mixing solvents for liquid–liquid extraction).
In initial experiments, a general organoid dropletexchange procedure (GODEP) was developed (Fig. 1D), whichis described in detail in the experimental section. Briefly, oneor more droplets of feed media or other reagents are drivento organoid culture regions and subsequently merged andmixed with the organoid-containing droplets. Excess media isthen driven to a waste reservoir or is saved for subsequentanalysis. Reagent concentrations are thus diluted to knownconcentrations, and multiple GODEPs can be implementedsequentially to further concentrate or dilute reagents whenrequired. A detailed examination of droplet mixing duringGODEP is described in the online ESI.† In typical experi-ments, organoids were cultured on-chip for several daysusing GODEP to exchange culture media every 24 hours.
Organoid characterization
The 3D organoids described here were designed to recapitu-late in vivo liver function more accurately than conventional
This journal is © The Royal Society of Chemistry 2014
2D in vitro cell culture. In practice, HepG2 cells were embed-ded in 3D hydrogel matrices comprising collagen I, a nativeextracellular matrix protein known to direct cells into pheno-types that more closely resemble those found in vivo.36 Inaddition, we evaluated the use of NIH-3T3 fibroblasts as acomponent of the DMF liver organoids, as they are known toactively remodel hydrogels10 and provide biochemical signalsrequired for liver cell activity.37
Three metrics were used to characterize liver organoids:construct contractility, viability and albumin production. Forthe first metric, cells grown in hydrogel matrices are knownto remodel and contract their local microenvironments. Thiseffect is an important parameter to measure for a number ofreasons. First, even a modest hydrogel contraction can signif-icantly increase cell densities. For example, an isometric con-traction to half the original length scales results in an 8-foldreduction in total volume, or an 8-fold increase in cell density(before accounting for cell division or other processes). Thisallows for the study of cell densities that are close to those ofnative tissue (~109 cell cm−3 in liver38). Second, hydrogel con-traction coupled with matrix protein remodeling can increasethe likelihood of cells coming into physical contact with eachother, which may be important because hepatocyte–hepatocytecontact is known to inhibit division-related processes whileincreasing liver-specific functions.39 Third, hydrogel contrac-tion also increases matrix stiffness, which affects a widerange of cellular processes including growth, morphologyand migration.40
Fig. 2A depicts representative liver organoids evaluated incontractility assays. HepG2 cells were seeded with or without2 × 106 cell mL−1 NIH-3T3 cells and at ‘low’ (0.9 mg mL−1) or‘high’ (1.5 mg mL−1) collagen I concentrations and were eval-uated on day zero and after four days in culture. As expected,the presence of NIH-3T3 fibroblasts substantially increasedthe contraction over 4 days relative to organoids withoutfibroblasts. Collagen density also played a role in this pro-cess, with high collagen density slightly inhibiting the magni-tude of contraction. The presence or absence of fibroblasts atthe concentrations used in this study had a greater impacton the contraction than did the change in collagen density.Importantly, the diameter of organoids, even when seededwith NIH-3T3 cells in low density collagen, did not decreaseto smaller than the gaps in the retention barrier (~50 μm).Similar levels of contraction in microgels seeded withfibroblasts have been reported previously for pooled systems10
(i.e., many microgels in a chamber). However, as far as we areaware this is the first report of work in which the contractionof individually addressable hydrogel constructs can be moni-tored over time. We propose that MODS is uniquely wellsuited for creating individually suspended hydrogels on anopen platform which are free to contract in three dimensions.
For the second characterization metric for liver organoids,viabilities were assessed to determine the effects of cultureconditions, including the degree of contraction, on cellhealth. As shown in Fig. 2B, the majority of cells remainedviable after four days in culture as determined by calcein-AM
Lab Chip, 2014, 14, 3290–3299 | 3295

Lab on a ChipPaper
Publ
ishe
d on
02
July
201
4. D
ownl
oade
d on
31/
07/2
014
13:0
5:04
. View Article Online
staining, with few dead cells (determined by ethidiumhomodimer-1 staining) observed in any of the tested condi-tions. This suggests that there is adequate diffusion of nutri-ents into and adequate diffusion of waste products out ofhydrogel organoids. Contraction and viability measures togetherprovided an approximate measure of cell health and activity.
For the third characterization metric for liver organoids,albumin production was chosen as a general measure of liverfunctional activity.41 To assay the amount of albuminsecreted, media was collected during daily feeds from MODScultures using GODEP (Fig. 1D) and assayed for human albu-min. As shown in Fig. 3, for the first 3 days, no significantdifference in albumin levels was observed between HepG2organoids and HepG2/NIH-3T3 organoids, but by day 4,the co-cultured organoids generated significantly ( p < 0.05)greater levels of albumin (1.03 × 10⁴ ± 1.40 × 10³ ng mL−1)than mono-culture organoids (3.24 × 10³ ± 1.39 × 10³ ng mL−1).This finding is consistent with previous results,11,42,43 con-firming that co-culture with fibroblasts improves the functionalactivity of HepG2 hepatocytes and may be related to the con-tractility of the organoids as described above. Interestingly,there were no statistical differences in albumin levels betweenorganoids cultured in low or high collagen densities.
The results described above confirm that the MODS tech-nique can be used to form and maintain viable 3D liver organoidswith robust hepatocyte activity on-chip for multiple days. Toevaluate the suitability of MODS for drug screening, twocommon assays were evaluated: CYP activity and hepatotoxicity.Fully contracted organoids formed with low concentration ofcollagen (0.9 mg mL−1) were used in these experiments, whichare described below.
CYP enzymatic activity
Cytochrome P450 (CYP) is a superfamily of proteins foundprimarily in the liver which are responsible for the catalysisof organic substances.44 These enzymes are of particular
3296 | Lab Chip, 2014, 14, 3290–3299
Fig. 3 Organoid albumin secretion assay. Concentration of secretedalbumin in liver organoid media collected during daily feedsdetermined using an ELISA for human albumin. Organoids werecreated with HepG2 cells, with (closed symbols) or without (opensymbols) NIH-3T3 fibroblasts and in either low (0.9 mg mL−1) (purple/blue circles) or high (2.9 mg mL−1) (red/green squares) collagen. Errorbars represent ±1 standard deviation, n = 3.
interest to the pharmaceutical industry because they meta-bolize many drugs and antibiotics. In addition, some smallmolecules are known to interfere with CYP enzymatic activity,delaying the clearance of other drugs or toxins in vivo.45 Inthis work, we evaluated the activity of human CytochromeP450 isoform 3A4 (CYP3A4) in liver organoids after incubationwith compounds known to either induce or inhibit CYP3A4enzymatic activity. Dexamethasone, an anti-inflammatory andimmunosuppressant drug was used as a model CYP3A4inducer, and ketoconazole, an anti-fungal drug, was used asa model CYP3A4 inhibitor. CYP3A4 activity was monitoredusing a fluorogenic substrate (BOMR) with specificity toCYP3A446,47 in no treatment, induced, or induced-inhibitedHepG2/NIH-3T3 co-cultures. The cultures were grown eitheras 2D monolayers in well plates or as 3D organoids inDMF devices. As shown in Fig. 4A, the rates of substratemetabolism (as determined by the slopes of the curves)by HepG2/NIH-3T3 co-cultured cells in 2D monolayersin well-plates were indistinguishable, regardless of the
This journal is © The Royal Society of Chemistry 2014
Fig. 4 Organoid cytochrome P450 3A4 assay. HepG2 and NIH-3T3laden organoids were untreated (blue circles), incubated with 10 mMdexamethasone for 48 hours prior to assay (red squares), or incubatedwith 10 mM dexamethasone for 48 hours plus 10 mM ketoconazolefor 1 hour (green diamonds) prior to assay. Assays and cultures wereconducted on HepG2/NIH-3T3 co-cultures in (A) two-dimensionalformat in 96 well plates or (B) three-dimensional organoids by MODS.Error bars represent ±1 standard deviation, n = 3.

Lab on a Chip Paper
Publ
ishe
d on
02
July
201
4. D
ownl
oade
d on
31/
07/2
014
13:0
5:04
. View Article Online
treatment condition. In contrast, the rates of substrate metabo-lism were clearly distinguishable in 3D DMF-cultured organoids(Fig. 4B). Dexamethasone-treated organoids demonstrated asignificantly higher rate (p < 0.05) of BOMR metabolism (slopeof 6.86 ± 0.77 intensity units min−1) and ketoconazole-treatedorganoids significantly lower ( p < 0.01) metabolism (slope of1.72 ± 0.57 intensity units min−1) than untreated controlorganoids (slope of 4.67 ± 0.20 intensity units min−1). The dif-ferences in slopes were consistent with the expected changesto CYP activity as a result of treatment with chemicalinducers and inhibitors. Hepatocyte CYP activity has beenshown to be higher in three dimensional systems than intraditional two dimensional formats,48 which may explainthe higher HepG2 liver-specific function in the DMF platformrelative to conventional 2D cultures. Another attribute of theDMF system which may contribute to this difference may bethat the detection limits for fluorescent read-outs on DMFdevices are often superior to those of comparable assaysimplemented on macroscale well plates,33 a phenomenonthat is likely a result of increased signal from the reflectivemetal layer on devices.
It should be noted that the HepG2 cells used here(an inexpensive immortalized cell line) are typically notused in metabolism tests because of the inability of 2DHepG2 cell cultures to model CYP activity.49,50 For example,Gerets et al.49 reported no significant differences in transcrip-tional regulation for human CYP3A4 in HepG2 cells in responseto treatment with known CYP inducers, beta-naphtoflavone,phenobarbitol and rifampicin. This is consistent with thedata in Fig. 4A, which reveals 2D HepG2 culture to be a poormodel for evaluating the effects of dexamethasone and keto-conazole on CYP activity. But as shown in Fig. 4B, the CYPactivity of DMF-cultured organoids containing HepG2 immor-talized cells can be both induced and repressed by small
This journal is © The Royal Society of Chemistry 2014
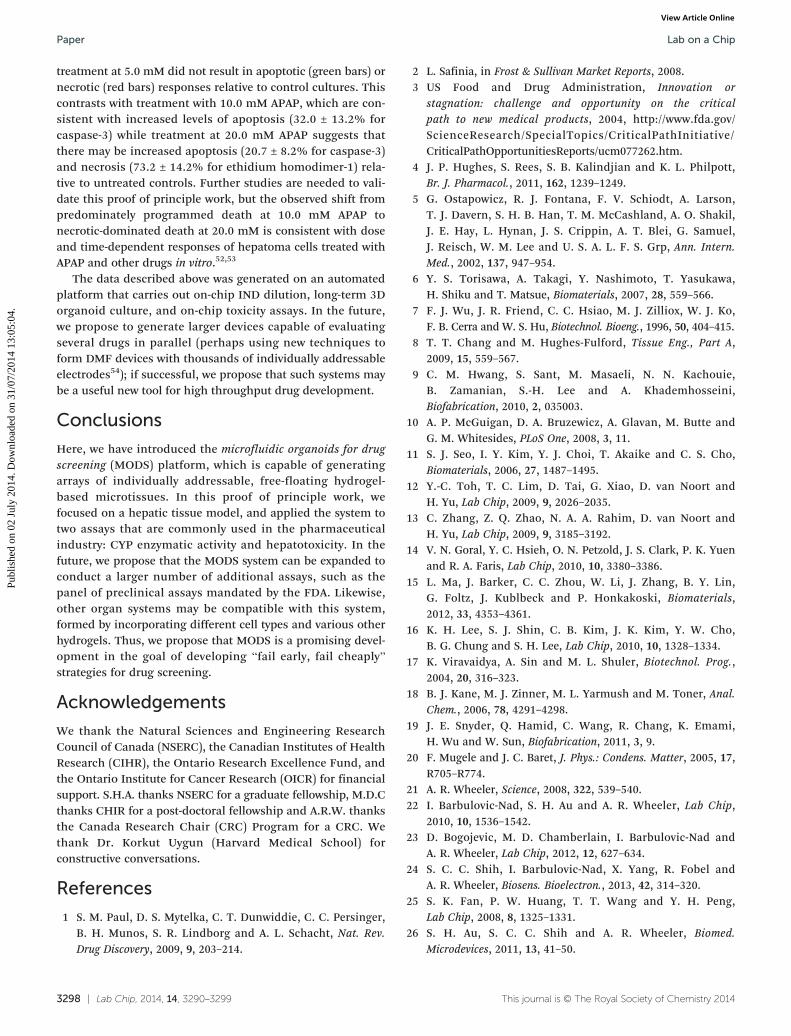
Fig. 5 Organoid acetaminophen (APAP) hepatotoxicity assay. (A) Images fr10.0 or 20.0 mM acetaminophen. (B) Confocal stacks of organoids trinucl(red). (C) Percentage of apoptotic (shaded green bars) and necrotic (solidpredetermined slices per organoid. Error bars represent ±1 standard deviati
molecules. Also, in contrast to assays that use RNA quantifi-cation as an indirect measure of enzyme activity (i.e., qPCRfor CYP), the MODS platform allows direct quantification ofthe relative rates of the CYP activities in real time. If similarresponses can be observed for other compounds, this will bea particularly attractive feature of the DMF organoid modelsystem for screening CYP activity in inexpensive immortal-ized cells without resorting to expensive primary hepatocytes.
Hepatoxicity
For a “fail early, fail cheaply”2 paradigm of drug developmentto succeed, IND candidates with the potential for adversehuman effects must be identified through routine screens.To evaluate the MODS platform for hepatoxicity screening,acetaminophen (APAP)-induced hepatotoxicity was chosen fora proof of principle study since APAP overdose accounts for39% of acute liver failure cases in the United States.5 TheMODS system is particularly well suited for this applicationbecause of its ability to replace labour intensive processeswith automated on-chip droplet manipulation. Fig. 5A depictsthe on-chip formation of a 4 point serial dilution curve usedto evaluate the cytotoxicity of a range of APAP concentrationson individual organoids. In the future, this function might becombined with on-chip electrochemical quantitation of APAP51
to achieve finer control over concentrations, but the four-point system used here was useful to evaluate the concept.
HepG2-laden organoids were formed and then exposed to0, 5.0, 10.0 or 20.0 mM APAP for 24 h using the MODSplatform. Confocal photomicrograph stacks of APAP-treatedorganoids from this study are shown in Fig. 5B. The percent-age of cells positively stained for early apoptosis (by caspase-3)and necrosis (by ethidium homodimer-1) were determinedfrom these photomicrographs (Fig. 5C). As shown, APAP
Lab Chip, 2014, 14, 3290–3299 | 3297
om a movie illustrating a serial dilution procedure for generating 0, 5.0,ear stained for total nuclei (blue), caspase-3 (green) and necrotic cellsred bars) cells in organoids analyzed by CellProfiler software in threeon, n = 2.
Lab on a ChipPaper
Publ
ishe
d on
02
July
201
4. D
ownl
oade
d on
31/
07/2
014
13:0
5:04
. View Article Online
treatment at 5.0 mM did not result in apoptotic (green bars) ornecrotic (red bars) responses relative to control cultures. Thiscontrasts with treatment with 10.0 mM APAP, which are con-sistent with increased levels of apoptosis (32.0 ± 13.2% forcaspase-3) while treatment at 20.0 mM APAP suggests thatthere may be increased apoptosis (20.7 ± 8.2% for caspase-3)and necrosis (73.2 ± 14.2% for ethidium homodimer-1) rela-tive to untreated controls. Further studies are needed to vali-date this proof of principle work, but the observed shift frompredominately programmed death at 10.0 mM APAP tonecrotic-dominated death at 20.0 mM is consistent with doseand time-dependent responses of hepatoma cells treated withAPAP and other drugs in vitro.52,53
The data described above was generated on an automatedplatform that carries out on-chip IND dilution, long-term 3Dorganoid culture, and on-chip toxicity assays. In the future,we propose to generate larger devices capable of evaluatingseveral drugs in parallel (perhaps using new techniques toform DMF devices with thousands of individually addressableelectrodes54); if successful, we propose that such systems maybe a useful new tool for high throughput drug development.
Conclusions
Here, we have introduced the microfluidic organoids for drugscreening (MODS) platform, which is capable of generatingarrays of individually addressable, free-floating hydrogel-based microtissues. In this proof of principle work, wefocused on a hepatic tissue model, and applied the system totwo assays that are commonly used in the pharmaceuticalindustry: CYP enzymatic activity and hepatotoxicity. In thefuture, we propose that the MODS system can be expanded toconduct a larger number of additional assays, such as thepanel of preclinical assays mandated by the FDA. Likewise,other organ systems may be compatible with this system,formed by incorporating different cell types and various otherhydrogels. Thus, we propose that MODS is a promising devel-opment in the goal of developing “fail early, fail cheaply”strategies for drug screening.
Acknowledgements
We thank the Natural Sciences and Engineering ResearchCouncil of Canada (NSERC), the Canadian Institutes of HealthResearch (CIHR), the Ontario Research Excellence Fund, andthe Ontario Institute for Cancer Research (OICR) for financialsupport. S.H.A. thanks NSERC for a graduate fellowship, M.D.Cthanks CHIR for a post-doctoral fellowship and A.R.W. thanksthe Canada Research Chair (CRC) Program for a CRC. Wethank Dr. Korkut Uygun (Harvard Medical School) forconstructive conversations.
References
1 S. M. Paul, D. S. Mytelka, C. T. Dunwiddie, C. C. Persinger,
B. H. Munos, S. R. Lindborg and A. L. Schacht, Nat. Rev.Drug Discovery, 2009, 9, 203–214.3298 | Lab Chip, 2014, 14, 3290–3299
2 L. Safinia, in Frost & Sullivan Market Reports, 2008.
3 US Food and Drug Administration, Innovation orstagnation: challenge and opportunity on the criticalpath to new medical products, 2004, http://www.fda.gov/ScienceResearch/SpecialTopics/CriticalPathInitiative/CriticalPathOpportunitiesReports/ucm077262.htm.
4 J. P. Hughes, S. Rees, S. B. Kalindjian and K. L. Philpott,
Br. J. Pharmacol., 2011, 162, 1239–1249.5 G. Ostapowicz, R. J. Fontana, F. V. Schiodt, A. Larson,
T. J. Davern, S. H. B. Han, T. M. McCashland, A. O. Shakil,J. E. Hay, L. Hynan, J. S. Crippin, A. T. Blei, G. Samuel,J. Reisch, W. M. Lee and U. S. A. L. F. S. Grp, Ann. Intern.Med., 2002, 137, 947–954.6 Y. S. Torisawa, A. Takagi, Y. Nashimoto, T. Yasukawa,
H. Shiku and T. Matsue, Biomaterials, 2007, 28, 559–566.7 F. J. Wu, J. R. Friend, C. C. Hsiao, M. J. Zilliox, W. J. Ko,
F. B. Cerra and W. S. Hu, Biotechnol. Bioeng., 1996, 50, 404–415.8 T. T. Chang and M. Hughes-Fulford, Tissue Eng., Part A,
2009, 15, 559–567.9 C. M. Hwang, S. Sant, M. Masaeli, N. N. Kachouie,
B. Zamanian, S.-H. Lee and A. Khademhosseini,Biofabrication, 2010, 2, 035003.10 A. P. McGuigan, D. A. Bruzewicz, A. Glavan, M. Butte and
G. M. Whitesides, PLoS One, 2008, 3, 11.11 S. J. Seo, I. Y. Kim, Y. J. Choi, T. Akaike and C. S. Cho,
Biomaterials, 2006, 27, 1487–1495.12 Y.-C. Toh, T. C. Lim, D. Tai, G. Xiao, D. van Noort and
H. Yu, Lab Chip, 2009, 9, 2026–2035.13 C. Zhang, Z. Q. Zhao, N. A. A. Rahim, D. van Noort and
H. Yu, Lab Chip, 2009, 9, 3185–3192.14 V. N. Goral, Y. C. Hsieh, O. N. Petzold, J. S. Clark, P. K. Yuen
and R. A. Faris, Lab Chip, 2010, 10, 3380–3386.15 L. Ma, J. Barker, C. C. Zhou, W. Li, J. Zhang, B. Y. Lin,
G. Foltz, J. Kublbeck and P. Honkakoski, Biomaterials,2012, 33, 4353–4361.16 K. H. Lee, S. J. Shin, C. B. Kim, J. K. Kim, Y. W. Cho,
B. G. Chung and S. H. Lee, Lab Chip, 2010, 10, 1328–1334.17 K. Viravaidya, A. Sin and M. L. Shuler, Biotechnol. Prog.,
2004, 20, 316–323.18 B. J. Kane, M. J. Zinner, M. L. Yarmush and M. Toner, Anal.
Chem., 2006, 78, 4291–4298.19 J. E. Snyder, Q. Hamid, C. Wang, R. Chang, K. Emami,
H. Wu and W. Sun, Biofabrication, 2011, 3, 9.20 F. Mugele and J. C. Baret, J. Phys.: Condens. Matter, 2005, 17,
R705–R774.21 A. R. Wheeler, Science, 2008, 322, 539–540.
22 I. Barbulovic-Nad, S. H. Au and A. R. Wheeler, Lab Chip,2010, 10, 1536–1542.23 D. Bogojevic, M. D. Chamberlain, I. Barbulovic-Nad and
A. R. Wheeler, Lab Chip, 2012, 12, 627–634.24 S. C. C. Shih, I. Barbulovic-Nad, X. Yang, R. Fobel and
A. R. Wheeler, Biosens. Bioelectron., 2013, 42, 314–320.25 S. K. Fan, P. W. Huang, T. T. Wang and Y. H. Peng,
Lab Chip, 2008, 8, 1325–1331.26 S. H. Au, S. C. C. Shih and A. R. Wheeler, Biomed.
Microdevices, 2011, 13, 41–50.
This journal is © The Royal Society of Chemistry 2014

Lab on a Chip Paper
Publ
ishe
d on
02
July
201
4. D
ownl
oade
d on
31/
07/2
014
13:0
5:04
. View Article Online
27 L. K. Fiddes, V. N. Luk, S. H. Au, A. H. C. Ng, V. Luk,
E. Kumacheva and A. R. Wheeler, Biomicrofluidics, 2012, 6.28 I. A. Eydelnant, B. B. Li and A. R. Wheeler, Nat. Commun.,
2014, 5, 3355.29 S. Srigunapalan, I. A. Eydelnant, C. A. Simmons and
A. R. Wheeler, Lab Chip, 2012, 12, 369–375.30 S. H. Au, R. Fobel, S. P. Desai, J. Voldman and
A. R. Wheeler, Integr. Biol., 2013, 5, 1014–1025.31 R. Fobel, A. E. Kirby, A. H. C. Ng, R. R. Farnood and
A. R. Wheeler, Adv. Mater., 2014, 26, 2838–2843.32 S. H. Au, P. Kumar and A. R. Wheeler, Langmuir, 2011, 27,
8586–8594.33 I. Barbulovic-Nad, H. Yang, P. S. Park and A. R. Wheeler,
Lab Chip, 2008, 8, 519–526.34 R. Fobel, C. Fobel and A. R. Wheeler, Appl. Phys. Lett.,
2013, 102, 193513–193515.35 N. A. Mousa, M. J. Jebrail, H. Yang, M. Abdegawad,
P. Metalnikov, J. Chen, A. R. Wheeler and R. F. Casper,Sci. Transl. Med., 2009, 1, 1ra2.36 M. W. Tibbitt and K. S. Anseth, Biotechnol. Bioeng.,
2009, 103, 655–663.37 V. L. Tsang, A. A. Chen, L. M. Cho, K. D. Jadin, R. L. Sah,
S. DeLong, J. L. West and S. N. Bhatia, FASEB J., 2007, 21,790–801.38 A. P. McGuigan and M. V. Sefton, Proc. Natl. Acad. Sci. U. S. A.,
2006, 103, 11461–11466.39 T. Nakamura, K. Yoshimoto, Y. Nakayama, Y. Tomita and
A. Ichihara, Proc. Natl. Acad. Sci. U. S. A., 1983, 80, 7229–7233.40 R. G. Wells, Hepatology, 2008, 47, 1394–1400.
41 A. Farrugia, Transfus. Med. Rev., 2010, 24, 53–63.This journal is © The Royal Society of Chemistry 2014
42 E. E. Hui and S. N. Bhatia, Proc. Natl. Acad. Sci. U. S. A.,
2007, 104, 5722–5726.43 A. Ito, H. Jitsunobu, Y. Kawabe and M. Karnihira, J. Biosci.
Bioeng., 2007, 104, 371–378.44 S. A. Wrighton and J. C. Stevens, Crit. Rev. Toxicol., 1992, 22,
1–21.45 J. H. Lin and A. Y. H. Lu, Clin. Pharmacokinet., 1998, 35,
361–390.46 N. J. Liptrott, M. Penny, P. G. Bray, J. Sathish, S. H. Khoo,
D. J. Back and A. Owen, Br. J. Pharmacol., 2009, 156, 497–508.47 O. Trubetskoy, B. Marks, T. Zielinski, M. F. Yueh and
J. Raucy, AAPS J., 2005, 7, E6–E13.48 K. Nakamura, R. Mizutani, A. Sanbe, S. Enosawa, M. Kasahara,
A. Nakagawa, Y. Ejiri, N. Murayama, Y. Miyamoto, T. Torii,S. Kusakawa, J. Yamauchi, M. Fukuda, H. Yamazaki andA. Tanoue, J. Biosci. Bioeng., 2011, 111, 78–84.49 H. H. Gerets, K. Tilmant, B. Gerin, H. Chanteux,
B. O. Depelchin, S. Dhalluin and F. A. Atienzar, Cell Biol.Toxicol., 2012, 28, 69–87.50 P. M. van Midwoud, E. Verpoorte and G. M. M. Groothuis,
Integr. Biol., 2011, 3, 509–521.51 M. D. M. Dryden, D. D. G. Rackus, M. H. Shamsi and
A. R. Wheeler, Anal. Chem., 2013, 85, 8809–8816.52 I. Manov, M. Hirsh and T. C. Iancu, Exp. Toxicol. Pathol.,
2002, 53, 489–500.53 I. Manov, M. Hirsh and T. C. Iancu, Pharmacol. Toxicol.,
2004, 94, 213–225.54 B. Hadwen, G. R. Broder, D. Morganti, A. Jacobs, C. Brown,
J. R. Hector, Y. Kubota and H. Morgan, Lab Chip, 2012, 12,3305–3313.Lab Chip, 2014, 14, 3290–3299 | 3299