labor availability and health care costs · the nursing staff 19 report to the minnesota...
TRANSCRIPT

Labor Availability and Health Care Costs
MMiinnnneessoottaa DDeeppaarrttmmeenntt ooff HHeeaalltthh
Report to the Minnesota Legislature
October, 22002
Health Policy and Systems Compliance DivisionHealth Economics ProgramPO Box 64975St. Paul, Minnesota 55164-0975(651) 282-6367www.health.state.mn.us

Labor Availability andHealth Care Costs
MMiinnnneessoottaa DDeeppaarrttmmeenntt ooff HHeeaalltthh
Report to the Minnesota Legislature
October, 22002
Health Policy and Systems Compliance DivisionHealth Economics ProgramPO Box 64975St. Paul, Minnesota 55164-0975(651) 282-6367www.health.state.mn.us
As required by Minnesota Statute 3.197: This report cost approximately $10,360 to prepare including stafftime, printing and mailing expenses


Table of Contents
Executive Summary vOverview of Health Care Spending Trends vHealth Care Labor Economics vHealth Care Labor Shortages Defined vi
Overview of the Health Care Workforce viRegistered Nurses viPharmacists viLicensed Practical Nurses viiNursing Assistants vii
Effects of a Worker Shortage viiSalary Composition and Growth viiiIndustry Performance viii
Discussion and Forecast viii
Introduction 1
Section 1 3An Overview of Health Care Spending in Minnesota and the United States 3
Aggregate Health Care Spending Trends 3Private Insurance Spending Trends 4Premium Trends 4
Section 2 5Health Care Labor Economics 5
Indicators of Workforce Shortages 6Scope of Workforce Shortages 7
Section 3 9Health Care Labor Shortages Defined 9
Overview of the Health Care Workforce 9Registered Nurses (RNs) 10Pharmacists 12Licensed Practical Nurses 13Nursing Assistants 14
Section 4 15Effects of a Worker Shortage - State and National Evidence 15
Labor Intensity in the Health Care Industry 15Staffing Costs within Health Care Institutions 16Compensation for Various Positions in Institutions 18
Composition of Staffing Costs 18The Nursing Staff 19
Report to the Minnesota Legislature
iii

Pharmacists 20Radiological Technicians 20Temporary or Contract Workers 21Fairview Nurses Strike 22
National Evidence on Labor Shortages 22Skilled Nursing Facilities 22Hospitals 23
Section 5 25Discussion and Forecast 25
Endnotes 27
Labor Availability and Health Care Costs
iv

EXECUTIVE SUMMARY
Rising health care costs have been of growing concern for the Minnesota Legislature over the last several years asMinnesotans have seen their health insurance premiums increase, on average, 11 percent per year since 1998.Underlying costs of health care have also grown since 1998. The tight labor market present during this sametime may be contributing to the escalating costs. For this reason, the Minnesota Legislature directed theMinnesota Department of Health to study the �effects of health care labor availability and its impact on healthcare costs.�
Overview of Health Care Spending Trends
Health spending in Minnesota during 2000 totaled approximately $19.3 billion, or $3,928 per person, and com-prised nearly 10.5 percent of the state�s economy. In the same year, hospital spending comprised 28 percent ofall health-related spending; physician services accounted for 23.5 percent; long-term care 16 percent; prescrip-tion drugs 11 percent; and dental services, 4 percent.
From 1998 to 2000, spending for services covered by private commercial health insurance products (per mem-ber, per month) in Minnesota grew, on average, 11 percent per year. Rate increases for private health insurancepremiums averaged 16 percent in Minnesota during 2000, a four percent increase over 1999, and a trend that isa significant departure from the nearly flat premium growth in the mid-1990s. Premiums for 2001 are alsoexpected to show a double-digit increase.
Health Care Labor Economics
To appreciate the affects of a workforce shortage, it is crucial to know how labor market conditions relate to theeconomy and to understand how they are defined. Supply and demand analysis predicts that when demand isgreater than supply, a shortage will occur. And when the price of a good goes down, the demand for that goodwill go up, all other things remaining constant. Health care, unlike many other goods however, cannot always beforgone in the face of high prices, and therefore as price has gone up, the demand has not decreased. As thedemand for health care has increased, so has the demand for health care workers, and thus, so has their�price� or wage.
There are a number of ways to examine the scope of work-force shortages. Indicators may include larger wageincreases in one industry relative to other industries, vacancy rates, and turnover rates. In addition, workforceprojections, which rely on assumptions about the future state of an industry, can be used to indicate future situ-ations of oversupply or shortage. The scope of workforce conditions can be defined by the opinions of individu-als familiar with the industry, through professional determinations about the number of staff needed to meetthe medical care needs of a population, by the ratio technique, and through examination of vacancy rates.
Report to the Minnesota Legislature
v

Health Care Labor Shortages Defined
Overview of the Health Care Workforce
According to the U.S. Department of Labor, employment in health service occupations grew at over 40 percentbetween 1986 and 1996, and is expected to increase faster than the average rate of increase for all occupationsbetween 1996 and 2006. As of December 2001, over 10 million people nationwide worked in the health servicesindustry. Studies have predicted large future shortages, they have found double-digit vacancies in certain sectorsof the health care market, and have found that workforce shortages are a top concern of hospital executives.
Data also suggests that Minnesota is in the midst of a workforce shortage. The Minnesota Department ofEconomic Security found that, of the 124,000 total job vacancies in Minnesota, more than 14,000 were inhealthcare occupations, and of those, a greater proportion are in Greater Minnesota.
Registered Nurses
Registered Nurses make up the largest provider group in the health care market. As health care is being provid-ed in more varied settings, changes in technology and a higher acuity of the inpatient population has increasedthe demand for nurses. Data suggest that these trends have led to a nursing shortage. According to the GAO,national unemployment for RNs in 2001 was at a decade low of 1 percent, while the number of RNs employedper capita dropped 3 percent over the last 3 years. Contributing to the shortage are decreases in nursing pro-gram enrollment, high turn-over rates, and an aging RN workforce.
In Minnesota, there were approximately 58,000 RNs working in 1999, making it the largest health care occupa-tion in the state. Like the nation, it appears as though Minnesota is facing an RN shortage. Despite an all timehigh in the number of working RNs in 1999, there were 2,900 reported vacancies for this position. For 2000, theMinnesota Department of Economic Security reported an RN vacancy rate of 7.8 percent for Greater Minnesotaand 6.4 percent for the Twin Cities. Similar to the national shortage, Minnesota�s RN shortage is aggravated by adecrease in nursing program enrollment, high turnover and vacancy rates, and an aging work force.
Pharmacists
In 2000, there were roughly 212,600 pharmacists in the United States, making them the third largest profes-sional group in the nation. In the early 1990s, the educational standards and training requirements for the pro-fession were raised, expanding the role of the profession. These changes, combined with an aging population, anincrease in the complexity of medications, and a surge in the number of prescriptions written each year createdan increased demand for pharmacists. Despite a 14 percent increase in the number of pharmacists from 1991to 2000, supply has not kept up with demand, and evidence suggests a pharmacist shortage.
High vacancy rates for pharmacists are being reported in both retail and clinical sectors. According to theNational Association of Chain Drug Stores, pharmacist vacancies in chain pharmacies increased from 2,500 in1998 to 6,500 in 2000. A HRSA pharmacy workforce study, reported that 11 percent of public hospitals reporteda pharmacy shortage in 2000 compared to 5 percent in 1996. The pharmacist shortage will be further affectedby the fact that the number of applications to pharmacy programs declined by 114,000 from 1994 to 1999.
Labor Availability and Health Care Costs
vi

According to the HRSA workforce study, Minnesota reported the highest demand level for pharmacists of anystate. In the fourth quarter of 2001, there were approximately 3,720 total jobs open to licensed pharmacists and334, or 9 percent, were vacant. In addition, the Office of Rural Health and Primary Care at the MinnesotaDepartment of Health found that well over half of all pharmacists in Minnesota started a new job in the lastthree years, suggesting an increase in opportunities due to a tight labor market.
Licensed Practical Nurses
In 2000, total national LPN employment was 679,470 making them the second largest health care occupation.According to the BLS, LPNs are projected to be the fourth fastest growing employment category of positions thatrequire postsecondary or associate degrees. Similar to the workforce conditions being reported for RNs, datasuggest a national LPN shortage. In 2001, the American Health Care Association (AHCA) reported that thenational vacancy rate for LPNs in nursing facilities was 14.6 percent and that 75.8 percent of respondents to ashortage survey said that it had become more difficult to recruit LPNs relative to the year before.
In Minnesota, there were 16,870 LPNs working in the fourth quarter of 2001. As nationally, data suggests ashortage in this occupation. According to the Minnesota Department of Economic Security, approximately 1,581LPN positions were vacant in 2001 (roughly 9.4 percent). The Minnesota Health and Hospital Partnershipreported that the average turnover rate for LPNs was 14.76 percent. According to the Minnesota Department ofHealth, although Greater Minnesota has a proportionally higher share of openings for LPNs, employers in theTwin Cities report having to wait a longer period of time to find and hire LPNs.
Nursing Assistants
According to the BLS, in 2000, there were roughly 2.1 million nursing assistants employed, and the occupationhad the ninth fastest growth of jobs that require short to moderate training. As with RNs and LPNs, evidence sug-gests a nursing assistant shortage. The AHCA reports that the annualized turnover rate for nursing assistants innursing facilities was highest in the nursing profession in 2001, at over 78 percent, and that the vacancy ratewas 11.9 percent.
Data for Minnesota also indicate a shortage of nursing assistants. According to the Minnesota Department ofEconomic Security�s Job Vacancy Survey, there were 30,200 nursing assistants working in Minnesota in thefourth quarter of 2001 and approximately 2,443 positions were vacant. The AHCA estimated that the there was a10.4 percent vacancy rate of nursing assistants in Minnesota nursing facilities, and an annualized turnover rateof 61.6 percent.
Effects of a Worker Shortage
The proportion of staffing costs to overall operating expenses for Minnesota hospitals has remained fairly consis-tent throughout the late 1990s. Salary and benefit costs averaged slightly over 51 percent of operating costs dur-ing that time period. Data received from the Minnesota Health and Housing Alliance (MHHA), a trade associa-tion for skilled nursing facilities, shows average staffing expenses for their members compose 71 percent of totaloperating expenses. Nationally, data shows noticeable salary growth in hospitals during the first six months of2001, with wages increasing 7.6 percent over the same time period in 2000.
Report to the Minnesota Legislature
vii

Salary Composition and Growth
Registered Nurses (RN) account for 35 percent of salary costs in hospitals and make up the bulk of definedstaffing costs. Licensed practical nurses (LPN) compose 2.9 percent of overall staffing costs; certified nursingassistants (CNA) and x-ray technicians both take up 2.5 percent of costs; pharmacists, 2.1 percent; and nurseanesthetists, 1.6 percent. The remainder and majority of staffing costs (53 percent) fall into an �other� category.
The average salary for experienced RNs has gone up 18 percent over the last five years, from $20.80 per hour to$25.35 per hour. Between 1996 and 2001, average CNA wages have increased from $8.11 per hour to $10.45 perhour � an increase of 22 percent. During this same time period, LPN wages have gone from $11.69 per hour to$15.08 per hours � an increase of 22.5 percent.
Industry Performance
The Center for Medicare and Medicaid Services (CMS) has undertaken a new initiative to review data availablefrom Wall Street analysts on various segments of the health industry. Reports on skilled nursing facilities andhospitals are currently available.
CMS reports great concern on the part of financial analysts regarding the future of the skilled nursing industry.They note that although the economy has recently been through a recession, the labor market in skilled nursingfacilities has remained very tight due to a severe nationwide nursing shortage. A report issued by Fitch Ratingsreinforced the challenges facing the industry due to the nursing shortage and concluded that the sector will con-tinue to be highly susceptible to nursing shortages and can expect overtime expenses and pay increases to rise.
Analyst reports on the hospital industry are not as conclusive. CMS and others acknowledge that the industry isalso plagued by a nursing shortage, although not as severe as in the skilled nursing industry. They also agreethat, due to industry consolidation, hospitals have seen their negotiating power with health plans vastly improve.However, reports differ regarding whether hospitals can strengthen their operating margins based on thesegains.
Discussion and Forecast
We found evidence regarding the severity of health care labor conditions and their influence on increasing healthcare costs. All signs indicate that labor, which composes nearly 60 percent of health care expenses, is an impor-tant and growing aspect of overall costs. However, while some health professions are seeing a brisk accelerationof their wages, none of the available data show that the majority of labor costs within health care institutions arerising more rapidly than labor in non-health related industries.
It is important to note that the severity of the workforce shortage and resulting wage increases are not uniformacross health professions. The shortage among registered nurses appears to have the greatest impact on staffingcosts, and, while the shortage among pharmacists is persistent and concerning, it does not appear to have asgreat an effect on overall budgets due to the relatively small presence of pharmacists within a hospital.
Recruiting and retaining medical personnel: While the recent recession may have eased demand pressure forlower-skilled workers, it does not appear to have had the same impact on workers who require 2 or more years
Labor Availability and Health Care Costs
viii

Report to the Minnesota Legislature
ix
of post-secondary schooling. Rising vacancy rates for RNs, pharmacists, and radiological technicians persist,leading institutions to offer signing bonuses, tuition reimbursement or loan repayment, flexible scheduling, andcash incentives for voluntary overtime shifts. Due to the length of time involved in training and education of newnurses, we do not anticipate that labor conditions will moderate in the near future; thus, costs for financialrecruitment and retention incentives can be expected to continue rising.
Hospital Performance: The industry appears to be rebounding from challenges it faced through the late 1990sdue to changes in Medicare reimbursement and the waning influence of managed care. While increased marketclout is a positive note for the industry, if staffing costs continue their rapid ascent, consumers will ultimatelypay the price in increased insurance premiums.

Labor Availability and Health Care Costs
x

INTRODUCTION
Rising health care costs have been of growing concern for the Minnesota Legislature over the last several years asMinnesotans have seen their health insurance premiums increase, on average, 11 percent per year since 1998.Underlying costs of health care have also grown since 1998. The tight labor market present during this sametime may be contributing to the escalating costs. For this reason, the Minnesota Legislature directed theMinnesota Department of Health to study the �effects of health care labor availability and its impact on healthcare costs.�1
The Minnesota Department of Health used several strategies to conduct this study. First, we reviewed availablehospital data collected by the health department to assess whether staffing costs were composing a greater shareof a hospital�s operating budget than in the past. We also reviewed historical wage data and the utilization of con-tract workers for various positions.
Second, the Department conducted site visits and telephone interviews with a wide-range of stakeholders,including hospitals, nursing homes, and trade associations, in order to assess the impact of the labor market ontheir operating budgets. The goal of the interviews was to gather the following information: wage history for themost prevalent positions in the institutions; salary costs as a percentage of overall operating costs; vacancy andturnover rates for positions; utilization of temporary agencies; and, how the institution is absorbing theincreased wages. Finally, in order to assess national trends on these issues, we conducted a review of availabledata and literature.
In order to provide background and context information for the reader, the first section of this report gives anoverview of health care spending in Minnesota and the U.S., the second section provides a brief overview on thefundamentals of wage setting and labor economics, and the third section examines recent trends in health careeducation and employment. The forth section of the report details the effects of labor availability on health carecosts from both a state and national perspective. The fifth and final section is a discussion of findings and policyimplications.
Report to the Minnesota Legislature
1

Labor Availability and Health Care Costs
2

SECTION 1
An Overview of Health Care Spending in Minnesotaand the U.S.
Prior to beginning a discussion on labor market issues in the health care industry, it is important to gain anunderstanding of health care spending trends in Minnesota and the United States. In the following section, infor-mation will be presented on how much we spend on health care, where the health care dollar goes, and whatexpenditures are rising most rapidly.
Aggregate Health Care Spending Trends
Health spending in Minnesota during 2000 totaled approximately $19.3 billion or $3,928 per person and com-prised nearly 10.5 percent of the state�s economy.2 In the same year, hospital spending comprised 28 percent ofall health related spending; physician services accounted for 23.5 percent; long-term care, 16 percent; prescrip-tion drugs, 11 percent and dental services, 4 percent (figure 1). This spending breakdown is fairly similar tonational statistics.3 Areas where spending grew most rapidly in Minnesota during the 1990s include outpatienthospital services, general physician services, and prescription drugs. The rate of increase in inpatient hospitalspending actually declined over the mid-1990s, primarily due to managed-care-related pressures, which includ-ed shifts in site of care to outpatient settings.
Figure 1
2000 Minnesota and US Health Care SpendingWhere it Went
17%
10%
3%
7%
5%
3%
23%
33%
15%
11%
1%
15%
4%
3%
24%
28%
0% 5% 10% 15% 20% 25% 30% 35%
Other Spending
Prescription Drugs
Home Health
Skilled Nursing Facilities
Dental Services
Other Professional Services
Physician Services
Hospital Care
US Minnesota
Source: MDH Health Economics Program; Centers for Medicare & Medicaid
Report to the Minnesota Legislature
3

Recently released national spending trends for 2000 show that a shift is taking place in the structure of healthcare spending growth. Hospital expenditures for Medicare, Medicaid, and private insurance contributed more toincreased spending in 2000 than prescription drugs, in large part because hospital spending comprises a largershare of total health spending. According to analysts, much of this increased spending came as hospitals haveconsolidated, improving their ability to negotiate increased reimbursement. These gains, however, have beentempered due to rising staff and energy costs.4 We will discuss increasing staffing costs in the context ofMinnesota later in this report.
Private Insurance Spending Trends
From 1998-2000, spending for services covered by private commercial health insurance products (per member,per month) in Minnesota grew, on average, 11 percent per year. During this time, growth in prescription drugsaveraged nearly 21 percent each year and accounted for 22 percent of total private health care spending growth.Inpatient and outpatient spending rose an average of 7 percent per year during this time and accounted for 20percent of total spending growth. Spending for physician services rose nearly 13 percent per year from 1998-2000 and accounted for 42 percent of overall health spending growth. Finally, administrative costs grew slightlyunder 8 percent and contributed to 9 percent of total spending growth.5 These numbers are similar to numbersobserved on a national level; however, due to significant differences in data collection methods, direct compar-isons are not possible.
Premium Trends
It is generally recognized that health insurance premiums are cyclical in nature, meaning that changes in pre-miums in a given year do not necessarily reflect changes in the underlying cost of providing health care in thesame year. Rate increases for private health insurance premiums averaged 16 percent in Minnesota during2000, a four percent increase over 1999 and a trend that is a significant departure from the nearly flat premiumgrowth in the mid-1990s.6 Premiums for 2001 are also expected to show a double-digit increase. These statisticsare consistent with national trends and suggest that the cyclical insurance underwriting cycle is on an upswing.Upswings are characterized by rising premiums for employers and widening operating margins for insurers. Thefact that the underwriting cycle is currently in an upswing, combined with increasing growth in underlyinghealth care costs, are the likely reasons responsible for the double-digit increases in the state over the past sev-eral years. While the improving margins of health plans may indicate that premiums may begin to stabilize incoming years, the increasing underlying cost of health care may act to temper effects of the downside of theunderwriting cycle. That is, while downsides of premium cycles bring declining premiums, the degree to whichpremiums decline may be limited by the strong underlying cost growth.
Labor Availability and Health Care Costs
4

SECTION 2
Health Care Labor Economics
To understand the affects of a workforce shortage, it is important to realize how labor market conditions relateto the economy, and how they are defined. The following section offers basic principals of health care labor eco-nomics, as well as labor market definitions.
One way to understand the potential cost implications of a health services workforce shortage is to use supplyand demand analysis. Shortages occur when the demand for workers in a specific occupation is greater than thesupply of willing, qualified, and available workers. This type of analysis helps to predict the changes that willoccur in the workforce as it responds to shifts in supply and demand. More specifically, it can provide insightinto workforce shortages and their affects.
Most economic analysis relies on the premise that people make rational choices, buying what they need andwant according to their budget. In addition, traditional economics assumes that consumers will utilize theirbudget for things that provide them with the greatest utility or happiness. Supply and demand theory argues thatwhen the price of a good goes down, demand for that good will go up, all other things remaining constant.Unlike the market for many goods, however, the health care market is relatively inelastic (that is, the demandfor a product is not as responsive to changes in the price of that product). This is due to the fact that health careis a good that, in most cases, people cannot forgo, regardless of their budget constraints. In light of this, as theprice of health care has increased, the demand has not decreased.
As the demand for health services has continued to rise due to demographic shifts and other factors, so has thedemand for health care workers to produce these services. As the demand for health care workers has gone up,the employment rate for these workers has gone up. If the existing supply of workers remained stable, therewould be fewer workers to hire, as these workers gained employment. Therefore, as the demand for health careworkers increases, the wage rate paid to workers (the �price� of the good) rises. In addition (assuming a stablepool of workers), as more workers are hired, supply dwindles, further driving up wages.
In health care, however, the pool of workers is not stable. New graduates of nursing, medicine, pharmacy, certi-fied nursing assistant (CNA), and other health care provider programs increase the pool of workers every year.The rate at which these workers graduate and become licensed is, therefore, very important to the wage rate. Anincrease of graduates will boost the number of available workers for an industry, giving employers more appli-cants from which to choose. At the same time, not every graduate who receives licensure to perform medical orhealth care services will take work in that field. For this reason, it is important not only to look at the number ofnew licensures, but the percentage of the licensed workforce that works in the health care sector (this is calledthe participation rate).
A note on technology: While in many industries the introduction of technology has served as a labor-saving inno-vation (for example, the introduction of automated processes in factories), in health care the introduction oftechnology has not been able to reduce labor intensity. Health care, by its nature, is a handicraft process where
Report to the Minnesota Legislature
5

doctors, nurses, and other professionals interact on a personal basis with patients. While technology hasundoubtedly improved outcomes and enhanced medical ability, it is not clear that it has reduced the need forlabor in health care.
Indicators of Work Force Shortages
One indicator of a work force shortage, according to supply and demand analysis, is an industry�s wage increas-es being larger than other industries�. That is, if wage increases are larger in industry A than in industry B, itmay indicate that demand for labor is stronger in A, and may signal that industry A is experiencing a work forceshortage. It is important, however, to examine wage increases for industries as a whole, rather than using singleoccupations within an industry to illustrate shortages. Using information about a single occupation in an indus-try doesn�t account for labor substitution. Labor substitution occurs when institutions substitute high-wageworkers with those who are less expensive. In health care, for instance, if there is a high demand for healthservices, but the supply of registered nurses (RNs) is not keeping pace with that demand, their wages willincrease. If the supply of licensed practical nurses (LPNs) and CNAs is growing in line with the demand forhealth services, their wages will not increase as much. In the face of such differentials, health care institutionsmay choose to, where feasible, substitute LPNs and CNAs for RNs. For this reason, although a wage increase mayillustrate a discrepancy between supply and demand within a single occupation initially, substitution may avertan overall industry shortage and increases in labor costs overall. The extent to which substitution can occurwithin a given industry depends upon the degree to which skills, regulation, education, and professional trainingallow for substitution of one occupation for another.
Vacancy rates are also used to indicate trends in workforce conditions. Vacancy rates refer to the percent ofunfilled, budgeted positions for which there is active recruitment. The presence of high, persistent vacancy ratescan be an indicator of a workforce shortage. It is important to consider the changing world of health care whenlooking at vacancy rates. Taking the example of RNs, the meaning of vacancy rates has changed over time,because an RN vacancy means something different to the health care system than it did ten years ago. Analystsargue that the financial pressures from managed care and other health care cost-containment initiatives, andcorresponding reductions in nurse staffing levels, have reduced the ability of institutions to move nurses fromone unit to another to meet temporary needs. For this reason, some believe that vacancy rate statistics are amore meaningful and accurate indicator of an industry shortage in the current workforce because less flexiblestaffing situations prohibit the shifting of workers across departments to alleviate vacancies.
Another potential indicator of overall industry conditions is labor turnover rates. Labor turnover refers to thechange in the employment of an industry during a reference period resulting from people leaving and enteringthe industry�s workforce. The labor turnover rate is the difference between the number of new employees andthe number of people who have discontinued employment. This indicator is used to suggest labor market condi-tions by illustrating the ease with which workers can shift between employers.
Workforce projections are also used to predict future situations of oversupply or shortage in occupational sec-tors. The accuracy of workforce projections is often questioned, however, because assumptions about the futureof an industry are used to make the prediction. For instance, a recent projection that was challenged by manywas a report called �The Critical Challenges in Revitalizing the Health Professions for the Twenty-First Century,�published in 1995 by the Pew Health Professionals Commission.7 It reported that there was an �oversupply of
Labor Availability and Health Care Costs
6
nurses in the U.S. and this oversupply would continue to grow in the future.�8 Critics argue that the currenttrends in the nursing sector suggest a shortage as opposed to a surplus, and therefore dismiss the validity of theprojection. According to critics, the flaw of this study was the Commission�s conclusions being based on theassumption that managed care would restructure the health system, forcing hospitals to function with more lim-ited resources. Although managed care and the Balanced Budget Act have reduced hospital payments relative towhat they otherwise would have been, they have not reduced the volume of service provided by hospitals. In fact,many argue that the demand for nurses has increased because of the aging of the population, the increased useof sophisticated technology, an increased ability to manage chronic diseases, and pressures to improve quality.
Scope of Work Force Shortages
There are several ways to define the scope of a workforce shortage. The first is a qualitative method that relies onthe opinions of individuals familiar with an industry. Within the health care industry, opinions might be soughtfrom nurse supervisors, human resource directors, or chief operating officers. These opinions are normally col-lected via survey. Items include rating the difficulty of filling positions, hiring workers, and the level of concernthe issue has relative to other industry problems. Responses are based on the normative judgments of therespondents (what they think staffing levels ought to be, the level of difficulty hiring staff ought to be). Thesevalue judgments are therefore subject to who is asked, and don�t necessarily reflect market realities.
A second method for defining the scope a workforce shortage is called �professional determinations.� In healthcare, this involves determining the number of staff in a particular occupation necessary to care for the medicalneeds of the population. The difference between the estimate and the current number of workers indicates thedegree of a shortage or surplus. A drawback with this definition, if applied to the aggregate, is that it is not clearthat the employed staff are distributed appropriately across geographic or other areas. For instance, there maybe twice as many LPNs in urban areas than was determined, based on the need, and twice as few in rural areas,but the aggregate will not reflect this. In addition, this determination is susceptible to problems if labor substitu-tion is not taken into consideration.
A third and popular technique for determining the scale of a workforce shortage is the ratio technique. Thisinvolves determining the current ratio of workers in an occupation to the population and comparing it to theratio that is projected in the future. The future ratio is calculated by the likely number of future graduates, therate of retirement in the occupation, and the rate of population growth. The difference between the current andfuture ratios reflects a possible shortage of workers. A problem with this technique is that it doesn�t take intoaccount possible shifts in demand. Specific to the health care sector, it ignores changes in reimbursement,changes in lifestyle factors, population aging, and other factors. In response to this criticism, some currentapplications of this measurement have begun to take demographic shifts and other factors into consideration.
Finally, vacancy rates are often used to indicate both the presence and severity of a workforce shortage. Thescope of the vacancies (both the number of vacancies and the length of the vacancies) can be used as an indica-tor to assess the degree of the shortage. The main problem with using vacancy rates to determine the scale of aworkforce shortage is shifts in employer expectations. When there is an abundance of labor in an occupationalsector, employers may become accustomed to hiring workers with a specific level of training and experience.When the labor market tightens, employers may find it more difficult to hire well-trained and experienced work-ers. This may lead to higher vacancies for longer periods of time, while employers spend time seeking out a spe-cific quality of worker.
Report to the Minnesota Legislature
7

Labor Availability and Health Care Costs
8

SECTION 3
Health Care Labor Shortages Defined
Data suggest the presence of a health care workforce shortage both in Minnesota and across the nation. Withinthe health care workforce, the shortage seems to affect occupations to varying degrees. In addition, the likelycauses of and solutions for the shortages vary across the different occupations. In this section, we review nation-al and state level data collected by government and other sources. We also review and summarize some of themajor national and state initiatives to address the shortage.
Overview of the Health Care Workforce
Over the last twenty years, the health care sector and the cost of health care services have been frequent issuesof concern to policy makers. Recently, workforce costs, one of the largest portions of the health care cost input,have been under examination. According to the U.S. Department of Labor, during 1986 to 1996, close to one outof every nine new jobs created by the economy was in health occupations, a trend that is expected to continuebetween 1996 and 2006.9 In addition, employment in health service occupations grew at over 40 percentbetween 1986 and 1996, and is expected to increase faster than the average rate of increase for all occupationsbetween 1996 and 2006.10 As of December 2001, over 10 million people nationwide worked in the health servic-es industry.11 Despite an increase in overall employment in the health care sector, evidence suggests workforceshortages in specific health services occupations.
Research done by the American Hospital Association (AHA) found that the percentage of hospital executives whocited labor and staffing as one of their major concerns nearly doubled from 1999 to 2000 (34 percent to 58 per-cent).12 In 2001, the Federation of American Hospitals and National Association of Public Hospitals and HealthSystems found double-digit vacancy rates for registered nurses (RNs), imaging technicians, pharmacists,licensed practical nurses (LPNs), and nursing assistants. The Federal government has also acknowledged theshortage. In 1998, the U.S. Department of Labor, Bureau of Labor Statistics (BLS), began to track the issue. TheBureau estimates that, by the year 2008, 450,000 more RNs and 136,000 more LPNs will be necessary to fill theneed (the BLS estimates that in 2000, there were approximately 2.2 million RNs and almost 680,000 and LPNsworking in their field).13
Data suggest that Minnesota is also suffering a workforce shortage with an especially severe shortage in GreaterMinnesota. The Department of Economic Security�s 2001 State of Minnesota Job Vacancy Survey reported that inthe fourth quarter of 2001, there were 17,776 job openings in the health care industry.14 The survey also foundthat of the 124,000 total job vacancies in Minnesota, more than 14,000 were in healthcare occupations.15
Registered nurse vacancies represented the fourth highest, and nursing assistants the sixth highest, job vacancyrates in the state.16 This same survey showed that although the Twin Cities area has the highest number ofhealth care worker vacancies, Greater Minnesota has a higher proportion of these vacancies.17
Report to the Minnesota Legislature
9

A recently completed survey by the Minnesota Department of Health shows that one important predictor ofwhere a health professional will eventually practice is where he or she grew up. According to the survey, whichasked about future practice plans of graduating students and residents in medical, pharmacy, dental, and otherhealth professional programs, those who had graduated from Minnesota high schools or colleges were signifi-cantly more likely to remain in the state to practice after completion of their training than were those who hadattended high school or college in other states or countries.18
Despite an overall workforce shortage, the situation differs by occupation type and health care setting. In addi-tion, the contributing factors and possible solutions differ for different occupations. The next section of thisreport examines different occupations separately.
Registered Nurses (RNs)
Registered nurses make up the largest provider group in the health care market and occupy jobs across thehealth care sector. In 2000, the total national employment for RNs was approximately 2.2 million.19 To practice,RNs must have either an associate degree in nursing (ADN) (4 or 5 years), bachelor of science degree in nursing(4 or 5 years), or an ADN diploma through a community or junior college (2 to 3 years), and must pass anational licensing examination. In addition, many states require periodic license renewal, which may involvecontinuing education. Registered nurses provide direct patient care and administer medications.20 Althoughmost RNs are employed in hospitals (about 59 percent in 2000) they also occupy positions in other settings,such as ambulatory care, home health, nursing homes, and outpatient clinics.21
Over the last twenty years, as the health care system has changed, so has the role of RNs. Cost containment hasshifted care from the traditional acute care hospital setting to ambulatory care centers, community clinics, andnursing homes. Changes in technology have further encouraged these shifts, leading to a decline in hospitalbeds and length of stay. As a result, the level of acuity for hospital patients has increased. The combination ofthese changes has led to an upsurge in job opportunities and demand for nurses.
Current evidence suggests that these shifts in the marketplace have led to a pervasive national nursing shortage.The General Accounting Office (GAO) reported that national unemployment for RNs in 2001 was at a decade lowof 1 percent and that, nationwide, the number of RNs employed per capita has decreased by 2 percent over thelast 3 years.22 This signals a sharp departure from the 44 percent increase in employed RN�s per capita from1980 to1996.23 At the same time, the BLS projected that RNs would be the fastest growing occupation amongpositions requiring a post secondary or associated degree.24
A decrease in nursing program enrollment, high turn over rates, and an aging RN workforce are also contribut-ing to the nursing shortage. According to a 1999 Nursing Executive Center report, nursing diploma programsand degree program enrollment declined 42 percent and 11 percent respectively between 1993 and 1996. As aresult, the number of successful RN licensures declined from 97,679 in 1996 to 74,787 in 2000 (a decrease of23 percent).25 The same study found that the national turnover rate for RN�s increased from 12 percent to 15percent between 1996 and 1999.26 A Federation of Nurses and Health Professionals study conducted in March2001 found that 1 in 5 nurses is considering leaving their job.27
Labor Availability and Health Care Costs
10

As the number of new nurses decline, the number of nurses aging out of the profession is increasing. Between1983 and 1998 the average age of U.S. nurses increased by 4.5 years, from 37.4 to 41.9 years.28 At the sametime, the average age of the U.S. worker increased less than 2 years, from 37.4 in 1983 to 39.0 years in 1998.29
According to an American Hospital Association work force study conducted in 2001, the average age of workingRN�s in 2000 was 43, and the number of working RNs under 30 decreased by 41 percent.
Fewer than one in three nurses were under 40 years of age in the year 2000.30 According to the BLS, the nursingprofession�s retiree replacement needs will be 330,000 by 2008, putting it in the top 10 occupations most affect-ed by the baby boom.31 An extensive study on the aging RN workforce, published in the Journal of the AmericanMedical Association in 2000, predicted that by 2010 more than 40 percent of RNs will be older than 50 years. Inaddition, the study reported that if current growth trends continue, there will be a 20 percent deficit between theexisting pool of RNs and the HRSA-estimated-requirement by 2020.32 The culmination of all of these factors haslead to speculation that there will be a nationwide shortage of one million nurses by 2010.33
In response to the RN shortage, the GAO was charged with further studying the issue. Their resulting studydescribed the shortage and attributed it to problems of retention and recruitment. Low job satisfaction driven byinadequate staffing levels, heavier workloads, and the increased use of mandatory overtime were cited as causesfor low retention and recruitment.34
To alleviate the nursing shortage on a national level, the Federal government has taken several approaches. Thefirst has been to fund a project headed by HRSA called the Nurse Education Loan Repayment Program. Thisproject will use $7.3 million to repay educational loans of clinical care nurses who agree to work for two years indesignated public or nonprofit health facilities facing a critical shortage of nurses. The second Federal initiative,also headed by HRSA, allots more than $20 million to be awarded in the form of 94 grants to 82 colleges, uni-versities, and other organizations, with the intent of increasing the number of nurses with bachelor�s andadvanced degrees.35
In Minnesota, like the nation, RNs represent the largest health care occupation. According to the MinnesotaNurses Association, Minnesota had an all-time high of approximately 58,000 RNs working in 1999, with approxi-mately 2,900 RN positions vacant across the state.36 Minnesota Department of Economic Security statisticsshowed that of the 46,630 estimated total RN positions in the fourth quarter of 2001, 3,260 were vacant (about7 percent).37 In Greater Minnesota, the shortage appears to be more acute. The most recent vacancy statisticsreported by the Minnesota Department of Economic Security show a vacancy rate for RNs is 7.8 percent for RNsin Greater Minnesota, and a rate of 6.4 percent for the Twin Cities.38
Similar to the national shortage, Minnesota�s RN shortage is aggravated by a decrease in nursing program enroll-ment, high turnover and vacancy rates and an aging work force. Turnover rates for RNs in Minnesota have beenvery high.39 According to a survey done by the Minnesota Hospital and Health Care Partnership (MHHP), theaverage turnover rate for RNs in 2001 was 6.3 percent.40 In addition, the Minnesota Job Vacancy Survey Reportfound that in the fourth quarter of 2001, nurses had a 7.0 percent vacancy rate compared with an average jobvacancy rate across all occupations of 3.1 percent (the report showed a rate of 5.9 percent for healthcare practi-tioners, overall).41 Finally, the age structure of Minnesota nurses increased 1.5 years between 1996 and 2000. In2000, the average age of an RN in Minnesota was 45.3.42 This aging trend is far more pronounced than thenational average: RNs in Minnesota are almost three years older, on average, than those in the rest of the coun-try. 43
Report to the Minnesota Legislature
11
State responses to the shortage have focused primarily around industry efforts. For example, in October 2001,MHHP joined with the Healthcare Education-Industry Partnership and Minnesota Colleagues in Caring to exam-ine ways to create capacity for nursing education in Minnesota. In addition, the Minnesota Nurses Association(MNA) has conducted a study funded by the American Nurses Association to quantify the effects of the nursingshortage on quality of care. The MNA has also initiated legislation to promote nursing recruitment, improve theworking environment and monitor quality-of-care issues related to the shortage.
Pharmacists
Pharmacists represent the third largest professional group in the United States. 44 According to the BLS, nationalpharmacist employment in 2000 was roughly 212,660.45 To practice, pharmacists need to be licensed, whichrequires that they graduate from an accredited college of pharmacy46, they must fulfill an internship under alicensed pharmacist and pass a state examination.47 Most states require continuing education for license renew-al. The majority of pharmacists practice in pharmacies located in traditional health delivery settings includinghospitals, medical centers, long-term care facilities, and in retail areas such as drug stores and grocery stores. Asmaller number of pharmacists work for managed care plans, consulting firms, universities, and pharmaceuti-cal companies.
The role of the pharmacist has changed dramatically over the last decade. Beginning in the 1990s, the profes-sion raised educational standards, requiring a doctorate and increased clinical and practical skill training.48 As aresult, the role of the profession expanded beyond pharmaceutical dispensing to training other health care pro-fessionals about prescription drugs and taking an increased role in the management of patient care. At the sametime, the complexity of medications amplified and the number of prescriptions written per year increased dra-matically (44 percent between 1990 and 1999).49 In addition, an aging population, increased coverage of pre-scription drugs, and increased consumer demand has lead to an increased demand for pharmacists.
In response to these changes, nationally, the number of pharmacists has increased by 14 percent from 1991 to2000 compared to a 9 percent growth in U. S. population.50 Despite this, evidence suggests that the demand forpharmacists has greatly outstripped supply. According to the National Association of Chain Drug Stores, inFebruary 2000 about 6,500, or 6 percent, of pharmacy jobs at chain pharmacies were unfilled. This representsan increase of 4,000 vacancies since February 1998.51 In terms of hospital pharmacists, the American Society ofHealth-System Pharmacies found that 70 percent of pharmacy directors termed the pharmacist shortage�severe� in 2000, compared with 48 percent in 1999.52 Finally, according to a HRSA pharmacy workforce study,11 percent of public hospitals reported a pharmacist shortage in 2000 compared to 5 percent in 1996.53
The pharmacist shortage is further affected by a decrease in pharmacy program enrollment. Data from theAmerican Association of Colleges of Pharmacy shows that, although the number of applications for pharmacyprograms hit a high of 342,000 in 1994, it rapidly decreased throughout the mid-1990s and was only 228,000by 1999.54 The combination of these shifts has lead many to project large future shortages.55 For instance,according to the HRSA�s Pharmacist Workforce Shortage Study, by 2010, there will be about 224,500 active phar-macists, and although they didn�t predict demand for pharmacists in 2010, they reported that the factors cur-rently influencing demand will last at least 5 to 10 years.56
Labor Availability and Health Care Costs
12

In December 1999, Congress directed the Department of Health and Human Services to study the validity andsize of the pharmacist shortage. HRSA conducted the study. HRSA�s report presented evidence supporting theexistence of a shortage and identified four contributing factors. The first was an increased use of prescriptiondrugs. The second was an increase in competition for pharmacists among retail pharmacies due to store open-ings, expanded hours, and increased time pharmacists spend verifying third- party payer information. The thirdfactor identified in the report was the expansion of pharmacy practice and roles. Finally, HRSA reported thatchanges in the pharmacist workforce, such as an increase in the number of female pharmacists who are morelikely to work part time, the loss of new graduates due to changes in the entry-level degree needed to enter phar-macy programs, and the increasing likelihood that pharmacists will not choose to practice in rural and under-served settings had contributed to the shortage. They also provided several possible policy approaches to addressthis issue. These options included using technicians to perform repetitive manual tasks, and utilizing automa-tion to increase efficiency and reduce pharmacists� workload.57
In June 2001, Congress acted to begin addressing the pharmacist workforce issues by passing the PharmacyEducation Aid Act. The act will provide funding for pharmacy school infrastructure, such as capital expendituresto modernize or expand existing pharmacy schools and to create new schools. The Act will also promote phar-macy program enrollment by enhancing funding for student loans and scholarships. In addition, the Act seeksto assure an adequate supply of pharmacy faculty by expanding existing faculty loan repayment and recruitingprograms for health professional schools.58
According to the HRSA workforce study, Minnesota reported the highest demand level for pharmacists of anyother state. In the fourth quarter of 2001, there were approximately 3,720 total jobs open to licensed pharma-cists and 334, or 9 percent, were vacant.59 Reinforcing the presence of a shortage, the Minnesota Department ofHealth (MDH) found that well over half of all pharmacists in Minnesota started a new job in the last three years,suggesting an increase in opportunities due to a tight labor market.60 In addition, according to the HealthProfessions Trainee Exit Surveys 2002 results released by MDH, roughly a quarter of pharmacists who respondedsaid that they received five or more job offers during their job search, almost half responded that it took lessthan a month to find a satisfactory practice position, and more than 56 percent reported no difficulty finding ajob.61
Licensed Practical Nurses
Licensed practical nurses represent the second largest health care occupation. The BLS reported that in 2000,total LPN employment was 679,470.62 The BLS projects LPNs as the fourth fastest growing employment categoryof positions that require postsecondary or associate degrees.63 To practice, LPNs must pass a national examina-tion after completing a state-approved practical nursing program (normally about 1 year of both classroom andclinical practice). Licensed practical nurses provide basic bedside care under the direction of a physician andRN. These activities include taking vital signs and treating bedsores. In states where the law allows, LPNs alsoadminister prescribed medicines or start intravenous fluids.64 Nationally, 29 percent of LPNs work in nursinghomes, 28 percent in hospitals, and 14 percent in physicians� offices and clinics. Other work settings includehome healthcare services, residential care facilities, and schools.65
Report to the Minnesota Legislature
13

Consistent with the picture for RNs, data suggest a national LPN shortage. According to a recent study by theAmerican Health Care Association (AHCA), an organization which represents the long-term care community, thenational vacancy rate for LPNs in nursing facilities was 14.6 percent in 2001. In addition, the annualizedturnover rate for LPNs in nursing facilities was found to be roughly 54 percent. The AHCA also reported that 75.8percent of respondents said that it has become more difficult to recruit LPNs relative to the year before.66
According to the Department of Economic Security, there were 16,870 LPNs working in Minnesota in the fourthquarter of 2001, and approximately 1,581 of these positions were vacant (roughly 9.4 percent).67 The MinnesotaHealth and Hospital Partnership reported that the average turnover rate for LPNs was 14.76 percent.l68 In thesame 2001 study by the AHCA, vacancy rates for LPNs in Minnesota nursing facilities were reported at 12.9 per-cent and annualized turnover rates were reported as 32.7 percent.69 Unlike RNs, the shortage of LPNs seems tobe affecting the Twin Cities more than Greater Minnesota. According to the Office of Rural Health and PrimaryCare, 84 percent of LPN positions remain open for more than two months. Although Greater Minnesota has aproportionally higher share of openings for LPNs, the Office of Rural Health and Primary Care reported thatemployers in the Twin Cities report having to wait a longer period of time to find and hire LPNs than employersin Greater Minnesota. In addition to tight demand, between 1994 and 2000 the supply of LPN graduates prepar-ing for Minnesota licensure decreased by 30 percent.70
Nursing Assistants
Nursing assistants represent the ninth fastest growing occupation of jobs that require short to moderate trainingperiods. According to the BLS, about 2.1 million nursing assistants were employed in 2000.71 Although in somesettings very little training is required to practice as a nursing assistant, hospitals often require mandatory train-ing (75 hours of classroom and practical training) and the completion of a state competency test. Nursing assis-tants who complete the program are certified and placed on a state registry. Nursing assistant duties depend onin-house and outside training, experience, and type of health care facility. Generally, however, nursing assistantswork under the direction of RNs and LPNs and take vital signs, serve meals, make beds, and help patients eat,dress, and bathe.72 Nationally, about 50 percent of nursing assistants work in nursing homes and 25 percentwork in hospitals. They also work at home health agencies, visiting nurse associations, social services agencies,and residential care facilities.73
According to data from the AHCA �Nursing Position Vacancy and Turnover Survey,� nursing assistants are also inshort supply. AHCA reports that the annualized turnover rate for nursing assistants in nursing facilities was high-est in the nursing profession in 2001 at over 78 percent. In addition, they reported the 2001 vacancy rate innursing facilities to be 11.9 percent. As with LPNs, the majority (over 58%) of respondents reported that it hadbecome more difficult to recruit nursing assistant than in the previous year.74
Data for Minnesota indicate that the state seems to be suffering a shortage of nursing assistants. There were30,200 nursing assistants working in Minnesota in the fourth quarter of 2001.75The estimated vacancy rate forthe second quarter of 2001 was 9.3 percent and the turnover rate was 21.2 percent.76 In terms of actual posi-tions, the Minnesota Department of Economic Security, Research and Statistics Office Job Vacancy Survey,approximately 2,443 jobs were vacant in the fourth quarter of 2001.77 According to the AHCA �Nursing PositionVacancy and Turnover Survey,� Minnesota nursing facilities have a 10.4 percent vacancy rate for nursing assis-tants and an annualized turnover rate of 61.6 percent.78
Labor Availability and Health Care Costs
14

SECTION 4
Effects of a Worker Shortage – State and NationalEvidence
The following section details the effects of health care workforce conditions on various institutions. The informa-tion presented in this section is based on data collected by the Minnesota Department of Health; interviews withhospitals, trade associations, and other providers from October 2001 through January 2002; and a review ofavailable literature.
To provide a definitive account of the dynamics between changes in health care utilization, availability of tech-nology, and staffing is difficult, even in the case where complete data is available. Data in this study is limitedprimarily to aggregated hospital data, and therefore we can only illustrate, in part, how dynamics of the healthcare market are affected by staffing pattern changes. In addition, the data collection effort that this study relieson�the Health Care Cost Information System�has experienced two rounds of methodology changes in the last5 years, making longitudinal analysis more difficult. Despite these limitations, the variety of sources used in thisanalysis points out a number of trends that can be of value to policymakers.
Labor Intensity in the Health Care Industry
Labor intensity measures the percentage of expenses which go toward labor in various industries. In industriesthat are more labor-intensive, wages and salaries represent a larger portion of overall operating expenses. Thus,in industries that are more labor-intensive, wage increases have a greater impact on overall costs of productionthan for industries which are less labor-intensive.
As shown in figure 2, payroll and benefits costs (as a portion of overall business costs) are relatively high in thehealth services industry when compared to other industries. Individual interactions with a wide range ofproviders, as well as complex payment and financing systems, contribute to the intensity level. Many otherindustries have found ways to automate certain services or production processes. As mentioned earlier, in healthcare, while technology has certainly enhanced provider capabilities, it hasn�t and cannot replace the need forhealth care providers. As a result, health care is, and likely will continue to be, a relatively labor-intensive indus-try. Therefore, health care labor costs will continue to play an important role in determining the overall cost ofhealth care.
Report to the Minnesota Legislature
15

Figure 2
Staffing Costs within Health Care Institutions
This section of the report examines the role of staffing costs relative to other expenses at Minnesota�s health careinstitutions.
The proportion of staffing costs to overall operating expenses for Minnesota hospitals has remained fairly consis-tent throughout the late 1990s. Salary and benefit costs averaged slightly over 51 percent of operating costs dur-ing that time period.79 This is not to say that wages are not rising; rather, they appear to be rising proportionate-ly with other cost centers in hospitals. Figure 3 does not reflect the settlement reached last year by Twin Citiesarea hospitals that will raise RN salaries by 21 percent over the next three years; we address that issue later inthis report.
Figure 3
Labor Costs as a Percentage of Total Operating Costs for Minnesota Hospitals
43.17% 42.29% 42.34% 41.87% 41.59%
9.00% 9.15% 9.13% 9.38% 9.51%
0%
10%
20%
30%
40%
50%
60%
1996 1997 1998 1999 2000
Per
cen
tag
e o
f To
tal O
per
atin
g C
ost
s
Benefits
Salary
51.24%
Source: HICCIS Database
51.46%51.43%52.17% 51.11%
Payroll and Benefit Expenses as a Percent of Operating Expenses for Selected Industries: 1997
45% 46%40%
51% 52% 51%
8% 8%
9%
8% 8% 10%
0%
10%
20%
30%
40%
50%
60%
70%
80%
90%
100%
MerchantWholsale
Retail Trade Lodging Buisness Sector Legal Services Health Services
Per
cen
t O
per
atin
g E
xpen
se
Fringe Benefits
Payroll
53% 54%49%
59% 60% 61%
Source: 1997 Economic Census
Labor Availability and Health Care Costs
16

Data received from the Minnesota Health and Housing Alliance (MHHA), a trade association for skilled nursingfacilities, shows average staffing expenses for their members compose 71 percent of total operating expenses.MHHA says this figure has remained fairly constant over the 1990s.80 While MHHA members do not representthe entire long-term care industry in Minnesota, staffing cost figures for members of this organization are com-parable to national numbers, so it is likely this figure is a relatively accurate representation for nursing facilitiesstatewide (figure 4).
Figure 4
Nationally, data shows noticeable salary growth in hospitals during the first six months of 2001, with wagesincreasing 7.6 percent over the same time period in 2000.81 It is difficult to know whether the increase insalary costs are due to a greater number of hours worked, an increase in average hourly wage, or combinationof the two. Evidence gained through the site visit portion of this study suggests it is likely a combination of fac-tors, with providers (in particular, RNs) working a greater number of hours than in the past, and being paid ahigher hourly wage. Additionally, data from the Center for Medicare and Medicaid Services, which calculateschanges in wages and benefits within hospitals, shows a rise in both areas from 1999 to early 2001 (figure 5).The rise in benefits is more evident than the rise in salaries, possibly because hospitals and nursing homes areattempting to substitute benefits in lieu of pay increases.
Salaries and Benefits as a Percentage of Total Nursing Home Operating Costs
9% Benefits
64% Salaries
Source: Minnesota Health and Housing Alliance
27% Other
Report to the Minnesota Legislature
17

Figure 5
Compensation for Various Positions in Institutions
Composition of Staffing Costs
Registered nurses account for 35 percent of salary costs in hospitals and make up the bulk of defined staffingcosts. LPNs compose 2.9 percent of overall staffing costs; CNAs and x-ray technicians both take up 2.5 percent ofcosts; pharmacists, 2.1 percent; and nurse anesthetists, 1.6 percent. The remainder and majority of staffingcosts (53 percent) fall into an �other� category.82 �Other� is composed of administrative costs, occupational andphysical therapists, physicians, lab technicians, temporary or contract workers and, in some cases, janitorial andfood service staff (figure 6).
Figure 6
Composition of Hospital Staffing Costs
35.0%
2.9% 2.5% 2.5% 2.1% 1.6%
53.0%
0%
10%
20%
30%
40%
50%
60%
RN LPN CNA X-RAY RX CRNA OTHER
Source: HCCIS Database
Quarterly Percent Change of Hospital Input Price Index
0
1
2
3
4
5
6
1999 Q2 1999 Q3 1999 Q4 2000 Q1 2000 Q2 2000 Q3 2000 Q4 2001 Q1
% C
hang
e
HCFA Occupational Wage Index HCFA Occupational Benefits Index
Source: Centers for Medicare and Medicaid Services
Labor Availability and Health Care Costs
18

The Nursing Staff
Figure 7
Figure 7 shows the change in average RN salaries for large Twin Cities area hospitals over the last five years.83
The average salary has gone up 18 percent over that time period, from $20.80 per hour to $25.35 per hour forexperienced RNs. Given that registered nurses compose the greatest share of the hospital workforce, averaging28 percent across Minnesota hospitals84 (figure 8), an increase of this level will likely have a significant impacton individual hospital operating expenses.
Figure 8
Occupational Full Time Equivalents as a Percentage of Total Health Care Full Time Equivalents Over Time
0%
3%
6%
9%
12%
15%
18%
21%
24%
27%
30%
1990 1991 1992 1993 1994 1995 1996 1997 1998 1999 2000
Year
Per
cen
t F
TE
s o
f To
tal
RN
LPN
CNA*Pharmacist*X-Ray Technician
Source: HCCIS Database*data not collected until 1996
$17.42
$20.80
$17.87
$21.34
$18.41
$21.98
$20.03
$23.91
$21.24
$25.35
$0.00
$5.00
$10.00
$15.00
$20.00
$25.00
$30.00
Dol
lars
/Hou
r
1998 1999 2000 2001 2002
RN Average Base Salary for Large Metro Hospitals
New Graduates RN's With 4 Years Experience
Report to the Minnesota Legislature
19

Wage data on licensed practical nurses and certified nursing assistants is not collected as widely as data on regis-tered nurses. However, the annual MHHA member survey has collected this information for the past five years.While this data may not be entirely representative of the experience of all nursing facilities, it is illustrative ofwages in long-term health care facilities. Between 1996 and 2001, average CNA wages have increased from $8.11per hour to $10.45 per hour � an increase of 22 percent. During this same time period, LPN wages have gonefrom $11.69 per hour to $15.08 per hour � an increase of 22.5 percent. These numbers are similar to the 23percent rise in overall weekly wages in all industries from 1996 to 2000 in Minnesota.85
Pharmacists
As documented earlier, the demand for pharmacists has rapidly increased over the last several years, primarilydue to an increase in the number of prescriptions filled, especially in supermarket and mass merchant settings.Administrators interviewed for this study commented extensively on the difficulty of hiring and retaining phar-macists. An administrator of a large hospital system in the Twin Cities commented that ��we are very happy tohave a pharmacy school in Minnesota; however, it is not generating enough graduates to keep pace with demandin the metro area, much less in Greater Minnesota. The school graduates 60 students per year, and we are cur-rently recruiting for 20 positions within our system alone.�
Those interviewed indicated that rural hospitals frequently resort to sharing a pharmacist between multiple hos-pitals. Illustrating this is a capital improvement grant that was recently awarded to the Wilderness Health CareCoalition, composed of nine hospitals in northeastern Minnesota. They received $500,000 to implement tele-pharmacy projects at five of the nine hospitals, where they will jointly purchase and use technology allowing forautomated medication dispensing as well as inventory control.86
Most hospitals in the Twin Cities now pay pharmacists an annual salary of $85,000 plus a significant signingbonus, oftentimes around $10,000.87 Administrators indicated that retaining pharmacists often requires annualsalary increases of 12 percent a year in order to compensate for required overnight and weekend work, and toremain competitive with community pharmacy settings. Given the small percentage of overall staffing costs thatpharmacists comprise, it is unclear whether increases of this magnitude have a considerable impact on a hospi-tal�s budget; however, the demographic changes that will be occurring over the next 10 years, and the trendtoward increasing utilization of prescription drugs, mean that hospitals will likely continue to feel the effects of arelatively short supply of pharmacists.
Radiological Technicians
Radiological technicians (RTs) are another position that hospitals are having difficulty filling. In each interviewwe conducted, administrators mentioned the rapid increase in stand-alone radiology imaging centers as themain reason for the increased demand for RTs. While data is limited on the number of these new centers, anec-dotal and capital expenditure reporting information indicates that there has been a rapid growth of these typesof facilities in the Twin Cities and in certain areas of Greater Minnesota.
The demand for RTs has lead to noteworthy salary increases. One health system in the state has seen salariesrise for RTs nearly 60 percent from 1995 to 2001 (with a 14 percent increase in 2001). A national survey foundthat RTs are currently earning an average wage of $21.20 per hour ($53,919 annually) � an increase of 20 per-cent since 1997.88 While RTs make up less than 3 percent of the health care workforce, they are among thefastest rising staffing costs within hospitals.
Labor Availability and Health Care Costs
20
Temporary or Contract Workers
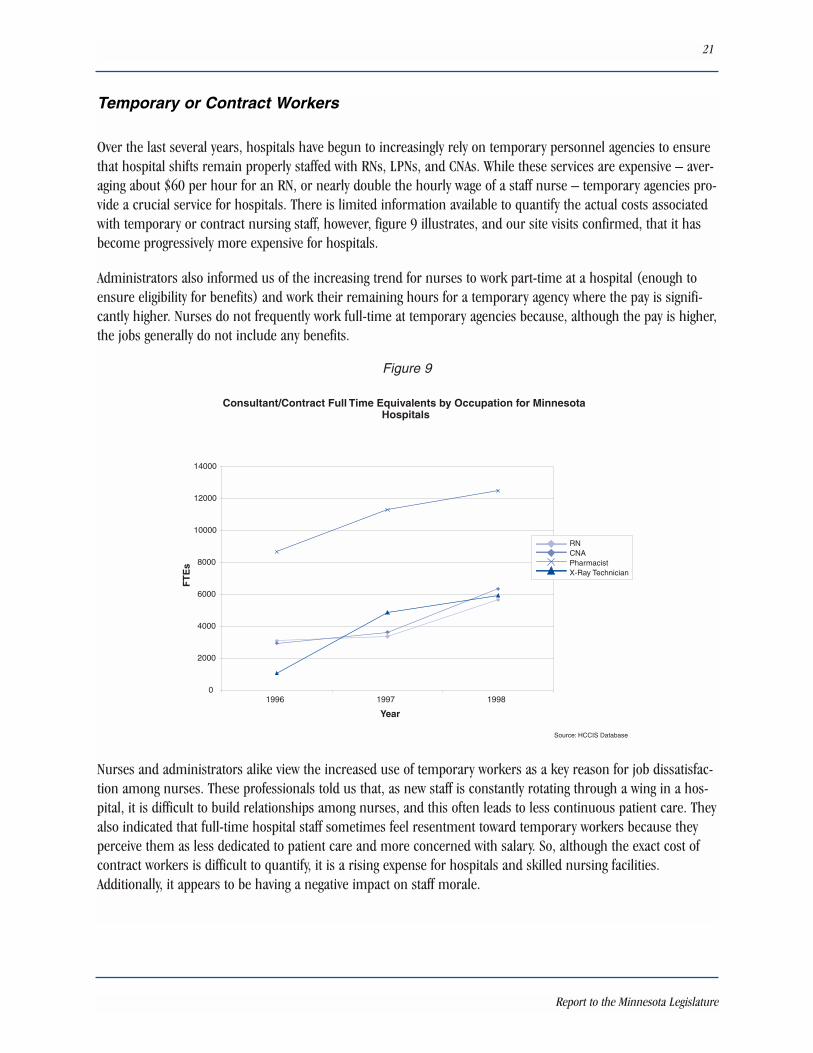
Over the last several years, hospitals have begun to increasingly rely on temporary personnel agencies to ensurethat hospital shifts remain properly staffed with RNs, LPNs, and CNAs. While these services are expensive � aver-aging about $60 per hour for an RN, or nearly double the hourly wage of a staff nurse � temporary agencies pro-vide a crucial service for hospitals. There is limited information available to quantify the actual costs associatedwith temporary or contract nursing staff, however, figure 9 illustrates, and our site visits confirmed, that it hasbecome progressively more expensive for hospitals.
Administrators also informed us of the increasing trend for nurses to work part-time at a hospital (enough toensure eligibility for benefits) and work their remaining hours for a temporary agency where the pay is signifi-cantly higher. Nurses do not frequently work full-time at temporary agencies because, although the pay is higher,the jobs generally do not include any benefits.
Figure 9
Nurses and administrators alike view the increased use of temporary workers as a key reason for job dissatisfac-tion among nurses. These professionals told us that, as new staff is constantly rotating through a wing in a hos-pital, it is difficult to build relationships among nurses, and this often leads to less continuous patient care. Theyalso indicated that full-time hospital staff sometimes feel resentment toward temporary workers because theyperceive them as less dedicated to patient care and more concerned with salary. So, although the exact cost ofcontract workers is difficult to quantify, it is a rising expense for hospitals and skilled nursing facilities.Additionally, it appears to be having a negative impact on staff morale.
Consultant/Contract Full Time Equivalents by Occupation for Minnesota Hospitals
0
2000
4000
6000
8000
10000
12000
14000
1996 1997 1998
Year
FT
Es
RNCNAPharmacistX-Ray Technician
Source: HCCIS Database
Report to the Minnesota Legislature
21

National Evidence on Labor Shortages
Skilled Nursing Facilities
The Center for Medicare and Medicaid Services (CMS) has undertaken a new initiative to review data availablefrom Wall Street analysts on various segments of the health industry. A major finding included: �the most signifi-cant cost for nursing facilities is labor. According to a Credit Suisse First Boston analysis, about 55-60 percent ofnursing facility companies� revenues go to pay for labor costs. It notes the wage rate increases over the last twoyears have been significant�.Thus, the industry remains at the mercy of the labor market, which despite therecession, remains tight because of a severe nationwide nursing shortage. Because of the labor shortage, manySNFs rely on staffing agencies, which are viewed by Wall Street as expensive.�91
Fairview Nurses Strike
Although the nursing shortage is not solely to blame for recent labor actions, both nurses and hospitaladministrators indicated that it undoubtedly played a prominent role. Staff have reported feeling overbur-dened with high patient loads and mandatory overtime caused by the shortage. According to Merritt ResearchServices, a municipal bond research company, �you need to look at the nursing shortages in tandem withlabor actions�.Shortages mean working conditions will remain at stressful levels and are therefore morelikely to trigger disputes.�
In May and June 2001, over 6,400 nurses at thirteen Twin Cities metro-area hospitals threatened to go onstrike over disputes related to staffing levels and mandatory overtime, as well as wages and benefits.According to Minneapolis Star Tribune interviews, nurses wanted relief from chronic staff shortages. Theyattributed the shortage with jeopardizing patient care and making their jobs �almost unbearable.� TheMinnesota Nursing Newsletter also cited poor staffing conditions caused by the nursing shortage as a primaryreason to strike. Ultimately, 10 hospitals settled contract disputes before the strike deadline, while 1,350nurses at 3 hospitals � Fairview Southdale and Fairview-University Medical Center�s Riverside campus �struck for 23 days before reaching a settlement that raises wages 19 percent over the next 3 years. RogerFeldman, a health economist from the University of Minnesota, estimates that a nearly 20 percent raise innursing salaries will increase the total staffing costs of a hospital by slightly over 2 percent, which Dr.Feldman estimated would result in a similar rise in health insurance premiums.89
While there are no aggregate figures available that estimate the total cost of the strike to Twin Cities hospitals,certain aspects can be examined. For instance, roughly 4,000 replacement nurses were brought into workduring the strike. Replacement nurses can cost roughly $40 to $50 an hour plus recruitment fees, trans-portation monies, accommodations, and other incentives. Affected hospitals operated at lower capacity inorder to preserve quality of care and appropriate nurse-patient ratios. This lead to costs associated with fore-gone revenue, legal and consulting bills and, finally, plans and preparations for the possible strikes. Moody�sInvestors indicated that the HealthEast care system paid nearly $2 million for 335 potential nurse replace-ments, which in turn lead Moody�s to downgrade their bond rating.90
Labor Availability and Health Care Costs
22

Fitch Ratings, a bond rating company, also examined the skilled nursing market and found that ��Fitch�s out-look for the long-term care sector is neutral to somewhat negative due largely to expected increasing laborcosts�.Fitch anticipates profitability to remain flat to declining in 2001.� They based this analysis on the factthat most skilled nursing facilities are heavily reliant on Medicaid payments as well as �.�compared to mosthospitals, skilled nursing providers pay lower wages to nurses, making the attraction of qualified and experi-enced nurses more difficult. The sector�is susceptible to nursing shortages and should face increasing agencynurse utilization, overtime expense, and pay increases.�92
Hospitals
Fitch Ratings has similar concerns with the hospital market as it does with skilled nursing. In a report fromJune 2001, they state that ��rising personnel expense, mainly due to the growing shortage of nurses, is themost significant long-term problem affecting hospitals and threatens to keep operating margins in check for theforeseeable future.� They also found that, �Hospitals can afford to increase nursing salaries only slightly becausemost hospitals perform only at break-even profitability already. If salaries are increased substantially, almost allhospitals would be unprofitable.�93
National studies have documented that many provider systems, after considerable consolidation, enjoy �must-have� status in health plan networks.94 This has enabled networks of hospitals and clinics to increase theirnegotiating power with health plans and improve reimbursement for services. The hospitals we spoke with in ornear the metro-area confirm that they have also been able to demand an increase in reimbursement rates fromhealth plans over the last 18 months and there were instances cited where health systems threatened to rejectcontract offers from health plans if they did not improve their rates. Given these market dynamics, it is likelythat hospitals, in large part, have been able to pass the increased wages on to third-party payers.
A study which examined national data on this issue found that, ��gains (in health plan contracts) were tem-pered by rapidly rising nurses� wages and energy costs. Weekly wages paid to workers in private hospitalsincreased 4.1 percent in 2000�.Costs also increased as hospitals hired more costly temporary staff, providedflexible work arrangements, and offered signing bonuses to meet staffing needs.�While nursing shortages waxand wane, pressures to increase nurses� wages are expected to increase.� 95
In another report by Fitch they projected that, �Maintaining its negative outlook of the past two years, Fitchbelieves that hospitals will continue to be challenged by various operating pressures and will produce flat or pos-sibly weaker operating margins in 2001.�Temporary staffing costs�have offset improvements hospitals havemade in their negotiations with managed care companies�.Although the absolute 0.7 percent increase in per-sonnel costs�may appear small, it is much more significant when realizing that this 0.7 percent directly corre-lates with a 0.7 percent decline in operating margins.�96
The market industry update on acute care hospitals recently completed by CMS comes to different conclusionsabout the impact of labor costs on hospitals. The analysis recognizes labor costs, and in particular nursing costs,as an area of some concern, but CMS does not believe it will have a significant impact on overall financial per-formance of the industry. They quote recent findings of a Medicare Payment Advisory Commission report whichstates, ��We note that revenue per adjusted admission grew at a greater rate than expenses, despite no appre-ciable change in hospital discharges, days, outpatient visits or non-operating revenue. This would suggest thatpayments from private payers continue to increase.�97 As health insurance premiums are expected to continuerising over the next year, CMS reports that analysts expect hospitals to remain well-positioned to extract rateincreases during this time period.
Report to the Minnesota Legislature
23

Labor Availability and Health Care Costs
24
SECTION 5
Discussion and Forecast
The Minnesota Department of Health was charged with determining the effects of health care labor availabilityand its impact on health care. We found evidence regarding the severity of health care labor conditions and theirinfluence on increasing health care costs. All signs indicate that labor, which composes nearly 60 percent ofspending on health care, is an important and growing aspect of overall costs. Data collected for this paper, aswell as national studies, indicate that personnel costs began to rise toward the end of 1999. Payroll data fromthe first half of 2001 shows a continuation of wage acceleration. However, while some health professions areseeing a brisk acceleration of their wages, none of the available data shows that the majority of labor costs withinhealth care institutions are rising more rapidly than labor in non-health related industries.
Factors influencing rising labor costs in Minnesota are trends being noted nationwide, in some cases muchmore severely. Utilization of health services is increasing due to a variety of factors, including the aging of thepopulation. This drives the need for more health professionals and perpetuates the growing issues with theretention of medical personnel. It is important to note that the severity of the workforce shortage and resultingwage increases are not uniform across health professions. The shortage among registered nurses appears tohave the greatest impact on staffing costs. In contrast, while the shortage among pharmacists is persistent andconcerning, it does not appear to have a great effect on overall budgets due to the relatively small presence ofpharmacists within hospitals.
Recruiting and retaining medical personnel: While the recent recession may have eased demand pressure forlower-skilled workers, it does not appear to have had the same impact on workers who require 2 or more yearsof post-secondary schooling. Rising vacancy rates for RN�s, pharmacists, and radiological technicians persist,leading institutions to offer signing bonuses, tuition reimbursement or loan re-payment, flexible scheduling, andcash incentives for voluntary overtime shifts. While nursing vacancy and turnover rates in Minnesota are highcompared to other industries in the state, when contrasted with national data, it appears as though Minnesota isfaring better than the rest of the country. Nationally, a 12-13 percent annual RN turnover rate is reported, whilein Minnesota, the annual RN turnover rate is estimated at 6 percent. With regards to the issue of an aging nursepopulation, Minnesota has a significantly older population of workers than the rest of the country. The averageage of an RN in Minnesota is 45.3 years, versus the national average of 43 years. Due to the length of timeinvolved in training and education of new nurses, we do not anticipate that labor conditions will moderate in thenear future, thus, costs for financial recruitment and retention incentives can be expected to continue rising.
Aging Population: Minnesota�s 65-and-older population is currently the fastest growing age group in the state.This trend, due to the aging of the baby boom generation, is expected to continue for at least the next 30 years.98
This has implications for projections related to health service utilization. As the population ages, people spendgreater amounts of money on health care because service use tends to increase with age. Average yearly medicalexpenditures are one indicator of this: expenses for people aged 18 to 64 are estimated at $1,861, while forthose over 65, the average is $5,370.99 Therefore, as the population ages, it is likely that there will be a contin-ued and increased demand for health care professionals, exacerbating the strain on the labor market for theseindividuals.
Report to the Minnesota Legislature
25

Hospital Performance: The hospital industry was faced with a number of challenges in the late 1990s. TheBalanced Budget Act of 1997 reduced Medicare payment increases, and the growing influence of managed caremeant that patient stays were curtailed and lower reimbursement for services was being offered. The industryappears to be rebounding from this, in part due to further changes made to Medicare reimbursement policy, aswell as the ebbing of managed care companies� marketplace negotiating leverage. CMS reports that the outlookfor the industry is fairly positive due to aging demographic trends, commercial premium rate increases, changesin Medicare payment policies and the projected improvement of the overall economy in the later half of 2002.They have concerns regarding the impact of the recession on state Medicaid budgets and the rising costs ofpharmaceuticals, malpractice insurance, utilities, and pensions.100 While the agency has expressed some appre-hension about the impact of labor costs on overall hospital budgets, it is not their leading concern. However,given that labor costs compose nearly half of an average hospital�s operating budget, combined with theirincreased negotiating power with health plans, if staffing costs continue their rapid ascent, consumers will ulti-mately pay the price in increased insurance premiums.
Cost Growth: From 1998-2000, private health care spending in Minnesota grew an average of 11 percent peryear. This figure illustrates the growth in underlying health care costs and it has risen every year since 1996.When this is combined with the continuing growth of health premiums, it seems unlikely that costs will moder-ate in the near future. Labor shortages, particularly in the nursing field, will exacerbate growth in underlyingcosts.
Continued Monitoring: The Health Economics Program will continue to monitor the issue of health professionlabor shortages and their impact on overall health care costs to ensure that accurate and timely information isavailable to policymakers and the public as Minnesota continues its efforts to make health insurance affordablefor all Minnesotans.
Labor Availability and Health Care Costs
26
Endnotes
1 MN Session Laws 2001, Chapter 9, S.F. 9, Article 1, Section 60
2 Aggregate health spending estimates in the section are preliminary for 2000.
3 Centers for Medicare and Medicaid Services.
4 Levit, K., Smith, C., Cowan, C., Lazenby, H., Martin, A. Inflation Spurs Health Spending in 2000. Health Affairs,Volume 21, Number 1.
5 Minnesota Department of Health, Health Economics Program.
6 Ibid.
7 The Pew Health Professionals Commission. Critical Challenges Revitalizing the Health Professions for theTwenty-First Century, third report. December, 1995. http://futurehealth.ucsf.edu/pdf_files/challenges.pdf
8 Ibid.
9 �Steady growth in health occupations, 1986-96 and projected 1996-2006�, Occupational Outlook Quarterly,Spring 1999 v43 il p 40(1): U.S. Department of Labor, 1999.http://www_bls.gov/opub/ooq/1999/Spring/oochart.pdf.
10 Ibid.
11 BLS. National Employment, Hours and Earning Survey. 2001.
12 Aon Health Alliance. Health Flash. 7.1: 2000. www.aonalliance.com
13 Bureau of Labor Statistics. Occupational Employment and Wages. Occupational Employment Statistics Survey,2000. http://www.bls.gov/news.release/ocwage.toc.htm
14 Minnesota Department of Economic Security, Research and Statistics Office. Minnesota Job Vacancy Survey.4th Quarter 2001, January 2002. http://www.mnwfc.org/lmi/jobvacancy/4thq1-02jvs.pdf
15 Ibid.
16 Ibid.
17 Ibid.
Report to the Minnesota Legislature
27
18 Minnesota Department of Health, Health Economics Program. Minnesota Health Professions Trainee ExitSurveys, June 2001.
19 Bureau of Labor Statistics. Occupational Employment and Wages. Occupational Employment Statistics Survey,2000.http://www.bls.gov/news.release/ocwage.toc.htm
20 Bureau of Labor Statistics. Occupational Outlook Handbook. 2002-03 edition.http://www.bls.gov/oco/
21 United States General Accounting Office. Nursing Workforce: Emerging Nurse Shortages Due to MultipleFactors. July 2001.
22 Ibid.
23 Ibid.
24 Bureau of Labor Statistics. Occupational Outlook Quarterly. Occupational Outlook. Winter 2001.http://www.bls.gov/opub/ooq/ooqhome.htm
25 United States General Accounting Office. Nursing Workforce: Emerging Nurse Shortages Due to MultipleFactors. July 2001.
26 Ibid.
27 Federation of Nurses and Health Professionals. The Nurse shortage: Perspectives from current direct carenurses and former direct care nurse. 2001.
28 Peter I. Beerhouse, et a. JAMA. Implications of an Aging Registered Nurse Workforce. 283(22): 2948-2954,2000.
29 Ibid.
30 American Hospital Association. Trend Watch. 3(2):2001.
31 Bureau of Labor Statistics. Occupational Outlook Quarterly: Occupations with the Greatest RetireeReplacement Needs, Projected 1998-2008. June 2001.http://www.bls.gov/opub/ooq/2001/spring/oochart.pdf
32 Peter I. Beerhouse, et a. JAMA. Implications of an Aging Registered Nurse Workforce. 283(22): 2948-2954,2000.
33 Fitch Ratings. Health Care Staffing Shortage. June 27, 2001.
34 United States General Accounting Office. Nursing Workforce: Recruitment and Retention of Nurses and NurseAides Is a Growing Concern. May, 17, 2001. and United States General Accounting Office. Nursing Workforce:Multiple Factors Create Nurse Recruitment and Retention Problems. June 27, 2001.
Labor Availability and Health Care Costs
28

35 HRSA News Room. President�s FY 2003 Budget to Strengthen National Health Service Corps, NursingEducation Loan Repayment Program. January, 2000. http://www.hrsa.gov/newsroom/
36 The Associated Press State and Local Wire. Nursing Shortage at the Heart of Contract Talks. May 7, 2001.
37 Minnesota Department of Economic Security, Research and Statistics Office. Minnesota Job Vacancy Survey.4th Quarter 2001, January 2002.http://www.mnwfc.org/lmi/jobvacancy/4thq1-02jvs.pdf
38 Ibid.
39 Office of Rural Health and Primary Care. Registered Nurse Workforce Profile. February, 2001.
40 Minnesota Health and Hospital Partnership. Employee Turnover and Vacancy Survey Report. 2001-2.
41 Minnesota Department of Economic Security, Research and Statistics Office. Minnesota Job Vacancy Survey.4th Quarter 2001, January 2002.http://www.mnwfc.org/lmi/jobvacancy/4thq1-02jvs.pdf
42 Office of Rural Health and Primary Care. Registered Nurse Workforce Profile. February, 2001.
43 Ibid.
44 Department of Health and Human Services and Health Resources and Services and Bureau of HealthProfessionals. The Pharmacist Workforce Study: A study of the Supply and Demand for Pharmacists. December,2000.
45 Bureau of Labor Statistics. Occupational Employment and Wages. Occupational Employment Statistics Survey.2000. http://www.bls.gov/news.release/ocwage.toc.htm
46 Colleges award a doctor of pharmacy which is a 4-year program that requires at least 2 years of college studyprior to admittance. This degree has replaced the Bachelor of Science degree, which will cease to be awardedafter 2005.
47 Bureau of Labor Statistics. Occupational Outlook Handbook. 2002-03 edition.http://www.bls.gov/oco/
48 In July 1992, the majority schools and colleges of pharmacy across the country voted to make the Doctor ofPharmacy (Pharm.D.) degree the only professional pharmacy degree. A PharmD degree requires four years ofprofessional study, following a minimum of two years of pre-pharmacy study, for a total of six academic years.This represented a one year increase in amount of schooling needed to get a professional pharmacy degree. TheBachelors in Science Degree which as all but been replaced by the Pharm D. will case to be awarded after 2005.
49 Department of Health and Human Services and Health Resources and Services and Bureau of HealthProfessionals. The Pharmacist Workforce Study: A study of the Supply and Demand for Pharmacists. December,2000.
Report to the Minnesota Legislature
29

50 Ibid.
51 New York Times. Unfilled Jobs in Pharmacies Raise Fears of Drug Errors. August 26,2001.
52 Department of Health and Human Services and Health Resources and Services and Bureau of HealthProfessionals. The Pharmacist Workforce Study: A study of the Supply and Demand for Pharmacists. December,2000.
53 Ibid.
54 American Association of Colleges of Pharmacy (AACP), American College of Clinical Pharmacy (ACCP),American Pharmaceutical Association (APhA), American Society of Consultant Pharmacists (ASCP), AmericanSociety of Health-System Pharmacists (ASHP), Food, Marketing Institute (FMI), National Association of ChainDrug Stores (NACDS), National Community Pharmacists Association (NCPA). Letter to Congressional CommitteeMembers: Support for Addressing Pharmacist Shortage. April 23, 2001.http://www.ashp.org/public/proad/shortage.html
55 American Association of Colleges of Pharmacy. Pharmaceutical Education and the Pharmacy Workforce.Should we Expand Our Programs? 2000.
56 Department of Health and Human Services, Health Resources and Services Administration, Bureau of HealthProfessionals. The Pharmacist Workforce Study: A study of the Supply and Demand for Pharmacists. December,2000.
57 Ibid.
58 National Association of Chain Drug Stores. Issue Brief. Pharmacist Shortage Addressed by �The PharmacyEducation Aid of 2001� Act. March 15, 2001.
59 Minnesota Department of Economic Security, Research and Statistics Office. Minnesota Job Vacancy Survey.4th Quarter 2001, January 2002. http://www.mnwfc.org/lmi/jobvacancy/4thq1-02jvs.pdf
60 Office of Rural Health and Primary Care. Pharmacist Workforce Profile. September, 2001.
61 Minnesota Department of Health, Health Economics Program. Minnesota Health Professions Trainee ExitSurveys, June 2001.
62 Bureau of Labor Statistics. Occupational Outlook Quarterly. Occupational Outlook. Winter 2001.http://www.bls.gov/opub/ooq/ooqhome.htm
63 Ibid.
64 Bureau of Labor Statistics. Occupational Outlook Handbook. 2002-03 edition.http://www.bls.gov/oco/
65 Ibid.
Labor Availability and Health Care Costs
30

66 American Health Care Association. Nursing Position Vacancy and Turnover Survey. 2001.http://www.ahca.org/research/vacancysurvey_020207.pdf
67 Minnesota Department of Economic Security, Research and Statistics Office. Minnesota Job Vacancy Survey.4th Quarter 2001, January 2002.http://www.mnwfc.org/lmi/jobvacancy/4thq1-02jvs.pdf
68 Minnesota Health and Hospital Partnership. Employee Turnover and Vacancy Survey Report. 2001-2.
69 American Health Care Association. Nursing Position Vacancy and Turnover Survey. 2001.http://www.ahca.org/research/vacancysurvey_020207.pdf
70 Office of Rural Health and Primary Care. Licensed Practical Nurse Workforce Profile. February, 2001.
71 Bureau of Labor Statistics. Occupational Employment and Wages. Occupational Employment Statistics Survey.2000.http://www.bls.gov/news.release/ocwage.toc.htm
72 Bureau of Labor Statistics. Occupational Outlook Handbook. 2002-03 edition.http://www.bls.gov/oco/
73 Ibid.
74 American Health Care Association. Nursing Position Vacancy and Turnover Survey. 2001.http://www.ahca.org/research/vacancysurvey_020207.pdf
75 Minnesota Department of Economic Security, Research and Statistics Office. Minnesota Job Vacancy Survey.4th Quarter 2001, January 2002.http://www.mnwfc.org/lmi/jobvacancy/4thq1-02jvs.pdf
76 Minnesota Health and Hospital Partnership. Employee Turnover and Vacancy Survey Report. 2001-2.
77 Minnesota Workforce Center. Job Vacancy Survey. 4th Quarter, 2001.
Minnesota Department of Economic Security, Research and Statistics Office. Minnesota Job Vacancy Survey. 4thQuarter 2001, January 2002.http://www.mnwfc.org/lmi/jobvacancy/4thq1-02jvs.pdf
78 American Health Care Association. Nursing Position Vacancy and Turnover Survey. 2001.http://www.ahca.org/research/vacancysurvey_020207.pdf
79 Minnesota Department of Health. Health Care Cost Information System. 1996-2000.
80 Minnesota Health and Housing Alliance. 2001.
81 Strunk, B., Ginsburg, P., Gabel, J. Tracking Health Care Costs: Hospital care surpasses drugs as the key costdriver. Health Affairs, Web Exclusive, September 26, 2001.
Report to the Minnesota Legislature
31

82 Minnesota Department of Health. Health Care Cost Information System. 1996-2000.
83 Metro hospital data was used in this instance because nurses in these hospitals operate under the same orvery similar contracts.
84 Ibid.
85 Minnesota Department of Economic Security. Average Hourly Wage Survey. 1996-2000.
86 Minnesota Department of Health, Office of Rural Health and Primary Care. 2002.
87 Industry Interviews, 2001.
88 American Society of Radiologic Technologists. 2001.
89 Lerner, M., Burcum, J. Nurse Strike Settlement; Nurses OK Contract. Star Tribune. June 26, 2001.
90 Find source from Elizabeth.
91 Center for Medicare and Medicaid Services. Health Care Industry Market Update: Nursing Facilities. February6, 2002.
92 Fitch Ratings. Median Ratios for Nonprofit Continuing Care Retirement Communities, 2000. July 19, 2001.
93 Fitch Ratings. Health Care Staffing Shortage. June 27, 2001.
94 Levit, K., Smith, C., Cowan, C., Lazenby, H., Martin, A. Inflation Spurs Health Spending in 2000. HealthAffairs, Volume 21, Number 1.
95 Ibid.
96 Fitch Ratings. 2000 Median Ratios for Nonprofit Hospitals and Health Care Systems. August 22, 2001.
97 Center for Medicare and Medicaid Services. Health care Industry Market Update: Acute Care Hospitals. April29, 2002.
98 Minnesota Planning, State Demographic Center. Faces of the Future; Minnesota Population Projections 1995-2025. May 1998.
99 Agency for Healthcare Research and Quality. Medical Expenditures Panel Survey. Health Care Expenses in theCommunity Population, 1996.
100 Center for Medicare and Medicaid Services. Health care Industry Market Update: Acute Care Hospitals. April29, 2002.
Labor Availability and Health Care Costs
32


To obtain additional copies of this report, please contact:
Minnesota Department of HealthMinnesota Health Information Clearinghouse
P.O. Box 64975St. Paul, Minnesota 55164-0975(651) 282-6314; (800) 657-3793
TDD (651) 215-8980
Printed with a minimum of 10% post-consumer materials. Please recycle.
If you require this document in another format, such as large print, Braille or cassettetape, call (651) 282-6314
