labor institutions and market performance
TRANSCRIPT
1
Labor Institutions and Market PerformanceLabor Institutions and Market PerformanceAn AgentAn Agent--Based Computational Economics ApproachBased Computational Economics Approach
Presenter:Presenter:
Leigh Tesfatsion Leigh Tesfatsion Professor of Econ, Math, and Electrical and Comp. Eng.Professor of Econ, Math, and Electrical and Comp. Eng.
Department of Economics Iowa State University
Ames, Iowa 50011-1070http://www.econ.iastate.edu/tesfatsi/
Last Revised: 8 December 2010
2
OutlineOutline
What is Agent-Based Computational Economics (ACE)?
Labor Institutions and Market Performance: What does ACE have to offer?
Illustration: (M. Pingle/L. Tesfatsion, 2003)
“Evolution of Worker-Employer Networks and Behaviors Under Alternative Non-Employment Benefits”
Trade Network Game (TNG) Lab Implementationwww.econ.iastate.edu/tesfatsi/TNGHome.htm
3
What is AgentWhat is Agent--Based Based Computational Economics (ACE)?Computational Economics (ACE)?
Culture-dish approach to the study of decentralized market processes
Computational study of economic processes modeled as dynamic systems of interacting agents
ACE Resource Site:www.econ.iastate.edu/tesfatsi/ace.htm
ACE Labor Market Research Site:www.econ.iastate.edu/tesfatsi/alabor.htm
4
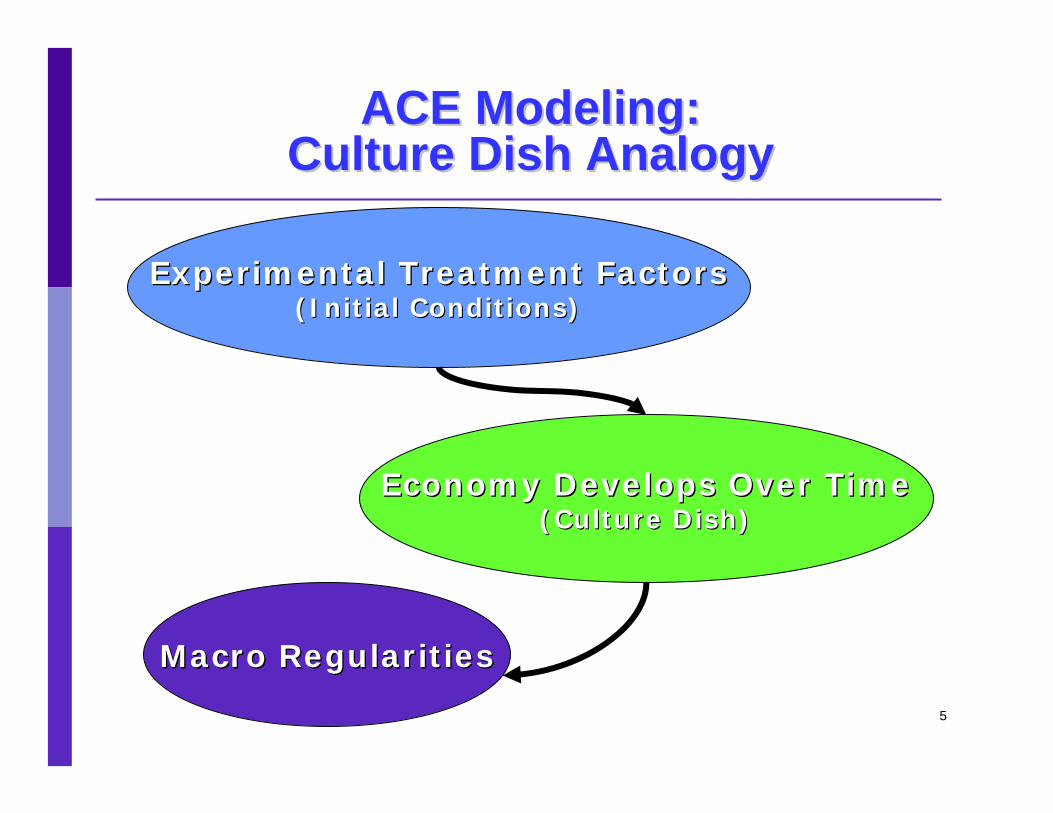
ACE Modeling: ACE Modeling: Culture Dish AnalogyCulture Dish Analogy
Modeler constructs a computational economic world populated by various types of agents (economic, social, biological, & physical)
Modeler sets initial conditions
The world then develops over timewithout further outside intervention
World driven solely by agent interactions
5
ACE Modeling: ACE Modeling: Culture Dish AnalogyCulture Dish Analogy
Experimental Treatment FactorsExperimental Treatment Factors(Initial Conditions)(Initial Conditions)
Economy Develops Over TimeEconomy Develops Over Time(Culture Dish)(Culture Dish)
Macro RegularitiesMacro Regularities

6
Key Characteristics of ACE ModelsKey Characteristics of ACE Models
Agents are encapsulated software programs capable of
− AdaptationAdaptation to environmental conditions− Social communicationSocial communication with other agents− GoalGoal--directed learningdirected learning− Autonomy (self-activation and self-determinism based on private internal processes)
Agents can be situated in realistically rendered problem environments
Behaviour/interaction patterns can develop endogenously over time
7
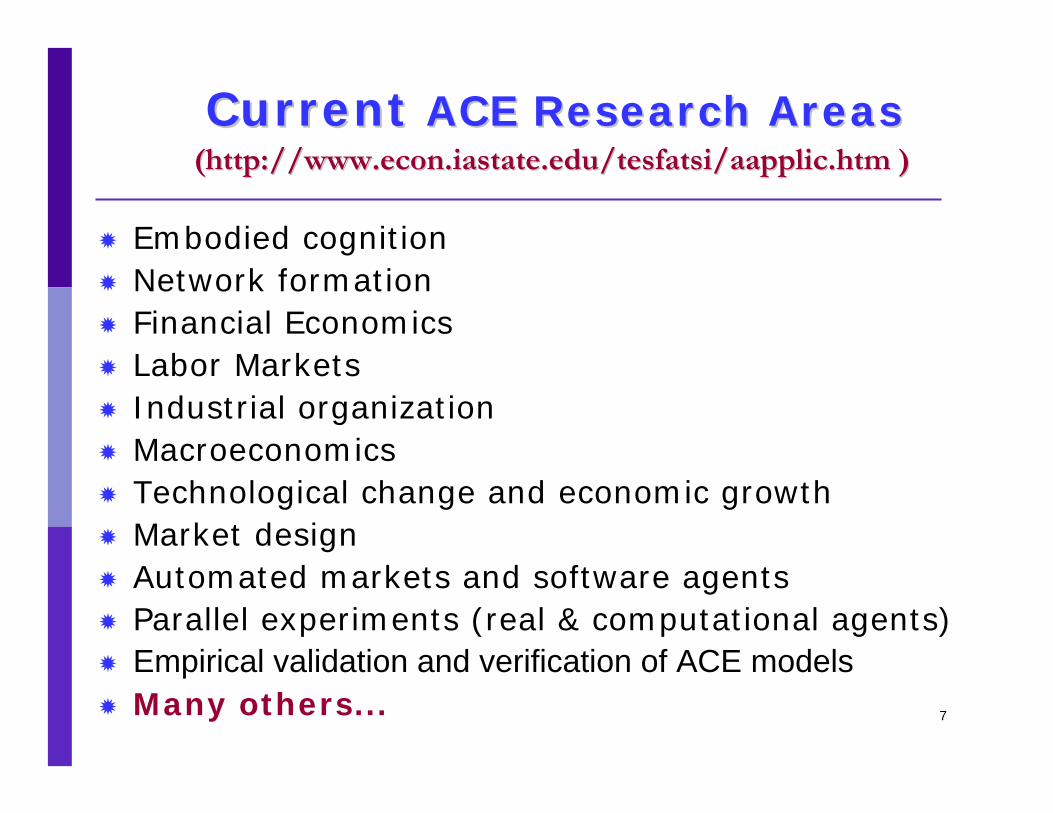
Current Current ACE Research AreasACE Research Areas(http://www.econ.iastate.edu/tesfatsi/aapplic.htm )(http://www.econ.iastate.edu/tesfatsi/aapplic.htm )
Embodied cognitionNetwork formationFinancial EconomicsLabor MarketsIndustrial organizationMacroeconomicsTechnological change and economic growthMarket designAutomated markets and software agentsParallel experiments (real & computational agents)Empirical validation and verification of ACE modelsMany others...

8
Labor Institutions and Market Performance
Some Key Issues:Some Key Issues:
Labor contracts typically Labor contracts typically incompleteincomplete
Supplemented by government programs Supplemented by government programs with with numerous eligibility restrictionsnumerous eligibility restrictions
Difficult to test program effectsDifficult to test program effects by by means of conventional analytical and/or means of conventional analytical and/or statistical toolsstatistical tools

9
Example: U.S. Programs ProvidingExample: U.S. Programs Providing
Unemployment Benefits (UB)Unemployment Benefits (UB)
UB only paid to “no fault of their own” unemployed
UB recipients must continue to seek employment
UB levels based on past earnings
UB of limited duration
UB financed by taxes imposed on employers
Additional UB often granted when unemployment rate is abnormally high for prolonged periods
Example: IA Unemployment Insurance Guide (29pp)http://www.iowaworkforce.org/ui/guide.htm
10
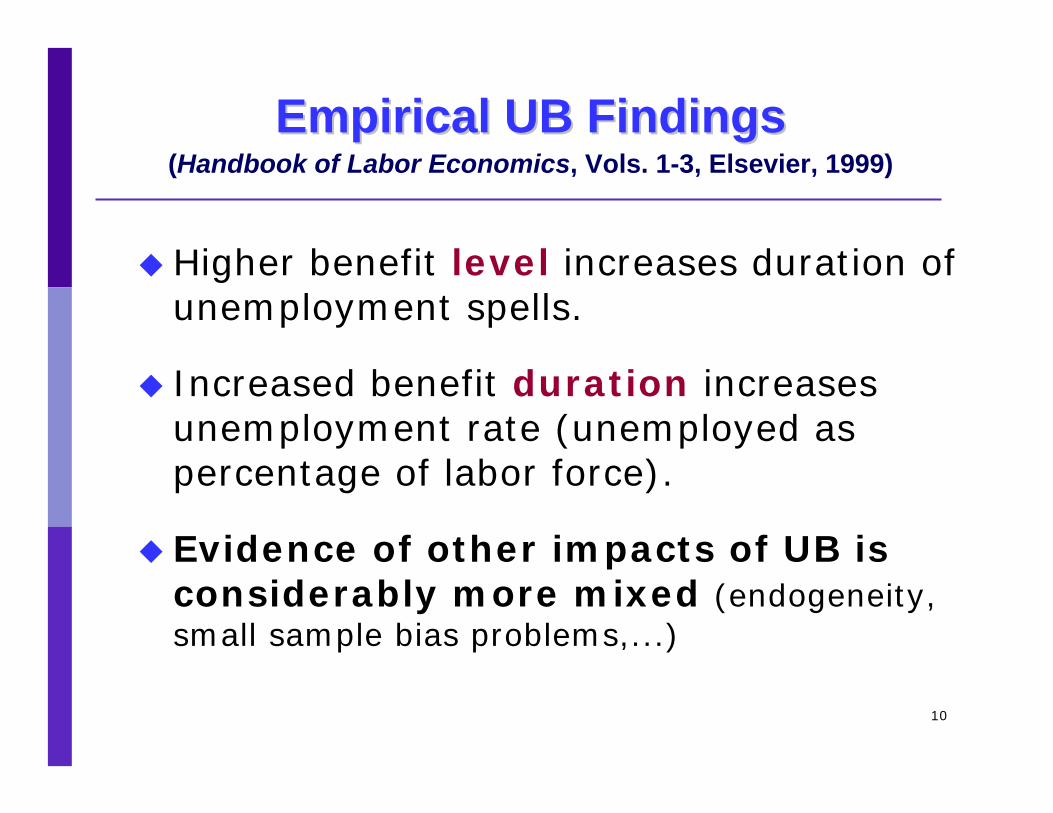
Empirical UB FindingsEmpirical UB Findings(Handbook of Labor Economics, Vols. 1-3, Elsevier, 1999)
Higher benefit level increases duration of unemployment spells.
Increased benefit duration increases unemployment rate (unemployed as percentage of labor force).
Evidence of other impacts of UB is considerably more mixed (endogeneity, small sample bias problems,...)

11
Common Approach to UB Theoretical ModelingCommon Approach to UB Theoretical Modeling(Handbook of Labor Economics, Vols. 1-3, Elsevier, 1999)
Dynamic Programming (DP)
Jobs arise and end randomly
Unemployed receive UB
Workers compare DP value of new job vs. current job or unemployment
Each worker maximizes lifetime expected utility
Precise predictions possible, but empirical support unclear.

12
Potential Contributions of an ACE Approach to Labor Research
www.econ.iastate.edu/tesfatsi/alabor.htm
Employers/workers can be modeled as autonomous interacting agents
Matching process can be preferential (endogenous hires, quits, and firings)
Learning can be calibrated to data (empirical, human-subject experimental)
Evolution of behaviors/interaction networks
Relatively easy to incorporate realistically detailed structural features (market protocols, policy rules, program eligibility requirements,…)
13
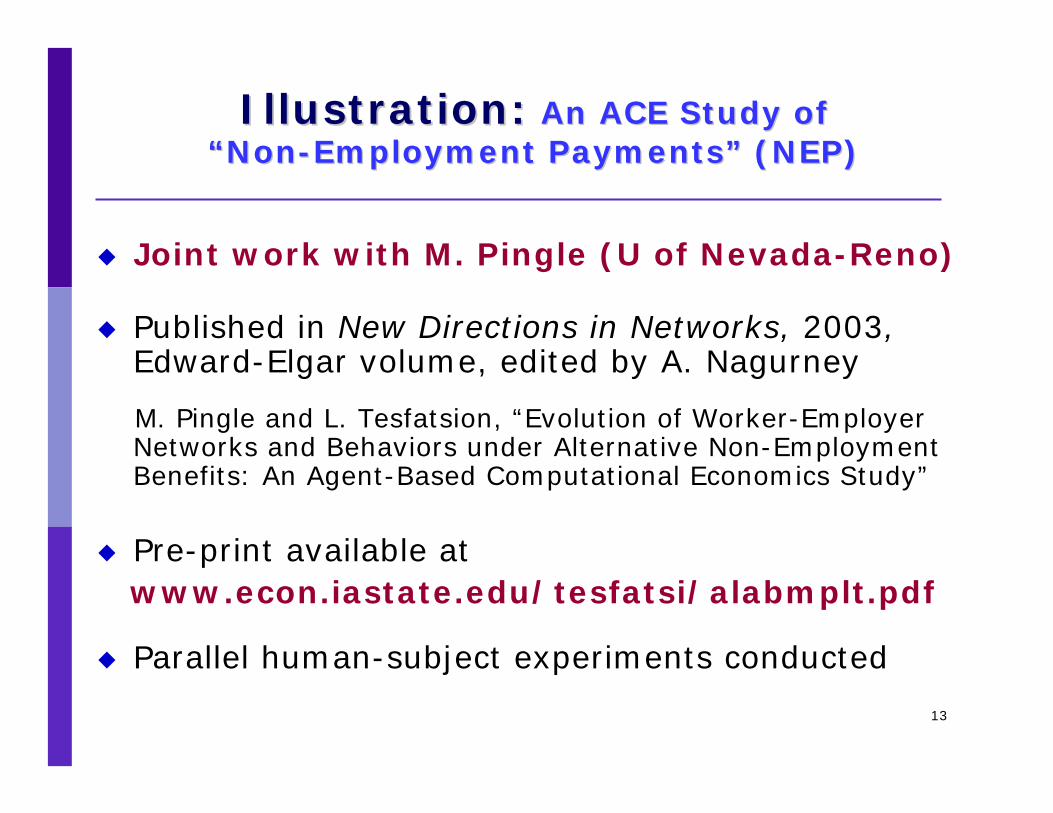
Illustration:Illustration: An ACE Study of An ACE Study of ““NonNon--Employment PaymentsEmployment Payments”” (NEP)(NEP)
Joint work with M. Pingle (U of Nevada-Reno)
Published in New Directions in Networks, 2003,Edward-Elgar volume, edited by A. Nagurney
M. Pingle and L. Tesfatsion, “Evolution of Worker-Employer Networks and Behaviors under Alternative Non-Employment Benefits: An Agent-Based Computational Economics Study”
Pre-print available atwww.econ.iastate.edu/tesfatsi/alabmplt.pdf
Parallel human-subject experiments conducted

14
ACE Labor Market FrameworkACE Labor Market Framework
W1W1 W2W2 W3W3 W12W12. . .
E1E1 E2E2 E3E3 E12E12. . .. . .
Preferential job search with choice/refusal of partners: Red directed arrow indicates refused work offer.

15
Focus on Interaction Effects Focus on Interaction Effects Endogenous Heterogeneity of AgentsEndogenous Heterogeneity of Agents
12 workers with same observableattributes in initial period T=012 employers with same observableattributes in initial period T=0Each worker can work for at most one employer in each period TEach employer can provide at most one job opening in each period TWorksite strategies in initial period T=0 are random and private info

16
Public methods for requesting/receiving infoabout various market and NEP policy protocols
Public communication methods–workers and employers can talk with each other.
Privately stored data that can change over time through experiences/communications
Private behavioral methods that include expectation formation & learning about preferred worksite partners and worksite strategy choices
Each worker and employer hasEach worker and employer has……
17
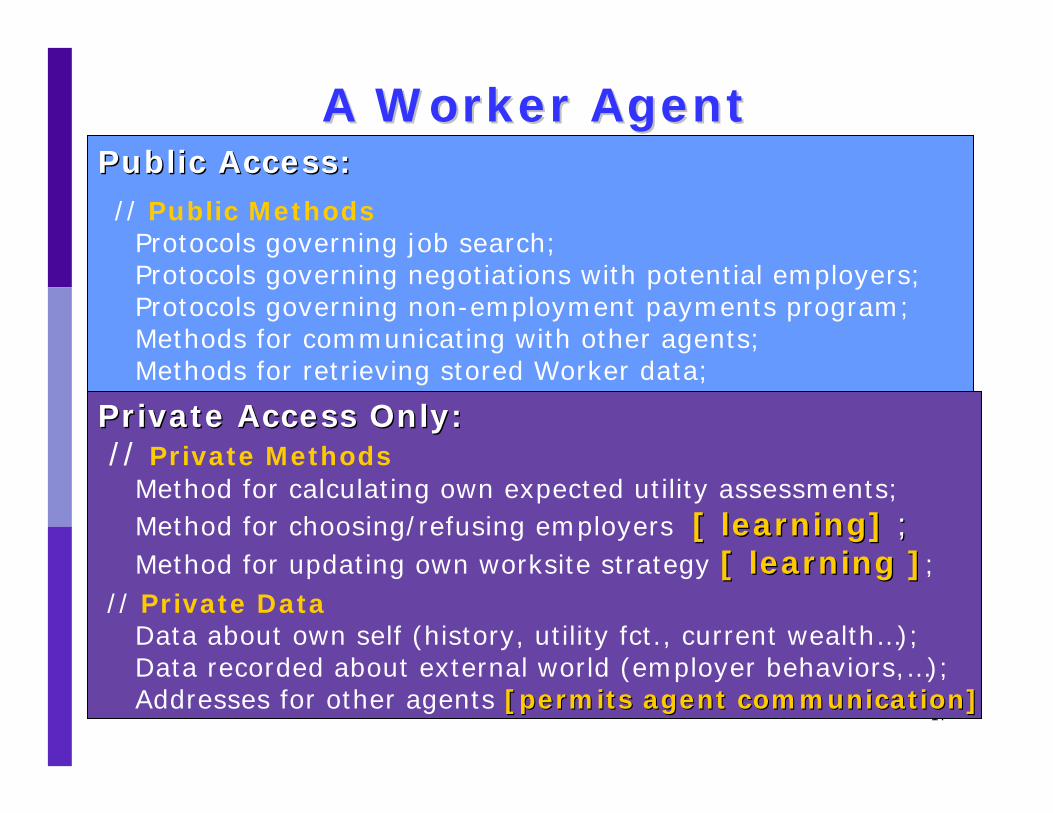
A Worker AgentA Worker AgentPublic Access:Public Access:// Public Methods
Protocols governing job search;Protocols governing negotiations with potential employers;Protocols governing non-employment payments program;Methods for communicating with other agents;Methods for retrieving stored Worker data;
Private Access Only:Private Access Only:// Private Methods
Method for calculating own expected utility assessments;Method for choosing/refusing employers [ learning] [ learning] ;;Method for updating own worksite strategy [ learning ][ learning ];
// Private DataData about own self (history, utility fct., current wealth…);Data recorded about external world (employer behaviors,…);Addresses for other agents [permits agent communication][permits agent communication];
18
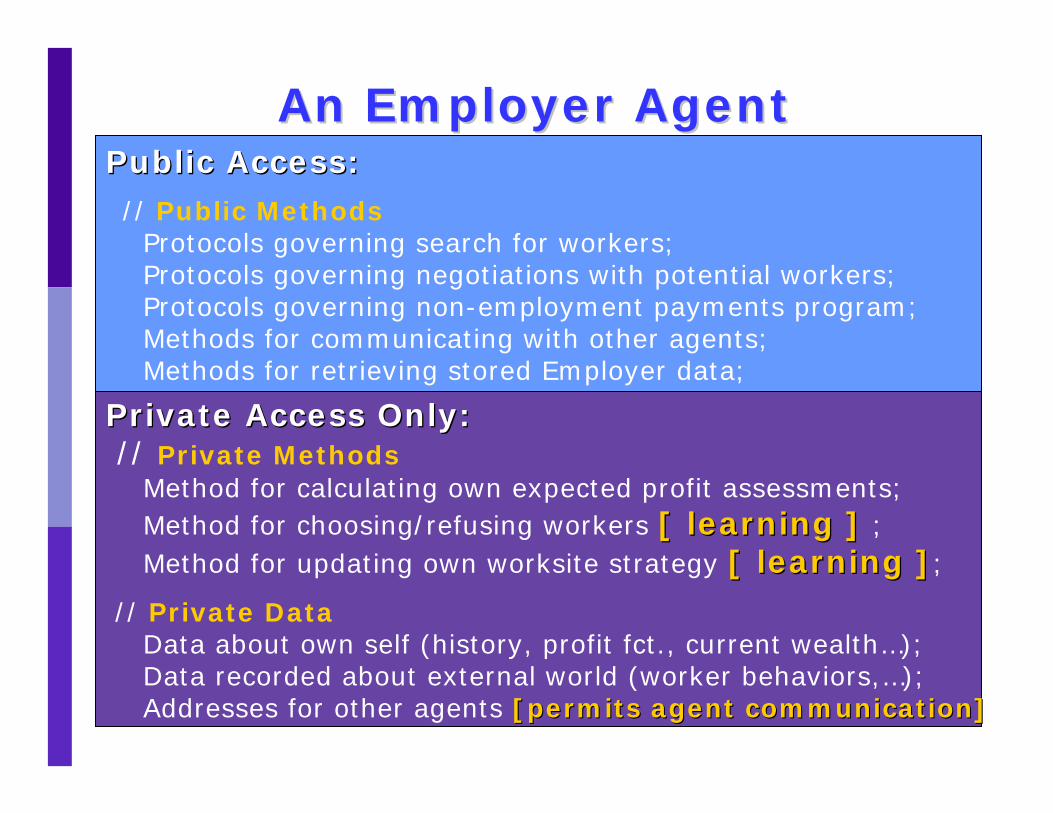
An Employer AgentAn Employer AgentPublic Access:Public Access:// Public Methods
Protocols governing search for workers;Protocols governing negotiations with potential workers;Protocols governing non-employment payments program;Methods for communicating with other agents;Methods for retrieving stored Employer data;
Private Access Only:Private Access Only:// Private Methods
Method for calculating own expected profit assessments;Method for choosing/refusing workers [ learning ][ learning ] ;Method for updating own worksite strategy [ learning ][ learning ];
// Private DataData about own self (history, profit fct., current wealth…);Data recorded about external world (worker behaviors,…);Addresses for other agents [permits agent communication][permits agent communication];
19
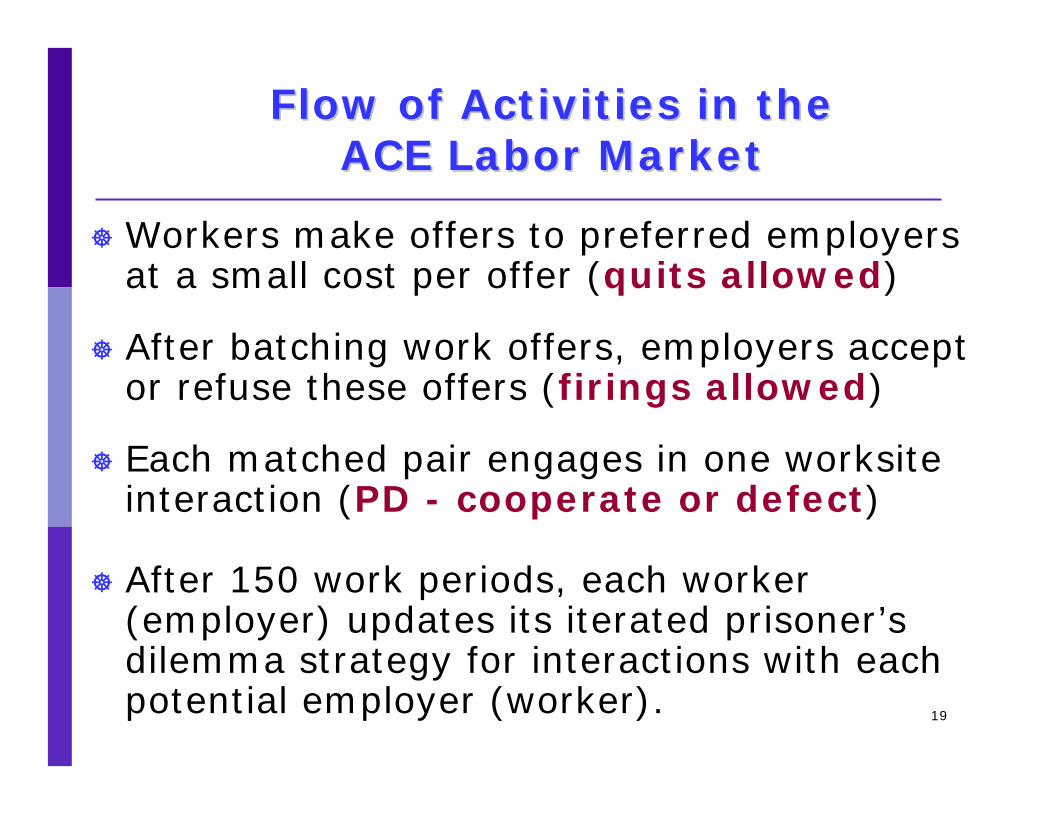
Workers make offers to preferred employers at a small cost per offer (quits allowed)
After batching work offers, employers accept or refuse these offers (firings allowed)
Each matched pair engages in one worksite interaction (PD - cooperate or defect)
After 150 work periods, each worker (employer) updates its iterated prisoner’s dilemma strategy for interactions with each potential employer (worker).
Flow of Activities in the Flow of Activities in the ACE Labor MarketACE Labor Market
20
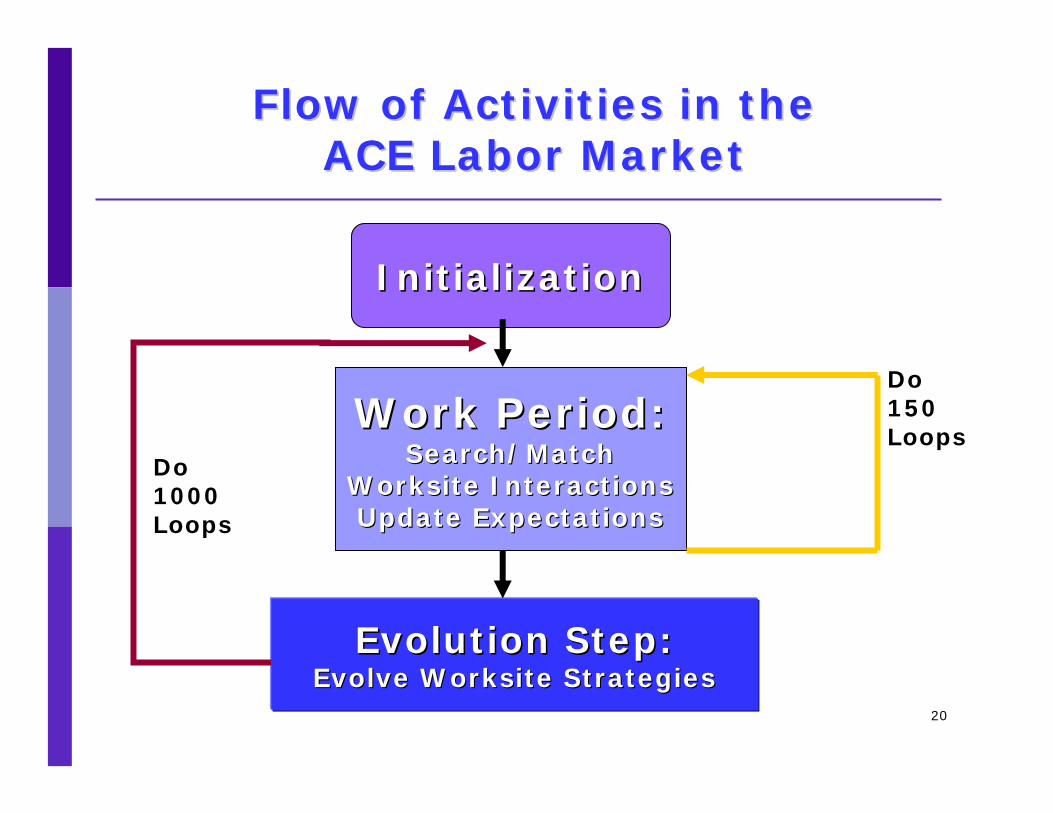
Flow of Activities in the Flow of Activities in the ACE Labor MarketACE Labor Market
InitializationInitialization
Work Period:Work Period:Search/MatchSearch/Match
Worksite InteractionsWorksite InteractionsUpdate ExpectationsUpdate Expectations
Evolution Step:Evolution Step:Evolve Worksite StrategiesEvolve Worksite Strategies
Do150Loops
Do1000Loops

21
Worksite Interactions as Worksite Interactions as PrisonerPrisoner’’s Dilemma (PD) Gamess Dilemma (PD) Games
C
D
C D
EmployerEmployer
WorkerWorker
(40,40)(40,40) (10,60)(10,60)
(60,10)(60,10) (20,20)(20,20)
D = Defect (Shirk); C = Cooperate (Fulfill Obligations)
22
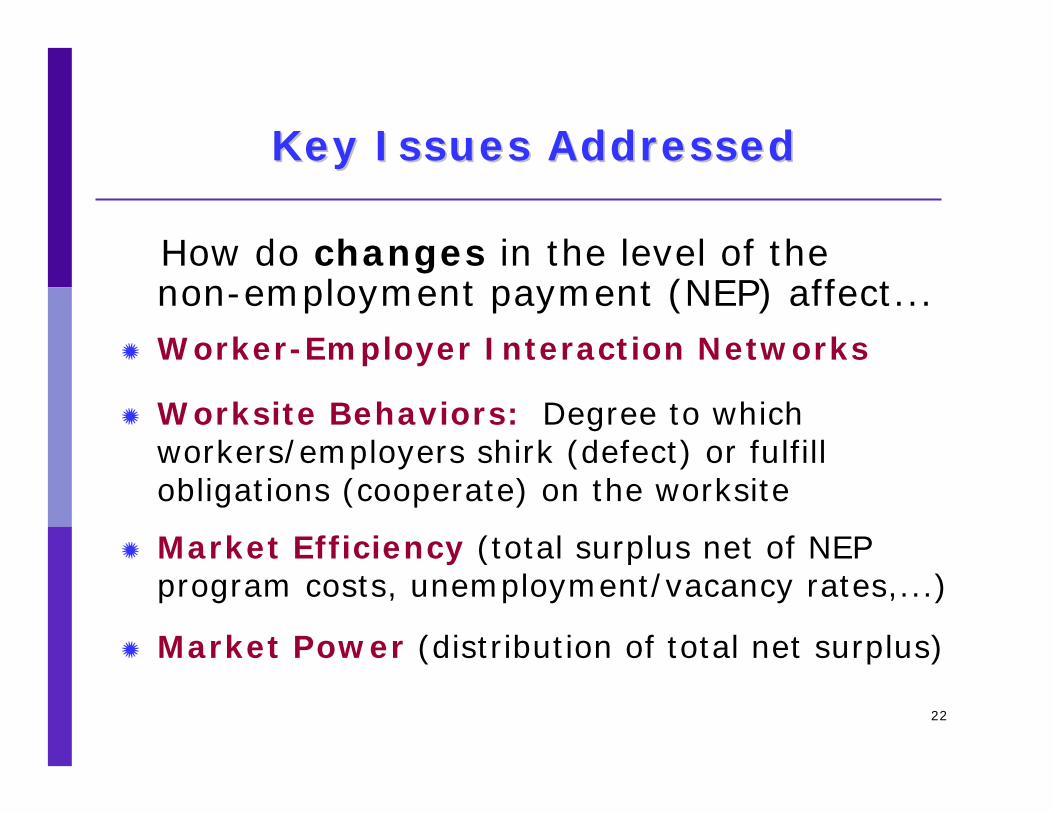
Key Issues AddressedKey Issues Addressed
How do changes in the level of the non-employment payment (NEP) affect...Worker-Employer Interaction Networks
Worksite Behaviors: Degree to which workers/employers shirk (defect) or fulfill obligations (cooperate) on the worksite
Market Efficiency (total surplus net of NEP program costs, unemployment/vacancy rates,...)
Market Power (distribution of total net surplus)
23
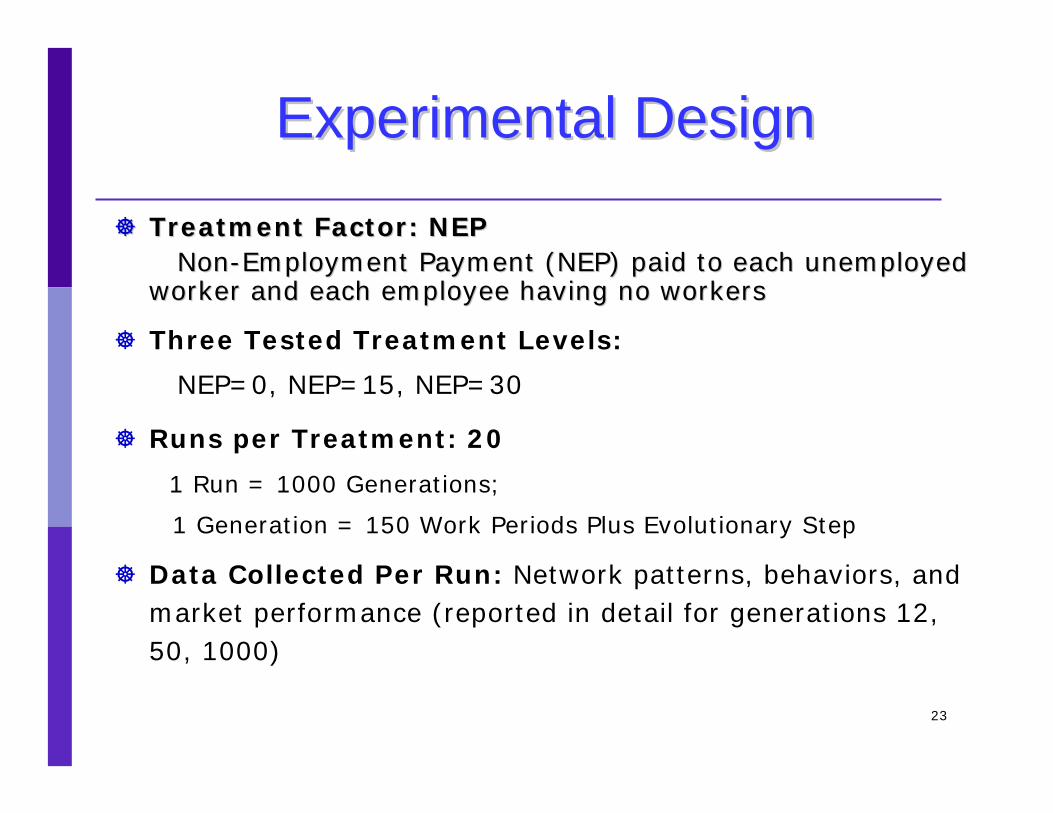
Experimental Design Experimental Design
Treatment Factor:Treatment Factor: NEPNEP NonNon--Employment Payment (NEP) paid to each unemployed Employment Payment (NEP) paid to each unemployed
worker and each employee having no workersworker and each employee having no workers
Three Tested Treatment Levels:
NEP=0, NEP=15, NEP=30
Runs per Treatment: 20
1 Run = 1000 Generations;
1 Generation = 150 Work Periods Plus Evolutionary Step
Data Collected Per Run: Network patterns, behaviors, and market performance (reported in detail for generations 12, 50, 1000)

24
Three NEP Treatments Three NEP Treatments in Relation to PD Payoffsin Relation to PD Payoffs
NEP=0 < L=10
L=10 < NEP=15 < D=20
D=20 < NEP=30 < C=40
NOTE: Work-site PD payoffs given by:
L (Sucker)=10 < D (MutualDef) = 20 < C (MutualCoop) = 40< H (Temptation) = 60
25
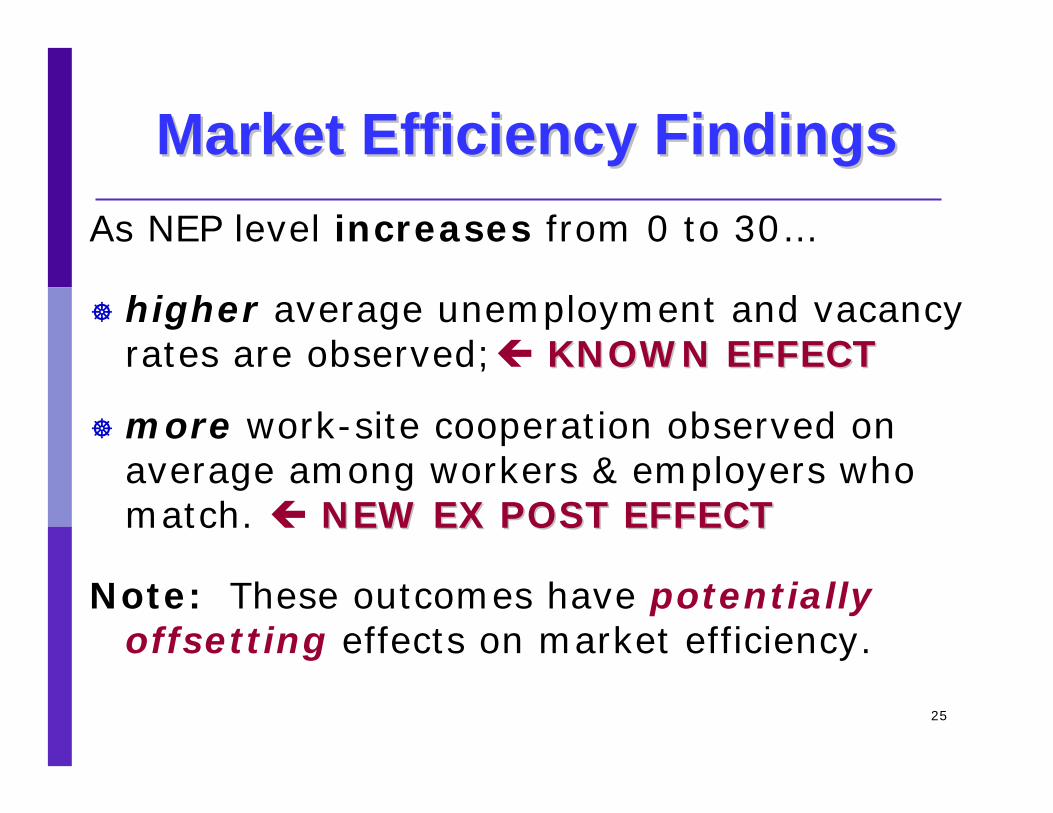
Market Efficiency FindingsMarket Efficiency FindingsAs NEP level increases from 0 to 30…
higher average unemployment and vacancy rates are observed; KNOWNKNOWN EFFECTEFFECT
more work-site cooperation observed on average among workers & employers who match. NEW EX POST EFFECTNEW EX POST EFFECT
Note: These outcomes have potentially offsetting effects on market efficiency.
26
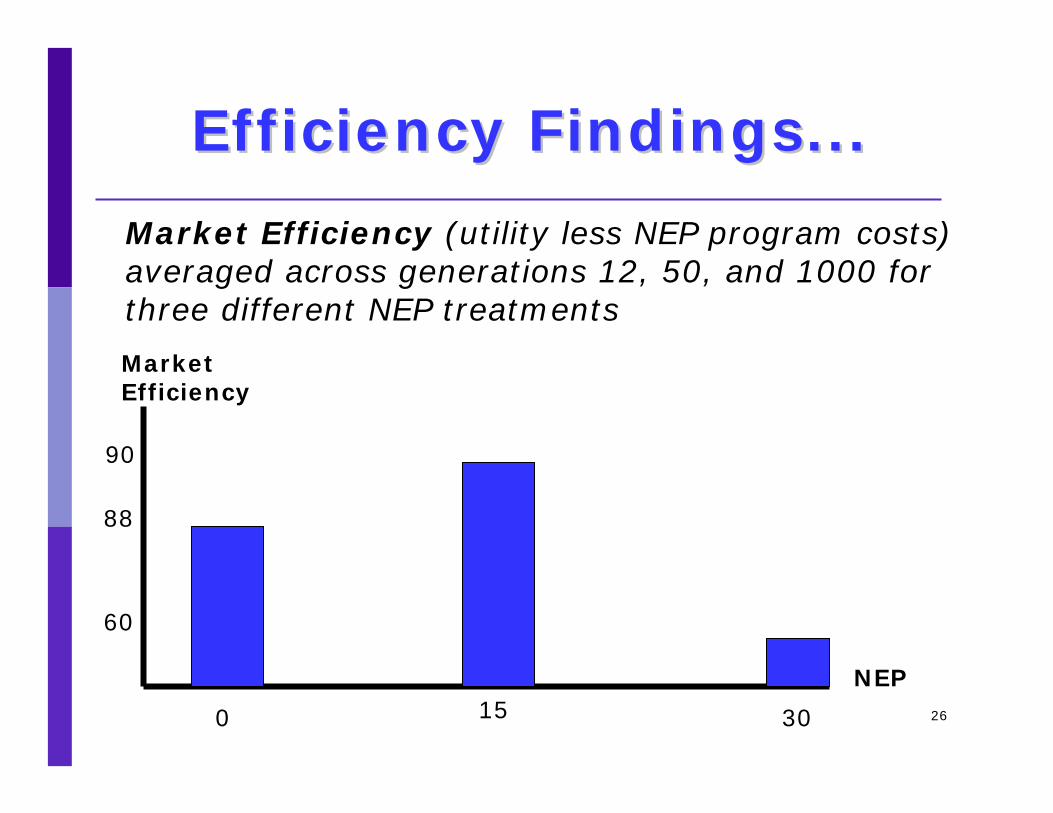
Efficiency Findings...Efficiency Findings...
Market Efficiency (utility less NEP program costs) averaged across generations 12, 50, and 1000 for three different NEP treatments
NEP
Market Efficiency
0 15 30
88
90
60

27
Efficiency Findings...Efficiency Findings...
NEP=15 yields highest efficiency
NEP=0 yields lower efficiency (too much shirking)
NEP=30 yields lowest efficiency(program costs too high – everyone too picky!)
28
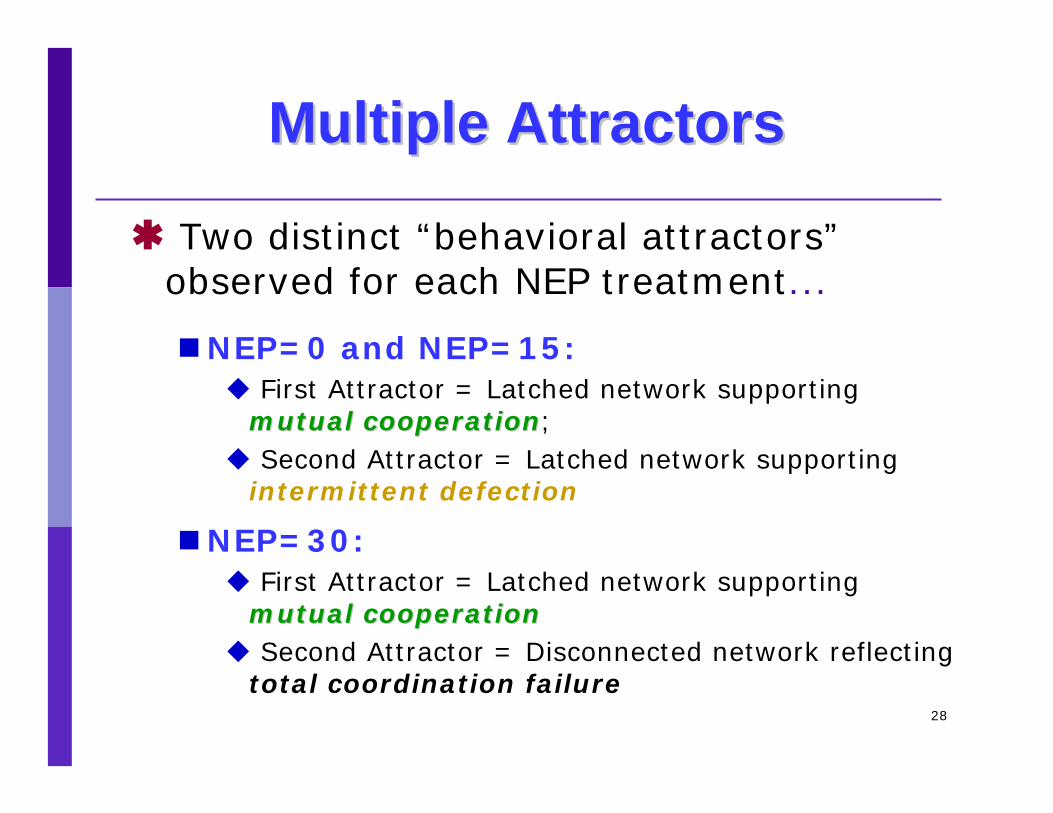
Multiple AttractorsMultiple Attractors
Two distinct “behavioral attractors”observed for each NEP treatment...
NEP=0 and NEP=15:First Attractor = Latched network supporting
mutual cooperationmutual cooperation; Second Attractor = Latched network supporting
intermittent defection
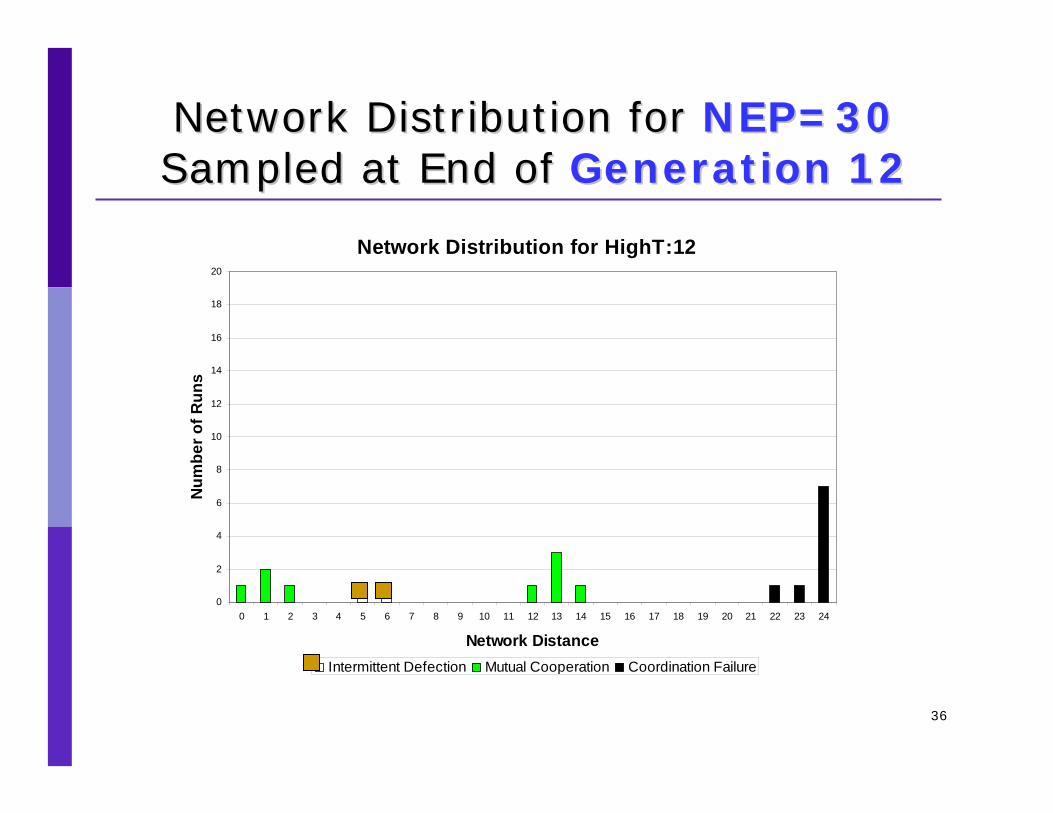
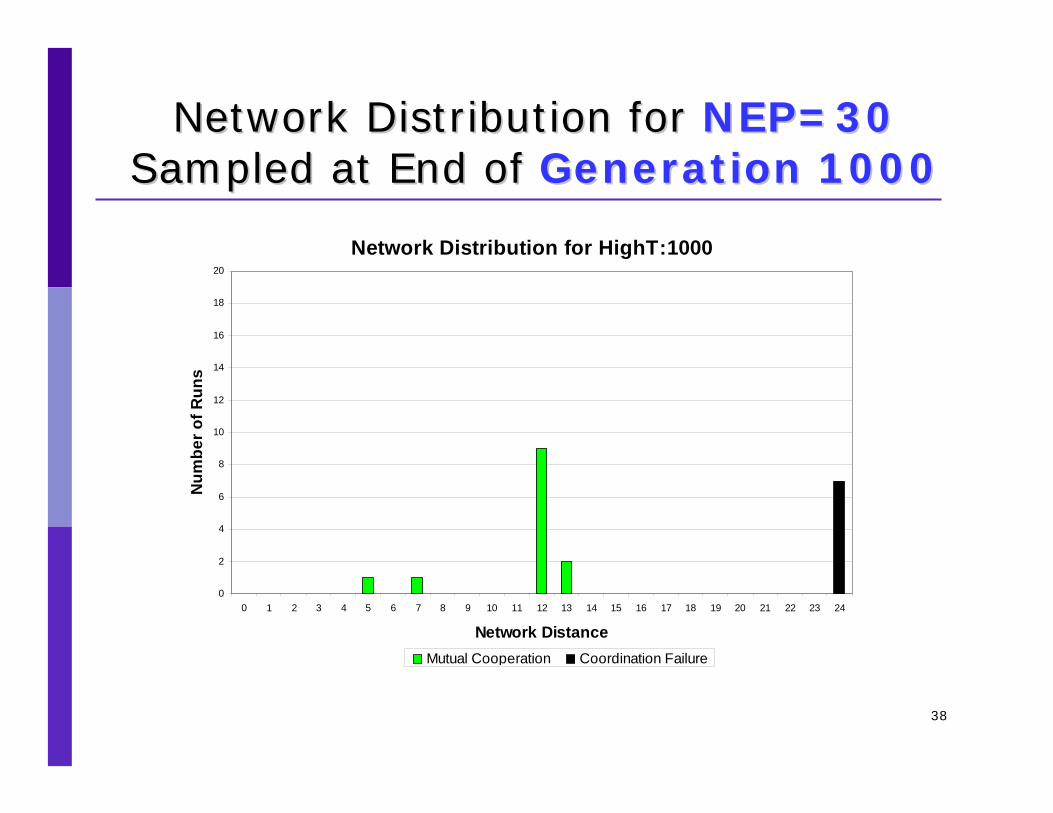
NEP=30:First Attractor = Latched network supporting
mutual cooperationmutual cooperationSecond Attractor = Disconnected network reflecting
total coordination failure
29
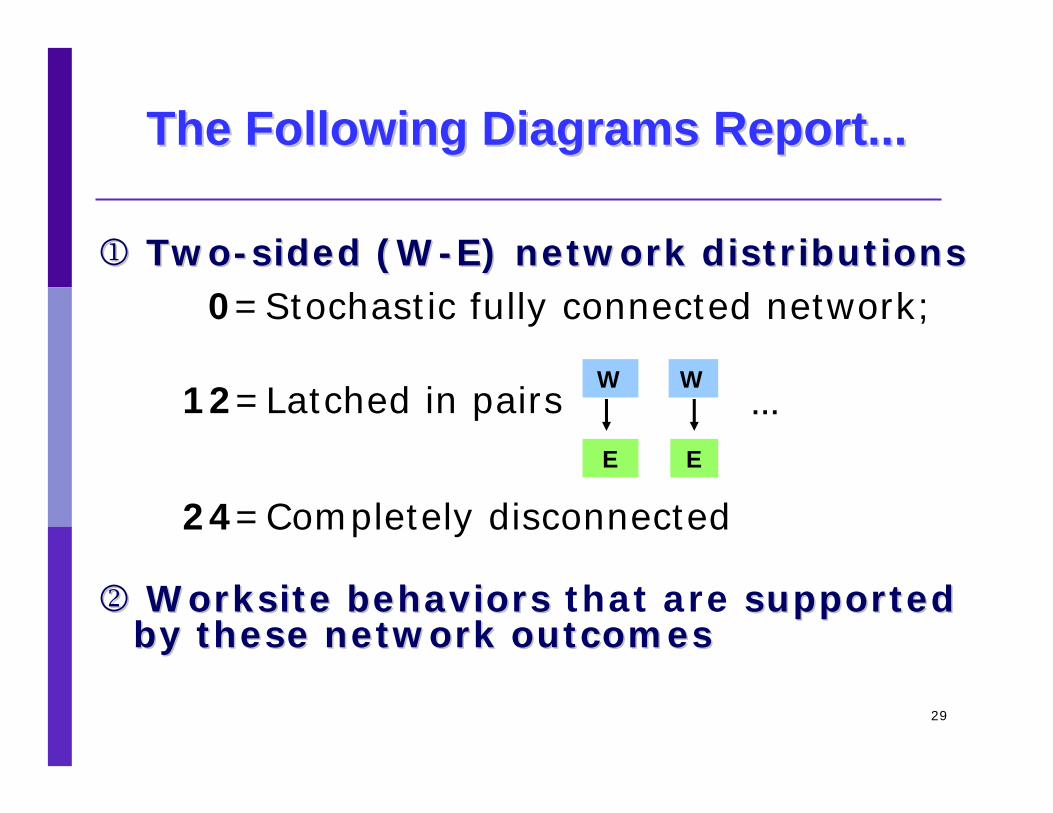
The Following Diagrams Report...The Following Diagrams Report...
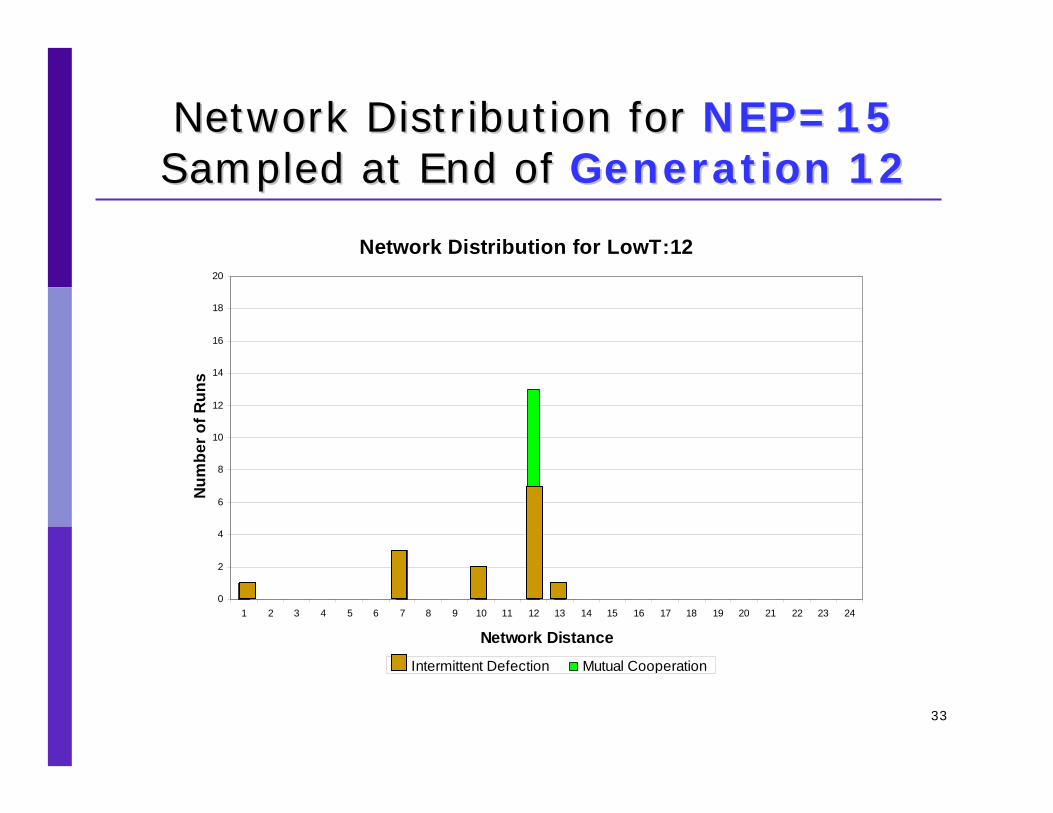
11 TwoTwo--sided (Wsided (W--E) network distributionsE) network distributions 0=Stochastic fully connected network;
12=Latched in pairs
24=Completely disconnected
22 Worksite behaviorsWorksite behaviors that are supported supported by these network outcomesby these network outcomes
W W
E E
...
30
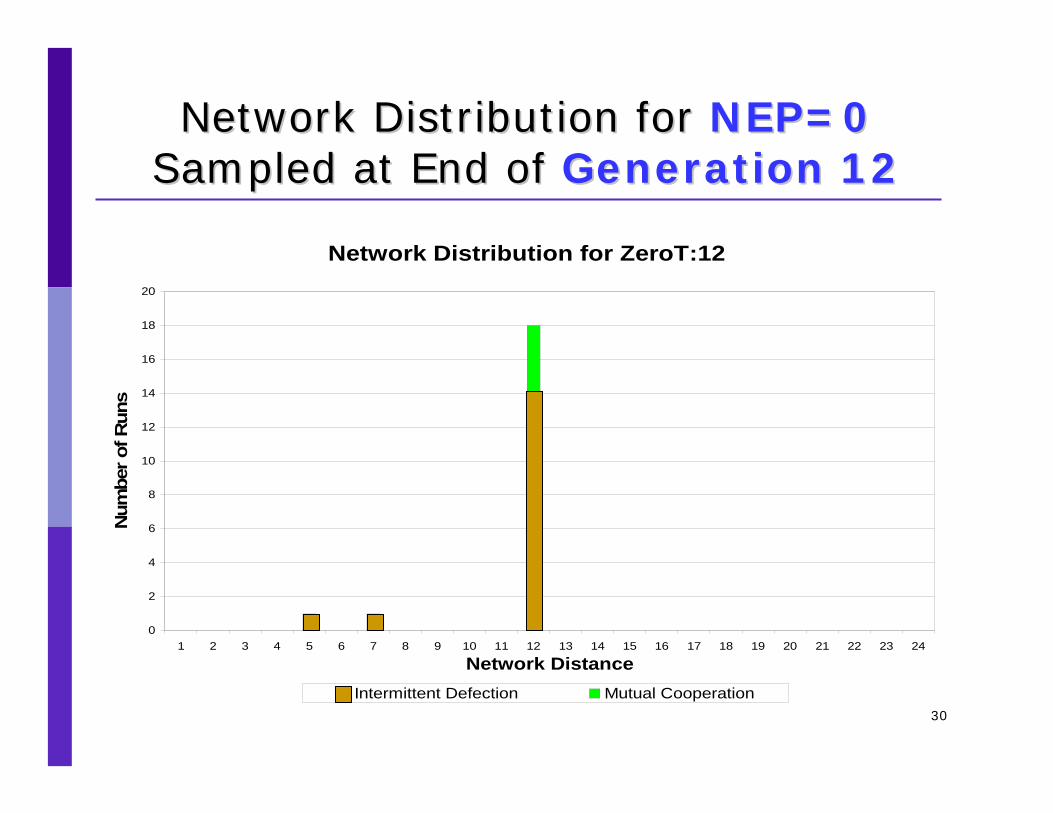
Network Distribution forNetwork Distribution for NEP=0NEP=0Sampled at End ofSampled at End of Generation 12Generation 12
Network Distribution for ZeroT:12
0
2
4
6
8
10
12
14
16
18
20
1 2 3 4 5 6 7 8 9 10 11 12 13 14 15 16 17 18 19 20 21 22 23 24
Network Distance
Num
ber o
f Run
s
Intermittent Defection Mutual Cooperation

31
Network Distribution forNetwork Distribution for NEP=0NEP=0Sampled at End ofSampled at End of Generation 50Generation 50
Network Distribution for ZeroT:50
0
2
4
6
8
10
12
14
16
18
20
1 2 3 4 5 6 7 8 9 10 11 12 13 14 15 16 17 18 19 20 21 22 23 24
Network Distance
Num
ber o
f Run
s
Intermittent Defection Mutual Cooperation
32
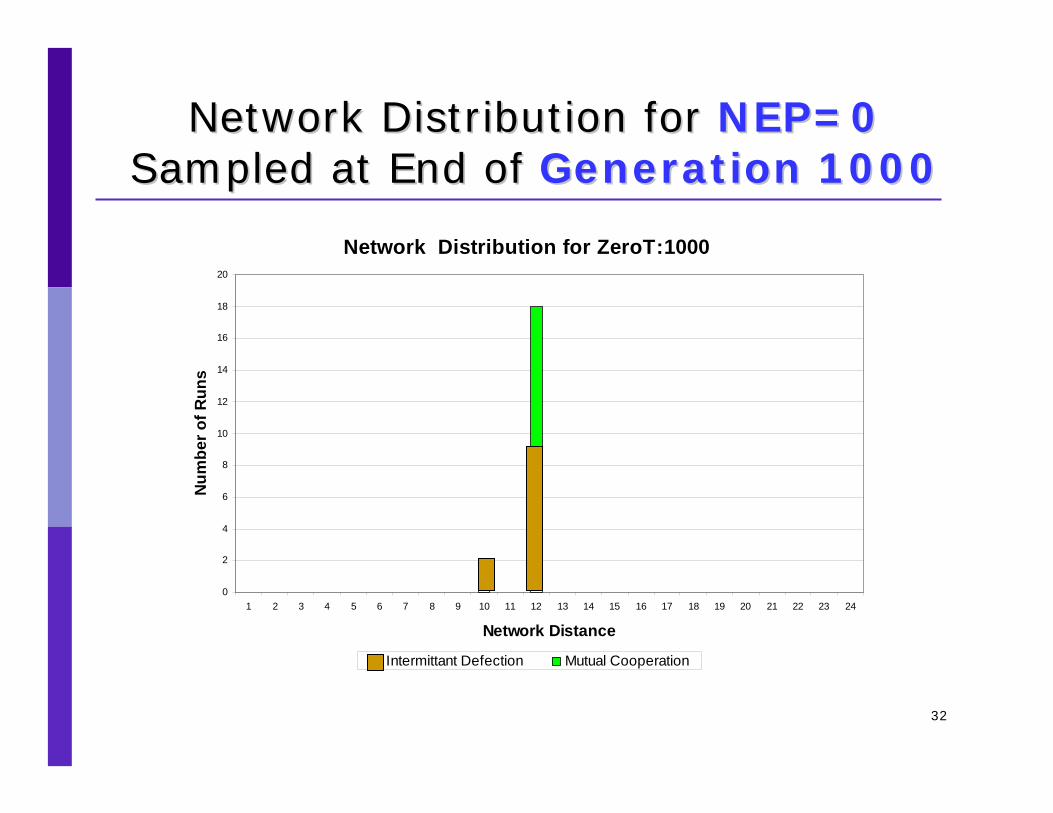
Network Distribution forNetwork Distribution for NEP=0NEP=0Sampled at End ofSampled at End of Generation 1000Generation 1000
Network Distribution for ZeroT:1000
0
2
4
6
8
10
12
14
16
18
20
1 2 3 4 5 6 7 8 9 10 11 12 13 14 15 16 17 18 19 20 21 22 23 24
Network Distance
Num
ber o
f Run
s
Intermittant Defection Mutual Cooperation
33
Network Distribution forNetwork Distribution for NEP=15NEP=15Sampled at End ofSampled at End of Generation 12Generation 12
Network Distribution for LowT:12
0
2
4
6
8
10
12
14
16
18
20
1 2 3 4 5 6 7 8 9 10 11 12 13 14 15 16 17 18 19 20 21 22 23 24
Network Distance
Num
ber o
f Run
s
Intermittent Defection Mutual Cooperation

34
Network Distribution forNetwork Distribution for NEP=15NEP=15Sampled at End ofSampled at End of Generation 50Generation 50
Network Distribution for LowT:50
0
2
4
6
8
10
12
14
16
18
20
1 2 3 4 5 6 7 8 9 10 11 12 13 14 15 16 17 18 19 20 21 22 23 24
Network Distance
Num
ber o
f Run
s
Intermittent Defection Mutual Cooperation

35
Network Distribution forNetwork Distribution for NEP=15NEP=15Sampled at End ofSampled at End of Generation 1000Generation 1000
Network Distribution for LowT:1000
0
2
4
6
8
10
12
14
16
18
20
1 2 3 4 5 6 7 8 9 10 11 12 13 14 15 16 17 18 19 20 21 22 23 24
Network Distance
Num
ber o
f Run
s
Intermittent Defection Mutual Cooperation
36
Network Distribution forNetwork Distribution for NEP=30NEP=30Sampled at End ofSampled at End of Generation 12Generation 12
Network Distribution for HighT:12
0
2
4
6
8
10
12
14
16
18
20
0 1 2 3 4 5 6 7 8 9 10 11 12 13 14 15 16 17 18 19 20 21 22 23 24
Network Distance
Num
ber o
f Run
s
Intermittent Defection Mutual Cooperation Coordination Failure

37
Network Distribution forNetwork Distribution for NEP=30NEP=30Sampled at End ofSampled at End of Generation 50Generation 50
Network Distribution for HighT:50
0
2
4
6
8
10
12
14
16
18
20
0 1 2 3 4 5 6 7 8 9 10 11 12 13 14 15 16 17 18 19 20 21 22 23 24
Network Distance
Num
ber o
f Run
s
Mutual Cooperation Coordination Failure
38
Network Distribution forNetwork Distribution for NEP=30NEP=30Sampled at End ofSampled at End of Generation 1000Generation 1000
Network Distribution for HighT:1000
0
2
4
6
8
10
12
14
16
18
20
0 1 2 3 4 5 6 7 8 9 10 11 12 13 14 15 16 17 18 19 20 21 22 23 24
Network Distance
Num
ber o
f Run
s
Mutual Cooperation Coordination Failure
39
Summary of FindingsSummary of Findings
Changes in NEP systematicallysystematically affect unemployment, vacancy, worksite behaviors, and welfare outcomes
Worker-employer networks tend to be either fullyfully latchedlatched in pairsin pairs or completely disconnectedcompletely disconnected
But… even fully latched networks support spectral (multiplespectral (multiple--peaked)peaked) behavioral distributions (potential pooling problems)

40
Implementation via Trade Network Game (TNG) Lab:
Architecture of the TNG LabArchitecture of the TNG Lab
TNG Homepage:http://www.econ.iastate.edu/tesfatsi/tnghome.htm
Graphical User Interface (GUI)
Supports run-timeoutput visualizations
TNG derived classes
Base class lib
41
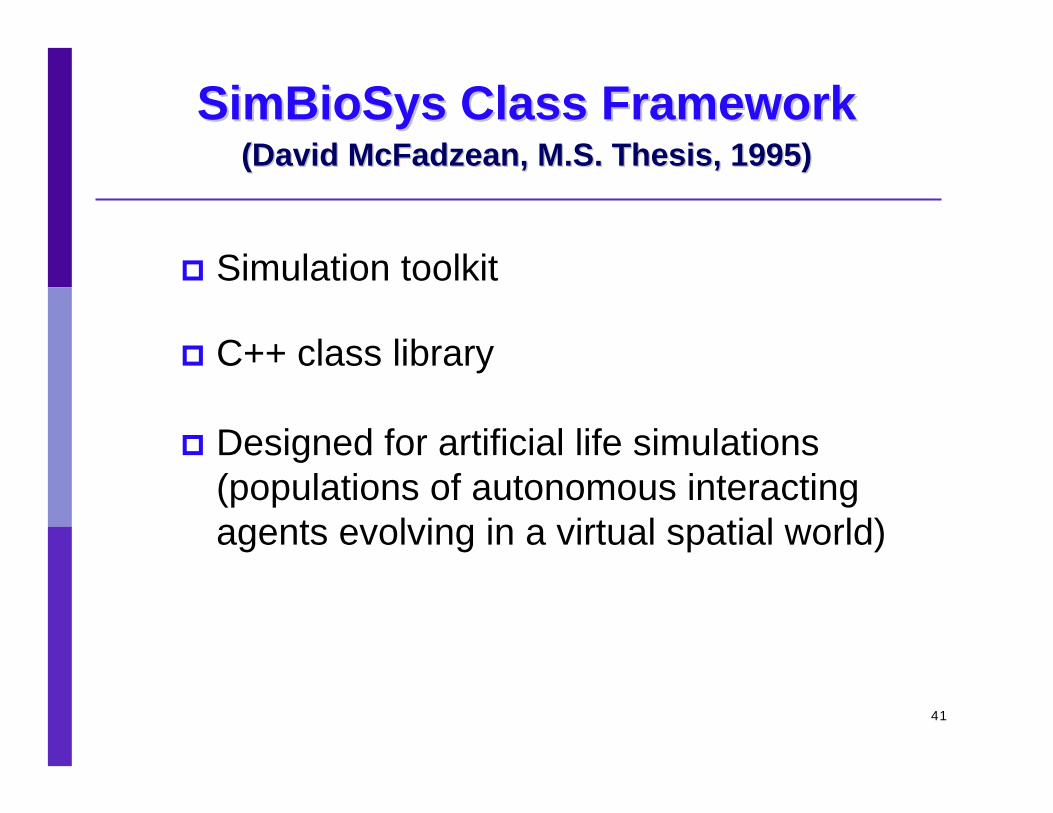
SimBioSys Class FrameworkSimBioSys Class Framework(David (David McFadzeanMcFadzean, M.S. Thesis, 1995), M.S. Thesis, 1995)
Simulation toolkit
C++ class library
Designed for artificial life simulations (populations of autonomous interacting agents evolving in a virtual spatial world)

42
TNG Lab: Agent Hierarchy in Unified Modeling Language (UML)
“is a”
TNG derivedagent classes
SimBioSysagent classlibrary C++
Worker Employer Labor application

43
TNG Lab Graphical User Interface (GUI)Settings Screen

44
TNG Lab GUI:
Results Screen
45
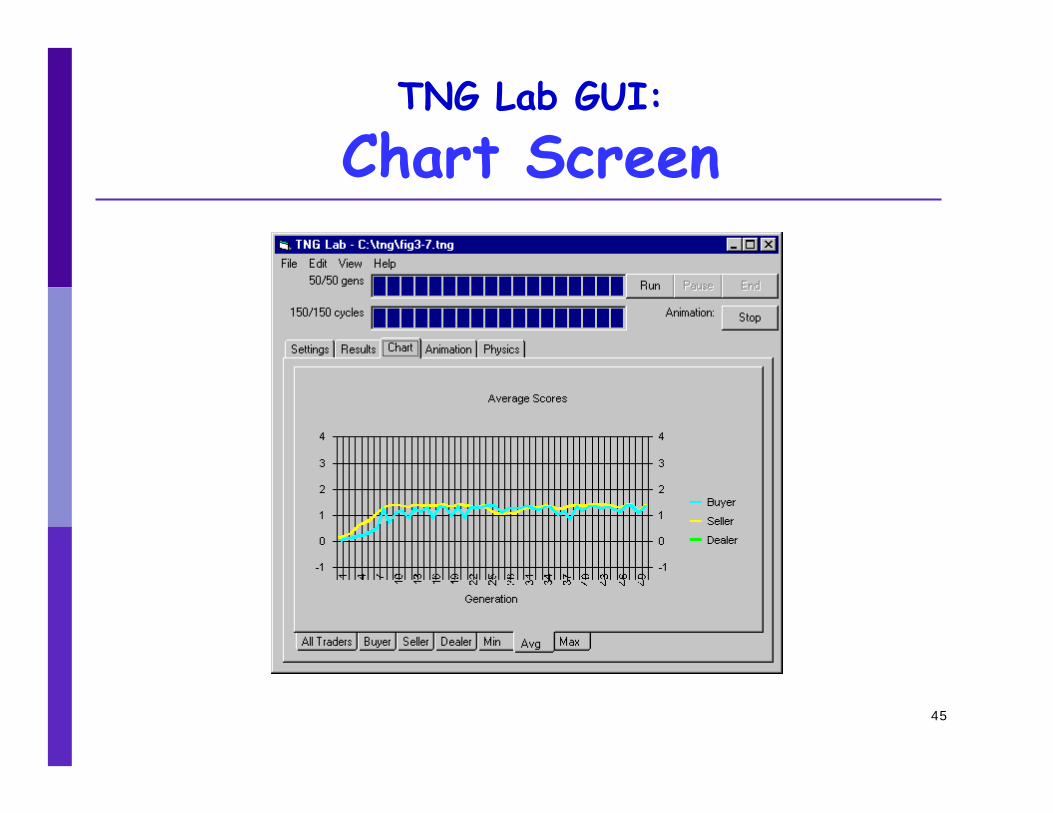
TNG Lab GUI:
Chart Screen

46
TNG Lab GUI:Network Animation Screen

47
TNG Lab GUI:Physics Screen

48
Online Software ResourcesOnline Software ResourcesACE General Software and Toolkits www.econ.iastate.edu/tesfatsi/acecode.htmwww.econ.iastate.edu/tesfatsi/acecode.htm
ACE Computational Laboratories www.econ.iastate.edu/tesfatsi/acedemos.htmwww.econ.iastate.edu/tesfatsi/acedemos.htm
Research Area: Development and Use of Computational Laboratories www.econ.iastate.edu/tesfatsi/acomplab.htmwww.econ.iastate.edu/tesfatsi/acomplab.htm
TNG Lab Homepage www.econ.iastate.edu/tesfatsi/tnghome.htmwww.econ.iastate.edu/tesfatsi/tnghome.htm