labor market o utcomes of family migrants in the united ... · colombia 2.08 poland 2.19 haiti 2.04...
TRANSCRIPT
Labor Market Outcomes of Family Migrants in the United States:
New Evidence from the New Immigrant Survey
Guillermina Jasso
New York University
Mark R. Rosenzweig
Yale University

In reforming or designing an immigration system, criteria need to beestablished for who will be admitted.
An important principle of U.S. immigration law is the creation, unification andre-unification of families.
Family kinship can be defined narrowly - spouse, children - or more broadly -parents, siblings, cousins.
Choosing among the criteria should be informed by how well groups definedby immigration criteria, and specifically by kinship criteria, fare in the U.S.labor market.
In my talk I will use data from the two rounds of the NIS to describe the labormarket outcomes of “family” immigrants and, as benchmarks, immigrantschosen by skill or by lottery.
Who are family migrants defined by U.S. immigration law?

There are two broad classes of “family” visas:
1. Visas so that U.S. citizens and permanent resident aliens can sponsorforeign-born relatives. Among these are:
A. A spouse
B. An adult child
C. A parent
D. A sibling
2. Visas for the accompanying foreign-born immediate (children of acertain age and spouse) family members of immigrants admitted on thebasis of non-family criteria.
In 2012 of the visas allocated for the “employment” category, morethan half (54.2%) were allocated to the children and spouses of thoseadmitted by employment criteria; over 40% of the adults in thiscategory were spouses of the employment principal

Among the questions we address here by specific visa categories are:
1. What human capital attributes do family (and non-family) migrantsbring to the United States (at admission)?
This informs us about the selectivity of family-basedimmigration criteria.
2. Which of these attributes are important, and by how much, for USearnings?
3. What are at-admission employment and unemployment rates?
4. How do the rates change over time for the different groups?
5. How important is self-employment and job creation?
6. What are the earnings of the immigrants at admission and then after 4-6years?
7. How fast do earnings grow?

The New Immigrant Survey (NIS)
NIS-2003 Round 1.
The sampling frame:
All new LPRs whose records were compiled in the 7-month period May-November 2003. These include new arrivals and visa adjustees (49.2%).
On average, interviews were conducted approximately four months afteradmission to LPR (95 languages (of choice)).
The analyses reported today are based on the Adult Sample of NIS-2003, aprobability sample from among all adults (age 18 and older) admitted to LPRduring the sampling period.
N= 8,573 sampled adults, for a response rate of 68.6 percent
And 4,334 spouses on immigrants.
Key features: visa category (from the administrative records), employment,earnings histories, schooling, migration histories, country of origin earnings.

NIS sampling design feature useful for comparing immigration criteria:
Oversampled two non-family immigrant groups that are a small part oflegal immigration flows:
A. Employment visa principals - those immigrants admitted topermanent residence status by dint of their skills or having a joboffer
Less than 5% of regular legal flows, but 16% of theadult NIS sample
B. Lottery visa principals - those immigrants admitted from pre-specified countries with at least a high school education basedon a random lottery
Less than 5% of regular legal flows but 14.4% of theadult NIS sample
Gives us a benchmark to compare to family migrants, who make up thelarge majority of immigrants.

NIS-2003 Round 2.
Respondents were re-interviewed in 2007-2009.
N= 3,903 adult sampled immigrants.
Also 1,555 spouses.
Adjusting for the 69 deceased and 48 incapacitated main respondents, theresponse rate is 46.2 percent.
Lower than anticipated: we were unable to use address reports filed by therespondents because of a new government ruling
However, the attrition does not appear to be selective on observed attributes:for example, proportionate by visa category and country of origin, humancapital characteristics.
The NIS thus allows us to observe initial and post-immigration labor marketoutcomes by type of visa: at immigration and then 4-6 years later.
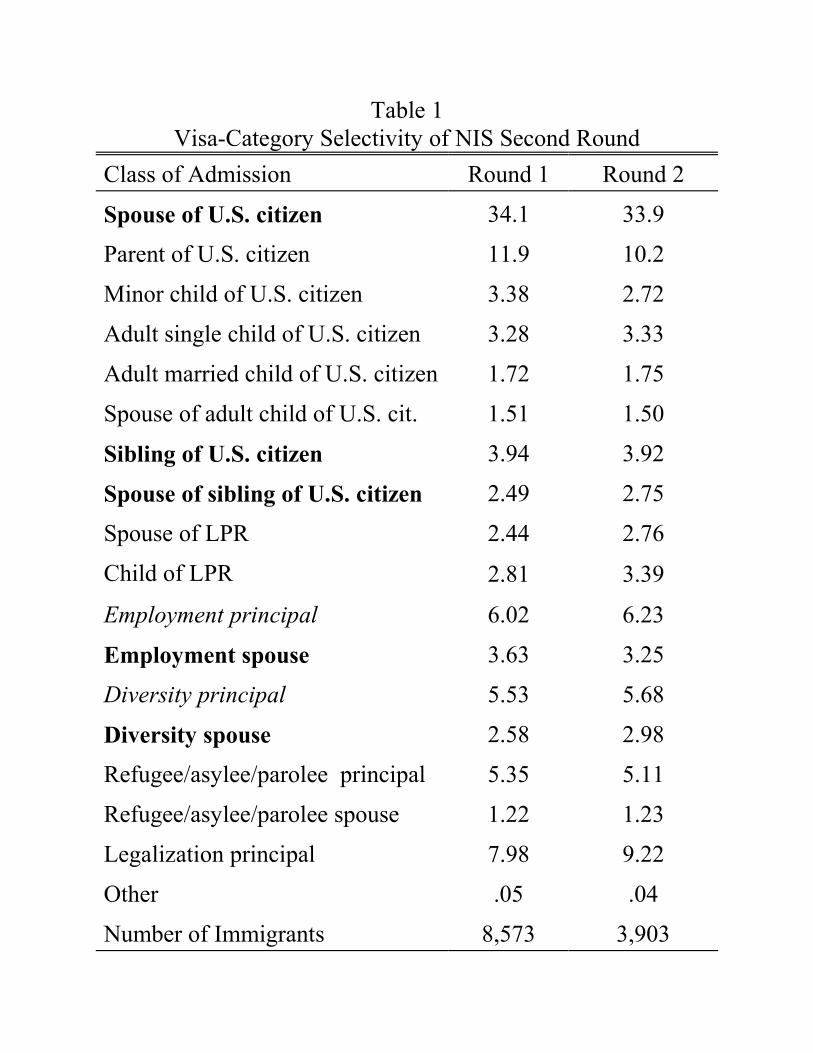
Table 1Visa-Category Selectivity of NIS Second Round
Class of Admission Round 1 Round 2
Spouse of U.S. citizen 34.1 33.9
Parent of U.S. citizen 11.9 10.2
Minor child of U.S. citizen 3.38 2.72
Adult single child of U.S. citizen 3.28 3.33
Adult married child of U.S. citizen 1.72 1.75
Spouse of adult child of U.S. cit. 1.51 1.50
Sibling of U.S. citizen 3.94 3.92
Spouse of sibling of U.S. citizen 2.49 2.75
Spouse of LPR 2.44 2.76
Child of LPR 2.81 3.39
Employment principal 6.02 6.23
Employment spouse 3.63 3.25
Diversity principal 5.53 5.68
Diversity spouse 2.58 2.98
Refugee/asylee/parolee principal 5.35 5.11
Refugee/asylee/parolee spouse 1.22 1.23
Legalization principal 7.98 9.22
Other .05 .04
Number of Immigrants 8,573 3,903
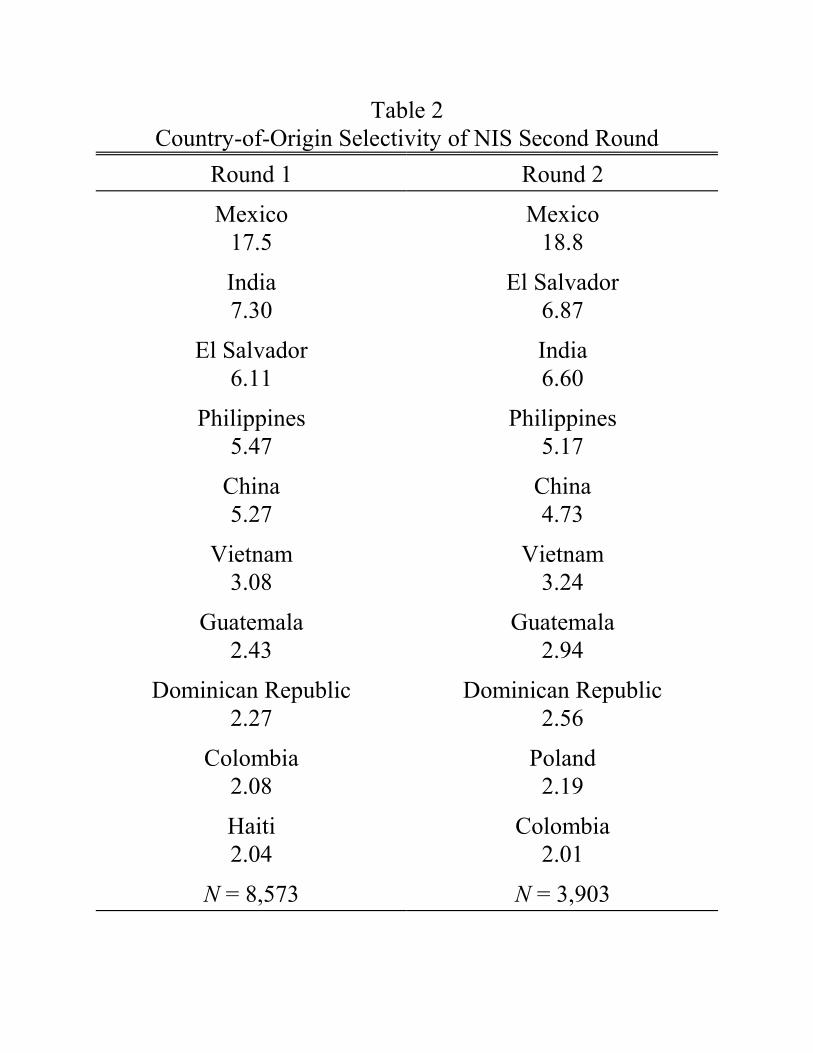
Table 2Country-of-Origin Selectivity of NIS Second Round
Round 1 Round 2
Mexico17.5
Mexico18.8
India7.30
El Salvador6.87
El Salvador6.11
India6.60
Philippines5.47
Philippines5.17
China5.27
China4.73
Vietnam3.08
Vietnam3.24
Guatemala2.43
Guatemala2.94
Dominican Republic2.27
Dominican Republic2.56
Colombia2.08
Poland2.19
Haiti2.04
Colombia2.01
N = 8,573 N = 3,903

There are four “family migrant” visa categories we focus on here:
Two family-sponsored visa categories:
1. Spouses of U.S. citizens (over 1/3 of all adult immigrants).
2. Siblings of U.S. citizens.
Two accompanying family visa categories:
3. Spouses of employment-visa immigrant principals
4. Spouses of lottery visa immigrant principals.
Note although immigrants in these visa categories were not over-sampled, because the NIS interviewed all spouses and overs-ampledthe principal immigrants in these categories, these two familyimmigrant groups are also over-sampled.
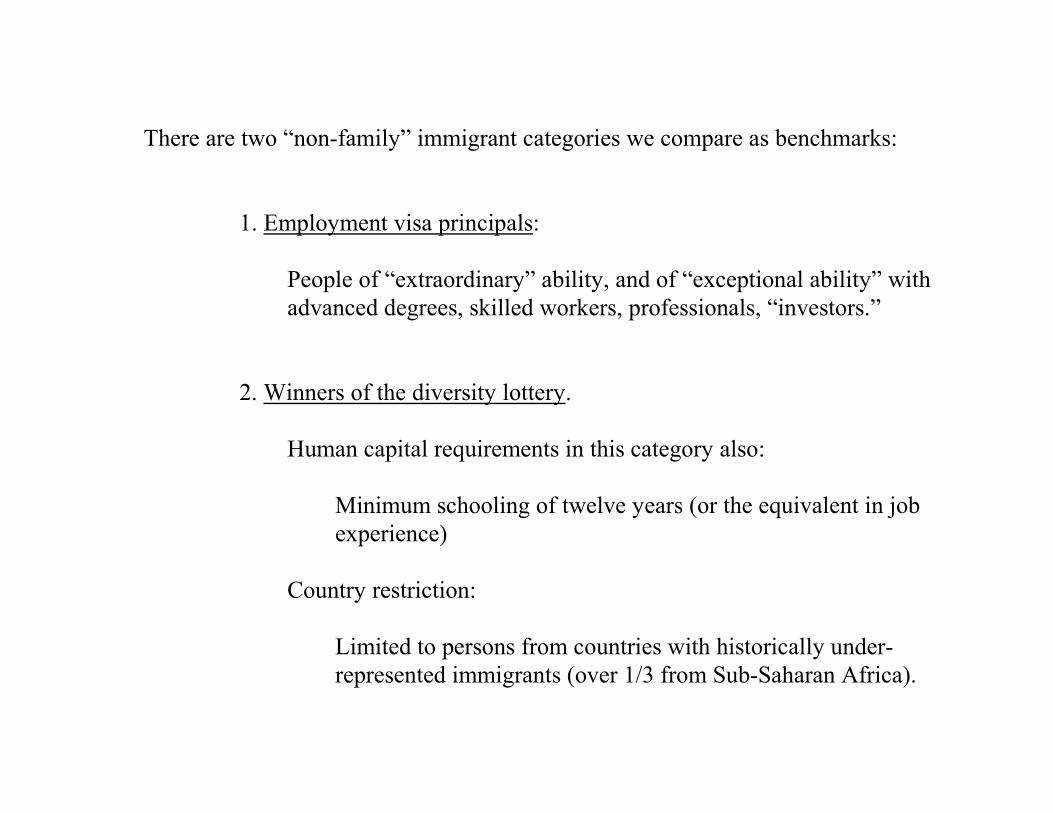
There are two “non-family” immigrant categories we compare as benchmarks:
1. Employment visa principals:
People of “extraordinary” ability, and of “exceptional ability” withadvanced degrees, skilled workers, professionals, “investors.”
2. Winners of the diversity lottery.
Human capital requirements in this category also:
Minimum schooling of twelve years (or the equivalent in jobexperience)
Country restriction:
Limited to persons from countries with historically under-represented immigrants (over 1/3 from Sub-Saharan Africa).

What might we expect to see in terms of labor market outcomes?
A. The group selected especially for the U.S. labor market should do very wellright from admission (employment-visa principals).
B. The family migrants have one advantage - they have U.S. sponsors who canhelp them find jobs and who provide (by law) financial help if needed.
This may prolong (financial backing) or shorten (job assistance)unemployment.
C. The accompanying lottery-winner spouses have no resident family in theUnited States to assist; they are least likely to have been in the United Statesprior to admission (and no human capital requirements).
They are likely to initially have a difficult time at admission.
D. Lottery-winner principals, while having no resident family, may have ahigher average education than other family migrants (schooling requirement).
They may do less well initially, but may do better over time.

Table 3At-Admission Characteristics of Immigrants, by Visa Category
At entrycharacteristic/visa
Spouseof
Citizen
Siblingof
Citizen
Employ-ment
Principal
Employ-ment
FamilyLottery
PrincipalLotteryFamily
Age (years) 32.7 46.6 36.8 35.6 32.5 35.3
Schooling (years) 13.0 11.5 15.6 15.4 14.5 13.9
% Female 62.8 51.9 32.4 77.9 40.9 50.7
Prior years in theUnited States
5.8 1.6 7.0 5.5 1.6 1.3
PPP $ OriginCountry GDP/L
$18,954 $10,643 $17,203 $15,463 $10,261 $10,820
Sample size 1,397 482 1,341 969 1,220 651

Table 4Determinants of the Log Hourly Wage, by Survey Round
Variable/roundFirst Round
(At Admission) Second Round
Schooling .0847(19.6)
.0912(14.9)
Age .0654(4.84)
.0624(3.06)
Age squared -.000879(4.94)
-.000820(3.40)
Female -.215(7.31)
-.208(5.07)
Years in the UnitedStates
.0668(11.7)
.0801(5.96)
Years in the USsquared
-.00191(7.34)
-.00220(4.42)
Log of PPP$ GDPper worker
.0619(3.69)
.0530(2.27)
N 2,895 1,581
Absolute value of t-ratio in parentheses.
0
10
20
30
40
50
60
70
80
90
100
Spouse Sibling EmploymentPrincipal
EmploymentFamily
LotteryPrincipal
LotteryFamily
First Round Second Round
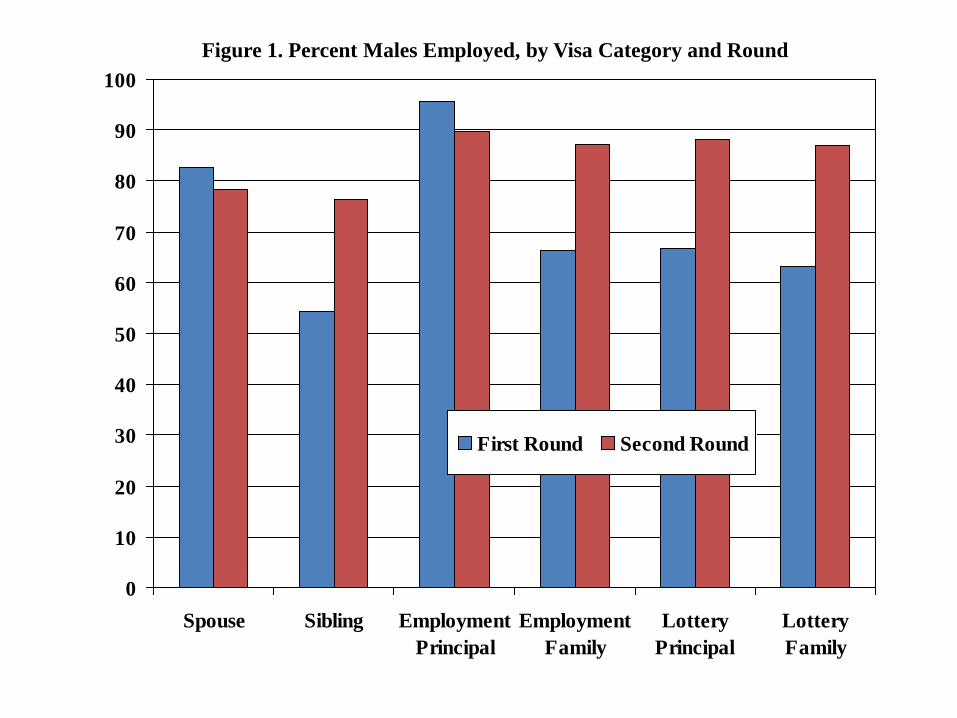
Figure 1. Percent Males Employed, by Visa Category and Round

0
10
20
30
40
50
60
70
80
90
100
Spouse Sibling EmploymentPrincipal
EmploymentFamily
LotteryPrincipal
LotteryFamily
First Round Second Round
Figure 2. Percent Females Employed, by Visa Category and Round
0
5
10
15
20
25
30
35
40
Spouse Sibling EmploymentPrincipal
EmploymentFamily
LotteryPrincipal
LotteryFamily
First Round Second Round
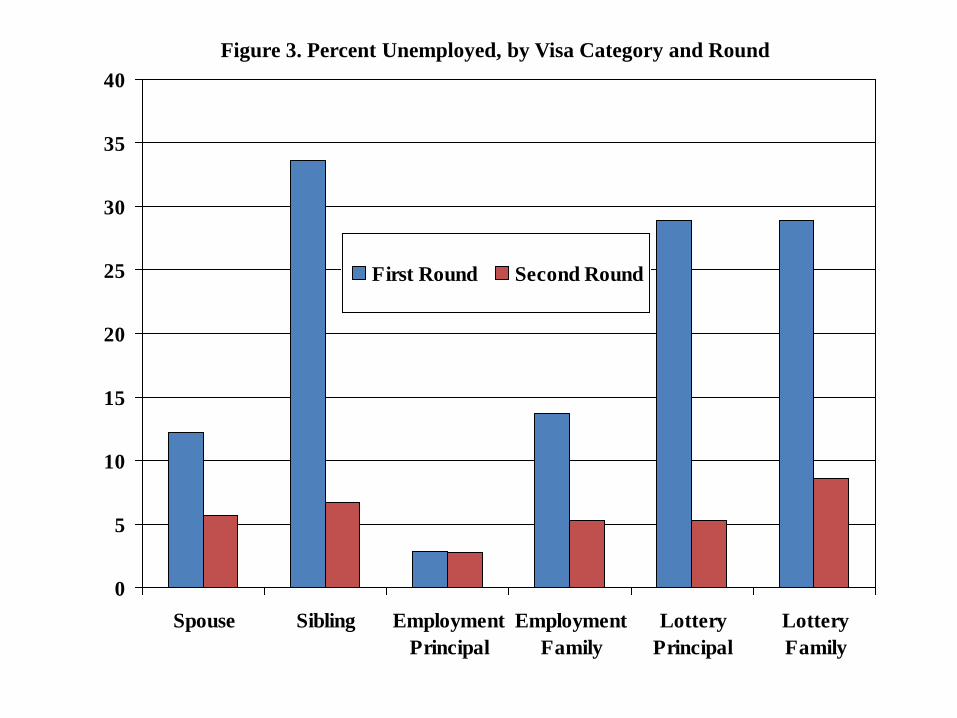
Figure 3. Percent Unemployed, by Visa Category and Round

0
5
10
15
20
25
30
35
40
Spouse Sibling EmploymentPrincipal
EmploymentFamily
LotteryPrincipal
LotteryFamily
Figure 4. Percent Getting Job Via Relative in the Second Round, by Visa Category

0
5
10
15
20
25
30
35
40
Spouse Sibling EmploymentPrincipal
EmploymentFamily
LotteryPrincipal
LotteryFamily
First Round Second Round
Figure 5. Percent Self-Employed Among the Employed, by Visa Category and Round

0
20
40
60
80
100
120
140
160
Spouse Sibling EmploymentPrincipal
EmploymentFamily
LotteryPrincipal
LotteryFamily
Figure 6. Number of Employees Working for the Self-Employed in the Second Round, by Visa Category

0
10
20
30
40
50
60
Spouse Sibling EmploymentPrincipal
EmploymentFamily
LotteryPrincipal
LotteryFamily
First RoundSecond Round
Figure 7. Real (2003 $) Hourly Earnings, by Visa Category and Round

0
5
10
15
20
25
30
35
40
45
Spouse Sibling EmploymentPrincipal
EmploymentFamily
LotteryPrincipal
LotteryFamily
Figure 8. Percent Growth in Real Hourly Wages, for Earners in Both Rounds, by Visa Category
0
5
10
15
20
25
30
35
40
Spouse Sibling EmploymentPrincipal
EmploymentFamily
LotteryPrincipal
LotteryFamily
Unadjusted
Adjusted for human capital characteristics and country
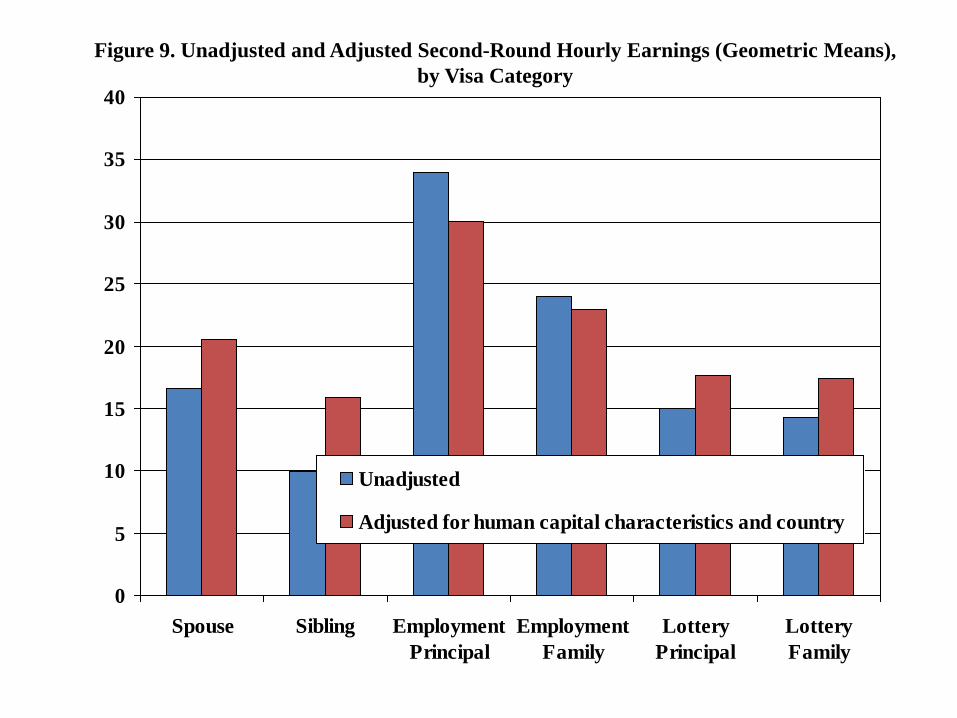
Figure 9. Unadjusted and Adjusted Second-Round Hourly Earnings (Geometric Means), by Visa Category

Conclusion
1. While unemployment rates are very high (and employment rates)relatively low for family migrants at admission, after 4-6 yearsunemployment rates are low for all immigrant groups.
2. All visa groups experience high rates of growth in earnings afteradmission.
3. Largest percent gains are for lottery winner principals - they struggle atadmission (high unemployment and low wages) but experience the highestrates of growth.
4. All immigrant groups have relatively high rates of self-employment (headbusinesses that employ, including family migrants).
5. The sibling visa category immigrants have lower earnings compared toother family migrants at admission and after 4-6 years - no catch up.
6. A large part of the reason sibling immigrants do less well is that they haveless good human capital attributes at admission (they have less schoolingand US experience, are older and come from poorer countries).

7. But measured human capital attributes do not account for all of thedifferences in labor market outcomes by visa category.
There is selection by unobserved (to us) characteristics that matter inthe labor markets.
8. Who are selectors? - U.S. Citizens and PRA’s bringing in relatives,marrying the foreign-born
Almost all immigrants are sponsored by US residents (not lottery).
Need to understand sponsorship behavior to understand more fullythe labor market outcomes of family and non-family migrants as wellas future numbers of immigrants.
Sponsorship behavior in the NIS - see sponsorship at work afteradmission
Among the questions: Who are the eligible kin of immigrants?
Who among the eligibles are sponsored?

0
1
2
3
4
5
6
7
8
9
10
Spouse Sibling EmploymentPrincipal
EmploymentFamily
LotteryPrincipal
LotteryFamily
Figure 10. Percent of Respondents Who Had Petitioned for Relatives by Round 2, by Visa Category