labor market prospects in tulsa: an analysis of recent … · labor market prospects in tulsa: an...
TRANSCRIPT

Labor Market Prospects in Tulsa: An Analysis of Recent Trends
Christopher T. King Brendan Hill February 2014 Revised
3001 Lake Austin Blvd., Suite 3.200 Austin, TX 78703 (512) 471-7891 www.raymarshallcenter.org

This report was prepared with funds provided from the Administration for Children and Families, U.S. Department of Health and Human Services (Contract #SP0016134/PROJ0004608.) The views expressed here are those of the authors and do not represent the positions of the funding agency or The University of Texas at Austin.

i
TABLE OF CONTENTS
List of Figures ............................................................................................................................. ii
List of Tables .............................................................................................................................. ii
Acknowledgements ................................................................................................................... iii
Introduction .............................................................................................................................. 1
The Tulsa Area Labor Market .................................................................................................... 2
Tulsa’s Industrial Base ......................................................................................................... 3
Occupations in Tulsa ........................................................................................................... 5
Recent Performance of Tulsa’s Healthcare Sector ............................................................. 8
The Healthcare Industry Group ................................................................................. 8
Healthcare Occupational Groups ............................................................................. 10
Healthcare Practitioners and Technical Occupations .............................................. 10
Healthcare Support Occupations ............................................................................. 11
Assessing Industry sectors for Targeting ................................................................................ 12
First-Level Analysis ............................................................................................................ 14
Second-Level Analysis ....................................................................................................... 16
Industry Evaluation ........................................................................................................... 17
Healthcare Industry Groups ..................................................................................... 17
Energy Industry Groups ........................................................................................... 18
Aerospace Industry Groups ..................................................................................... 25
Conclusions and Recommendations ....................................................................................... 29
References .............................................................................................................................. 32

ii
LIST OF FIGURES
Figure 1. Unemployment Rates for the United States, Oklahoma, and the Tulsa MSA, 2000 to 2012 ........................................................................................................................... 2
Figure 2. Employment Growth in the United States, Oklahoma, and the Tulsa MSA, January 2000 to July 2013 (index: Jan 2000=100) ....................................................................... 3
LIST OF TABLES
Table 1. Largest Industry Groups in Tulsa, 2012 ............................................................................ 4
Table 2. Growth in Major Industrial Groups 2007-2012, Tulsa MSA ............................................. 5
Table 3. Tulsa's Major Occupational Groups, 2012 ....................................................................... 6
Table 4. Growth in Occupations 2007-2012, Tulsa MSA ............................................................... 7
Table 5. Tulsa's Healthcare Industry Subgroups, 2011 .................................................................. 9
Table 6. Growth of Tulsa's Healthcare Subgroups, 2007-2011 ..................................................... 9
Table 7. Growth in Tulsa MA Health Practitioners Occupations 2007-2011 ............................... 10
Table 8. Minor Occupations in Tulsa's Health Support Occupations Group, 2011 ..................... 11
Table 9. Growth in Tulsa's Healthcare Support Occupations 2007-2012 .................................... 11
Table 10. Criteria for Choosing Target Industry Sectors in Tulsa ................................................. 13
iii
ACKNOWLEDGEMENTS
We want to recognize the assistance received from our partners and colleagues in
preparing this report. First, Norma Noble and Terry Watson of the Oklahoma Department
of Commerce facilitated our access to labor market data from Burning Glass, which
enhanced the quality of our analysis.
Monica Barczak, director of Innovation Labs with the Community Action Project of
Tulsa County (CAP-Tulsa), and Alicia Plati, a consultant to CAP-Tulsa, both offered insights
that improved the final report.
Finally, Tara Smith, Susie Riley and Karen White at the Ray Marshall Center
supported the analysis and preparation of the report in various ways.


1
INTRODUCTION
In this report, we review recent changes in Tulsa’s labor market and their potential
implications for CareerAdvance®, the career pathway program operated by the Community
Action Project of Tulsa County (CAP-Tulsa). This analysis updates the initial labor market
analysis conducted by King et al. (2009), which recommended sectors that CAP-Tulsa should
target for training parents in the pilot year of the CareerAdvance® project in 2009-2010.
Since then, CareerAdvance® has evolved into an established program. In September 2010,
it received a five-year Health Professions Opportunities Grant (HPOG) from the
Administration for Children and Families (ACF) at the U.S. Department of Health and Human
Services (HHS). Nine cohorts after its pilot group of enrollees, the HPOG grant have allowed
CareerAdvance® to expand its program offerings. It started as a single nursing career
pathway program with 15 participants in 2009. Since then, it has offered training for nearly
400 individuals in nursing as well as several other health pathways, including Health
Information Technology, Pharmacy Technician, and Medical Assistant.
The HPOG grant will end in September 2015. In response, CAP-Tulsa must seek out
new funding sources and additional partners, as well as make adjustments to the program
to respond to these and other new circumstances. Moving away from HPOG funding also
presents an opportunity to target non-healthcare positions for training. The Tulsa economy
and labor market have emerged from the Great Recession, such that the range of job
opportunities available to its residents has increased.
We begin the report with a broad overview of the Tulsa labor market and how it has
changed over the last five years. Included in this analysis is an in-depth look at the
healthcare industry and associated occupations and how they have fared relative to other
segments of the market. We then examine other industry sectors and occupations to assess
whether they may be suitable for CAP-Tulsa to target for CareerAdvance® training options.
We take a more granular look at the labor market, investigating which jobs employers are
seeking to hire for, and how successful they have been at filling those positions. We
conclude with recommendations for a set of sectors and jobs that would be suitable to train
CAP parents to enter.

2
THE TULSA AREA LABOR MARKET
The Tulsa Metropolitan Statistical Area (MSA) is a 7-county area containing almost a
million residents (2013) comprising one-quarter of Oklahoma’s population.1 Since the end
of the Great Recession in mid-2009, the labor market in the Tulsa metropolitan area has
recovered faster than in the United States as a whole. Tulsa’s unemployment rate in 2012
averaged 5.6% and stood at 5.2% in August 2013.2 As Figure 1 demonstrates, Tulsa’s
unemployment rate has been consistently lower than the rest of the country, even before
the start of the Great Recession. Not only has Tulsa had lower unemployment over time,
but its unemployment rate also fell faster than the US rate during the ensuing economic
recovery. Since 2010, Tulsa’s unemployment rate has fallen by 2.1 percentage points, while
the national rate fell 1.5 percentage points. Since 2009, Oklahoma has consistently had a
lower unemployment rate than both the United States and Tulsa.
Figure 1. Unemployment Rates for the United States, Oklahoma, and the Tulsa MSA, 2000 to 2012
Source: U.S. Bureau of Labor Statistics, Current Populations Study and the Local Area Unemployment
Statistics Program
1 The seven counties, listed in declining order by population size, are: Tulsa, Rogers, Wagoner, Creek, Osage,
Okmulgee and Pawnee. 2 Oklahoma’s unemployment rate in August 5.2% is not seasonally adjusted. More recently available data
suggest that unemployment may be somewhat higher; rates (also not seasonally adjusted) for more recent months are: 5.5% (September), 5.8% (October), 5.3% (November), and 5.4% (preliminary, December). Source: U.S. Bureau of Labor Statistics, Local Area Unemployment Statistics, Accessed November 11, 2013

3
In July 2013, total nonfarm employment in Tulsa stood at 431,100. After the
recession ended, Tulsa’s employment growth largely mirrored that of the United States
(Figure 2). From January 2012 to July 2013, employment in Tulsa grew by 2.7%, adding
11,000 jobs. Employment in the United States and Oklahoma grew by 2.4% and 1.3%,
respectively.
Figure 2. Employment Growth in the United States, Oklahoma,
and the Tulsa MSA, January 2000 to July 2013 (index: Jan 2000=100)
Source: U.S. Bureau of Labor Statistics, Current Employment Survey and the State and Metro Area
Employment, Hours, & Earnings Program
Tulsa’s Industrial Base
In 2012, employment in the Tulsa MSA was concentrated in four broad industry
groups (Table 1):3 Healthcare; Government; Manufacturing; and Retail Trade. Together,
these four broad groups accounted for just over 60% of all employment in the area, with
3 Note that the term “Broad Industry Group” as used in this paper is what the U.S. Bureau of Labor Statistics
(BLS) defines as Industry Sectors classified by two-digit North American Industry Classification System (NAICS) codes. To more effectively grow its economy, Tulsa has identified groups of industries to promote as “Targeted Industry Sectors.” When we write about industry sectors (as defined by BLS), we describe them as “Broad Industry Groups” to distinguish the two industry groups called sectors.
4
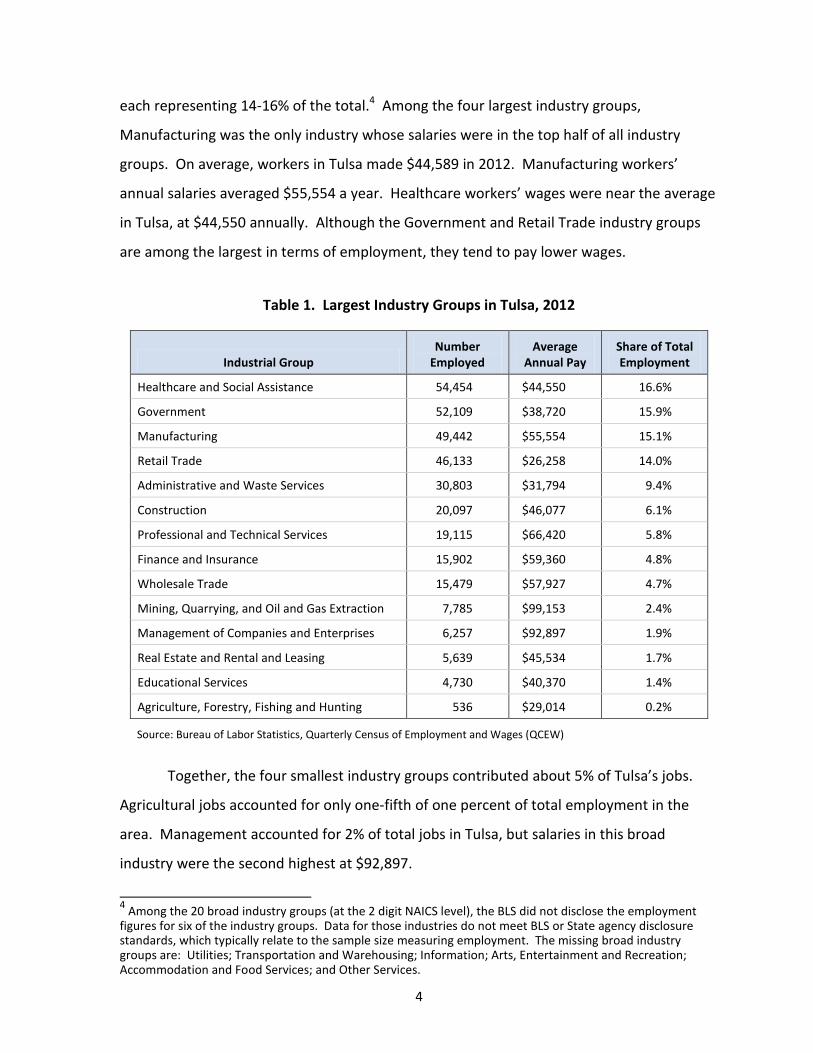
each representing 14-16% of the total.4 Among the four largest industry groups,
Manufacturing was the only industry whose salaries were in the top half of all industry
groups. On average, workers in Tulsa made $44,589 in 2012. Manufacturing workers’
annual salaries averaged $55,554 a year. Healthcare workers’ wages were near the average
in Tulsa, at $44,550 annually. Although the Government and Retail Trade industry groups
are among the largest in terms of employment, they tend to pay lower wages.
Table 1. Largest Industry Groups in Tulsa, 2012
Industrial Group Number
Employed Average
Annual Pay Share of Total Employment
Healthcare and Social Assistance 54,454 $44,550 16.6%
Government 52,109 $38,720 15.9%
Manufacturing 49,442 $55,554 15.1%
Retail Trade 46,133 $26,258 14.0%
Administrative and Waste Services 30,803 $31,794 9.4%
Construction 20,097 $46,077 6.1%
Professional and Technical Services 19,115 $66,420 5.8%
Finance and Insurance 15,902 $59,360 4.8%
Wholesale Trade 15,479 $57,927 4.7%
Mining, Quarrying, and Oil and Gas Extraction 7,785 $99,153 2.4%
Management of Companies and Enterprises 6,257 $92,897 1.9%
Real Estate and Rental and Leasing 5,639 $45,534 1.7%
Educational Services 4,730 $40,370 1.4%
Agriculture, Forestry, Fishing and Hunting 536 $29,014 0.2%
Source: Bureau of Labor Statistics, Quarterly Census of Employment and Wages (QCEW)
Together, the four smallest industry groups contributed about 5% of Tulsa’s jobs.
Agricultural jobs accounted for only one-fifth of one percent of total employment in the
area. Management accounted for 2% of total jobs in Tulsa, but salaries in this broad
industry were the second highest at $92,897.
4 Among the 20 broad industry groups (at the 2 digit NAICS level), the BLS did not disclose the employment
figures for six of the industry groups. Data for those industries do not meet BLS or State agency disclosure standards, which typically relate to the sample size measuring employment. The missing broad industry groups are: Utilities; Transportation and Warehousing; Information; Arts, Entertainment and Recreation; Accommodation and Food Services; and Other Services.

5
Table 2. Growth in Major Industrial Groups 2007-2012, Tulsa MSA
Industrial Sector
Number Employed
2007
Number Employed
2012 Employment
Growth
Employment Growth
(Percent)
Mining, Quarrying, and Oil and Gas Extraction 6,100 7,785 1,685 27.6%
Healthcare and Social Assistance 48,016 54,454 6,438 13.4%
Management of Companies and Enterprises 5,557 6,257 700 12.6%
Educational Services 4,534 4,730 196 4.3%
Retail Trade 44,575 46,133 1,558 3.5%
Administrative and Waste Services 29,922 30,803 881 2.9%
Public Administration 52,037 52,109 72 0.1%
Manufacturing 49,553 49,442 -111 -0.2%
Finance and Insurance 16,620 15,902 -718 -4.3%
Professional and Technical Services 20,053 19,115 -938 -4.7%
Construction 21,526 20,097 -1,429 -6.6%
Wholesale Trade 17,966 15,479 -2,487 -13.8%
Agriculture, Forestry, Fishing and Hunting 634 536 -98 -15.5%
Real Estate and Rental and Leasing 7,920 5,639 -2,281 -28.8%
Source: Bureau of Labor Statistics, Quarterly Census of Employment and Wages (QCEW).
Employment growth from 2007 to 2012 varied considerably across these broad
industry groups (Table 2). Seven industry groups employed more workers in 2012 than in
2007, including three that had double-digit growth rates: Mining, Healthcare, and
Management. Together, these broad industry groups added 8,823 jobs. Average wages in
two of these industry groups, Mining and Management, were higher than most of the other
groups at over $90,000 a year, though relatively small numbers of workers are employed in
either industry.
Occupations in Tulsa
Tulsa’s workforce is classified into 22 major occupational groups. Similar to its
industrial mix, Tulsa’s workers are concentrated within a few major occupational groups
(Table 3). The largest three occupations make up more than one-third of the Tulsa

6
workforce: Office and Administrative Support; Sales; and Production. However, workers in
these occupations tend to earn relatively low wages.
Table 3. Tulsa's Major Occupational Groups, 2012
Occupational Group Number
Employed Average
Annual Pay
Share of Total
Employment
Office and Administrative Support Occupations 71,930 $31,970 17.4%
Sales and Related Occupations 45,330 $35,010 10.9%
Production Occupations 37,850 $36,610 9.1%
Food Preparation and Serving Related Occupations 34,340 $19,390 8.3%
Transportation and Material Moving Occupations 25,380 $31,140 6.1%
Heath care Practitioners and Technical Occupations 24,370 $66,370 5.9%
Management Occupations 23,360 $90,420 5.6%
Education, Training, and Library Occupations 22,140 $40,060 5.3%
Installation, Maintenance, and Repair Occupations 21,060 $42,440 5.1%
Construction and Extraction Occupations 20,060 $35,430 4.8%
Business and Financial Operations Occupations 17,420 $58,590 4.2%
Heath care Support Occupations 11,850 $25,020 2.9%
Building and Grounds Cleaning and Maintenance Occupations 11,190 $22,390 2.7%
Architecture and Engineering Occupations 9,090 $76,940 2.2%
Personal Care and Service Occupations 8,980 $22,800 2.2%
Protective Service Occupations 8,440 $36,980 2.0%
Computer and Mathematical Occupations 7,280 $64,160 1.8%
Community and Social Service Occupations 4,700 $36,680 1.1%
Legal Occupations 3,390 $93,040 0.8%
Arts, Design, Entertainment, Sports, and Media Occupations 3,330 $41,160 0.8%
Life, Physical, and Social Science Occupations 1,930 $77,440 0.5%
Farming, Fishing, and Forestry Occupations 660 $23,920 0.2%
Source: Bureau of Labor Statistics, Occupational Employment Statistics (OES).
The six smallest occupations only make up 5% of all jobs in Tulsa. Two of those
occupation groups, Legal and Science Occupations, are relatively well paid, earning on
average $93,040 and $77,440 respectively.

7
Table 4. Growth in Occupations 2007-2012, Tulsa MSA
Occupational Group
Number Employed
2007
Number Employed
2012 Employmen
t Growth
Employment Growth
(Percent)
Farming, Fishing, and Forestry Occupations 350 660 310 88.6%
Legal Occupations 2,480 3,390 910 36.7%
Community and Social Service Occupations 3,710 4,700 990 26.7%
Personal Care and Service Occupations 7,650 8,980 1,330 17.4%
Heath care Practitioners and Technical Occupations
20,920 24,370 3,450 16.5%
Sales and Related Occupations 42,800 45,330 2,530 5.9%
Architecture and Engineering Occupations 8,610 9,090 480 5.6%
Building and Grounds Cleaning and Maintenance Occupations
10,870 11,190 320 2.9%
Business and Financial Operations Occupations 17,010 17,420 410 2.4%
Food Preparation and Serving Related Occupations 34,480 34,340 -140 -0.4%
Management Occupations 23,790 23,360 -430 -1.8%
Education, Training, and Library Occupations 22,570 22,140 -430 -1.9%
Protective Service Occupations 8,710 8,440 -270 -3.1%
Office and Administrative Support Occupations 75,210 71,930 -3,280 -4.4%
Production Occupations 40,200 37,850 -2,350 -5.8%
Installation, Maintenance, and Repair Occupations 22,900 21,060 -1,840 -8.0%
Construction and Extraction Occupations 21,970 20,060 -1,910 -8.7%
Transportation and Material Moving Occupations 27,890 25,380 -2,510 -9.0%
Heath care Support Occupations 13,630 11,850 -1,780 -13.1%
Arts, Design, Entertainment, Sports, and Media Occupations
3,910 3,330 -580 -14.8%
Life, Physical, and Social Science Occupations 2,410 1,930 -480 -19.9%
Computer and Mathematical Occupations 9,850 7,280 -2,570 -26.1%
Source: Bureau of Labor Statistics, Occupational Employment Statistics (OES).
The growth rates of occupations at the top of Table 4 look impressive, but are
somewhat deceiving. Farming, Fishing, and Forestry occupations grew by 89% from 2007-
2012, while Legal occupations and Social Service occupations grew by 37% and 27%,
respectively. Although all of these occupations posted high rates of growth, their absolute

8
numbers are quite small. The three fastest growing occupations added 2,210 jobs.
Occupations with the next three highest growth rates added 7,310 jobs to Tulsa’s labor
market, three times as many as the top three. Workers in only one of these occupations
earn relatively high salaries: Healthcare Practitioners earn on average $66,370 a year. Not
all occupational groups added jobs in this period. Thirteen major occupation groups in
Tulsa actually lost jobs from 2007 to 2012.
Recent Performance of Tulsa’s Healthcare Sector
Since its pilot phase began in 2009, CareerAdvance® has trained the parents of CAP-
Tulsa Head Start and Early Head Start children for jobs in the healthcare sector, one of the
most robust industry groups in the Tulsa area.
The Healthcare Industry Group
Healthcare jobs are extremely valuable to the performance of Tulsa’s economy. Not
only is healthcare the largest sector in Tulsa in terms of jobs, its growth rate was the second
fastest of all industry groups. However, employment levels and growth are not evenly
distributed within the broader healthcare sector. The healthcare industry has four broad
subgroups (Table 5). The two largest of these — Ambulatory Services and Hospitals —
employ almost 73% of all healthcare workers in Tulsa and typically pay more than Tulsa’s
average salary.

9
Table 5. Tulsa's Healthcare Industry Subgroups, 20115
Industrial Sub-Sector Number
Employed Average
Annual Pay
Share of Employment
in the Healthcare
Sector
Ambulatory Healthcare Services 20,758 $54,845 38.4%
Hospitals 18,520 $45,929 34.3%
Nursing and Residential Care Facilities 8,084 $23,999 15.0%
Social Assistance 6,686 $22,405 12.4%
Source: Bureau of Labor Statistics, Quarterly Census of Employment and Wages (QCEW).
Growth in the healthcare industry subgroups was uneven as well (Table 6). The two
fastest-growing subgroups were Ambulatory Healthcare Services and Social Assistance.
Ambulatory Healthcare Services was also the largest and highest-paying subgroup. The
Nursing and Residential Care Facilities subgroup actually lost jobs from 2007 to 2012.
Table 6. Growth of Tulsa's Healthcare Subgroups, 2007-2011
Heath care Industrial Subgroup
Number Employed
2007
Number Employed
2011 Employment
Growth
Employment Growth
(Percent)
Ambulatory Healthcare Services 17,760 20,758 2,998 16.9%
Social Assistance 6,091 6,686 595 9.8%
Hospitals 17,585 18,520 935 5.3%
Nursing and Residential Care Facilities 8,170 8,084 -86 -1.1%
Source: Bureau of Labor Statistics, Quarterly Census of Employment and Wages (QCEW)
5 Note that the healthcare industry discussion uses 2011 data, due to changes in BLS reporting categories in
2012.

10
Healthcare Occupational Groups
There are two major healthcare-related occupation groups: Healthcare Support
occupations, and Healthcare Practitioners and Technical occupations. Nearly twice as many
workers are employed in Healthcare Practitioner than Healthcare Support occupations.
Since 2007, Healthcare Practitioners added jobs, while employment in Health Support
occupations declined.
Healthcare Practitioners and Technical Occupations
Healthcare Practitioners and Technical occupations have three subgroups: Health
Diagnosing occupations; Health Technicians; and Other Practitioners. Health Diagnosing
occupations include general doctors such as primary care physicians and dentists. Health
Technicians provide services that are complementary to specific Health Diagnosing
occupations, such as dental hygienists. Other Practitioners, e.g., athletic trainers, handle
specific health issues usually not addressed by a primary doctor. The vast majority of
Health Practitioners (69%) are technologists and technicians. It is the lowest paying
healthcare occupation subgroup, at an average annual salary of $38,974.
The fastest growing subgroup is Other Healthcare Practitioners and Technical
Occupations (Table 7). However, as noted, a high growth rate does not mean large
numbers of jobs were created. There were only 160 Other Practitioners in 2007. This group
grew by 63%, but only added 100 jobs. The other two subgroups grew by only 23% and
10%, respectively, but added 730 and 880 jobs, respectively.
Table 7. Growth in Tulsa MA Health Practitioners Occupations 2007-2011
Occupational Sub Group
Number Employed
2007
Number Employed
2011 Employment
Growth
Employment Growth
(Percent)
Other Heath Care Practitioners and Technical Occupations
160 260 100 62.5%
Health Diagnosing and Treating Practitioners 3,210 3,940 730 22.7%
Health Technologists and Technicians 8,450 9,330 880 10.4%
Source: Bureau of Labor Statistics, Occupational Employment Statistics (OES)

11
Healthcare Support Occupations
Healthcare Support occupations interact more directly and physically with patients
than do Healthcare Practitioners as a group. They are likely to provide health services such
as occupational or massage therapy, or they are nurses who either aid primary doctors or
provide healthcare service themselves. Nursing, Psychiatric, and Home Health Aides are by
far the largest subgroup, comprising 62% of Healthcare Support Workers (Table 8). These
occupations also paid the lowest of the Health Support subgroups, an average of just
$21,645 annually.
Table 8. Minor Occupations in Tulsa's Health Support Occupations Group, 2011
Occupational Subgroup. Number
Employed
Average Annual
Pay
Share of Employment in
the Health Support Group
Nursing, Psychiatric, and Home Health Aides 6,890 $21,645 61.6%
Other Heath care Support Occupations 3,750 $41,242 33.5%
Occupational Therapy and Physical Therapist Assistants and Aides
550 $28,687 4.9%
Source: Bureau of Labor Statistics, Occupational Employment Statistics (OES).
All three healthcare support subgroups lost jobs from 2007 to 2012 (Table 9). The
smallest subgroup, Occupational and Physical Therapist Assistants, lost the fewest jobs over
the period. The other two subgroups are relatively larger, and both lost jobs at higher rates.
Table 9. Growth in Tulsa's Healthcare Support Occupations 2007-2012
Occupational Minor Group
Number Employed
2007
Number Employed
2011
Employment Growth
(Number of jobs)
Employment Growth
(Percent)
Occupational Therapy and Physical Therapist Assistants and Aides
600 550 -50 -8.3%
Nursing, Psychiatric, and Home Health Aides 8,240 6,890 -1,350 -16.4%
Other Healthcare Support Occupations 4,600 3,750 -850 -18.5%
Source: Bureau of Labor Statistics, Occupational Employment Statistics (OES).

12
ASSESSING INDUSTRY SECTORS FOR TARGETING
Since CareerAdvance® was launched in 2009, Tulsa has weathered the housing
market collapse, and the Great Recession and relatively sluggish recovery that followed.
We conducted an analysis of additional industry groups in Tulsa to determine which would
be appropriate for CareerAdvance® to target in the future. Following our earlier analysis of
the Tulsa labor market in preparation for the program’s design and launch (King et al.,
2009), we first examined whether the industry groups were targeted by other key groups,
how they performed in the labor market, and whether they appeared to be good fits for the
regional workforce system and for employing parents with young children. Then, we
evaluated whether these industries appeared to offer other features that might work for
CareerAdvance® and its participants, including whether there was an industry group or
association that could provide support for efforts focused on it, whether industries
recognized the need for training, and whether training capacity existed in the region.
Because the primary focus of CareerAdvance® has been on jobs in Healthcare, due
both to its strong growth earlier and reliance on Health Profession Opportunity Grant
funding, we evaluated whether this was still a suitable industry to target for CAP-Tulsa
parents. The answer is a resounding “Yes.” Two of the top five potential target sectors are
in Healthcare, which is already a focus area. Of the remaining industry groups with the best
labor market performance, three—Energy, Mining and Aerospace—were scrutinized further
for suitability. Although our investigation showed that all three are somewhat promising
targets, the most suitable industry group for CAP-Tulsa to target for CareerAdvance® in the
near term appears to be Aerospace Product and Parts Manufacturing. This industry
features job openings at good wages, an established career ladder that local institutions can
and are available to support, and the potential to attract more funding for CareerAdvance®
operations. Table 10 below summarizes the results of our analysis.

13
Table 10. Criteria for Choosing Target Industry Sectors in Tulsa
INDUSTRY SECTORS CONSIDERED Off
ice
s O
f P
hys
icia
ns
Sup
po
rt A
ctiv
itie
s Fo
r M
inin
g
Ae
rosp
ace
Pro
du
ct A
nd
P
arts
Man
ufa
ctu
rin
g
Oil
An
d G
as E
xtra
ctio
n
Ge
ne
ral M
ed
ical
An
d
Surg
ical
Ho
spit
als
First-Level Criteria - Labor Market Suitability
Critical to Economic Development: Targeted by the Tulsa Chamber, State of Oklahoma or other Economic Development entity
● ● ● ● ●
Strong Employment Demand: Employers are hiring and have ongoing projected openings ● ● ● ◑ ●
Experiencing Key Occupational Shortages: Demand figures show shortages; significant numbers of jobs are involved
◑ ● ● ◑ ◑
Appropriate for Targeted Clientele by Workforce System: There are multiple entry points below a 4-year college degree for skilled, trained workers
● ● ● ● ●
Suitable for Parents with Young Children: Jobs are stable, do not require extraordinary hours, travel or other characteristics that could be barriers to participation
● ◑ ● ◑ ◑
Good Earnings, Benefits and Opportunities for Advancement: Positions pay at least minimum standards, offer benefits and advancement opportunities
◑ ◑ ● ● ◑
Second-Level Criteria - Potential for Training and Industry Engagement
Industry Group in Existence: Industry association or organization with interest and activities exists to support initial outreach and analysis
● ● ● ● ●
Recognized Industry Need: Employers acknowledge shortages in critical occupations
◑ ◑ ◑ ◑ ◑
Institutional Support: Area providers offer training for the career pathway
● ◑ ● ● ●
Potential for funding ◑ ● ● ◑
Best prospects
*Key: ● Strongly meets criteria ◑ Partially meets criteria Does not meet criteria
? Status is uncertain Recommended sector

14
First-Level Analysis
Our first-level analysis examined which industries performed well in the Tulsa labor
market, both on the supply and the demand side of the market. We placed greater
emphasis on the demand (or employer) side because employers control the potential jobs
trained participants could fill. Programs must ensure they are meeting the needs of
employers if they want their participants to become employed in high-demand, high-skill
industries. This is an important element in the success of sectoral training and career
pathway strategies, of which CareerAdvance® is an example.6
We used six (6) indicators to evaluate these industry groups. First, we focused on
whether the industry was seen as critical to economic development, i.e., targeted by groups
such as the Tulsa Chamber of Commerce, the State of Oklahoma or other entities focused
on economic development. Supporting industries with the potential for employment
growth is a key aspect of economic development planning in Tulsa and the State of
Oklahoma. The Tulsa Metro Chamber of Commerce funded an assessment of the local
economy. The Chamber study by Ball (2012) identified six sectors for targeting. Each sector
contained multiple industries that were likely to expand if provided with the appropriate
resources. These six sectors were:
1. Energy,
2. Aerospace,
3. Advanced Manufacturing,
4. Professional Services and Regional Headquarters,
5. Health Care, and
6. Transportation Distribution, and Logistics.
These six sectors are highly interconnected and make up a substantial part of Tulsa’s
economy. In 2012, these target sectors employed 14% of Tulsa’s workforce, provided 25%
of its labor income, and accounted for 23% of its gross metropolitan product (GMP)
6 Glover and King (2010) and King (2014) review the evidence on sectoral and career pathway programs.

15
according to Ball (2012). The five industries chosen to investigate further come from three
of Tulsa’s targeted sectors: Healthcare, Energy and Aerospace.
The State of Oklahoma is in the process of establishing a similar economic
development strategy, which is in its trial stages (Wright, 2013). Oklahoma’s strategy
targets industry groups, which it terms “ecosystems.” Unlike Tulsa’s target industries (also
known as clusters), the “ecosystem” strategy might not concentrate incentives in industries
already dominant in the area. Instead, it might focus on smaller, high-performing industries
with more upward career mobility potential. Oklahoma will inevitably direct some of its
resources towards these industry groups or “ecosystems,” which in turn would positively
affect employment in those industries. Of the six ecosystems targeted by the state
(Oklahoma Department of Commerce, 2013), four match the industries targeted by the
Tulsa Chamber:
1. Health
2. Aerospace,
3. Energy, and
4. Transportation.
These industries will likely receive more state support, and hire and train workers for
higher-skilled, higher-paid jobs, including those in the Tulsa area.
Second, we assessed the strength of employment demand in the industry group
using several measures, including the number employed in the industry in 2012, the growth
rate of employment in the industry from 2007-2012, and recent job openings from
November 2012 to October 2013, the most recent period for which data were available
when we conducted our analysis. Job openings for this analysis included the total number
of open positions that a typical CareerAdvance® participant might be qualified for, i.e.,
entry-level jobs that only require applicants to have a high school education or some
college-level coursework. For job openings, we used the Labor Insight database created by
Burning Glass, a national labor market information firm.7 Burning Glass populates their
7 The Oklahoma Department of Commerce has a statewide contract to access and use Burning Glass LMI data
for its programs and granted the Ray Marshall Center access to these data.

16
database with job postings gleaned from numerous public and proprietary sites available on
the web. These data also included job requirements (e.g., level of education), which most
job postings listed. All other indicators were taken from the Bureau of Labor Statistic’s
Occupational Employment Statistics (OES) survey. We excluded industry groups if they did
not advertise open positions in this period.
Third, we examined whether occupational shortages involving significant numbers of
positions were being reported in the industry. Fourth, we assessed whether the industry
featured multiple entry points below a four-year college level for which the workforce
system in the region might offer training. Fifth, we judged the degree to which jobs
available in the industry were suitable for parents with young children, i.e., CAP-Tulsa
parents, in terms of stability, hours of work and similar features. And, finally, we examined
whether entry-level occupations could lead to better jobs with the right education and work
experience.8
As shown in Table 10, most of the five industry groups met many of these criteria.
Only Aerospace Product and Parts Manufacturing met all of them.
Second-Level Analysis
Our second-level analysis then assessed whether the industries would be good for
CareerAdvance® to target based on additional factors. One factor that influenced our
assessment was whether there was an industry association or trade group in existence that
was both interested and available to support outreach and further analysis of employment
in the industry. A second factor — one that was examined more closely through a series of
in-depth industry interviews and focus groups for the earlier 2009 analysis — was whether
area employers acknowledged shortages in critical occupations their industry. Third, we
examined the extent to which local providers had the capacity to offer training for positions
8 Note that most career pathways included in this paper are adaptations of sample career pathways found
online. In our paper, they typically include just one of the paths for each lattice found online. However, we took some liberties to match characteristics of career paths online with occupational data from Burning Glass. Not all jobs in the career ladders online strictly matched occupations as classified under SOCs, and thus were not included in our analysis. If an occupation online did not have an exact match in our data classified by SOCs, we used occupations with similar tasks and qualifications. Footnotes for each career path explain substitutions made to fit our data with the online models.

17
in the industry.
A final factor considered beyond the two-level analysis was the potential for funding
training efforts in each of the industries identified for possible targeting.
Industry Evaluation
In this section, we examine each of the five industry groups further and evaluate
whether CareerAdvance® should target them in the future with new career pathway
training options. Of these, Aerospace probably represents the best addition to Healthcare
as a sector to target.
Healthcare Industry Groups
Two industry groups that our initial analysis identified as promising targets are in the
Healthcare sector: Offices of Physicians; and General Medical and Surgical Hospitals.
Almost all target sectors and industries in Tulsa are associated with the Healthcare sector.
Most workers see quality healthcare as directly affecting their well being. Tulsa is home to
nine hospitals, two of which are medical schools with research facilities. Research in the
healthcare sector is producing new products that improve the quality and length of life.
Advanced manufacturing companies often contribute high tech parts to help build these
inventions. Given this wide range of activities, it is not surprising that occupations in the
medical field require a wide range of educational requirements. There are many entry-level
nursing assistant positions, which require successfully completing a certificate program. On
the other end, healthcare practitioners, like doctors and surgeons, require post-graduate
training. Most healthcare workers in research and development require higher-level
degrees as well. As a large and growing industry, it is not surprising that there are several
large area healthcare sector employer groups, including the Healthcare Roundtable and The
Tulsa Hospital Council.
Both healthcare industry subgroups selected as part of the initial analysis offer
several occupations that would be good targets for CareerAdvance®. They pay well, offer
established career pathways, and have area training or education providers that could help
participants advance to higher-skilled, better-paying jobs on job ladders. CareerAdvance® is

18
already targeting multiple healthcare occupations. We would only recommend expanding
into the Offices of Physician's and General Medical and Surgical Hospital's industry groups
after further study, in particular pursuant to in-depth conversations with leading employers
in these groups to validate appropriate training and employment opportunities.
Energy Industry Groups
Two of the selected industry groups — Oil and Gas Extraction, and Support Activities
for Mining — produce products that are part of Tulsa’s vibrant energy sector. After a brief
description of the larger energy sector, we assess each industry group separately, starting
with Oil and Gas.
The energy sector has a long history in Tulsa. One active firm, Arrow Engine
Company, has been in business for over 50 years. Historically, Tulsa has been known as an
oil town. However, energy production in Tulsa now comes from many sources, including
traditional ones like coal and natural gas, as well as newer green sources such as wind
power.
Tulsa is a national hub for energy production. It is home to around 1,000 energy-
related businesses. Larger companies like ONEOK Inc. and Baker Hughes each employ some
1,200 workers, while ConocoPhillips employs 3,200 Tulsans (Tulsa Regional Chamber, 2013).
As a well-established industry, Tulsa also boasts a number of energy employer associations.
The Second Century Energy Initiative is one example. Tulsa’s energy sector also includes
mid-sized alternative energy companies, particularly ones who produce wind power, e.g.,
DMI Industries.
The energy sector provides Tulsa’s industries the power needed to perform most of
their economic activities. Energy companies are also consumers of products created by
other sectors. Many energy producers extract or create energy in one part of the world,
though the final consumption happens elsewhere (Evans, 2013). In 2012, workers in the
energy cluster comprised 2.3% of Tulsa’s workforce, received 10.5% of labor income, and
produced 12% of local goods and services (Ball, 2012).

19
OIL & GAS EXTRACTION
Tulsa was historically known as the “Oil Capital of the World.” It is not surprising
that the oil and gas industry has created two large employer associations locally: the
Oklahoma Gas Association, and the Mid-Continent Oil & Gas Association of Oklahoma.
Larger oil companies, including Kaiser-Francis Oil Company, Samson Investment COHQ, and
Wpx Energy, Inc., each employ between 1,000 and 5,000 workers (Manta Media Inc., 2013).
The industry employs workers from across all levels of the education spectrum. Oil
companies employ lower-skilled production workers including petroleum pump system
operators and high-skilled employees include geological and petroleum technicians.
Recommending suitable Oil and Gas industry jobs to target is difficult. First,
compared with the other second-level industry groups, the industry actually has posted
fewer job openings. Its openings-to-employment ratio is under one percent, the lowest of
the industries identified as high-performing. Many entry-level, low-skilled occupations
within the oil industry group are either not specific to the industry or do not seem to have
clear career advancement potential. One promising occupation is Geological and Petroleum
Technicians, which are similar to Rig Operators.
On average, the oil industry paid Rig Operators $59,670 in 2012. This is $20,000 a
year more than the average salary paid to all workers in Tulsa, $41,040 (Bureau of Labor
Statistics, 2012). Rig Operators repair pumps, mud tanks, and related equipment. Rig
Operators could learn the skills required to complete these tasks through formal training.
However, Rig Operator jobs typically do not require previous work-related skills, knowledge,
or experience.
Career Paths in Oil and Gas Extraction
If they follow a certain career pathway, individuals who initially join the industry as a
Rig Operator9 could eventually rise to become a Petroleum Engineer after enrolling in
academic and/or training programs (CareerOneStop, 2013a).
9 Rig Operator is not included in our Burning Glass occupational analysis. The substitutes we chose with
similar skills and responsibilities were geological and petroleum technicians.

20
This career pathway might be as follows:
Becoming a Rig Operator requires at least a high school education. After being a Rig
Operator for a year, they could become Rig Manager if they attained the necessary
experience and training, including possibly earning a bachelor’s degree. After several years
of being a Rig Manager where they received some engineering on-the-job training, a Rig
Manager could pursue a bachelor's degree and become a Petroleum Engineer.
Education and Training for Jobs in Oil and Gas Extraction
An individual looking to earn the proper credentials for all steps of the Rig Operator
career ladder can find most of them through a Petrotech Certification Program. The
Oklahoma Energy Resources Board (OERB) created this program with assistance from the
Francis Tuttle Technology Center and the Tulsa Technology Center (Oklahoma Energy
Resource Board, 2011). Petrotech offers programs that specialize in many different areas of
the oil and gas industry, e.g., well and production data management, and mud logging.10 A
student can take many different classes to earn a general Petrotech Certification, or they
can earn specific associate degrees in the field. To become a petroleum engineer, a student
must transfer to a college, such as the University of Tulsa. At the University of Tulsa, a
student can subsequently earn the required Bachelor of Science in Petroleum Engineering.
10
Mud logging is a type of drilling procedures used on oil rigs.
Rig Operator Rig Manager Petroleum Engineer

21
Funding Opportunities for Training Workers for the Oil and Gas Industry
Although independent funding to train workers for the energy industry (including,
but not exclusively oil and gas) is lacking, there is clear interest in promoting this industry.
New grants may become available soon (U.S. Environmental Protection Agency, 2013). Two
fairly large grants for similar training ended in 2013, and another will wrap up in 2014. As
part of the American Reinvestment and Recovery Act (ARRA), the federal government
funded the State Energy Sector Partnership (SESP), which gave out $190 million in grants in
2010 (US Department of Labor, 2010a). These federal grants were designed to help states
implement a comprehensive statewide energy sector strategy (U.S. Department of Labor,
2010b). This grant has supported programs training workers in skills required to work in the
energy industry. Oklahoma’s grant was $6,000,000 and lasted from January 2010 to
January 2013. Oklahoma used its SESP grant to train workers for energy efficiency and
renewable energy jobs that paid above the state’s per capita income. Tulsa Community
College led one of six programs that Oklahoma funded across the state (Sustainable Tulsa,
2011), the TCC Green Training Consortium, which was awarded $364,277. It trained 387
participants for jobs in alternative energy, driver training, and waste minimization.
A second source of funding for energy-related job training was the Bill and Melinda
Gates Foundation. In 2010, it awarded $300,000 to the Center for Energy Workforce
Development (CEWD) to design career pathways in the energy industry (Center for Energy
Workforce Development, 2010). The Get Into Energy Career Pathways Planning Project
(GIEC), as it was known, funded nine states, including Oklahoma, to design pathways for
utility technicians in the energy sector.
The third recent source of funding for energy-related job training was the Green
Jobs Innovation Fund (GJIF), which was authorized as a pilot project to train workers for
“green” jobs. The purpose of the grant was to provide access to “green” career pathways
(U.S. Department of Labor, 2011). Funding began in July 2011 and is scheduled to end in
June 2014 (U.S. Government Accountability Office, 2013). Oklahoma received two major
green job grants through this project (OK Green $6M and OK Greenovation $5M). This is
potentially a good industry to target because local training programs have received funding.
CAP-Tulsa might consider potentially partnering with one of these organizations.

22
MINING INDUSTRY GROUPS
Some industry groups in the mining sector overlap with extraction of energy sources
like oil and coal. It is difficult to talk about mining as completely separate from the energy
sector because some of the largest companies in the sector extract fossil fuels. Some of
these were described earlier.
However, mining encompasses a far larger set of products than coal and other
energy source extraction. Support activities for mining companies provide a wide variety of
services. They provide tools and support services (e.g. transportation of minerals) and
perform major parts of the extraction itself. Some companies do the preparation work
(exploration of minerals) before mining can start. This can include sampling rocks near a
potential mining spot to test whether or not there is a high concentration of the mineral the
company is looking to extract. Companies also do major parts of the extraction, including
the removal of unwanted material from a mining site and drilling test holes to search for oil.
Although coal mining, a major part of the mining industry, has decreased over the years, it
still has a $60 million impact on Tulsa’s economy.
Mining has major employer and industry groups in addition to oil and gas groups.
These include the Coal Producers Committee and the Oklahoma Aggregates Association.
Occupations in the mining industry include workers with various skills, from the chemists
who test the concentration of minerals in different locations to blue-collar workers that run
equipment to extract and transport material.
Jobs in the Mining Industry
Many oil industry jobs are not appropriate for CareerAdvance® to target. However,
there appears to be a shortage of jobs in the industry. The mining industry has the second
highest openings-to-employment ratio in the area, at just over 10 percent. However, the
most serious concern is that most of the entry-level occupations with openings are not
specific to the mining industry. Blue-collar mining occupations with more job openings
include maintenance and repair workers; and laborers and freight, stock, and material
movers. Other broad jobs include sales representatives; wholesale and manufacturing,
except technical and scientific products bookkeeping; accounting and auditing clerks; truck

23
drivers, heavy and tractor-trailer. Some of these jobs are actually higher skilled. Moreover,
a clear career pathway for these jobs is generally lacking. Therefore, CareerAdvance®
participants might have difficulty finding a job that could lead to a better-paying position.
However, local institutions can train workers for good low-skilled mining jobs that
could lead to better jobs in the industry, including crane operators or welders, jobs with
significantly higher-than-average annual salaries. Some of these low-skilled jobs might be a
reasonable first step in a career ladder, regardless of whether or not they are specific to
mining.
Career Pathways in the Mining Industry
Designing career paths in the mining industry is difficult because many entry-level
jobs are not specific to the mining industry. However, participants can still start their career
path in the mining industry in occupations that also belong to other professions or career
ladders. Professional welders are found across many areas of the labor market and are
needed wherever metal needs adhering to another metal. A skilled professional welder will
have career opportunities in many industries nationwide.
One career pathway11 could start as a Welder, and with the right training and
education, one could ultimately become a Mechanical Engineer (CareerOneStop, 2013b):
To qualify to be a welder, a person must first earn a professional welders certificate.
Later, they can earn a 2-year diploma to provide them access to better opportunities.
Associate degrees can build on certificate classes, and allow participants to specialize in
11
The online career path this example was modeled after is for the advanced manufacturing industry. However, since a career path for both mining and manufacturing could start with welder and end with mechanical engineers, the model is relevant for mining career paths as well.
Welder Mechanical Engineering Technician
Mechanical Engineer
24
different areas.
Focusing on one area could help participants create a niche, although it might not
help advance their career in mining unless they acquire more industry-specific training.
Higher-level positions require a broader understanding of the industry. Specialized mining
training programs are available and could provide a better chance of advancement. To
advance, welders could take individual mining classes or perhaps a certification in a specific
mining area.
In addition to mining industry training, participants may need other education and
training to move up on the career path and access mechanical engineering technician
positions. These positions typically require an associate’s degree. Workers also need one
or two years of training involving both on-the-job experience and informal training under
the supervision of experienced engineers.
The final step on this path is becoming a mechanical engineer. Mechanical
engineers in the minerals and energy industry may design and construct new machines,
equipment or systems for major projects. They also design machines and mechanical
installations and evaluate installed machinery, processes and products. To perform these
tasks requires skills taught at the bachelor’s degree level.
Local Education and Training Programs in the Mining Industry
To climb higher on a career ladder in the mining industry, workers would need to
combine training from two or three different fields or institutions. For CareerAdvance® to
map out a sequence of activities necessary for workers to progress would be challenging. It
would take coordinating with more institutions than it does now for its healthcare program
offerings.
Entering the welder career pathway described above requires initial training that is
not industry-specific. In Tulsa, the skills and education required can be obtained at Tulsa’s
Welding School (TWS). TWS offers both certificate and two-year associate degrees. Many
colleges and universities allow students to transfer some credits from TWS. TWS’
Professional Welder Program is one such program for welding.

25
Like many industries, mining has specialized training schools to gain the skills needed
to advance to higher-level occupations in the industry. The Oklahoma Miner Training
Institute (OMTI) provides this type of training, covering all aspects of mine safety and
health. OMTI mostly offers general education classes but they also have classes leading to
certification. A welder looking to advance in the mining industry could use classes such as
Introduction to Mining to bring them up to speed and qualify for higher-level positions.
Regularly scheduled classes are provided at OMTI, but they also travel to mine sites
throughout the state to minimize the inconvenience to both miners and operators. Training
provided by OMTI is free of charge to mining companies who hold permits in Oklahoma.
The next higher occupation in the mining career path shown above is a mechanical
engineering technician, a position that requires an associate’s degree, which can be earned
at Tulsa Community College. Although TCC does not offer associate’s degrees in mechanical
engineering, it does have a Science Associates program with an emphasis on mechanical
engineering. Unfortunately, this degree does not cover important topics necessary to
perform a mechanical engineer’s tasks, the final step in the mining career pathway. If
students want be promoted as a mechanical engineer, they could transfer to the University
of Tulsa, which offers a bachelor’s of science degrees in Mechanical Engineering (ABET,
2013).
Aerospace Industry Groups
The Aerospace Products and Parts Manufacturing industry group is part of Tulsa’s
aerospace cluster, which has a major presence in Tulsa. The aerospace cluster is highly
visible when flying into Tulsa. Many of its companies work in a large building located close
to the runway. Being adjacent to Tulsa’s airport is ideal for the aerospace cluster. Runway
space is typically hard to come by and is expensive elsewhere. In Tulsa, business comes
directly to them when incoming jets need service or parts. These firms also produce
leading-edge technology for the Department of Defense, such as unmanned aerial systems
known more commonly as drones.
The aerospace cluster has many large companies in in Tulsa. The American Airlines
Maintenance Repair and Overhaul Division is not only the largest aerospace employer in

26
Tulsa, it is one of the largest in the world. Spirit AeroSystems also is a substantial presence
in Tulsa, employing more than 1,000 Tulsans. Tulsa Aerospace associations include: the
Oklahoma Aerospace Alliance, the Oklahoma Aerospace Engineer Tax Credit Program, and
the Oklahoma Manufacturing Alliance. Aerospace companies require a highly skilled, highly
educated workforce, which includes computer related and engineering jobs.
Job Openings in the Aerospace Industry
Finding aerospace occupations to recommend for targeting by CareerAdvance® was
more straightforward than identifying suitable jobs in the oil and gas and mining industries.
More of the aerospace occupations captured in our analysis of the Burning Glass data are
industry-specific. The aerospace industry also currently has many more job openings than
the oil and gas industry.
However, not all features of the aerospace industry are positive. The openings-to-
employment ratio for aerospace is about half of that for mining. Also, many of the entry-
level jobs with openings are relatively low-paying positions. One entry-level job identified
as a good candidate to target within the aerospace industry is aerospace mechanic.12 The
annual salary for an aerospace mechanic is $45,890, above the Tulsa average.
Career Pathways in the Aerospace Industry
Like Mining, the Aerospace industry has entry-level jobs that require generalizable,
non-aerospace specific skills, e.g., mechanic. Also similar to mining, the aerospace industry
has a local institution (Spartan College of Aeronautics and Technology) specializing in
aerospace programs that helps those with portable skills to integrate and move up on the
career path to more advanced skilled jobs in the industry. If they start off as a Mechanic,
one career path could lead them to becoming an Aircraft Maintenance Supervisor (OK
Career Planner, 2013):
12
The occupation in our data that is the closest match to Mechanic is Installation, Maintenance, and Repair Workers.

27
If workers start as a regular mechanic, no education is needed other than graduation
from high school. Aviation Maintenance Mechanic requires an approved certification from
the Federal Aviation Agency (FAA). One suitable credential is an Airframe and Powerplant
certification (an A &P license). The last step to becoming an Aircraft Maintenance
Supervisor is to earn a relevant bachelor’s degree such as a Bachelors of Science in Aviation
Technology Management.
Education and Training for Jobs in the Aerospace Industry
Spartan College of Aeronautics and Technology, a private school, provides all the
education required to start a career in the aerospace industry, become a mechanic and
subsequently an aircraft maintenance supervisor (Spartan College of Aeronautics and
Technology, 2013). Spartan College offers programs in avionics across the board. Its
students can earn many types of accreditations, certifications, and associates degrees. It
also has many specialized job-specific education and training programs, including the FAA-
approved Aviation Maintenance Technology program that would fulfill requirements for the
first two steps on the career ladder discussed above. Most of the training at Spartan
College is applicable to lower-level jobs in Aerospace.
Local public colleges also offer several aerospace programs. However, most of them
are upper level and more academic. They do not address many different scenarios that
could occur in an aerospace manufacturing facility.
Mechanic Aviation
Maintenance Mechanic
Aircraft Maintenance
Supervisor

28
Funding Possibilities/Opportunities for Training Workers for the Aerospace Industry
One grant program that could help CareerAdvance® fund a targeted aerospace
strategy is the Trade Adjustment Assistance Community College and Career Training
(TAACCCT) program. TAACCCT was created to help community colleges expand job training
nationally through local employer partnerships (U.S. Department of Labor, 2012). TAACCCT
grants have totaled $500 million to date and are the second installment of a $2 billion, 4-
year initiative. The third round of TAACCCT grants was announced in September of 2013.
There might another round announced in the near future. TAACCCT is designed to support
training for workers who are unemployed due to adverse trade impacts. However, if there
are insufficient numbers of unemployed trade-affected workers to fill a particular training
program, grantees can use the funding to enroll otherwise-eligible, non-trade-affected
groups. TCC received a $2.5M TAACCCT grant in February 2012 to train workers in
Advanced Manufacturing, Aerospace, and Transportation and Logistics pathways, but at this
point does not expect to enroll significant numbers of trade-affected workers from the
area.13 The shortage of trade-affected workers in Tulsa may present an opportunity for
CareerAdvance® to train for jobs in Aerospace and related industry groups.
13
The Ray Marshall Center has partnered with the Corporation for a Skilled Workforce as the third-party evaluator of Tulsa’s TAACCCT grant. The grant is slated to run through September 2016.

29
CONCLUSIONS AND RECOMMENDATIONS
The clearest lesson from the analyses in both sections of the report is that health
care is still an appropriate sector to target for many reasons. However, the analysis also
suggests that CareerAdvance® should consider targeting other industry sectors as well,
particularly in preparation for the expiration of HPOG funding (September, 2015) with its
requirement to train only in healthcare occupations.
Training programs for other industry groups described above have received federal
funding. At least one of these grants, the Tulsa TAACCCT grant, may have sufficient
flexibility to reallocate some of its training slots in the near future. This grant runs through
September 2016.
Also, although further exploration is needed, some CAP-Tulsa fathers have not been
very excited about entering nursing or other healthcare fields. This might be because
historically, nursing was viewed as a female occupation. That is no longer the case to such
an extent. There are strong industry candidates for CAP-Tulsa to target that provide other
less gender-specific jobs.
We recommend Aerospace Manufacturing as the next sector for CareerAdvance® to
target. The initial 2009 labor market analysis for CAP-Tulsa’s pilot program also
recommended considering the Aerospace sector after establishing Healthcare as the lead
sector. The Aerospace Manufacturing sector was selected over the other two industry
finalists in the current analysis based on several factors:
1. It has the best near-term potential to attract outside funding. TAACCCT
grants might fund another round of programs, and CareerAdvance® has a
potential local partner, i.e., TCC, experienced with this grant effort.
2. The future looks relatively robust for the Aerospace industry. Aerospace
companies are making the products of the future, such as drones for
civilian use. The other industries’ long-term sustainability is uncertain. Oil
and natural gas production has spiked over the last several years.
However, oil and other commodities have experienced extreme boom-and-
bust cycles, leaving workers without jobs and former oil towns with no
economy. Coal, one of the mining industry’s largest markets, has shrunk.
Many coal mines around Tulsa are now abandoned. Also, power plants, a

30
large purchaser of coal, are transitioning away from using coal for
regulatory, environmental and other reasons.
3. Aerospace was the only selected industry group that did not require high
initial education levels to enter, making it easier for CareerAdvance®
participants to begin working relatively soon with less extensive
preparation.
4. Finally, participants pursuing a career pathway in Aerospace can currently
obtain the training they need in one location, the Spartan College of
Aeronautics and Technology.
Beyond continuing to pursue Healthcare and targeting Aerospace and closely related
industry sectors for future training opportunities for CareerAdvance® participants, it is also
important to point out that this analysis is based primarily on an examination of existing
labor market data and knowledge of local education and training institutions. Area
employers have a wealth of knowledge about actual hiring requirements and practices and
the way they are changing/expected to change and job openings in existing and emerging
occupations among other key features of their particular industry sector. This knowledge
needs to be tapped before proceeding. It is likely that employer and industry groups, as
well as other labor market experts, will be able to add to the list of target industries and
occupations in substantive ways.14
CareerAdvance® has reached a critical juncture. Grants issued over the last couple
of years support job training for industries other than healthcare. Funding for education
and training in industries such as Aerospace is likely to continue into the future, especially
given the continuing need for aerospace products from large customers like the U.S.
government. Local groups, particularly Tulsa Community College (TCC), have been recent
recipients of grants to train workers for industries other than healthcare as well. It might be
advantageous to form a stronger partnership with TCC and other area colleges, particularly
reaching out to individuals in their development offices.
14
The Ray Marshall Center completed an analysis of the Austin area labor market in 2012 that made extensive use of such information (see Glover et al., 2012). It led to an expanded set of target industries and jobs that would not have been the case based solely on existing labor market information.

31
Finally, pursuit of a career pathway program in the aerospace industry does not limit
options to the aerospace occupations cited in this report. The career pathways described
are samples designed by labor market and workforce development experts for a typical
person seeking to move up in a career pathway. The population CAP-Tulsa serves is not
necessarily the typical student on a generic career pathway. There are many options for the
type of classes that can help CareerAdvance® participants move forward on a career path.
Additional consultation with employer and industry associations and experts would be
essential to redesigning CareerAdvance® to best meet the program’s, providers’ and
participants’ needs.

32
REFERENCES
ABET. (2013). “Accredited Program Search,” 2013. http://main.abet.org/aps/Accreditedprogramsearch.aspx.
Ball, Bob. (2012). “Tulsa MSA Forecast 2013.” presented at the Tulsa Regional Chamber Economic Outlook Conference, Tulsa, OK, December 13, 2012. http://ww3.tulsachamber.com/upload/file/Economic%20Development/Tulsa%20MSA%20Forecast%202013%20by%20Bob%20Ball.pdf.
Bureau of Labor Statistics, U.S. Department of Labor. (2012). “Tulsa, OK - May 2012 OES Metropolitan and Nonmetropolitan Area Occupational Employment and Wage Estimates,” May 2012. http://www.bls.gov/oes/current/oes_46140.htm.
CareerOneStop. (2013a). “Sample Career Ladder/Lattice for Advanced Manufacturing,” 2013. www.careeronestop.org/competencymodel/careerpathway/ReviewCareerPathways/AdvancedManufacturing_CPW.pdf.
CareerOneStop. (2013b). “Sample Career Ladder/Lattice for Energy.” Accessed December 9, 2013. http://www.careeronestop.org/competencymodel/careerpathway/ReviewCareerPathways/Energy_CPW.pdf.
Center for Energy Workforce Development. (2010). Get Into Energy Career Pathways. Washington, D.C, October 7, 2010. http://www.cewd.org/pathways.asp.
Evans, Russell R. (2013). “Tulsa’s Energy Industry in 2012: Industry Definition and Economic Impact.” Accessed December 9, 2013. https://www.cityoftulsa.org/media/299452/tulsaenergyeconomicimpactreport-april2013.pdf.
Glover, Robert W. and Christopher T. King (2010). “The Promise of Sectoral Approaches to Workforce Development: Towards More Effective, Active Labor Market Policies in the United States,” In Charles J. Whalen, Ed., and Human Resource Economics: Essays in Honor of Vernon M. Briggs, Jr., Kalamazoo, Michigan: The W. E. Upjohn Institute for Employment Research, pp. 215-251.
Glover, Robert W.; Daniel O’Shea; Christopher T. King, Laura Stelling; and Richard Fonté (2012). Workforce Potential Project: Analysis of Area Labor Market and Provider Capacity, Final Report, Austin: Ray Marshall Center for the Study of Human Resources, Lyndon B. Johnson School of Public Affairs, University of Texas at Austin, September.
King, Christopher T. (2014). “Sectoral Workforce and Related Strategies … What We Know and What We Need to Know,” In Robert Giloth and Maureen Conway, Eds., Sector Strategies and Workforce Intermediaries in an Uncertain Economy: A Decade of Research and Practice, New York: American Assembly (forthcoming).

33
King, Christopher T.; Robert W. Glover; Tara C. Smith; Reagan Coffey; Brian Levy; Hirokazu Yoshikawa; William Beardslee; and Micah Kordsmeier (2009). The CareerAdvance Pilot Project: Recommended Jobs Strategy for Families Served by the Community Action Project of Tulsa County. Austin, TX:: Ray Marshall Center for the Study of Human Resources, LBJ School of Public Affairs, The University of Texas at Austin, August 2009.
Manta Media Inc. (2013) “Tulsa, OK Oil and Gas Field Exploration Services Companies.” Accessed December 9, 2013. http://www.manta.com/mb_54_E317E_H5K/oil_and_gas_field_exploration_services/tulsa_ok?refine_company_emp=E09.
Oklahoma Energy Resource Board. (2011). “OERB Celebrates First Graduates from Tulsa PetroTech Program.” Accessed December 9, 2013. http://www.oerb.com/Default.aspx?tabid=116&mid=471&newsid471=396.
OK Career Planner. (2013). “Airframe and Powerplant Mechanic Sample Pathway,” 2013. http://pathways.okcareerplanner.com/print.php.
Oklahoma Department of Commerce. (2013). “Key Business Ecosystems.” Accessed December 11, 2013. http://okcommerce.gov/location-or-expansion/oklahomas-business-ecosystems/.
PLANiTULSA. (2010). Our Vision for Tulsa, Tulsa Comprehensive Plan, Economic Development. Tulsa, OK: PLANiTULSA, July 2010. http://www.planitulsa.org/files/tulsa-comp-plan-ED-0112.pdf.
Spartan College of Aeronautics and Technology (2013). “Aviation & Aircraft Maintenance Program,” 2013. http://www.spartan.edu/programs/aviation-maintenance.
Sustainable Tulsa. (2011). “Green Jobs,” February 8, 2011. http://www.doleta.gov/pdf/GJIFOnePagersALL.pdf.
Tulsa Regional Chamber. (2013). 2013 TULSA MSA Largest Employers List. Tulsa, OK, 2013. http://ww3.tulsachamber.com/upload/file/Economic%20Development/Largest%20Employers%20List%20Jan%202013.pdf.
U.S. Department of Labor. (2010a). “US Department of Labor Announces Nearly $190 Million in State Energy Sector Partnership and Training Grants for Green Jobs,” January 20, 2010. http://www.dol.gov/opa/media/press/eta/eta20100078.htm.
U.S. Department of Labor. (2010b). “American Recovery and Reinvestment Act of 2009: State Energy Sector Partnership (SESP) and Training Grants,” 2010. http://www.doleta.gov/pdf/SESP_Summaries_FINAL_02042010.pdf.
U.S. Department of Labor. (2011). Green Jobs Innovation Fund. Washington, D.C: U.S. Department of Labor., 2011. http://www.doleta.gov/pdf/GJIFOnePagersALL.pdf.
U.S. Department of Labor (2012). “Obama Administration Announces $500 Million in Community College Grants to Expand Job Training through Local Employer Partnerships,” September 19, 2012. http://www.dol.gov/opa/media/press/eta/ETA20121885.htm.

34
U.S. Department of Labor. (2013). “Brookwood-Sago Mine Safety Grants Notices.” Washington, D.C: U.S. Department of Labor, July 30, 2013. http://www.msha.gov/REGS/FEDREG/NOTICES/2013Misc/2013-18209.asp
U.S. Environmental Protection Agency. (2013). “EPA Announces Rose State College in Oklahoma as Workforce Development and Job Training Grant Recipient,” June 13, 2013. http://yosemite.epa.gov/opa/admpress.nsf/0/BD0CC8E42E11E28285257B89006B94C5.
U.S. Government Accountability Office. (2013). Labor’s Green Jobs Efforts Highlight Challenges of Targeted Training Programs for Emerging Industries. U.S. Government Accountability Office, June 2013. http://www.gao.gov/assets/660/655331.pdf.
Wright, Joshua. (2013). “Oklahoma Establishes Statewide Economic Development Strategy after In-Depth Data Analysis,” March 14, 2013. http://www.economicmodeling.com/2013/03/14/oklahoma-establishes-statewide-economic-development-strategy-after-in-depth-data-analysis/.