laboration the spectrum analyzer 2010_f
TRANSCRIPT
8/7/2019 Laboration the spectrum analyzer 2010_f
http://slidepdf.com/reader/full/laboration-the-spectrum-analyzer-2010f 1/11
The spectrum analyzer
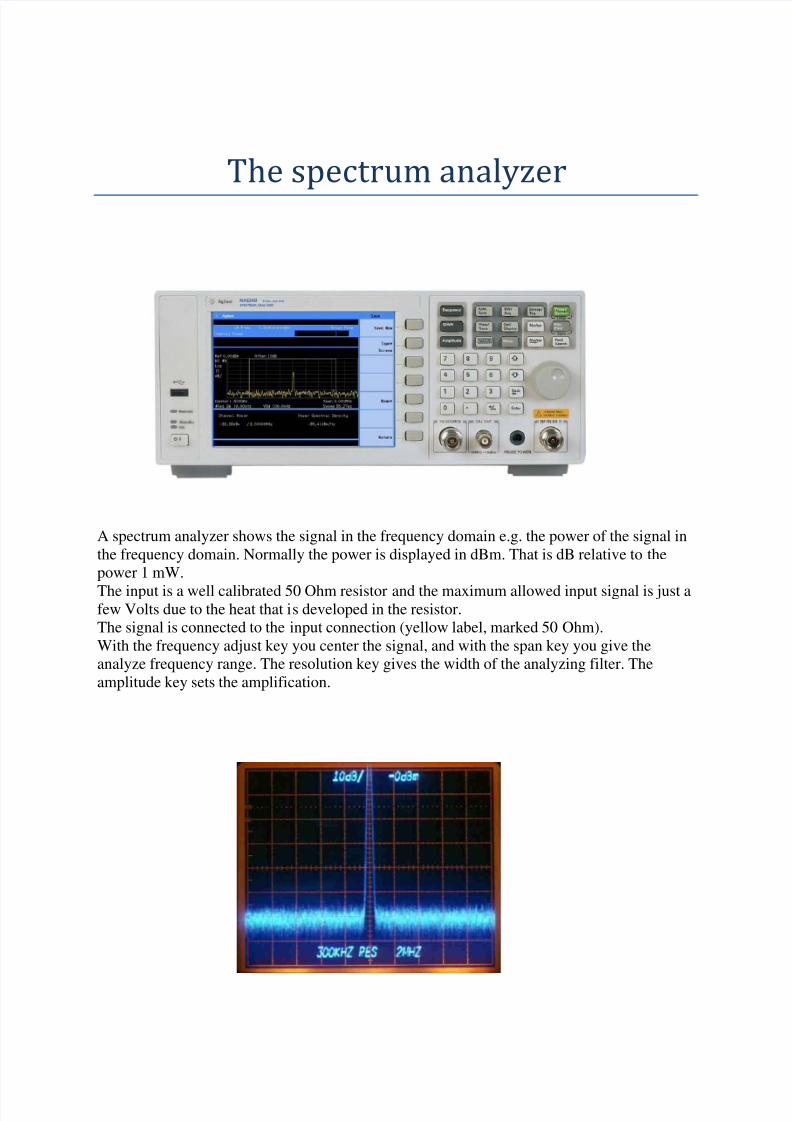
A spectrum analyzer shows the signal in the frequency domain e.g. the power of the signal in
the frequency domain. Normally the power is displayed in dBm. That is dB relative to the
power 1 mW.
The input is a well calibrated 50 Ohm resistor and the maximum allowed input signal is just afew Volts due to the heat that is developed in the resistor.
The signal is connected to the input connection (yellow label, marked 50 Ohm).
With the frequency adjust key you center the signal, and with the span key you give the
analyze frequency range. The resolution key gives the width of the analyzing filter. The
amplitude key sets the amplification.

8/7/2019 Laboration the spectrum analyzer 2010_f
http://slidepdf.com/reader/full/laboration-the-spectrum-analyzer-2010f 2/11
A general overview of time and frequency
The general idea is to show how you can work with a spectrum analyzer to make visiblesignals in the frequency domain. The spectrum analyser is a basic instrument, which you need
to be able to manage in order to get correct information of a signal. The spectrum analyser
shows the frequency components of a signal with a very high dynamic resolution in the
amplitudes of different signal components. In contrast the oscilloscope shows the signal in
time domain with a very poor dynamic resolution but the time resolution is very good in
opposite to the spectrum analyser.
Spectrum Analyzer Basics Copyright2000
OverviewFrequency versus Time Domain
t i m e
Amplitude(power) f r e q
u e n c y
Time domainMeasurements Frequency DomainMeasurements
The
oscilloscope
The spectrum
analyzer
8/7/2019 Laboration the spectrum analyzer 2010_f
http://slidepdf.com/reader/full/laboration-the-spectrum-analyzer-2010f 3/11
The first experiment
We start with to learn how to use the ”frequency” and ”span” controls. We also
work with the scaling of the spectra.
On the laboratory place there is a spectrum analyzer and a signal generator
Now put on the signal generator and adjust the frequency to 100 MHz and the amplitude to
100 mV. No modulation of the signal.
Put on the spectrum analyzer and connect the signal from the output of the signal generator to
the input of the spectrum analyser.
Measure the signal with the signal analyzer with the use of the frequency and span controls.
Measure the level and the frequency of the signal by using the marker-function.
Determine if the amplitude level is correct and if the source-signal is a 100 mV:s signal?
Calculate if the reading corresponds to the amplitude 100 mV.
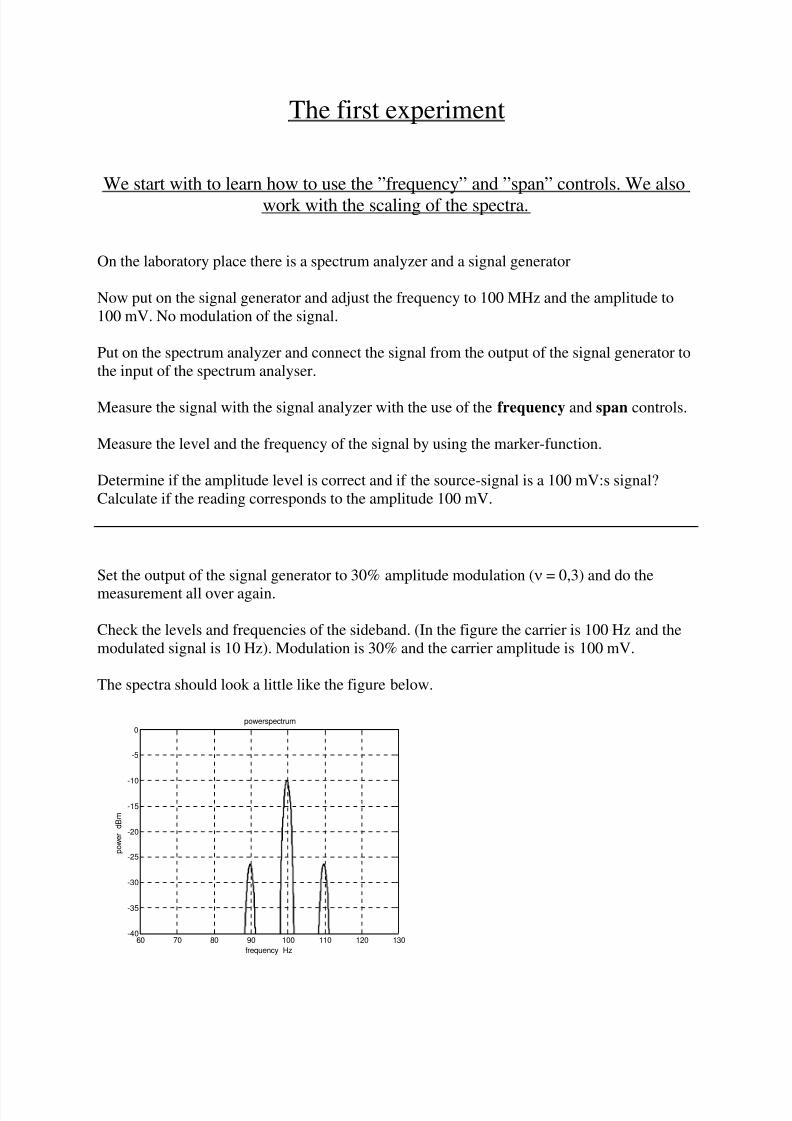
Set the output of the signal generator to 30% amplitude modulation (ν = 0,3) and do the
measurement all over again.
Check the levels and frequencies of the sideband. (In the figure the carrier is 100 Hz and the
modulated signal is 10 Hz). Modulation is 30% and the carrier amplitude is 100 mV.
The spectra should look a little like the figure below.
60 70 80 90 100 110 120 130-40
-35
-30
-25
-20
-15
-10
-5
0
frequency Hz
p o w e r d B m
powerspectrum

8/7/2019 Laboration the spectrum analyzer 2010_f
http://slidepdf.com/reader/full/laboration-the-spectrum-analyzer-2010f 4/11

8/7/2019 Laboration the spectrum analyzer 2010_f
http://slidepdf.com/reader/full/laboration-the-spectrum-analyzer-2010f 5/11
We will continue and examine what a spectrum analyzer can be used for.
Three typical areas are measurement of modulations, measurement of noise levels, anddistortion measurement.
If we start with an analysis of a carrier wave you can select an appropriate centre frequency
withFrequency control and adjust the span as you think is good.
But the signal as you see is much narrower than what the plot shows, and it is due to the fact
that the filter shapes the plot that you see on the screen.
If you vary the resolution bandwidth you can get a
much better/more correct picture of the signal.
With the Res/BW control you analyse the signal in a
more “narrow” scale. The price you pay is time.
Noise level
8/7/2019 Laboration the spectrum analyzer 2010_f
http://slidepdf.com/reader/full/laboration-the-spectrum-analyzer-2010f 6/11
Measuring the noise level
Set the RF out off on the signal analyzer and set the frequency to 1 GHz and the span to 100
MHz on the spectrum analyzer. Press the Res/BW and lower it from a 1 MHz to 10 kHz.
Notice the difference in the time of analyse (sweep time) when you lower the resolution
bandwidth, and make a not off what happens to the noise level? (See figure at previous page)
Put the screen at the spectrum analyser in “maximum hold” and measure the level of noise at
different filter bandwidths.
Your mission is to make a conclusion on how many dB the noise level changes when you
reduce the bandwidth of the filter (resolution bandwidth). Make also a note of how the sweeptime changes. How many dB is the change in the noise level if you reduced the bandwidth by
a factor 10?
The analyser sets the sweep time automatically in order to minimize the error due to a fast
frequency sweep and a narrow filter in order to minimize the amplitude error.
If you on the other hand choose the sweep time to long it costs too much time but no extras is
added.

8/7/2019 Laboration the spectrum analyzer 2010_f
http://slidepdf.com/reader/full/laboration-the-spectrum-analyzer-2010f 7/11
In this experiment the mission is to measure the bandwidth of the GSM signal
from a cellular phone or the bandwidth of a signal from a WLAN - or Bluetooth
network
Apply the rubber antenna to the input of the spectrum analyzer. Notice that the adapter of the
antenna has a special “homemade” male adapter. (an extra pin, sv: löst stift )
Set up a transmission between two telephones or use the local wlan net to set up a
transmission in the neighbourhood of the spectrum analyser. (a few meters), or why not use
the Bluetooth communication between two mobile phones.
You can make the display memorise the different plots that comes from different packages
that are transmitted from your phone. My figure only shows three added plots, there are more
to be seen. Use the maximum hold function.
First you simply have to find at what frequencies or frequency band you can find the
frequencies of interest. Both the frequency control and the span control have to be adjusted.
Now, if you take a narrow resolution bandwidth you might never find the signal packages.
And if you choose the resolution bandwidth very wide the resolution won’t be good enough.
You just have to try out the best compromise.
I want to know which frequencies are used and how many. I also want to know the bandwidth
of each frequency.
8/7/2019 Laboration the spectrum analyzer 2010_f
http://slidepdf.com/reader/full/laboration-the-spectrum-analyzer-2010f 8/11
Länkar;
http://www.educatorscorner.com/tools/lectures/slides/sabas.shtml
http://we.home.agilent.com/cgi-bin/bvpub/agilent/library/cp_Library.jsp?prevSearchString=&prevSearchInterestArea=&LAN
GUAGE_CODE=eng&NAV_ID=-
11145.0.03&COUNTRY_CODE=ZZ&searchString=spectrum&searchInterestArea=-11145
http://www.tmintl.agilent.com/demo/flash/sim/
http://www.tm.agilent.com/data/static/eng/tmo/Notes/interactive/an-150-1/index.html
8/7/2019 Laboration the spectrum analyzer 2010_f
http://slidepdf.com/reader/full/laboration-the-spectrum-analyzer-2010f 9/11
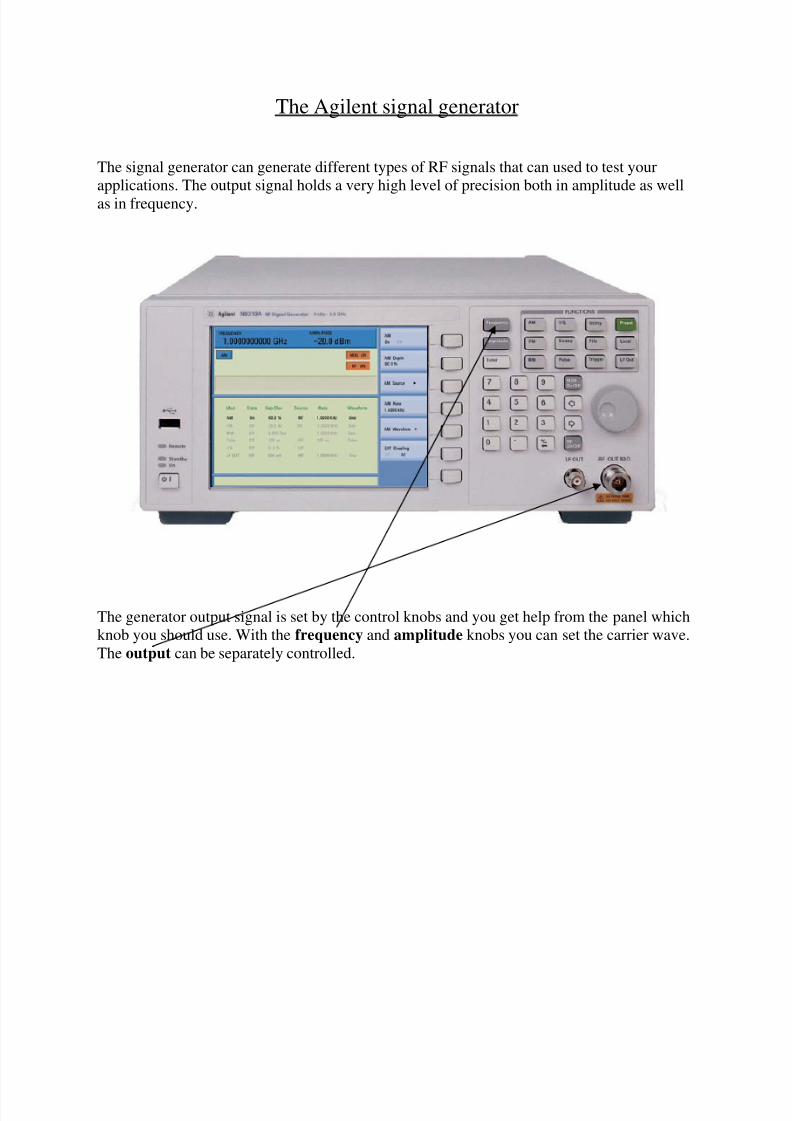
The Agilent signal generator
The signal generator can generate different types of RF signals that can used to test your
applications. The output signal holds a very high level of precision both in amplitude as well
as in frequency.
The generator output signal is set by the control knobs and you get help from the panel which
knob you should use. With the frequency and amplitude knobs you can set the carrier wave.
The output can be separately controlled.
8/7/2019 Laboration the spectrum analyzer 2010_f
http://slidepdf.com/reader/full/laboration-the-spectrum-analyzer-2010f 10/11
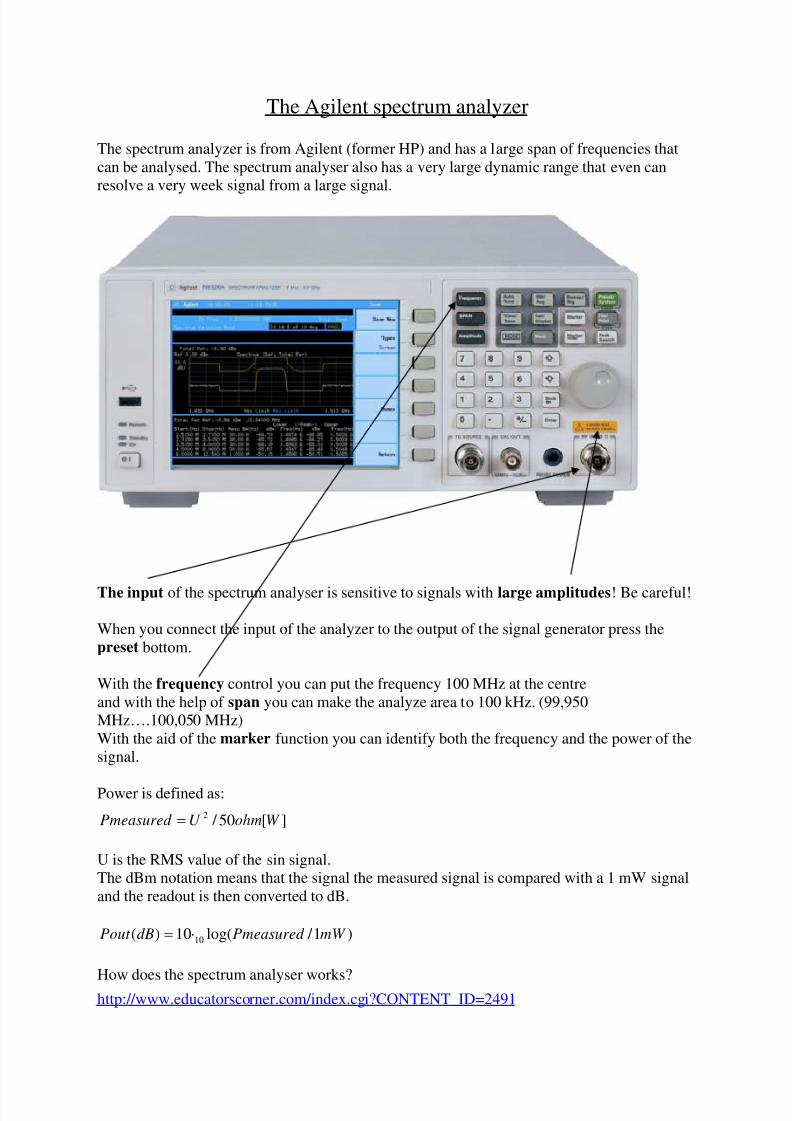
The Agilent spectrum analyzer
The spectrum analyzer is from Agilent (former HP) and has a large span of frequencies that
can be analysed. The spectrum analyser also has a very large dynamic range that even can
resolve a very week signal from a large signal.
The input of the spectrum analyser is sensitive to signals with large amplitudes! Be careful!
When you connect the input of the analyzer to the output of the signal generator press the
preset bottom.
With the frequency control you can put the frequency 100 MHz at the centre
and with the help of span you can make the analyze area to 100 kHz. (99,950
MHz….100,050 MHz)
With the aid of the marker function you can identify both the frequency and the power of the
signal.
Power is defined as:
][50 / 2 W ohmU Pmeasured =
U is the RMS value of the sin signal.
The dBm notation means that the signal the measured signal is compared with a 1 mW signal
and the readout is then converted to dB.
)1 / log(10)( 10 mW Pmeasured dBPout ⋅=
How does the spectrum analyser works?http://www.educatorscorner.com/index.cgi?CONTENT_ID=2491
8/7/2019 Laboration the spectrum analyzer 2010_f
http://slidepdf.com/reader/full/laboration-the-spectrum-analyzer-2010f 11/11
Data for the spectrum analyzer:
Professional performance for spectrum analysis from 9 kHz to 3 GHz• Minimum non-zero span sweep time: < 10 ms
• Resolving power RBW: 10 Hz to 1 MHz
• Sensitivity DANL: -130 dBm, -148 dBm with preamp on• Overall amplitude accuracy: ±1.5 dB, typical ±0.5 dB
Here you can note that the analyzer can handle signals up to 3 GHz with a resolution of 10 Hz
and with a very high dynamic capability (-130 dBm). (The dynamic capability for the
oscilloscope is very poor due to the eight bit A/D converter.)
Link to Agilent;
http://www.home.agilent.com/agilent/product.jspx?id=1433597&pageMode=OV&pid=14335
97&lc=swe&ct=PRODUCT&cc=SE&pselect=SR.PM-
Search%20Results.Key%20Specifications