laboratory astrophysics on the z pulsed power facility
TRANSCRIPT

S a n d i a N a t i o n a l L a b o r a t o r i e s
28 July 2009
Laboratory Astrophysics on the Z Pulsed Power Facility
Gregory A. Rochau Workshop on Science with High-
Power Lasers and Pulsed Power
800 900 1000 1100 1200 1300 0.0
0.2
0.4
0.6
0.8
1.0
Sandia is a multiprogram laboratory operated by Sandia Corporation, a Lockheed Martin Company,
for the United States Department of Energy’s National Nuclear Security Administration under contract DE-AC04-94AL85000.

…S T Pai
& Qi
Zhang, “Introduction to High Power Pulse Technology,”World Scientific Publishing Co., Singapore, 1995.
Energy Store Pulse Forming
Pulse Transmission
Load TargetFastSwitch
SlowSwitch
Low Electrical PowerUp to 107 J –
106 WHigh Electrical PowerUp to 107 J –
1014 W
Pulsed power is the temporal compression of electrical energy to produce short bursts of high power.
Take the equivalent energy required to operate a TV for a few hours (1-2 MJ) and compress it into more electrical power than provided by all the power plants in the world combined (~15 TW).

Pulsed power has been investigated for over a century.
Tesla’s Lab (GW) ZR facility {SNL}Z-pinch (100 TW)
1900 1920 1940 1960 1980 2000Radar (MW)•Germany•US•Russia•Great Brittain
WWIIHermes -
II
{SNL}e-beam (TW)
PBFA -
II
{SNL}Ion Beams (20 TW)
Angara -
II
{Russia}Simulator (TW)
DARHT
{LANL}Radiography (10 GW)

Current
B-Field
JxB Force
StagnationImplosionInitiation
kinetic and electrical energy
internal (shock heating)
x rays
electrical energy
kinetic energy •
Z-pinch loads–
Gas puffs–
Foils–
Low density foams–
wire arrays
•
Ex-ray ≈
0.15 Eelectrical
Z-pinch implosions effectively convert electrical energy into radiation
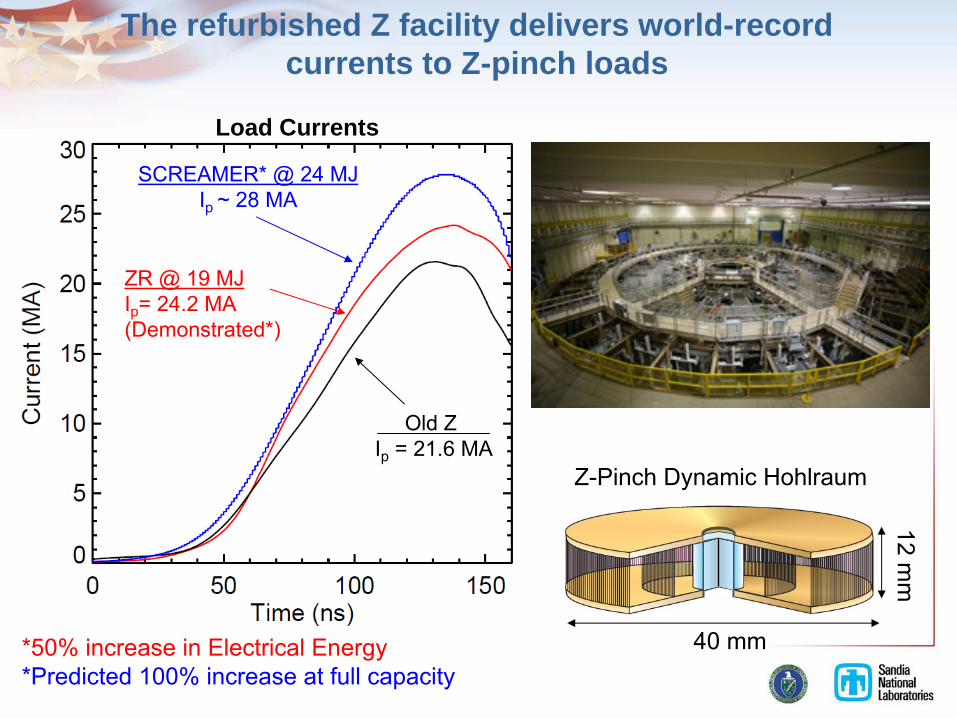
The refurbished Z facility delivers world-record currents to Z-pinch loads
Load Currents
Old Z Ip
= 21.6 MA
SCREAMER* @ 24 MJIp
~ 28 MA
ZR @ 19 MJIp
= 24.2 MA(Demonstrated*)
*50% increase in Electrical Energy*Predicted 100% increase at full capacity
Z-Pinch Dynamic Hohlraum
40 mm
12 mm

The Z facility has an extensive suite of standard diagnostics
X-ray Power and EnergyFiltered X-ray Diodes (XRDs)……………….
< 4 keV
PowerPhoto-Conducting Diamonds (PCDs)..……..
> 1 keV
PowerSilicon Diodes (TEP)………………………….
Broad-band PowerBolometers…………………………................
Broad-band Energy
X-ray SpectroscopyElliptically Curved Crystals……………………
0.7-10 keV
Time-gatedConvex Curved Crystals.……………………..
0.7-10 keV
Time-integratedSpherically Curved Crystals.…………………
0.7-10 keV
Time-integratedTransmission Crystals………………………… > 10 keV
Time-integrated
X-ray ImagingFiltered Pinhole Cameras…………………….. > 0.7 keV
Time-gatedMulti-layer Mirror Pinhole Cameras………….
0.277±0.003
keV
Time-gated
X-ray BacklightingPoint-projection…………………………………two-frame @ ~1kJ ea.1 or 2-color Monochromatic Imaging.............. two-frame @ ~1kJ ea.
Fiber-Based Velocity Interferometry (VISAR)


240/120 TungstenWire Arrays
4 mm
CH2
• Ip
> 21 MA• 18 radial slots (x-ray exit holes)• 1 axial aperture• High internal temperature
ZPDH Source
Sanford et al., POP 9 (2002)Bailey et al., POP 13 (2006)Lemke et al., POP 12 (2004)Slutz
et al., POP13 (2006)Rochau et al., PPCF 49 (2007)
40 mm
190 ±
20 TW1007 ±
100 kJ(8 shots)
120 ±
17 TW823 ±
140 kJ(28 shots)
Radial Power on Z and ZR
The Z-pinch Dynamic Hohlraum (ZPDH) is an energetic and reproducible x-ray source.

240/120 TungstenWire Arrays
4 mm
CH2
• Ip
> 21 MA• 18 radial slots (x-ray exit holes)• 1 axial aperture• High internal temperature
ZPDH Source
10.2 ± 0.13 TW
> 100 kJ
Axial Power and Energy on Z
40 mm
*Axial power not yet conclusively measured on ZR
Sanford et al., POP 9 (2002)Bailey et al., POP 13 (2006)Lemke et al., POP 12 (2004)Slutz
et al., POP13 (2006)Rochau et al., PPCF 49 (2007)
The Z-pinch Dynamic Hohlraum (ZPDH) is an energetic and reproducible x-ray source.

240/120 TungstenWire Arrays
4 mm
CH2
• Ip
> 21 MA• 18 radial slots (x-ray exit holes)• 1 axial aperture• High internal temperature
ZPDH Source
40 mm
Experimental
Clean RMHD Model
RMHD Model w/ R-Tperturbation
Internal Tr of ZPDH on Z
*Internal Tr
not yet measured on ZR
Sanford et al., POP 9 (2002)Bailey et al., POP 13 (2006)Lemke et al., POP 12 (2004)Slutz
et al., POP13 (2006)Rochau et al., PPCF 49 (2007)
The Z-pinch Dynamic Hohlraum (ZPDH) is an energetic and reproducible x-ray source.

1015
1020
1025
1030
1010
108
106
104
102
Tem
pera
ture
(K)
Density (cm-3)
The Z facility provides a wide range of energy densities – Flexibility for Lab Astro
Neutron Star Atmospheres
GiantPlanets
Hot Neutron Star Interiors
High Energy Density RegimePtotal
> 1011
N/m2
= 1 Mbar
Sun60 M(sun)
Room Air
Z Experiments

Foord
et al., PRL 93 (2004)
High resolution imaging ofradiation driven jets
Bennett et al., RSI 77 (2006)
Rad Jets Photoionized PlasmaEOSD2 EOS relevant to giant
planet interiors.Rad dominated plasmas
relevant to accretion objects
Knudson et al., PRL 87 (2001)
Z provides multiple platforms for a variety of laboratory astrophysics experiments.
B-
Driven ICE & Flyer Plates Double Ended Hohlraum
Fe absorption
~ 20 erg cm/s
Wire-Array Z-Pinch Source
FeC15
H12
O4foam
Backlit image
D e n s i t y C o m p r e s s io n
2 3 4 5 6 7
Pres
sure
(GPa
)
0
5 0
1 0 0
1 5 0T BR o s sS e s a m e 7 2L a s e rD e s ja r l a i sK e r l e y 0 3R u s s ia n ( l )R u s s ia n ( s )v a n T h i e lD i c kN e l l i sZP IM C
Reduced VISAR data

Stellar Envelope OpacityOpacity of Fe in envelope around
Cepheid Variable stars.
Springer et al., JQSRT 58 (1997)
Saturn Z-pinch Secondary Hohlraum
Solar Interior OpacityOpacity of Fe at the boundary between
the solar radiation and convection zones.
Bailey et al., PRL 99 (2007)
Z-pinch Dynamic Hohlraum
800 900 1000 1100 1200 1300 0.0
0.2
0.4
0.6
0.8
1.0
DataModel
h
sample
Z provides multiple platforms for a variety of laboratory astrophysics experiments.

T(eV) ne (cm-3) r/R0
1360 6x1025 0
182 9x10²² 0.713
Solar model : J.N. Bahcall et al, Rev. Mod. Phys. 54, 767 (1982)
Transport depends on opacity, composition, ne, Te
An astrophysical issue: The ‘CZ problem’
• measured boundaryRCZ = 0.713 + 0.001
• Predicted RCZ = 0.726
• Thirteen
difference
“The CZ problem”
• 10-20% higher opacity?
Springer’s experiment
54 1x10²² 1.0

• Base of solar convection zone: Te ~ 193 eV, ne ~ 1023 cm-3
• Most important elements: O, Ne, Fe• Fe is the most complex and therefore the most suspect• Fe charge states: +16, +17, +18 ( Ne-like, F-like, O-like) • Photon energy range h
~ 700-1400 eV• Atomic processes: L-shell bb transitions and bf transitions
Definition of a laboratory astrophysics experiment to address the ‘CZ problem’

The Z-pinch Dynamic Hohlraum (ZPDH) provides a platform for high temperature opacity experiments.
An experiment platform• Source characterization
• Diagnostic methods-instrumentation-analysis methods
• Peer ReviewSampleTe
up to 190 eVBailey et al. , PRL 99 (2007)
SampleTe
up to 50 eVRochau et al., PRE 72 (2005)Bailey et al., JQSRT 81 (2003)

Electron Temp.
Radiation Temp.
shockfront
TungstenZ pinch
Radius (cm)0.0 0.2 0.4 0.6
Current Flow
2-D RMHD Simulation
The Dynamic Hohlraum is formed by an imploding Z pinch, and heated by a strong radiating shock.
1.2 cm
CH2 Foam

A reproducible radiating shock is the source of x-ray energy for the Z-pinch dynamic hohlraum.
Tungsten
ShockedFoam
UnshockedFoam
Framing Pinhole Camera Images
skm 25326su
< 8% shot-to-shot standard deviation
Rochau et al., PRL 100 (2008)
Radiating Shock Image SNR 1987a
3
1
shock
therm
rad
MPP

Foil is heated during the ZPDH implosion
Foil is backlit at shock stagnation
OpacityFoil
The ZPDH shock is used to drive and backlight opacity experiments at Te > 150 eV.
Bailey et al., POP 16 (2009)

Opacity measurements require reproducibility in source power (heating) and spectrum (backlighting).
Mg Fe
Wavelength (Å)
Unattenuatedspectrum
Absorption spectrafrom 2 separate shots
Time-integratedConvex CrystalSpectrometer
Fe+Mg
foil

7.847.80 7.86(Å)
He-
line profile
He
Ly Ly He
He He
0.2
0.4
0.6
0.8
0.2
0.4
0.6
0.8
0.2
0.4
0.6
0.8
tran
smis
sion
tran
smis
sion
tran
smis
sion
OPAL
OPAS
PrismSPECT
(Å)7.0 7.5 8.0 8.5
Mg K-shell spectra indicate Te = 156 eV and ne = 7*1021 cm-3.
Voigt
-
2
= 5.5Mancini
-
2
= 1.2

800 900 1000 1100 1200 1300 0.0
0.2
0.4
0.6
0.8
1.0
800 900 1000 1100 1200 1300 0.0
0.2
0.4
0.6
0.8
1.0
800 900 1000 1100 1200 1300 0.0
0.2
0.4
0.6
0.8
1.0
800 900 1000 1100 1200 1300 0.0
0.2
0.4
0.6
0.8
1.0
800 900 11001000 1200
MUTAJ. Abdallah, LANL
OPALC. Iglesias, LLNL
PRISMSPECTJ. MacFarlane, PRISM
OPASOPAS team, CEA
0.4
0.8
0.4
0.8
0.4
0.8
0
0.4
0.8
The measured Fe transmission compares well with models from LANL, LLNL, CEA, and PRISM.
Bailey et al., PRL 99 (2007)h
(eV)
Tran
smis
sion

Z experiments reproduce the iron charge states at the Solar CZ boundary
Fe charge state
frac
tion
+14(Mg)
+15(Na)
+16(Ne)
+17(F)
+18(O)
+19(N)
0.0
0.1
0.2
0.3
0.4
Z conditions156 eV, 7 x 1021 cm-3
Solar CZ boundary193 eV, 1 x 1023 cm-3
800 900 1000 1100 1200 1300 0.0
0.2
0.4
0.6
0.8
1.0

1000 1100 1200 13000.2
0.4
0.6
0.8
h
(eV)
Z dataOP2 = 16
Z dataOPAS2 = 3.7
Tran
smis
sion 0.4
0.6
0.8
• OP Rosseland mean is ~ 1.5x lower than OPAS at Z conditions.
• If this difference persisted at the exact CZ conditions, it would solve the CZ problem
The OP model used in solar research predicts Fe L-shell opacity that is too low at Z conditions
T = 156 eV, ne = 7 x 1021 cm-3

At the base of the convection zone (T=193 eV, ne =1023cm-3):• Iron frequency-dependent opacities possess some differences.
• Rosseland mean opacities are not significantly different, even though they disagree at Z conditions.
h(eV)
(c
m2 /g
)
OP -
R
=2606 cm2/g
OPAS -
R
=2646 cm2/g
OPAL -
R
=2731 cm2/g
Discrepancies at Z conditions raise a caution flag for solar opacities
T = 193 eV, ne = 1023cm-3

The higher power ZPDH on ZR heats opacity foils to ~20% higher temperatures than achieved on Z.
Mg K-shell absorption from a Mg/Fe foil
He-
Ly-He-
He-
Z
ZR
He-
He-
Line Widths
• Higher Ly/He ratios indicate ~20% increase in Te
• Broader high-n lines indicate ~300% increase in ne
Preliminary comparisons indicate Te
~ 190 eV, ne
~ 3x10²²
cm-3

Pulsed power sources are gaining recognition as effective drivers for laboratory astrophysics
2010 Joint OFES-NNSA HEDLP grants for laboratory astrophysics related to Z:
-Mancini et al., UNR, Photo-ionized plasmas (Accretion disks)
-Pradhan
et al., OSU, Laboratory Tests of Stellar Interior Opacity Models
-Bailey et al., SNL, Laboratory Tests of Stellar Interior Opacity
Models
-Frank et al., IC, Astrophysical Jets

Extra Slides

J.E. Bailey, M. Cuneo, G. Bennett, D. Ampleford, S.B. Hansen, P.W. Lake, T.J. Nash, D.S. Nielsen, J. Porter, M. HerrmannSandia National Laboratories
C.A. Iglesias, P. Springer, R. HeeterLawrence Livermore National Laboratory
J. Abdallah Jr., M.E. Sherrill, B. WildeLos Alamos National Laboratory
J.J. MacFarlane, I. Golovkin, P. WangPrism Computational Sciences
R.C. Mancini, I. Hall, T. DurmazUniversity of Nevada, Reno, NV
C. Blancard, Ph. Cosse, G. Faussurier, F. Gilleron, J.C. PainCEA, France
D. Cohen, M. RosenbergSwarthmore College
A.K. Pradhan, S.N. Nahar, M. PinsonneaultOhio State University
Y. Maron, E. Stambulchik, D. Fisher, V. FisherWeizmann Institute, Israel
Many People and Institutions Contribute

The anatomy of a Z-pinch source

1015
1020
1025
1030
1010
108
106
104
102
Tem
pera
ture
(K)
Density (cm-3)
ICF capsulesRadiating ShocksFe OpacityMaron
B-field
107
N/m2
equivalent from Bailey Stark-
shift
The Z facility provides a wide range of energy densities – Flexibility for Lab Astro
Neutron Star Atmospheres
GiantPlanets
Neutron StarInteriors
High Energy Density RegimePtotal
> 1011
N/m2
= 1 Mbar
Sun60 M(sun)
Z Experiments

Mg foils at three azimuths show a consistent radial x-ray energy.
LOS 13/14LOS 21/22LOS 1/2 2
max ~ 1.1
x = 0.25mg/cm2
Rochau, Ph.D. Thesis (2003)

The shock stagnation makes a bright, featureless, continuum backlighter.
Bailey et al., POP 16 (2009)

Sample electron temperatures are reproducible to < 4%.
Foil temperatures from 10 shots over 3 yrs
Over all shots:T
= 3.8%, P
~ 15%
TdT
PdP 4 Mg Ly
Mg He
Mg He
Mg He
DataCalc
Mg Absorption Spectrum
156 ± 6 eV

Photo-ionized plasma research is a success story for external user experiments on Z
• Initial work by M. Foord
and R. Heeter:Fe at
~ 20 erg cm/sFoord et al., PRL 93 (2004)
• Stockpile Stewardship Academic Alliances Grant:R. Mancini, 2007-2009Ne at
~ 4-10 erg cm/sHall et al., Astro. Space Sci. 322 (2009)
• High Energy Density Laboratory Physics Grant:R. Mancini, 2010-2012
Z-pinch Source
Neon Gas Cell
Photo-ionized Ne Spectrum

Measurements of Fe at Te ~ 20 eV benchmarked opacity calculations for stellar envelopes.
20 eV
secondary hohlraum
Springer et al., JQSRT 58 (1997)
Fe sample at ~10-4
g/cc
•
Detailed line-by-line treatment is required to match even the bulk transmission.
•
Critical temperature and density regime for Stellar envelopes.
-
Rogers and Iglesias, Science 263 (1994)
Z pinch
STA
OPAL-DTA
OPAL-UTA
Tran
smis
sion
1.0
0.8
0.6
0.4
0.2
0.0
1.0
0.8
0.6
0.4
0.2
0.065
70
75
80
85
65
70
75
80
85
Energy (eV)
DATA