laboratory exams in the diagnosis of cns infections dr paul matthew pasco june 7, 2008
TRANSCRIPT

Laboratory exams in the diagnosis of CNS infections
Dr Paul Matthew Pasco
June 7, 2008

Lab exams for bacterial meningitis CSF GS/CS CSF cytology (+) of bacterial antigens in CSF Neuroimaging Molecular techniques (PCR)

CSF culture & sensitivity
Gonzaga (1967): (+) in 57/85 patients Pneumococcus in 26%; G(-) bacilli in 33%
Punsalan (1988) = (+) in 9/12 Handumon (2000) = (+) in 11/50 adults
Reyes (1979): 82 children Most common: G(-) bacilli in 53.7% Others: S. pneumoniae, N. meningitidis
Kho (1992): 50 culture-proven cases; G(+) in 62% (S. pneumoniae), G(-) in 38%

CSF cytology & GS (Reyes 1986)

CSF cytology & GS (Reyes 1986)
SENS = 81% SPEC = 34%
SENS = 85% SPEC = 51%

How do we use sensitivity & specificity? SnNout = for a test with high sensitivity, a
negative result rules out the diagnosis SpPin = for a test with high specificity, a
positive result rules in the diagnosis A perfect test is both a SpPin & SnNout A useless test: SENS + SPEC – 100 = 0

CSF cytology & GS (Reyes 1986)
PPV = 44%
NPV = 73%
PPV = 63%
NPV = 77%

Likelihood ratios
LR(+) = probability of (+) test for a person with the diseaseprobability of (+) test for a person
without the disease
LR(-) = probability of (-) test for a personwith the disease
probability of (-) test for a personwithout the disease

Likelihood ratios
For cytology: LR(+) = 22/27 = 1.23
27/41
LR(-) = 5/27 = 0.54 14/41
For gram stain: LR(+) = 23/27 = 1.77
13/27
LR(-) = 4/27 = 0.29 14/27
Not very good!

A likelihood ratio nomogram

How do we estimate our patient’s pre-test probability of having the disease? Clinical experience Local prevalence statistics Information from databases Original studies to assess diagnostic tests Studies devoted specifically to determining
pre-test probabilities

Etiology of CNS infections in 7 hospitals (Punsalan 1999) (892 cases) Bacterial meningitis – 29.9% TB meningitis – 28.9% Meningitis unspecified – 12.2% Viral meningitis – 10.5% Brain abscess – 8.1% Cryptococcal meningitis – 2.0% Tuberculoma – 1.6% Others – 3.3%

Local experience in bacterial meningitis (Handumon 2000) Typical clinical picture:
Drowsy, 50% Meningismus, 85% Seizure, 26% Focal neurological deficit, 18% Fever + headache + sensorial change, 85%

Bacterial antigens in CSF (Garcia 1988) Phadebact, with culture as gold standard:
Sensitivity = 83% Specificity = 93% PPV = 83% NPV = 93%
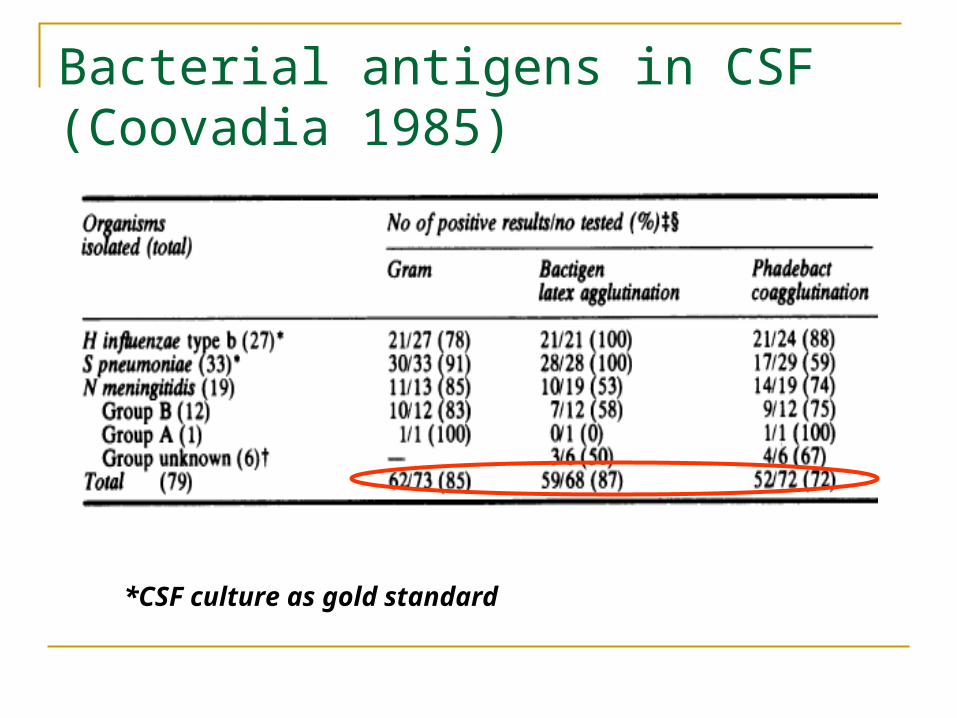
Bacterial antigens in CSF (Coovadia 1985)
*CSF culture as gold standard

Other tests on CSF
CSF CRP: sensitivity of 61%, specificity of 100%, PPV of 100%, NPV of 80% (Changco 1987)
CSF leukocyte esterase: sensitivity of 100%, specificity of 93%; CSF nitrite: specificity and NPV of 85% (Tan 1997)
CSF pH: decreased in 10/11 cases of purulent meningitis (Espiritu 1986)

Neuroimaging
CT scan of head: Not routinely done Only to rule out other causes of CNS infection
Cranial ultrasound (Lee 2001): 95 culture-proven cases Wide and highly echogenic sulci = 87% Convexity leptomeningeal thickening = 86% Hydrocephalus = 62% Extra-axial fluid collection = 8-48%

Other tests
GS/CS from throat and petechiae (esp. for meningococcal disease) and blood
Serum CRP (Sutinen 1998): elevated CRP (>10 mg/ml) has 100% sensitivity in 19 cases of bacterial meningitis (but may be low in early stages of infection)
Molecular techniques – not available locally PCR for N. meningitidis & S. pneumoniae Quantitative PCR to determine bacterial load?

How should lab results help us in management of CNS infections?
*Lab results should help us cross a threshold;*We may have to performseveral tests to cross athreshold.

Viral encephalitis
Standard cell culture Brain biopsy Serologic diagnosis: detect a 3-fold or more
increase in specific antibody production CSF ELISA & PCR – how to determine
sensitivity and specificity?

Problem: no single lab test or clinical feature can distinguish between different types of CNS infections
Solution: propose clinical decision rules which combine clinical and simple laboratory features

Clinical decision rules to distinguish between bacterial and viral meningitis (Dubos 2006)

Decision rule by Nigrovic (2002)
*BMS > 2 predicts bacterial meningitis with 100% sensitivity

Lab exams for tuberculous meningitis CSF AFB smear and TB culture CSF qualitative & quantitative exams ELISA – to detect IgG antibodies to
mycobacterial antigens in CSF PCR – to detect mycobacterial DNA elements Neuroimaging

CSF TB culture
Montoya (1991) – (+) in 4/17 clinically presumptive cases of TBM
Pasco (2007) – (+) in 3/63 probable TBM De Guzman (2005) – MGIT mycobacterial
culture system: using a surrogate gold standard, 75% sensitive and 31% specific

ELISA for TB meningitis
Montoya (1991) – 30 kDa native antigen: (+) in 3 of 4 definite TBM, (-) in all normal & non-TBM cases
Valenzuela (2000) – 38 kDa antigen: (+) in 1 of 1 definite TBM; specificity of 72%
Montoya (2000) – antigen A60: 3 definite cases; 100% sensitive and 94% specific

The Polymerase Chain Reaction (PCR) Technique

PCR for TB Meningitis
Montoya (1997) – (+) in 7/8 culture-proven TB Meningitis; no data in non-TBM
Pasco (2007) – 63 probable TBM: 3/63 (+) by smear or culture, 14/63 (+) by PCR; 2/3 definite TBM also (+) by PCR
Udarbe-Agustin (2004) – 3/6 definite TBM (+) by PCR
Montoya (2001) – 9 definite TBM: 1 (+) by Amplicor, 2 (+) by nested PCR
Meta-analysis by Pai (2003) – sensitivity is 56%, specificity is 98%

CT scan in TB Meningitis
Malazo (1995) – 30 children with TBM: 28 had hydrocephalus, 14 had basal exudates, 2 were normal
Kumar (1996) – compared CT scans of 94 children with TBM and 52 with pyogenic meningitis: basal meningeal enhancement, tuberculoma, or both, were 89% sensitive and 100% specific for TBM

Clinical decision rules in TBM Kumar (1994) – 110 Indian children with TBM and 94 with non-TBM; predictive of TBM:
Symptoms > 6 days Optic atrophy Focal neurological deficit Abnormal movements Neutrophils < 50% of CSF WBC count
Thwaites (2002) – 143 Vietnamese adults with TBM & 108 with non-TBM; predictive of TBM: Age > 36 Blood WBC < 15,000 Symptoms > 6 days CSF WBC < 750 CSF neutrophils < 90%
Pasco (200?) – 300+ Filipino adults with TBM focal deficit (+) PTB on CXR CSF WBC > 50, lymphocytes predominant CSF < 50% serum RBS Increased CSF protein

Cryptococcal meningitis
India Ink & Sabouraud’s culture CALAS titers Lokin (2000) – 8 cases of cryptococcal
meningitis: 8 (+) by India Ink and mucicarmine; after 24h, still (+) by mucicarmine

Summary
Lab results should help us move across a testing or treatment threshold
Use clinical decision rules that combine clinical and laboratory exam results These should not replace the clinician’s skills and
perceptions; They should only be applied after a complete
validation process.