laboratory for machine tools and production engineering€¦ · erp systems are an advancement of...
TRANSCRIPT
Production Management B – Spring Semester 2009 Lecture 01
IT-Systems in Production Management L01 P. 0
Production Management B
Lecture 01IT-Systems in Production Management
Organisation:Dipl.-Ing. M. RittstiegSteinbachstr. 53BRaum 516Tel.: [email protected]
Laboratory for Machine Tools and Production Engineering
Chair of Production EngineeringProf. Dr.-Ing. Dipl.-Wirt. Ing. G. Schuh
Chair of Production ManagementProf. Dr.-Ing. A. Kampker

Production Management B – Spring Semester 2009 Lecture 01
IT-Systems in Production Management L01 P. 1
Index:
Schedule Page 2Glossary Page 3Target of this lecture Page 5Lecture
Development of IT-Systems in PM Page 6Enterprise Resource Planning Page 11Supply Chain Management Page 23Customer Relationship Management Page 31Product Lifecycle Management Page 37Final statement Page 42
Bibliography Page 43

Production Management B – Spring Semester 2009 Lecture 01
IT-Systems in Production Management L01 P. 2
Schedule:
No. Date Responsible
L1 27.04.2009 Mr. Rittstieg 0241 80 20396
L2 04.05.2009 Mr. Bartoscheck 0241 80 28203
L3 18.05.2009 Mr. Fuchs 0241 80 26265
L4 25.05.2009 Mr. Reil 0241 80 27964
L5 08.06.2009 Mr. Potente 0241 80 27387
L6 15.06.2009 Mr. Bauhoff (fir) 0241 47705-439
L7 22.06.2009 Mr. Hoeschen 0241 80 27382
L8 29.06.2009 Mr. Jung 0241 80 27392
L9 06.07.2009 Mr. Rauhut 0241 80 28206
L11 13.07.2009 Mr. Koch 0241 80 25321
L12 20.07.2009 Mr. Cuber (fir) 0241 47705-420
Customer Relations Management
Enterprise Ressource Planning I
Enterprise Ressource Planning II
Topic
IT in Production Management
Enterprise Ressource Planning III
Product Lifecycle Management II
Digitale Plant Planning and Simulation
Business Engineering - Method of selecting IT-Systems (Trovarit)
Supply Chain Management I
Supply Chain Management II
Product Lifecycle Management I

Production Management B – Spring Semester 2009 Lecture 01
IT-Systems in Production Management L01 P. 3
Glossary for the lecture (I/II):
Enterprise Resource Planning (ERP):ERP is an holistic, process orientated software solution, which fulfills the tasks of production planning and control. It provides necessary information for all bordered divisions.
Supply Chain Management (SCM): SCM means the communication of all logistic procedures and functions within the supply chain from the supplier to the consumer with the objective to optimize customer service and minimize costs at the same time. SCM systems connect the entire (enterprise internal and external) supply chain from the raw material supplier up to the final customer, by exchanging all relevant data between the members of the chain.
Customer Relationship Management (CRM):CRM means the holistic relationship of an enterprise with its customers. Communication -, distribution- and supply-oriented policy are not further detached from each other. They have to be aligned at the customer needs in order for a higher customer satisfaction, which represents a criterion for the customer loyalty and thus the enterprise value.
Product Lifecycle Management (PLM):PLM covers the administration and controlling of all product data - along the complete life cycle and the extended logistics chain - from the construction and production over the distribution up to the maintenance. The integrated PLM offers access to all product and process data of the entire life cycle of a product.

Production Management B – Spring Semester 2009 Lecture 01
IT-Systems in Production Management L01 P. 4
Glossary for the lecture (II/II):
Product Data Management (PDM):PDM is a system for product data management. The aim is that all involved parties (e.g. suppliers and manufacturer or several construction engineers) work with the current versions and variants of a complex product. PDM is the superior organization instrument, which can be split into data and process management. Process management goes beyond the passive data management. It describes, manages and controls the interaction between actions and data from events. Data management covers the administration of the data of all application systems. In addition it distributes the data to the users and their right of access.
Product planning and control (PPS):Production planning plans the actions during the production for a certain time in advance under given basic conditions and implementation of given aims.
Workflow-Management: The Workflow management organizes and controls the information flow between the involved places and the processes in an enterprise.

Production Management B – Spring Semester 2009 Lecture 01
IT-Systems in Production Management L01 P. 5
Target of this lecture:
The lecture „IT-Systems in Production Management“ gives a broad overview of the most common IT-Systems in production engineering. The historic development as well as the interfaces between the IT-Systems will be addressed in the first part of the lecture. Afterwards an overview regarding definition, goals as well as main criteria of each type of IT-System will be given. Therefore this lecture can be regarded as a general forecast of the topics addressed in detail in the following lectures of PM B.

Production Management B – Spring Semester 2009 Lecture 01
IT-Systems in Production Management L01 P. 6
Seite 6© WZL/Fraunhofer IPT
Development of the business world under the influence of IT-systems
Enterprise Resource Planning
Cost reduction and efficiency by the integration
of business processes
Cooperation between
enterprises
Efficiency increase by cooperation of the
supply chains
Cooperation between virtual
communities
Added value by co-operation in virtual
communities
Notes:
The integration of IT-systems into the commercial world enables the companies not only interior but also cross-company flow of information and data interchange. These are the conditions for cooperation and virtual networks.

Production Management B – Spring Semester 2009 Lecture 01
IT-Systems in Production Management L01 P. 7
Notes:
- Until 1970 there has been only a technological application. An integration in an IT-system did not take place because of the lacking possibilities.
- Until 1985 the first automated processes has been developed for different sections in a company. An export of machine control data and the integration of this data in a process control application has been possible.
- The SCM was able to create the first connection of the automated processes.- PLM and CRM has been the following optimized stages of development.
Total sales: 2002 4,9 (bn. €) 2006 6,1 (bn. €) (Lünendonk)Total sales: 2002 4,9 (bn. €) 2006 6,1 (bn. €) (Lünendonk)Total sales: 2002 4,9 (bn. €) 2006 6,1 (bn. €) (Lünendonk)Total sales: 2002 4,9 (bn. €) 2006 6,1 (bn. €) (Lünendonk)Total sales: 2002 4,9 (bn. €) 2006 6,1 (bn. €) (Lünendonk)
Seite 7© WZL/Fraunhofer IPT
Past and present
2000 1999
Verk
auf
Prod
uktio
n
Entw
ickl
ung
Fina
nz
…..
Customer Relationship Management (CRM)
Supply Chain Management (SCM)
Product Lifecycle Management (PLM)
Zei
Total sales: 2000 9,7 (bn. €) 1999 8,1 (bn. €) (Müller-Merbach 2002)
Sale
s
Prod
uctio
n
Dev
elop
men
tFi
nanc
e
…
Customer Relationship Management (CRM)
Supply Chain Management (SCM)
Product Lifecycle Management (PLM)
Tim
e
Development of technical and scientific applications until approx. 1970
Automated until approx. 1985
Currentintegrations and optimizations
Total Sales: 2002 = 4,9 bn. € vs. 2006 = 6,1 bn. € (Source: Lünendonk 2007)
Company results of the 15 largest standard software providers in Germany

Production Management B – Spring Semester 2009 Lecture 01
IT-Systems in Production Management L01 P. 8
Seite 8© WZL/Fraunhofer IPT
Market penetration and achievement of objectives
1.8
2
2.2
2.4
2.6
2.8
3
SCM CRM e- Business ERP
Da ERP bei den meistenAnbietern der Basisbaustein
ist, hat es auch die größteDurchdringung
0%
20%
40%
60%
80%
100%
SCM CRM e- Business ERP
0%
20%
40%
60%
80%
100%
SCM CRM e- Business ERP
0%
20%
40%
60%
80%
100%
SCM CRM e- Business ERP
Market penetration
1.8
2
2.2
2.4
2.6
2.8
3
SCM CRM e- Business ERP
Achievement of objectives – from individually self defined objectives
1.8
2
2.2
2.4
2.6
2.8
3
SCM CRM e- Business ERP
1.8
2
2.2
2.4
2.6
2.8
3
SCM CRM e- Business ERP
ERP schneidet vergleichsweise schlecht ab, da:
1. Viele ERP Systeme seit vielen Jahren imEinsatz und daher weniger benutzerfreundlichals die neuen SCM und CRM Systeme sind
2. Wegen der durchgreifenden und
ERP performance is quite poor because:
1. Many ERP systems are already in use for many years which makes them less user friendly than newer SCM and CRM systems
2. Because of the drastic and regularized effect on nearly all processes, ERP is evaluated particularly critically
Da ERP bei den meistenAnbietern der Basisbaustein
ist, hat es auch die größteDurchdringung
Since ERP is the basic component from many software companies, it
has also the largest penetration
Source: Helbing Management Consulting
Notes:

Production Management B – Spring Semester 2009 Lecture 01
IT-Systems in Production Management L01 P. 9
Seite 9© WZL/Fraunhofer IPT
IT in production management
SCM
ERP
CRM
PLM
Enterprise Cus
tom
ers
Resources
Supp
liers
Products
Notes:
IT-Systems create the interface between:- Companies and products via Product Lifecycle Management (PLM)- Companies and customers via Customer Relationship Management (CRM)- Companies and resources via Enterprise Resource Planning (ERP)- Companies and distributors via Supply Chain Management (SCM)

Production Management B – Spring Semester 2009 Lecture 01
IT-Systems in Production Management L01 P. 10
Seite 10© WZL/Fraunhofer IPT
Interaction: Enterprise, suppliers, customers, products
PLM
CRM
SCM
Production CustomersSuppliers
ERP
Notes:
The ERP-system generates the basic component all further systems rely on. Basic data which other IT-systems make use of are deposited in ERP-systems. ERP only deals with company-interior material flows. SCM expands the viewpoint on supplying industries and it also assimilates the flow of material with the supplying industries to ascertain a frictionless logistic-chain. CRM integrates in addition to ERP the customers processes. CRM tries to merge the customer knowledge into the in-house knowledge management and it also tries to increase the customer satisfaction. PLM puts its focus on the main processes from a cross section point of view and it includes all other processes. It enables all users from the entire life cycle of a product to recall the data.

Production Management B – Spring Semester 2009 Lecture 01
IT-Systems in Production Management L01 P. 11
Seite 11© WZL/Fraunhofer IPT
IT im Produktionsmanagement – Enterprise Resource Planning
ERP is an holistic, process orientated software solution, which manages, controls and evaluates the business activities. ERP systems are an advancement of the production planning & control systems (PPS) and the material requirements planning (MRP).
Main features
Objectives
Definition
• Solutions try to cover and illustrate information flows (capital, production, input/output etc.) in the enterprise as a whole
• Detection of bottlenecks• Optimal workload of all resources - personal, machine, material, capital
• Supports the departments production, distribution, logistic, human resources, administration
• Large quantity of given basic functionality
• Presents the basis for further management programs
Anmerkungen zur Folie:
Top 3 ERP-Softwareanbieter nach umsatzbezogenem Marktanteil in Deutschland im Jahr 2006:- SAP (54,8%)- Infor (5,5%)- Microsoft (3,8%)
Quelle: http://www.computerwoche.de/top_100/software/546025

Production Management B – Spring Semester 2009 Lecture 01
IT-Systems in Production Management L01 P. 12
Seite 12© WZL/Fraunhofer IPT
Influencing variables during the production planning and control
Human resourcesQualification Flexible working hoursShift systemNumber of spare HR
ProductNumber of parts/variants Geometrical similarity of products Number of operationsTime/control of operationsConnection of operationsQuantities/yearProduction list
OrganizationManufacturing organization (group production, shop fabrication, flow production)Structure of the material flowNumber of breakdownsOrganization of the maintenance
TechnologyAutomation levelPortion of manual activitiesNumber of working stationsSubstitution levelNumber of pallets, fixturesNumber of transport units
Determining factors for the design of the production planning and -control
Notes:

Production Management B – Spring Semester 2009 Lecture 01
IT-Systems in Production Management L01 P. 13
Seite 13© WZL/Fraunhofer IPT
Functional overview of an ERP system
Online Service
Online Personali
sierung
Auftrags-ausführung
Online Verkauf/ Katalog
Online service
Online Persona-lisation
Job execution
Online distribution/ Catalogue
Bill/ paymentEmployee Self Service
Finances
Sales & Marketing
KnowledgeMgmt./
Research
CollaborativeApplications
Logistic/ production
StrategicEnterprise
Mgmt.
Human Resource
CollaborativePlanning & Forecasting
Purchase
Bill/ payment
Cus
tom
er
Supp
lier
Employees
Partners
Notes:
This picture shows some exemplary function modules of ERP. You can also see the connection to customers, distributors, employees and business partners.

Production Management B – Spring Semester 2009 Lecture 01
IT-Systems in Production Management L01 P. 14
Seite 14© WZL/Fraunhofer IPT
Fluctuation of requirements
Steering criteria of the ERP
Spreading of cycle time
Delivery time
Delivery-/ cycle time
Shortest delivery time
Medium cycle time
Criterion: Time
Planning tolerance
Cycle time spreading
Criterion: Spreading Cycle time spreading
Cycle time
Planning tolerance
Fluctuation of requirements
Capacity flexibility
Time
Criterion: Amount Maximum capacity
Minimal Capacity
Tolerance requirements
Is the planning tolerance (external view) smaller than the realisable cycle time spreading (internal view)?
Speed requirements
Require heterogeneous delivery times (external view) heterogeneous cycle times (internal view)?
Flexibility requirements
Do the fluctuation of requirements (external view) exceed the capacity flexibility (internal view)?
Source: Wiendahl, IFA
Freq
uenc
yPi
eces
/ day
Freq
uenc
y
Notes:
A main focus of an ERP-system is to optimize speed, flexibility and tolerance. The four basic factors of optimization are: adherence to delivery dates, delivery period, workload and capital commitment.

Production Management B – Spring Semester 2009 Lecture 01
IT-Systems in Production Management L01 P. 15
Seite 15© WZL/Fraunhofer IPT
Ideal business curve
Source: Wiendahl, IFA
Wahl des optimalen Betriebspunktes
?Unterlastbereich
bergangsbereichÜberlastbereich
Umlauf-bestand
DLZ
DLZ
je Leistungseinheit
DLZLow work in progress
Low cycle time
Low cost per manufacturing unit
High adherence to delivery dates
High workload
Wahl des optimalen Betriebspunktes
?Underload range
Transition rangeOverload range
Work in progress
DLZ
DLZ
per manufacturing unit
DLZ
Notes:
The ideal operating characteristic curve is situated in the transition range between an underloadand overload range. The underload range is characterized by the fact that the middle capacity expressed in hours per operating calendar date is low, which is equivalent to an unexploited output potential. The overload range is characterized by the fact that the middle capacity is totally exhausted, whereas the need is still increasing. The cycle time is rising, due to the distinction of the machines efficiency and the fact that unexpected events can not be cushioned.

Production Management B – Spring Semester 2009 Lecture 01
IT-Systems in Production Management L01 P. 16
Seite 16© WZL/Fraunhofer IPT
Tasks of the ERP in the order procedure
Programm-planung
Program-planning
Material requirement
planning
und-
Prognosis
Production planning
Manufacturing orders
Schedule and capacity planning
Incoming orders
Customer ordersJob order
management
Shipped orders
Available stock inventory
Planned incomings and leavings
Planned incomings and leavingsfrom end products
Inventory control
Available stocks
Organisation of machine workload
from components
Purchase ordersPurchase
Stock incomings Stock incomings
Job release Operation scheduling
Feedback
Manufacturing
Notes:
This picture shows the typical controlling of an ERP system. In the following pictures the functions of the individual blocks are described in detail.

Production Management B – Spring Semester 2009 Lecture 01
IT-Systems in Production Management L01 P. 17
Seite 17© WZL/Fraunhofer IPT
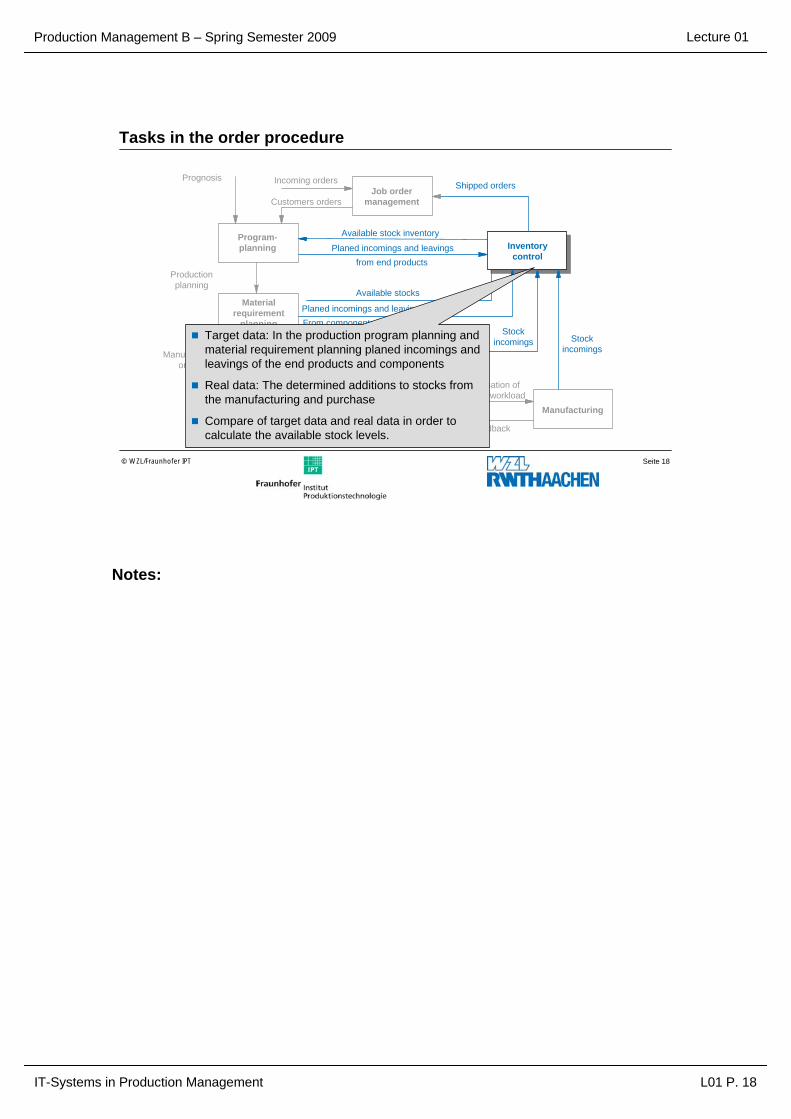
Tasks in the order procedure
Programm-planung
Program-planning
Material requirement
planning
und-
Prognosis
Production planning
Manufacturing orders
Schedule and capacity planning
Incoming orders
Customers ordersJob order
management
Shipped orders
Available stock inventory
Planed incomings and leavings
Planed incomings and leavingsfrom end products
Inventory control
Available stocks
Purchase orders
Job release
The program planning specifies the production of the product type and quantities in each planning period.
Demand prognosis, customer jobs and capacity load are required.
Planed output of products, spare parts, saleable assembly groups and component parts are results.
No exact capacity adjustment and exact schedules required.
Notes:
Production Management B – Spring Semester 2009 Lecture 01
IT-Systems in Production Management L01 P. 18
Seite 18© WZL/Fraunhofer IPT
Tasks in the order procedure
Program-planning
Material requirement
planning
Prognosis
Production planning
Manufacturing orders
Schedule and capacity planning
Incoming orders
Customers ordersJob order
management
Shipped orders
Available stock inventory
Planed incomings and leavings
Planed incomings and leavingsfrom end products
Inventory control
Available stocks
Organisation of machine workload
From components
Purchase ordersPurchase
Stock incomings Stock
incomings
Job releaseScheduling
Feedback
Manufacturing
Target data: In the production program planning and material requirement planning planed incomings and leavings of the end products and components
Real data: The determined additions to stocks from the manufacturing and purchase
Compare of target data and real data in order to calculate the available stock levels.
Notes:

Production Management B – Spring Semester 2009 Lecture 01
IT-Systems in Production Management L01 P. 19
Seite 19© WZL/Fraunhofer IPT
Tasks in the order procedure
Program-planning
Material requirement
planning
Prognosis
Production planning
Manufacturing orders
Schedule and capacity planning
Incoming orders
Customers ordersJob order
management
Shipped orders
Available stock inventory
Planed incomings and leavings
Planed incomings and leavingsfrom end products
Inventory control
Available stocks
Organisation of machine workload
From components
Purchase ordersPurchase
Stock incomings Stock incomings
Job releaseScheduling
Feedback
Manufacturing
MRP (material requirement planning)
Parts lists are evaluated in order to calculate the demand of all intermediate products, raw materials and purchase parts.
Purchase orders for the requirements are created.
Production orders are send to the schedule and capacity planning.
Notes:

Production Management B – Spring Semester 2009 Lecture 01
IT-Systems in Production Management L01 P. 20
Seite 20© WZL/Fraunhofer IPT
Tasks in the order procedure
Program-planning
Material requirement
planning
Prognosis
Production planning
Manufacturing orders
Schedule and capacity planning
Incoming orders
Customers ordersJob order
management
Shipped orders
Available stock inventory
Planed incomings and leavings
Planed incomings and leavingsfrom end products
Inventory control
Available stocks
Organisation of machine workload
From components
Purchase ordersPurchase
Stock incomings Stock incomings
Job release Operation scheduling
Feedback
Manufacturing
Calculation of cycle time:
Backward scheduling:On the basis of the latest required date it is determined, when the individual process steps of an order have to be made at the latest.
Forward scheduling:The earliest start and end dates are determined.
Capacity scheduling:In case of deviations the capacity requirements will be adjusted with the available capacity
Notes:

Production Management B – Spring Semester 2009 Lecture 01
IT-Systems in Production Management L01 P. 21
Seite 21© WZL/Fraunhofer IPT
Tasks in the order procedure
Program-planning
Material requirement
planning
Prognosis
Production planning
Manufacturing orders
Schedule and capacity planning
Incoming orders
Customers ordersJob order
management
Shipped orders
Available stock inventory
Planed incomings and leavings
Planed incomings and leavingsfrom end products
Inventory control
Available stocks
Organisation of machine workload
From components
Purchase ordersPurchase
Stock incomings Stock incomings
Job release Operation scheduling
Feedback
Manufacturing
The execution of the terminated orders on the individual machines are made in the context of the operation scheduling.
The operation scheduling reacts extremely sensitive to data changes and is therefore done very shortly.
Notes:

Production Management B – Spring Semester 2009 Lecture 01
IT-Systems in Production Management L01 P. 22
Seite 22© WZL/Fraunhofer IPT
Tasks in the order procedure
Program-planning
Material requirement
planning
Prognosis
Production planning
Manufacturing orders
Schedule and capacity planning
Incoming orders
Customers ordersJob order
management
Shipped orders
Available stock inventory
Planed incomings and leavings
Planed incomings and leavingsfrom end products
Inventory control
Available stocks
Organisation of machine workload
From components
Purchase ordersPurchase
Stock incomings Stock incomings
Job release Operation scheduling
Feedback
Manufacturing
The organisation of machine workloads as input
Feedback after production to the operation schedule
Feedback after production to the inventory control
Notes:

Production Management B – Spring Semester 2009 Lecture 01
IT-Systems in Production Management L01 P. 23
Seite 23© WZL/Fraunhofer IPT
IT in production management – Supply Chain Management
Main features
Objectives
DefinitionSupply Chain Management is the integral planning and controlling of processes over the whole supply chain. Even the suppliers are integrated to achieve optimal customer satisfaction.
• Optimization of processes and operations in logistics (= all activities which are connected with the allocation, storage and transport of goods)
• Emphasis is on the improvement of the information flow and utilization of resources between all chain links
• Interaction between all in the production involved departments
• Material- and information flows are considered
• Whole value chain is considered (cross-company)
Anmerkungen zur Folie:
Top 3 ERP-Softwareanbieter nach umsatzbezogenem Marktanteil in Deutschland im Jahr 2006:- SAP (54,8%)- Infor (5,5%)- Microsoft (3,8%)
Quelle: http://www.computerwoche.de/top_100/software/546025
Production Management B – Spring Semester 2009 Lecture 01
IT-Systems in Production Management L01 P. 24
Seite 24© WZL/Fraunhofer IPT
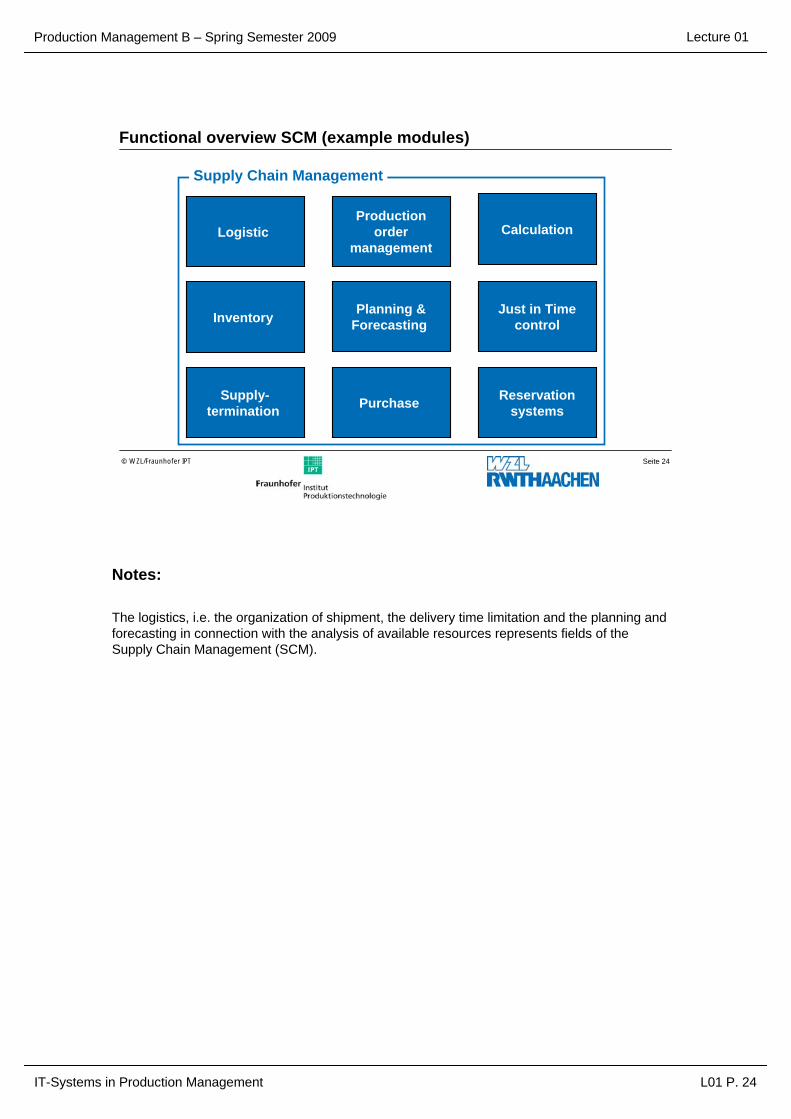
Functional overview SCM (example modules)
Planning &Forecasting
Just in TimecontrolInventory
Logistic
Purchase Supply-termination
Reservation systems
Production order
management Calculation
Supply Chain Management
Notes:
The logistics, i.e. the organization of shipment, the delivery time limitation and the planning and forecasting in connection with the analysis of available resources represents fields of the Supply Chain Management (SCM).

Production Management B – Spring Semester 2009 Lecture 01
IT-Systems in Production Management L01 P. 25
Seite 25© WZL/Fraunhofer IPT
IT-Systems in SCM: Central success factors
„Networked“ SCM =web based, cross-company
cooperation in the supply chain
Aim: Information exchange in real-time to coordinate and synchronise needs and supplies over the whole network
Result: Connection of enterprises to linked, integrated supply chains
Supply Chain Strategic Alignment
Supply Chain Planning
Collaboration
Supply Chain Execution
Collaboration
Supply Chain IT-Support
Supply Chain Information Availability
Supply Chain Communication
Supply Chain Know-
How
Supply Chain Skill
Sharing
Supply Chain (Re-)
Configuration Flexibility
1
34
5
2
CollaborationReactivity
Coordination
Notes:
On the basis of the three central factors of success - collaboration, coordination and reactivity -an intense cross-company cooperation is possible in the Supply Chain:
CollaborationExact coordination of production and transport between the individual levels
CoordinationReal-time and complete communication of demands over the entire delivery chain.
ReactivityPromptly transformation of the incoming orders via internal calculation of requirements, dispatching in production and depending on it the passing on to purchase or distributor.
Networked SCM is a progression of the SCM concept. Essentially it is based on the e-enabled Supply Chain Management (SCM), as well as on the Supplier Relationship Management (SRM). The described requests should be transferred in an IT system referring to SCM.
Production Management B – Spring Semester 2009 Lecture 01
IT-Systems in Production Management L01 P. 26
Seite 26© WZL/Fraunhofer IPT
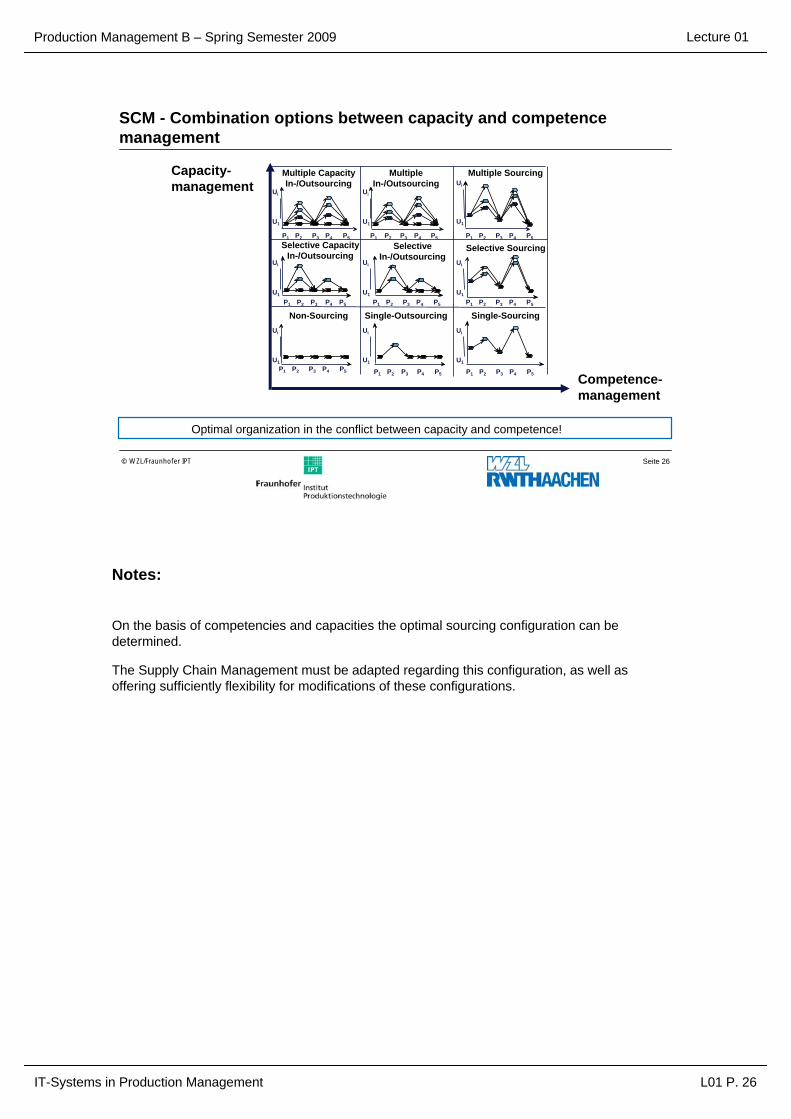
SCM - Combination options between capacity and competence management
Capacity-management
Competence-management
Multiple CapacityIn-/Outsourcing
MultipleIn-/Outsourcing
Multiple Sourcing
Selective CapacityIn-/Outsourcing
SelectiveIn-/Outsourcing
Selective Sourcing
Non-Sourcing Single-Outsourcing Single-Sourcing
P1 P2 P3 P4 P5
P1 P2 P3 P4 P5
P1 P2 P3 P4 P5
P1 P2 P3 P4 P5 P1 P2 P3 P4 P5
P1 P2 P3 P4 P5 P1 P2 P3 P4 P5
P1 P2 P3 P4 P5
P1 P2 P3 P4 P5
Ui
U1
Ui
U1
Ui
U1
Ui
U1
Ui
U1
Ui
U1
Ui
U1
Ui
U1
Ui
U1
Optimal organization in the conflict between capacity and competence!
Notes:
On the basis of competencies and capacities the optimal sourcing configuration can be determined.
The Supply Chain Management must be adapted regarding this configuration, as well as offering sufficiently flexibility for modifications of these configurations.

Production Management B – Spring Semester 2009 Lecture 01
IT-Systems in Production Management L01 P. 27
Seite 27© WZL/Fraunhofer IPT
Bullwhip-Effect
t tt
Order quantity/
t
End UserRetailer
Orders
t tt
Stocks
t
Wholesaler Manufacturer
Order quantity
Order quantity/Stocks
Order quantity/Stocks
Order quantity
Stocks
Shown for the first time by Jay Forrester (MIT) in the 60's
A small increase of the final customer’s demand leads to a disproportionate and delayed rise of the order quantity of the retailer
Higher demand continues increasing itself along the logistics chain
Notes:
If the final consumers needs increases the retailers stocks are getting smaller. The retailer has to enlarge his order quantity to fill up his stocks again. He has to adapt his order quantity depending on the current demand and thus his future inventory, which is larger than the final consumers needs. This effect is called the Bullwhip-Effect. Along the logistics-chain this effect amplifies itself. A further factor according to this effect is the biased demand, which may be created by offers or some accretion of discount.
Production Management B – Spring Semester 2009 Lecture 01
IT-Systems in Production Management L01 P. 28
Seite 28© WZL/Fraunhofer IPT
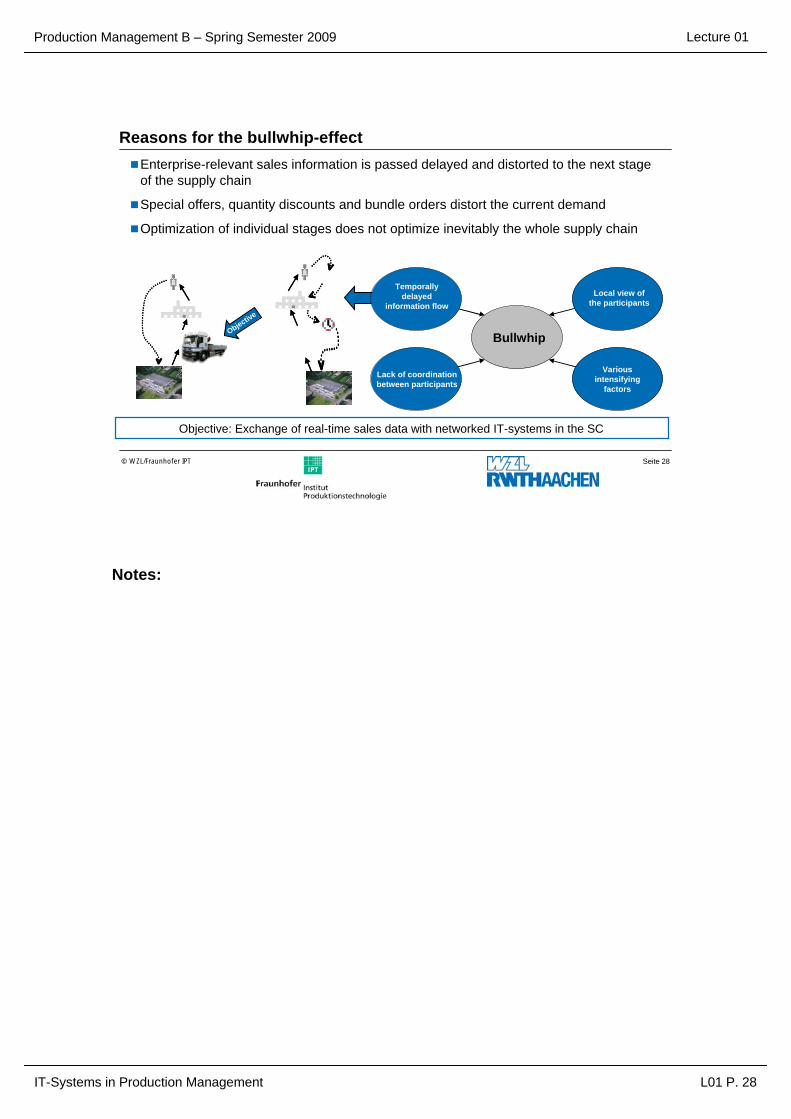
Reasons for the bullwhip-effect
Lack of coordination between participants
Various intensifying
factors
Bullwhip
Objective: Exchange of real-time sales data with networked IT-systems in the SC
Objective
Temporally delayed
information flowLocal view of
the participants
Enterprise-relevant sales information is passed delayed and distorted to the next stage of the supply chain
Special offers, quantity discounts and bundle orders distort the current demand
Optimization of individual stages does not optimize inevitably the whole supply chain
Notes:

Production Management B – Spring Semester 2009 Lecture 01
IT-Systems in Production Management L01 P. 29
Seite 29© WZL/Fraunhofer IPT
Process transparency and process optimization via SCM
Spareon schedule
fastcheap
CustomersJobs
Supply Chain
Management
Termintreu?Schnell? Kostengünstig?
Jobs
Spare
Deliveries
When?Cost?
Supplier CustomersSCM for the whole optimum in the
enterprise...Removal of lags and bottlenecksAvoidance of over supplyingAdherence the date of delivery
Storage
Adherence to delivery dates
Cycle time
Return
Productivity
Culture
Source: WASSERMANN AG
Notes:
Production Management B – Spring Semester 2009 Lecture 01
IT-Systems in Production Management L01 P. 30
Seite 30© WZL/Fraunhofer IPT
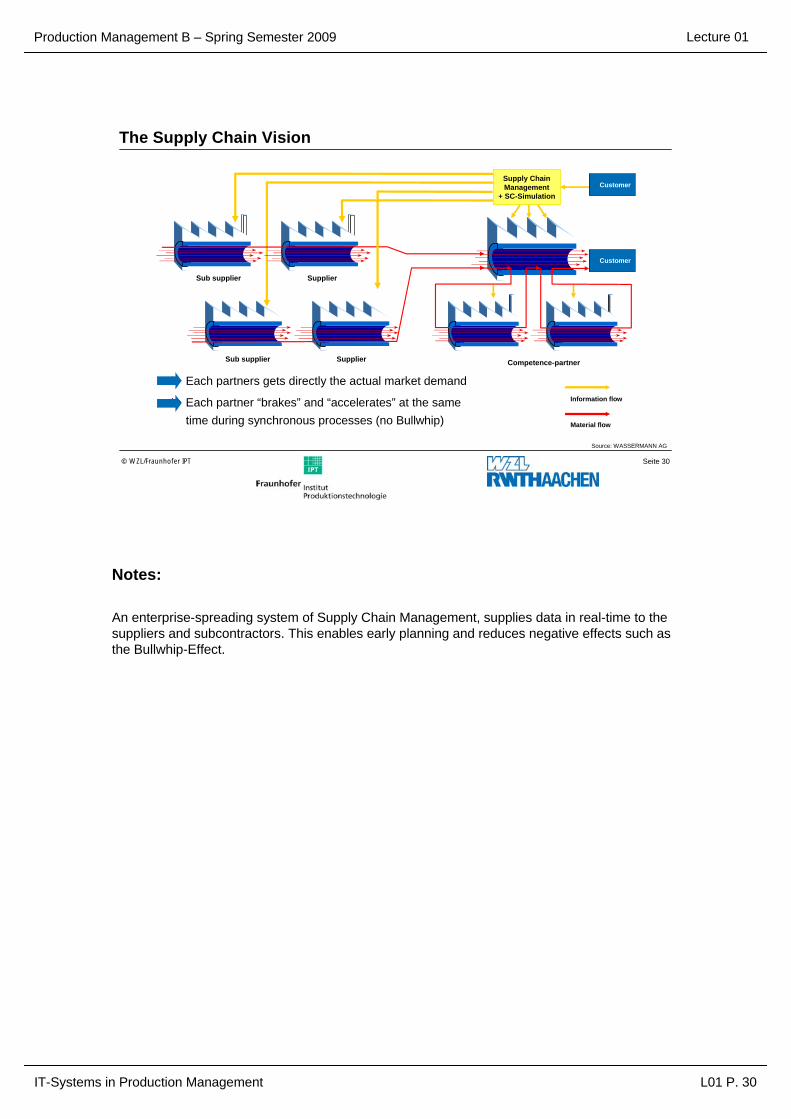
The Supply Chain Vision
Each partners gets directly the actual market demand
Each partner “brakes” and “accelerates” at the same time during synchronous processes (no Bullwhip)
Sub supplier Supplier
Sub supplier Supplier
Competence-partner
Information flow
Material flow
Supply ChainManagement
+ SC-SimulationCustomer
Customer
Source: WASSERMANN AG
Notes:
An enterprise-spreading system of Supply Chain Management, supplies data in real-time to the suppliers and subcontractors. This enables early planning and reduces negative effects such as the Bullwhip-Effect.

Production Management B – Spring Semester 2009 Lecture 01
IT-Systems in Production Management L01 P. 31
Seite 31© WZL/Fraunhofer IPT
Main features
Objectives
Definition
IT in production management – Customer Relationship Management
CRM is an customer-oriented business philosophy. It tries with the help of modern information and communication technologies to build up long term profitable customer relationships by holistic and differentiated marketing-, sales- and service concepts. (Source: Hettich/Hipper/Wilde 2001)
• Know-How: Understand markets and customers
• Sell: Win new customers
• Target: Develop service offering
• Service: Rise customer loyalty
• „One Face to the Customer“
Anmerkungen zur Folie:
Top 3 ERP-Softwareanbieter nach umsatzbezogenem Marktanteil in Deutschland im Jahr 2006:- SAP (54,8%)- Infor (5,5%)- Microsoft (3,8%)
Quelle: http://www.computerwoche.de/top_100/software/546025

Production Management B – Spring Semester 2009 Lecture 01
IT-Systems in Production Management L01 P. 32
Seite 32© WZL/Fraunhofer IPT
Objectives of CRM
Know-HowUnderstand markets and
customer
ServiceRise
customer loyalty
Target Develop
service offers
SellWin
customers
CRM
Performance- and customer systemsHow are performance systems build and how fits a customer system to that?
Better attainment of customer needs„How are homogeneous clusters for needs are build?“
Industrial services„How much differentiation offers the product, how much differentiation offers the service?“
Better attainment of customer needs„Which capabilities are worth for the customers?“
Notes:
Know-How: „Understand markets and customers“In the future it is not sufficient anymore to address the basic needs of the customer, moreover it is necessary to satisfy the latent wishes of the customer, which he might not even be able to express.
Sell: „Win customers“The advantages of the economies of scale can be used within homogenous clusters. It is important to notice, that some existing rules for clustering are not valid anymore (e.g. income clusters are less commonly used).
Target: „Development of services“Service systems enables the producer to offer customer focused product packages via the combination of physical products and services.
Service: „Rise customer loyalty“The customer loyalty can be improved by offering services. Furthermore they are a good way to differentiate oneself from competitors.

Production Management B – Spring Semester 2009 Lecture 01
IT-Systems in Production Management L01 P. 33
Seite 33© WZL/Fraunhofer IPT
Profitability of individual customer groups - Concentration on profitable customers
Central objective of the CRM concept is the focusing on customers, who appear profitable on a long-term basis
Share of Wallet (portion of the purchasing power of a customer group) has higher priority than the increase of the market share
Focusing on the right customer groups
Most enterprises obtain a large part of their profit with only few customers. On the other side is a large customer group, which has an small or even negative profit contribution.
Customer Lifetime Value in %
Customer with positive CLV contribution
Customer with negative CLV contribution
100
intended reduction of the customer base
100
Customer in %
Desired situation
Actual situation
Source: Helmke, Dangelmaier 2001
Notes:
The calculation of the Customer Lifetime Value (CLV) seems to be easier or more precise with the quantitative, instead of the qualitative parameters. The reason is the relevance of future events within the customers life cycle. The internal interest rate should correspond to the customer-relationships capital costs. It results from considerations of net return risks for the decrease of the systematic risk of a customer relationship. The in- or out-payment surplus can be determined by the turnovers or costs, which are allocable to the respective customers in this period. The capital value method is important, since it stresses the dynamic view of the CLV and thus the CLV-managements measures. To a company these measures are solely profitable on a middle to long-term basis. According to the CLV management the present value of the Customer relationship represents a suitable control parameter. However an exact calculation of the customer value is not that striking referring to a CLV Management application, but the production of a support in decision making. Therefore the possibility of classification in customer groups with low, middle and high customer value would already be a basis for marketing activities. After all the CLVs qualitative parameters should not be neglected. With consideration of empirical values and respective probabilities of entrance these qualitative parameters should be multiplied.

Production Management B – Spring Semester 2009 Lecture 01
IT-Systems in Production Management L01 P. 34
Seite 34© WZL/Fraunhofer IPT
Targets for costs, customer value/ Value-to-Customer and proficiency level
Expansion ReductionOptimum
Costs
Customer value = Willingness to pay the price
Target profit
Target costs
Diversity,technical proficiency level
Source: Simon Kucher und Partners
Notes:
Product and pricing strategy start with the development. It is not solely about offering technically maximal output, but the level of output should be adjusted to the customers benefit – neither too low nor too high. The integrated customer's benefits and costs are essential referring to technically demanding products. This is possible with e.g. a Target-Value-Costing approach. Due to each accomplished characteristic of capacity target use and target costs should be uniquely derived.

Production Management B – Spring Semester 2009 Lecture 01
IT-Systems in Production Management L01 P. 35
Seite 35© WZL/Fraunhofer IPT
Functional overview CRM (example modules)
Onlineservice
Onlinesales
Customer-data sheet
Service
Sales Marketing Customer
Complaint-management
Call center
Customer Relationsship Management
Notes:
The major tasks of CRM are shown on the represented fields. They improve the comprehension of customer needs and create a competitive advantage.

Production Management B – Spring Semester 2009 Lecture 01
IT-Systems in Production Management L01 P. 36
Seite 36© WZL/Fraunhofer IPT
Emotional profile and customer satisfaction
Win customers with CRM and services
Integrated project management
Integration of services
Services
Range of goods
Product system
Product
Modular enlargement
Periphery, spare parts
Service, maintenance, training
Choice of machine, adapt the machine
Start up management, final approval, Product attendance
Customer-days
Gen
eral
mar
ketin
g
Span
ned
mar
ketin
g
Indi
vidu
al m
arke
ting
Notes:
CRM is a major tool for marketing. Marketing is divided into: general marketing, segmented marketing and individual marketing. The specified tools can be assigned to the marketing forms and they should be covered by the CRM.

Production Management B – Spring Semester 2009 Lecture 01
IT-Systems in Production Management L01 P. 37
Seite 37© WZL/Fraunhofer IPT
Main features
Objectives
DefinitionIT in production management – Product Lifecycle Management
PLM is the management and the controlling of all information concerning the product. It handles and contains information about the product from the development, first tests, production over the total service life and lifetime of a product.
• Information from the whole life cycle• Cost reduction for following products due to collected life cycle information• Elimination of geographical, organizational and technological borders
• The product/ the product life cycle and all connected tasks and processes are tasks of PLM
Anmerkungen zur Folie:
Top 3 ERP-Softwareanbieter nach umsatzbezogenem Marktanteil in Deutschland im Jahr 2006:- SAP (54,8%)- Infor (5,5%)- Microsoft (3,8%)
Quelle: http://www.computerwoche.de/top_100/software/546025

Production Management B – Spring Semester 2009 Lecture 01
IT-Systems in Production Management L01 P. 38
Seite 38© WZL/Fraunhofer IPT
Potentials of PLM
Release
Product finding
Product realisation Launch Market
growthMaturing
timeMarket
saturation Descent
€
0
Realisation cost
Product profits not cumulated
Product sales
+
-Quality factors,reutilisations factors
Time-to-market-factor
Quality factors
Synergy factors
Sales factors
Course without PLM
Course with PLM
Notes:

Production Management B – Spring Semester 2009 Lecture 01
IT-Systems in Production Management L01 P. 39
Seite 39© WZL/Fraunhofer IPT
Functional overview PLM (example modules)
Quality-management
Demandanalyse
Product-development (EDM/ PDM )
Controlling
Marketing Distribution Construction
Maintenancemanagement
Changemanagement
Product Lifecycle Management
Notes:

Production Management B – Spring Semester 2009 Lecture 01
IT-Systems in Production Management L01 P. 40
Seite 40© WZL/Fraunhofer IPT
Task und structure of EDM/ PDM systemsEDM/ PDMGraphic user interface
Application-oriented functions:• Product data- and document management• Product structure- and configuration management• Classification- and part family management• Process- and workflow management• User management• Project data management
Application-overlapping functions
DBMS Adoption, configuration, administration
Inte
rfac
es
• Management of large data volumes
• Spanning over department and enterprise barriers
• A process control integrated handling
The main tasks of EDM -and PDM-systems is:
Functional modules
Notes:
Engineering Data Management (EDM) and Product Data Management (PDM) generate the basic modules of a PLM system.

Production Management B – Spring Semester 2009 Lecture 01
IT-Systems in Production Management L01 P. 41
Seite 41© WZL/Fraunhofer IPT
Data base for EDM/ PDM systemsEDM/ PDM
Production program planningLong term planning
Commercial DVe.g.
personal accounting
Workshop control
Store Transpor-tation Handling Adaptation Assembling
CAD
PPSOrganisational, planning, jobs, appointments,
capacity
CAP
CAQ
CAM
BDE
DevelopmentConstruction
Technical planningNC-Programming
Technical machine control
Quality manage-
ment
Mainte-nance
Capture of production data
Goods input Shipping
Material flow
Notes:
Data stored in EDM and PDM systems mainly originates from the development, the quality management and the machine control.

Production Management B – Spring Semester 2009 Lecture 01
IT-Systems in Production Management L01 P. 42
Final statement:
Within the lecture „IT-Systems in Production Management“ an overview of the IT-Systems ERP, SCM, CRM, PLM, EDM and PDM has been provided. The systems‘ aims, characteristics and functions were described. Furthermore their interfaces were addressed as well as their individual potentials and limitations. The following lectures will focus these systems in detail.
Production Management B – Spring Semester 2009 Lecture 01
IT-Systems in Production Management L01 P. 43
Bibliography:
Benett: Komplexitätsmanagement in der Investitionsgüterindustrie. Dissertation der Universität St. Gallen; 1999
Busch; Dangelmaier: Integriertes Supply Chain Management. Gabler Verlag; 2002
Eversheim: Prozessorientierte Unternehmensorganisation. Konzepte und Methoden zur Gestaltung „schlanker“ Organisationen. 2. Aufl.; Springer Verlag; 1996
Eversheim et al.: Simultaneous Engineering. Springer Verlag; 1995
Eversheim; Schuh: Betriebshütte – Produktion und Management. Springer Verlag; 1996
Günther; Tempelmeier: Produktion und Logistik. 3. Auflage; Springer Verlag; 1997
Helmke; Dangelmaier: Effektives Customer Relationship Management – Instrumente, Einführungskonzepte, Organisation. 1. Auflage; Gabler Verlag; 2001
Hieber: Supply Chain Management. A Collaborative Performance Measurement Approach. 2. Auflage; vdf Hochschulverlag der ETH Zürich; 2001
Marbacher: Demand & Supply Chain Management. Verlag Paul Haupt; 2001
Porter: Competitive Advantage – Spitzenleistungen erreichen und behaupten. Campus Verlag; 1996
Scheer: Der computergesteuerte Industriebetrieb. Springer Verlag; 1990
Schuh; Schwenk: Produktkomplexität managen – Strategien, Methoden, Tools. HanserVerlag; 2001
Schuh; Wiendahl: Komplexität und Agilität, Steckt die Produktion in der Sackgasse? Springer Verlag, 1997
Production Management B – Spring Semester 2009
Customer Relationship Management L02 P. 0
Lecture 02
Laboratory for Machine Tools and Production Engineering
Chair of Production EngineeringProf. Dr.-Ing. Dipl.-Wirt. Ing. G. Schuh
Chair of Production ManagementProf. Dr.-Ing. A. Kampker
Production Management B
Lecture 02Customer Relationship Management (CRM)
Organisation:Dipl.-Ing. Dipl.-Wirt. Ing. Markus BartoschekSteinbachstr. 53BRaum 506Tel.: [email protected]

Production Management B – Spring Semester 2009
Customer Relationship Management L02 P. 1
Lecture 02
Index:
Index page 1Schedule page 2Glossary page 3Target of this lecture page 4Lecture
Highlights and learning targets page 5Markets with asymmetric information page 6Definition and goals of Customer Relationship Management page 7Aims of CRM page 8Customer-oriented corporations – characteristics, determinants page 10CRM as differentiated customer development strategy page 11Context of customer retention and company value page 10Customer Lifetime Value page 13Profitability of individual customer groups page 14Profitability – Focus on profitable customers page 16Six steps for weighting customer requirements page 17Evaluation of customer clusters page 18Homogeneous solutions for homogeneous customer cluster page 19Performance- and customer-systems page 21Design of service systems page 22Method example: Conjoint-Analysis page 23Correlation between service and price page 24Objectives for costs, Customer benefit.... page 25Pricing page 26The look of an effective pricing-process page 27Pricing-Process vs. Cost reduction page 28Realising proximity to the customer with service systems page 30Customer retention with complementary services page 31IT-support for CRM systems page 33Architecture of eCRM systems page 34Final statement page 35Questions page 36
Bibliography page 37

Production Management B – Spring Semester 2009
Customer Relationship Management L02 P. 2
Lecture 02
Schedule:
No. Date Responsible
L1 27.04.2009 Mr. Rittstieg 0241 80 20396
L2 04.05.2009 Mr. Bartoscheck 0241 80 28203
L3 18.05.2009 Mr. Fuchs 0241 80 26265
L4 25.05.2009 Mr. Reil 0241 80 27964
L5 08.06.2009 Mr. Potente 0241 80 27387
L6 15.06.2009 Mr. Bauhoff (fir) 0241 47705-439
L7 22.06.2009 Mr. Hoeschen 0241 80 27382
L8 29.06.2009 Mr. Jung 0241 80 27392
L9 06.07.2009 Mr. Rauhut 0241 80 28206
L11 13.07.2009 Mr. Koch 0241 80 25321
L12 20.07.2009 Mr. Cuber (fir) 0241 47705-420
Customer Relations Management
Enterprise Ressource Planning I
Enterprise Ressource Planning II
Topic
IT in Production Management
Enterprise Ressource Planning III
Product Lifecycle Management II
Digitale Plant Planning and Simulation
Business Engineering - Method of selecting IT-Systems (Trovarit)
Supply Chain Management I
Supply Chain Management II
Product Lifecycle Management I

Production Management B – Spring Semester 2009
Customer Relationship Management L02 P. 3
Lecture 02
Glossary:
Customer Relationship Management (CRM) is the english expression for the administration of the customer relationships. The main aim of the CRM is the initialisation, the care and if necessary the recovery of customer relations.
The Conjoint-Analysis is a complex, statistically supported method, which enables an optimal alignment of products or product concepts on the market.
Scenarios are future trend schemes for an open or defined point in time.
Earning = revenues – costs
Revenues = all cash receipts of a company that are generated through sales of goods or services.
Stimuli = bundle of attribute characteristics

Production Management B – Spring Semester 2009
Customer Relationship Management L02 P. 4
Lecture 02
Target of this lecture:
Crisis periods are always times, in which organizations concentrate particularly on the important business values. In former times it seemed that the investmentinto new technologies, the development of even smarter products or the additional purchase of different companies alone determined the value of an enterprise. In the meantime companies realized the simple truth that also satisfied and fruitful customers are an important factor of success. Thus the systematic approach to the Customer Relationship Management (CRM) moves into focus of the strategic and integrative management.
For a successful Customer Relationship Management the processes of selling, marketing, services, personnel management, the account system and finances all have to be considered. The operational arrangement of these processes, with a clear focus on the customer, becomes very important for the long-term perspective.
Especially the sales activities – as a connecting element between customers andthe enterprise - are confronted with new challenges such as the increase of profitability of specific customer groups, multi-channel management and strategic account management.
Therefore the sales department should not act isolated. The third customer-orientated function - the service - represents an important instrument for the customer management and the increase of sales and revenues. Concepts, activities and service measures have to be focused again on what they used torepresent in the first way – developing customer benefits.
The target of this lecture is to present methods for the market and customer segmentation and to show how to adjust the product programme to the customer system.

Production Management B – Spring Semester 2009
Customer Relationship Management L02 P. 5
Lecture 02
Seite 5© WZL/Fraunhofer IPT
Highlights and learning targets
How to identify reliable customer- and market segments?
How to adjust the product- and service programme to the determined customer- and market segments?
How to methodically analyse customer demands and how to configure the products on their feature level appropriately to the customer demands afterwards?
How to define and adjust product programmes as well asservice systems?

Production Management B – Spring Semester 2009
Customer Relationship Management L02 P. 6
Lecture 02
Seite 6© WZL/Fraunhofer IPT
Markets with asymmetric information
Nobel price 2001 in economicsGeorge Akerlof, Michael Spence, Joseph Stiglitz
Attitude in the early 70´s: Optimal allocation of goods by symmetric informations due to price mechanism
Effects that appear as a result of an asymmetricinformation of economic units
Adverse Selection (Akerlof)
Overcoming of asymmetric information throughMarket Signalling (Spence)
Screening (Stiglitz)
Composition of reputation
Notes:Adverse Selection (George Akerlof, 1970): The seller usually knows more about the condition of a used car than the buyers do. Those cannot evaluate the quality of the specific carbecause for them all cars of the same type have the same appearance. They merely know the average quality of the car type due to technical press. Thus all cars are dealt at the same price which have the appearance of average quality due to asymmetric information. Hence the seller of a good car only gains the average price because the buyers do not recognize the better quality. So the sellers do not want to offer good cars anymore because the average prices are too low for them. Only the bad cars, the so called “lemons” or “citrons” are dealt. The good cars are swamped out of the market. This phenomenon is named “Adverse Selection”. When the buyers realize, that only bad cars are sold, the willingness to pay higher prices will decrease.Thus less good cars are offered on the market. This effect is amplified and can expire in a total market crash.Market Signaling (Michael Spence, 1973): Entrepreneurs know less about the skills than the employees do themselves. If companies pay a wage which is adequate to the average productivity, the productive employees subsidizes the unproductive ones. In order to inform theentrepreneur of their better skills (to reach higher wages) the productive individual has to send a signal which can not be imitated by the unproductive ones. According to Spence the higher education costs of the unproductive will over-compensate the expected rise of wages and does not pay off. For the productive individuals the education costs are lower in proportion to the expected rise of their wages. They intend continuing an education to show the companies theirabilities. Thus the adverse selection can be decreased by signals from the informed side. Screening (Stiglitz): Screening means that the uninformed party tries to divide the informed ones. An insurance company does not know the willingness of their customers to take risks.The car drivers themselves certainly know their own willingness very well. Insurance companies can divide customers into groups through offering different spreads concerning cost sharing and premiums. A roadhog will rather decide for a comprehensive collision coverage with higher premiums and lower sharing cost. The cautious car driver prefers part collision coverage with lower premiums and higher cost sharing.

Production Management B – Spring Semester 2009
Customer Relationship Management L02 P. 7
Lecture 02
Seite 7© WZL/Fraunhofer IPT
Definition and goals of Customer Relationship Management
Definition CRM
Simply stated, Customer Relationship Management (CRM) deals with identifying, attracting and retaining customers. CRM is part of every customer-focused business strategy and includes the organisation, processes and technology questions associated with marketing, sales, and service.
Goals of Customer Relationship Management (CRM)
Optimisation of customer relationships– Maintaining existing profitable customer relationships– Setting up new profitable customer relationships
Increase of customer loyalty– Increase of Share of Wallet concerning the contingent of total customer demands
(within a special product group) that a company achievesSource: Helmke, Dangelmeier (2001)
Notes:With the holistic perception, it becomes clear, that not only the management is the crucial factor but also the CRM. The CRM is the most significant value of a company. In the past, the introduction of CRM was confined to technologies or detached projects.

Production Management B – Spring Semester 2009
Customer Relationship Management L02 P. 8
Lecture 02
Seite 8© WZL/Fraunhofer IPT
Aims of CRM
Know-How Under-
standing markets and customers
Service To commit customer
TargetDevelopment
of serviceoffers
SellWin
customers
CRM
Services- and customer systems“How should service systems be built up and what are adequate customer systems?”
Seeking customer demands„How are homogeneous ´demand-clusters´generated ?“
Industrial Services„How big is the differentiation potential of the product or service feature?“
Better seeking of customer demand„How much will the customer pay for which service attribute?“
Notes:

Production Management B – Spring Semester 2009
Customer Relationship Management L02 P. 9
Lecture 02
Seite 9© WZL/Fraunhofer IPT
Structure
Know-How: appreciating markets and customers 1
Sell: attracting customers2
Target: developing service offers3
Service: committing customers4
eCRM: supporting systems5

Production Management B – Spring Semester 2009
Customer Relationship Management L02 P. 10
Lecture 02
Seite 10© WZL/Fraunhofer IPT
Customer-oriented corporations – characteristics & determinants
Sensitivity: dimension of systematic comprehension of demand- and problem-changing of customers by company
Reagibility: the “speed of reaction” thatproviders can react or adapt with to new customer demands
Flexibility: Ability of contractors to be responsive to individual service requirements of their customers
Feasibilty: Ability of contractors to convert customer demands in branch-specific and lucrative solutions
Customer-oriented corporations act successfully in the four important dimensions –sensitivity, reagibility, flexibility and feasibility
Proximity to customers
Customer service system
Customer problem solution
Customerintegration
means…
in…to…
avail…
Source: Belz, Schuh et al (1997)
Notes:

Production Management B – Spring Semester 2009
Customer Relationship Management L02 P. 11
Lecture 02
Seite 11© WZL/Fraunhofer IPT
CRM as differentiated customer development strategy
The goal is a consistent focus on selection, commitment and development of the relationship to profitable customers
To offer the customer the best service possible To increase the profitTo assure differentiation adverse to competitionTo avoid obsolescence caused by lost customers
The goal is a consistent focus on selection, commitment and development of the relationship to profitable customers
To offer the customer the best service possible To increase the profitTo assure differentiation adverse to competitionTo avoid obsolescence caused by lost customers
Emphases in the future: customer development
Identification of potential customer requirementsDevelopment of new applications for present customersIdentification of potential within different customer segmentsActive contacting of customers
Emphases in the future: customer development
Identification of potential customer requirementsDevelopment of new applications for present customersIdentification of potential within different customer segmentsActive contacting of customers
Source: Prof. Homburg and Partners
Notes:A dynamic development of customer relationships is essential to assure customer loyalty in the future. Positive appraisal by customers today can be obsolete tomorrow. The so called „learning company“ has to draw the right conclusions for the future out of existing customer relations.
It is an important assumption to use the existing customer relationship. The company is acquainted with the customer and knows his needs and expectations. Based on this knowledge there is the opportunity of a precise and value-orientated relationship to the customer in the face of the development of customer-orientated service tools.

Production Management B – Spring Semester 2009
Customer Relationship Management L02 P. 12
Lecture 02
Seite 12© WZL/Fraunhofer IPT
Context of customer relation and company value
By how much does the company value rise, if several positions are improved/ raised up to 10%?
behalten
To inspire
To alter
To keep
Acquisition costs of unique visitors
Rate of increase of unique visitors
Acquisition costs for new customers
Compilation quote visitor/ new customer
Sales increasing rate per new customer
Customer retention costs
Exchange rising rate per patron
Compilation quote customer / patron
loss rate of patrons
0,7
3,1
0,8
2,3
0,7
5,8
9,5
4,6
6,7
Source: Krafft, Bromberger (2001)
Notes:Additional dealings based on existing customer relationships are realised easy. This can be thebasis for a positive and profitable acquisition of more customers with similar profiles.
It has to be the aim to commit own customers at first instead of acquiring new customers . Growth can also be realised with existing customers.

Production Management B – Spring Semester 2009
Customer Relationship Management L02 P. 13
Lecture 02
Seite 13© WZL/Fraunhofer IPT
Customer Lifetime Value
What is the today´s ability of companies to collect and evaluate information about their customer´s earning rate?
„Customer Lifetime Value for a firm is the net profit or loss to the firm from a customer over the entire life of transactions of that customer to the firm.Hence the lifetime value of a customer for a firm is the net of the revenues obtained from that customer over the lifetime of transactions with that customer minus the cost of attracting, selling, and serving that customer, taking into account the time value of money”
Today Future
CLV iTransactionsi Margini Lifetimei
Cross- & Up-Sellingi
x x x=
Customerlifetime valueof customer i
Number of orders / frequency
of customer i
Profit – costs per transaction
of customer i
Forecast periodof customer i( estimated)
Forecast of future buying activityof customer i(estimated)
Source: Jain, Singh
Notes:„A customer relationship has the status of a capital investment.“ This approach of CRM means that there is a payment (acquisition costs) but in the long run there are positive incomesfollowing. Thus the calculation of the CLV is based on the net present value.
The direct added revenues and costs of a customer belong to the quantitative determinants of the CLV. First of all, there are the acquisition costs which are appearing as a sum of all investments of a new customer in the beginning of the customer life cycle.
Hereupon the accounting balance is calculated out of all revenues and costs in the future per customer during the life time.
The costs depend on operating costs caused by customers and service costs.
Qualitative determinants of the CLV are potentials that cannot directly be measured by revenues and customer related costs, e.g. the re-reference potential, lead-customer-potential, up/cross-selling potential and the rising willingness to pay on customer side.
The re-reference potential principally depends on the satisfaction of a customer. The main view is that each satisfied customer recommends the products of the company to other customers. Thus, the amount of potential customers increases.
Cross-Selling means that the demand of a product is assigned to other offers.
Production Management B – Spring Semester 2009
Customer Relationship Management L02 P. 14
Lecture 02
Seite 14© WZL/Fraunhofer IPT
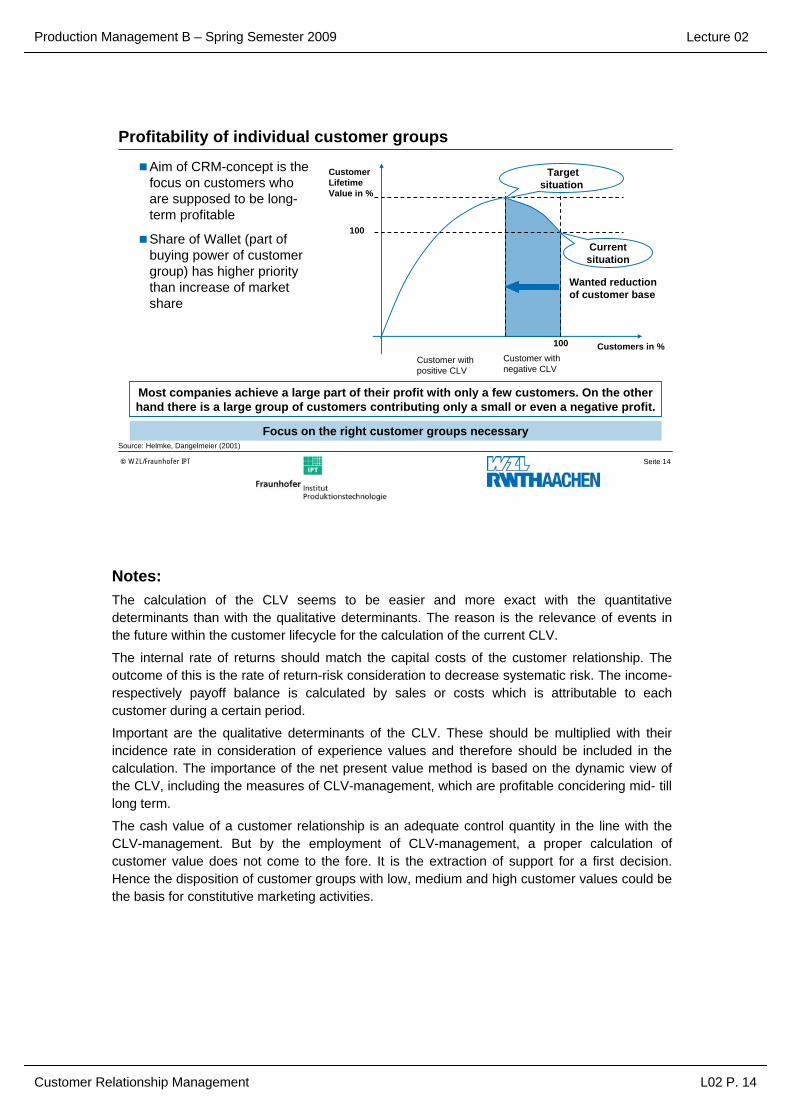
Profitability of individual customer groups
Aim of CRM-concept is the focus on customers who are supposed to be long-term profitable
Share of Wallet (part of buying power of customer group) has higher priority than increase of market share
Focus on the right customer groups necessary
Most companies achieve a large part of their profit with only a few customers. On the other hand there is a large group of customers contributing only a small or even a negative profit.
Customer Lifetime Value in %
Customer with positive CLV
Customer with negative CLV
100
Wanted reduction of customer base
100
Customers in %
Target situation
Current situation
Source: Helmke, Dangelmeier (2001)
Notes:The calculation of the CLV seems to be easier and more exact with the quantitative determinants than with the qualitative determinants. The reason is the relevance of events in the future within the customer lifecycle for the calculation of the current CLV.
The internal rate of returns should match the capital costs of the customer relationship. The outcome of this is the rate of return-risk consideration to decrease systematic risk. The income-respectively payoff balance is calculated by sales or costs which is attributable to each customer during a certain period.
Important are the qualitative determinants of the CLV. These should be multiplied with their incidence rate in consideration of experience values and therefore should be included in the calculation. The importance of the net present value method is based on the dynamic view of the CLV, including the measures of CLV-management, which are profitable concidering mid- till long term.
The cash value of a customer relationship is an adequate control quantity in the line with the CLV-management. But by the employment of CLV-management, a proper calculation of customer value does not come to the fore. It is the extraction of support for a first decision. Hence the disposition of customer groups with low, medium and high customer values could be the basis for constitutive marketing activities.

Production Management B – Spring Semester 2009
Customer Relationship Management L02 P. 15
Lecture 02
Seite 15© WZL/Fraunhofer IPT
Structure
Know-How: appreciating markets and customers 1
Sell: attracting customers2
Target: developing service offers3
Service: committing customers4
eCRM: supporting systems5

Production Management B – Spring Semester 2009
Customer Relationship Management L02 P. 16
Lecture 02
Seite 16© WZL/Fraunhofer IPT
Profitability – focus on profitable customers
Target market Responder
Voluntarydischarger
Recoveredcustomer
Potential customers Lost customers
Active customers Reactivated customers
Contribution of customer to the companie´s profit
Tasks
Data Mining –support (examples)
Initiation of business relation
Interests management Customer retention management Recovery management
Improvement of relationships
Prevention of cancellation
Abandonment unmeant cancellation
• Targeting• Customer segmentation• ...
• Market basket analysis• Cross- / Up-Selling analysis• Customer evaluation• ...
• Storno-Analysis
• etc.
Low valuecustomer
Consolidation of customer relationship
Forced discharger
New customers
High valuecustomer
High potentialcustomer
Notes:The customer lifetime cycle (relationship cycle) includes the total time frame of a customer-to-company-relationship. Generally it starts with the successful recovery of the new customerduring the acquisition phase and ends with the final retirement of the customer from therelationship.
To predict the duration of a customer relationship, experience values are used, such as theaverage migration, branche loyalties and the dynamics of market segments.

Production Management B – Spring Semester 2009
Customer Relationship Management L02 P. 17
Lecture 02
Seite 17© WZL/Fraunhofer IPT
Six steps for weighting customer requirements
Service package per customer cluster
Integration of customers
Conception phase
Requirementsweighting
Pre-selection/Priorisation
5
Marketsegmenting
Requirementdetection
Customer-evaluation
Define customer cluster
1
2
3
Preparation phase
Analysis phase
4
6
<Black-Box>Customer
Prec
isis
ion
leve
l of i
nfor
mat
ion
Source: Belz, Schuh et al (1997)
Notes:The customer requirements considered in the target-value-management are the source of theweighting process of customer requirements. In order to acquire reasonable information at current customer requirements (kind and weight), one has to structure the buy-decisive requirements in a standardized process which consists of six steps.

Production Management B – Spring Semester 2009
Customer Relationship Management L02 P. 18
Lecture 02
Seite 18© WZL/Fraunhofer IPT
Evaluation of customer clusters
Selection of target groups within the relevant markets for whom different problem solutions have to be provided
Creation of homogeneous customer clusters by using evaluated requirement catalogues
Combination of the customer clusters with adequate offers and services
Two main steps of cluster analysisDetermination of optimal cluster-/ segments quantity (e.g. Ward-Method)Optimal allocation of observations to cluster/ segments (e.g. k-means method)
Customer-evaluation
1unimportant
2less
unimportant
3neutral
4ímportant
5very
important
PowerHandlingGuaranteeDesign
Requirement x
Cluster „A“ Cluster „B“ Cluster „X“
Source: Belz, Schuh et al (1997)
Notes:Furthermore, the WARD procedure is important. Distance measure, distance computation and clustering will be determined whereby the error square sum (variance criterion) as a heterogeneity measure is as low as possible over all groups. For the selection of the suitable procedure, the fusing characteristics have to be considered. The Ward procedure leads to approximately equal large groups, which are appropriate in general.
K-Means algorithm: The K-means algorithm is an algorithm used to cluster objects based on attributes into k partitions. It is a variant of the expectation-maximization algorithm in which the goal is to determine the k means of data generated from gaussian distributions. It assumes that the object attributes form a vector space. The objective it tries to achieve is to minimize total intra-cluster variance. The algorithm starts by partitioning the input points into k initial sets, either randomly or using heuristic data. It then calculates the mean point, or centroid, of each set. It constructs a new partition by associating each point with the closest centroid. Then the centroids are recalculated for the new clusters, and the algorithm is being repeated by an alternate application of these two steps until convergence, which is obtained when the points no longer switch clusters (or alternatively centroids are no longer changed).

Production Management B – Spring Semester 2009
Customer Relationship Management L02 P. 19
Lecture 02
Seite 19© WZL/Fraunhofer IPT
Homogeneous problem solutions for homogeneous customer clusters
Nearly homogeneous requirement profiles within the clusters
Development of adjusted service packages
Revision of evaluated customer requirements to basic (buy-decisive) criteria
Benefit segmentation, allocation/ segmentation of relevant markets based on standardized benefit profiles
Customer cluster
Customer
A
B
C
Service packages(problem solutions)
Service Component
I
II
III
must-be factors
attractive factors
satisfying factors
Customersatisfaction
Degree offulfilled needs
Source: Belz, Schuh et al (1997)
Kano´s model
Notes:Geographical segmentation criteria divide markets into countries, regions, cities and other comprising spaces. A special segmentation approach is the micro-geographical segmentation. The main idea is, that people with a similar lifestyle and akin consumption habits often live concentrated in certain residential zones. For example, you can draw conclusions from looking at the income which correlates with the kind of house type: villa, raw house, tower block. But this criterion is only a first indication for a possible segmentation. Misinterpretation is possible by isolated usage. People living in villas are customers at discounters as well as people living inraw houses or social flats.Criteria of product utilization: It means how and how intensely customers use certain products. This data is not being collected systematically by every company, but they are normally easy accessible. E.g. for a bank it is very easy to divide customers in groups like good-occupants or few-occupants based on the number of transactions. Airlines and masstransit companies are able to partition customers in a short time based on the intensity of the customer´s usage as well. Psychographic segmenting criteria: psychographic rudiments include motives, attitudes and requirements. Examples are the benefit-segmentation or the so-called customer-benefit-segmentation. But the problem is, that the customer benefit is not exactly defined such as age, income or other definable factors. Hence psychographic segmentation is associated with detailed cost- and time-consuming market research projects. Experiences, how customers use certain products are consulted by the customer-benefit-segmentation. Furthermore customer satisfaction interviews are made and the shopping behavior is being analyzed. In addition, former experiences are used by consulting employees from customer service or sales force. These perceptions are very important for the operational marketing. But it has to be considered, that these perceptions are subject to environmental ascendancies and changing requirements and therefore instable in time.

Production Management B – Spring Semester 2009
Customer Relationship Management L02 P. 20
Lecture 02
Seite 20© WZL/Fraunhofer IPT
Structure
Know-How: appreciating markets and customers 1
Sell: attracting customers2
Target: developing service offers3
Service: committing customers4
eCRM: supporting systems5

Production Management B – Spring Semester 2009
Customer Relationship Management L02 P. 21
Lecture 02
Seite 21© WZL/Fraunhofer IPT
Performance- and customer systems
Customer systems are strongly related to performance systemsPerfomance systems Customer systems
Product Programme Market6 Emotional profile – and customer adventure
5 Integrated project management4 Integration of service
3 Services2 Assortment
1 Product system
0 Product
Customer advantages
Gen
eral
M
arke
ting
Indi
vidu
al
Mar
ketin
g
Span
ned
Mar
ketin
gEnterprise advantages
…
Customer basemarketing
Relationship management
Non time based customermarketing
Peer systems
Key Account Management
Customer system
Product programmesystem
Source: Belz, Schuh et al (1997)
Notes:The starting point of generating performance- and customer-systems is the companie´sdecision what products to provide and what markets to focus on. They solve problems more comprehensively or economic very effectively. Companies do not only offer their plain products and scores of services but also develop integrated solutions for specific customer groups (e.g. major customers). They search for innovative service-/ market combinations in order to achieve advantages for customers and to distinguish themselves from the competitors. How to enlace a product with different shells is shown in the illustration above. The more away from the kernel of a product, the more specific service has to be customized to different customer groups. Packets of problem solutions are usually specific.

Production Management B – Spring Semester 2009
Customer Relationship Management L02 P. 22
Lecture 02
Seite 22© WZL/Fraunhofer IPT
Design of service systemsPrinciple of integration: integration of services for customers – synergy of components is decisive
Principle of billing: billing of the achieved surplus of benefit for the customer
Principle of participation and explanation: identification, realisation and communication of problem solutions – close cooperation with customer
Principle of evolution: dynamic of service systems, e.g. continuing and improving to increasingly differentiate from competitors; overfulfilling customer´s demands
Long-term principle: build up service systems with long-term perspective – quick concessions are not systems
Principle of relevance: aiming activities to customer-relevant fields
Important for the success of customer service systems are not only the design of the service system shells and the service description appropriate to the customers. The way it is realized, closely related to the customer, is much more important. Quality should be the
focus of the whole problem solution package.Source: Belz, Schuh et al (1997)
Notes:

Production Management B – Spring Semester 2009
Customer Relationship Management L02 P. 23
Lecture 02
Seite 23© WZL/Fraunhofer IPT
Method example – Conjoint-Analysis
Definition of considered product attributes and their characteristics
Compilation of defined product attributes to product totality (stimuli)
Ranking of the pre-defined stimuli by test personsMulti attribute judgements
Additive model of partly benefits
Use of algorithm to determine each benefit value
Taking the average of all part benefit values acquired from test persons
Source: Backhaus
1. Definition of product aspects
2. Definition stimuli
3. Evaluation
4. Estimation of value of benefitmodel (partly benefits)
5. Aggregation
Notes:The Conjoint-Analysis, also called multi-attribute compositional models, is a statistical technique that originated in the 70´s in mathematical psychology. Today it is used in many of the social sciences and applied sciences including marketing, product management and operations research. The objective of the Conjoint-Analysis is to determine what combination of a limited number of attributes is most preferred by respondents/ customers. It is used frequently in testing customer acceptance of new product designs and assessing the appeal of advertisements. It has been used in product positioning, but there are some problems with this application of the technique.
Any number of algorithms may be used to estimate utility functions. The original methods were a monotonic analysis of variance or linear programming techniques, but these are largely obsolete in contemporary marketing research practice. Far more popular are hierarchicalbayesian procedures that operate based on choice data. These utility functions indicate the perceived value of the feature and how sensitive consumer perceptions and preferences are to changes in product features.

Production Management B – Spring Semester 2009
Customer Relationship Management L02 P. 24
Lecture 02
Seite 24© WZL/Fraunhofer IPT
Not yet professionally optimized
Possibilities of expansion are limited
Correlation between service and price
There are only three relevantdriver of profit.
Porter’s U-GraphA company, which is neither cost-nor quality-pace maker is „stuck in the middle“.
too large to concentrate on exclusive market segments.
too small in order to profit fromall potentials of cost reduction.
Advantage of service
Advantage of price
Mar
ket s
ucce
ss (R
OI,
Cas
h flo
w)
Strategy of preference
„buy the better product“
Strategy „to sit on the fence“ -
„Negation of buy, because it is
neither cheaper nor better“
Strategy of price-quantity
„buy the cheaper product“
Widely exploited
Profit = Price x Volume - Costsvariable
fix
Source: Porter
Notes:The amount of earnings of a strategic business unit is defined by the relevant market share.
A company that is neither cost- nor quality-pace maker is „stuck in the middle“ as Porter describes. This case often applies to companies that are too large to concentrate on exclusive market segments. On the other hand the companies are too small in order to profit from all potentials of cost reduction.
Pace maker of quality or cost management were the successful options in the past. If one achieves to offer customer individuality associated with an adequate price, the realization of„economies of scale“ and differentiated services, then the middle will become interesting as well.

Production Management B – Spring Semester 2009
Customer Relationship Management L02 P. 25
Lecture 02
Seite 25© WZL/Fraunhofer IPT
Objectives for costs, customer benefit/ value-to-customer and service level
Expansion ReductionOptimum
Costs
Customer benefit = Willingness to pay
Benefit, Costs
Targetcosts
Diversity,technical service level
Source: Simon Kucher and Partners
Notes:Product- and price policy starts with the development. The focus cannot be to achieve the technical maximum of service. The service level has to adapt to the customer benefit – neither too low nor too high. Technically ambitious products require an integrated view of customer benefit and costs. A possible kind of realisation is the target-value-costing approach. Aim benefit and aim costs are derived from each performed service.

Production Management B – Spring Semester 2009
Customer Relationship Management L02 P. 26
Lecture 02
Seite 26© WZL/Fraunhofer IPT
Pricing
Price scenarios
Market behaviour
Quantity
p, Kv
Kv
x
Quantity
p, Kv
Kv
Contribution margin Loss of profit
y
x
y1
y2
2634 36
3942
Beginner model less than € 30.000
Scenario 1
2932 35 38 41
Harmonic tuned price grades
Scenario 2
26 28 30 32 34
Aggressive pricing of whole product line
Scenario 3
Quantity effects Income effects (Index)
Price
Quantity effects
Income effects
Notes:There is the possibility to define different pricing models for a product program or -family.
The aim of differentiated prices/ price grades is to find the adequate price for an offered service package and to consider the price willingness of a customer cluster at the same time.
Furthermore advantages are found in terms of contribution margin and loss of profit by price differentiation. Differentiation of prices enables normally profit maximization.
The coherence of quantity and income effects in the field of pricing is considered by resiliences. Quantity effects are directly influenced by an increase or decrease of the price. Income effects normally follow the characteristical “U-Graph”.

Production Management B – Spring Semester 2009
Customer Relationship Management L02 P. 27
Lecture 02
Seite 27© WZL/Fraunhofer IPT
The design of an effective pricing-process
What do we want? Where
do we go?
How do we make it today?
What is the optimal Price/
Price-structure?
How can the price be
achieved in market?
Which prices were
achieved?
Strategicobjectives
AimsPositioningCompetition
Analysis
Now-situation/-process
Price decisionStructureLevelDifferentiationBundling
ImplementationOrganisation/ StewardshipITIncentives
Controlling/ Monitoring
Increase of benefit
Feedback
Source: Simon Kucher and Partners
Notes:The first rising aspect of profit is the price. There is hardly an area where as much profit potential is lost due to missing systematic analysis. The contribution margin can be raised by an optimized pricing-process in situations of unsystematic pricing like „on a gut level“. Measurable profit potentials could be realised by systematic preparation of decision, explicit rules (for pricing) as well as efficient price monitoring and -controlling.

Production Management B – Spring Semester 2009
Customer Relationship Management L02 P. 28
Lecture 02
Seite 28© WZL/Fraunhofer IPT
Pricing process vs. cost reduction
Quick Wins – Pricing processes have three advantages
Profit/Cash
Time
Cost Reduction/ Cost Cutting1. Investment
advantage1. Investment
advantage
3. Profit advantage3. Profit advantage
2. Time advantage2. Time
advantage
Pricing processimprovement
Source: Simon Kucher and Partners
Notes:Effects are achieved by an optimal adaptation of the price system. Comprehensive measures of reorganisation to the product programme, product processes or structure of organisation normally call for substantial investments. An adaptation of the price table only causes few effort and is quickly realised in contrast. The result of this price adaptation is an effective profit advantage.

Production Management B – Spring Semester 2009
Customer Relationship Management L02 P. 29
Lecture 02
Seite 29© WZL/Fraunhofer IPT
Structure
Know-How: appreciating markets and customers 1
Sell: attracting customers2
Target: developing service offers3
Service: committing customers4
eCRM: supporting systems5

Production Management B – Spring Semester 2009
Customer Relationship Management L02 P. 30
Lecture 02
Seite 30© WZL/Fraunhofer IPT
Realising proximity to the customer with service systems
Industrial services
„How much differentiation does the product afford, how much does the service afford?“
„Permanent Relationship” -Customer relation is only interrupted by the purchase of the product
Selective service managementCustomer is merely rudimentally integrated in the configuration of the service system
Integrated service managementfrom offer change to the cultural and behavioural change
Tran
scul
tura
tion
Customerintegrator
Black- Box provider
Pure productmanufacturer
Problem solverOffer change
Today
trade-off
selective service management
Integrated service management
Source: Belz, Schuh et al (1997)
Notes:Industrial companies that disregard their services or execute them dilettantishly will have a lot of problems as manufacturers in the future. The change to a contractor with an all-embracing service system (products and services) creates better requirements for proximity to the customer. To have a successful change there are two rudiments described by the determinate of proximity to the customer.
The selective service management supports the company in the change of the offer from a pure product manufacturer to a customer-orientated problem solver. The focus lies on industrial services. These are getting more professional in order to improve the problem solutions of the customer.
The integrated service management is an adaptation of company development. Among the offer change the company takes part of a synchronistical trans-culturation and behavioural changing. The „Black-Box“ provider becomes a customer integrator. His job is to coordinate the external customer requirements with internal possibilities. Different divisions of the companyare integrated in those service processes which are value-raising for the customers.

Production Management B – Spring Semester 2009
Customer Relationship Management L02 P. 31
Lecture 02
Seite 31© WZL/Fraunhofer IPT
Customer retention with complementary servicesHow much service is reasonable?
Increasing part of individual services
Multi-part products with complex structure
Multi-part productswith simple structure
Single partproducts
Increasing part of individual product services
Incr
easi
ng p
art o
f ind
ustr
ial
serv
ices
Mass production
Serial production
Unit-/ Limited-lot production
One-time production
Part supplier
Module contractor
Product manufactorer
Plant manufacturer
Product structure
Production concept
Notes:

Production Management B – Spring Semester 2009
Customer Relationship Management L02 P. 32
Lecture 02
Seite 32© WZL/Fraunhofer IPT
Structure
Know-How: appreciating markets and customers 1
Sell: attracting customers2
Target: developing service offers3
Service: committing customers4
eCRM: supporting systems5

Production Management B – Spring Semester 2009
Customer Relationship Management L02 P. 33
Lecture 02
Seite 33© WZL/Fraunhofer IPT
IT-support for CRM systems
Communicative CRMControl, support and synchronisation of all communication channels to customer
Operative CRMApplications that have direct contact to customer (Front Office). They support the dialogue with the customer
Analytical CRMSystematic record and analysis of customer contacts and -communication.Response to differentiatedcustomer requirements
Supply Chain Management
Enterprise Resource Planning
CIM ….
Customer Interaction
Center
Closed Loop Architecture
Customer Data Warehouse
and Data Marts
Data Mining OLAP
PersonelContact
InterneteMail
MailingsTelephone
Wap
TV/Radio
Marketing Automation
Sales Automation
Service Automation
Source: Hippner, Wilde (2001)
AnalyticalCRM
CommunicativeCRM
OperativeCRM Front
Office
Back Office
Notes:The dynamic development of customer relationships is realised on the basis of the CRM-approach. This approach provides the strategy and the adequate tools to learn constantly by measurable actions. Thus each customer relationship is more and more improved. By this way CRM enhances the comprehension of the fact that „I can not live without the customer“ to the goal-oriented strategy „to grow with the customer“.
A decisive separation in present CRM systems is brought by the changeover from the communicative to the operational part of the system.
The direct contact to the customer and the admission of the customer-related data occurs in the communicative part. This data is used in the operational part to achieve an adjustment of corporate activities relating to marketing, sales and service. A target-orientated conditioning of customer-related data is coming to the fore in the analytical part of CRM-systems.
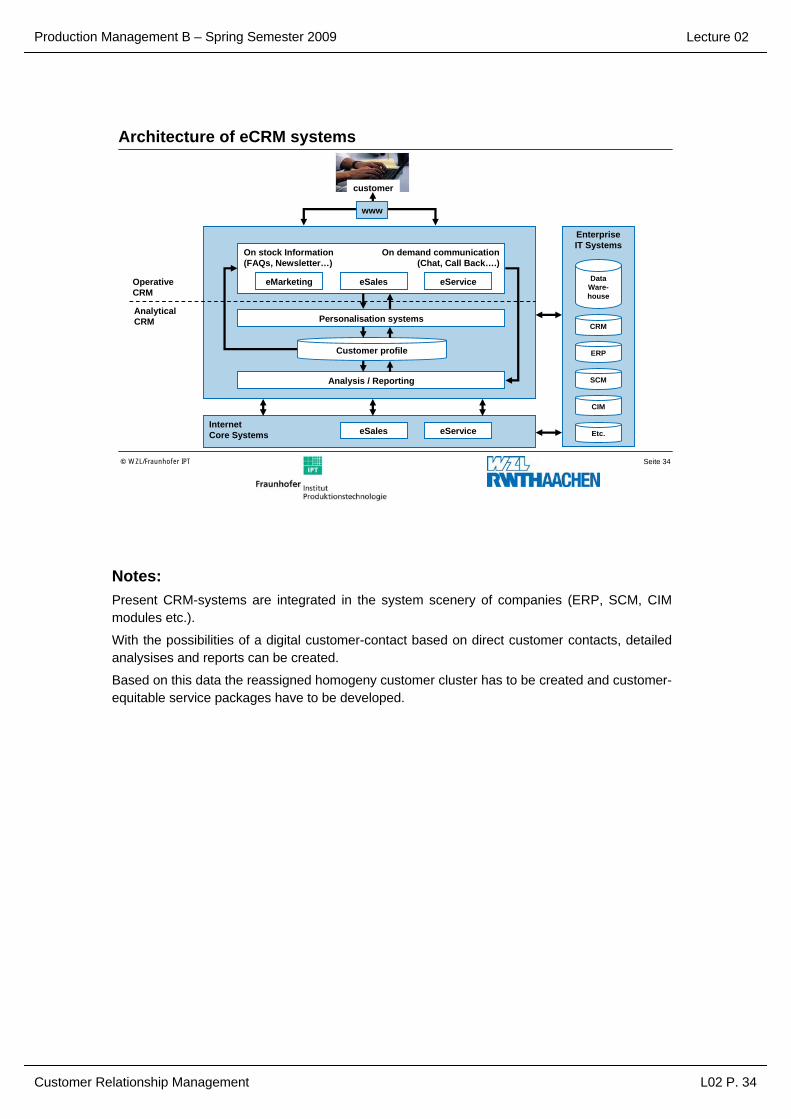
Production Management B – Spring Semester 2009
Customer Relationship Management L02 P. 34
Lecture 02
Seite 34© WZL/Fraunhofer IPT
Architecture of eCRM systems
Personalisation systems
Analysis / Reporting
eMarketing eSales eService
Customer profile
On stock Information(FAQs, Newsletter…)
On demand communication(Chat, Call Back….)
Data Ware-house
CRM
ERP
SCM
CIM
Etc.
EnterpriseIT Systems
eSales eServiceInternetCore Systems
Operative CRM
AnalyticalCRM
customer
www
Notes:Present CRM-systems are integrated in the system scenery of companies (ERP, SCM, CIM modules etc.).
With the possibilities of a digital customer-contact based on direct customer contacts, detailed analysises and reports can be created.
Based on this data the reassigned homogeny customer cluster has to be created and customer-equitable service packages have to be developed.

Production Management B – Spring Semester 2009
Customer Relationship Management L02 P. 35
Lecture 02
Final statement:
Getting informed about the aims and fields of action of the CustomerRelationship Management
Presentation of the relationship between customer bonding and enterprisevalue
Presentation of a method for the identification of profitable customers and market clusters
Systematics for the design of customer-oriented products and services
Presentation of a method for the estimation of customer value
Production Management B – Spring Semester 2009
Customer Relationship Management L02 P. 36
Lecture 02
Questions:
What goals does the Customer Relationship Management have?
What are the characteristics of customer-oriented companies?
Which relationship exists between the customer bonding and the value of a company?
What is the Customer Lifetime Value approach good for?
Which relation exists between the creation of customer clusters and the Kano-Model of customer satisfaction?
What are the elements of customer service systems and which principles are relevant for their design?
What advantages does the Conjoint-Analysis have?
What are the advantages of well-structured pricing processes for mostcompanies?

Production Management B – Spring Semester 2009
Customer Relationship Management L02 P. 37
Lecture 02
Bibliography:
Belz, C.; Schuh, G.; et al: Industrie als Dienstleister. Fachbuch für Marketing. St. Gallen: Thexis, 1997
Helmke, Dangelmaier: Effektives Customer Relationship Management –Instrumente, Einführungskonzepe, Organisation. 1. Aufl., Wiesbaden: Gabler,2001
Kalakota, Robinson: E-Business 2.0. Roadmap for success. Boston: Addison Wesley, 2001, p.164
Porter, M. E.: Competitive Advantage – Spitzenleistungen erreichen und behaupten. Frankfurt: Campus, 1996
Backhaus, K., Erichson, B., Plinke, W., Weiber, R.: Conjoint-Measurement, Kapitel 9. In: Backhaus, K.; et al. (Hrsg.): Multivariate Analysemethoden. Eine anwendungsorientierte Vertiefung. 7. Aufl., Berlin: Springer, 1994, S. 498-554
Jain; Singh: Customer Lifetime Value Research in Markteing: a Review and Future Directions, Journal of Interactive Marketing, No. 16 (2), 2002, S. 38
Krafft, M.; Bromberger, J.: Kundenwert und Kundenbindung. In: Albers, S.;Clement, M.; Peters, K.; Skiera, B. (Hrsg.): Marketing mit Interaktiven Medien. Strategien zum Markterfolg. Frankfurt am Main, 2001
Simon Kucher und Partners: unveröffentlichter Vortrag URL: www.simon-kucher.com
Eberling, G.: Kundenwertmanagement. Wiesbaden: Deutscher Universitätsverlag, 2002

Production Management B – Spring Semester 2009
Customer Relationship Management L02 P. 38
Lecture 02
Seite 38© WZL/Fraunhofer IPT
Structure
Know-How: appreciating markets and customers1
Sell: attracting customers2
Target: developing service offers3
Service: committing customers4
eCRM: supporting systems5

Production Management B – Spring Semester 2009
Enterprise Resource Planning I L03 P. 0
Lecture 03
Production Management B
Lecture 03- Enterprise Resource Planning I -
Organization:Dipl.-Ing. Sascha FuchsSteinbachstr. 53BRaum 514Phone: [email protected]
Laboratory for Machine Tools and Production Engineering
Chair of Production EngineeringProf. Dr.-Ing. Dipl.-Wirt. Ing. G. Schuh
Chair of Production ManagementProf. Dr.-Ing. A. Kampker

Production Management B – Spring Semester 2009
Enterprise Resource Planning I L03 P. 1
Lecture 03
Index:
Index Page 1
Schedule Page 2
Lecture landscape Page 3
Glossary Page 4
Short summary Page 5
Classification of lecture episode in overall lecture context Page 6
Lecture
ERP systems in production planning and scheduling Page 7
Historical development of IT systems in PPS Page 13
Company specific core tasks of ERP systems Page 21
Bibliography Page 31
Final statement Page 32
Questions Page 33

Production Management B – Spring Semester 2009
Enterprise Resource Planning I L03 P. 2
Lecture 03
Schedule:
No. Date Responsible
L1 27.04.2009 Mr. Rittstieg 0241 80 20396
L2 04.05.2009 Mr. Bartoscheck 0241 80 28203
L3 18.05.2009 Mr. Fuchs 0241 80 26265
L4 25.05.2009 Mr. Reil 0241 80 27964
L5 08.06.2009 Mr. Potente 0241 80 27387
L6 15.06.2009 Mr. Bauhoff (fir) 0241 47705-439
L7 22.06.2009 Mr. Hoeschen 0241 80 27382
L8 29.06.2009 Mr. Jung 0241 80 27392
L9 06.07.2009 Mr. Rauhut 0241 80 28206
L11 13.07.2009 Mr. Koch 0241 80 25321
L12 20.07.2009 Mr. Cuber (fir) 0241 47705-420
Customer Relations Management
Enterprise Ressource Planning I
Enterprise Ressource Planning II
Topic
IT in Production Management
Enterprise Ressource Planning III
Product Lifecycle Management II
Digitale Plant Planning and Simulation
Business Engineering - Method of selecting IT-Systems (Trovarit)
Supply Chain Management I
Supply Chain Management II
Product Lifecycle Management I

Production Management B – Spring Semester 2009
Enterprise Resource Planning I L03 P. 3
Lecture 03
Seite 3© WZL/Fraunhofer IPT
Lecture landscape of the Department of Production Engineering
• Integrated management task/job• Product and product program planning• Organization and staff conduct/behavior
L1 IT in Production ManagementL2 Customer Relations ManagementL3 Enterprise Resource Planning IL4 Enterprise Resource Planning IIL5 Enterprise Resource Planning IIIL6 Supply Chain Management IL7 Supply Chain Management IIL8 Product Lifecycle Management IL9 Product Lifecycle Management IIL10 Product Lifecycle Management IIIL11 Digital Production site planning and simulationL12 Methodology for system selection
Quality ManagementTechnical InvestmentPlanning
Cost Management in Workshops
Production Management II
Production Management I Manufacture andAssembly Compatible Construction
Production Site Planning
Innovation Managementwith Dr. Wiedeking
• Basics• Methods and auxiliary means/devices• Process & construction organization
• Construction task in small group• Construction examples• Construction regulations
• Workshop facility planning• Storage & transportation planning• Human resources planning
• Cost accounting• Investment appraisal & evaluation• Balances
• Quality assurance systems• Quality planning• Product liability
• Workshop facility planning• Technology planning• Cost accounting
Notes:

Production Management B – Spring Semester 2009
Enterprise Resource Planning I L03 P. 4
Lecture 03
Glossary:
UtilisationUtilisation describes the level of efficiency. It is the ratio between a maximum and real utilisation factor.
PDA = Production data acquisition PDA is the term for acquisition of different actual data of the production process. (exp. process, job, and machine data).
DispatchingDispatching is the separation on quantity basis to the necessary resources.
EAI = Enterprise Application IntegrationEAI is a concept for integration of different software structures company-wide.
ERP = Enterprise Ressource PlanningERP is a holistic and process orientated software solution with the function for production planning and controlling.
MDA = Machine data acquisitionThe interface between production machines and the information processing.
MES = Manufacturing Execution SystemMES monitors manufacturing processes in real time by direct connection to production.
MRP = Material Requirement PlanningMRP is a task for determination of material requirements, procurement, storage and allocation of raw materials, parts and components which are needed for production.
MRPI = Material Requirement Planning IMRP I was developed as feature for MRP to involve production capacity in planning processes.
MRPII = Material Resource Planning IIMRP II ought to be a feature for MRP I to include strategic and economic aspects of production planning.
Primary requirements Primary requirements define the necessary amount of manufactured goods in a planning period.
Secondary requirements Secondary requirements define the necessary amount of raw material and sub- assembly goods maintaining primary requirements.
Bill explosion In MRP, bill explosion is a separation of different production orders for example parts, components and sub- assembly parts.

Production Management B – Spring Semester 2009
Enterprise Resource Planning I L03 P. 5
Lecture 03
Short summary:
ERP-systems (ERP = Enterprise Resource Planning) are among other things used to support production planning and control (PPC).
In the course of the development of IT-systems the functionality has been extended from a mere quantity planning to a companywide information integration.
Dependent on the type of order processing and company targets the PPS elements has to be adjusted individually.

Production Management B – Spring Semester 2009
Enterprise Resource Planning I L03 P. 6
Lecture 03
Seite 6© WZL/Fraunhofer IPT
Classification of the lecture episode ERP into the context
Custo-mersSuppliers
CRMSCM
PLM
Products
ResourcesER
P
Company
Notes:

Production Management B – Spring Semester 2009
Enterprise Resource Planning I L03 P. 7
Lecture 03
Seite 7© WZL/Fraunhofer IPT
Gliederung
ERP systems for production planning and scheduling 1
Historical development of IT systems in production planning and scheduling2
Typology specific core tasks of ERP systems3
Notes:

Production Management B – Spring Semester 2009
Enterprise Resource Planning I L03 P. 8
Lecture 03
Seite 8© WZL/Fraunhofer IPT
Enterprise Resource Planning for Production Planning and Scheduling
Source: Luczak
Company
Administration and corporate planning
AccountingCalculation
Sales Purchase/Acquisition
Technical order processing
Construction Operations Scheduling
Assembly
Enterprise Ressource Planning(ER
P)
Order
Material Product
Billing
Advanced Planning and Scheduling (APS)
„Classic“definitionof techn. order handling
„Enhanced“ definitionof techn. order handling
PPSControlling
Distribution
Manufacture of Components
Notes:After the classic definition the technical order processing includes every department which participates in the fabrication of the product.
After the enhanced definition the interfaces between customer and company are added (e.g. Sales, Purchase and Distribution). Therefore production planning and scheduling support the entire technical order processing between incoming and outgoing order.
Production planning pre-plans the workflow during the creation of a product for a certain time considering certain general conditions and realizing predetermined objectives.
Production scheduling tries to realize the planning as completely as possible in spite of unavoidable changes concerning the order quantity and the order date as well as disturbances by machine failure or loss of manpower, delays in delivery and scrap.
ERP is a holistic, process oriented software solution, which performs the task of production planning and control. ERP makes the required information available to all related divisions of the company.

Production Management B – Spring Semester 2009
Enterprise Resource Planning I L03 P. 9
Lecture 03
Seite 9© WZL/Fraunhofer IPT
PPS: Allocation of the production in a simplified company
Source: WZL
Development
Sale
Material flow
Information flow
PurchaseProduct creation
Logistics
Administration & Staff
Suppliers
Manufacturing Assembly Customer
Distribution
Notes:The Product creation as center of the value-added chain can be seen in the company‘s heart. Further supporting areas are the sale and administration and staff.

Production Management B – Spring Semester 2009
Enterprise Resource Planning I L03 P. 10
Lecture 03
Seite 10© WZL/Fraunhofer IPT
Task structure of PPS: PPS/ERP-Model from Aachen
Source: Schuh
Production program planning
Production requirements planning
Procurement planning and scheduling
In-plant production
planning and scheduling
Data management
Core tasks Cross-sectional tasks
Ord
er c
oord
inat
ion
ER
P-C
ontro
lling
Sto
rage
Notes:Many enterprises have come to the conclusion, that on time delivery and the delivery time have become important factors of competition. Thus the PPC-model results in a networked task structure.
The PPS-functions are structured by the core tasks in order to promote the order procedure. This includes long-term production program planning, middle-term production requirements planning, short-term in-plant production planning and scheduling and short-term procurement planning and scheduling
The cross-sectional tasks serve for trans-sectoral integration and improvement of the PPS. The data management is part of both, because all tasks of realisation share it.
Concerning the serial production the fulfillment of the core tasks is very important. On the other side the essential for the batch production and the make-to-order production is the order-specific coordination and the project management.

Production Management B – Spring Semester 2009
Enterprise Resource Planning I L03 P. 11
Lecture 03
Seite 11© WZL/Fraunhofer IPT
Task structuring of PPS/ERP (1)
Source: Schuh
Sales planningStock planningPrimary requirement planningResource rough planning (order anonymous)Gross secondary requirement determinationNet secondary requirement determinationClassification of type of procurementThroughput time scheduling Capacity requirement determinationCapacity coordination
Lot size calculationDetailed schedulingDetailed resource planningPlanning of order successionAvailability monitoringOrder releaseOrder controlResource control
Order accountOrder entry/evaluationSelection of supplierOrder releaseOrder control
Core tasks
Production program planning
Production requirements planning
Procurement planning and scheduling
In-plant production planning and scheduling
Notes:The manufactured products of the production program planning are fixed by nature, batch and provision date for a certain planning period. There are some aims to achieve: Check the sales plan regarding the operability and coordinate the general preliminary planning and the order-specific planning.
The middle-term production requirements planning – based on the production planning as the result of the PPS – includes the planning of the required resources. This covers the material requirements planning as well as the continuous scheduling and the capacity coordination.
The outcome of this are in-plant production orders classified by nature, batch and provision date.

Production Management B – Spring Semester 2009
Enterprise Resource Planning I L03 P. 12
Lecture 03
Seite 12© WZL/Fraunhofer IPT
Task structuring of PPS/ERP (2)
Source: Schuh
Order processingOrder reviewOrder rough planningResource rough planning (customer specific)Order ManagementStock logistics managementStock controlStorage location managementBatch managementStock inspectionStock takingInformation editingInformation evaluationConfigurationWorkpiece managementParts list managementWork plan managementResource managementPlanning data managementOrder managementCustomer managementSupplier management
Order coordination
Storage
Cross-sectional tasks
Data management
PPS Controlling
Notes:The cross-sectional tasks have a central character and are supposed to ensure the efficiency of the complete value chain.
The order coordination serves for the adaptation of all involved divisions of one sales order. It becomes more important by decreasing in-plant production and increasing business venture coordination as an so-called order centre.
The tasks of the storage are the direction, evaluation and estimation of the stock and the stock management.
Within the scope of the commercial control the task of the PPS Controlling is the support of the management of production while it works out transparent and interpretable information and makes them available to the management of production.

Production Management B – Spring Semester 2009
Enterprise Resource Planning I L03 P. 13
Lecture 03
Seite 13© WZL/Fraunhofer IPT
Gliederung
ERP systems for production planning and scheduling 1
Historical development of IT systems in production planning and scheduling2
Typology specific core tasks of ERP systems3
Notes:

Production Management B – Spring Semester 2009
Enterprise Resource Planning I L03 P. 14
Lecture 03
Seite 14© WZL/Fraunhofer IPT
Quantity planning
MR
P
time-phased production plan for final products
primary requirements (manufactures)
gross dependent requirementsexplosion of bill of materials
net dependent requirementsstocks
The initial MRP concept, i.e. the determination of quantity and material requirements, was developed in the fifties and represents the change from a consumption-oriented to a demand-oriented dispatching of material.
MRP: Material Requirement Planning
Source: Scheer 1990
Notes:Tasks of MRP are the determination of material requirements, procurement, storage and allocation of raw materials, parts and components which are needed for the production-line.
Starting point for MRP is a time-phased production plan for final products.
Based on this plan, MRP determines lot sizes for all intermediate products with the help of explosion of bill of materials and forward calculation of order dates in such a way that a feasible overall plan is generated. All materials needed are supplied in the required quantities early enough to guarantee in-time production of final products.
MRP only considers material quantity requirements; therefore, it does not guarantee that sufficient production capacities are available at each point of time to execute all orders planned.
Lecture 3

Production Management B – Spring Semester 2009
Enterprise Resource Planning I L03 P. 15
Lecture 03
Seite 15© WZL/Fraunhofer IPT
MRP I: Material Resource Planning I
Source: Scheer 1990
order initiation and control
capacity scheduling
production program planning
periodic aggregationcalculation of order quantity
production and assembling lots
capacity schedulingavailable capacity
fine scheduling of production orders & sequencing
order initiation
production progress monitoring
MR
P I
Quantity planning
MR
P
time-phased production plan for final products
primary requirements (manufactures)
gross dependent requirementsexploration of bill of materials
net dependent requirementsstocks
In the middle of the sixties, the MRP I concept was developed as an MRP add-on, which also included the production capacity in planning for the first time. As all information about the exact production flow isn’t always available at the time of dispatching of orders, it is common practice to feed back the results of a planning step to an earlier planning step.
Notes:MRP only deals with the material planning. MRP 1 goes one step further and expand the planning scope, i.e. MRT 1 takes into account the capacity. This way it takes place a detailed planning of all separate production orders.
Starting from the total net requirements manufacture and assembly batches are composed by means of different methods of order quantity. Afterwards they are dispatched regarding the capacity within the scope of the capacity scheduling.
It is the task of the control to implement these production targets. This comprises a fine scheduling of production orders, the origination of working operation oriented workshop orders and the controlling of the production progress.

Production Management B – Spring Semester 2009
Enterprise Resource Planning I L03 P. 16
Lecture 03
Seite 16© WZL/Fraunhofer IPT
MRP II: Management Resource Planning IIIn the eighties, the MRP II concept was finally developed, which also takes into consideration economic and strategic aspects of production planning.
The MRP II concept is still widely used because it is the basis for most current IT-systems in this field.
Source: Scheer 1990
order initiation and control
production program planning
fine scheduling of production orders & sequencing
order initiation
production progress monitoring
sales planning
budgeting
MR
P I
MR
P II
Quantity planning
MR
P
time-phased production plan for final products
primary requirements (manufactures)
gross dependent requirementsexploration of bill of materials
net dependent requirementsstocks
capacity scheduling
periodic aggregationcalculation of order quantity
production and assembling lots
capacity schedulingavailable capacity
Notes:MRP II is a technique for the planning of all resources within a manufacturing company.
It integrates monetary budgeting, market-oriented production program planning, capacity and material requirements planning as well as production control, production data acquisition (PDA) and machine data acquisition (MDA). Planning is performed sequentially with a series of feedback loops.
MRP II has evolved from MRP. We speak of MRP II if the results of MRP planning activities are fed back and used for the planning of the production program.
MRP II denotes a higher level of integration of planning, the results of which are used for further steps of corporate planning. MRP II is suitable for well predictable production processes with continuous order entries.
[source: Competence Site / Gabler Wirtschaftslexikon]

Production Management B – Spring Semester 2009
Enterprise Resource Planning I L03 P. 17
Lecture 03
Seite 17© WZL/Fraunhofer IPT
Enlargement of scope from ERP to ERP II
Source: Infor business solutions AG
Learning from MRP II:
„The maximisation of the resources utilisation results in the maximisation of profit.“
ERP / ERP II:
integrated information supply and control, monitoring and coordination of all processes and activities within the company
MR
PII
• Manufacturing control• PDA/MDA/PTA• Dispatching• Distribution• Purchasing• Logistics
• Financial accounting• Asset accounting• Cost calculation• Human resource mgmt.• Controlling/MIS• Project management• Document management
• e-Procurement• SCM• CRM
ER
P
ER
P II
CRM: Custom RelationshipMDA: Machine Data AcquisitionMIS: Management Information System
PDA: Production Data AcquisitionPTA: Process Time AcquisitionSCM: Supply Chain Management
Notes:Differences between ERP and ERP II:The task of the traditional ERP is the internal optimisation of a company. ERP II systems, in contrast, optimise the whole value-added chain by collaboration with all business partners.
Traditional ERP systems focus on production and logistics. ERP II systems are used by companies of all sectors and fields, including service companies, governments and heavy industry.
In contrast to ERP systems, which were only used inside single companies, ERP II systems link all trading partners and thus work across the borders of single companies.
While old ERP systems were designed monolithically and self-sufficiently, ERP II systems are internet based and open for integration with other systems. Their modular design allows users to choose program modules suitable for their needs.

Production Management B – Spring Semester 2009
Enterprise Resource Planning I L03 P. 18
Lecture 03
Seite 18© WZL/Fraunhofer IPT
MES as link between ERP and process level
Source: Infor business solutions AG
Coordination level
Operational level
Process level
• Production control center• Transportation control• Tool administration
• Process control • Quality management• Production data acquisition
• Material administration• Cells order management• Cells order coordination• Tool administration cell
• Machine driver• Robot manager• Robot driver
ERP
Manufacturing Execution System (MES)
Notes:ERP-systems primarily support the rough production planning and control. On deeper company levels more detailed tasks are to be performed, which belong mainly to the autonomous resource administration and control.
Generally, MES are located deeper than the ERP-levels in a software architecture. This means that the production planning is frequently created first on the ERP-level and after this it is transferred on the MES-level. On the other hand the MES-level reports to the ERP-level the operations status of the separate orders so that it could used for the logistic control, e.g. the planning for the next periods.
The different technical and business requirements are the reasons for the separation of ERP and MES. ERP primarily focus on the whole enterprise and is responsible for a logistical optimisation on a aggregated level apart from plants and lines. Mostly you do not need online actuality for it. In contrast, MES particularly execute only one production line. This includes the administration of the required logistic control data as well as e.g. technical parameter, which is not of interest to ERP-systems. In this spirit MES are the executives of ERP.

Production Management B – Spring Semester 2009
Enterprise Resource Planning I L03 P. 19
Lecture 03
Seite 19© WZL/Fraunhofer IPT
As a part of EAI ERP covers all production relevant areas
Source: WZL
Development
Sale
Purchase
Product creation
Logistics
Administration & Staff
Suppliers
Manufacturing Assembly Customer
Distribution
EAI ERP II
ERP
MRP II
MRP MES
MRP I
MES: Manufacturing Execution SystemCAD: Computer Aided Design
EAI: Enterprise Application IntegrationERP II: Enterprise Resource Planning II
ERP: Enterprise Resource PlanningMRP II: Management Resource Planning
MRP I: Material Resource PlanningMRP: Material Requirement Planning
Notes:On the top level Enterprise Application Integration-Systems (EAI) integrate all used subsystems. This covers in addition to IT-systems of the product creation those of the product development and many more.
In contrast to other integration technics, e.g. the operation integration or the data integration, the EAI approach do not modify the implementation of the several business operations. All functional interfaces are prescinded by adapters (interface converter).
(compare to slide 5)

Production Management B – Spring Semester 2009
Enterprise Resource Planning I L03 P. 20
Lecture 03
Notes:SAP R/3 is one of the most established ERP systems.
According to the latest concepts, the open modular structure enables the selection as needed of all required components.
Seite 20© WZL/Fraunhofer IPT
SAP R/3 – Examples of Established ERP-Systems
R/3R/3Client / ServerClient / Server
ABAP/4ABAP/4
FIFIFinancialaccouting
COControlling
COControlling
TRTreasury
TRTreasury
PSProjekt-system
PSProjectsystem
WFWorkflow
WFWorkflow
ISIndustrysolutions
MMMaterials manage-
ment
HRHuman
resources management
SDSaleSDSale
PPPPProduction
planning
itManage-
ment
QMQualitymanage-
ment PMPeriodical
mainte-nance
Integratedtotal
Opensystems
Client / Server
CompanyData model
Multinationality
Comprehensivefunctionality
Industry neutrality
SAPSAPsolutions
architecture
Lecture 3

Production Management B – Spring Semester 2009
Enterprise Resource Planning I L03 P. 21
Lecture 03
Seite 21© WZL/Fraunhofer IPT
Gliederung
ERP systems for production planning and scheduling 1
Historical development of IT systems in production planning and scheduling2
Typology specific core tasks of ERP systems3
Notes:

Production Management B – Spring Semester 2009
Enterprise Resource Planning I L03 P. 22
Lecture 03
Seite 22© WZL/Fraunhofer IPT
Polylemma of Production
Source: Wiendahl, Fertigungsregelung
Positioning area
0 WIPLTmin WIPCmin WIPPlan
Utilization U
Lead Time LT
Costs C
On Time DeliveryMinimum
Minimum
Maximum
Maximum
Work in Progress
Choice of the optimal operating point
on time delivery
high utilization
low work in progress
low lead time
low costs per unit size
WIPUmax
Notes:The characteristics of production systems could be well-described by a couple of management ratios. The run of the curves is a characteristic for all of them.
Analysing the illustration it appears that is not possible to fulfill all targets at the same time as best as possible. Consequently, there is no optimal operating point.
The enterprises could rather position themselves on different operating points depending on their prioritisation of strategic targets and the handling of customers. It stands to reason that targets may be changed by and by. So the chosen operating point is not static but could diversify during the development of an enterprise.

Production Management B – Spring Semester 2009
Enterprise Resource Planning I L03 P. 23
Lecture 03
Seite 23© WZL/Fraunhofer IPT
„Order Penetration Point“ – Influence on PPS and the ERP System
Supp
lier
Cus
tom
er
Procurement Manufacturing Assembly Delivery
Program dependant
stocking point
Customer dependant
Customer Decoupling Point
Logistic targets
… order penetration pointUtilization
Stocks
Throughput timesAdherence to delivery
dates
Before the … Behind the …
Program manufacturer
Variant manufacturer
Order-specific manufacturer
Source: Eversheim Betriebshütte 14.4
Notes:
The manufacturing of the products after the receipt of order shall be aimed at. In case this is impossible due to the product construction, the manufacturing times or the production structure, the products have to be prefabricated to a large extent. But this is not possible with products of a high number of variants or even less with customer specific solutions.
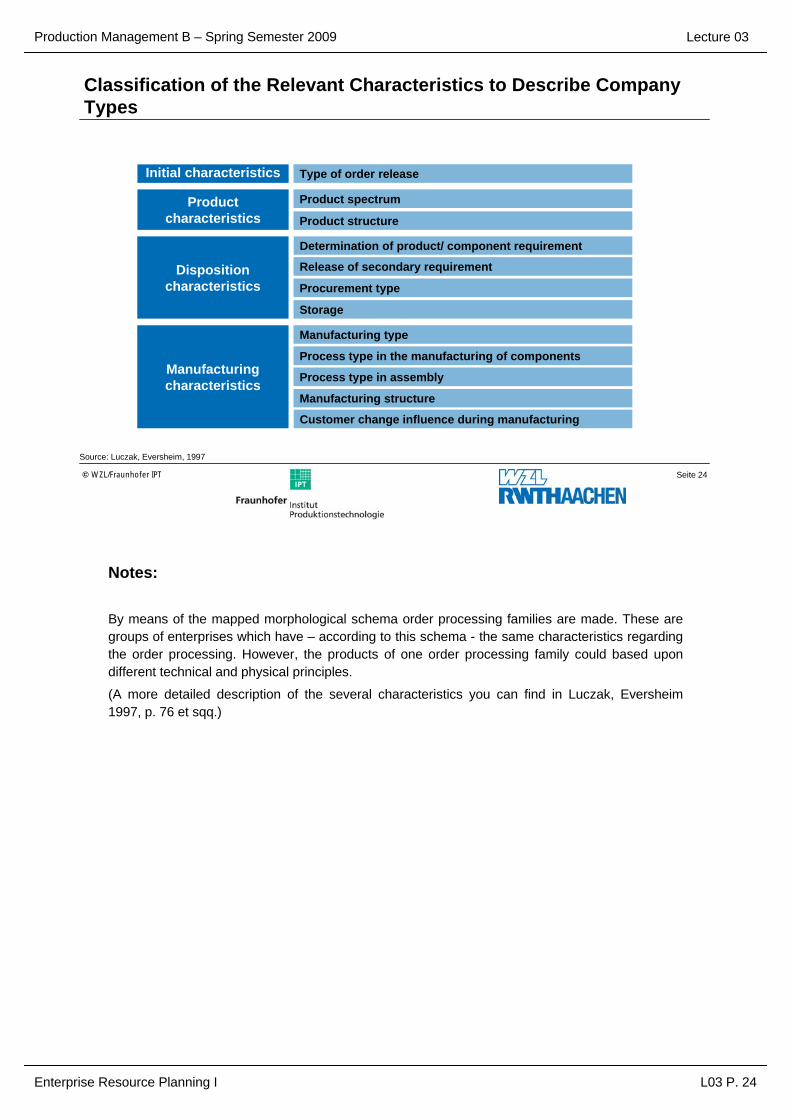
Production Management B – Spring Semester 2009
Enterprise Resource Planning I L03 P. 24
Lecture 03
Seite 24© WZL/Fraunhofer IPT
Classification of the Relevant Characteristics to Describe Company Types
Initial characteristics Type of order release
Product characteristics
Product spectrum
Product structure
Disposition characteristics
Determination of product/ component requirement
Release of secondary requirement
Procurement type
Storage
Manufacturing characteristics
Manufacturing type
Process type in the manufacturing of components
Process type in assembly
Manufacturing structure
Customer change influence during manufacturing
Source: Luczak, Eversheim, 1997
Notes:
By means of the mapped morphological schema order processing families are made. These are groups of enterprises which have – according to this schema - the same characteristics regarding the order processing. However, the products of one order processing family could based upon different technical and physical principles.
(A more detailed description of the several characteristics you can find in Luczak, Eversheim1997, p. 76 et sqq.)

Production Management B – Spring Semester 2009
Enterprise Resource Planning I L03 P. 25
Lecture 03
Seite 25© WZL/Fraunhofer IPT
Typology „Order-specific Manufacturer"Structure sizes Order related producing company
Type of order release
Product spectrum
Product structure
Determination of the product/comp.
requirementRelease of the
secondary requirement
Procurement type
Storage
Manufacturing type
Process type in manufacture
Process type in assembly
Manufacturing structure
Customer change influences during
manufacture
1
2
3
4
5
6
7
8
9
10
11
12
Production on order with individual orders
Production on order with blanket orders
Customer anonymous precustomer order
related final production
Production on store
Products after customer
specification
Typed products with customer specific
variants
Standard products with variants
Standard productswithout variants
Multi-part products with complex structure
Multi-part products with simple structure Few-part products
According to requirement
on result level
Partly according to expectations, partly according to requirementson comp. level
According to expectations on
components level
According to expectations on
product level
Usage orientated on product level
Order orientated partly order orientatedpartly period orientated Period orientated
largeexternal procurement
External procurement in a bigger scale
Little external procurement
No stocking of requirement
positions
Stocking of requirement positions
on lower structure levels
Stocking of requirement positions
on upper structure levels
Stocking of products
Non-repetitive production
Unit and limited-lot production Series production Mass production
Workshop production Island production Batch production Continuous
production
Construction site assembly Group assembly Batch assembly Continuous flow
assembly
Manufacture with large depth
Manufacture with medium depth
Manufacture with minor depth
Many changing influences
Occasional changing influences
Few changing influences
Source: Eversheim BH 14.63
Notes:The order-specific manufacturer produce on order by individual appointments. The range of products comprises products depending on customers specifications with multipart and complex structures. The type of production unit and limited-lot production distinguishs oneself by no stocking of required positions. The product and components requirements turn out demand-orientated on the product level. The secondary requirements are released order related whereas the external procurement becomes more important. Workshop production is the predominant type of production. The assembly takes place at a fixed workstation with a large manufacture depth. This means that there is a high number of production steps and sequent operations. Furthermore, customers preferences and influences appear during the production to a greater extent.

Production Management B – Spring Semester 2009
Enterprise Resource Planning I L03 P. 26
Lecture 03
Seite 26© WZL/Fraunhofer IPT
Main control loop
Control loop
ERP Configuration „ Order-specific Manufacturer"
Customer order inducementand control
Determination of delivery dateResource planning
Resourcedisposition
Manufacture control(anticipated)
Customer specificproduct development
Customer
Prod
uct
Procurement Product creation
Supply confirmation
Source: Eversheim Betriebshütte 14.65
Notes:
It followed from the described factors above and their characteristics certain requirements for the PPS. These also influence the use of the several PPS-features to a great extent.
Main production targets
• Adherence to delivery dates
• Short throughput times
• Readiness to provide information
Planning focus
• Coordination of product development and product creation
• Production start without exact specification of the product
• Consideration of insecure order offers
• Insecure capacity requirements and processing times
Control focus
• Order inducement
• Order control/supervision
• Reaction on short-term plan deviations due to Customer’s change preferences

Production Management B – Spring Semester 2009
Enterprise Resource Planning I L03 P. 27
Lecture 03
Seite 27© WZL/Fraunhofer IPT
Typology „Program Manufacturer"Structure sizes Program bound producing company
Type of order release
Product spectrum
Product structure
Determination of the product/comp.
requirementRelease of the
secondary requirement
Procurement type
Storage
Manufacturing type
Process type in manufacture
Process type in assembly
Manufacturing structure
Customer change influences during
manufacture
1
2
3
4
5
6
7
8
9
10
11
12
Production on order with individual orders
Production on order with blanket orders
Customer anonymous precustomer order
related final production
Production on store
Products after customer
specification
Typed products with customer specific
variants
Standard products with variants
Standard productswithout variants
Multi-part products with complex structure
Multi-part products with simple structure Few-part products
According to requirement
on result level
Partly according to expectations, partly according to requirementson comp. level
According to expectations on
components level
According to expectations on
product level
Usage orientated on product level
Order orientated partly order orientatedpartly period orientated Period orientated
largeexternal procurement
External procurement in a bigger scale
Little external procurement
No stocking of requirement
positions
Stocking of requirement positions
on lower structure levels
Stocking of requirement positions
on upper structure levels
Stocking of products
Non-repetitive production
Unit and limited-lot production Series production Mass production
Workshop production Island production Batch production Continuous
production
Construction site assembly Group assembly Batch assembly Continuous flow
assembly
Manufacture with large depth
Manufacture with medium depth
Manufacture with minor depth
Many changing influences
Occasional changing influences
Few changing influences
Source: Eversheim BH 14.67
Notes:
Concerning the operative factors the characteristics of program bound types of production are completely different from order orientated types. Besides the order-specific manufacturer the program manufacturer is the other extreme form. In contrast to the order orientated production the product development is not part of the order processing but it is already completed before. There are only standard products without variants, which are produced in store, and few-part products. The production and components requirements are identified on the production level order orientated. Furthermore, the release of secondary requirements is period orientated and the external procurement only plays a subordinate part. The flow assembly and production are the preferred process types, because the lot sizes are very large. The large depth with one production step and few sequent operations are the characteristics of the production. There is no reaction on customer’s change preferences during the production.

Production Management B – Spring Semester 2009
Enterprise Resource Planning I L03 P. 28
Lecture 03
Seite 28© WZL/Fraunhofer IPT
ERP Configuration “Program Manufacturer"
Production program planning
Resourcedisposition
Order inducementOrder control/supervision
Market
Customer
Push control
Finished goods store
Cus
tom
er a
nony
mou
spr
oduc
t dev
elop
men
t
Main control loop
Control loop
Product spectrum
Procurement Product creation
Sales forecast
Source: Eversheim Betriebshütte 14.69
Notes:
The differences between order-specific and program manufacturer also cause other main focuses concerning the use and specification of several PPS-features.
Main production targets
• High and steady capacity utilization
• Low costs
Planning focus
• No planning of indirect areas
• Permanent material availability
• Minimal control effort in order to save expenses
Control focus
• Fault repair
• Control of efficiency and quality
• Equipment availability (material, tools, devices)

Production Management B – Spring Semester 2009
Enterprise Resource Planning I L03 P. 29
Lecture 03
Seite 29© WZL/Fraunhofer IPT
Typology „Variant Manufacturer"Structure sizes Company producing variants
Type of order release
Product spectrum
Product structure
Determination of the product/comp.
requirementRelease of the
secondary requirement
Procurement type
Storage
Manufacturing type
Process type in manufacture
Process type in assembly
Manufacturing structure
Customer change influences during
manufacture
1
2
3
4
5
6
7
8
9
10
11
12
Production on order with individual orders
Production on order with blanket orders
Customer anonymous precustomer order
related final production
Production on store
Products after customer
specification
Typed products with customer specific
variants
Standard products with variants
Standard productswithout variants
Multi-part products with complex structure
Multi-part products with simple structure Few-part products
According to requirement
on result level
Partly according to expectations, partly according to requirementson comp. level
According to expectations on
components level
According to expectations on
product level
Usage orientated on product level
Order orientated partly order orientatedpartly period orientated Period orientated
largeexternal procurement
External procurement in a bigger scale
Little external procurement
No stocking of requirement
positions
Stocking of requirement positions
on lower structure levels
Stocking of requirement positions
on upper structure levels
Stocking of products
Non-repetitive production
Unit and limited-lot production Series production Mass production
Workshop production Island production Batch production Continuous
production
Construction site assembly Group assembly Batch assembly Continuous flow
assembly
Manufacture with large depth
Manufacture with medium depth
Manufacture with minor depth
Many changing influences
Occasional changing influences
Few changing influences
Source: Eversheim 14.80
Notes:
In practice you can basically find specifications as a mixture of both principles. The customer decoupling point of most of the enterprises is located between the two extreme forms. There are also enterprises with a large range of products where the customer penetration point could even be different within an enterprise. During the industrial development the role of the product bound production lost importance. Nowadays you can still find a program orientated production in the consumer goods industry, e.g. domestic appliances. The requirements on PPS are rising independent of the type of enterprise by the increasing variety of products because of the customer’s demands for special solutions. Therefore non-repetitive, unit and limited-lot and series production enterprises increase their product-, chain- and production system complexity. The variety of products concerns the assortment variety as well as the variety on the assembly group and components level. The considerable problems of the PPS result from the rise of part numbers and complexity of the process organisation. Therefore the PPS has to fulfill their tasks concerning capacities, order control and material provision in spite of difficult marginal conditions. These are frequent operation changes and an increasing error rate of automated plants.

Production Management B – Spring Semester 2009
Enterprise Resource Planning I L03 P. 30
Lecture 03
Seite 30© WZL/Fraunhofer IPT
ERP Configuration „Variant Manufacturer"
M Montage
Main control loop
Control loop
Production program planning
Resourcedisposition
Order inducementOrder control/supervision
Order
Push control
Product
Customer
Sale
Procurement Customer specificProduct creation
Sales forecastC
usto
mer
ano
nym
ous
prod
uct d
evel
opm
ent
Product spectrum
Source: Eversheim BH 14.81
Notes:
The special requirements on PPS result from the combination of particulate contrary characteristics. These arise out of the work of the variant manufacturer.
Main production targets
• High utilisation
• Low stocks
• Readiness to provide information
Planning focus
• Program planning
• Quantity planning
• Optimal product succession/order regarding the production system
Control focus
• Fault repair
• Control of efficiency and quality

Production Management B – Spring Semester 2009
Enterprise Resource Planning I L03 P. 31
Lecture 03
Bibliography:
/1/ Infor business solutions AG:
inforMES – Manufacturing Execution System Produktionsinformationsschrift, Friedrichsthal 2003
/2/ Infor business solutions AG:
inforMES – Produktionsbeschreibung Produktionsinformationsschrift, Friedrichsthal 2003
/3/ Eversheim; Schuh :
Betriebshütte – Produktion und Management. Springer-Verlag. Berlin, Heidelberg, New York. ISBN 3-540-59360-8. 1996
/4/ Scheer, A.-W.:
Der computergesteuerte Industriebetrieb, Springer, Berlin/Heidelberg, 1990
/5/ Luczak; Eversheim.:
Produktionsplanung und –steuerung, Springer Verlag, 1997
/6/ Gabler Wirtschaftslexikon, 1997

Production Management B – Spring Semester 2009
Enterprise Resource Planning I L03 P. 32
Lecture 03
Final statement:The lecture overviews the scope of duty in production planning and scheduling. The Aachener PPS model, as a PPS description model with different perspectives, is described by the task view.
Today the IT support plays a great role in production planning and scheduling. Established systems are generally called ERP systems. They are based on the MRP II logic with all ist tasks. The planning process proceeds successively in several loops. One level below several detail solutions can be found. They are called MES systems and fulfill special demands on the shop floor.
Especially during the planning phase it is important to define target values to adjust the production. The polylemma of production describes, that not every target value can be fulfilled equally.
During the configuration of ERP systems the order penetration point is very important. It identifies which logistic target, e.g. utilization or adherence to delivery dates, has primarily to be followed. Depending on the company typology the ERP system has to be configured differently.

Production Management B – Spring Semester 2009
Enterprise Resource Planning I L03 P. 33
Lecture 03
Questions:• Which are the fundamental elements of technical order processing?
• What are the tasks of production planning and scheduling?
• Which concept is the basis for modern ERP systems?
• Why are short throughput times and a high utilization at the same time problematic?
• Which typologies are distinguished and what is their characteristic?
• What are the ERP core tasks in the different typologies?

Production Management B – Spring Semester 2009
Enterprise Resource Planning I L03 P. 34
Lecture 03
Seite 34© WZL/Fraunhofer IPT
Gliederung
ERP systems for production planning and scheduling1
Historical development of IT systems in production planning and scheduling2
Typology specific core tasks of ERP systems3

Production Management B – Spring Semester 2009
Enterprise Resource Planning II (ERP) L04 P. 0
Lecture 04
Production Management B
Lecture 04Enterprise Resource Planning II (ERP)- Order Clarification and Configuration -
Organisation:Dipl.-Ing. Dipl.-Wirt. Ing. Tobias ReilSteinbachstr. 53BRoom 521Phone: [email protected]
Laboratory for Machine Tools and Production Engineering
Chair of Production EngineeringProf. Dr.-Ing. Dipl.-Wirt. Ing. G. Schuh
Chair of Production ManagementProf. Dr.-Ing. A. Kampker

Production Management B – Spring Semester 2009
Enterprise Resource Planning II (ERP) L04 P. 1
Lecture 04
Index:Index Page 1Schedule Page 2Glossary Page 3Targets of this lecture Page 5Lecture
Introduction and basics Page 6
Tools for the generation of an offer Page 10
Product Configuration Page 16
Example of a product configuration Page 30
Final Statement Page 38
Questions Page 39
Bibliography Page 40

Production Management B – Spring Semester 2009
Enterprise Resource Planning II (ERP) L04 P. 2
Lecture 04
Schedule:
No. Date Responsible
L1 27.04.2009 Mr. Rittstieg 0241 80 20396
L2 04.05.2009 Mr. Bartoscheck 0241 80 28203
L3 18.05.2009 Mr. Fuchs 0241 80 26265
L4 25.05.2009 Mr. Reil 0241 80 27964
L5 08.06.2009 Mr. Potente 0241 80 27387
L6 15.06.2009 Mr. Bauhoff (fir) 0241 47705-439
L7 22.06.2009 Mr. Hoeschen 0241 80 27382
L8 29.06.2009 Mr. Jung 0241 80 27392
L9 06.07.2009 Mr. Rauhut 0241 80 28206
L11 13.07.2009 Mr. Koch 0241 80 25321
L12 20.07.2009 Mr. Cuber (fir) 0241 47705-420
Customer Relations Management
Enterprise Ressource Planning I
Enterprise Ressource Planning II
Topic
IT in Production Management
Enterprise Ressource Planning III
Product Lifecycle Management II
Digitale Plant Planning and Simulation
Business Engineering - Method of selecting IT-Systems (Trovarit)
Supply Chain Management I
Supply Chain Management II
Product Lifecycle Management I

Production Management B – Spring Semester 2009
Enterprise Resource Planning II (ERP) L04 P. 3
Lecture 04
Glossary:
Offer Calculation:The offer calculation is the calculation of the offer or quotation price. In order of increasing accuracy, the following methods can be deployed:- Estimation (experience-based)
- Cost-per-kg- or material-cost-method
- Calculation based on cost functions
- Calculation broken down to individual parts
While an estimation may require the least effort, it at the same time provides the lowest accuracy. A calculation broken down to individual components requires a large effort, but generates a quotation price with the maximum accuracy. (Schuh 2005)
Order Clarification:The order clarification is the process of clarifying and specifying the customer requirements as completely as possible. The difficulties in the offering phase are based on the fact that usually not all customer requirements can be entirely specified. Whether or not an offer should be generated and an order should be accepted, can only be estimated based on experiences with similar products.
Based on the information from the order clarification phase, an order selection can be performed under consideration of the profit margin, the demanded and the possible delivery date. (Schuh 2005)
Module:Modules are parts to be attached, that enable a manifold combinability of components and an efficient creation of variety based on separate function, but unified product interfaces. The principle of modularisation is especially well suited to represent a high product variety with only limited effects on the product complexity. (Schuh 2005)

Production Management B – Spring Semester 2009
Enterprise Resource Planning II (ERP) L04 P. 4
Lecture 04
Module Building Set:Module Building Sets are characterised by one or few base elements, onto which modules of differing variety can be mounted over various assembly steps. This principle is a common basis for bill-of-material structures in the area of plant engineering and construction. The difference to a pure module approach lies in the existence of base elements, but not in the existence of and structuring into different modules as parts to be attached. (Schuh 2005)
Product Configuration:Product configuration means the composition of products or system solutions based on standardised components and on a knowledge base of predefined configuration rules. This composition of products happens according to customer specifications. (Schuh 2005)
Product Structure:A product structure is the structured composition of components to a product. Sub-assembly components and individual parts lead to structure steps by bundling those components and parts on a lower level in the product structure. (Schuh 2005)
Production Management B – Spring Semester 2009
Enterprise Resource Planning II (ERP) L04 P. 5
Lecture 04
Targets of this Lecture:
Separation of the tasks in the order process particularly in companies with an order-bound production
Explanation and description of appropriate methods and tools to the rationalisation of the order process
Terminisation of the offering phase
Calculation of the offering costs
Configuration of products

Production Management B – Spring Semester 2009
Enterprise Resource Planning II (ERP) L04 P. 6
Lecture 04
Seite 6© WZL/Fraunhofer IPT
Structure
Introduction and basics1
Tools for the generation of an offer2
Product configuration3
Example of a product configuration4
Notes:

Production Management B – Spring Semester 2009
Enterprise Resource Planning II (ERP) L04 P. 7
Lecture 04
Seite 7© WZL/Fraunhofer IPT
Relation between Supply and Demand
Order-specific manufacturer
(build-by-order)
Order-specific manufacturer
(build-by-order)Variant
manufacturerVariant
manufacturerSeries
manufacturer(build-on-stock)
Series manufacturer
(build-on-stock)
CustomerCustomer
InquiryInquiry
Public authoritiesPublic authorities
Invitation to tender
Invitation to tender
MarketMarket
AnonymousAnonymous
DemandDemand
Assessment of DemandAssessment of Demand
Order processing is dependent on the type of company
Order processing is dependent on the type of company
Offer
Notes:During the series manufacturing no offering or configuration process takes place. Instead series manufacturer build on stock, therefore anonymously to the customers. The products are produced on the base of prediction to meet the markets demands. The array of the products usually contains standardized products in different versions. The series manufacturing is used in a wide array of products.
On the other hand the variant manufacturer, after getting an enquiry, chooses one solution out of many already constructed solutions. The variant manufacturer is anxious to produce as little as possible in advance and to prevent order-specific elements. The manufacturing process starts after the individual order. The array of products contains customer specified products which are usually more complicated than products from the series manufacturer.
The order-specific manufacturer is always confronted with a great number of order-specific elements, which combined with existing technical solutions lead to a significant configuration problem. Partially new constructive solutions have to be developed during the creation of the offer.

Production Management B – Spring Semester 2009
Enterprise Resource Planning II (ERP) L04 P. 8
Lecture 04
Seite 8© WZL/Fraunhofer IPT
Order Processing
OfferOffer
New compilation of standard components
Unit Construction System
New compilation of standard components
Unit Construction System
Compilation of technical solutions
Compilation of technical solutions
Individual ComponentsIndividual ComponentsStandard componentsStandard components
Product by requirementProduct by
requirement
Variant manufacturerVariant manufacturer Order-specificmanufacturer
Order-specificmanufacturer
Individualtechnical solutionsschedulescalculationsconditions
Product by catalogueProduct by catalogue
Series manufacturerSeries manufacturer
with:specificationtimes of deliveryterms of deliveryprices
WarehouseWarehouse
Notes:Because of the possible compilation of different standard components by connecting individual components, the variant manufacturer is able to satisfy the customer's demand. Hereby it is possible for the variant manufacturer to offer a great number of different products on the market without additional construction efforts. Usually individual customer's wishes which are not part of a standard component are not considered.
However the order-specific manufacturer is able to consider special requests by individual customers. During the creation of the offer, technical solutions, schedules, calculations and conditions are acquired for each specific order.

Production Management B – Spring Semester 2009
Enterprise Resource Planning II (ERP) L04 P. 9
Lecture 04
Seite 9© WZL/Fraunhofer IPT
The Offer and Offer Preparatory Tasks
Customer requirements
Form of quotation
(technical) feasibility
Order acquisition and evaluation
Declaration of
Supplying/ offering company
Specifies benefits and terms of delivery
Scheudeling
Basis for negotiation
Offer
Text
Graphics
Total price, price of components, fixed price, target price
Delivery date
Validity date
Delivery procedures
Warrenty
Penality clauses
Compilation and documentation of the technical solutions
Calculation and pricing
Determination of times and terms of delivery
Terms of business
Notes:Through the offer the company shows that it has acquired the service and is able to find the right solution to the right conditions and the right schedule. The offer is the declaration of a company to deliver an appointed product to appointed conditions. The offer is temporary and is usually the basis for negotiations.

Production Management B – Spring Semester 2009
Enterprise Resource Planning II (ERP) L04 P. 10
Lecture 04
Seite 10© WZL/Fraunhofer IPT
Structure
Introduction and basics1
Tools for the generation of an offer2
Product configuration3
Example of a product configuration4
Notes:

Production Management B – Spring Semester 2009
Enterprise Resource Planning II (ERP) L04 P. 11
Lecture 04
Seite 11© WZL/Fraunhofer IPT
Delivery Scheduling Tools
Rough scheduling proceduresRough scheduling procedures
Bar chart - procedure
Capacity scheduling - procedure
Bottleneck machine - procedure
Critical path planning
Notes:The different methods of critical path planning are very helpful tools to plan, coordinate and control complex processes, their logical links and schedules. The best known methods are Critical Path Planning (CPM), Program Evaluation and Review Technique (PERT) and the Metra-Potential-Method (MPM). (Eversheim 1996)
A good tool for the description of the duration and the chronology of the process is the bar chart procedure. This procedure is especially for smaller projects with a small amount of manufacturing steps and without complicated combinations. It is possible to create a bar chart automatically out of a critical path plan. Bar charts have a high clarity and they are easy to construct.
The capacity scheduling procedure is needed to calculate a theoretical capacity limit, while having a real and given capacity limit in mind. Already accepted orders and the conversion rate have to be considered during this procedure.
Planning principle for the bottleneck machine procedure is the bottleneck machine itself. The machine with the longest process time inside a production chain is characterized as the bottleneck machine.

Production Management B – Spring Semester 2009
Enterprise Resource Planning II (ERP) L04 P. 12
Lecture 04
Seite 12© WZL/Fraunhofer IPT
Scheduling of Offers Taking the Capacity Requirements of Quotes Previously Submitted into Account
orders accepted
capacity limit
capacity for further offers
theoretical capacity limit for offers (conversion rate 5:1)
quotes submitted
5.000
10.000
15.000
20.000
25.000
capa
city
(h/d
ay)
20 21 22 23 24 25t [calendar
week]
Notes:The shown possibility to schedule offers for companies with a low volume or piece production is called capacity scheduling procedure.Planning principle for this procedure are the capacity requirements of different products, the available manufacturing capacity, the conversion rate and the consumption of resources of already accepted orders.
Based on a given and real capacity limit it is possible to calculate a theoretically capacity limit while considering already accepted orders and the conversion rate.
The theoretically capacity limit is easily calculated by subtracting the fixed capacity and already accepted orders, multiplied by the conversion rate. The conversion rate is an indication for the number of submitted quotes which are averagely converted into concrete orders.
The difference between the theoretically capacity limit and already accepted orders results in the capacity for further orders. New orders are dispatched as soon as possible.
The capacity scheduling procedure guarantees an order process without interruptions.

Production Management B – Spring Semester 2009
Enterprise Resource Planning II (ERP) L04 P. 13
Lecture 04
Seite 13© WZL/Fraunhofer IPT
Approaches for Cost Determination
Cost-Determination
Differentiated evaluationallocation of costs according to input involved
Analogical approachestimation based on classification
E2B9621
Analyticalcalculation of individual parts
Estimationestimation based on experience
Knowledge-basedartificial intelligence
expert systems
Statisticaldeduce cost function
Parametrical
Cost function
f(x)=ax+bx2+...
Notes:Applied methods and computer-aided tools have to be adjusted to the allowed tolerance and to the probability of the order.
The effort of the cost determination of rough methods (estimation, differentiated evaluation, analogical approach) is compared to methods with a higher accuracy obviously lower.

Production Management B – Spring Semester 2009
Enterprise Resource Planning II (ERP) L04 P. 14
Lecture 04
Seite 14© WZL/Fraunhofer IPT
Quotation Costing MethodsQuotation costing methods
Determination of similar technical solutions
Production costs
Cost-per-kg-method Material cost method Calculation based on influencing factors
Calculation of individual parts
Basis: price per kg of similar products
Basis: cost structure of similar products
Basis: significant factors influencing the production costs
Basis: time value tables, wage rate, etc. of representative individual parts regarding costs
Determination of the price per kg of similar products
Determination of weight of the product to be calculated
Production costs = weight*price per kg
Determination of the cost structure of similar goods
Determination of material costs of the product to be calculated
Production costs= Σmaterial costs+%wages+%overhead costs
Cost analysis of similar products (determination of significant factors)
Generation of a cost function
Production costs= f(influencing factors)
Determination of representative new parts (regarding costs)
Determination of times, material prices wage rates, etc.
Production costs= Σproportion of material *material price + …
Notes:To generate an offer including the price, the amount of the production costs has to be well known.
If the calculated amount is higher than the actual size of the production costs, competitive prices are inhibited and the danger of fewer orders is high. On the other hand unprofitable orders might be accepted if the calculated production costs are below the actual costs.

Production Management B – Spring Semester 2009
Enterprise Resource Planning II (ERP) L04 P. 15
Lecture 04
Seite 15© WZL/Fraunhofer IPT
Problems Concerning the Clarification of Orders
Quality of the order clarification is strongly
dependent on the person processing it
High risk of overlooking certain solutions
Customer benefit of certain individual options can not be
emphasised sufficiently
Long cycle times in planning (business) units
Tardy and unspecific planning of the production flow
Customer Sales
Complexity of Products
Discrepancy between the need of explanation of
products and ability to explain of sales
Numerous iteration loops for the order clarification between
order processing unit and customer/sales
Notes:The difficulties of the offering phase partly originate in the imprecise customer's wishes.

Production Management B – Spring Semester 2009
Enterprise Resource Planning II (ERP) L04 P. 16
Lecture 04
Seite 16© WZL/Fraunhofer IPT
Structure
Introduction and basics1
Tools for the generation of an offer2
Product configuration3
Example of a product configuration4
Notes:

Production Management B – Spring Semester 2009
Enterprise Resource Planning II (ERP) L04 P. 17
Lecture 04
Seite 17© WZL/Fraunhofer IPT
Potentials of Systematic Order Clarification and Configuration
Concretion of orders
60%
workflow
30-40%
60 - 80%
information deficit
nominal curve
assembly launch
actual curve
Indirect areas of business direct
100%
Notes:The lack of transparency between contractor and customer concerning individual products often results in a paucity of information, which is not resolved until the late phase of the order process.
This means that the production has already started although not all conditions are specified. Interruptions of the production combined with significant costs might be the result.
With the aid of the order configuration the paucity of information is resolved in an earlier point of the order process. This way interruptions can be avoided.
The order configuration assists to reduce the paucity of information. System-aided configuratorssupport an early order clarification.

Production Management B – Spring Semester 2009
Enterprise Resource Planning II (ERP) L04 P. 18
Lecture 04
Seite 18© WZL/Fraunhofer IPT
Product Configuration
Source: Schuh 2005
„Product configuration denotes the combination of products or system solutions based on standardized component parts and on configuration rules stored in a data base in accordance with specifications of customers.“
Definition
Notes:
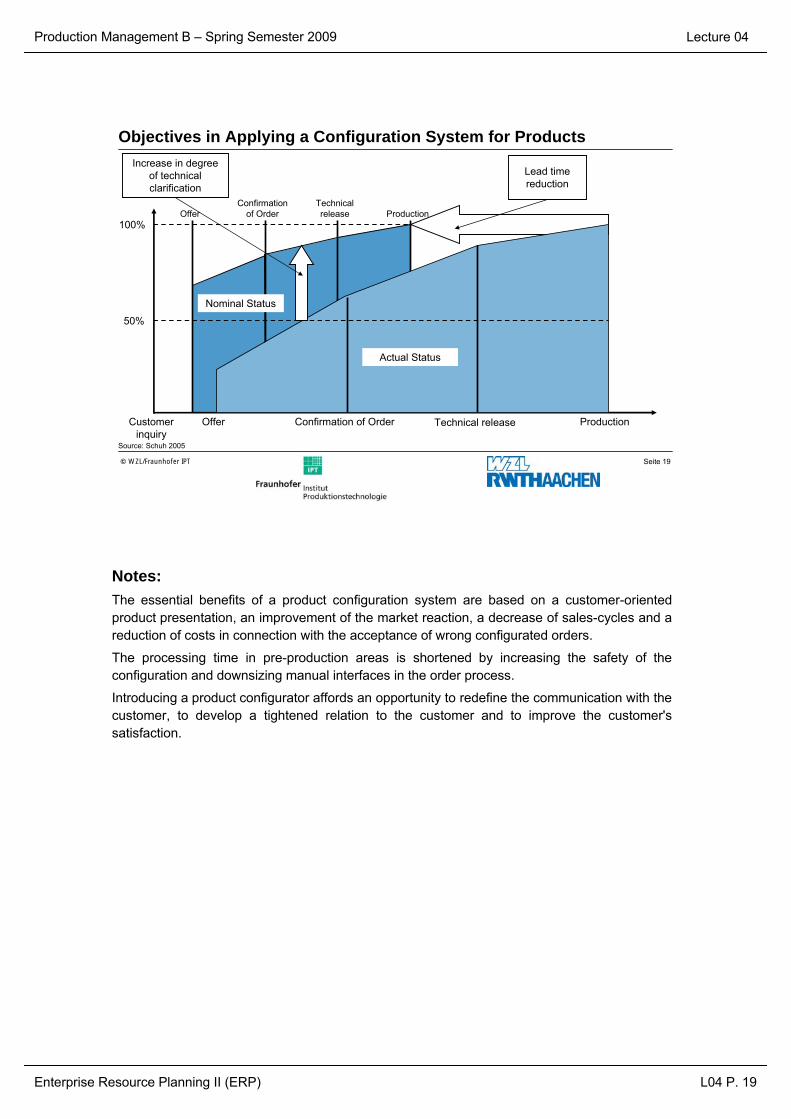
Production Management B – Spring Semester 2009
Enterprise Resource Planning II (ERP) L04 P. 19
Lecture 04
Seite 19© WZL/Fraunhofer IPT
Objectives in Applying a Configuration System for Products
Source: Schuh 2005
Offer Confirmation of Order Technical release ProductionCustomerinquiry
50%
100%
Increase in degree of technical clarification
Increase in degree of technical clarification
Lead time reduction
Lead time reduction
OfferConfirmation
of OrderTechnicalrelease Production
Actual Status
Nominal Status
Notes:The essential benefits of a product configuration system are based on a customer-oriented product presentation, an improvement of the market reaction, a decrease of sales-cycles and a reduction of costs in connection with the acceptance of wrong configurated orders.
The processing time in pre-production areas is shortened by increasing the safety of the configuration and downsizing manual interfaces in the order process.
Introducing a product configurator affords an opportunity to redefine the communication with the customer, to develop a tightened relation to the customer and to improve the customer's satisfaction.

Production Management B – Spring Semester 2009
Enterprise Resource Planning II (ERP) L04 P. 20
Lecture 04
Seite 20© WZL/Fraunhofer IPT
Functionalities and Fields of Activity of Product Configurators
Source: Dangelmaier 2001; picture: Krauss-Maffei
Distribution-oriented user guidance decision-oriented process flow
selection of standard processes
rapid information transfer
Distribution-oriented user guidance decision-oriented process flow
selection of standard processes
rapid information transfer
Documentation of special requests
Documentation of special requests
Visualisationof products
Visualisationof products
Configuration of products by testing for technical incompatibilities and identification of entries in the bill of materials
Configuration of products by testing for technical incompatibilities and identification of entries in the bill of materials
Interactive Selling System (ISS), sale of complicated high-variety products via the internet
Interactive Selling System (ISS), sale of complicated high-variety products via the internet
Established clientele: customer and Selling Information System interface
Established clientele: customer and Selling Information System interface
On-site offer preparationOn-site offer preparation
Illustration of certain specifications
Illustration of certain specifications
Argumentative help (i.e. competitive products)
Argumentative help (i.e. competitive products)
Graphical user-interface
Graphical user-interface
Interfaces to PPS-, CAD-, CRM-, und ERP-systems
Interfaces to PPS-, CAD-, CRM-, und ERP-systems
Pricing (total price and special equipment price)
Pricing (total price and special equipment price)
Notes:
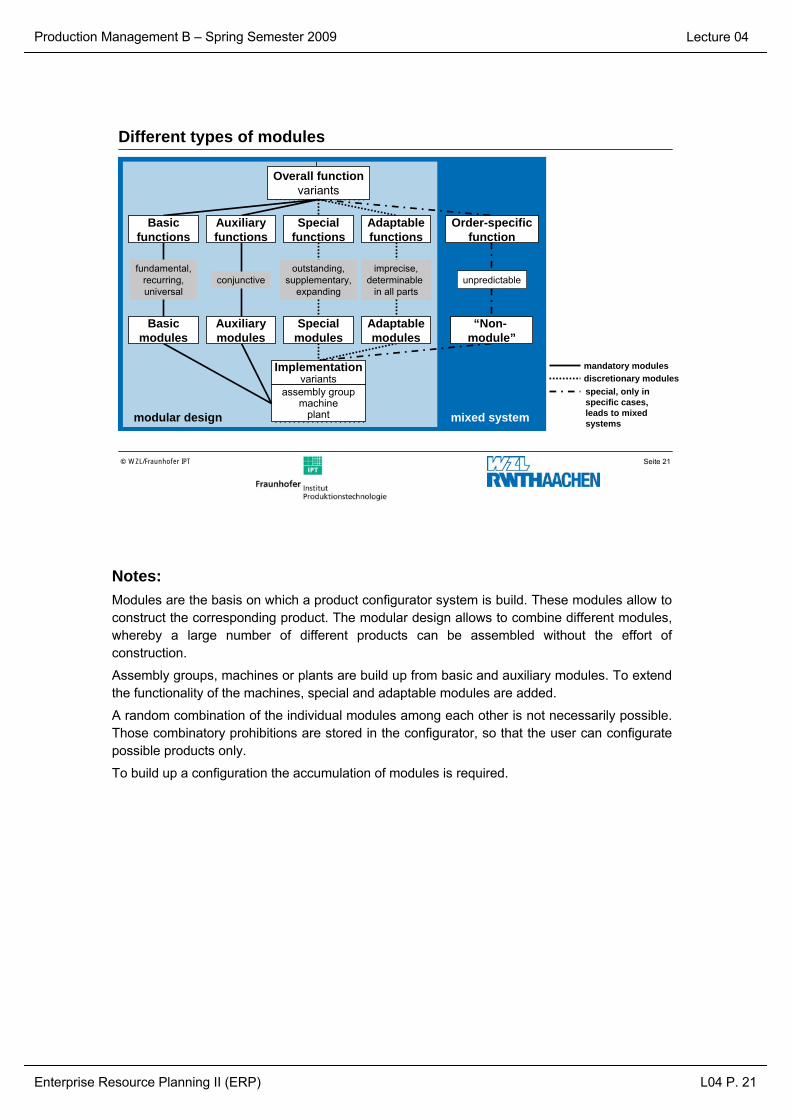
Production Management B – Spring Semester 2009
Enterprise Resource Planning II (ERP) L04 P. 21
Lecture 04
Seite 21© WZL/Fraunhofer IPT
Different types of modules
mandatory modulesdiscretionary modules
mixed system
Order-specificfunction
“Non-module”
unpredictable
modular design
fundamental,recurring,universal
conjunctiveoutstanding,
supplementary,expanding
imprecise,determinable
in all parts
Overall functionvariants
Implementationvariants
assembly groupmachine
plant
Basicfunctions
Auxiliaryfunctions
Specialfunctions
Adaptablefunctions
Basicmodules
Auxiliarymodules
Specialmodules
Adaptablemodules
special, only in specific cases, leads to mixed systems
Notes:Modules are the basis on which a product configurator system is build. These modules allow to construct the corresponding product. The modular design allows to combine different modules, whereby a large number of different products can be assembled without the effort of construction.
Assembly groups, machines or plants are build up from basic and auxiliary modules. To extend the functionality of the machines, special and adaptable modules are added.
A random combination of the individual modules among each other is not necessarily possible. Those combinatory prohibitions are stored in the configurator, so that the user can configuratepossible products only.
To build up a configuration the accumulation of modules is required.

Production Management B – Spring Semester 2009
Enterprise Resource Planning II (ERP) L04 P. 22
Lecture 04
Seite 22© WZL/Fraunhofer IPT
Module Building Set with Standard Products, Standard Variants and Variants to develop
standard module released module
module can be derived by modification new or not released module
variantsm
odul
e
Notes:

Production Management B – Spring Semester 2009
Enterprise Resource Planning II (ERP) L04 P. 23
Lecture 04
Seite 23© WZL/Fraunhofer IPT
Customer Requirements are Reflected in the Product Structure (e.g. Matrix-Method)
Connections and interdependencies between Functions
Current and future functions
Interdependencies betweenfunctions and modules
(principal/subordinate) module
neutral and non-neutralinterfaces between modules
Notes:In accordance to satisfy a big part of the market with the product varieties, the configurable product structure has to be adjusted to the customer's needs. The Matrix-Method is one possibility to reflect the product structure with the customer's needs.
This methods helps visualizing combinatory prohibitions and combinatory commandments between modules and functions. In addition the matrix-notation allows to combine functions with appropriate modules.

Production Management B – Spring Semester 2009
Enterprise Resource Planning II (ERP) L04 P. 24
Lecture 04
Seite 24© WZL/Fraunhofer IPT
Module Development and Design in accordance with Different Business Units
Source: Schuh 2005
modular structure Sales-/
customer-perspective
non-order related pre-assembly
optimal lot size
Manufacturing-/purchase perspective
R&D-perspective
Assembly-perspectiveassembly module
customer module
net benefit for
customers
functional complexes
Notes:During the development of the modules several perceptions have to be considered.

Production Management B – Spring Semester 2009
Enterprise Resource Planning II (ERP) L04 P. 25
Lecture 04
Seite 25© WZL/Fraunhofer IPT
Configuration Process
Source: Schuh 2005
list of customer requirements(completed checklist or specification sheet)
revised list of customer requirements
completed scan
data base of components
dependency rules
varied functional components
with estimated costs
functional components with forecasted costs
selection of optimal functional components
product calculation legend: computer-aided methods
functional componentswith existing costs
selection of optimal functional components, or new configuration
compilation of cost-oriented product configuration
search for conformal functional components within data base
conflict resolution
translation into distinctive scanning features
supplemental and specificationof customer requirements
Notes:The first step in the configuration process is the acquisition of the customer's requirements on the product. Checklists help to receive the necessary details and to fix them in an appropriate form for the order. At the same time the functional configuration-relevant orders has to be minded. After revising and making sure that the customer requirements are technically practicable, the computer-aided configuration process begins.
The effect of the input is a selection of product configuration components which are converted into a list of items-structure by the system. This list is available for the process plan and it's preparation.
This process, automatically accomplished by the configurator, is based on product characteristics as well as connection-functions. Furthermore the configuration process is supported by an early basis configuration and gained experience from knowledge data bases.
If the final product configuration exists, the product calculation based on price tables in the system is going to be accomplished.
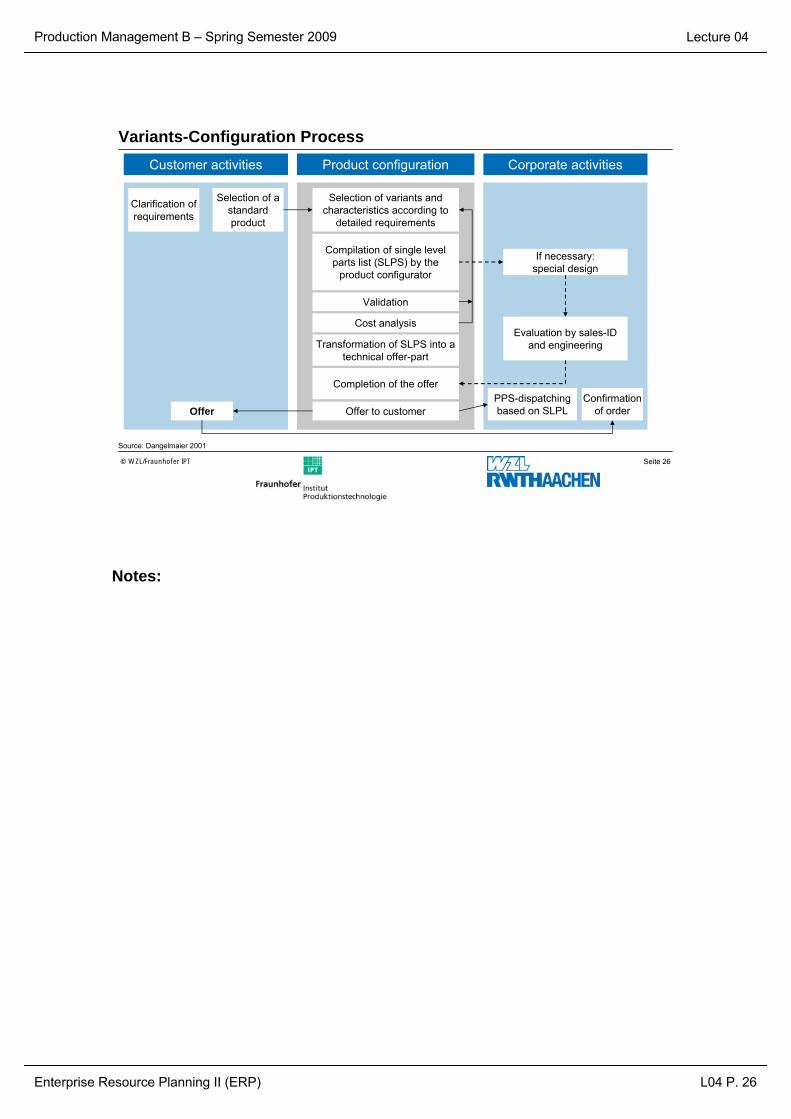
Production Management B – Spring Semester 2009
Enterprise Resource Planning II (ERP) L04 P. 26
Lecture 04
Seite 26© WZL/Fraunhofer IPT
Variants-Configuration Process
Source: Dangelmaier 2001
Corporate activitiesCorporate activitiesCustomer activitiesCustomer activities Product configurationProduct configuration
Evaluation by sales-ID and engineering
If necessary:special design
Confirmation of order
PPS-dispatching based on SLPL
Clarification ofrequirements
Selection of astandard product
Selection of variants and characteristics according to
detailed requirements
Compilation of single level parts list (SLPS) by the
product configurator
Cost analysis
Transformation of SLPS into a technical offer-part
Completion of the offer
Offer to customerOffer
Validation
Notes:

Production Management B – Spring Semester 2009
Enterprise Resource Planning II (ERP) L04 P. 27
Lecture 04
Seite 27© WZL/Fraunhofer IPT
3 Methodological Approaches of Product Configurators
Source: Schuh 2005
rule-based configurators– body of rules and regulations (complex dependencies, preclusions,
validations and calculations), configuration of customer without help of sales
interaction-based configurators- intermediate stage -– configuration by customer and/ or sales person (complex products
(e.g. machine tools), limited combinatory variety
knowledge-based configurators– sales and engineering knowledge, for cases when configurational
variety is extremely large, extremely complex objects (e.g. planning of industrial plants), illustration in the system is neither realizable nor advisable
Criteria for classification/differentiation: Where is the comprehensive configurational knowledge located?
Notes:

Production Management B – Spring Semester 2009
Enterprise Resource Planning II (ERP) L04 P. 28
Lecture 04
Seite 28© WZL/Fraunhofer IPT
Procedure for Establishing Configurational Knowledge
Source: Benett 1999
Classification of the range of products in focus
Accumulation of information and structuring
Establishment of an information base
Linkage of assembly groups and specifications
of characteristics
Depositation of combinatorics between
assembly groups
Depositation of non-order-related information
(prices, product information)
Listing of product characteristics and specifications
charact. specifications
1 a2 a
bb c
..
Classification of assembly groups:
basic (B)mandatory (M)discretional (D)special (S)
assembly groups
BG 2 X
M S
XBG 5
BXBG 1
BG 4 X
D
XBG 3
Notes:An adjusted product structure is the basis for the construction of a product configurator. Through an appropriate modularization and standardization an assembly group structure, which variety accomplishes the customer's wishes, has to be found.
It is reasonable to include not only the „technical sensible“ product varieties but also economically speaking the optimal solution. Explicit decision criterions have to be developed.
In order to make the complexity of the product configurators controllable for the user, graphically browser, which display the single objects and object's connections through icons and structure-knots, asserted themselves.

Production Management B – Spring Semester 2009
Enterprise Resource Planning II (ERP) L04 P. 29
Lecture 04
Seite 29© WZL/Fraunhofer IPT
Order Configuration –from a Non-Order-Related to a Customer-Specific Order Structure
Source: Gross 1990
SP 1SP 2
V2
V3
?
V 1
V4
Stop
4713
MV 4712
V1 V2
SP 1 SP 2 MV 4711
V3 V4
4713
MV 4712
V1 V2
SP 1 SP 2 MV 4711
V3 V4
Non-order- and non-customer-related product structure
Customer-specific order structure
Order clarification
legend:
MV = mandatory variantV = variant
structure chart
SP = single partorder parts list
Notes:A structure chart is an interrogation-logic. All possible combinations of characteristics and specifications, which describe a product type, are deflected. Through the interrogation-logic an order neutral product structure is converted into a customer specified product structure.
Production Management B – Spring Semester 2009
Enterprise Resource Planning II (ERP) L04 P. 30
Lecture 04
Seite 30© WZL/Fraunhofer IPT
Structure
Introduction and basics1
Tools for the generation of an offer2
Product configuration3
Example of a product configuration4
Notes:

Production Management B – Spring Semester 2009
Enterprise Resource Planning II (ERP) L04 P. 31
Lecture 04
Seite 31© WZL/Fraunhofer IPT
Configuration Example (1/7)
Source: Audi 2008
model
Notes:
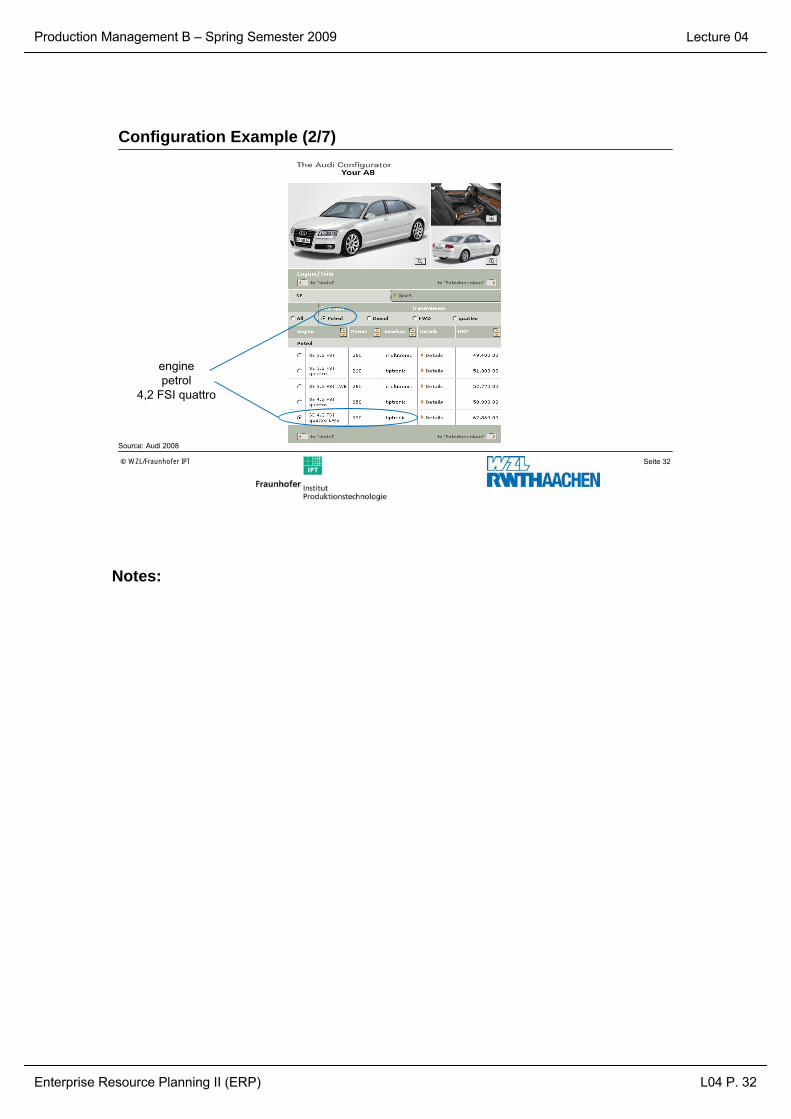
Production Management B – Spring Semester 2009
Enterprise Resource Planning II (ERP) L04 P. 32
Lecture 04
Seite 32© WZL/Fraunhofer IPT
Configuration Example (2/7)
enginepetrol
4,2 FSI quattro
Source: Audi 2008
Notes:

Production Management B – Spring Semester 2009
Enterprise Resource Planning II (ERP) L04 P. 33
Lecture 04
Seite 33© WZL/Fraunhofer IPT
Configuration Example (3/7)
Specification of functions from a customer point of view
characteristics specifications
Source: Audi 2008
Notes:
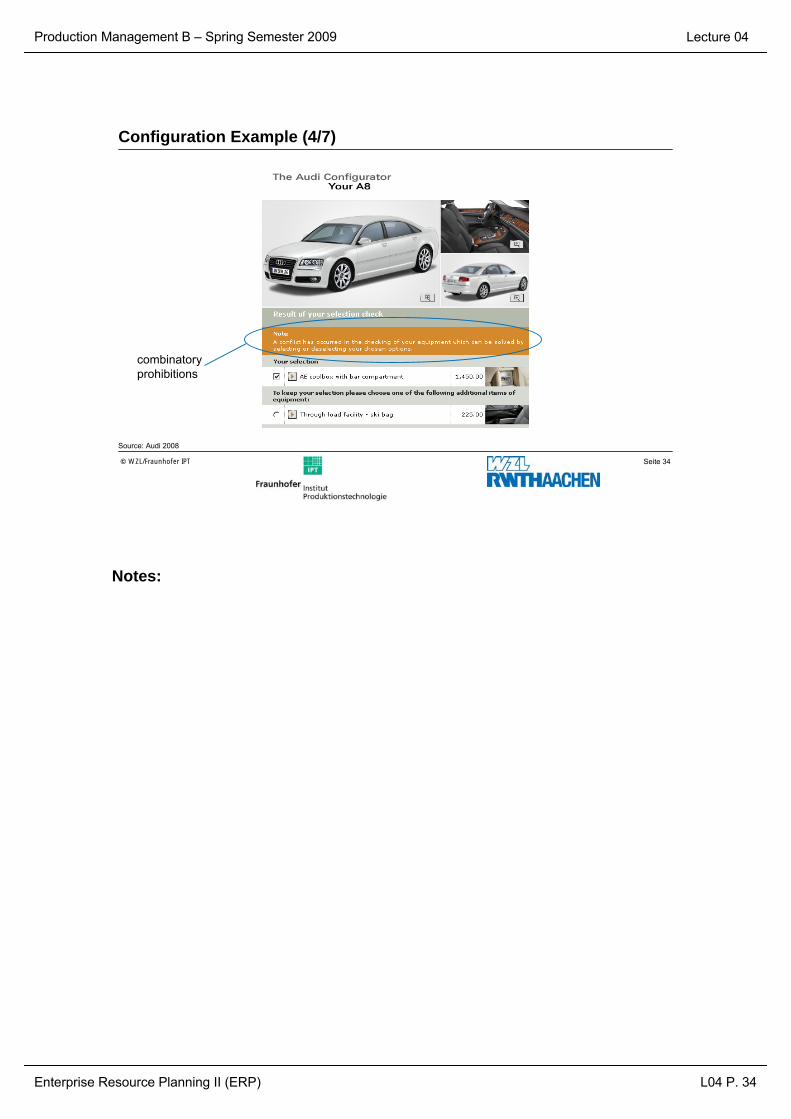
Production Management B – Spring Semester 2009
Enterprise Resource Planning II (ERP) L04 P. 34
Lecture 04
Seite 34© WZL/Fraunhofer IPT
Configuration Example (4/7)
combinatory prohibitions
Source: Audi 2008
Notes:

Production Management B – Spring Semester 2009
Enterprise Resource Planning II (ERP) L04 P. 35
Lecture 04
Seite 35© WZL/Fraunhofer IPT
Configuration Example (5/7)
complete configuration
Source: Audi 2008
Notes:

Production Management B – Spring Semester 2009
Enterprise Resource Planning II (ERP) L04 P. 36
Lecture 04
Seite 36© WZL/Fraunhofer IPT
Configuration Example (6/7)
fuel typecylinder capacity
# cylinders# valves
KW
Nmexhaust gas
gearbox
region
…
Otto4,2832171
450EU3
multitronic
EU
…
…………
191
650EU4
tiptronic
Japan
…
…………
240
440EU2B
…
…
…
…………
257
…D4…
…
…
……………
………
…
…
……………
………
…
…
……………
………
…
…
charact. specifications
Engine configuration:
engine type 4711 product line: 4,2l FSI quattro
Notes:

Production Management B – Spring Semester 2009
Enterprise Resource Planning II (ERP) L04 P. 37
Lecture 04
Seite 37© WZL/Fraunhofer IPT
Configuration Example (7/7)
1 0 6 A 1 0 3 0 1 1 A B Z Y L . K U R B E L G E H A E U S E 11 0 6 A 1 0 3 1 5 4 B S P R I T Z D U E S E 11 0 6 A 1 0 3 1 7 1 B D I C H T F L A N S C H 11 0 3 8 1 0 3 1 7 1 E D I C H T F L A N S C H 11 0 3 8 1 0 3 1 7 1 B D I C H T F L A N S C H 11 0 6 A 1 1 5 1 2 5 R O L L E N K E T T E 11 0 6 A 1 1 5 1 3 0 K E T T E N S P A N N E R 11 0 6 A 1 0 5 0 2 1 F K U R B E L W E L L E 11 0 6 A 1 1 5 1 2 1 K E T T E N R A D 11 0 6 A 1 0 5 2 0 9 K E T T E N R A D 11 0 5 0 1 0 5 1 8 9 B G E B E R R A D 11 0 2 6 1 0 5 6 3 5 A A N L A U F S C H E I B E 11 0 6 B 1 0 5 5 6 1 H A U P T L A G E R 11 0 6 A 1 1 5 1 0 5 B O E L P U M P E 11 0 6 A 1 1 5 2 5 1 S A U G L E I T U N G 11 0 6 B 1 0 3 6 2 3 E S C H W A L L W A N D 11 0 6 A 1 0 3 6 3 4 F U E H R U N G S R O H R 11 0 3 4 1 0 5 7 0 1 P L E U E L L A G E R 11 0 3 4 1 0 5 7 0 1 B P L E U E L L A G E R 11 0 6 A 1 0 7 0 6 5 A B K O L B E N M I T R I N G E 11 0 2 7 1 0 5 4 0 1 C P L E U E L S T A N G E 11 0 2 7 1 0 5 4 0 1 J P L E U E L S T A N G E 11 0 3 8 1 0 3 6 0 1 M O E L W A N N E 11 1 J 0 9 0 7 6 6 0 B S E N S O R 11 0 6 A 9 0 6 4 3 3 L I M P U L S G E B E R 11 0 6 A 9 0 6 4 3 3 G I M P U L S G E B E R 11 0 3 0 9 0 5 3 7 7 C K L O P F S E N S O R 11 0 5 8 1 0 3 3 8 3 K Z Y L I N D E R K O P F D I C H T . 11 0 6 A 1 0 3 3 5 3 P Z Y L I N D E R K O P F 11 1 0 1 0 0 0 0 6 3 A A Z U E N D K E R Z E 11 0 5 0 1 2 1 1 1 3 C T H E R M O S T A T / K U E H L W A S S E R R E G L . 11 0 6 A 1 1 5 4 0 5 A H O E L F I L T E R H A L T E R 11 0 6 A 1 0 3 6 6 3 B E I N F U E H R T R I C H T E R 11 0 6 A 1 0 3 2 2 7 A T E N T L U E F T U N G 11 0 5 8 1 0 3 5 5 5 B A B S C H I R M T E I L 11 0 6 A 1 0 3 4 6 9 S Z Y L I N D E R K O P F H A U B E 11 0 5 8 1 0 3 3 6 5 T R A N S P O R T L A S C H E 11 0 2 6 1 0 3 4 8 5 O E L V E R S C H L U S S D E C K . 11 0 2 6 1 0 3 4 8 5 A O E L V E R S C H L U S S D E C K . 11 0 6 A 9 1 9 0 8 1 A O E L D R U C K S C H A L T E R 11 0 6 A 9 1 9 0 8 1 A O E L D R U C K S C H A L T E R 11 0 2 8 1 1 7 0 2 1 B O E L K U E H L E R 11 0 6 A 1 1 5 5 6 1 B W E C H S E L F I L T E R 11 0 6 B 1 0 9 1 1 1 Z A H N R I E M E N R A D 11 0 6 A 1 0 5 2 6 3 D Z A H N R I E M E N R A D 11 0 5 8 1 0 3 7 2 8 A B E F E S T I G U N G S T E I L 11 0 6 A 1 2 1 1 3 2 D W A S S E R S T U T Z E N 11 0 7 8 9 1 9 5 0 1 C T E M P E R A T U R G E B E R 11 0 6 B 1 0 9 2 4 3 D S P A N N R O L L E 11 0 6 A 1 3 1 0 9 8 M K O M B I V E N T I L 11 0 6 A 1 3 3 0 6 2 C D R O S S E L K L A P P E N S T U . 11 K R A F T S T . S A M M E L L T G . 11 0 6 B 1 0 9 4 7 7 R I E M E N S P A N N E R 11 0 6 B 1 0 9 1 1 9 A Z A H N R I E M E N 11 0 6 B 1 0 9 1 1 9 B Z A H N R I E M E N 1
Z Y L I N D E R K O P F D I CZ Y L I N D E R K O P FZ U E N D K E R Z E
Engine type 4711 Cylinder head
Crank shaft
Oil pump
Parts list motor type 4711
Automatically generated, individually bill of materials
H A U P T L A G E R
K U R B E L W E L L E
fuelcubic capacity
# cylinders# valves
KWHPNm
exhaust gas
gearing
region
…
Otto1,845
110150210EU4
B80
EU
…
…………
115157235EU3
B80q
Japan
…
…………
125170280
EU2B
MQ350
…
…
…………
132180…D4
…
…
…
…………
165225……
…
…
…
……………………
…
…
…
…………
………
…
…
…
charact. specifications
Notes:

Production Management B – Spring Semester 2009
Enterprise Resource Planning II (ERP) L04 P. 38
Lecture 04
Final Statement:
• Basics of the offer preparation
- Order Processing
- Tasks of the offer preparation
• Rough scheduling procedures
- Capacity scheduling procedure
- Bar chart-procedure
- Bottleneck machine-procedure
- Critical path planning
• Methods to calculate the production costs
- Cost-per-kg-method
- Material cost method
- Calculation based on influencing factors
- Calculation of individual parts
• Product-configurators
- Potentials of Systematic Order Clarification an Configuration
- Tasks
- Modular constructions

Production Management B – Spring Semester 2009
Enterprise Resource Planning II (ERP) L04 P. 39
Lecture 04
Questions:
What are the essential differences between a series manufacturing, a variant manufacturing an a order-specific manufacturer?
What are important tasks at the offer preparation?
How can you calculate the theoretical capacity limit for offers?
What the meaning of the conversion rate?
Please name different methods to calculate the production costs.
Please describe problems concerning the clarification of orders.
How get the potential at the clarification of orders with the help of prduct-configurators release?
Outline or describe the configuration-process!

Production Management B – Spring Semester 2009
Enterprise Resource Planning II (ERP) L04 P. 40
Lecture 04
Bibliography:
Audi 2007: Audi AG: Online-Produktkonfigurator. URL:http://www.audi.de/audi/de/de2/neuwagen.html [Stand: Januar 2008]
Benett, S.: Komplexitätsmanagement in der Investitionsgüterindustrie. Dissertation der Universität St. Gallen, 1999.
Dangelmaier, W.: Marktspiegel Customer Relationship Management. Anbietervon CRM-Software im Vergleich. Gabler Verlag, 2001
Eversheim, W.; Schuh, .G.: Betriebshütte – Produktion und Management. Teil2, 7., völlig neu bearbeitete Auflage, Springer-Verlag, 1996
Gross, M.: Planung der Auftragsabwicklung komplexer, variantenreicherProdukte. Dissertation an der RWTH Aachen, 1990
Schuh, G.: Produktkomplexität managen – Strategien, Methoden, Tools. 2. überarbeitete und erweiterte Auflage, Hanser-Verlag, 2005

ERP III – Controlling Strategies
Lecture 05Production Management B – Spring Semester 2009
L05 P. 0
Production Management B
Lecture 05ERP III – Controlling Strategies
Organisation:Dipl.-Ing. T. PotenteSteinbachstr. 53BRaum 528Tel.: [email protected]
Laboratory for Machine Tools and Production Engineering
Chair of Production EngineeringProf. Dr.-Ing. Dipl.-Wirt. Ing. G. Schuh
Chair of Production ManagementProf. Dr.-Ing. A. Kampker

ERP III – Controlling Strategies
Lecture 05Production Management B – Spring Semester 2009
L05 P. 1
Index:
Schedule Page 2Target of this lecture Page 3Lecture
Production targets Page 4Roles in the production of tomorrow Page 4Target System of the Production Planning and Controlling Page 5Strategy Compliant Positioning of a Production Page 6
Production planning and controlling Page 7Logistic Control Cycle Page 7Production planning Page 8 Selection of Control Methods Page 11Failure/Flaw cycle of the Production Control Page 13Basic Control Principles Page 14
System presentation Page 21Final statement Page 24Bibliography Page 25

ERP III – Controlling Strategies
Lecture 05Production Management B – Spring Semester 2009
L05 P. 2
Schedule:
No. Date Responsible
L1 27.04.2009 Mr. Rittstieg 0241 80 20396
L2 04.05.2009 Mr. Bartoscheck 0241 80 28203
L3 18.05.2009 Mr. Fuchs 0241 80 26265
L4 25.05.2009 Mr. Reil 0241 80 27964
L5 08.06.2009 Mr. Potente 0241 80 27387
L6 15.06.2009 Mr. Bauhoff (fir) 0241 47705-439
L7 22.06.2009 Mr. Hoeschen 0241 80 27382
L8 29.06.2009 Mr. Jung 0241 80 27392
L9 06.07.2009 Mr. Rauhut 0241 80 28206
L11 13.07.2009 Mr. Koch 0241 80 25321
L12 20.07.2009 Mr. Cuber (fir) 0241 47705-420
Customer Relations Management
Enterprise Ressource Planning I
Enterprise Ressource Planning II
Topic
IT in Production Management
Enterprise Ressource Planning III
Product Lifecycle Management II
Digitale Plant Planning and Simulation
Business Engineering - Method of selecting IT-Systems (Trovarit)
Supply Chain Management I
Supply Chain Management II
Product Lifecycle Management I
ERP III – Controlling Strategies
Lecture 05Production Management B – Spring Semester 2009
L05 P. 3
Target of this lecture:
• connection between strategy and production targets • survey of relevant production control methods• IT-support for production planning and control• weak points of conventional PPS-systems and new approaches
Demonstration: Simulation
• effects of different control strategies on the performance of a production system (Push/Pull)
Exercise:
• Harmonisation of lot sizes and logistic operating curves

ERP III – Controlling Strategies
Lecture 05Production Management B – Spring Semester 2009
L05 P. 4
Seite 4© WZL/Fraunhofer IPT
Roles in the Production of Tomorrow
Different value added tasks need different logistic approaches!
These two areas are closely linked together
Production
15%
55%
30%
Product
Production
today
ZielProduct-supplier
Product related production (e.g.
assembly)
Volume and capacity oriented
production
Production specialists

ERP III – Controlling Strategies
Lecture 05Production Management B – Spring Semester 2009
L05 P. 5
Seite 5© WZL/Fraunhofer IPT
Target System of the Production Planning and Controlling
profitability
high adherence to delivery dates
high utilisation
low stocks
short through
put times
Notes:
The main function of production planning and control is to reach the logistic targets:
• high adherence to delivery dates, • short throughput times, • low inventory and • high efficiency. taking their interdependencies, ability to reach the final target and high profitability into account. A target’s adherence to delivery dates, throughput times, stocks and utilization can be linked to a target system with the dimensions logistic efficiency and costs. The logistic efficiency is defined by the adherence to delivery dates and delivery times as experienced by the customer. The former depends on the adherence to delivery dates in the order processing and the latter on the order throughput times. The logistic costs, which can be influenced by the company, consist of the capital commitment costs and the production costs. The capital commitment costs can be influenced by stock changes.
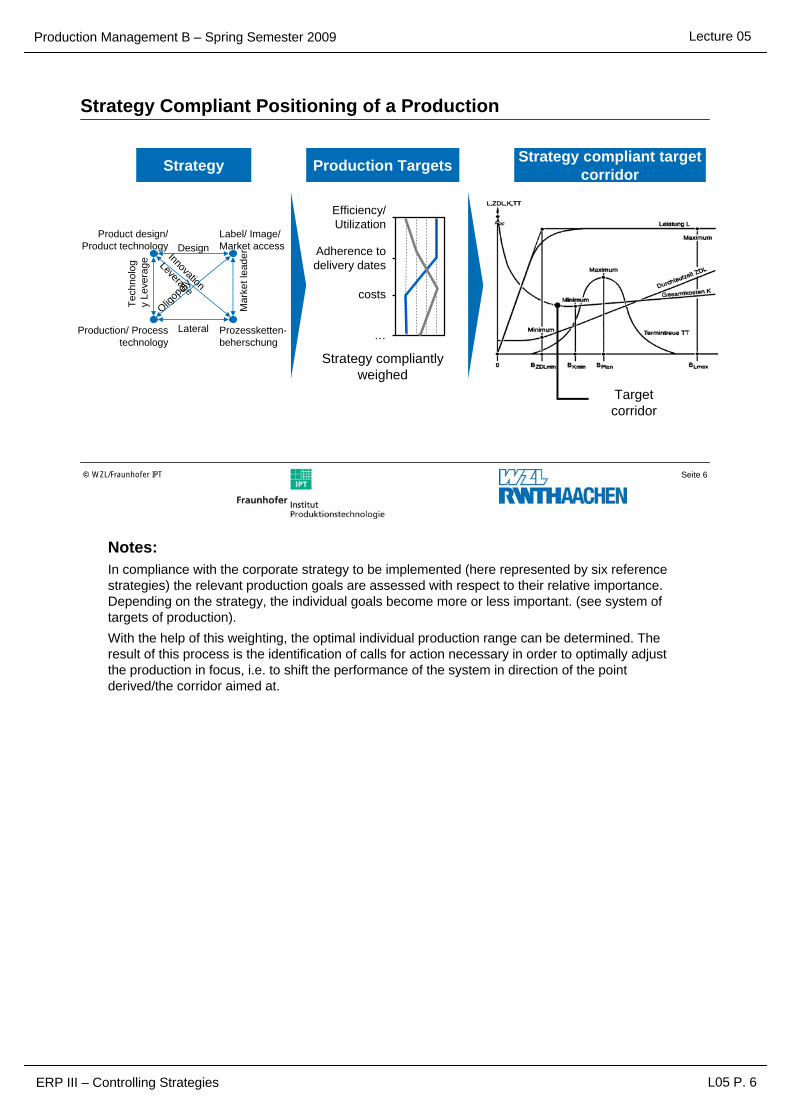
ERP III – Controlling Strategies
Lecture 05Production Management B – Spring Semester 2009
L05 P. 6
Seite 6© WZL/Fraunhofer IPT
Strategy Compliant Positioning of a Production
Strategy Production Targets
Efficiency/ Utilization
costs
Adherence to delivery dates
…
Strategy compliant target corridor
Strategy compliantlyweighed
Target corridor
Product design/ Product technology
Production/ Processtechnology
Prozessketten-beherschung
Label/ Image/ Market accessDesign
Lateral
Tech
nolo
gy
Leve
rage
Mar
ket l
eade
rInnovation
Leverage
Oligop
oly
Notes:In compliance with the corporate strategy to be implemented (here represented by six reference strategies) the relevant production goals are assessed with respect to their relative importance. Depending on the strategy, the individual goals become more or less important. (see system of targets of production). With the help of this weighting, the optimal individual production range can be determined. The result of this process is the identification of calls for action necessary in order to optimally adjust the production in focus, i.e. to shift the performance of the system in direction of the point derived/the corridor aimed at.

ERP III – Controlling Strategies
Lecture 05Production Management B – Spring Semester 2009
L05 P. 7
Seite 7© WZL/Fraunhofer IPT
Adjusting the Operating Point: The Logistic Control Cycle
Source: according to Wiendahl/Pritschow/Milberg
Control variable
Com
man
d va
riabl
es
Control variable
controllera) Technical
control variable
b) Logisticcontrol variable
Con
trol
varia
ble
Subsidiarycontroller
Closed loop
control-led
system
Productionplanning
ProductioncontrolC
omm
and
varia
bles
Con
trol
varia
ble
Material flow
Notes:The figure a) shows the typical hierarchic control structure of a technical control loop. In analogy, a logistical control cycle has been developed. The analysis of a production system in view of its dynamic behavior over time constitutes the first step in realizing a production control system. This permits the reproduction of the control path, in this case material flow. The identification of control variables represents the next step. Based on the control variables identified, the adjustment characteristic and the disturbance reaction is to be analyzed in view of stability, finally leading to the development of a control system.

ERP III – Controlling Strategies
Lecture 05Production Management B – Spring Semester 2009
L05 P. 8
Seite 8© WZL/Fraunhofer IPT
Production Planning
Theoretical Result: Week, day and shift plans, which are coordinated according to schedule and capacity per capacity area?
1. Throughput scheduling
2. Capacity dispatchingon work station A
3. Capacity adjustment,sequence/order formation(according to set up criteria)
Time/durationStart planningperiod
End planningperiod
A1 A2 A3 A4 A5A6
A3
A2
A1A5
A4 A6
F
CB D
D
F
B
B C
C
A4
A2
A6
A5
A3
A1
F
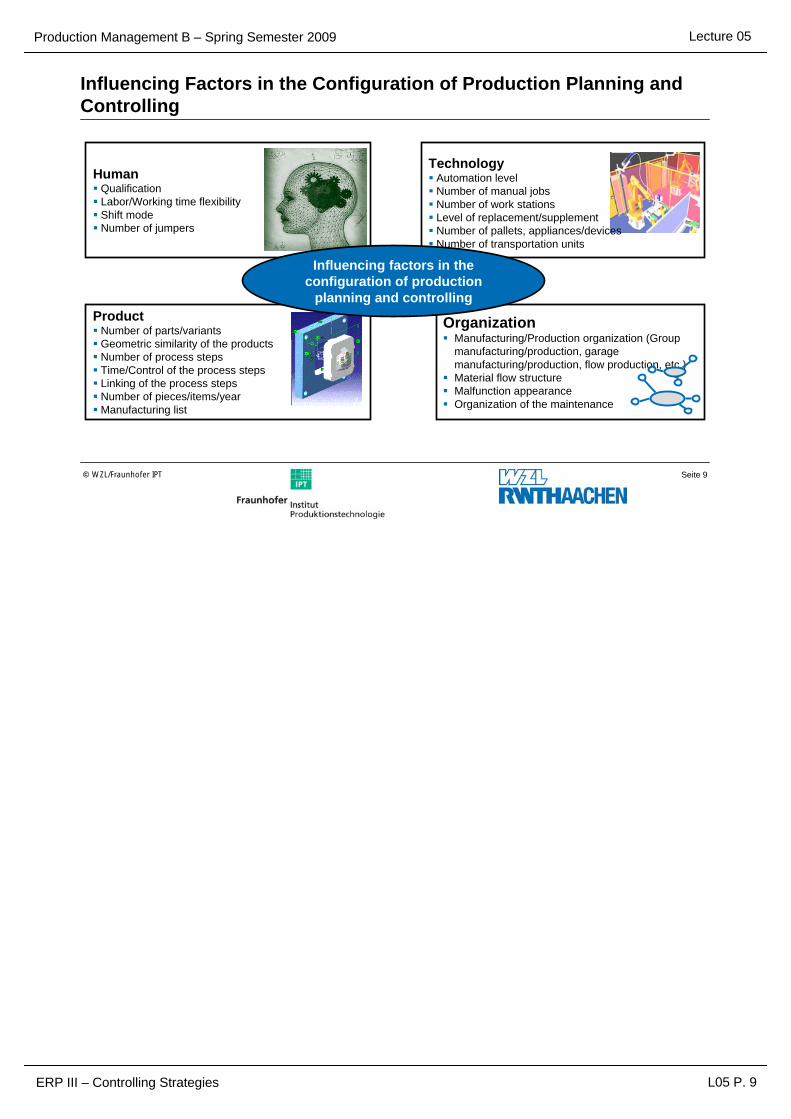
ERP III – Controlling Strategies
Lecture 05Production Management B – Spring Semester 2009
L05 P. 9
Seite 9© WZL/Fraunhofer IPT
Influencing Factors in the Configuration of Production Planning and Controlling
HumanQualification Labor/Working time flexibilityShift modeNumber of jumpers
ProductNumber of parts/variants Geometric similarity of the productsNumber of process stepsTime/Control of the process stepsLinking of the process stepsNumber of pieces/items/yearManufacturing list
OrganizationManufacturing/Production organization (Group manufacturing/production, garage manufacturing/production, flow production, etc.)Material flow structureMalfunction appearanceOrganization of the maintenance
TechnologyAutomation level Number of manual jobsNumber of work stationsLevel of replacement/supplementNumber of pallets, appliances/devicesNumber of transportation units
Influencing factors in the configuration of production
planning and controlling

ERP III – Controlling Strategies
Lecture 05Production Management B – Spring Semester 2009
L05 P. 10
Seite 10© WZL/Fraunhofer IPT
Oppositional Approaches for the Production Planning and Controlling
Central Planning
Planning Knowledge
Decentralized Planning
Planning Knowledge

ERP III – Controlling Strategies
Lecture 05Production Management B – Spring Semester 2009
L05 P. 11
Seite 11© WZL/Fraunhofer IPT
Selection of Control Methods
Source: according to Zülch
Production structure
Controlling principle
Control strategy
Control method
Process principle
contains a certain
can be controlled through
enable certain
are realized in
Examples:Non-repetitive productionSerial productionProcedural production
Job-shop organizationGroup productionSeries productionContinuous production
Work order controlThroughput controlCompulsion control
Release logicSize of orderSuccession
Order schedulingBurden orientated order releaseEfficiency rate agreementKanban, process control
Notes:The chart illustrates an approach in selecting a suitable control method and exemplifies a generally accepted and approved procedure. Based on advisements of Siemens AG the following procedure can be determined: the production structure and the operation sequence call for a certain control principle. Therefore the control strategy and method is determined. The parameters are generally accepted and are focused on specifying “static” characteristics. These are in particular the product variance and frequency of recurrence (product spectrum with types and numbers of different products and their variants, piece number per variant, distribution of work contents), operating sequence (i.e. flow production and shop fabrication), distribution of cycle times and their ratio to delivery times.

ERP III – Controlling Strategies
Lecture 05Production Management B – Spring Semester 2009
L05 P. 12
Seite 12© WZL/Fraunhofer IPT
Fields of Application of Production Control Methods
KANBAN
Cumulative quantity
CONWIP
MRP I
bottle neck control (OPT)
BOA
lowhigh
Material flow complexity
Num
ber o
f var
iant
s
low
high

ERP III – Controlling Strategies
Lecture 05Production Management B – Spring Semester 2009
L05 P. 13
Seite 13© WZL/Fraunhofer IPT
Failure/Flaw Cycle of the Production Control
The cycle times become longer and
spread/ disperse more Bad adherence
to delivery dates
The planned cycle times
increaseOrders are
released earlier
The work load/ burden at the job increases
The waiting queues become
longer
Notes:In practice most companies react in a unilateral manner and handle the most urgent problem. For instance, overfilled stocks usually lead to actions aiming at reducing of stocks. Yet almost inevitably, problems in delivering certain parts or products occur. Most companies then assume the cause to be too short scheduled cycle times. The according values are then increased, resulting in earlier starting dates of orders. This again induces an increase in stocks in production and assembly. The cycle times then tend to increase due to the longer wait times combined with a greater dispersion. In sum, the adherence to delivery dates deteriorates and only rush-orders and other special actions can guarantee in-time delivery.

ERP III – Controlling Strategies
Lecture 05Production Management B – Spring Semester 2009
L05 P. 14
Seite 14© WZL/Fraunhofer IPT
Basic Control PrinciplesPush / Pull
Source: according to Wiendahl
Customer/stockAS 1
PPC-System
AS 2 AS 3
a) Push-control
Customer/stockAS 1 AS 2 AS 3
b) Pull-control
Variants Material flow Information flow WS – working system
Notes:Two basic job control principles can be distinguished: in the case of the so-called push principle, production lots and dates are determined in a superior planning level and affect production processes beginning with the supply of raw materials and ending with the delivery to customers. Orders are assigned with a job account number and a due date and launched. The main target of production control is managing orders in a way that delivery dates can be met. According to the pull-principle, a customer order triggers a demand affecting preliminary stages in the material flow. For instance: preliminary assembly delivers against an order placed by final assembly, manufacturing receives orders from preliminary assembly and places orders with materials procurement. The primary objective of pull-oriented control systems is therefore the disposition of a agreed lot in an agreed time schedule. Orders in process are neither assigned with a job account number nor a final delivery date.

ERP III – Controlling Strategies
Lecture 05Production Management B – Spring Semester 2009
L05 P. 15
Seite 15© WZL/Fraunhofer IPT
Push-Principles (I/III)MRP II
Source: according to Scheer
MR
P
Feinterminierung der Fertigungsaufträge & Reihenfolgebildung
MR
P I
MR
P II
sales planningbudgeting
production programme planning
quantity planning
time-phased production plan for final products
primary requirements (manufactures)
gross dependent requirements
explosion of billofmaterials
net dependent requirements
order initiation and control order initiation
production progress monitoring
capacity schedulingperiodic aggregation
production and assembling lots
capacity scheduling
stocks
calculation of order quantity
available capacity
fine scheduling of production orders & sequencing
Notes:MRP (Material Requirement Planning) = planning of lots
1950ies: requirement-oriented materials disposition supersedes consumption-oriented materials disposition;
MRP I (Manufacturing Resource Planning) = planning of production factorsmid 1960ies: increase in performance of electronic data processing allows taking production capacities into consideration
MRP II (Management Resource Planning)1980ies: economic and strategic aspects are taken into consideration;
With MRP II the level of detail increases with a decreasing planning horizon. Subordinate planning steps can affect and revise guidelines for super-ordinate planning steps.
As the term “Manufacturing Resource Planning” implies, the MRP I concept is a material-oriented approach and strictly discriminates between planning of lots and scheduling.
In spite of a number of weak points, MRP I is deployed for strictly demand-oriented production (i.e. piece and small series production). Complex procedures, as found in the control of shop fabrication, do not allow for long-term and detailed planning.
MRP II is an extension on the MRP I-concept, taking strategic aspects and the control-oriented implementation of planning measures into consideration.
The concept of MRP II (unlike MRP I, MRP II stands for “Management Resource Planning”) incorporates control and planning in a comprehensive logistics supply chain. In this context, the production program planning for instance is seen as a strategic planning level.

ERP III – Controlling Strategies
Lecture 05Production Management B – Spring Semester 2009
L05 P. 16
Seite 16© WZL/Fraunhofer IPT
Push-Principles (II/III)Optimized Production Technology
Inventory Primary requirements
Manufacturing resourcesTask scheduleParts lists
BUILD NET
Network Burden analysis
Critical capacitiesSPLIT
Shop-floor scheduling
CriteriaBackward scheduling
Forwardscheduling
OPT SERVE
Splitting of the net into a “critical” and a “non-critical” part
Analysis of the capacity burden
Backward scheduling of the production steps, that do not burden bottlenecksLot creation/formation for production and transport
Forward scheduling of the production steps, that burden bottlenecks
Lot creation/formation for production and transport
Notes:“Optimized Production Technology - System (OPT)” is a network-based software product for the control of shop fabrication. The system aims at managing and steering production processes, primarily focusing on the overall corporate performance instead of on individual measures. Therefore, the order network is divided into two parts containing critical and noncritical capacities. Critical capacities are mostly bottle necks. OPT-rules on the one hand specify the general production control strategies and on the other hand deal with the relevance of bottle necks for the entire production flow and for the attaining of production goals. The nine OPT-rules:Adjust the production flow, not the capacity. The capacity factor of a noncritical capacity is not determined by the capacity itself, but by some other restriction in the overall operating sequence. Provision and utilization of a capacity is not synonymous.An hour lost in a bottle neck is an hour lost for the entire system.An hour gained in noncritical capacity is a miracle.Bottle necks determine the sequence as well as the stocks.A transport lot is not necessarily equal to a production lot, often this is even prohibited.Production lots must be variable and not fixed.When plans are made, all preconditions necessary must be checked simultaneously. Cycle times are the result of a plan and cannot be pre-determined. The sum of individual optima is not equal to the overall-optimum.

ERP III – Controlling Strategies
Lecture 05Production Management B – Spring Semester 2009
L05 P. 17
Seite 17© WZL/Fraunhofer IPT
Push-Principles (III/III)Cumulative Quantity
lag
advance
Present
advance inquantityunits
advance indays
cumulated plannedlot size =
target cumulative quantity
cumulated achievedlot size =
actual cumulative quantity
Days
Quantity units
Notes:This concept is utilized mainly in series and mass production which is assembly-oriented and common to the automotive industry. A cumulative quantity signifies a cumulative value and can refer to various different parameters. If the cumulative quantity refers to planning-oriented values, we speak about a target(ted) cumulative value. Accordingly, cumulative values referring to actual values are determined as actual cumulative values. By comparing target(ed) and actual cumulative values, different insights can be deduced. If for instance the curve of an actual cumulative value lies above the curve of a target(ed) cumulative value production is taking place in advance. Fore-runnings can be expressed in units of quantity by the vertical distance between the curves, in units of time by the horizontal distance. The available stock is a result of the difference between the cumulative values of inward and outward stock movements. Cumulative quantity system provide an efficient and rapid overview of the production progress of suppliers in a certain defined sections in the material flow. Elaborate inventory maintenance and reservation systems can be omitted. By comparing the actual and the targeted course of the cumulative values, detailed production control measures (order control and release) and planning measures (dates, lots, requirements, …) can be deduced. For instance by determining the fore-runnings or the backlog in the dimensions “time” and “lots”, the “technical” and “temporal” capacity balancing can be prepared. Moreover, order release strategies can be carried out according to the “pull”principal.

ERP III – Controlling Strategies
Lecture 05Production Management B – Spring Semester 2009
L05 P. 18
Seite 18© WZL/Fraunhofer IPT
Pull-Principles (I/III)Kanban
Rawmaterial stock
Rawmachin-ing
Fine machin-ing
Pre-assembly
Final assembly
Finishedgoods store
Card
Material flowInformation flowControl through certain number of emitted “ordering cards” (Jap. KANBAN)Reduce the number of cards until the production just worksCalling principle (Pull)Low capital lockup between intermediate and final stockSuitable for large scale and mass production according to the flow principle (automotive industry)
Card Card Card
Buffer Order
Notes:In terms of lean production, KANBAN is not only a material provision technique but also a philosophy. A perfectly tuned “KANBAN”-system, also referred to as “Just-in-time”, integrates all relevant suppliers and subordinate factories and leads to the entire elimination of stocks. Thus all security networks are systematically eliminated. Hence each member of the comprehensive production process is automatically forced to identify problems in a foresighted manner, before serious trouble occurs. The roots of Kanban-systems can be found in the 50ies, when the Japanese economy wasearmarked by a shortage in space and escalating lack of capital. For these reasons, the enterprisers were forced to make special efforts to reduce their stocks and to rationalize the material flow within the production areas and between different companies. This corporate rethinking lead to the development of Just-in-time (JIT) and of Kanban-systems as a specialized form of JIT.The Kanban-system can primarily be characterized by low control efforts and aims at fulfilling the following logistic goals: reduce material stocks,reduce cycle times,increase transparency of corporate actions and processes,increase productivity,increase flexibility with respect to short-term supply disposition and increase quality assurance.
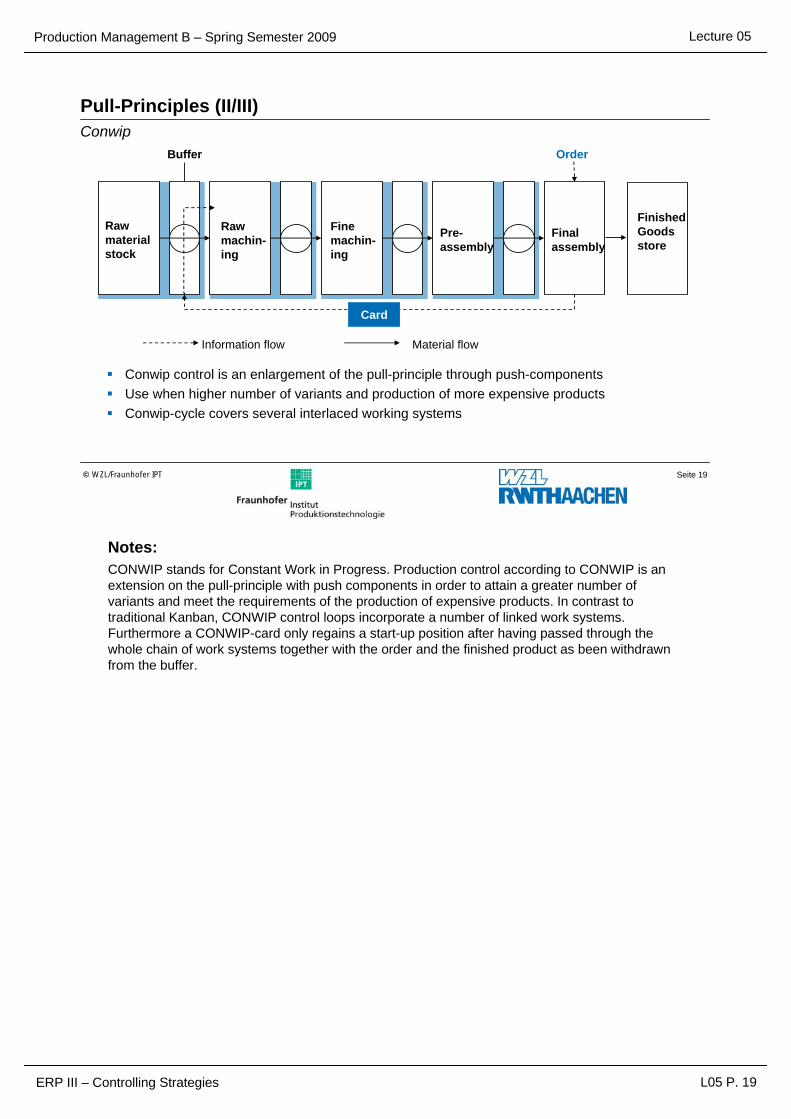
ERP III – Controlling Strategies
Lecture 05Production Management B – Spring Semester 2009
L05 P. 19
Seite 19© WZL/Fraunhofer IPT
Pull-Principles (II/III)Conwip
Raw material stock
Raw machin-ing
Fine machin-ing
Pre-assembly
Finalassembly
Card
Material flowInformation flow
Buffer Order
Conwip control is an enlargement of the pull-principle through push-componentsUse when higher number of variants and production of more expensive products Conwip-cycle covers several interlaced working systems
Finished Goodsstore
Notes:CONWIP stands for Constant Work in Progress. Production control according to CONWIP is an extension on the pull-principle with push components in order to attain a greater number of variants and meet the requirements of the production of expensive products. In contrast to traditional Kanban, CONWIP control loops incorporate a number of linked work systems. Furthermore a CONWIP-card only regains a start-up position after having passed through the whole chain of work systems together with the order and the finished product as been withdrawn from the buffer.

ERP III – Controlling Strategies
Lecture 05Production Management B – Spring Semester 2009
L05 P. 20
Seite 20© WZL/Fraunhofer IPT
Pull-Principles (III/III)Load Orientated Order Release
Source: according to Wiendahl
customer inventory personalrequirements
stock
knownvolume of orders
urgentvolume of orders
releasedvolume of orders
VH
Stellrad “burden barrier"(Parameter: dispatching percentage)
“date barrier"(Parameter: forward horizon VH)
stock level
plan capacity
Disposition
Notes:The so-called load orientated order release is a procedure, the implementation of which is stochastically oriented. It is applied periodically, using the backlog of orders as a central control value which is calculated continually at the individual work stations (inward and outward movement function). Only those orders, which have to be fulfilled within a defined period are retrieved from the entire order backlog and enter the so-called urgent order backlog. In this case the systems verifies that there are sufficient capacities available, not surmounting a defined load barrier. Indirect load contingents – these only burden a work station after one or several work steps have been processed – are taken into account with a reduced load contingent as they are less likely to occur. If a work step of an order cannot locate a free capacity according to this procedure, the release of the whole order is held back. The main advantage of the procedure is a high flexibility with respect to variations from the consumer point-of-view. The control of orders containing a large number of work steps often leads to problems, this being the main disadvantage of load orientated order release.
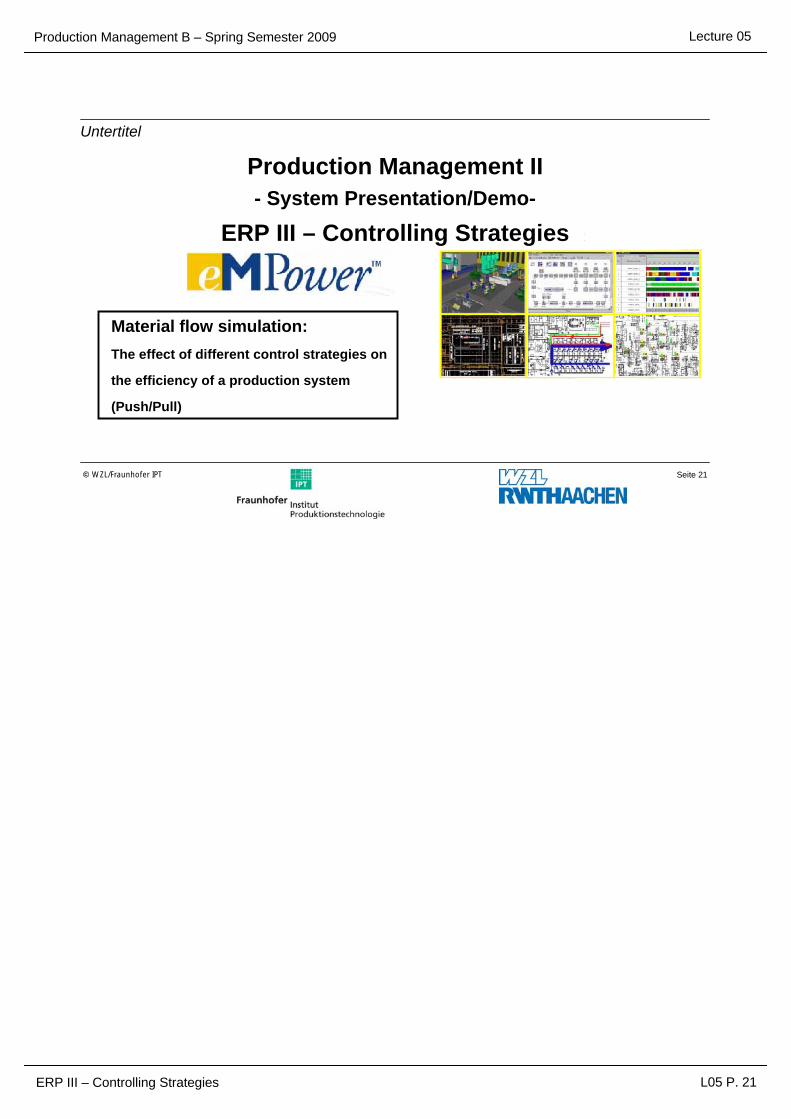
ERP III – Controlling Strategies
Lecture 05Production Management B – Spring Semester 2009
L05 P. 21
Seite 21© WZL/Fraunhofer IPT
Untertitel
Production Management II- System Presentation/Demo-
ERP III – Controlling Strategies
Material flow simulation:The effect of different control strategies on
the efficiency of a production system
(Push/Pull)

ERP III – Controlling Strategies
Lecture 05Production Management B – Spring Semester 2009
L05 P. 22
Seite 22© WZL/Fraunhofer IPT
Interlaced Machine Row without (A) or with (B) Buffer places/spotsUntertitel
Buffer
Machine

ERP III – Controlling Strategies
Lecture 05Production Management B – Spring Semester 2009
L05 P. 23
Seite 23© WZL/Fraunhofer IPT
Job Control of an AssemblyPush versus Pull
Pull control
ERP III – Controlling Strategies
Lecture 05Production Management B – Spring Semester 2009
L05 P. 24
Final statement:The long-term success of manufacturing business enterprises is secured byefficient and flexible production logistics. The strategic orientation is derived from the corporate environment (market dynamics, customer behavior, competitors, suppliers, etc.) and defines the primary production goals relevant for success. The factors mentioned determine the logistic concept/model of the company. In general, five conflicting production goals are pursued: low level of costs, high adherence to delivery dates, short cycle times, small inventory and a high performance level.Production planning and control are an integral factor in configuring and implementing efficient production logistics. The main targets of this lecture are to provide an overview of all control methods which are actually applied in practice and to describe existing software solutions. The main functions of production control are the prompting, controlling and securing of the lead-through and accomplishment of tasks with respect to lots, target dates and costs. Two main control principles can be determined: push and pull control concepts. These two concepts depict the two main characteristics of production control principles: deterministic push-control principles as opposed to user-oriented pull-control principles . Depending on the manufacturing structure, the complexity of material flows and the number of variants, the appropriate control principle can be chosen. In the following, all relevant control procedures will be examined in detail. The PPS system has been used for decades to support the functions of production control and planning mentioned above. These IT-systems are usually based on the MRP-concept developed in the 50ies. Increasing demands with respect the level of reality, precision and rate of work order/job planning and control have lead to new requirements, which traditional systems can no longer adequately fulfill. With the help of new approaches such as Advanced Planning and Scheduling (APS), the application of multi-agent-systems and the support of material flow simulation, the mentioned deficiencies can be remedied.

ERP III – Controlling Strategies
Lecture 05Production Management B – Spring Semester 2009
L05 P. 25
Bibliography:
Cox, J.; Goldratt, E.M.: Das Ziel, Höchstleistung in der Fertigung, McGraw-Hill, 1984
Eversheim, W.; Schuh, G.: Betriebshütte, Produktion und Management, Springer-Verlag, 1996
Eversheim, W.; König, W.; Pfeifer, T.; Weck, M.: Wettbewerbsfaktor Produktionstechnik, (AWK 1996), VDI Verlag, Düsseldorf 1996
Kuhn, Axel: Wege zur innovativen Fabrikorganisation, Band 1, Verlag Praxiswissen, 1998
Nyhuis, P.; Wiendahl, H.-P.: Logistische Kennlinien: Grundlagen, Werkzeuge, Anwendungen, 2. Auflage, Springer-Verlag, Berlin, 2002.
Ortmann, L.: DV Produktion - PPS im Überblick: Strategien und Verfahren zur PPS SYMIX Systems GmbH, Dortmund 2000
Schuh, G.; Wiendahl, H.P.: Komplexität und Agilität, Steckt die Produktion in der Sackgasse, Springer-Verlag, 1997
Günther, H.-O.; Tempelmeier, H.: Produktion und Logistik, 3. Auflage, Springer-Verlag, 1997
Wiendahl, H.-P.: Fertigungsregelung. Logistische Beherrschung von Fertigungsabläufen auf Basis des Trichtermodells Hanser Verlag, München, 1997.
Wiendahl, H.-P.: Erfolgsfaktor Logistikqualität, 2. Auflage, Springer-Verlag, Berlin, 2002
Zahn, E.; Zülch, G.: Systematisierung von Strategien der Fertigungssteuerung; In: Organisationsstrategie und Produktion, gmft Verlag, München, 1990

Production Management B – Spring Semester 2009
Supply Chain Management I L06 P. 0
Lecture 06
Laboratory for Machine Tools and Production Engineering
Chair of Production EngineeringProf. Dr.-Ing. Dipl.-Wirt. Ing. G. Schuh
Chair of Production ManagementProf. Dr.-Ing. A. Kampker
Production Management B
Lecture 06Supply Chain Management I
Organisation:Dipl.-Wirt.-Ing. Fabian BauhoffPontdriesch 14/16Raum 211Tel.: [email protected]

Production Management B – Spring Semester 2009
Supply Chain Management I L06 P. 1
Lecture 06
Index:
Index Page 1
Schedule Page 2
Glossary Page 3
Target of this lecture Page 4
Lecture/Introduction into Supply Chain Management Page 6
Planning Tasks in Supply Chain Management Page 13
Supply Chain Structures – Problems and Strategies Page 18
Virtual Market Places Page 27
Final statement Page 37
Questions Page 38
Bibliography Page 39

Production Management B – Spring Semester 2009
Supply Chain Management I L06 P. 2
Lecture 06
Schedule:
No. Date Responsible
L1 27.04.2009 Mr. Rittstieg 0241 80 20396
L2 04.05.2009 Mr. Bartoscheck 0241 80 28203
L3 18.05.2009 Mr. Fuchs 0241 80 26265
L4 25.05.2009Mr. Reil
0241 80 27964
L5 08.06.2009 Mr. Potente 0241 80 27387
L6 15.06.2009 Mr. Bauhoff (fir) 0241 47705-439
L7 22.06.2009 Mr. Hoeschen 0241 80 27382
L8 29.06.2009 Mr. Jung 0241 80 27392
L9 06.07.2009 Mr. Rauhut 0241 80 28206
L11 13.07.2009Mr. Koch
0241 80 25321
L12 20.07.2009 Mr. Cuber (fir) 0241 47705-420
Customer Relations Management
Enterprise Ressource Planning I
Enterprise Ressource Planning II
Topic
IT in Production Management
Enterprise Ressource Planning III
Product Lifecycle Management II
Digitale Plant Planning and Simulation
Business Engineering - Method of selecting IT-Systems (Trovarit)
Supply Chain Management I
Supply Chain Management II
Product Lifecycle Management I

Production Management B – Spring Semester 2009
Supply Chain Management I L06 P. 3
Lecture 06
Glossary:
APS – Advanced Planning SystemsAdvanced planning incorporates long-term, mid-term and short-term planning levels. Software products - called Advanced Planning Systems - are available to support these planning tasks. APS do not substitute, but supplement existing Enterprise Resource Planning (ERP) systems. APS now take over the planning tasks, while an ERP system is still required as a transaction and execution system (for orders). (Kilger 2005)
ATP – Available-to-promiseIn most APS - and also ERP-systems - the master plan quantities that form the basis for order promising are called available-to-promise (ATP). ATP is the result of a synchronized supply and capacity plan and represents actual and future availability of supply and capacity that can be used to accept new customer orders on. (Kilger 2005)
CTP – Capable-to-promiseCTP follows ATP and takes additionally capacities within the company and the supply chain into account while calculating the delivery date.
(Alicke 2003)
MRP – Material Requirements PlanningMRP is the transformation of an independent into a dependent demand by using the Bill-of-Material. (Alicke 2003)
MRP II – Manufacturing Resource PlanningMRP II is the completion of the material and quantity related MRP calculation by taking capacities into account. (Schuh 2006)
PPC – Production planning and -controlThe PPC includes the complete order management from order acception to delivery of goods. THe planning and control functions are linked with the enterprise departements sales, construction, purchasing, production, assembly and distribution. (Schuh 2006)

Production Management B – Spring Semester 2009
Supply Chain Management I L06 P. 4
Lecture 06
Objectives of Lecture on SCM:
Overview on structures of Classical Supply Chains and currently predominant Supply Networks
Introduction into different supply chain reference models
Overview of the Supply Chain Management tasks within the different planning levels
Different supply chain structures and their implications
Methods, potentials and obstacles of Supply Chain Management (SCM)
Knowledge about emergence of virtual market places out of SCM needs
Differentiation between different types of virtual market places
Integration of virtual market places into SCM
Production Management B – Spring Semester 2009
Supply Chain Management I L06 P. 5
Lecture 06
Page 5© WZL/FIR
Structure
Introduction in Supply Chain Management1
Planning Tasks in Supply Chain Management2
Supply Chain Structures – Problems and Strategies3
Virtual Market Places4
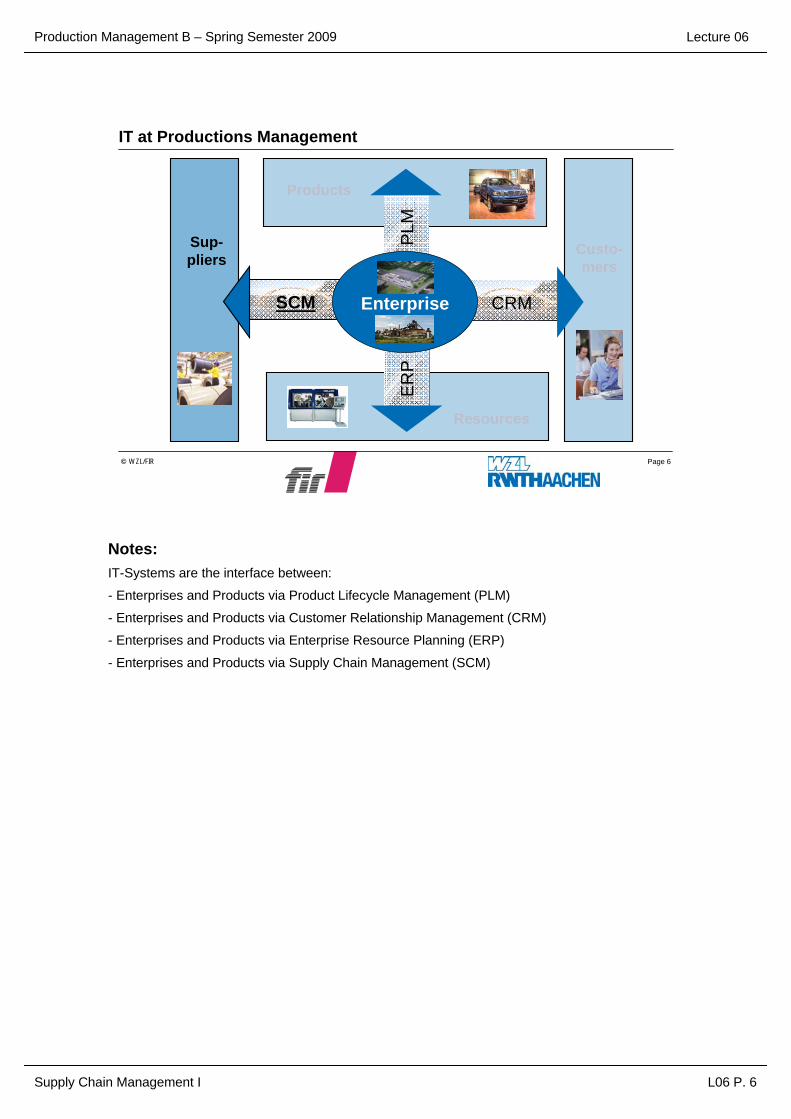
Production Management B – Spring Semester 2009
Supply Chain Management I L06 P. 6
Lecture 06
Page 6© WZL/FIR
IT at Productions Management
SCM
ER
P
CRM
PLM
Enterprise
Custo-mers
Resources
Sup-pliers
Products
Notes:IT-Systems are the interface between:
- Enterprises and Products via Product Lifecycle Management (PLM)
- Enterprises and Products via Customer Relationship Management (CRM)
- Enterprises and Products via Enterprise Resource Planning (ERP)
- Enterprises and Products via Supply Chain Management (SCM)

Production Management B – Spring Semester 2009
Supply Chain Management I L06 P. 7
Lecture 06
Page 7© WZL/FIR
Supply Chain Management (SCM) from the perspective of …
Production Production Distribution CustomerSupplierEnterpriseSupplier
… direct relationships of an enterprise…
Customer
… to the value creating supply chain.
Definition
Supply Chain Management is the process oriented integration of Planning & Control of the products, Information & Cash flow through the entire value chain from the customer to the supplier‘s supplier with the following goals:
Better fulfillment of the customer demandsSynchronization & Optimization of resources to meet the demand Flexible Manufacturing to fulfill the orders Reduction of Inventory across the supply chain Kuhn, Hellingrath 2002
Notes:
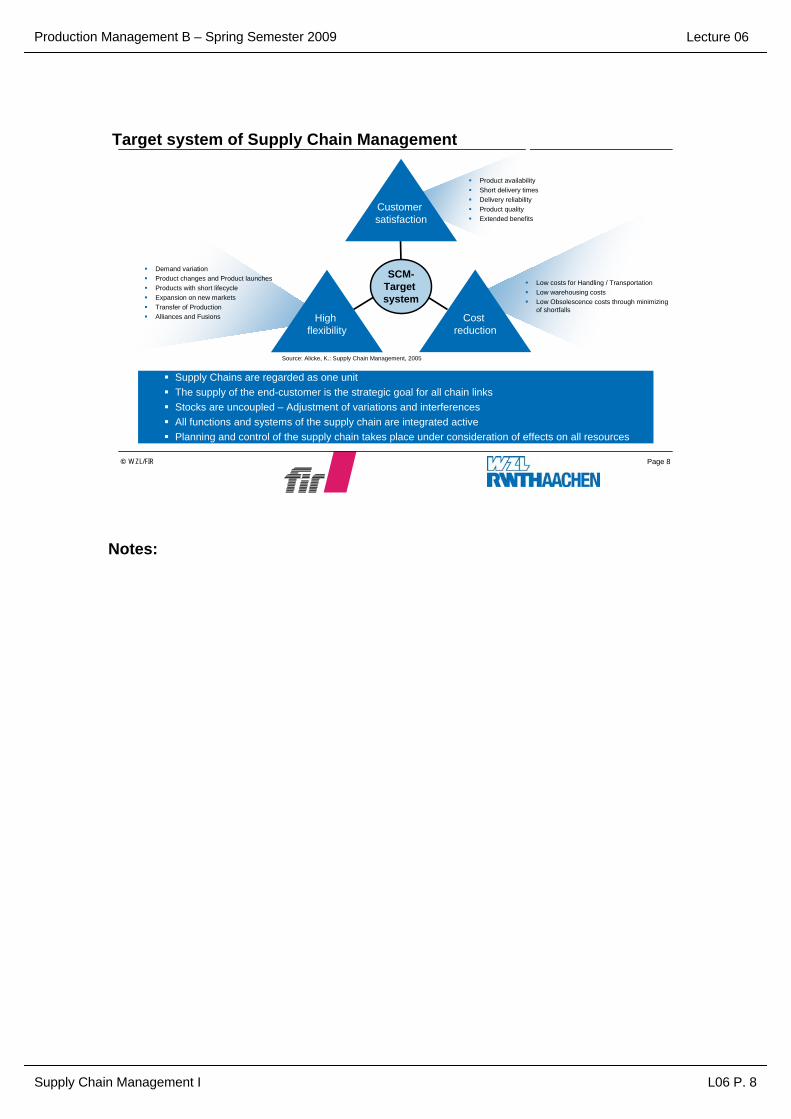
Production Management B – Spring Semester 2009
Supply Chain Management I L06 P. 8
Lecture 06
Page 8© WZL/FIR
Target system of Supply Chain Management
Source: Alicke, K.: Supply Chain Management, 2005
Low costs for Handling / Transportation Low warehousing costsLow Obsolescence costs through minimizing of shortfalls
Product availabilityShort delivery timesDelivery reliabilityProduct qualityExtended benefits
Cost reduction
SCM-Target system
High flexibility
Demand variationProduct changes and Product launchesProducts with short lifecycleExpansion on new marketsTransfer of ProductionAlliances and Fusions
Customer satisfaction
Supply Chains are regarded as one unitThe supply of the end-customer is the strategic goal for all chain linksStocks are uncoupled – Adjustment of variations and interferencesAll functions and systems of the supply chain are integrated activePlanning and control of the supply chain takes place under consideration of effects on all resources
Notes:
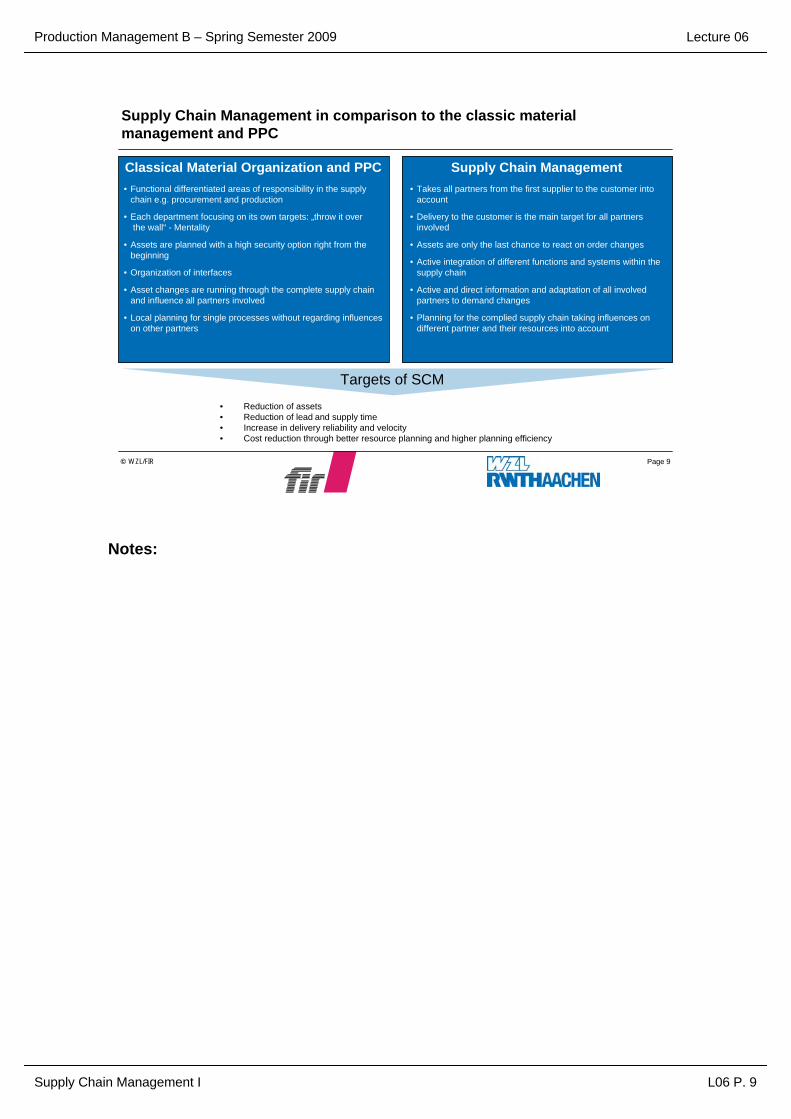
Production Management B – Spring Semester 2009
Supply Chain Management I L06 P. 9
Lecture 06
Page 9© WZL/FIR
Classical Material Organization and PPC• Functional differentiated areas of responsibility in the supply
chain e.g. procurement and production
• Each department focusing on its own targets: „throw it over the wall“ - Mentality
• Assets are planned with a high security option right from the beginning
• Organization of interfaces
• Asset changes are running through the complete supply chain and influence all partners involved
• Local planning for single processes without regarding influenceson other partners
Supply Chain Management• Takes all partners from the first supplier to the customer into
account
• Delivery to the customer is the main target for all partners involved
• Assets are only the last chance to react on order changes
• Active integration of different functions and systems within thesupply chain
• Active and direct information and adaptation of all involved partners to demand changes
• Planning for the complied supply chain taking influences on different partner and their resources into account
Supply Chain Management in comparison to the classic material management and PPC
• Reduction of assets• Reduction of lead and supply time• Increase in delivery reliability and velocity• Cost reduction through better resource planning and higher planning efficiency
Targets of SCM
Notes:

Production Management B – Spring Semester 2009
Supply Chain Management I L06 P. 10
Lecture 06
Page 10© WZL/FIR
Modeling the Supply Chain using the SCOR (Supply Chain Operational Reference Model)
Quelle: Supply Chain Council
www.supply-chain.org
Plan
Supplier Customer
DeliverSource Make DeliverMakeSource Source
Intern or extern Intern or externYour Manufacturing Organization
SCOR Model
Return Return Return
Return Return Return Return Return
MakeDeliver DeliverSource
SCOR describes any partner in the supply chain using 5 basic processes – Procurement (Source), Manufacturing (Make), Delivery (Deliver), Planning (Plan) and taking back the defective products (Return).
Notes:
For a consistent description, rating and analysis of logistic chains different reference models were designed. The most established one is the SCOR Model (Supply Chain Operational Reference Model) of the Supply Chain Council. The different processes are defined as:
Source:
Source are all processes, which control the shopping and acquisition, which are needed to meet the actual needs.
Make:
Make are all processes, which are needed to commute the raw materials to finished goods. They have to be construed for that the actual and planned stock is covered.
Deliver:
Deliver are all processes, which bring the products and services to the customer.
Plan:
Plan are all processes, which synchronize the supply and demand. The goal is to achieve the best solutions for all partners.
Return:
Return are the processes, when broken products have to be returned to the manufacturer.

Production Management B – Spring Semester 2009
Supply Chain Management I L06 P. 11
Lecture 06
Page 11© WZL/FIR
Using the SCOR model, enterprises are modelled at different process levels
#
Level
Schematic Comments
1
2
3
4
Configuration Level(Process Categories)
ProcessElement Level(Decompose Processes)
PlanDeliverMakeSource
ImplementationLevel(DecomposeProcess Elements)
Supp
ly C
hain
Ope
ratio
ns R
efer
ence
mod
el
Top Level
(Process Types)
Notin
Scope
Description
Balance Production Resources withProduction Requirements
Establish DetailedProduction Plans
Identify, Prioritize, and AggregateProduction Requirements
Identify, Assess, and AggregateProduction Resources
P3.1
P3.3 P3.4
P3.2
Return
Die Supply Chain eines Unternehmens kann im nächsten Level durch ca. 17 Standardmodule konfiguriert werden. Die Unternehmen implementieren auf Level 2 ihreOperationsstrategie durch eine zugeschnittene Konfiguration.
Level 3 definiert die Möglichkeiten eines Unternehmens in seinen gewählten Märkten zu wirtschaften und besteht aus:• Definitionen der Prozesselemente• Input und Output von Prozesselementinformationen• Leistungsmessung der Prozesse• Best Practices• Potenziale des Systems zur Unterstützung der Best Practices
Level 3 verfeinert die Ebenen des 2. Levels
In diesem Level implementieren Unternehmen speziellzugeschnittene Supply Chain Management ToolsLevel 4 definiert Handlungsalternativen um Wettbewerbsvorteile zu erlangen und flexibel auf veränderteMarktsituationen regieren zu können
Level 1 definiert den Anwendungbereich und den Inhalt des Supply Chain Operations Reference-ModellsBasis für die Wettbewerbsstrategie
Quelle: SCOR Version 7.0 Overview, Supply-Chain Council 2005
Level 1 defines the scope and content for the Supply chain Operations Reference-model.Here basis of competition performance targets are set.
A company’s supply chain can be “configured-to-order” at Level 2 from core “process categories.”Companies implement their operations strategy through the configuration they choose for their supply chain.
Level 3 defines a company’s ability to compete successfully in its chosen markets, and consists of:
• Process element definitions• Process element information inputs, and outputs• Process performance metrics• Best practices, where applicable• System capabilities required to support best practices• Systems/tools
Companies “fine tune” their Operations Strategy at Level 3.
Companies implement specific supply chain management practices at this level. Level 4 defines practices to achieve competitive advantage and to adapt to changing business conditions.
Source: SCOR Version 7.0 Overview, Supply-Chain Council 2005
Notes:

Production Management B – Spring Semester 2009
Supply Chain Management I L06 P. 12
Lecture 06
Page 12© WZL/FIR
Structure
Introduction in Supply Chain Management1
Planning Tasks in Supply Chain Management2
Supply Chain Structures – Problems and Strategies3
Virtual Market Places4
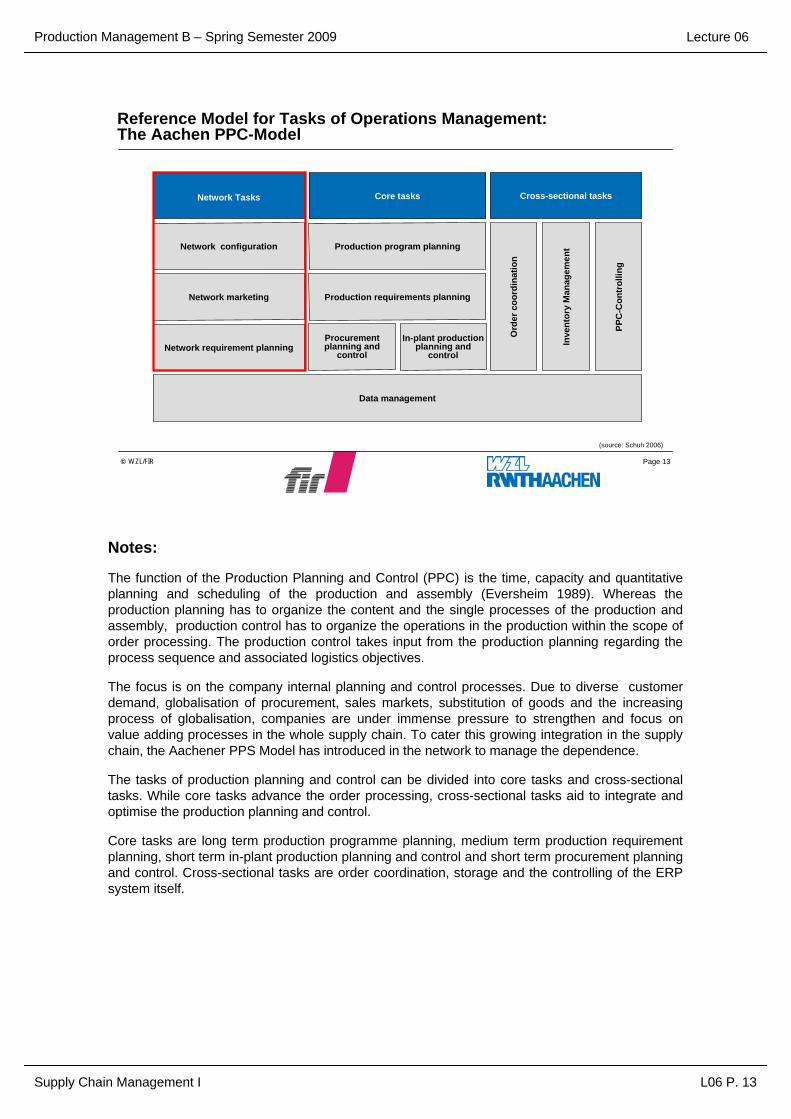
Production Management B – Spring Semester 2009
Supply Chain Management I L06 P. 13
Lecture 06
Page 13© WZL/FIR
Reference Model for Tasks of Operations Management: The Aachen PPC-Model
(source: Schuh 2006)
In-plant production planning and
control
Procurement planning and
control
Data management
Production program planning
Production requirements planning
Network configuration
Network marketing
Network requirement planning
Network Tasks Cross-sectional tasksCore tasks
Ord
er c
oord
inat
ion
Inve
ntor
y M
anag
emen
t
PPC
-Con
trol
ling
Notes:
The function of the Production Planning and Control (PPC) is the time, capacity and quantitative planning and scheduling of the production and assembly (Eversheim 1989). Whereas the production planning has to organize the content and the single processes of the production and assembly, production control has to organize the operations in the production within the scope of order processing. The production control takes input from the production planning regarding the process sequence and associated logistics objectives.
The focus is on the company internal planning and control processes. Due to diverse customer demand, globalisation of procurement, sales markets, substitution of goods and the increasing process of globalisation, companies are under immense pressure to strengthen and focus on value adding processes in the whole supply chain. To cater this growing integration in the supply chain, the Aachener PPS Model has introduced in the network to manage the dependence.
The tasks of production planning and control can be divided into core tasks and cross-sectional tasks. While core tasks advance the order processing, cross-sectional tasks aid to integrate and optimise the production planning and control.
Core tasks are long term production programme planning, medium term production requirement planning, short term in-plant production planning and control and short term procurement planning and control. Cross-sectional tasks are order coordination, storage and the controlling of the ERP system itself.

Production Management B – Spring Semester 2009
Supply Chain Management I L06 P. 14
Lecture 06
Page 14© WZL/FIR
• ___• ___• ___
max
• Supply Chain Modeling • Design of Supply Chain Elements (Capacities
for Inventory, Production and Logistics, ....
• ___• ___• ___
• ___• ___• ___
maxmax
Supply Chain Planning Level Description IT-System functions
Planning levels of Supply Chain Management
• Sales planning• Distribution planning• Master planning• Production planning• Machine scheduling• Sales order simulation• Transport planning• Problem management planning• Controlling• ....
• Customer Order Processing• Transport Order Processing• Assembly Order Processing• Production Order Processing• ....
Configuration of Production- and Logistic structures
Planning of Inventories, Planning of Assets and Capacities
Order Management
Supply Chain Configuration
Supply Chain Planning
Supply Chain Execution
Network configuration
Network marketing andNetwork requirement planning
Notes:

Production Management B – Spring Semester 2009
Supply Chain Management I L06 P. 15
Lecture 06
Page 15© WZL/FIR
Procurement Production Distribution Sales
materials program
supplier selection
cooperation's
plant location
production system
physical distributionstructure
product program
strategic salesplanning
staff planning
materialrequirements
order management
master productionscheduling
capacity planning
distributionplanning
mid-term sales planning
staff planning
ordering materials
lot-sizing
machine scheduling
replenishment
transport planning
short-term salesplanning
Supply Chain Configuration
Supply Chain Planning
Supply Chain Execution
information flows flow of goodsSource: Stadtler, Kilger: Supply Chain Management and Advanced Planning, 2005
Planning tasks of Supply Chain Management –The Supply Chain Planning Matrix
Notes:The Supply Chain Planning Matrix (SCP) classifies the planning tasks in the two dimensions „planning horizon“ and „supply chain process.“ The figure shows typical tasks which occur in most supply chain types, but with various contents in the particular businesses. The long-term tasks are shown in a single box to illustrate the comprehensive character of strategic planning. The other boxes represent the matrix entries, but do not correspond exactly to the planning modules of an hierarchical Planning System. The latter may contain only parts of a box - e. g. on the short-term level the planning tasks can be decomposed according to further dimensions like factory sites or product groups - or combine tasks of several boxes. The SCP Matrix can also be used to position the software modules of most APS vendors. (Stadtler, Kilger 2005, S. 86ff.)

Production Management B – Spring Semester 2009
Supply Chain Management I L06 P. 16
Lecture 06
Page 16© WZL/FIR
Supply Chains are dependent on Competence & Capacity Management for an enterprise
Cap
acity
Man
agem
ent
Competence Management
Multiple CapacityIn-/Outsourcing
MultipleIn-/Outsourcing
Multiple Sourcing
Selective CapacityIn-/Outsourcing
SelectiveIn-/Outsourcing
Selective Sourcing
Non-Sourcing Single-Outsourcing Single-Sourcing
P1 P2 P3 P4 P5
P1 P2 P3 P4 P5
P1 P2 P3 P4 P5
P1 P2 P3 P4P5 P1 P2 P3 P4 P5
P1 P2 P3P4 P5 P1 P2 P3 P4 P5
P1 P2 P3 P4 P5
P1 P2 P3 P4 P5
Ui
U1
Ui
U1
Ui
U1
Ui
U1
Ui
U1
Ui
U1
Ui
U1
Ui
U1
Ui
U1
Notes:
• The Supply Chain Management is dependent of the Competence- and Capacity management of a company
• The Supply Chain Management has to be adjusted to the company

Production Management B – Spring Semester 2009
Supply Chain Management I L06 P. 17
Lecture 06
Page 17© WZL/FIR
Structure
Introduction in Supply Chain Management1
Planning Tasks in Supply Chain Management2
Supply Chain Structures – Problems and Strategies3
Virtual Market Places4
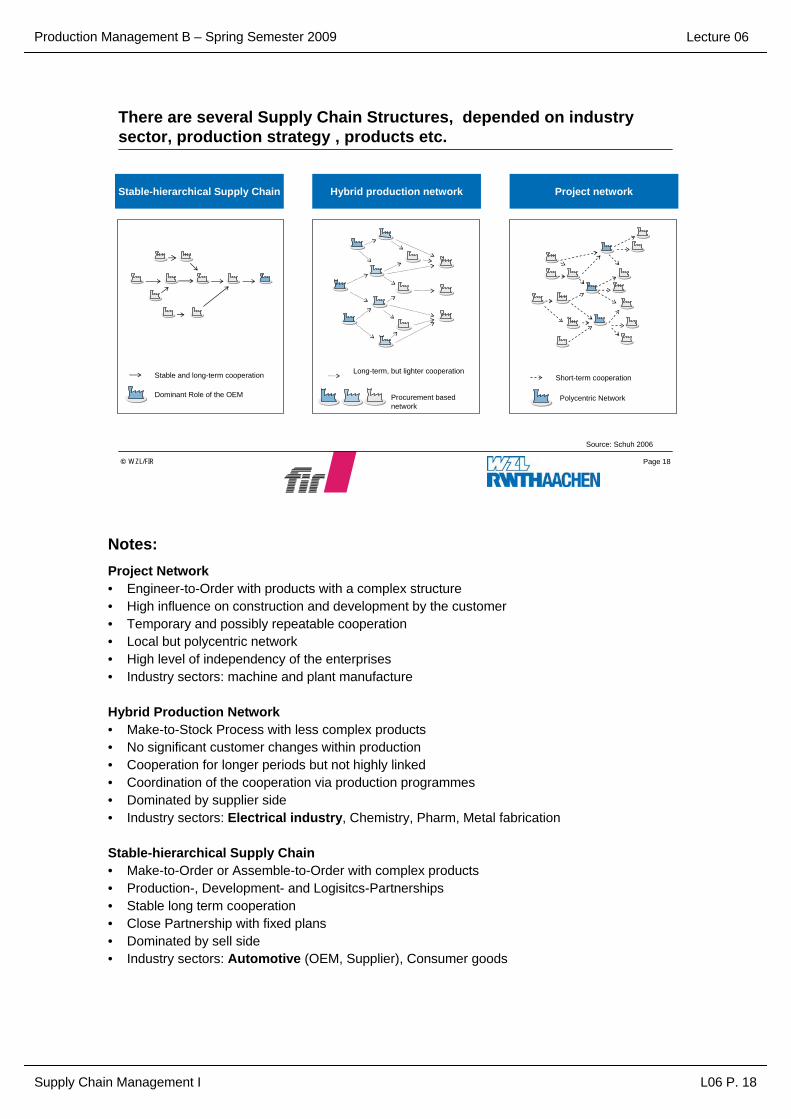
Production Management B – Spring Semester 2009
Supply Chain Management I L06 P. 18
Lecture 06
Page 18© WZL/FIR
There are several Supply Chain Structures, depended on industrysector, production strategy , products etc.
Project network
Short-term cooperation
Polycentric Network
Hybrid production network
Long-term, but lighter cooperation
Procurement basednetwork
Stable-hierarchical Supply Chain
Stable and long-term cooperation
Dominant Role of the OEM
Source: Schuh 2006
Notes:Project Network• Engineer-to-Order with products with a complex structure• High influence on construction and development by the customer• Temporary and possibly repeatable cooperation• Local but polycentric network• High level of independency of the enterprises• Industry sectors: machine and plant manufacture
Hybrid Production Network• Make-to-Stock Process with less complex products• No significant customer changes within production• Cooperation for longer periods but not highly linked• Coordination of the cooperation via production programmes• Dominated by supplier side• Industry sectors: Electrical industry, Chemistry, Pharm, Metal fabrication
Stable-hierarchical Supply Chain• Make-to-Order or Assemble-to-Order with complex products• Production-, Development- and Logisitcs-Partnerships• Stable long term cooperation• Close Partnership with fixed plans• Dominated by sell side• Industry sectors: Automotive (OEM, Supplier), Consumer goods

Production Management B – Spring Semester 2009
Supply Chain Management I L06 P. 19
Lecture 06
Page 19© WZL/FIR
The network structure depends on the companies structure in an industry sector
Stru
ctur
e of
com
pani
es a
tm
anuf
actu
ring
indu
stry
Pro
ject
net
wor
k
Stru
ctur
e of
com
pani
es a
t A
utom
otiv
e in
dust
ryS
tabl
e-hi
erar
chal
Sup
ply
Cha
in
Notes:

Production Management B – Spring Semester 2009
Supply Chain Management I L06 P. 20
Lecture 06
Page 20© WZL/FIR
For different Supply Chain Structures exist different coordination ConceptsCentral coordinated Supply Chain
Dominated Supply Chain
Supplier RemodelSurface- finish
Final Installation OEM
Supplier Installation-company Packer Distributor Customer
Stocks Production ordersStocks Production ordersStocks Production orders
General Agreement, Deliver Plans, CallsGeneral Agreement, Deliver-Plans,
Calls
General Agreement, Deliver plans, Kanban calls
Product development, Logistic coordinator Customer-Orders
Shipping ordersStock, Arrival of
GoodsProduction-,
Shipping ordersStock, Arrival of
Goods
Production-, Shipping orders
For example: Car Manufacturers
Notes:
Features of Central Coordinated Supply Chain:
• the logistic coordinator is responsible for planning and controlling the supply chain
• only few final product specific components – no close strategic relationship between the members of the supply chain
• logistic coordinator has no own production
Features of a Dominated Supply Chain:
• OEM determines batch sizes and target dates due to basic agreements
• order picking based on kanban
• every supply chain member knows demand data of the OEM
• overview over final needs of costumers allows coordinated storage and delivering with all partners of the SC

Production Management B – Spring Semester 2009
Supply Chain Management I L06 P. 21
Lecture 06
Page 21© WZL/FIR
Producer
Problems within the Supply Chain: The Bullwhip - Effect
± 3%± 70%
Supplier 1 Supplier 2 Customer
Information flow
Material flow
Sto
cks
/ Ord
er
size
t
Sto
cks
/ Ord
er
size
t
Sto
cks
/ Ord
er
size
t
Sto
cks
/ Ord
er
size
t
Stocks Order size
Notes:
Classical planning and design concepts are normally optimizing one partner of the logistics chain after each other. In this case the occurrence of small variations in the order size of the final customer have a huge impact on the order size for products from suppliers at the end of the logistic chain. This effect is called: Bullwhip-Effect
Reasons are :
1. Lack of actual sales forecast
2. Grouping of orders
3. Price variations
4. Bottle neck poker (limited flexibility)
Possible solutions are:
1. Continuous information flow through all levels of the supply chain
2. Introduction of information and communication systems
3. Central organization of orders

Production Management B – Spring Semester 2009
Supply Chain Management I L06 P. 22
Lecture 06
Page 22© WZL/FIR
The Bullwhip Effect – Causes and countermeasures
Transmit information (PoS, actions, etc.)
Supplier and customer integration
Reduction of complexity with frame contracts
Reduction of reaction time
Everyday low prices: no promotions etc.
Vendor Managed Inventory: Supplier takes care for stock
Increase network transparency and flexibility– Stock visibility – Increase supplying frequency, reduce
procurement/ production
Supply Chain fitting to functional/innovative products
Information flow
Flow of goods
Local information processing
Local planning at every location
Economies of scale/ Lot-production
Full-Truck-Load, Full Container
Undefined performance indicators
Lack of updating sales forecasts
Orders pooling
Price fluctuations
Quota limitation and bottleneck “poker”
Notes:

Production Management B – Spring Semester 2009
Supply Chain Management I L06 P. 23
Lecture 06
Page 23© WZL/FIR
Problems in the Supply Chain: Causes of delivery delay in the machine and plant manufacture industry –Information deficits
Inner-companyorders progress
Inter-companyorders progress
Inter-companyorders management
Inner-companyorders management
Inadequatemaster data
Capacitymaster dates
Materialmaster dates
Parameter ofdating
Inadequatefeedback
Inconsequentorders management
32%
29%
38%
35%
50%
36%
27%
• Unrealistic delivery dates
• Inadequate delivery reliability
Causes Effect
Source: Study - „Liefertermintreue im Maschinen- und Anlagenbau“ (Schuh u. Westkämper 2006)
Notes:Results of a study with 80 enterprises mainly of the machine and plant manufacture industry.
Key reasons for “unrealistic delivery dates” and “inadequate delivery reliability” are insufficient information flow processes. Companies do not share order progress and order management information with their partners.

Production Management B – Spring Semester 2009
Supply Chain Management I L06 P. 24
Lecture 06
Page 24© WZL/FIR
Supply Chain Management in the machine and plant manufacture industry -Integrated order management with myOpenFactory
Stat
us Q
uo
Relevant data structures of cooperation are standardized
Provides inter-company negotiation functions
Provides inter-company production planning functions
The integrated order management is hindered by the use of a multitude of different ERP systems.
The Implementation of 1:1 connections is expensive.
The most used communication media are still letters and fax
Notes:

Production Management B – Spring Semester 2009
Supply Chain Management I L06 P. 25
Lecture 06
Page 25© WZL/FIR
Potentials of Supply Chain Management
Supplier PhysicalProcess Producer Commerce CustomerPhysical
ProcessPhysicalProcess
Available to promise
Finding bottle necks
Order tracking
Reduction of delivery time
Faster business processes
Planning security
Higher flexibility
Higher cost transparency
Proactive Stock management…
Financial flow
Information flow
Baumgarten, TU Berlin 2001
Planning SCM
Potentials Potentials
Active asset management
Notes:
Beside missing trust between the partners in the value chain the main reason for the bullwhip effect is a lack of suitable and integrated IT-Systems. The occurring problems can not be solved by using partial solutions. A complete solution for the whole supply chain is required to achieve the mentioned benefits/potentials.
As already shown, these concepts can only be realized successful if all partners are involved in the project.
For the designing, planning, controlling and integration the tasks are not only divided in divisions in a company, they are also divided to other partners in different companies.
The cooperation partners are integrated in the Supply Chain to realize a win-win situation. A survey of the Supply Chain Council showed the room of improvement:
• Decreasing of delivery time 10-60%
• Reduction of the planning loop up to 95%
• Reduction of the stocks up to 75%
• Higher Capacity 10-50%

Production Management B – Spring Semester 2009
Supply Chain Management I L06 P. 26
Lecture 06
Page 26© WZL/FIR
Structure
Introduction in Supply Chain Management1
Planning Tasks in Supply Chain Management2
Supply Chain Structures – Problems and Strategies3
Virtual Market Places4

Production Management B – Spring Semester 2009
Supply Chain Management I L06 P. 27
Lecture 06
Page 27© WZL/FIR
The E-Community - Another form of modern customer / supplier relationship
Classical network
E-Community Supply Chain Network
Network
E-Marketplace
bala
nced
one.
-sid
ed
instable stable
Supplier
Supplier
Supplier
Supplier
Supplier
Supplier
Supplier
Supplier
MarketOEM
Supplier
OEM Market
Tier-1Tier-2
Market
Market
Supplier
Supplier
Supplier
Supplier
Supplier
SC Network A
SC Network B
Duration of cooperation
Rel
atio
nshi
p of
Dep
ende
ncy
and
Pow
er in
Te
rms
of P
lann
ing
and
Coo
rdin
atio
n Supplier
Supplier
Supplier
Supplier
SupplierSupplier
Supplier
Supplier
Supplier
Supplier
Supplier
Supplier
Supplier
Supplier
Supplier
Supplier
Supplier
Supplier
Supplier
Notes:
Today a company is not only member of one single type of supply chain. Originated in the traditional costumer-supplier relationship today there are three new types of supply chain networks:
1. E-Community:
Every supplier offers his products on an e-market place, where suppliers as well as final costumers can purchase parts.
2. Strategic Network:
The strategic network is controlled by a OEM who also dominates the whole supply chain. There may be several stages in the supply chain. To keep the competition between the different supply chain alive the OEM run private market places where the suppliers are competitors.
3. Supply Chain Network:
In a supply chain network is no defined structure between the several suppliers. Depending on their actual needs, the members supply each other situation based. Companies often participate on more than one network.

Production Management B – Spring Semester 2009
Supply Chain Management I L06 P. 28
Lecture 06
Page 28© WZL/FIR
Market Places as Connection between Seller and Customer
Virtual Marketplace
A B
C
DE
F
A B
C
DE
F
Real Market Place Virtual Market Place
Combination of traditional market places Integration of electronic market places
Notes:
Electronic market places are platforms where different activities belonging to electronic transactions are combined. The last and most lasting step of a value chain in the E-commerce is the organization of complete transactions via electronic market places. This results in the usage of scale effects in the network and reduction of single interactions between companies. Transactions are not any more organized between two companies. They are organized as the optimum for all integrated partners through the electronic data highway by using centralized agencies.
This allows to make offers and requests public and find the most suitable solution with very limited costs and efforts.

Production Management B – Spring Semester 2009
Supply Chain Management I L06 P. 29
Lecture 06
Page 29© WZL/FIR
Problems with Electronic Market Places
Reaching critical massIncome mainly based on number of transactions
Variable costs
Critical mass
Cos
ts
Number of transactions
Fixed costs:• Rent• Personal costs• Marketing costs• Organization
Variable costs:• Customer care• Administration of database• Transaction specific costs
Fixed costs
Notes:
During the past 2 years a huge number of electronic market places occurred and disappeared even faster.
Regarding recent literature it is common scenes that electronic market places have something like a critical number of transactions which they have to reach before being successful. Often this point is quite high due to the fact that you have high initial efforts which often are underestimated by the operating companies.
To negotiate the critical mass, the financial income of the market place, which is often depending on the chosen concept, has to be higher than the occurring costs. The occurring costs are a combination of fixed costs and variable costs.
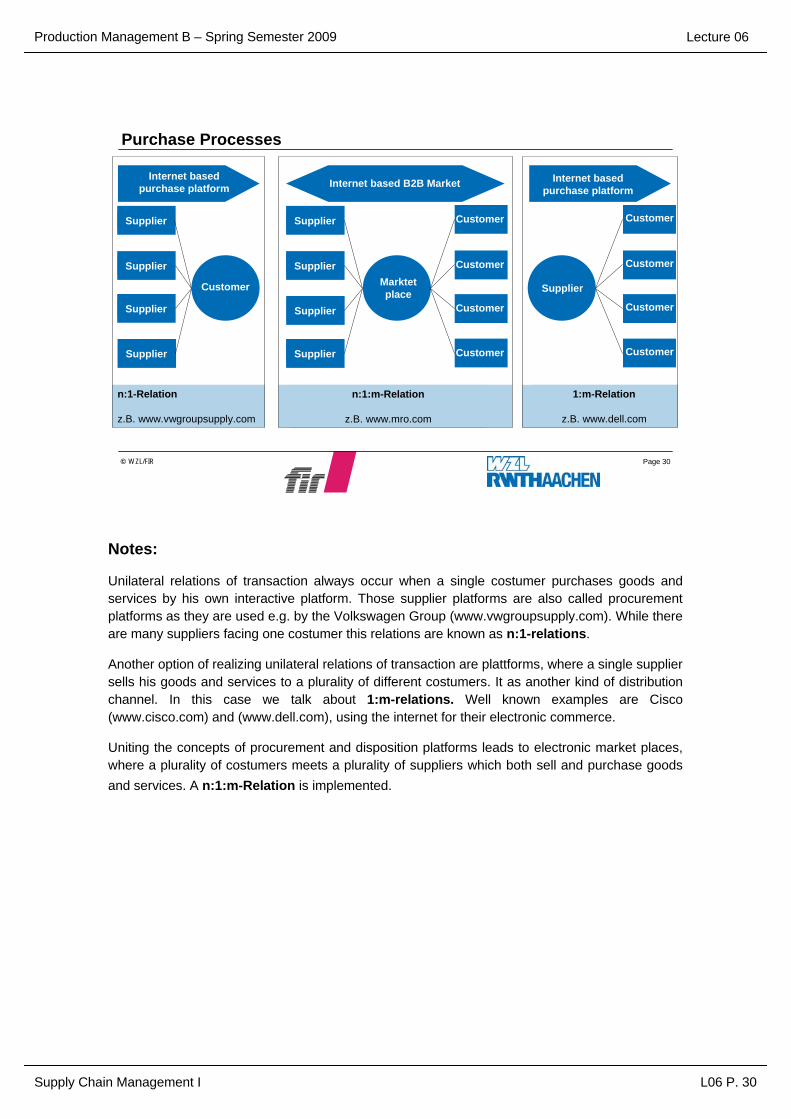
Production Management B – Spring Semester 2009
Supply Chain Management I L06 P. 30
Lecture 06
Page 30© WZL/FIR
Purchase Processes
Marktetplace
Supplier
Supplier
Supplier
Supplier
Customer
Supplier
Supplier
CustomerSupplier
Supplier
Supplier
Customer
Customer
Customer
Customer
Customer
Customer
Customer
Internet based B2B MarketInternet based
purchase platform
n:1-Relation
z.B. www.vwgroupsupply.com
n:1:m-Relation
z.B. www.mro.com
1:m-Relation
z.B. www.dell.com
Internet based purchase platform
Notes:
Unilateral relations of transaction always occur when a single costumer purchases goods and services by his own interactive platform. Those supplier platforms are also called procurement platforms as they are used e.g. by the Volkswagen Group (www.vwgroupsupply.com). While there are many suppliers facing one costumer this relations are known as n:1-relations.
Another option of realizing unilateral relations of transaction are plattforms, where a single supplier sells his goods and services to a plurality of different costumers. It as another kind of distribution channel. In this case we talk about 1:m-relations. Well known examples are Cisco (www.cisco.com) and (www.dell.com), using the internet for their electronic commerce.
Uniting the concepts of procurement and disposition platforms leads to electronic market places, where a plurality of costumers meets a plurality of suppliers which both sell and purchase goods and services. A n:1:m-Relation is implemented.

Production Management B – Spring Semester 2009
Supply Chain Management I L06 P. 31
Lecture 06
Page 31© WZL/FIR
Integration of Virtual Market Places in SCM
Supply Chain 1
Supply Chain 2
Supply Chain 3
C1
C1
C1
C2
C2
C2
C3
C3
C3
C4
C4
C4
Vertical electronic market place, additional to SCM
Vertical electronic market place, additional to SCM
horizontal electronic Marketplace, additional to SCMLegend:
C = Company
Notes:
Supply Chain 1, 2 and 3 are build out of four companies each. It is assumed that all Supply Chains belong to different branches.
Horizontal market places offer the opportunity to companies, belonging to different branches, to combine their special skills. This is an supplement to the normal supply chain management. Typical examples for this are logistic oriented marketplaces which are working for companies of different branches.
Vertical market places combine participants from different levels of the value chain within one branch. They can be an add on for the supply chain management (Example: Supply Chain 1) or an additional solution (Example: Supply Chain 3). Vertical Market places are mainly used to integrate small and medium sized enterprises in a supply chain without a high amount of information exchange like it is typically required for the supply chain management.

Production Management B – Spring Semester 2009
Supply Chain Management I L06 P. 32
Lecture 06
Page 32© WZL/FIR
Example for a Market Place within the Supply Chain
• wtransnet is an internet based logistic trading platform (horizontal Marketplace)
• Better usage of trucks
• Reduction of waiting time
• Higher transparency
116.077 requests counted inMarch 2003
Notes:
The most important functions of wtransnet:
The Transport Company – Catalogue is a search machine which allows the customer to find his product during the whole shipping process. Information provided by the search engine are: geographic position, used truck, used route.
Participants – Search engine is a tool which allows members to identify each other and to specify if someone is member of wtransnet. Further on, information like VAT number, social capital, date of foundation or available storage space are available. Also included in this search engine is an information exchange tool to contact companies directly or report incidents to wtransnet.
Emergency delivery database is a database with companies providing storage space and delivery services for goods that have to be stored unplanned due to an accident or other emergencies.

Production Management B – Spring Semester 2009
Supply Chain Management I L06 P. 33
Lecture 06
Page 33© WZL/FIR
Covisint: Market Place for the Automotive IndustryFounders:
DaimlerChrysler,
Ford,
General Motors,
Nissan
and Renault.
Co Connectivity, Collaboration und Communication
Vis derivated from visibility, means presence and transparency , which the Internet intercedesand the vision of the Supply Chain Management of the future
Int pointed to the integrated solutions, which are provide by this risk enterprise and the international exchanges sphere of action.
E.g. DaimlerChrysler‘s Supply Chain Portal
www.covisint.com
Notes:

Production Management B – Spring Semester 2009
Supply Chain Management I L06 P. 34
Lecture 06
Page 34© WZL/FIR
Covisint: Provided Services and Functions
CollaborativeProduct Development
CovisintValue Added Services
Supply Chaine-Procurement Cross Product
Functionality
• Virtual Workspace• Collaborative Design• Secured Knowledge Exchange
• Portal Technology• Secure Single Sign-On• User Personalization
• Electronic Catalogues• Digital Marketplace• Auctions (On Line Bidding) • Quote Management• Asset Control
• Supply Chain Planning• Supply Chain Execution• Supply Chain Connectivity• Supplier Quality
Quality
• Problem Solver• Advanced Quality Planner
Notes:
Value Added ServicesUnternehmen haben zahlreiche e-Business Bedürfnisse. Zu diesen Bedürfnissen zählt unter anderem die optimale Kooperation innerhalb eines Unternehmens oder mit den jeweiligen Handelspartnern. Des Weiteren bestehen Bedürfnisse im Hinblick auf die Optimierung der gemeinsamen Nutzung von Dokumenten, der Prüfung von Revisionen, der Mitteilung elektronischer Informationen, der Integration von Lösungen, der Kommunikation mit den jeweiligen Kunden und den jeweiligen Lieferanten.QualityDie Quality Solution Suite von Covisint umfasst ein Werkzeug zur erweiterten Produktqualitätsplanung durch eine Partnerschaft mit Powerway sowie das von Covisintentwickelte Problem Solver-Werkzeug. Mit Advanced Quality Planner können die Prozessanforderungen an die erweiterte Produktqualitätsplanung sowie die Liefergegenstände verwaltet und die Komplexität der Produktqualitätsplanung verringert werden. Problem Solver löst dauerhaft Probleme, die nicht im Produktqualitätsplanungsprozess behoben werden konnten.e-ProcurementCovisint Procurement bietet folgende Möglichkeiten:
• Senden und Empfangen von RFQs (Angebotsanforderungen) auf elektronischem Wege über Quote Manager.
• Online-Durchführung von Verhandlungen zwischen mehr als zwei Personen; BuyerAuctions ermöglicht Verhandlungen zwischen mehreren Personen innerhalb einer kurzen Zeitspanne.
• Über Online-Custom Catalogs erhalten Sie per Tastendruck elektronischen Zugriff auf Produkte.
• Asset Control ermöglicht Ihnen die Umverteilung von Ressourcen oder deren Kauf oder Verkauf im Rahmen einer größeren Anzahl von Teilnehmern.

Production Management B – Spring Semester 2009
Supply Chain Management I L06 P. 35
Lecture 06
Page 35© WZL/FIR
Future of Virtual Market PlacesCustomization
• My Marketplace
• My Products
• My Service
Customization
• Integrated product development
• Integrated projectsConnectivity
• Open communication with third parties in different marketplaces
Commerce
• Transaction specific information
• Transactions
• Integrated services
Content
• Information archive
• Databases
• News service
• Analyses and comments
Community
• Possibility for discussions
• Expert-Chat
• Career-Center
• Controlling systems
• …
Higher customer loyaltyStandard
Notes:
In this example most of the shown possibilities for the future development for internet based B2B-market places are only mend to give a general overview.
A special allocation of provided services to the different types of market places is not realized in this slide.
In the center of all future activities you will find the initiation and organization of transactions. This main service will be completed by different services with which the interest for the customers can be enlarged.

Production Management B – Spring Semester 2009
Supply Chain Management I L06 P. 36
Lecture 06
Final statement:• SCM increases the scope of traditional PPC. Within the scope of SCM are all
Enterprises of a supply chain.
• There exist different reference models. SCOR is the most known and used one.
• The planning tasks of SCM can be structured with the Aachener PPC Model. There exist three different planning levels with different planning horizons.
• There exist different Supply Chain structures. Different methods are applicable in those structures.
• The most popular problem within Supply Chains is the Bullwhip-effect. There are different counter measures to avoid bullwhip, their core is the improvement of the information flow.
• Virtual market places address the electronic order management.

Production Management B – Spring Semester 2009
Supply Chain Management I L06 P. 37
Lecture 06
Questions:• What are the main targets of Supply Chain Management?
• How does SCM differentiate from the classic material management and PPC?
• How can Supply Chains be modeled?
• What are the core tasks of SCM?
• Which different types of Supply Chains exist? In which industry sectors can they be found?
• What is the Bullwhip effect? Why does it happen and which countermeasures exist?
• What are virtual market places?
• How can virtual market places be differentiated?
• Can you name examples for virtual market places?

Production Management B – Spring Semester 2009
Supply Chain Management I L06 P. 38
Lecture 06
Bibliography:
Supply Chain ManagementSimchi-Levi, D.;Kaminsky, P.; Simchi-Levi, E.: Managing the Supply Chain;;
McGraw-Hill Companies; 2003.
Stadtler, H.; Kilger, C. (Hrsg.): Supply Chain Management and Advanced Planning, 3.Auflage, Springer 2005.
Schuh, G.: Produktionsplanung und -steuerung – Grundlagen, Gestaltung und Konzepte; 3. Auflage; Springer; Berlin Heidelberg; 2006.
Alicke, K.: Planung und Berieb von Logistiknetzwerken: Unternehmensübergreifendes Supply Chain Management; 2. Auflage; Springer; Berlin Heidelberg; 2005.
Kuhn, A.; Hellingrath, B.: Supply Chain Management; Springer; Berlin Heidelberg; 2002.
Milberg, J.; Schuh, G.: Erfolg in Netzwerken; Springer; Berlin Heidelberg; 2002
Marbacher, A.: Demand & Supply Chain Management; Verlag Paul Haupt; Bern, Stuttgart, Wien; 2001
Virtual Market PlacesDingeldein, R.: Entwicklung einer Systematik internetbasierter B2B-Marktplätze;
Digitaler Vervielfältigungs- und Verlagsservice Frankfurt am Main; Juli 2002.
Richter, K.; Nohr, H.: Elektronische Marktplätze, Potentiale, Funktionen und Auswahlstrategien; Die Deutsche Bibliothek - CIP - Einheitsaufnahme; 2002
Heilmann, H.: Elektronische Marktplätze; HMD; 2002
VDI Internet, e-Supply Chain Management und Virtual Reality; VDI-Berichte 1649; VDI-Verlag; 2001
Kaluza, B.; Blecker, T.: Integration von Unternehmung ohne Grenzen und Supply Chain Management; Universität Klagenfurt Nr. 9904; Institut für Wirtschaftswissenschaften; 1999

Production Management B – Spring Semester 2009
Supply Chain Management II L07 P. 0
Lecture 07
Production Management B
Lecture 07Supply Chain Management II
Teaching Assistant:Dipl.-Ing. A. [email protected] 53B, room 507Phone: 80-27382
Laboratory for Machine Tools and Production Engineering
Chair of Production EngineeringProf. Dr.-Ing. Dipl.-Wirt. Ing. G. Schuh
Char of Production ManagementProf. Dr.-Ing. A. Kampker

Production Management B – Spring Semester 2009
Supply Chain Management II L07 P. 1
Lecture 07
Index:
Index Page 1
Schedule Page 2
Glossary Page 3
Targets of this lecture Page 5
LectureClassification Page 6
Deterministic Optimization Page 14
Further Optimization Page 21
Final Statements Page 32
Questions Page 33
Bibliography Page 34

Production Management B – Spring Semester 2009
Supply Chain Management II L07 P. 2
Lecture 07
Schedule:No. Date Responsible
L1 27.04.2009 Mr. Rittstieg 0241 80 20396
L2 04.05.2009 Mr. Bartoscheck 0241 80 28203
L3 18.05.2009 Mr. Fuchs 0241 80 26265
L4 25.05.2009 Mr. Reil 0241 80 27964
L5 08.06.2009 Mr. Potente 0241 80 27387
L6 15.06.2009Mr. Bauhoff (fir)
0241 47705-439
L7 22.06.2009 Mr. Hoeschen 0241 80 27382
L8 29.06.2009 Mr. Jung 0241 80 27392
L9 06.07.2009 Mr. Rauhut 0241 80 28206
L11 13.07.2009Mr. Koch
0241 80 25321
L12 20.07.2009 Mr. Cuber (fir) 0241 47705-420
Customer Relations Management
Enterprise Ressource Planning I
Enterprise Ressource Planning II
Topic
IT in Production Management
Enterprise Ressource Planning III
Product Lifecycle Management II
Digitale Plant Planning and Simulation
Business Engineering - Method of selecting IT-Systems (Trovarit)
Supply Chain Management I
Supply Chain Management II
Product Lifecycle Management I

Production Management B – Spring Semester 2009
Supply Chain Management II L07 P. 3
Lecture 07
Glossary:The bead chain is a metaphor to describe a concept, in which the order of consumption of vendor
parts is determined as early as possible, allowing not only direct suppliers (tier 1) to supply just-in-sequence, but where the this order is also used to align suppliers of the second and third tier. It is one of the most extreme application of the Just-in-time concept and requires for the stability of the production sequence.
Combinatorial optimization is being used for problems, where the set of feasible solutions isdiscrete or can be reduced to a discrete one
Dynamic optimization is a method of solving problems whose parameters change over time.
Evolutionary Algorithms are optimization algorithms which use some mechanics inpired by biological evolution, namely selection, recombination an mutation.
Genetic algorithms are a particular class of evolutionary algorithms wich additionally employ a mechanic of inheritance.
Heurisic algorithms or heurisics are algorithms which are able to produce an acceptablesolution to a problem, but for which there is no formal proof of its correctness or the absolute quality of the outcome.
Linear programming (LP) is a technique for optimization of a linear objective function, which in turn is subject to linear equality and linear inequality constraints. Linear programming determines the way to achieve a mathematical optimum in a given model, in which requirements and constraints are being represented as linear equations.
A metaheuristic is a heuristic optimization method by combining heuristics to approach problems for which there is no satisfactory problem-specific algorithm or heuristic, or for which it is impractical to implement such a specific method.
Nonlinear programming (NLP) is a technique for optimization of an objective function which is subject to constraints, where some of the constraints or the objective function itself may be nonlinear.
Simulated annealing (SA) is a generic metaheuristic inspired by annealing in metallurgy. It is often used when the search space is discrete (e.g., all tours that visit a given set of cities). Simulated annealing may be more effective than complete enumeration, provided that the goal is merely to find a good solution in a given time, rather than the actual optimum.
Stochastic optimization (SO) is a a optimization method, in which algorithms incorporate random elements, either in the objective function, the constraints, in the algorithm itself or a combination the above.
A supply chain is an inter company network, whose links are both customer and supplyer within a given production process. A supply chain may be found in the production process of an automobile, where a company may provide modules for the OEM and buy parts from vendor suppliers, who in turn receive parts themselves. Other examples include supply chains of the textile industry, aeronautics and space industry. are for example the automotive

Production Management B – Spring Semester 2009
Supply Chain Management II L07 P. 4
Lecture 07
Glossar:

Production Management B – Spring Semester 2009
Supply Chain Management II L07 P. 5
Lecture 07
Targets of this Lecture:
• Overview over requirements to IT systems in supply chain management
• Overview over planning methods in supply chain management and over basic operations research methods
• Exemplary presentation of three operations research methods
• Linear optimization
• Evolutionary algorithms
• Simulated Annealing
• Overview over problems and challenges in supply chain management
Production Management B – Spring Semester 2009
Supply Chain Management II L07 P. 6
Lecture 07
Seite 6© WZL/Fraunhofer IPT
Structure
Classification in Context1
Deterministic Optimization2
Further Optimization Methods3

Production Management B – Spring Semester 2009
Supply Chain Management II L07 P. 7
Lecture 07
Seite 7© WZL/Fraunhofer IPT
How does "SCM" fit into the big picture?
CRMSCM
PLM
CustomerSupplier
Products
Resources
ERP
Enterprise

Production Management B – Spring Semester 2009
Supply Chain Management II L07 P. 8
Lecture 07
Seite 8© WZL/Fraunhofer IPT
Evolution of IT Systems in SCM
MRP, MRPII
ERP
Network Resource Planning (NRP) SCM + ERP + CRM
Supply Chain Excellence
Time
SCM Planning & Execution Software
1975 19951985 2005
The development of information technology has contributed substantially to innovation within the area of Supply Chain Management.
Focus on individual processes
Focus on enterprises
Focus on value creation network
MRP, MRP II (Manufacturing Resource Planning) Focus on individual processes: independent single solutions surrounded by an integrated planning environment
ERP (Enterprise Resource Planning)Focus on enterprises: Reduction of some stand-alone solution functionalities in favor of a higher integration
NRP (Network Resource Planning)Focus on value creation network: web-based networks of different
ERP and SCM solutions on all stages value creation

Production Management B – Spring Semester 2009
Supply Chain Management II L07 P. 9
Lecture 07
Seite 9© WZL/Fraunhofer IPT
IT Systems in SCM: Central Success Parameters
Supply Chain strategic alignment
Supply Chain planning
collaboration
Supply Chain execution
collaboration
Supply Chain IT-support
Supply Chain information availability
Supply Chain communication
Supply Chain know-How
Supply Chain skill sharing
Supply Chain (re-)
configuration flexibility
1
34
5
2
„Networked“ SCM =Web-based, enterprise-spanning co-
operation within the Supply Chain
Aim: Information exchange in real time for the coordination and synchronization of demand and supply over the entire network
Consequence: connection of enterprises to networked, integrated Supply Chains
CollaborationReactivity
Coordination
The three central success parameters collaboration, coordination and reactivity build the basis for intensive enterprise-spanning cooperation in the Supply Chain:
CollaborationExact tuning of production and transport between the individual stages
CoordinationReal-time and complete communication of the demand over the entire supply chain
ReactivityFast transformation of incoming orders through internal calculation of requirements, dispatching of production and passing on orders to divisions or suppliers
Networked SCM is an evolution of the SCM concept. It is essentially based on e-enabled Supply Chain Management (eSCM) as well on Suppler Relationship Management (SRM).
The described requirements must be fulfilled by SCM IT systems.

Production Management B – Spring Semester 2009
Supply Chain Management II L07 P. 10
Lecture 07
Seite 10© WZL/Fraunhofer IPT
Example: Bead Chain
Constant, sequential feeding of production lineRealize rationalization potential of 25%
Aims
Proximity of the supplier to the manufacturerFor "pure" bead chain: no buffers at allReplacement of stocks by real time data communicationIncrease of lead times facilitates application of concept
Enabler
TurbulencesTime spreading in linesProcess securityAvailability
Problems
Losses of sequence by errors in production system
corrective by stockStability of sequence
No buffer or variation possibilitiesKeine Puffer - bzw. Variationsmöglichkeiten
A1 A2 A3 A4
T_A4
T_A3
T_A2
M_A2
M_A3
M_A1
M_A4Z_A5
Z_A4 Z_A6
TIER 2
TIER 1
TIER 1JIS
JIS
JIS
Keine Puffer - bzw. Variationsmöglichkeiten
A1 A2 A3 A4A1 A2 A3 A4
T_A4
T_A3
T_A2
T_A4
T_A3
T_A2
M_A2
M_A3
M_A1
M_A4
M_A2
M_A3
M_A1
M_A4Z_A5
Z_A4 Z_A6
Z_A5
Z_A4 Z_A6
TIER 2
TIER 1
TIER 1JIS
JIS
JIS
Concept of the bead chainThe basic concept of the bead chain sounds trivial, the conversion, however, is complicated:
Goal is to get a fixed sequencing of the products as early as possible, all products will then pass through the entire production process like drawn up on a bead chain. During order scheduling, all requirements of all production departments as well as different special processes are considered from the beginning.
However, such a continuous sequential feeding of the production line is very difficult to achieve in practice. Turbulences in the form of quality problems and disturbances appear from time to time so that products must be taken out of the sequence, reworked and finally be reinserted into the production flow. This destroys the bead chain.
Increasing the lead time makes sequencing easier for suppliers.

Production Management B – Spring Semester 2009
Supply Chain Management II L07 P. 11
Lecture 07
Seite 11© WZL/Fraunhofer IPT
Practical Example: Bead Chain: smart
(Source: smart)
After the production sequence the module supplier supplies to the location of assembling
Wrongly supplied modules are installed in any case
Modularity
Supplier are directly settled down beside the assembly hall
Period from 1.5 to 4 hours (for the production of the modules in the demanded variant)
Short ways and times
Smartville - „Automobile factory of the future“Smartville is the first factory in the automobile sector, which follows the vision of the logistics-focused factory and tries to convert the bead chain concept.. This focusing on logistics is characterized by a final assembly, which are answered and accomplished by the car manufacturer, as well as characterized by a gradated supply system for components.
The principles of this type of factory are the modularity, the expandableness, the short ways and the optimization of the flow of material.
The company is located at Hambach in the French Lorraine. The factory has a maximum capacity of 150.000 vehicles per year. A SMART is produced after approximately 4.5 to 5 hours.

Production Management B – Spring Semester 2009
Supply Chain Management II L07 P. 12
Lecture 07
Seite 12© WZL/Fraunhofer IPT
IT-Systems in SCM: Development Needs
There is still a lot to do!
Insufficient consideration of capacities and bottlenecks
Insufficient consideration of current production conditions
No common development of prognosis data
Data distortion by lacking information exchange
Bad quality of feedbacks
Insufficient consideration of changed basic conditions
Increasing dependence on suppliers because of outsourcing
Difficult data exchange because of missing standards

Production Management B – Spring Semester 2009
Supply Chain Management II L07 P. 13
Lecture 07
Seite 13© WZL/Fraunhofer IPT
Planning in SCM: Proceeding & Range of Application
Proceeding
Problem analysis
Determination of aims and options
Formulation of a mathematical model
Procurement of necessary data
Finding a solution
Evaluation of this solution
Range of application (examples)Planning of production networks
Production program planning
Machine scheduling
Determination of lot sizes
Balancing of production tasks in the network
…
Logistics
Stock management
Transport planning
Route planning
Marketing
Financing
Planning in general and hence also OR supported planning in SCM takes place in a complex process with six steps. These steps represent an abstraction of real planning processes with the help of OR.
Between these steps, there are various interdependences and loops. They must be seen as a cycle which has to be passed through several times (completely or partially).

Production Management B – Spring Semester 2009
Supply Chain Management II L07 P. 14
Lecture 07
Seite 14© WZL/Fraunhofer IPT
Structure
Classification in Context1
Deterministic Optimization2
Further Optimization Methods3

Production Management B – Spring Semester 2009
Supply Chain Management II L07 P. 15
Lecture 07
Seite 15© WZL/Fraunhofer IPT
Types of Optimization Problems
Optimization
Stochastic optimization
Combinatorial optimization
Dynamic optimization
Linear programming
Nonlinear programming
We talk of Stochastic optimization if random variables are present in secondary conditions or in the objective function.
Dynamic optimization is needed if optimization problems are regarded over several stages or time periods. According to Bellman's principle of optimization, the problem is fragmented into stages and relevant decisions are only taken inside stages. The aim is the realization of a global total optimum – which depends on all partial solutions. E.g., production might have to be organized in a way that secures minimum supply and fixed maximum stock levels. The determination of shortest ways and the solution of the traveling salesman problem (see below) are other dynamic optimization tasks.Nonlinear programming, if function and restrictive equations are not linear. Solutions with the help of Lagrange’s multiplication procedure or Kuhn-Tucker-Theorem. Solution is highly complex. Few applications.Combinatorial optimization for linear problems which require integer or binary solutions. Solution methods are the cutting plane procedure or the branch and bound methods. Typical tasks: allocation of locations to regions, allocation of persons to tasks, allocation of orders (at optimal costs and time) to machines; route and lot size planning problems. Linear programming if both objective function and restrictions are linear. Solution e.g. with the help of the simplex procedure. Typical application examples: profit-maximizing production under restriction of machining times or workers, cost-minimal mixture of raw material/substances, waste-minimal cutting of products.
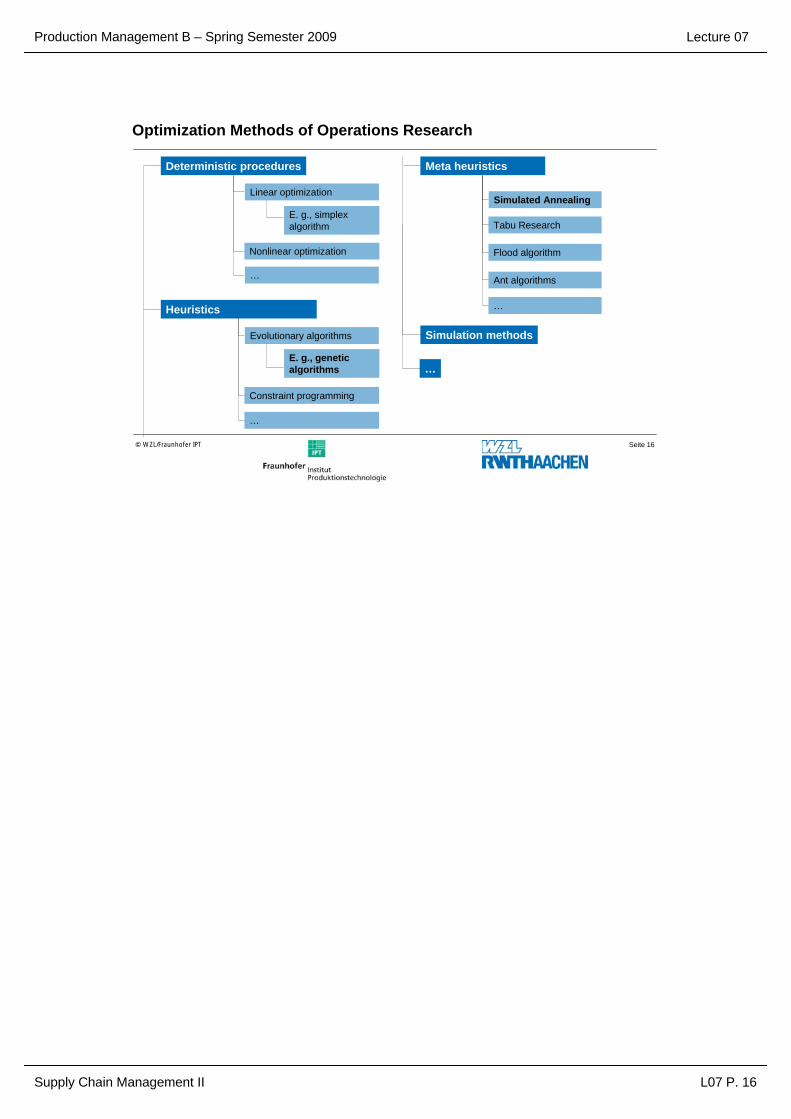
Production Management B – Spring Semester 2009
Supply Chain Management II L07 P. 16
Lecture 07
Seite 16© WZL/Fraunhofer IPT
Optimization Methods of Operations Research
Deterministic procedures
Linear optimization
Nonlinear optimization
Heuristics
Meta heuristics
Evolutionary algorithms
E. g., genetic algorithms
Simulated Annealing
Tabu Research
Flood algorithm
Ant algorithms
…
Simulation methods
E. g., simplex algorithm
Constraint programming
…
…
…

Production Management B – Spring Semester 2009
Supply Chain Management II L07 P. 17
Lecture 07
Seite 17© WZL/Fraunhofer IPT
Linear Optimization 1: Basic Solution Principle
Objective function F(x) is linear:
Linear side conditions:
Decision variables xj nonnegative
Linear optimization is the most important and most popular instrument of Operations Research. Linear optimization means the optimization – i. e., the maximization or minimization – of a linear objective function, the variables of which have to fulfill a system of linear inequalities (so called restrictions)
Definition
Example (optimal production program)
n productpj price of productkj direct manufacturing costsm machineaij production coefficientbji capacity of machine i
Legend:
Determine manufactured lot sizes xj (j=1,…,n)so as to maximize the contribution margin:
under the side condition
njxj
,...,mibxa
)xk(pF(x)
n
j
ijij
n
j
jjj
,...,1für 0
1für
max
1
1
=≥
=≤
−=
∑
∑
=
=
∑===
n
1jji cxxcF(x)
∑=−=
n
1jjjiji bxa(x)g
)R(X n+=

Production Management B – Spring Semester 2009
Supply Chain Management II L07 P. 18
Lecture 07
Seite 18© WZL/Fraunhofer IPT
Linear Optimization 2: Procedure (example: graphic solution)
M: machinepc/unit: contribution margin per unit
optimal solution:
contribution margin = 398
(with x1=82, x2=78)
0x,0x 792x7x3 320x2x2 600x3x4
x3x2max
21
21
21
21
21
≥≥≤+≤+≤+
+under the side conditions
contrib. margin/unit
machining time in hours
product
product 2product 1
capacity in hours
mac
hine
(see exercise for sample problem)

Production Management B – Spring Semester 2009
Supply Chain Management II L07 P. 19
Lecture 07
Seite 19© WZL/Fraunhofer IPT
Linear Optimization 3: Application Area of Production Program Planning
Determination of the optimal production program under capacity and other constraints with the goal of minimizing costs or maximizing profit (e.g. optimal manufacturing, smelting, and rolling program):
What has to be produced (which products)?How much has to be produced (in which quantities regarding the limited capacity of machines and workers)?How shall it be produced (which producer, what kind of production process)?
Task
Production and sales volumes are the same for all products. Price and variable costs are constant for each product.Production coefficients are constant.Capacities are constant and are known for the planning period.Sales quantities of product are not correlated.Setup costs and times are not explicitly considered.No co-products exist.Factor prices are constant.
Premises
The underlying premises strongly constrict the procedure in practice.
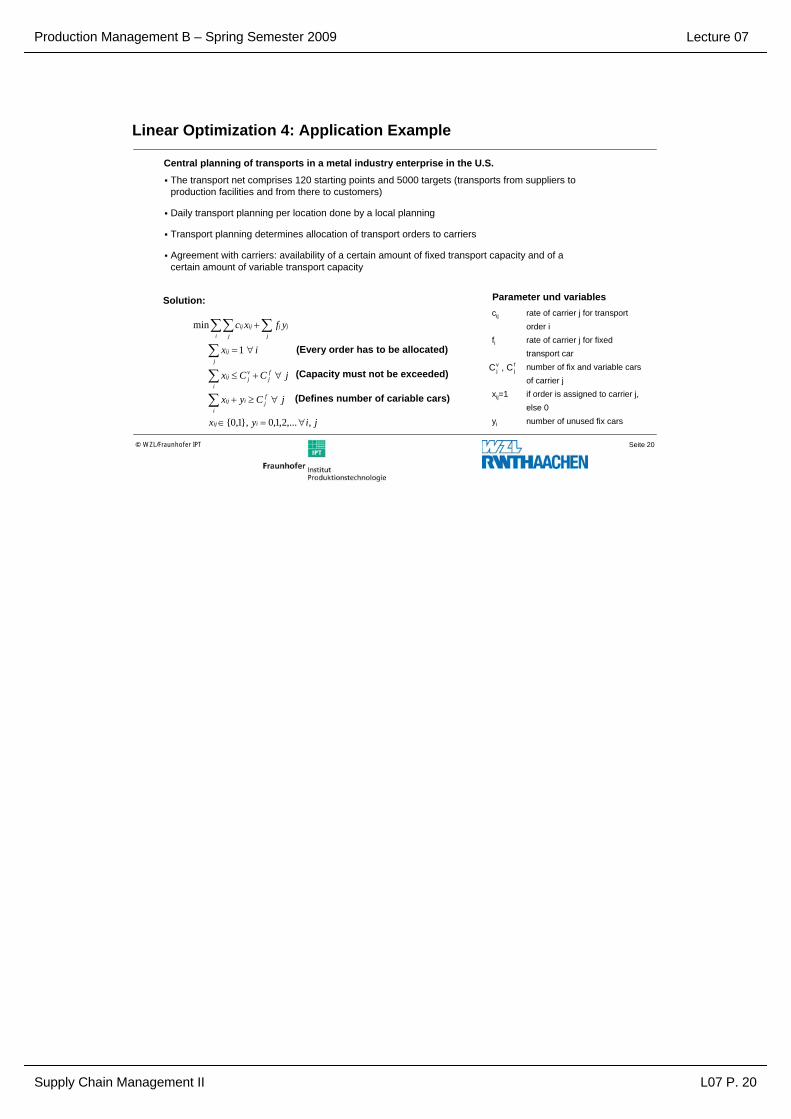
Production Management B – Spring Semester 2009
Supply Chain Management II L07 P. 20
Lecture 07
Seite 20© WZL/Fraunhofer IPT
Linear Optimization 4: Application Example
The transport net comprises 120 starting points and 5000 targets (transports from suppliers to production facilities and from there to customers)
Daily transport planning per location done by a local planning
Transport planning determines allocation of transport orders to carriers
Agreement with carriers: availability of a certain amount of fixed transport capacity and of a certain amount of variable transport capacity
Central planning of transports in a metal industry enterprise in the U.S.
cij rate of carrier j for transport order i
fi rate of carrier j for fixed transport carnumber of fix and variable carsof carrier j
xij=1 if order is assigned to carrier j,else 0
yi number of unused fix cars
, C C fj
vj
Parameter und variables
jiyx
jCyx
jCCx
ix
yfxc
iij
i
fjiij
fj
i
vjij
j
ij
jjj
i jijij
,,...2,1,0},1,0{
1
min
∀=∈
∀≥+
∀+≤
∀=
+
∑
∑
∑
∑∑∑
Solution:
(Every order has to be allocated)
(Capacity must not be exceeded)
(Defines number of cariable cars)

Production Management B – Spring Semester 2009
Supply Chain Management II L07 P. 21
Lecture 07
Seite 21© WZL/Fraunhofer IPT
Structure
Classification in Context1
Deterministic Optimization2
Further Optimization Methods3

Production Management B – Spring Semester 2009
Supply Chain Management II L07 P. 22
Lecture 07
Seite 22© WZL/Fraunhofer IPT
Linear Optimization 4: Application Example
The transport net comprises 120 starting points and 5000 targets (transports from suppliers to production facilities and from there to customers)
Daily transport planning per location done by a local planning
Transport planning determines allocation of transport orders to carriers
Agreement with carriers: availability of a certain amount of fixed transport capacity and of a certain amount of variable transport capacity
Central planning of transports in a metal industry enterprise in the U.S.
cij rate of carrier j for transport order i
fi rate of carrier j for fixed transport carnumber of fix and variable carsof carrier j
xij=1 if order is assigned to carrier j,else 0
yi number of unused fix cars
, C C fj
vj
Parameter und variables
jiyx
jCyx
jCCx
ix
yfxc
iij
i
fjiij
fj
i
vjij
j
ij
jjj
i jijij
,,...2,1,0},1,0{
1
min
∀=∈
∀≥+
∀+≤
∀=
+
∑
∑
∑
∑∑∑
Solution:
(Every order has to be allocated)
(Capacity must not be exceeded)
(Defines number of cariable cars)

Production Management B – Spring Semester 2009
Supply Chain Management II L07 P. 23
Lecture 07
Seite 23© WZL/Fraunhofer IPT
Heuristics
Greek “heuriskein” means „to find“, „to discover“
Meaning in philosophy: methods for gaining awareness
Meaning in optimization: Set of rules for the derivation and transformation of solutions with the goal of finding good and valid solutions, often deducted from plausibility considerations
Neither the discovery of an optimal solution nor the discovery of valid solutions in guaranteed
Only a small part of the solution space is analyzed
Algorithms that permit a quality guarantee are called approximation algorithms
An example of heuristics are „evolutionary algorithms”.
Heuristic methodsDespite the increasing computation power of modern computers, the exact solution of complex optimization problems is still infeasible today
On the way to finding a good valid solution, many branches of the decision tree have to be investigated that are useless for the determination of the optimal solution. The earlier the uselessness of such a branch is discovered, the more the computing power needed for finding a solution will decrease. It is therefore reasonable to “cut” the branches of a tree if their uselessness is expected with a certain degree of confidence.

Production Management B – Spring Semester 2009
Supply Chain Management II L07 P. 24
Lecture 07
Seite 24© WZL/Fraunhofer IPT
EA 1: Evolutionary algorithms (EA): Overview
„Evolutionary algorithms” (EA) are a class of algorithms that use the natural principle of evolution. EA are hence stochastic search techniques that imitate natural evolution.
EA operate with a number of potential solutions, a “population” of “individuals”. The principle “survival of the fittest“ is apply to these individuals to generate increasingly better individuals.
The most widely known representatives of evolutionary algorithms are:
evolutionary programming (EP; Lawrence Fogel, San Diego)evolutionary strategies (ES; developed in Germany by Ingo Rechenberg und Hans-Paul Schwefel, Berlin), andgenetic algorithms (GA; developed in the USA by John Holland, Ann Arbor, Michigan).
Example: To achieve an optimal solutions, genetic algorithms (GA) use strategies from natural evolution. They operate according to the principle „mutation and selection". This principle as well as GA terminology has been taken from biology. Individuals are the units to be optimized. Multiple individuals that originated at the same time represent one generation. Like nature, one generation contains better and worse solutions. These solutions are called individuals and constitute a population. Individuals in nature proliferate and die; they couple and adjust to the environment. GAs imitate the same procedures; strong individuals survive and maybe mutate; weak individuals die. The total size of the population is normally constant.

Production Management B – Spring Semester 2009
Supply Chain Management II L07 P. 25
Lecture 07
Seite 25© WZL/Fraunhofer IPT
EA 2: The basic principle of genetic algorithms (GAs)
String of information: “chromosome”Parameter, feature: “gene”Value of parameter of feature: ”allele”
Position of parameter in string of information: “locus”Data structure: “genotype”, “genome”Solution alternative: “phenotype”
Terminology of Genetic Algorithms
11011101 2600001010 1500111110 401111011 1100110101 1911100111 1101101000 910000110 5
Generation k Selection Crossover Mutation Generation k+1
0011010111011101011110111101110111011101011010000011010101101000
0001110111010001111110110101110101001101110110000011110001100101
0011110111010101111110110101110101101101110110000011100001100101
Individual Fitness
Selection Crossover MutationGeneration k Generation k+1
SelectionFor reproduction, strings with a high fitness are selected with a higher probability. The search focuses on promising areas of the solution space.
CrossoverTwo strings are combined to new strings that contain information from both parents. Crossover is, together with mutation, important for the global exploration of the solution space.
MutationRandom mutation of a string with a certain, low probability. Mutation ensures diversity of the population and is, together with selection, the local component of the search.

Production Management B – Spring Semester 2009
Supply Chain Management II L07 P. 26
Lecture 07
Seite 26© WZL/Fraunhofer IPT
EA 3: Example from SCM environment
Situation: n orders
order 1order 2
order n-1order n
…
parameter 1 (lot size)parameter 2 (capacity requirements)parameter 3 (cycle time, due date
performance)
Choice and determination of sequence of the optimal order combination for the fulfilment of defined criteria (e.g., maximum capacity utilization, minimum cycle time, etc.)
Determination of „Fitness“of an order combination
Solution: Genetic algorithm
…
parameter m-1parameter m
Goal:
Number of potential combinations (= 2n) is too high for normal processor capacities
Solution set with 2n
solutionsRandom choice of 1st generation
Evaluation of fitness
…
010001011
010010011
011010101
001010011
120
30
45
100
…
Mutation, cross-over, elimination
…010001011
010010011
011010101
001010011
replace
mutate
Crossover
Configuration of the 2nd generation
…
010000011
010011011
11110001
101010011
Evaluation of fitness
70
50
95
160
…
The following steps are conducted by the genetic algorithm until predefined termination criteria are fulfilled:
Choice of a finite, manageable number of alternative solutions (i. e. production programmes)
Evaluation of fitness of the alternatives with respect to known criteria (e. g., cycle time, due date performance, capacity utilization)
Mutation, crossover, elimination of the alternative solutions according to their fitness and replacement of eliminated alternatives by new alternatives
Evaluation of the new generation

Production Management B – Spring Semester 2009
Supply Chain Management II L07 P. 27
Lecture 07
Seite 27© WZL/Fraunhofer IPT
EA 4: Typical application example of heuristics
Travelling Salesman Problem
Solution principle:
Given: n places i N={1,…,n} with distances dij between place i and place j
Sought: Shortest route through all n places
Formal: min {c(p): p permutation of N}
Can be expressed as mixed-integer program, e. g.:
∈
SC:
2
4
3
5
7
61
d25
d12
d13
d24
d14d47
d43
d54
d37
d56
d76
2
4
3
5
7
61
d25
d12
d13
d24
d14d47
d43
d54
d37
d56
d76
NjNix
nUmitNUx
Nix
Njx
xd
ij
Ui UNjij
Nj
ij
Ni
ij
Ni Njijij
∈∀∈∀∈
−≤≤⊂∀≥
∈∀=
∈∀=
∑ ∑
∑
∑
∑∑
∈ ∈
∈
∈
∈ ∈
,}1,0{
221
1
1
min
\
The binary variables xij take the value 1 if an arrow is part of the route. Otherwise they take the value 0.
This first and second side conditions guarantee that a place is reached and left exactly once.
The last side condition guarantees that the route to be found contains all nodes of the graph.
Lecture 7

Production Management B – Spring Semester 2009
Supply Chain Management II L07 P. 28
Lecture 07
Seite 28© WZL/Fraunhofer IPT
EA 5: Challenges, Advantages and Disadvantages
Choice of encoding
Fitness function (especially: degree of detail)
Choice of size of population
Development/choice of crossover operators
Determination of probabilities for change operators
Challenges
Application possible even if no specific (deterministic) method for solution known
Fast finding of good solutions
Hardly ever finds optimal solution. Quality of solution found is unclear
Can “get stuck” in local optima
Advantages and disadvantages+
+
-
-
Lecture 7

Production Management B – Spring Semester 2009
Supply Chain Management II L07 P. 29
Lecture 07
Seite 29© WZL/Fraunhofer IPT
Metaheuristics
Metaheuristics are heuristic concepts and guidelines for controlling the operations of subordinated (problem-oriented) heuristics to solve an optimization problem.
Definition 1
Metaheuristics are iterative methods that use subordinated heuristics. They structure and process information from specific iterations. Objective is the „efficient“ determination of solutions near the optimum.
Definition 2
An example of metaheuristics is „simulated annealing”.
Heuristic searches can “get stuck” in a local optimum. Higher-level strategies are thus used to control heuristics. They are called metaheuristics.
Heuristic Heuristic
Control by metaheuristics
Lecture 7

Production Management B – Spring Semester 2009
Supply Chain Management II L07 P. 30
Lecture 07
Seite 30© WZL/Fraunhofer IPT
Example of metaheuristics: Simulated Annealing (SA) – Basic Concept
Simulated Annealing
Simulated Annealing (SA) is the stochastic variant of local search (iterative upgrade):• SA starts with a plausibility solution of the combinative optimization problem and randomly creates a
surrounding solution.• If this solution is better, it will be made the current solution and the basis for iteration; otherwise, the
new solution is accepted with a certain probability only. This probability decreases with the number of iterations.
• The (infrequent) acceptance of worse states avoids “getting stuck” in a local optimum and thus helps to reach a global optimum.
This method is based on the analogy to the annealing of material. Material is melted and then slowly annealed. Arrangement and movement of molecules is stochastic.
Objective is the extraction of ideal crystals (optimal energetic state, low entropy). The focal point is reached when the material solidifies.
In the state of thermal balance, the probability of energy state E (at temperature T) is P:
(kB: Boltzmann-constant)
Annealing of materials
)TkEexp()T|EX(P
B
−==
Some metaheuristics temporarily accept, besides better solutions, also worse states. It has to be ensured that the search does not get stuck in a loop and create the same sequence of solutions over and over again.
Lecture 7
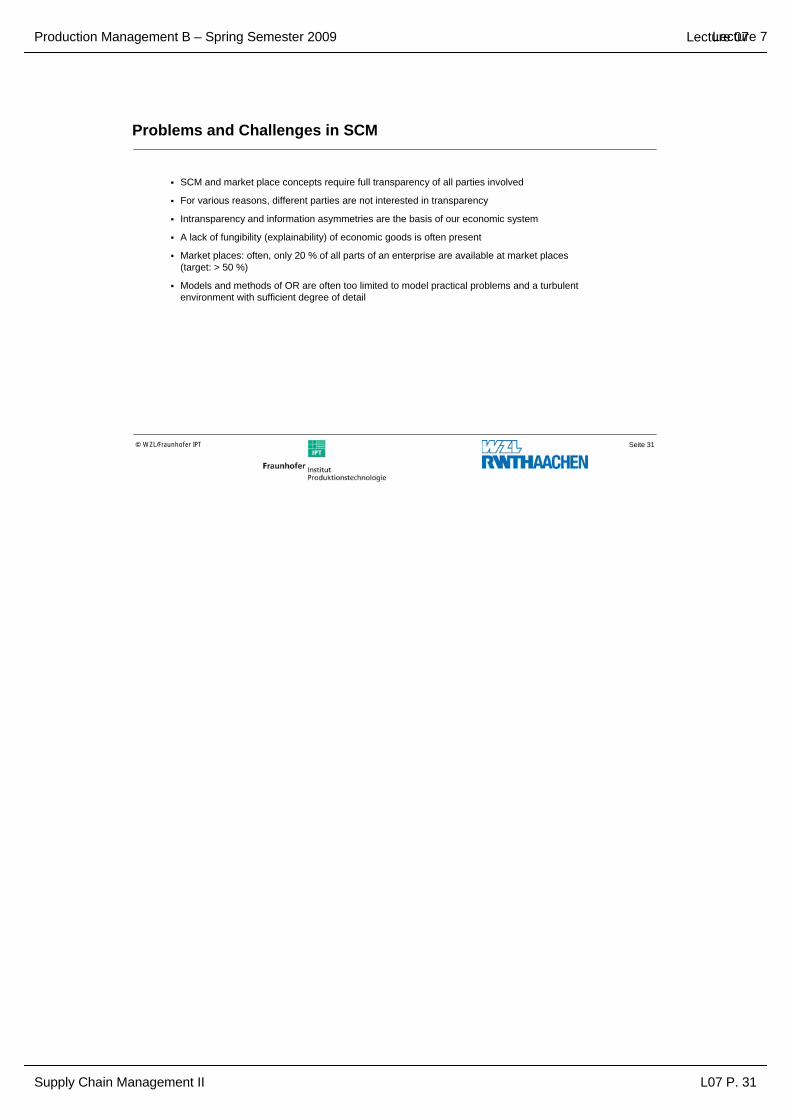
Production Management B – Spring Semester 2009
Supply Chain Management II L07 P. 31
Lecture 07
Seite 31© WZL/Fraunhofer IPT
Problems and Challenges in SCM
SCM and market place concepts require full transparency of all parties involved
For various reasons, different parties are not interested in transparency
Intransparency and information asymmetries are the basis of our economic system
A lack of fungibility (explainability) of economic goods is often present
Market places: often, only 20 % of all parts of an enterprise are available at market places(target: > 50 %)
Models and methods of OR are often too limited to model practical problems and a turbulent environment with sufficient degree of detail
Lecture 7

Production Management B – Spring Semester 2009
Supply Chain Management II L07 P. 32
Lecture 07
Final Statements
IT-Systems are essential for the Supply Chain ManagementThere are five different methods of optimization, distinguished by the characteristics of the problems the are applied to:
Dynamic optimization,
Linear Programming,
Nonlinear Programming,
Combinatorial Optimization and
Stochastic Optimization.An important optimization method is Linear Programming, applied to find a mathematical solution in a given model.The most important evolutionary algorithms are genetic algorithms, together with simulated annealing, they are part of the group of meta heuristics.Genetic algorithms begin with a group of individual solutions. By engaging selection, crossover and mutation operators, they create new solutions which form new Generations. To avoid loops, all employed operators must contain an element or randomness.

Production Management B – Spring Semester 2009
Supply Chain Management II L07 P. 33
Lecture 07
Questions
Which IT-Systems are being used in supply chain management? What are the main challenges?
What types of problems appear in supply chain management, and what are their main characteristics?
What are heuristics, what are their main characteristics and what examples for heuristic methods used in supply chain management can you name?

Production Management B – Spring Semester 2009
Supply Chain Management II L07 P. 34
Lecture 07
Literaturhinweise:
Burkard, R.: Heuristische Verfahren zur Lösung quadratischer Zuordnungsprobleme. In: Zeitschrift für Operations Research. 19. Jg., 1975
Burkard, R.: Methoden der ganzzahligen Optimierung. Wien: Springer, 1972
Domschke, W.: Taktische Tabus, Tabu Search - Durch Verbote schneller Klein, R.; Optimieren -. In: Magazin für Computertechnik. 1996, Nr. 12 Scholl, A.:
Engele, G.: Simultane Standort- und Tourenplanung. Köln: Heymann Verlag, 1980
Eversheim, W.: Prozessorientierte Unternehmensorganisation. Konzepte und Methoden zur Gestaltung „schlanker“ Organisationen. 2. Aufl. Springer, 1996
Eversheim, W.: Gestaltung von Produktionsbetrieben. (Reihe: Produktion und Schuh, G.: Management, Bd. 3). Springer, 1998
Eversheim, W.: Produktion und Management. Springer, 1999 Schuh, G.:
Gallus, G.: Heuristische Verfahren zur Lösung ganzzahliger linearer Optimierungsprobleme. In: Zeitschrift für Operations Research. 20. Jg., 1976
Grauel, A.: Neuronale Netze, Grundlagen und mathematische Modellierung. Mannheim: 1993
Hieber, R.: Supply Chain Management. A Collaborative Performance Measurement Approach. 2. Aufl. vdf Hochschulverlag der ETH Zürich, 2001
Horst, R.: Nichtlineare Programmierung. München: Hanser Verlag, 1979
Kallrath, J.: Gemischt-ganzzahlige Optimierung: Modellierung in der Praxis. Vieweg, 2002, ISBN 3-528-03141-7

Production Management B – Spring Semester 2009
Supply Chain Management II L07 P. 35
Lecture 07
Literaturhinweise:
Milberg, J.: Erfolg in Netzwerken. 1.Aufl. Springer, 2002 Schuh, G.:
Schöneburg, E.: Heinzmann, F.; Feddersen S.: Genetische Algorithmen und Evolutionsstrategien. Addison-Wesley, 1994
Schönsleben, P.: Integrales Logistikmanagement. Planung und Steuerung von umfassenden Geschäftprozessen. 2. Aufl.: Springer, 2000
Schuh, G.: Produktionskomplexität managen. Hanser Fachbuch, 2001 Schwenk, U.:
Voß, S.: Meta-Heuristics. Advances and Trends in Local search Paradigms for Optimization. Technische Universität Carolo- Wilhelmina zu Braunschweig
Wiendahl, H.-P.: Betriebsorganisation für Ingenieure. München: Hanser Fachbuch, 1989

Production Management B – Spring Semester 2009
Supply Chain Management II L07 P. 36
Lecture 07
Seite 36© WZL/Fraunhofer IPT
Structure
Classification in Context1
Deterministic Optimization2
Further Optimization Methods3

Production Management B – Spring Semester 2009
Product Lifecycle Management I L08 P. 0
Lecture 08
Production Management B
Lecture 08Product Lifecycle Management I
Organisation:Dipl.-Ing. Michael JungSteinbachstr. 53BRaum 528Tel.: [email protected]
Laboratory for Machine Tools and Production Engineering
Chair of Production EngineeringProf. Dr.-Ing. Dipl.-Wirt. Ing. G. Schuh
Chair of Production ManagementProf. Dr.-Ing. A. Kampker
Production Management B – Spring Semester 2009
Product Lifecycle Management I L08 P. 1
Lecture 08
Index:
Index Page 1
Schedule Page 2
Glossary Page 3
Target of this lecture Page 4
LectureProduct Lifecycle Management (PLM) Page 6
Important of information flows within CAx-applications Page 9
Differentiation between CAD, PDM and PLM Page 10
Computer-internal display formats of CAD-modelling Page 13
Objectives of CAD-interface applications Page 19
Integration of CAD and FEA Page 25
Final statement Page 28
Bibliography Page 29

Production Management B – Spring Semester 2009
Product Lifecycle Management I L08 P. 2
Lecture 08
Schedule:
No. Date Responsible
L1 27.04.2009 Mr. Rittstieg 0241 80 20396
L2 04.05.2009 Mr. Bartoscheck 0241 80 28203
L3 18.05.2009 Mr. Fuchs 0241 80 26265
L4 25.05.2009Mr. Reil
0241 80 27964
L5 08.06.2009 Mr. Potente 0241 80 27387
L6 15.06.2009 Mr. Bauhoff (fir) 0241 47705-439
L7 22.06.2009 Mr. Hoeschen 0241 80 27382
L8 29.06.2009 Mr. Jung 0241 80 27392
L9 06.07.2009 Mr. Rauhut 0241 80 28206
L11 13.07.2009Mr. Koch
0241 80 25321
L12 20.07.2009 Mr. Cuber (fir) 0241 47705-420
Customer Relations Management
Enterprise Ressource Planning I
Enterprise Ressource Planning II
Topic
IT in Production Management
Enterprise Ressource Planning III
Product Lifecycle Management II
Digitale Plant Planning and Simulation
Business Engineering - Method of selecting IT-Systems (Trovarit)
Supply Chain Management I
Supply Chain Management II
Product Lifecycle Management I

Production Management B – Spring Semester 2009
Product Lifecycle Management I L08 P. 3
Lecture 08
Glossary:
CAD (Computer Aided Design, see annotation figure 7, page 11)
CAM (Computer Aided Manufacturing) refers to computer applications for controlling manufacturing. This includes the direct controlling of machine tools, machining centers or assembly lines as well as logistic problems, e.g. controlling of material flow or registration of operating data.
CAE (Computer Aided Engineering) refers to all activities within CAD, CAP*, CAM and CAQ**, i.e. all computer applications in technical divisions of companies.
CAP (Computer Aided Planning) is the computer adoption in process- and production planning, e.g. generation of NC-information, working plans or parts lists.
CAQ (Computer Aided Quality Assurance) is the computer adoption in quality assurance e.g. generation of check programs, plans or statistical analysis of check values.
Product Data Management (PDM) is a technical information management system for manufacturing companies and engineering service providers. It provides an information platform for product development with core competences like system integration, data management, process management, project management and authorization management.
Engineering Data Management (EDM) is another expression (synonym) for PDM.

Production Management B – Spring Semester 2009
Product Lifecycle Management I L08 P. 4
Lecture 08
Target of this lecture:
The lecture introduces to the topic of Product Lifecycle management and presents current IT tools in the development process. The lecture explains different computer-internal display formats of CAD-Modeling. The lecture shows the importance of information flows within CAx-applications and the objectives and problems of CAD-interface applications.

Production Management B – Spring Semester 2009
Product Lifecycle Management I L08 P. 5
Lecture 08
Seite 5© WZL/Fraunhofer IPT
Product Lifecycle Management (PLM)
… includes management and controlling of product data - during the complete product life cycle along the enhanced logistics supply chain -beginning from design engineering and production beyond sales (distribution) and ending with maintenance.
Integrated PLM offers access to all product and process data of the complete life cycle of a product.
The functionality exceeds the system.Prof. Dr. Stucky, aifb, Karlsruhe
PLM
CSC PLOENZKE AG
ProductLifecycle
Management
Productdevelopment
Manufacturing & assembly
Market
Service &maintenance
Distribution &shipping
Productionpreparation
Product planningDisassembly
& recycling
The Term Product Lifecycle Management is used differently by the literature and by system providers. Generally three different approaches are distinguished:
PLM as a synonym for Product-Data-Management:PLM is a no new systemclass and no new form of PDM-System, but the
consequent transformation to on WEB-technology based location- and companie overlapping application of the PDM-core-competences datamanagement, process management and system integration in all areas and phases of the industrial added value.
PLM as integral integrational platform of different IT-systems:PLM is a engineering-driven PDM system. PDM is supporting every employee
during the whole product life cycle by administration of all related data and processes.
PLM as integral organisational concept of mangament for dataadministration an information availibilty:

Production Management B – Spring Semester 2009
Product Lifecycle Management I L08 P. 6
Lecture 08
Seite 6© WZL/Fraunhofer IPT
Development of PLM with function integration of CAx and ERP
Figure 2
PLM – horizontal Integration
IntersectionConfigurationParts management Parts lists management
MRP: Material Requirement PlanningMRP I: Material Resource Planning IMRP II: Management Resource Planning IIERP: Enterprise Resource Planning
timetime
2D-CAD1960
MRP1950
Notes:CAD (Computer Aided Design, see annotation figure 7, page 11)
CAM (Computer Aided Manufacturing) refers to computer applications for controlling manufacturing. This includes the direct controlling of machine tools, machining centres or assembly lines as well as logistic problems, e.g. controlling of material flow or registration of operating data.
CAE (Computer Aided Engineering) refers to all activities within CAD, CAP*, CAM and CAQ**, i.e. all computer applications in technical divisions of companies.
*CAP (Computer Aided Planning) is the computer adoption in process- and production planning, e.g. generation of NC-information, working plans or parts lists.
**CAQ (Computer Aided Quality Assurance) is the computer adoption in quality assurance e.g. generation of check programmes, plans or statistical analysis of check values.
Product Data Management (PDM) is a technical information management system for manufacturing companies and engineering service providers. It provides an information platform for product development with core competences like system integration, data management, process management, project management and authorisation management.
Engineering Data Management (EDM) is another expression (synonym) for PDM.

Production Management B – Spring Semester 2009
Product Lifecycle Management I L08 P. 7
Lecture 08
Seite 7© WZL/Fraunhofer IPT
Product Lifecycle Management is integrating processes, technologies and humans
Attending process
Product appearance
Productfabrication
Productdevelopment
Marketing Acquisition Salereal
product
Real Produktlife
Produkt-nutzung
Produkt-entsorgung
PLM-System Integrational platformIntegrational platform
Information generatingTools
Modeling Tools(CAD/CAM/CAP)
Calculation- andSimulation Tools (CAE)
Visualising Tools(DMU, VR, AR)
Information andCollaborationmanagement
Product Data Management
Supply Chain Mangement
Customer RelationshipMangement
Anmerkungen zur Folie:Product development process from product life cycle viewThe product life cycle consists of the main phases
Product appearance (planning, development)Product development (process planning, operative production) and the real Product life (Use and disposal)
The main process phases are supplemented by attending processes
Term plurality in context with PLMReasons for the term plurality:
Chronological further development of the systems (e.g. Enhancement of functions)Different Marketing strategies of the software-producersAs well used nowadays terms are EDM and PDM
Classification „PLM – PDM“:Traditional PDM-Approach: PDM is acting as interface between technical and commercialinformation processing, that means between CAx-systems on the one hand and acquisitionand production on the other hand. Therefore these systems were limited to the development.PLM-Approach: PLM is expanding the PDM-functionalities and has the ability to provideprocess integrating data and information. In addition it is separating the detachement of intern and extern users along the supply chain. PLM supports cooperative forms of collaborationbeyond company boundaries.

Production Management B – Spring Semester 2009
Product Lifecycle Management I L08 P. 8
Lecture 08
Seite 8© WZL/Fraunhofer IPT
Beispiel für einen digitalen Produktentstehungsprozess
ConstructionStyling Coverage & Clearing Check Production-
planning
Generating Ideas and creation ogLösungsvarianten für das Autodesign3D-Visualisierung z.B. durch VR-Sketchingoder Virtual Clay ModellingComparison and choiceof a design
3D-Creation of singlecomponents like e.g. a crankshaft with CAD-ToolsJoining singlecomponents to assembliesCreation of parts lists
CAE-Analyse: Calculation and interpretation of components, e.g. verification, if a crank isfatigue endurableCollision-analyses of componentsFitting- and demountingtestingBuildability testing
Compilation of streamdynamic simulationsstreamsimulation witha DMU (Digital Mock-Up)FEM (Finite Element Method) for static loadtestCrash-TestsErgonomic analyses
Planing and Simulation of production processChoice of the machineOrder of productionstepsParallelisation of production stepsProcess optimisation
Anmerkungen zur Folie:

Production Management B – Spring Semester 2009
Product Lifecycle Management I L08 P. 9
Lecture 08
Seite 9© WZL/Fraunhofer IPT
Supporting IT-systems for PLM
CAD
CAM
CAD: Computer Aided DesignCAE: Computer Aided EngineeringCAM: Computer Aided Manufacturing
CAP: Computer Aided PlanningCAQ: Computer Aided QualityCRM: Custom Relationship Management
ERP: Enterprise Ressource PlanningPDM: Product Data ManagementPLM: Product Lifecycle Management
SCM: Supply Chain Management
ERP
nach EDM-Report Nr.1, 2003
PLM reference process
CRM
CAQ
PDM
CAQ
SCMCAP
CAE
CAQ
CRM
Market DevelopmentOperations
scheduling &process planning
Productionplanning
Manufacturing & assembly Sales Service &
maintenanceDisassembly & recycling
Notes:It is not that the PLM-IT-systems lead to the idea of PLM but the other way round: PLM-IT-systems represent the functionalities and processes behind the idea of PLM.
The use of a combined basis of PLM-data for development, order processing, configuration etc. implies a new application process routine among the entire product lifecycle.
By realising the simultaneous data access of all persons involved in the product and the process, PLM supports resp. operationalises the idea of Simultaneous Engineering resp. Concurrent Engineering.
PLM reduces redundancies of data within the product life cycle.

Production Management B – Spring Semester 2009
Product Lifecycle Management I L08 P. 10
Lecture 08
Seite 10© WZL/Fraunhofer IPT
Important of information flows within CAx-applications
CAD: Computer Aided DesignCAP: Computer Aided PlanningNC: Numerical ControlERP: Enterprise Resource
PlanningPPS: Production Planning
SystemCAM: Computer Aided
ManufacturingCAQ: Computer Aided
Quality Assurance
EDM/PDM
CAP CAQ
ERP(PPS)
CAD
NC-Programm-ing system
Working plan &Operation plan
Quotationprocessing
Finaldispatch
NC-Programme
Feedback Operations
CAMcontrol centre
Production
customerOrder
Quotation
Dra
win
g
Parts list &drawing
Workingplan
Parts list
Order
Shop-order
Audit-operation
control variable
Measuringdata
Notes:For handling orders respectively manufacturing products an information exchange between different divisions of a company is necessary.
Among other things it deals with drawings, parts lists, working plans etc.. Thus huge amounts of data and complex information contents like geometry data are transferred.

Production Management B – Spring Semester 2009
Product Lifecycle Management I L08 P. 11
Lecture 08
Seite 11© WZL/Fraunhofer IPT
Differentiation between CAD, PDM and PLMIntegration depth
Product structure
Documents
Change and configuration management
Collaboration
Project planningand calculation
CAD
PDM
Projection BasicEngineering
Maintenance& service
Processplanning
Production &assembly
PLMProject management
CollaborativeEngineering Change
management
As-built
Knowledgemanagement
DetailEngineering
Configurationmanagement
Visualization
Constructionchange
Structures
Documentmanagement
Variant configuration
Legende:PLM=Product Lifecycle ManagementPDM=Produkt DatenmanagementCAD=Computer Aided Design
Integration breadth
Anmerkungen zur Folie:The lifecycle of a product from product emergence in the development to acquisition and production up to service is significantly characterized by a stronginternal dissection and a heterogeneous system landscape.
The Product Lifecycle Management(PLM), with the idea of integration, depth of integration as well as integration threshold, points out that the focus on areas of the individual system do not represent the standard anymore and only is a integral view on the whole Life Cycle of the different processes.
Reckoning the PLM as an Management Concept it includes the administrationand controlling of all product data along the whole Life Cycle of the advancedlogistic chain, from Construction and Production up to the Sale and Maintenance.
The integrated PLM offers acces to all product and process data of the Lice Cyleof a Product. (Prof. Dr. Stucky, Karlsruhe)
Hence the drawings and documents, compiled with CAD, are part of the Product-Management which coevally is responsible to supply the PLM-System with dataduring the whole Lice Cycle.

Production Management B – Spring Semester 2009
Product Lifecycle Management I L08 P. 12
Lecture 08
Seite 12© WZL/Fraunhofer IPT
History of development of workplaces for design engineering
l1 w1 l2 w2
d3
d4d1
d5
l1
b
d2
d5d5
d5
Abi
lity
for f
urth
erpr
oces
sing
of d
ata
2D-CADsystem
3D-CADsystem Virtual Reality
InteractionImmersion
Intuitional presentation
Digitalprototype
Electronicdrawing boardDrawing board
till 50‘s 60‘s 80‘s 21. century time
Notes:CAD stands for „Computer Aided Design“. The term appeared in 1957 when a NC*- (Numerical Control) system was developed by Douglas T. Roos in the United States.
CAD is a collective term for all activities where EDP (Electronic Data Processing) is directly or indirectly applied within the scope of construction and design. This can refer to common technical calculations with or without graphical output, the adoption of technical information systems and the two dimensional (2D) drawing display as well as to the three dimensional (3D) designing.
*NC (Numerical Control) is the numerical control of machine tools. The distance- and operate-information is binary-coded and inserted into machine tools by storage media like floppy disks or CD-ROMs or directly by a control computer (DNC: Direct Numerical Control) respectively by an integrated freely programmable computer (CNC: Computer Numerical Control).
VR (Virtual Reality) is a method for visualising and manipulating product models in a 3D-environment. With a VR-application one is integrated into a 3D-environment that is close to reality in order to display product models (digital prototypes) including all demanded functions during its life cycle.

Production Management B – Spring Semester 2009
Product Lifecycle Management I L08 P. 13
Lecture 08
Seite 13© WZL/Fraunhofer IPT
Examples of CAD-application
examples
CAD-
applications
CAD: Computer Aided Design
l1 w1 l2 w2
d3
d4d1
d5
l1
b
d2
d5d5
d5
Quotation processing
Machinedesign
DetailingElectronicdesign
Manufacturing resources
design

Production Management B – Spring Semester 2009
Product Lifecycle Management I L08 P. 14
Lecture 08
Seite 14© WZL/Fraunhofer IPT
Computer-internal display formats of CAD-modelling
-+ =
Translation vectordrillingnotdescribable
2D - line model:point, line
2 ½ D - profile line model:point, line, vector
3D - wire-frame model:point, line
3D - surface model:point, line, surface
3D- CSG-volume model(Constructive Solids Geometry): volume
3D-B-Rep model(Boundary Representation):point, line, surface, volume
Hybrid model:(3D-CSG volume model + 3D-B-Rep model)
Notes:The most important differentiating factors of CAD-systems are the internal data structures for geometry-processing. They are also called computer internal displays.
In the following, computer internal displays (representations) that are important in practice are explained.

Production Management B – Spring Semester 2009
Product Lifecycle Management I L08 P. 15
Lecture 08
Seite 15© WZL/Fraunhofer IPT
Application-suitability of computer-internal representations3D
B-Rep2D 21
2 D3D
Wireframe
3DArea
3DCSG
3DHybrid
appropriate
partially appropriate
not appropriate
CSG: Constructive Solid Geometry
B-Rep: Boundary Representation
Drawings, blueprints, electricalengineering, circuit boards
Preparation of drawings
Rotationally symmetricalcomponents
Profile -shaped components
Components with regulargeometry (hydraulic block)
Direct NC -programming
Kinematics, animated simulation
Finite elements analysis (FEA)
Photorealistic illustration
Components with sculptured geometry (medical equipments,mould and die making)
high calculating performance(higher investment volume)
low calculating performance(lower investment volume)

Production Management B – Spring Semester 2009
Product Lifecycle Management I L08 P. 16
Lecture 08
Seite 16© WZL/Fraunhofer IPT
2D-CAD systemsSystem-specific advantages
Low complexity
Low investment volume (hardware, software)
Good drawing functions
Point- and line functions (e.g. circle on two tangents and one point)
Dimensioning and hatching functions
Line types and thickness, colours
Typical functions
Making drawings with different views and cuttings
Electronic construction and circuit board layout
Design drafts and layouts
Factory planning and plant construction
Application areas
Gear drawing
Fact
ory
layo
ut
Notes:For 2D-CAD-systems the investment volume is low and the working technique is similar to making drawings.
2D-CAD-systems though require a certain amount of abilities of abstraction regarding to the implementation from 3D-conception to 2D representation.
Important demand in many companies is the compilation of drawings conforming to standards. That is why most CAD-systems have modules that assist the preparation of drawings.

Production Management B – Spring Semester 2009
Product Lifecycle Management I L08 P. 17
Lecture 08
Seite 17© WZL/Fraunhofer IPT
System-specific advantagesRelative small data volume
Specific orientation to surface design
Easy link up with NC-programming
Curvatures, surface intersections
Stretching slant and sloping surface
Specific functions for surface description(e.g. guidelines processing)
Typical functions
Description of sculptured surfaces
Mould and die making
Design
Application areas
3D-CAD systems based on surface models
Sculptured surface
Mold and die design
Notes:For the description of sculptured surfaces that cannot be characterised analytically, special 3D-CAD-systems based on surface models have been developed. A typical example of application is the description of forging blanks.

Production Management B – Spring Semester 2009
Product Lifecycle Management I L08 P. 18
Lecture 08
Seite 18© WZL/Fraunhofer IPT
3D-CAD systems based on CSG-modelsSystem-specific advantages
Volume information available
Quick generation of simple geometries
History of development available
Intersection of volume bodies
Volume calculation
Translation- and rotation functions
Typical functions
Animated simulation
Plant engineering and construction
Regular geometries
Application areas
FactoryA
nim
ated
sim
ulat
ion
Valve
Cams
Valvehead
Lever
Notes:For generating of analytically describable geometries, CAD-systems based on CSG-models (Constructive Solids Geometry) are suitable.
Thereby work pieces are described by volume bodies that are combined by Boolean Operations (addition, subtraction and deviation).
Sculptured surfaces cannot be created by this means. The connection to NC-programmes is difficult because of missing surface information.

Production Management B – Spring Semester 2009
Product Lifecycle Management I L08 P. 19
Lecture 08
Seite 19© WZL/Fraunhofer IPT
3D-CAD systems based on B-Rep-modelsSystem-specific advantages
Complete geometry model(Points, lines, surfaces, volume)
Suitable for any design and construction
Usable for direct NC-machining
Surface- and volume functions
Almost all advantages of surfaces- and CSG-models
Typical functions
Any design and construction
Complex products and geometries
Application areas
Gear
Generator
Notes:CAD-models that are based on B-Rep-models (Boundary Representation) manage all geometrical basic elements, beginning with a point and ending with the volume in a consistent data structure.
Thus all advantages of other computer internal displays are available. But these CAD-systems (hybrid-model also) require high-end hardware and that causes a high investment volume.

Production Management B – Spring Semester 2009
Product Lifecycle Management I L08 P. 20
Lecture 08
Seite 20© WZL/Fraunhofer IPT
Objectives of CAD-interface applications
Objects of CAD-interface applications
Transfer of CAD-data
Avoidance of multiple inputs
Reduction of cycle times
Prevention of data inconsistencies and redundancies
CADCAD
Rapid prototyping Numerical controlled machine tools
Finite Element Analysis
Virtual Reality
Digital Mock-Up
Engineering data management
Notes:The cost-intensive adoption of CAD-systems is only effective and economical if the produced data can be used by different divisions within the company and by customers respectively distributors.
Interfaces for exchanging data are necessary because normally different CAD-configurations are used by sender and receiver.
In connection with simultaneous engineering and design cooperation the importance of high-end data and information interfaces is very high.

Production Management B – Spring Semester 2009
Product Lifecycle Management I L08 P. 21
Lecture 08
Seite 21© WZL/Fraunhofer IPT
Data exchange with standard interfaces in the field of CAxCAD
Computer AidedDesign
CADComputer Aided
Design
CAPComputer Aided
Planning
CAMComputer AidedManufacturing
ERPEnterprise
Resource Planning
IGES, EDIFVDAFS, VDAPS
STEPSTEP SQL
IGES, VDAFS, STEP
CLDATA,IRDATA, STEP
CAQComputer Aided
Quality Assurance
ApplikationsspezifischesKopplungsprogramm
IGES: Initial Graphics Exchange Specification
EDIF: Electronic Design Interchange FormatVDAFS: Verband der Automobilindustrie –
Flächenschnittstelle(Association of automotive industry
– surface interface)VDAPS: Verband der Automobilindustrie –
Programmschnittstelle(Association of automotive industry – program interface)
STEP: Standard for the Exchange of Product Data
CLDATA: Cutter Location Data IRDATA: Industrial Robot DataSQL: Structured Query Language
Ope
ratin
g da
ta
Geometry data
Operating data
Operating data
Notes:For the exchange of data between different divisions of the company some standard interfaces are available whose complexity is not sufficient to transfer all necessary information.
Because of using different pre- and post-processors information loss is a result of inexact interface definitions. An example is the exchange of drawing data between two different CAD-systems with the standard interface IGES. (Loss of information because of downsizing the 3D-Volume-Model to a 3D-Surface-Model, especially problematic at model-edges)

Production Management B – Spring Semester 2009
Product Lifecycle Management I L08 P. 22
Lecture 08
Seite 22© WZL/Fraunhofer IPT
Development of standards for product data exchange
1996 1997 1998 1999
Stückliste
STEP AP 214
Welle
STEP: Standard for the Exchange of Product DataAP: Application ProtocolVDAFS: Verband der Automobilindustrie – FlächenschnittstelleIGES: Initial Graphics Exchange Specification
VDAFS IGES
ProSTEP AG
0,02
Product data model
Technology data
Calculation data
Volume model
Surface model
Wire-frame model
Technical drawing
Organisation data/Parts list
Increasingindustrialutilisation
Notes:STEP (Standard for the Exchange of Product Data) is an international standard for describing physical and functional characteristics of product data.
The standard (standardisation) is formally known as ISO 10303 „Industrial automation systems and integration product data representation and exchange“. Many countries were involved in developing, e.g. Germany, England, France, Italy, Japan and USA.
STEP is based on the specification of standard information models for product defining data. This model covers all data during the product’s entire life cycle that refers to the product and its production.
STEP allows the computer-interpretable representation and the exchange of product model data of the entire product life cycle and it supports the integration of production chains, web-based teamwork, the management of product life cycles and the re-use of concept, planning and production data.
For consistent and explicit description of the product model the formal description language EXPRESS has been defined. EXPRESS is not a programming but a specification language that unites different concepts.
The significant advantage of STEP over IGES is in the additional transfer of organisation data, calculation data, etc., like for example assembly-strucures. STEP is steadily developed further and is also nowadays one of the most prominent standards.

Production Management B – Spring Semester 2009
Product Lifecycle Management I L08 P. 23
Lecture 08
Seite 23© WZL/Fraunhofer IPT
Product data exchange with STEP
ProSTEP AG
Usage within application areas with STEP
Computer Aided Design (CAD)
Computer Aided Manufacturing (CAM)
Engineering analysis (e.g. FEA)
Process planning
Product Data Management (PDM)
…
Product data
04 Material spezifizieren DGK
05 ggf. Langläuferteile spezifizieren DGK
06 Baustruktur, Verantwortlichkeiten festlegen DGK CDM
M1 Internes Design Review durchführen DGK Abstimmungsgespräch
07 Einzelteile festlegen DGK
08 Make-or-Buy Entscheidung treffen DGK, MET
09 ggf. Laufdynamik berechnen LD
10 ggf. statisches/dynamisches Verhalten berechnen STA
M2 QFD-Methode anwenden DGK „House of Quality“
M3 Konstruktions-FMEA durchführen DGK FMEA-Formblatt
M4 Ergebnisse der Morphologie überprüfen DGK Morphologischer Kasten
11 Einzelteile grob gestalten DGK CATIA Exact Solids, Sheet Metal Designer
12 Anbindung an Drehgestell grob gestalten DGK CATIA Exact Solids, Sheet Metal Designer
M5 Informationsweitergabe und –rückführung oder Abstimmung mit Statik, Laufdynamik
DGK, STA, LD
Datenaustausch oder Abstimmungsgespräch
M6 Digital Mock Up (DMU) aufbauen DGK 4D-Navigator
M7 Internes Design Freeze durchführen DGK, STA, LD
CATIA Exact Solids, 4D-Navigator
M8 Bauteilbeanspruchung überschlägig prüfen DGK Generative Part Stress
spe zi fiz i e re n
*
*
Design Geometry Parts lists Production plans Kinematicssimulation
Quality control plans,measuring data
Manufacturing resources &method plansProduction dataNC-ProgrammingProduct-
documentationFinite Element
Analysis

Production Management B – Spring Semester 2009
Product Lifecycle Management I L08 P. 24
Lecture 08
Seite 24© WZL/Fraunhofer IPT
Possibilities of realising interfaces within the field of CAx
Man
ufac
ture
r-sp
ecifi
cA
pplic
atio
n-sp
ecifi
cN
eutra
lLinking based on a standard data format
CADPre-
processorStandard
data format(e.g. IGES)
Post-processor NC
CAD Linking-programme NC
CAD/CAM(CAD-module)
Computer-internal model
CAD/CAM(NC-module)
Linking based on an application-specific linking-programme
Linking based on a shared computer-internal model representation CAD: Computer Aided Design
CAM: Computer Aided Manufacturing
IGES: Initial GraphicsExchange Specification
NC: Numerical Control
Notes:The example of linking CAD and NC shows how data exchange between two systems with different data formats is handled:
Exchange with standard data format and implementation into the system-specific format
Exchange with an application-specific linking programme
Exchange of data by using a standard computer-internal model. That is why no formatimplementation is necessary.

Production Management B – Spring Semester 2009
Product Lifecycle Management I L08 P. 25
Lecture 08
Seite 25© WZL/Fraunhofer IPT
Problems with CAD-data exchange in IGES-formatDispatching system
Utilisation of non IGES-compliant elements and attributes (e.g. colouring)
Pre-processorIncomplete implementation of IGES-elementsFailure within IGES-format (e.g. manufacturer-designed syntax)
Post-processorIncomplete analyses of allIGES-elements
Target systemHigher mathematical accuracy than within the dispatching systemNo adequate system element for some IGES-elements
CAD System
CAxSystem
Data exchange inIGES-format
Notes:In spite of standard interface formats a data exchange is normally not exact. As shown in the picture, every other interface has similar difficulties. Within the STEP-development these error causes should be avoided.

Production Management B – Spring Semester 2009
Product Lifecycle Management I L08 P. 26
Lecture 08
Seite 26© WZL/Fraunhofer IPT
Integration of CAD and FEACAD Model: Initial solution
Min. weight
Min. parts tension
Min. deformation
Optimised calculation geometryCAD Model: optimised alternative
Reverse transformationof optimised geometry
Automatic model transformation and
integration
FEM Model
Targets of optimisation: Parameter:
Wall thickness
Form
Topology
Notes:Besides actual CAD-systems additional supplementing EDP-modules contribute to a rationalisation in design.
Special calculating-modules based on FEA (Finite Element Analysis) assist a strain-related optimisation of parts geometries.
FEA is a calculation method that divides the physical structure of an object into finite mechanical/ mathematical defined elements. These elements are linked by discreet cross points. The state of an object under load is calculated by numerical approximation procedures in stepwise transmission of state variables at cross points.

Production Management B – Spring Semester 2009
Product Lifecycle Management I L08 P. 27
Lecture 08
Seite 27© WZL/Fraunhofer IPT
Digital Mock-Up – Production technical integrationDigital Mock-Up for usage simulation:
Dynamic on-/off-construction analysis withcollision testing
Review of available construction and assembly space
Involvement of humans into model world
Example: Changing lamp
Lamp
Human
Notes:Besides simulating and evaluating product characteristics Digital Mock-ups (DMU)* can verify process flows and production systems. By involving humans into the model world ergonomic aspects can be analysed, too.
*Digital Mock-Up (DMU) is an early calibration, simulating, verifying and rating of development results based on digital prototypes respectively virtual products.

Production Management B – Spring Semester 2009
Product Lifecycle Management I L08 P. 28
Lecture 08
Seite 28© WZL/Fraunhofer IPT
Potential of Digital Mock-Up
Development time and costs can be reduced with the help of DMU!Examples: Automotive industry up to 30% *
Aircraft industry up to 40% **
time
Trial
PMU Process
DMU process100 %
construction
DMU Check HW Check
Source:* Koytek ** US Air ForceSource: von Praun
Legend:DMU: Digital Mock-UpPMU: Physical Mock-UpHW: Hardware
time
Changing-costs
Product-quality
Costsper failure
DesignDevelopment
Process planningManufacturing Customer
Final inspection
Source: PfeiferBenchmark deficit

Production Management B – Spring Semester 2009
Product Lifecycle Management I L08 P. 29
Lecture 08
Seite 29© WZL/Fraunhofer IPT
Quantification for increase of productivity
CAD/CAM capable time share tf
Reduced time share tr = tf / R
Additional capacity tz = tf – tr
Working time reduced by CAD/CAM tmr = tm – tz
Factor of increase of productivity Cp = tm / tmr
Additional capacity tz
Reduction factor RTotal time tm
CAD/CAM capable time share tf Not influence-able by CAD/CAM
Design
Calcula
tion
Drawing
Chang
ing
Contro
lling
Seco
ndar
y
proc
essin
g
timesPr
ovidi
ng
infor
mation
Repea
ted
parts
sear
ch
Parts
list
creati
on
Notes:The calculation of the economic efficiency of CAD-systems is difficult. By considering all individual activities the total benefit based on time and costs is quantified in design.

Production Management B – Spring Semester 2009
Product Lifecycle Management I L08 P. 30
Lecture 08
Final statement:PLM comprises the management and control of the complete product data of the whole lifecycle along the enhanced logistics supply chain.
CAD is a generic term for all activities that use EDP directly or indirectly within construction and development activities.
The use of 3D CAD models allows an easy linking to NC-programming and FEM-analysis.
Digital Mock-Up (DMU) supports early simulation and check of development results based on digital prototypes resp. Virtual products.
The calculation of efficiency of CAD-systems is difficult. The overall benefit regarding time and costs in construction is quantified through the mediation of single activities.

Production Management B – Spring Semester 2009
Product Lifecycle Management I L08 P. 31
Lecture 08
Bibliography:
M. Grieves, Product Lifecycle Management: Driving the Next Generation of Lean Thinking, New York: McGraw-Hill, 2006
G. Susman, Product Life Cycle Management, Hamilton, Ont.: Society of Management Accountants of Canada, 1994
G. Hartmann, mySAP Product Lifecycle Mangement: Strategien –Technologie - Implementierung, Bonn, Galileo Press, 2004
J. Stark, Product Lifecycle Management: 21st Century Paradigm forProduct Realisation, London, Springer, 2006

Product Lifecycle Management II
Lecture 09
L09 P. 0
Production Management B – Spring Semester 2009
Production Management B
Lecture 09Product Life-Cycle Management II
Organisation:Dipl.-Phys. Oec. Marcus RauhutSteinbachstr. 53BRaum 521Tel.: [email protected]
Laboratory for Machine Tools and Production Engineering
Chair of Production EngineeringProf. Dr.-Ing. Dipl.-Wirt. Ing. G. Schuh
Chair of Production ManagementProf. Dr.-Ing. A. Kampker

Product Lifecycle Management II
Lecture 09
L09 P. 1
Production Management B – Spring Semester 2009
IndexIndex Page 1
Schedule Page 2
Glossary Page 3
Target of this lecture Page 4
Summary of the lecture Page 4
Lecture
1. Distinction CAD, PDM and PLM Page 5
2. History of development of PDM systems Page 6
3. Relevance of PDM-Systems Page 7
4. General function overview of PDM-Systems Page 8
4.1 Product oriented functions
Product structure management 1/2 Page 9/10
Document management Page 11
Configuration management Page 12
Classification / feature strip Page 13
View management Page 14
4.2 Process oriented functions
Workflow management Page 15
Revions management Page 16
Access management Page 17
5. Interfaces and integration of systems Page 18
Technical Risks during introduction/use of PDM-Systems Page 19
6. Potential of product life cycle managements Page 20
PLM reduces expenditure of engineering time Page 21
PLM lowers quality caused production and consequential costs Page 22
PLM raises the level of carry-over of assembly groups and product periphery Page 23
Usability of all factors effects superproportional growth of market share Page 24
7. Usability of PLM, SCM and CRM systems Page 25
8. Conclusion Page 26
Bibliography Page 27
Excercise Page 28-39

Product Lifecycle Management II
Lecture 09
L09 P. 2
Production Management B – Spring Semester 2009
Schedule:
No. Date Responsible
L1 27.04.2009 Mr. Rittstieg 0241 80 20396
L2 04.05.2009 Mr. Bartoscheck 0241 80 28203
L3 18.05.2009 Mr. Fuchs 0241 80 26265
L4 25.05.2009 Mr. Reil 0241 80 27964
L5 08.06.2009 Mr. Potente 0241 80 27387
L6 15.06.2009 Mr. Bauhoff (fir) 0241 47705-439
L7 22.06.2009 Mr. Hoeschen 0241 80 27382
L8 29.06.2009 Mr. Jung 0241 80 27392
L9 06.07.2009 Mr. Rauhut 0241 80 28206
L11 13.07.2009 Mr. Koch 0241 80 25321
L12 20.07.2009 Mr. Cuber (fir) 0241 47705-420
Customer Relations Management
Enterprise Ressource Planning I
Enterprise Ressource Planning II
Topic
IT in Production Management
Enterprise Ressource Planning III
Product Lifecycle Management II
Digitale Plant Planning and Simulation
Business Engineering - Method of selecting IT-Systems (Trovarit)
Supply Chain Management I
Supply Chain Management II
Product Lifecycle Management I

Product Lifecycle Management II
Lecture 09
L09 P. 3
Production Management B – Spring Semester 2009
Glossary:

Product Lifecycle Management II
Lecture 09
L09 P. 4
Production Management B – Spring Semester 2009
Target of this lecture:
Objective of the lecture:Overview of Product Data Management systemsEvolution of PDM systemsProduct and process oriented functions of PDM systemsBenefit of PDM systems
ExerciseCase study for a product structureDocuments during the product lifecycle
Summary of lecture 9:
Product Lifecycle Management (PLM) gains more and more importance through the increasing number of different single systems in the economical scenery and the complex requirements on today‘s products. Therefore PLM gets increasingly into management‘s focus. After the PLM-introduction and the consideration of CAD within the scope of PLM in Lecture PM II L8 the Product Data Management (PDM) with its different functionalities and potentials will now be described.
PDM is an essential basis for today‘s engineering processes. This technology‘s propagation increased during the last years and it is used throughout the whole product lifecycle.
Requirements on the IT-systems of manufacturing enterprises have increased enormously in quality and quantity. Examples of topics modern IT-strategies have to deal with lean production, business process oriented structures, shorter product lifecycles and times of delivery, decreasing vertical range of manufacture combined with decentral customer-supplier cooperation, pressure of costs and quality management.
In this environment is where product data management gains an essential role. Through a product data management system information can be recorded or using so called originator systems such as CAD-, CAE-, CAM- and Office Systems adopted automatically, edited individually, retrieved, administrated and forwarded. These systems are adjusted to each particular enterprise‘s date and process model through flexible customization.

Product Lifecycle Management II
Lecture 09
L09 P. 5
Production Management B – Spring Semester 2009
Seite 5© WZL/Fraunhofer IPT
Vertical level of integration
Productstructures
Documents
Modification and configurationmanagement
Collaboration
Project planningand calculation
CAD
PDM
Project Planning
BasicEngineering
Maintenance& Service
Job Preparation
Production &Mounting
PLMProjectManagement
CollaborativeEngineering Modification Service
for ProductionOrders
As-built
KnowledgeManagement
DetailEngineering
Configurationmanagement
Visualisation
Production Revision
Structures
DocumentManagement
VariantConfiguration
Legend:PLM=Product Lifecycle ManagementPDM=Product Data ManagementCAD=Computer Aided Design Source: Hartmann, Schmidt 2004
Horizontal level of integration
Distinction CAD, PDM und PLM
Notes on figure:
Today the lifecycle of a product from the product origin in the development through the procurement and production up to the service is marked by a strong in-plant decomposition and a heterogeneous system scenery. The Product Lifecycle Management (PLM), with the integrating idea in integration depth as well as in integration width, points out to the fact, that focusing on areas and single systems is no more enough for the today's requirements, and offers a comprehensive consideration about the whole lifecycle of the different processes. If one considers PLM as a management concept, PLM encloses the management and control of all product data along the complete lifecycle of the construction and production across the marketing up to service. For this reason the integrated PLM enables access to all product and process data of the whole lifecycle of a product. (Prof. Dr. Stucky, Karlsruhe)Therefore, the drawings and documents which have been provided with CAD are a part of the product data management, that at the same time supplies the PLM systems with the required data.

Product Lifecycle Management II
Lecture 09
L09 P. 6
Production Management B – Spring Semester 2009
Seite 6© WZL/Fraunhofer IPT
Evolution of PDM Systems
1980 1985 1990 1995 2000Source: itm2005
2D/3D-CAD-Systems
CAD AddOns: drawing administration, bill of structure characteristics, standard parts,..
1st GenerationIsolated PDM Systems
DocumentManagement
StructureManagement
2nd GenerationVertical Integration
StructureManagement
DocumentManagement
3rd GenerationHorizontal Integration
ERPPDMProduct Lifecycle-
Management
Notes on figure:
At the beginning of the 80's the first product data management systems were characterised by managing technical documents. In the 1st generation of the PDM systems the different individual systems were still isolated, where as during the 2nd generation the vertical integration was in the forefront. At the end of the 90's, PDM systems with existing ERP systems were then further developed into PLM systems in terms of horizontal integration. For the data processing and procurement by different providers, advancements of PDM systems were developed depending upon application extent.
PDM² = Product and Process Development ManagementCPC = Collaborative Product CommercecPDM = Collaborative Product Data ManagementVPDM = Virtual Product Definition ManagementPDC = Product Definition and CommercePKM = Product Knowledge Management

Product Lifecycle Management II
Lecture 09
L09 P. 7
Production Management B – Spring Semester 2009
Seite 7© WZL/Fraunhofer IPT
The relevance of PDM systems is growing, but there is a lack of control of the systems
VR systems will get more important in the future, but the control of these systems is very low
The control of 2D-CAD systems is the highest of all, but the importance will decrease in future
Source: WZL-Study 2003
no low middle high
no
low
middle
high
Today´s relevance
Futu
re re
leva
nce
VR
3D-CAD
2D-CAD
EDM/PDM
Relevance of PDM Systems
Size = Degree of mastery
Legend:
Notes on figure:
A study, performed by the WZL, asked 32 different companies about today's and future importance of IT-systems in the field of product engineering. Additional the grade of control of these IT-systems was analysed.

Product Lifecycle Management II
Lecture 09
L09 P. 8
Production Management B – Spring Semester 2009
Seite 8© WZL/Fraunhofer IPT
product oriented functions
product structure managementdocument managementconfiguration managementclassificationclass lists of characteristics
view managementrevision managementfile administrationstoragevaulting
process oriented functions
lifecycle managementprocess/activity managementworkflow managementproject managementstatus managementinterface managementviewing und redlining
clearence sequencesrevision managementaccess authorisation administrationauditingcommunication managementhistory
General Overview of Functions of PDM Systems
Notes on figure:
The functions of PDM-systems can be divided into two main categories. These are the product oriented and process oriented group of functions. The product oriented functions are used for generation of product data and the administration of product data. The use of process oriented functions is focused on collaboration in- and outside of the enterprise.

Product Lifecycle Management II
Lecture 09
L09 P. 9
Production Management B – Spring Semester 2009
Seite 9© WZL/Fraunhofer IPT
Product structure means the structured composition of the product by its components. Assembly groups and single parts lead to structure levels by combining components on a lower level of the product.
Bills of material (Data structures of products) are used to transform the product structure into a “machine-readable“ form.
Structure level 0
Structure level1
Structure level 2
Structure level 3
Legend:P = ProductAG = Assembly GroupPP = Purchased Parts
P
AG AG AG
AG PP
PPPP
PP PP
Product structure
Source: Schuh, Schwenk 2001
Product Structure Management (1/2)
Notes on figure:
Products often are very complex objects. To comprehends, modify or design them, a certain transparence is to be created. The illustration of the product complexity takes place in the product structure.

Product Lifecycle Management II
Lecture 09
L09 P. 10
Production Management B – Spring Semester 2009
Seite 10© WZL/Fraunhofer IPT
Building up and Administration of:
basic BOM und part usage– quantities BOM– structure BOM– single-level BOM
variant BOM– structure variants:
variation of BOM at different dates– part variants:
variants of single parts (e.g. colour)
No. Name Pieces2457 Screw 362458 Screw 142549 Flange 32550 Screw nut 20
Quantities BOM
Single-level BOM
Structure BOMNo. Name Pieces2457 Screw 362458 Screw 142549 Flange 32550 Screw nut 20
1No. Name Pieces2 Upper part 13 Bottom part 1
Body
3No. Name Pieces4 Side panel 15 Bottom 16 Floor panel 1
Bottom part
5No. Name Pieces
7 Floor panel 18 Foot 4
Bottom
No. Non-variable part P1 P2 P3B1 1B2 2B3 1B4 2E1 1 -1E6 1
Manufactured item type P
No. Non-variable part P1 P2 P3B1 1B2 1 E1 1 -1 -1E2 1 E3 1E6 1
Manufactured item type P
Product Structure Management (2/2)
Notes on figure:
Product structures are often called bills of materials (BOM), they describe the assignments of product components (material, semi-finished products, parts, assembly groups, products) to each other.The assignment is based on the use of components (“belongs to”) and the breaking up into components (“is made of”). The relation has information about quantity, assembly location, etc. The building up of several different structures is leading to different views. The structures are displayed text based or graphically based in a web-browser. The graphical display is more used then the text based illustration.

Product Lifecycle Management II
Lecture 09
L09 P. 11
Production Management B – Spring Semester 2009
Seite 11© WZL/Fraunhofer IPT
Source: Hartmann, Schmidt, 2004
PLM Applikation Server
Frontend Computer Frontend Computer
Filing(Check-in)
Getting(Check-out)
For each document file a seperate document info record is saved
The document file contains the document information (e.g. an engineering drawing)
The document info record contains metadata of a document (e.g. identification, status, version, author, date, validity)
System Structure
Version management
Status management
Document structure
Classification
Search of documents
Document distribution
Web access
Functions
Electronic Vault (Safe)
PLM Database
Document FileDocument Info Record
Document Management
Notes on figure:The document management serves the administration of all technical documents created during the whole life cycle of a product. Till this day there has been a change-over in the companies from manual editing of documents to the usability of personal computers for editing and exchanging information. Thereby the amount of data has increased considerably and still is rising constantly. For this reason the usability of PDM systems gains more importance, because such systems are adapted to administrate huge amounts of documents and their dedicated describing meta data. Meta data like document number, document description or author describe and identify a document. Reduction of costs and improvement of quality are direct stimulations. Such systems are characterized by following potential benefits:
• Efficient search and locating of certain documents• Quick and direct transmission of information and associated modifications• Access to knowledge of existing products and of former projects• Encouragement of trans-sectoral collaboration in the engineering

Product Lifecycle Management II
Lecture 09
L09 P. 12
Production Management B – Spring Semester 2009
Seite 12© WZL/Fraunhofer IPT
Source: Eigner, Stelzer 2001
past
E1
today
future
Product structure
Document structure
Effectivity
= revision proposal
Legend:
The configuration management applies technical and administrative rules to the product life cycle of a configuration unit from the development across manufacturing till service and support.
= no modificationB2 is compatible to B1
F1 is incompatible to B2
Configuration Management
A2
C2 D2 E1
F1
A1
C1 D2 E1
B2
A1
C1
B1
D1
Notes on figure:
The activities in connection with configuration management are used to inform about a product´s construction level (=configuration) at any state of its lifecycle. In addition there is information about the measures that leaded to the current construction level. This verification management is very important in the course of product liability.Changes of customer requirements are leading to configurations. These configurations have two different variants. The compatible configuration changes one part only, the incompatible configuration changes connecting parts either, because of different connection dimensions.The following questions are relevant to configuration management:• Where and when the part was mounted?• Who produced, delivered and mounted the part?• Who initialized and effected revisions?• Which single parts or assembly groups (versions and mutations) does the part
consist of?• In which version the part/assembly group is applied?

Product Lifecycle Management II
Lecture 09
L09 P. 13
Production Management B – Spring Semester 2009
Seite 13© WZL/Fraunhofer IPT
Demand of Search
Saved Specification
ExcistingObjects
Result
Classification Feature Strip
98
A
0-49 100-19950-99
50 100 50 100
A B~~ A C~~
100 2000
Classification / Feature Strip
B C B C
Notes on figure:
Classification means the arrangement of similar and standard parts by common attributes to support carry-over. Examples for attributes are descriptions of functions, shape, material, release date, version, editor, project, etc.Classified objects can be identified by a search through attributes or by browsing the classification hierarchy. Examples for classification hierarchies are public (e.g. DIN) standards, factory standards, etc..Within the scope of classification things and facts are organized by certain considerations. Thereby a classification system describes objects based on properties independent of the product.The feature strip is a principle for direct transformation of characteristic attributes and data into a form able to be machined by search algorithms. The system of feature strips is based on the fact that parts can be combined in groups of maximum similarity and that the properties are listed as characteristics in a schedular form. Feature strips are used especially for description and classification of geometrically similar components.

Product Lifecycle Management II
Lecture 09
L09 P. 14
Production Management B – Spring Semester 2009
Seite 14© WZL/Fraunhofer IPT
Distribution View
Which sellable units are
available?
Engineering ViewWhich functions are
to be complied?
Manufacturing View
How to manufacture the
single parts? Mounting ViewIn which order the
parts are mounted?
Shipping ViewWhich units are
dispatched together?
Marketing Engineering ProcessPlanning Production Mounting &
Assembly Shipping
Picture: Gallus
View Management
Notes on figure:
During the manufacturing and production process there are different views of the product through the different departments. These perspectives are distinguished in dependence to order, difference in structure, amount of information and modification status. An engineering BOM (bill of material) is not-order-related, composed functionally and modified manually by the designing engineer, if necessary. This perspective informs the designing engineer about the history of development and the required functions of the product.The assembly BOM is linked to a particular customer order and provides detailed manufacturing and assembly orientated information concerning the product structure. Potential revisions are operated systematically by the revision management.

Product Lifecycle Management II
Lecture 09
L09 P. 15
Production Management B – Spring Semester 2009
Seite 15© WZL/Fraunhofer IPT
The Workflow Managementorganizes and controlls the information flow between the involved places and processes of the company.
Concerning workflow management the distribution of documents guarantees that at certain moments or milestones the documents are automatically passed to the relevant person.
Source: PDM-Portal 2005
ConceptEnvironment
CAD A
CAD B
CAD A
Tools
CAP
Check/ release of drawing
Elaboration of single parts
create/change of construction
BOM
Create flow chart
WorkflowManagement
DocumentManagement
Product DataManagement
Project structure
Product structure
CAD drawing
BOM
Flow chart
Workflow Management
Notes on figure:
The procession of business processes are displayed in the workflow management. For all possible results of a process the corresponding successors are defined.

Product Lifecycle Management II
Lecture 09
L09 P. 16
Production Management B – Spring Semester 2009
Seite 16© WZL/Fraunhofer IPT
Phases of clearance and revision processes
EngineeringChanges Request 2
EngineeringChange Request 1
EngineeringRelease Request 2
...
...
EngineeringRelease Request 1
ImplementationEngineeringChange/ReleaseNotification
EngineeringChange/ReleaseOrder
Verification and Approval
Release
Revision Request
functional improvementrationalisation of manufacturingcustomer requirements, market needsremovel of errors in the technical documentation eliminate the cause of producing scraplegal requirements
Engineering Change Order
stop concering productsrevision of documents, BOM, master dataupdating revision indeximplementation of collected data in the revision notedefinition of mailing list
Verification and Approval
adding of missin datadefine department for revision approvaldepartments verificate, agree or disagree with statementpreparation of revision job
Distribution of Information
clearence of the partcopying of documentsdistribution according to mailing listrevision fulfilled
Source: Eigner 2001
Revisions Management
Notes on figure:
The revisions management systemises the revision process to avoid inconsistencies in the product data. A revision request is set, verified and approved by every concerned department. If a request is declined a statement is needed to justify the refusal.If all departments agreed the revision proposal the old version is locked by the change order. The new version is elaborated and the new one replaces the old one and is released. With the revision in the PDM-system all departments have the current version and all participants know about the latest revision.

Product Lifecycle Management II
Lecture 09
L09 P. 17
Production Management B – Spring Semester 2009
Seite 17© WZL/Fraunhofer IPT
The access management controls which user can generate, access or change documents or product information at a certain moment.
The kind of access to documents is controled by the so called „Access Control List“.
Engel
RethbergBrendler
Müller
SchulzMeier
Group 1
Group 2
47114712
4713
Documents/Product informations
Object Identification User authorization
Document 4711 Engel d
Document 4711 Rethberg -
Document 4711 Schulz w
Document 4711 Meier d
Access Control List (ACL)
Legend:- access deniedr read accessw write accessd deleting allowed
Source: Eigner, Stelzer 2001
Access Management
Notes on figure:
PDM systems allow collective access to stored data for different users. Therefore articles, documents or projects as well as user and their access authorization to objects and functions must be managed. The user administration is in charge of administration of system users, generation of user groups, distribution of rights and data security. So exists an access control to information units as well as the functions of the PDM system.

Product Lifecycle Management II
Lecture 09
L09 P. 18
Production Management B – Spring Semester 2009
Seite 18© WZL/Fraunhofer IPT
CADComputer Aided
Design
CADComputer Aided
Design
CAPComputer Aided
Planning
CAMComputer AidedManufacturing
ERPEnterprise
Resource Planning
IGES, EDIFVDAFS, VDAPS
STEPSTEP SQL
IGES, VDAFS, STEP
CLDATA,IRDATA, STEP
CAQComputer Aided
Quality Assurance
Application specificlinking program
Ope
ratin
g da
ta
Legend:IGES: Initial Graphics Exchange SpecificationEDIF: Electronic Design Interchange FormatVDAFS: Verband der Automobilindustrie –
Flächenschnittstelle(Association of automotive industry – surface interface)
VDAPS: Verband der Automobilindustrie –Programmschnittstelle(Association of automotive industry – program interface)
STEP: Standard for the Exchange of Product Data
CLDATA: Cutter Location Data IRDATA: Industrial Robot DataSQL: Structured Query Language Geometry data
Operating data
Operating data
Data exchange with standard interfaces in the field of CAx
Notes on figure:For the exchange of data between different divisions of the company some standard interfaces are available whose complexity is not sufficient to transfer all necessary information.
Because of using different pre- and post-processors information loss is a result of inexact interface definitions. An example is the exchange of drawing data between two different CAD-systems with the standard interface IGES.

Product Lifecycle Management II
Lecture 09
L09 P. 19
Production Management B – Spring Semester 2009
Seite 19© WZL/Fraunhofer IPT
Source: Océ2001/M. Wendenburg
AutoCADSolid
Works
?+ ?
CAD =
PDM
⇒PDM≠ERP
Departments and business partners in networks do not work with the same integrable CAD/CAM systems
system providers do not open their systems⇒ interface and standards implementation is difficult
same provider of CAD- and PDM-Systems ⇒ shifting the problem to PDM/ERP-integration
quality of the interface depends on transfer and administration of non-geometric data
PDM/PPS connection problem of software und organisation (e.g. which BOM will be maintained with which system, etc.)
different CAD systems depend on different structure information
process flows are difficult to map ⇒ implementation is very difficult
Technical Risks during Integration of Systems
Notes on figure:

Product Lifecycle Management II
Lecture 09
L09 P. 20
Production Management B – Spring Semester 2009
Seite 20© WZL/Fraunhofer IPT
€
0
Source: Betriebshütte
Approval
ProductDetermination
ProductRealisation Launch Growth Adolescence Saturation of
the Market Descent
Realisation Costs
Product Profit
+
-
Time-to-market Factor
Quality Factor Sales FactorTrend without PLM
Trend with PLM
Timeline of the phases without PLM
Potential of PLMSynergy Factor
Product Sales
Quality Factor,Reusability Factor
Notes on figure:
According to the typical volume and profit of every product seven phases of a lifecycle are distinguished. To define each phase the graph of product sales and profit is used. Requirement for a successful product determination is a strong orientation to the market. That means that customer orientation starts with the first phases of the lifecycle and a efficient product engineering process is needed. Each approval of a product realisation is an extensive financial exposure. The product determination has to be executed carefully and adequately ensured.

Product Lifecycle Management II
Lecture 09
L09 P. 21
Production Management B – Spring Semester 2009
Seite 21© WZL/Fraunhofer IPT
Progression without PLM Progression with PLM
Functions
Product orientedDocument managementIllustration of product structureConfiguration management
Process orientedWorkflow Management
Sinking Time-to-market Sinking effort of searchLess database interfacesLess effort for maintenanceIncreasing turnover through higher market share (Sales factor)
Chronical Progression of Product Lifecycle
DescentProductDetermination
ProductRealisation
MarketLaunch Growth Ado-
lescenceSaturation of
the Market
Realisation Costs
Product Profit
Product Sales
Quality Factor &Reusability Factor
Time-to-market Factor
Quality Factor
Sales Factor
Synergy Factor
+
€
0t
-
Source: PLM-Seminar of WZL 2004
PLM reduces expenditure of engineering time
Notes on figure:

Product Lifecycle Management II
Lecture 09
L09 P. 22
Production Management B – Spring Semester 2009
Seite 22© WZL/Fraunhofer IPT
Functions
Product orientedDocument managementFile and storage management
Prozess orientedAccess managementLifecycle management
Early identification of bugsLess manufacturing errorsLess warranty and consequential costsHigher market share throughincreased quality
PLM lowers quality caused production and consequential costs
Source: PLM-Seminar of WZL 2004
Chronical Progression of Product Lifecycle
DescentProductDetermination
ProductRealisation
MarketLaunch Growth Ado-
lescenceSaturation of
the Market
Realisation Costs
Product Profit
Product Sales
Quality Factor &Reusability Factor
Time-to-market Factor
Quality Factor
Sales Factor
Synergy Factor
+
€
0t
-
Progression without PLM Progression with PLM
Notes on figure:

Product Lifecycle Management II
Lecture 09
L09 P. 23
Production Management B – Spring Semester 2009
Seite 23© WZL/Fraunhofer IPT
Functions
Product orientedDocument managementIllustration of product structureConfiguration management
Process orientedProcess/operation management
Sinking time of creation of parts lists, data sets, drawings etc.Stock reduction of identical data Less effort for maintenance
Source: PLM-Seminar of WZL 2004
PLM raises the level of carry over of assembly groups and product periphery
Chronical Progression of Product Lifecycle
DescentProductDetermination
ProductRealisation
MarketLaunch Growth Ado-
lescenceSaturation of
the Market
Realisation Costs
Product Profit
Product Sales
Quality Factor &Reusability Factor
Time-to-market Factor
Quality Factor
Sales Factor
Synergy Factor
+
€
0t
-
Progression without PLM Progression with PLM
Notes on figure:

Product Lifecycle Management II
Lecture 09
L09 P. 24
Production Management B – Spring Semester 2009
Seite 24© WZL/Fraunhofer IPT
Functions
Product orientedDocument managementFile and storage management
Process orientedProcess/operation managementRevision management
Improved support of decisionsLess revisionsSuperproportional growth of market share through concurrent use of Time-to-market factor and quality factor Transparent information and web based cooperation for each participant
Source: PLM-Seminar of WZL 2004
Usability of all factors effects superproportional growth of market share
Chronical Progression of Product Lifecycle
DescentProductDetermination
ProductRealisation
MarketLaunch Growth Ado-
lescenceSaturation of
the Market
Realisation Costs
Product Profit
Product Sales
Quality Factor &Reusability Factor
Time-to-market Factor
Quality Factor
Sales Factor
Synergy Factor
+
€
0t
-
Progression without PLM Progression with PLM
Notes on figure:

Product Lifecycle Management II
Lecture 09
L09 P. 25
Production Management B – Spring Semester 2009
Seite 25© WZL/Fraunhofer IPT
ProductConception
Start of Production
End of Production
End of Product Lifecycle
Source: CIM Data 2001
PLM
SCM
CRM
Engineering Manufacturing Aftersales, Service
Time
Relevance/ Usability of
the Systems
Legend:PLM=Product Lifecycle ManagementSCM=Supply Chain ManagementCRM=Customer Relationship Management
Usability of PLM, SCM, and CRM Systems
Notes on figure:
PLM, SCM and CRM are the most important systems of supporting operational processes of manufacturing companies. During the lifecycle of a product the different systems have different levels of relevance and usability. During the phase of development/engineering a PLM system is used more frequently than a SCM system, while a SCM system is often used during the phase ofmanufacturing.

Product Lifecycle Management II
Lecture 09
L09 P. 26
Production Management B – Spring Semester 2009
Seite 26© WZL/Fraunhofer IPT
The PDM system is a central component of PLM.
PLM provides access to all product and prozess data during the whole lifecycle of a product
PLM implicates a new operation sequence routine during the whole lifecycle of a product
PLM-IT systems represent the functions and processes beeing behind the PLM idea
PLM opens up quality, costs, time and synergy potentials
PLM is more than an IT system
Conclusion
Notes on figure:

Product Lifecycle Management II
Lecture 09
L09 P. 27
Production Management B – Spring Semester 2009
Seite 27© WZL/Fraunhofer IPT
Bibliography lecture 9:
Hartmann, G. mySAP Product Lifecycle Management – Strategie, Technologie, Schmidt, U. Implementierung
2., aktualisierte und erweiterte AuflageGalileo Press, Bonn, 2004
Schichtel, M. Produktdatenmodellierung in der PraxisCarl Hanser Verlag, München, Wien, 2002
Eigner, M. Produktdatenmanagement-Systeme,Stelzer, R. Ein Leitfaden für Product Development und Life Cycle Management
Springer Verlag, Berlin, 2001
Schuh, G. Produktkomplexität managenSchwenk, U. - Strategien, Methode, Tools
Carl Hanser Verlag, München, Wien , 2001
Eversheim, W. Betriebshütte, Produktion und Management, Schuh, G. Springer-Verlag, 1996
Eversheim, W. Wettbewerbsfaktor Produktionstechnik,König, W. (AWK 1996)Pfeifer, T. VDI Verlag, Düsseldorf 1996Weck, M.
N.N. PDM-Marktstudie 2000 in Deutschland,Beitrag in Zeitschrift eDM REPORT Nr. 2/2001S. 26 ff., Dressler-Verlag, Heidelberg, 2001
Assmus, D. FE – Tomorrow Studie 2003Pfeifer, T. Unveröffentlichte Studie des Laboratorium für
Werkzeugmaschinen und Betriebslehre (WZL) derRWTH Aachen
Wendenburg, M. Guten Ideen schneller zum Durchbruch verhelfenBeitrag im CAD/CAM-Report 2001 Heft 11 S.48 – 50Dressler – Verlag. Heidelberg, 2001

Production Management II – Spring Semester 2009
Digital Factory Planning and Simulation L11 P. 0
Lecture 11
Laboratory for Machine Tools and Production Engineering
Chair of Production EngineeringProf. Dr.-Ing. Dipl.-Wirt. Ing. G. Schuh
Chair of Production ManagementProf. Dr.-Ing. A. Kampker
Production Management B
Lecture 11Digital Factory Planning and Simulation
Organisation:Dipl. Wirt. -Ing. Sven KochSteinbachstr. 53BRaum 528Tel.: 0241- [email protected]

Production Management II – Spring Semester 2009
Digital Factory Planning and Simulation L11 P. 1
Lecture 11
Index:
Index Page 1
Schedule Page 2
Glossary Page 3
Target of this lecture Page 4
Short summary Page 4
Introduction Page 5
Fundamental principles of digital Factory Planning Page 9
Overview
Data Management
Virtual Reality
Simulation
Generic tool use
Tools for Factory Planning Page 18
Tools for production structuring
Tools for layout planning
Tools for laying out area and workspace
Tools for process simulation
Conclusion Page 29

Production Management II – Spring Semester 2009
Digital Factory Planning and Simulation L11 P. 2
Lecture 11
Schedule:
No. Date Responsible
L1 27.04.2009 Mr. Rittstieg 0241 80 20396
L2 04.05.2009 Mr. Bartoscheck 0241 80 28203
L3 18.05.2009 Mr. Fuchs 0241 80 26265
L4 25.05.2009 Mr. Reil 0241 80 27964
L5 08.06.2009 Mr. Potente 0241 80 27387
L6 15.06.2009 Mr. Bauhoff (fir) 0241 47705-439
L7 22.06.2009 Mr. Hoeschen 0241 80 27382
L8 29.06.2009 Mr. Jung 0241 80 27392
L9 06.07.2009 Mr. Rauhut 0241 80 28206
L11 13.07.2009 Mr. Koch 0241 80 25321
L12 20.07.2009 Mr. Cuber (fir) 0241 47705-420
Customer Relations Management
Enterprise Ressource Planning I
Enterprise Ressource Planning II
Topic
IT in Production Management
Enterprise Ressource Planning III
Product Lifecycle Management II
Digitale Plant Planning and Simulation
Business Engineering - Method of selecting IT-Systems (Trovarit)
Supply Chain Management I
Supply Chain Management II
Product Lifecycle Management I

Production Management II – Spring Semester 2009
Digital Factory Planning and Simulation L11 P. 3
Lecture 11
Glossary:
Digital factory:
The idea of the term digital factory is the planning activity that builds an image of a factory-mapping or production system to demonstrate an maximum realisticillustration of the production flow on a computer, before the building begins. Therefore software tools like for the geometric design of layouts of every product, machine, plant, conveying system etc. as well as simulation systems for picturing the dynamic production effects are used.
Simulation:
In VDI 3633 simulation is defined as copy of a system with all dynamic processes in a model that lends itself well to experimentation to get transferable knowledge for reality. The point is to run an with theoretic prospects qualified experiment on a model under controlled risk of failure. Necessary are:
- a model
- a methodical procedure to create intended effects as well as
- valuable data
(This text is a translation of the German version of VDI 3633)
Workflow:
Workflow is the organization of operational procedures by descriptions and specifications of defined and dividable processes that must be proceed in a parallel or sequential defined order. The target of workflow-management-systems is to ensure that every work step is made at the right time by the right worker and who has therefore the necessary information available.
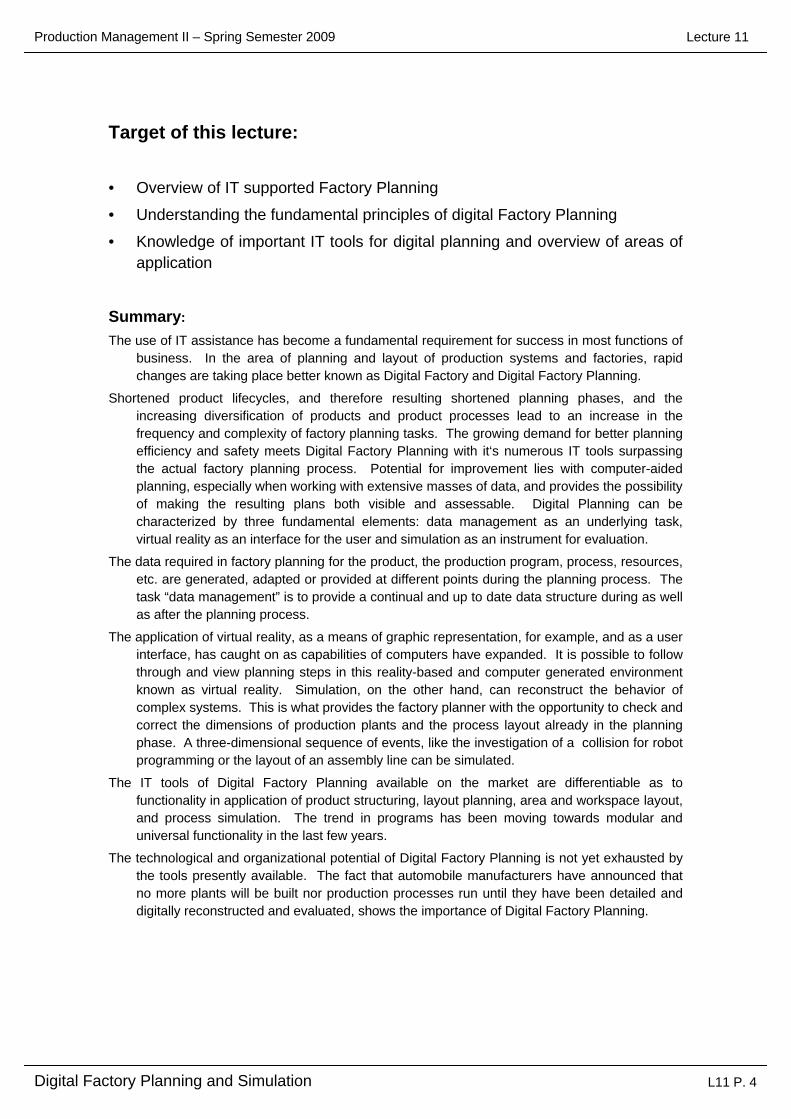
Production Management II – Spring Semester 2009
Digital Factory Planning and Simulation L11 P. 4
Lecture 11
Target of this lecture:
• Overview of IT supported Factory Planning
• Understanding the fundamental principles of digital Factory Planning
• Knowledge of important IT tools for digital planning and overview of areas of application
Summary:The use of IT assistance has become a fundamental requirement for success in most functions of
business. In the area of planning and layout of production systems and factories, rapid changes are taking place better known as Digital Factory and Digital Factory Planning.
Shortened product lifecycles, and therefore resulting shortened planning phases, and the increasing diversification of products and product processes lead to an increase in the frequency and complexity of factory planning tasks. The growing demand for better planning efficiency and safety meets Digital Factory Planning with it‘s numerous IT tools surpassing the actual factory planning process. Potential for improvement lies with computer-aided planning, especially when working with extensive masses of data, and provides the possibility of making the resulting plans both visible and assessable. Digital Planning can be characterized by three fundamental elements: data management as an underlying task, virtual reality as an interface for the user and simulation as an instrument for evaluation.
The data required in factory planning for the product, the production program, process, resources, etc. are generated, adapted or provided at different points during the planning process. The task “data management” is to provide a continual and up to date data structure during as well as after the planning process.
The application of virtual reality, as a means of graphic representation, for example, and as a user interface, has caught on as capabilities of computers have expanded. It is possible to follow through and view planning steps in this reality-based and computer generated environment known as virtual reality. Simulation, on the other hand, can reconstruct the behavior of complex systems. This is what provides the factory planner with the opportunity to check and correct the dimensions of production plants and the process layout already in the planning phase. A three-dimensional sequence of events, like the investigation of a collision for robot programming or the layout of an assembly line can be simulated.
The IT tools of Digital Factory Planning available on the market are differentiable as to functionality in application of product structuring, layout planning, area and workspace layout, and process simulation. The trend in programs has been moving towards modular and universal functionality in the last few years.
The technological and organizational potential of Digital Factory Planning is not yet exhausted by the tools presently available. The fact that automobile manufacturers have announced that no more plants will be built nor production processes run until they have been detailed and digitally reconstructed and evaluated, shows the importance of Digital Factory Planning.

Production Management II – Spring Semester 2009
Digital Factory Planning and Simulation L11 P. 5
Lecture 11
Seite 5© WZL/Fraunhofer IPT
L11: Digital Factory Planning & Simulation
Motivation and introduction1
Fundamental principles of digital Planning2
Tools for factory planning3
Conclusion4
Picture Notes:

Production Management II – Spring Semester 2009
Digital Factory Planning and Simulation L11 P. 6
Lecture 11
Picture Notes:The basic steps involved in planning a production system are shown in the above picture.Future demands on a production system, with respect to manufactured products, are determined during the phase “strategic planning of a production schedule”. Then, organization and production principles of the future production system are decided upon.Planning of the arrangement of resources follows the layout planning.There is a close connection between determining the layout and determining the type and number of resources needed.
Seite 6© WZL/Fraunhofer IPT
Process planning
• Processes
Strategic planningof production
schedule
Factory Planning
Establishment ofproductionprincipals
• Documents
• Single and small series production vs. batch series production
• Shop vs. group vs. belt production
• Product types
• Quantity
Layoutplanning
• Rough layout
• Refined layout
Resourceplanning
• Resources
• Capacity
Process Sheet
Factory Planning

Production Management II – Spring Semester 2009
Digital Factory Planning and Simulation L11 P. 7
Lecture 11
Seite 7© WZL/Fraunhofer IPT
• Shorter product lifecycles Planning frequency• Short „Time to Market“ Planning duration• Planning costs Planning safety• Increasing alteration costs Planning flexibility• Increasing variance Planning complexity
Planning
SOP
Pilot lot
Computer-aided planning process
Challenges in Factory Planning
Digital Factory Planning
Enabler technology developmentComputer capacity based on Example of transistors per chip
20001980
4 Mio.
0.1 Mio.
Challenges in Digital Factory Planning
Picture notes:
The increasing need for improved efficiency and security of planning projects suggests what challenges are faced in Factory Planning. Carrying out planning steps aided by a computer can be extremely helpful to this end.
Technological developments have afforded Digital Factory Planning with the opportunity of creating IT tools with respect to the use of intricate graphic user interfaces, for example.
The occurance of rapid technological advancements is supported by a thesis written in 1965 by Gordon E. Moore, one of the founders of Intel. Moore claimed that computer capability and transistor density doubles every 18 months – „Moore‘s Law“. His thesis still applies today.

Production Management II – Spring Semester 2009
Digital Factory Planning and Simulation L11 P. 8
Lecture 11
Picture notes:
The Factory Planning process can be divided into four simple phases: Program Planning, Process Planning, Structure and Implementation Planning. These planning processes are supported by Digital Factory Planning in the form of various IT tools.
CAx systems are primarily used in Program Planning, like CAD, for generating a bill of materials or planning systems (CAP/CAPP) for the structuring and measurement of manufacturing tasks.
Systems for process structuring, meaning the determination of necessary processing steps and resources, as well as systems for measuring capacity and flow of materials are used in planning the production process.
Layout creating systems help with resource arrangement and planning.
In order to create manufacturing processes in the Structure Planning phase, tools for process simulation are used.
3D CAD and engineering systems are used in the detailed creation of workspaces and manufacturing areas, because it is possible to create simulations of manufacturing environments that are true to reality.
In Implementation Planning, engineering tools (CAE) are used with which it is possible to see how systems crucial to operation are constructed.
There are three continual elements in Digital Factory Planning, aside from the planning process, which will be discussed later in the lecture: Data Management, Virtual Reality and Simulation.
Seite 8© WZL/Fraunhofer IPT
Process Planning Structure PlanningProgram Planning ImplementationPlanning
Layout planningLayout planningsystems
Logistic &Material Flow PlanningSimulation of processes
Product program planningCAx Systems
Workspace &Ergonometrically correctformation3D Simulation
Planning CapacitySimulation of processesInfrastructure planning
Process PlanningStructuring systemsDatabank systems
Area layout3D CAD Systems3D Engineering Systems
Digital Factory Planning is the IT supported implementation of Factory Planning tasks:
Set upCAE Systems
Data management
Simulation
Virtual Reality
Continuous Tasks
In Anl. an: Joos
Digital Factory Planning

Production Management II – Spring Semester 2009
Digital Factory Planning and Simulation L11 P. 9
Lecture 11
Seite 9© WZL/Fraunhofer IPT
L11: Digital Factory Planning & Simulation
Motivation and introduction1
Fundamental principles of digital Planning2
Tools for factory planning3
Conclusion4
Picture Notes:

Production Management II – Spring Semester 2009
Digital Factory Planning and Simulation L11 P. 10
Lecture 11
Seite 10© WZL/Fraunhofer IPT
Tasks of Data Management:Comprehensive data handling Databank systemData transfer Standardized intersectionData preparation Data structure/ Workflow systems
Productdata
Processdata
Resourcedata
Machine & tool data
Stock andtransport data
ProductionProgram
1996 1998 2000
Type
Year
Process Sheet
1001
EXT.PHONE
NAME
ADDRESSS
BILLING ADDRESS:
EXT.PHONE
NAME
ADDRESSS
SHIPPING ADDRESS:
CASH C.O.D.CHARGE
DESCRIPTION
SHIP VIAPAID OUT F.O.B. POINT
TAX
TOTALRECEIVED BY
Arbeitsplan1001
EXT.PHONE
NAME
ADDRESSS
BILLING ADDRESS:
EXT.PHONE
NAME
ADDRESSS
SHIPPING ADDRESS:
CASH C.O.D.CHARGE
DESCRIPTION
SHIP VIAPAID OUT F.O.B. POINT
TAX
TOTALRECEIVED BY
Arbeitsplan
Resource availability & qualification
VI
IIIIX
XII
Flow of Material &Control Regulation
Factory Layout
Data Management in Factory PlanningConstruction data
D l
L
g1
Picture notes:
Data Management consists of the storage, correlation and availability of various data important to the digital planning process. The data used in Factory Planning is especially associated with the product to be manufactured, with the production resources and with the manufacturing process.
The difficulty in Data Management has to do with the variety of different data types and the vast number of interactive groups in business involved in storing and preparing the data and making in available. Data Management must have a data structure at their disposal to prevent redundancy of records. This data structure has to keep all data vital to the planning process readily available and has to keep track of the results of each planning step which in turn serves as input for the next step.
The fundamental tasks of Data Management can be summarized accordingly as: comprehensive data handling, the taking over (transferring) of data from one planning step to the next and the preparation of data in the form needed.

Folie 11
g1 Sücklisten & Konstruktionszeichnunggot_h1; 16.05.2003

Production Management II – Spring Semester 2009
Digital Factory Planning and Simulation L11 P. 11
Lecture 11
Seite 11© WZL/Fraunhofer IPT
VirtualReality
virtualreal
Real Visible
ExtendedContent
Area of representation
Reality
AugmentedReality
Contextsensitive
Implemen-tation of VR
Contents ofRepresentation
Source: IFA
ex.: Simulation of energy and
temperature in a VR model of a
manufacturing hall
ex.: Digital planningenvironment for Factory Planning
ex.:Illustration of a manufacturing area
Source: MPA
Virtual Reality in Factory Planning
Vorlesung 11
Picture notes:
Virtual Reality (VR) has become the most important user interface in Digital Factory Planning. Aside from the pure representation of planning results, VR systems are also used in development where the planner can make changes directly to virtual objects.
The various forms of Virtual Reality used in Factory Planning can be differentiated in terms of representation area and content. In the most widespread form of VR, the context sensitive form, the planner moves in a virtual (digital) environment and gains information on relativity, like the specifications of resources, possible planning configurations or clues about possible repercussions of planning decisions.
Typical ways of using Virtual Reality are, for example, on a normal computer screen - as desktop VR, with data helmets or in VR rooms (Cave).

Production Management II – Spring Semester 2009
Digital Factory Planning and Simulation L11 P. 12
Lecture 11
Seite 12© WZL/Fraunhofer IPT
simulare [lat]: imitate, mimic, copySimulation is used in:
F
FEM SimulationGraphic 3D-Simulation
• Decision making• Evaluation of alternatives• Determination of planning data• Understanding the system• System optimization
Multiple Part SimulationProcess Simulation
Simulation in Factory Planning
Source: Bosch
Picture Notes:
The interaction of complex systems under certain conditions can be examined in a simulation, for example, for evaluation purposes or to gain an understanding of how the systems works.
Simulation is not limited to any one academic discipline and can be used on a physical or purely theoretical model. Actually, simulation is not even computer bound.
As applied to Digital Factory Planning, graphic 3D simulations and process simulations are among the most important. Graphic simulations can be used for laying out the workspaces of machines or ergonomic investigations, for example. Flow of materials, regulation of controls or resource capacity is investigated using process simulations.

Production Management II – Spring Semester 2009
Digital Factory Planning and Simulation L11 P. 13
Lecture 11
Seite 13© WZL/Fraunhofer IPT
In Anl. an: VDI-Richtlinie 3633
Modeling
Interpretation
Analysis
Problem
Production Data
Case 1 Case 2
real System
Model
1
Results
• Enlarge buffer
• Capacity raised
Improvement
Reality
Model
Implementation
Steps of a Simulation Test
On the basis of VDI 3633
2 3 4
567
Picture notes:
The course of action in simulation tests can be described in four steps:
First, a model is made of the actual system. Making a model of a system basically means that correlations are symbolized/coded (in shortened form). Therefore, it is extremely important to keep a model‘s purpose and function in mind when introducing symbolization. Algorithms are used to describe a model in IT-aided simulation.
Tests done on a model lead to theories about how a system interacts under special circumstances. The numerous results of a simulation are gathered, organized and interpreted using graphs or characteristic values, for example. The analysis and interpretation of key data lead to conclusions on whether or not a system needs to be changed.
Changes on a model are undergone during optimization where any influence can be determined based on the results.
New findings need to be evaluated realistically and cost/utilization factors checked before any major changes are implemented on the real system.

Production Management II – Spring Semester 2009
Digital Factory Planning and Simulation L11 P. 14
Lecture 11
Seite 14© WZL/Fraunhofer IPT
ModelInput Output
???
Modeling
ModelInput Output???
Simulation
ModelInput Output???
Optimization
Mod
elin
gSi
mul
atin
gIm
prov
ing
Modeling of production resources
Representation of production processes
Identification of relevant performance data
Deduction of action to take
Independence of individual actions
Evaluation of result of action
Creation of scenarios
Performance of a system
Sensitivity to changes (flexibility)
Sensitivity to disturbances
Partial Steps of a Simulation Test
Picture notes:
Of central importance to simulation tests is the model which, together with input and output data, should successfully represent the characteristics of a real system.
The basic steps of a simulation test are building a model with it‘s input and output variables (modeling), the investigation of the model‘s behavior based on output data (simulation) and the improvement of the system by optimizing input variables.
The input data of a model corresponds to the variables assigned to the model, like the situation concerning orders, characteristics of machines, control regulation, etc. The output data to be analyzed is production data such as machine leading, machine time for orders, etc.

Production Management II – Spring Semester 2009
Digital Factory Planning and Simulation L11 P. 15
Lecture 11
Seite 15© WZL/Fraunhofer IPT
Modeling of time variables
Static
Dynamic
Discrete
Continuous
Continual Simulation:
Permanent examination of
conditions
ex.:Process simulation in the chemical industry
Discrete incidence-oriented sequence
simulation:Examination of
occurrence of incidence
ex.: Flow of Materialssimulation
time
depe
nden
t va
riabl
e
Continual Simulation with discrete time intervals:
Examination of the condition at discrete time
intervals
ex.:Simulation of
market progress
time
depe
nden
t va
riabl
e
Time SequenceIncidence-oriented Sequence
Static Simulation:
Examination of a condition
(time independent)
ex.:Modeling of condition
variables
depe
nden
t va
riabl
e
time
depe
nden
t va
riabl
e
Simulation Models
Source: ASIM
Picture notes:
Simulation models can be differentiated by one fundamental characteristic: time variables and their determination, which is dependent on the type and flow of the process. Time variables show how often changes occur and become visible.
The typical form of a model in process simulation is the discreet incidence-oriented time model. The times are not pictured at constant intervals, but when particular incidences occur. For example, when a tool arrives at a machining station.

Production Management II – Spring Semester 2009
Digital Factory Planning and Simulation L11 P. 16
Lecture 11
Seite 16© WZL/Fraunhofer IPT
Relevant time of the runti Arrival time of the i-th partAi Arrival intervals of the partsSi Machining time per part
A1 A2 A3 A4
We2
S1 S2Ws
S3
timet1 t2 t3
e1 e2 e3
Wei Waiting time of the i-th partWs Waiting time of the Workstationei End of machining time of the i-th part
Cueing TheoryModeling of a process at a workstation:discrete, incidence-oriented simulation in the cueing theory
Picture notes:
The discrete incidence-oriented simulation of production processes is based on the principle of the cueing theory.
Points are marked on the time axis that show a discreet change in conditions of a system. Distribution functions deliver the time intervals of the items and their machining time. The machining process starts when the first item arrives at a station and the station is in use. Following items are placed in the cue until the machining time of the first item has been completed. If the cue is empty and the previous item has already undergone the machining process, the machining station waits until the next item arrives.
Extreme and average values of machining and cueing times can be described and calculated using this relatively simple representation of manufacturing processes. Downtime and malfunction times can be accounted for using deterministic or stochastic time portions and are used to improve the nearly real behavior of production times. This is how availability and efficiency factors of various linked production items of a production system can be simulated.

Production Management II – Spring Semester 2009
Digital Factory Planning and Simulation L11 P. 17
Lecture 11
Seite 17© WZL/Fraunhofer IPT
DevelopmentProduction
layout
Ergonomics
Simulation
Process Planning
Digital Factory data model
Digital Factoryis the complete digital representation of the layout details of a factory as a model
Use of a universal data modelStandardized interfacesContinual support of all planning tasks (Workflow)
ModularityGenerizitätIntegrationTransparency
ModularityGenerizitätIntegrationTransparency
Complete Digital Factory Representation
Picture notes:
The trend in the development of Digital Factory Planning is a completely functional virtual safeguard of the planning phase and a continual digital synchronization of product representation and production representation. This is made possible by using a consistent data model, which determines and unites different data types, standardizes interfaces between user groups and planning phases and which allows the consistent use of tools in all planning phases.
The characteristics of a model are described as follows.
Modularity:For reducing complexity. The connection between objects and sub-systems are understood under Modularization. Modules are independent.
Generizität:Generic building blocks are universally valid and independent of the specifications of an object to be modeled. Specific data is derived from general, generic data.
Transparency:The model makes the interesting correlations and aspects of the object to be modeled apparent.
Integration:The individual building blocks are not isolated but are related to one another and build a whole.

Production Management II – Spring Semester 2009
Digital Factory Planning and Simulation L11 P. 18
Lecture 11
Seite 18© WZL/Fraunhofer IPT
L11: Digital Factory Planning & Simulation
Motivation and introduction1
Fundamental principles of digital Planning2
Tools for factory planning3
Conclusion4
Picture Notes:

Production Management II – Spring Semester 2009
Digital Factory Planning and Simulation L11 P. 19
Lecture 11
Seite 19© WZL/Fraunhofer IPT
Area of use of the software toolsBuilding product and part familiesAssigning product and part families to resource groupsBuilding production areas, making block layoutsArea structure and assignment optimizing, ex. According to material and information flow pointsDetailing layouts, deciding on machine positioning
Examples of suitable software toolsFactoryCADFastdesign
Visualization of flow of materialsBlock layout
CAD
Process plan, production program, resource
capacity
Resource library
Modularity ex. Resource libraryGenerizität ex. StructuringIntegration ex. Product, process and
resource dataTransparency ex. Representation
Tools of Production Structuring
Picture notes:
Tool for production structuring help in the planning and formulation of production tasks. The emphasis in that case is on the assignment of product and parts family to resource groups as well as building block layouts out of existing process plans and production schedules. The tools used in structuring help to formulate the production process, to guarantee a useful layout for the flow of materials, for example, or to identify and disperse useful resources.

Production Management II – Spring Semester 2009
Digital Factory Planning and Simulation L11 P. 20
Lecture 11
Seite 20© WZL/Fraunhofer IPT
Range of applicationIndustrial Facility Management (IFM)Flow of materials analysis and logistic planningLayout planning and draft creationProject administration for managing all relevant documentsOrder administration for controlling internal and external maintenance tasks
FActorySTructure - DesignUsed in data collection, layout creation and concept formation
FunctionsOutline and layout creation (2D or 3D)Resource libraryProduction structuring with formation of parts families and manufacturing groups
Auswertungen
Datenverwaltung
3D-Modell
Example Fast Design
Picture notes:
Fast Design consists of two modules. The module FASTPLAN is used to structure manufacturing areas and includes the functional groups: formation of parts families, capacity calculation, formation of manufacturing groups and calculation of flow of materials. The module FASTGRAF is an interactive, graphical user surface and is made up of the following functions: CAD-aided layout construction, editing and planning functions and ability to represent a flow of materials using Sankey diagrams. The task of data administration is taken over by an integrated data bank application which supports the preparation of basic data consisting of part, process plan, parts list and machine data. FASTDESIGN assists the planner from data collection to the creation of various layouts to the evaluation of concepts based on diagrams and tables.

Production Management II – Spring Semester 2009
Digital Factory Planning and Simulation L11 P. 21
Lecture 11
Seite 21© WZL/Fraunhofer IPT
Area of use of the software toolsProduction structuring/ area formationDetermination of space needs/ formation of block layout Layout formation based on standard CAD software (2D/ 3D)
Examples of suitable software toolsFactory CADFastdesign
Factory planning table „Build-It“
ex.: Electronic production
Modularity ex. Resource libraryGenerizität ex. Any area of useIntegration ex. Configuration
of resources Transparency ex. Visualization
Planning
Tools for Layout Planning
Picture notes:
Layout planning has the task of organizing preliminary considerations and the individual results of structure and system planning in an outline form based on the flow of materials and defined 3-dimensionally. It is primarily oriented on the given geometry and the standards set by the production schedule. The roughly estimated plans are the main source of information.

Production Management II – Spring Semester 2009
Digital Factory Planning and Simulation L11 P. 22
Lecture 11
Seite 22© WZL/Fraunhofer IPT
A D
B
C
3D-View
2D-View
Range of applicationElaboration of block layoutsPositioning machinesLayout of workplace
FunctionsTable: 2D-ProjectionWall: 3D-ProjectionResource libraryArrangement of resources in the layout with „Bricks“
Interactive layout planning in a team with simultaneous visualization
ex.: planning of parts production
Example: Factory Planning Table „Build-It“
Picture notes:
The Build-it planning table is an intuitively usable factory planning system which supports participative group-oriented factory planning.
The people involved sit together at a conference table on which an outline of the factory to be built and set up is projected. In addition, a user-defined view is projected on a screen behind the table. This way the planners get a feel for the 3-dimensionality of that which they are planning 2-dimensionally.
Interaction with the digital model occurs through so called „bricks“- small cubic building blocks for placing planning objects - similar to the usage of a graphic tray. A special software that recognizes pictures is used to record the position and orientation of the layout on the table.
A 3D model is produced with a 3D CAD system which is read by the proper VR software so that the factory model produced by the team can also be seen on the big projector.

Production Management II – Spring Semester 2009
Digital Factory Planning and Simulation L11 P. 23
Lecture 11
Seite 23© WZL/Fraunhofer IPT
Area of use of the software toolsCreating area layoutFlow of materials, Fördertechnik and AustaktungArrangement of machines and workplacesWorkspace layout and ergonomicsAssembly layoutGraphic simulation und collision examination
Examples of suitable software toolsDelmia Process EngineerTecnomatix eM Power
Ergonomic experiments
Area layout
Workspace layout
Modularity ex. Functional moduleGenerizität ex. Method orientation Integration ex. Product and process planningTransparency ex. Graphic simulation
Tools for Area and Workspace Layout
Picture notes:
Tools for producing area and workspace layout use the details of production. When creating a layout for a workspace, questions with respect to automatic manufacturing machines as well as ergonomics come up depending on what area is being looked at.

Production Management II – Spring Semester 2009
Digital Factory Planning and Simulation L11 P. 24
Lecture 11
Seite 24© WZL/Fraunhofer IPT
Range of ApplicationConcept developmentSimulation of manufacturing processesResource and capacity planning Set up and surveillance of operational manufacturing
Digital Enterprise Lean Manufacturing Interactive Applications
Typical Functional ModuleLayout planningQuality planningErgonomicsRobot simulationNC-SimulationProcess planningCost calculation Process simulation (Quest)
Example: Delmia Process Engineer
Picture notes:Delmia Process Engineer is one of the most extensive factory planning tools in existence. The focus of the Process Engineer is on the detailed production planning and area layouts. Various modules cover the tasks and steps of factory planning.The Process Engineer brings the processes within product development, production planning and manufacturing into harmony. Processes within development, planning and production can be combined and their synergetic effect exploited. With successful integration, changes and delays are realized at once and planning tasks can be pushed further along the process chain towards construction and development (concurrent engineering).Another software available similar in capability to the Process Engineer is the eM Power software package from Tecnomatix.
.

Production Management II – Spring Semester 2009
Digital Factory Planning and Simulation L11 P. 25
Lecture 11
Seite 25© WZL/Fraunhofer IPT
FunctionsWorkplace configurationTime analysis, ex. MTM Ergonomic analysis, ex. body posture and energy useField-of-vision analysisAdvanced kinematic and movement resourcesMacros for Fast Task ModelingDocumentation (ex. ergonomic reports and animated work directions)
Range of ApplicationRough and refined planning of manual workplacesTime abtaktungExamination of the convertibility of tasksErgonomic Analysis
Examples of suitable software toolsDelmia Process Engineer (ErgoMas)Tecnomatix eM Human
ex. Automobile assembly
Example: Ergonomic Formation
Source: Audi
Picture notes:The layout of workspaces, manufacturing and assembling tasks according to ergonomically correct methods is an important theme in Area and Workspace Layout.Ergonomic experiments suggest an improvement in the productivity of work systems and a reduction in the burden/pressure on working employees.Simulation programs help in developing safe workspace layouts quickly by providing anatomical information, like correct range of visibility for example. Grasping room might, for example, lead to increased upper body movement which in turn could lead to an increase in cycle times.

Production Management II – Spring Semester 2009
Digital Factory Planning and Simulation L11 P. 26
Lecture 11
Seite 26© WZL/Fraunhofer IPT
FunctionsData transfer with CAD/ CAM system3D visualizationStatic and dynamic collision recognition Robot and workpiece libraryAutomatic robot programmingResource and kinematic representation
Range of ApplicationPlanning and optimization of robot useAttainability and collision examination Simulation of manufacturing processesBi-directional conversion between a sequence of movements and control specific programs (ex. eM-OLP)
Source:Tecnomatix
Source: BMW
Examples of suitable software tools eMOLDeMSpot
ex. Weld-robot simulation
ex. Offline programmingof robots
Example: Plant Simulation
Picture notes:
Machine simulation is a big help in creating the layout of automatic manufacturing areas. Machine simulations are used to plan ergonomically correct and collision-free robot workstations in order to curb expensive positioning times and test runs. Critical factors such as space restrictions, geometric restrictions and robot cycle times are examined. It is therefore necessary to refer to robot and work piece literature.
Software programs offer the direct application of parameters onto the control programs of robots and machines.

Production Management II – Spring Semester 2009
Digital Factory Planning and Simulation L11 P. 27
Lecture 11
Seite 27© WZL/Fraunhofer IPT
Area of use of the software toolsRepresentation and examination of flow of materials and process chainsDetermination of production characteristic values ex. For capacity and buffer formation Optimization of existing production systems and planning of new production systems Development and evaluation of control strategies
Examples of suitable software toolseM Plant (ehem. Simple ++)TaylorArenaQuest Characteristic production values
Case 1Case 2
Real System
Modeling, Simulation
Interpretation, Analysis, Conversion
Modularity ex. Modular programmingGenerizität ex. Modeling Integration ex. Combination of resources in the
production process Transparency ex. Graphic evaluation
Tools for Process Simulation
Picture notes:
Process simulation is used to evaluate the efficiency of planned processes.

Production Management II – Spring Semester 2009
Digital Factory Planning and Simulation L11 P. 28
Lecture 11
Seite 28© WZL/Fraunhofer IPT
FunctionsObject oriented, graphic or integrated work environmentObject oriented libraries ex.:
– „Assembly“ for assembly processes
– „Carbody“ for pipe building processes
– „Paint“ for painting processes
Range of ApplicationModeling, simulation and optimization of complex systems and business processesExamination of the convertibility of tasks Selection and arrangement of resources
Example: eM Plant
Picture notes:eM-Plant optimizes complex systems and business processes using graphic modeling and realistic simulations. Concepts such as building block, language and list programming are all part of eM-Plant.Specific objects and production systems are preconfigured in predefined libraries containing flow of materials, control regulation and implemented variables of simulated runs. eM-Plant can be used as an integrating simulation component, part of an extensive information system, because of it‘s ability to keep up real-time communication with numerous other software. The differences between business, strategy, system and process simulation have been overcome.

Production Management II – Spring Semester 2009
Digital Factory Planning and Simulation L11 P. 29
Lecture 11
Seite 29© WZL/Fraunhofer IPT
L11: Digital Factory Planning & Simulation
Motivation and introduction1
Fundamental principles of digital Planning2
Tools for factory planning3
Conclusion4
Picture Notes:

Production Management II – Spring Semester 2009
Digital Factory Planning and Simulation L11 P. 30
Lecture 11
Seite 30© WZL/Fraunhofer IPT
Continual planning workflow Avoidance of interface and efficiency loss and of complete support of all planning steps
Concurrent Engineering Decreasing preparation times and preparation planning: parallel product and process planning
Complete Representation Planning of critical plant phase and representation of unstable system behavior, ex. Virtual ramp-up
Integration in the business Integration of all interactive groups of a business: development, planning, buying, selling, etc.
Integration of the supply chain General supply chain processes:ex. Digital product model as a service
Current Developments in Digital Planning
Picture notes:In the future, fully functional and virtual safe guards of general processes will have an increasing impact on factory planning.This means that the system functionality of tools need to be further developed, the performance of hardware increased and data formats standardized.What has become apparent in Digital Factory Planning over the last few years, is the necessity of conforming business processes to the needs and possibilities of digital planning besides the development of IT hardware and software.The organizational changes that come along with Digital Planning in view of general process chains show the challenges that are still faced in Factory Planning.

Production Management II – Spring Semester 2009
Digital Factory Planning and Simulation L11 P. 31
Lecture 11
Seite 31© WZL/Fraunhofer IPT
VisionLayout and planning of all mechanical systems on a
digital basis
Approaching correlations that
cannot be modeled
Maturity of hardware and software
Standardization and compatibility of planning
tools
Reorganization of business processes congruent to Digital
Planning
Conclusion
Picture notes:
There are different hurtles to overcome on the way to a complete layout plan of production systems.
This picture shows four areas of development.

Production Management II – Spring Semester 2009
Digital Factory Planning and Simulation L11 P. 32
Lecture 11
Seite 32© WZL/Fraunhofer IPT
L11: Digital Factory Planning & Simulation
Motivation and introduction1
Fundamental principles of digital Planning2
Tools for factory planning3
Conclusion4
Picture Notes:

Production Management B – Spring Semester 2009
Business Engineering & Software Selection L12 P. 0
Lecture 12
Laboratory for Machine Tools and Production Engineering
Chair of Production EngineeringProf. Dr.-Ing. Dipl.-Wirt. Ing. G. Schuh
Chair of Production ManagementProf. Dr.-Ing. A. Kampker
Production Management B
Lecture 12Business Engineering & Software Selection
Organisation:Dipl.-Kfm. Stefan CuberPontdriesch 14/16Room 214 Phone: [email protected]

Production Management B – Spring Semester 2009
Business Engineering & Software Selection L12 P. 1
Lecture 12
Index:
Index Page 1
Schedule Page 2
Target of this lecture Page 3
LectureIntroduction into Business Engineering Page 4
Web-based ERP-Selection Process in Comparison to Page 17
tradition methods
Summary and Conclusion Page 34
Questions Page 36
Bibliography Page 37

Production Management B – Spring Semester 2009
Business Engineering & Software Selection L12 P. 2
Lecture 12
Schedule:
No. Date Responsible
L1 27.04.2009 Mr. Rittstieg 0241 80 20396
L2 04.05.2009 Mr. Bartoscheck 0241 80 28203
L3 18.05.2009 Mr. Fuchs 0241 80 26265
L4 25.05.2009 Mr. Reil 0241 80 27964
L5 08.06.2009 Mr. Potente 0241 80 27387
L6 15.06.2009 Mr. Bauhoff (fir) 0241 47705-439
L7 22.06.2009 Mr. Hoeschen 0241 80 27382
L8 29.06.2009 Mr. Jung 0241 80 27392
L9 06.07.2009 Mr. Rauhut 0241 80 28206
L11 13.07.2009 Mr. Koch 0241 80 25321
L12 20.07.2009 Mr. Cuber (fir) 0241 47705-420
Customer Relations Management
Enterprise Ressource Planning I
Enterprise Ressource Planning II
Topic
IT in Production Management
Enterprise Ressource Planning III
Product Lifecycle Management II
Digitale Plant Planning and Simulation
Business Engineering - Method of selecting IT-Systems (Trovarit)
Supply Chain Management I
Supply Chain Management II
Product Lifecycle Management I

Production Management B – Spring Semester 2009
Business Engineering & Software Selection L12 P. 3
Lecture 12
Summary lecture 12:
Today’s economy is undergoing a transformation from the industrial to the information age. This transformation allows one to move the focus of transformation from its original area to the entire network of value selection.
Isolated IT-applications as a result of the tayloristic approach of functional fragmentation of the entire production process can be found prevalently. But, a continuous flow of information both within and far beyond the company is an existential premise for the company‘s future success. Hence, the introduction of IT-systems is being complicated by a huge number of interfaces, which in parts can be very complex. Communication is being alleviated through standards on the levels of business, process and application as well as adequate software-solutions.
“Business Engineering“ characterizes as the design for companies of the information-age. Since transformation applies to complex man-machine-systems, a limitation to the technical aspect of change is not sufficient. Introducing an IT-system is more likely an organizational than a technical problem.
Making the transformation fast and safe as well as minimizing expenses is the approach in Business Engineering. Hereby transformation becomes directable: It strips transformation down to projects, a project down to a professional outline and to the direction of change. In turn the professional outline is stripped down to the levels strategy, process and system. Small, handable project-activities with clearly defined results in form of documents are generated.
During the selection and implementation of standard ERP systems three phases can be distinguished:
• Reorganisation: Project Initiation, Process and Structure Analysis, Process and Structure Optimization
• System Selection: Pre-selection, Final Selection, Final Contract Negotiation
• Realization: Realization Preparations, System Implementation, Setting System into Service.
The selection of an ERP System is expediently supported by the internet platform “IT-Matchmaker”.
Professional Change Management and consequent controlling of implementation are elementary premises for a successful implementation IT-systems.

Production Management B – Spring Semester 2009
Business Engineering & Software Selection L12 P. 4
Lecture 12
Page 4© WZL/FIR
Agenda
Introduction into Business Engineering1
Web-based ERP Selection Process in comparison to traditional methods2
Summary and Conclusion3

Production Management B – Spring Semester 2009
Business Engineering & Software Selection L12 P. 5
Lecture 12
Page 5© WZL/FIR
new companies
IT-Innovations force companies of the industrial age to change
Bild 1
Business Engineering
IT-innovationsinformation technique
construction technique
applications electronic services
preparation, structuring and
use of information
business-knowledge
methods of Change Management
business architecture of the information age
companies of the industrial
age
understand
transformation
understand support
restructured companies
make possible
represents overall concept
Notes:
Today’s economy is undergoing a transformation from the industrial to the information age. Especially innovations from the sector ‘information- and communication-technology’ („IT-innovations“) allow new business-solutions, new services, products, processes, companies and branches. New forms of leadership and coordination replace conventional forms of organization.
The transformation with its technical and socio-economic aspects is by far too eminent and complex to be intuitively and uncoordinatedly created by a single isolated person on basis of minor basic rules.
In order to open up business potentials of IT-innovations, teams, which are based on a division of labor, must look into technologies, strategies, processes and applications minutiously and professionally. Such proceedings and the existence and usage of appropriate procedure models, methods and tools characterize disciplines in the field of engineering.
“Business Engineering” characterizes as the design of companies of the information-age. As the transformation concerns complex man-machine-systems, it is essential not just to focus on the technical and professional aspects of change. Knowledge of business and IT are being brought together and connected to all aspects of the transformation, leading from means of representation to procedure models and cultural as well as political aspects.

Production Management B – Spring Semester 2009
Business Engineering & Software Selection L12 P. 6
Lecture 12
Page 6© WZL/FIR
IT-Systems in the field of production management
marketing development workpreparation
productionplanning
productionassembly sales service
maintenancedisassembly
recycling
CAD
CAM
CRM
SCMCAP
CAE
PLM meta-data basis
CAO
CAD: Computer Aided DesignCAE: Computer Aided EngineeringCAM: Computer Aided Manufacturing
CAO: Computer Aided OfficeCAQ: Computer Aided QualityCAP: Computer Aided Planning
CAQ
CRM: Custom Relationship ManagementERP: Enterprise Ressource PlanningPLM: Product Lifecycle Management
SCM: Supply Chain Management
ERP
Bild 2
Notes:
Nowadays one will not find companies operating without computer support. Since the 50s computer-based information processing has become a determined part in producing companies.Today complete process chains of producing companies are being supported by information technologies. There are appropriate IT-systems for nearly each task: Beginning design and development supported by several CAD-systems and simulation tools, to the administration department and services, which e. g. may offer long-range services for products or telemetric services. Masses of data are stored and maintained in complex data- and transaction-systems.

Production Management B – Spring Semester 2009
Business Engineering & Software Selection L12 P. 7
Lecture 12
Page 7© WZL/FIR
Integrating IT-Systems into a company‘s process network
Bild 3
Pictures: SAP AG, Hasso Plattner, Technologie integrierter Informationssysteme, 2001
1.Integration into processes within the company
2.Integration into processesexceeding the borders ofthe company
CollaborativeMarketplace
Notes
In the past the organization of data processing ensued the organization of the production. Thereby it accorded to the tayloristic approach of functional separation of the entire producing processes.
One result is an infrastructure of optimized functional subareas, which can still be found today in sub-optimum processes of the entire company. Isolated applications only allow a certain effort in maintaining competitive ability. A continuous flow of information is an existential premise for a company‘s success.
Therefore IT-systems need to be integrated into the company’s processes. In advance these processes are to be optimized, as systematization comes before automization to ensure the company’s success. A large number of new systems, such as SCM-systems, optimize workflows far beyond the borders of departments or processes.
Due to today‘s tight networking among companies, the next step is to integrate IT-systems into processes exceeding the borders of the company. Very often this interconnection cannot just be found among twocompanies. A variety of internet platforms allow an automatic process-flow on a basis of so-called „Collaborative Marketplaces“

Production Management B – Spring Semester 2009
Business Engineering & Software Selection L12 P. 8
Lecture 12
Page 8© WZL/FIR
IT-Systems require a maximum in data exchange
Bild 4
RAO = Raw material, auxiliary material, operating material, subassemblies
purchasing
merchandise planning
-
sales planning
production
product concept
-
ex stock
processing of orders
-
cost accounting
-
Human Ressources
auditing
financial accounting
-
billing
bill order
intakeorder intake
stock value
working hours
plan orderproduction order
work plansbill of materials
calculation
accountinggoods issue
costs
delivery date
customer-specificqualities
requ
est f
or d
eliv
ery
plan
bre
ak
capa
citie
s
orde
r
orde
r
avai
labl
e qu
antit
y
with
draw
al R
AO
approved job
cash
sal
es
-
outstanding money
liabi
litie
s
finan
cial
-stat
emen
t
production planning
-
Notes:
A large exchange of data can be found between the separate elements of a process. This needs to be beard in mind while integrating the information technology into processes.
Each source of information needs to be kept in mind, data-structures are to be created accordingly and interfaces need to be defined and implemented. Data, wich is generated within single processes, must be accessible to other areas and systems.
The realization of interfaces during implementation of IT-systems is highly complex and laborious – whether adjustments of standard systems or individual solutions are concerned. In many cases a main part of the software investment is needed here.
Defining standards of communication drastically eases this challenge. Especially among inter-companies-exchange it initializes a cost-effective linking of processes.
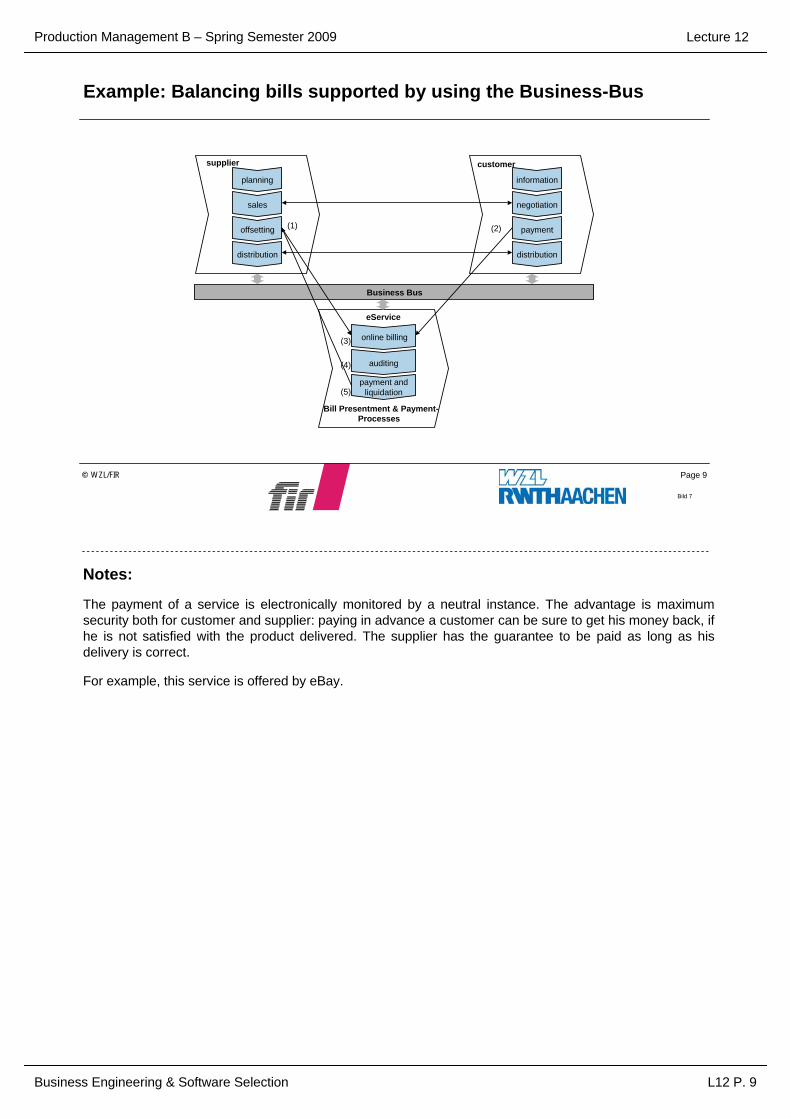
Production Management B – Spring Semester 2009
Business Engineering & Software Selection L12 P. 9
Lecture 12
Page 9© WZL/FIR
Example: Balancing bills supported by using the Business-Bus
Bild 7
Business Bus
distribution
sales
planning
offsetting
supplier customer
auditing
-online billing
payment and liquidation
eService
Bill Presentment & Payment-Processes
distribution
negotiation
information
payment(2)
(3)
(4)
(5)
(1)
Notes:
The payment of a service is electronically monitored by a neutral instance. The advantage is maximum security both for customer and supplier: paying in advance a customer can be sure to get his money back, if he is not satisfied with the product delivered. The supplier has the guarantee to be paid as long as his delivery is correct.
For example, this service is offered by eBay.

Production Management B – Spring Semester 2009
Business Engineering & Software Selection L12 P. 10
Lecture 12
Page 10© WZL/FIR
IT-architectures: today‘s systems have a flexible structure
Bild 8
presentation & - logic logic of usage data
presentation & - logic logic of usage
Core System
Client / Server - SystemClient Server
data
Tripartite system architecture
presentatationWebclient
presentation logicWebserver
presentation presentation logicClient
applicationsserver (ORB)
logic of usage
CORBA JAVA .NET
data
data
Server
Server
Software
IT-technologies:
Notes:
Basically IT-systems consist of four core-components:
- Presentation: Graphic output of the software-surface, e. g. windows, buttons, etc.
- Presentation logic: Data preparation for the presentation, e. g. calculation of diagrams
- Logic of usage: Functionality, e. g. interpretation of total turnover
- Data: Storing information, e. g. figures, texts, etc.
Most of today‘s IT-systems used in producing companies are client server based. Innovative software solutions have a tripartite structure and enable a dynamic exchange of software components.
The tripartite system architecture practically is the technical basis for the Business Collaboration Infrastructure. At the same time, it is the most flexible solution for networks, as old core components can be separated to several servers. Future dominating IT-technologies to realize this architecture are Corba, Java and Microsoft‘s upcoming .NET initiative.
Application Service Provider (ASP) use this architecture as well. These service providers have application logic and data servers in their computer-pools, while the customer is remotely accessing data from the distance and uses and pays functions simply by needs.

Production Management B – Spring Semester 2009
Business Engineering & Software Selection L12 P. 11
Lecture 12
Page 11© WZL/FIR
Chances and risks during implementation of IT-systems
Bild 9
+ Chances - Risks
Accelerated processesIncreased flexibilityIncreased qualityImproved productsGeneral access to knowledgeStandardized, where applicable automated data transferCost saving
IT-implementation is more an organizational than a technical challenge!
Remodeling of processesIncreased need of trainingIncreased burden on employees Unpredictable interfacesLoss of customized solutions along with implementation of standard softwareEnsured “capacity to act” of the company during implementationDependency on external partnersOversized startup costs
What is being implemented and when? Standard software or individual development?Are goals and potentials as a matter of fact achieved?
Notes:
The transformation from the industrial to the information age is a gigantic challenge for industry and society. Thousands of projects a year bring up new or improved business solutions. But not every project is succesful. According to an analysis carried out by Cambridge Technology Partners, 95% of more than 600 IT-projects did not work to their satisfaction.
IT-systems promise to open up a wide range of new potential within companies. But very often chances face risks, which are hardly planable in advance. Implementation does not only mean implementation of a software system: Processes and structures need to be optimized and oppositions and fears need to be reduced.
Mostly things cannot be done at once. Graduated schemes have to be developed in analogy to priorities and possibilities. A decision between customizing a standard software or implementing an individual solution is to be made: Guaranteed quality and functionality of standard software are facing the expenses to customize the product and limited possibilities.
Thus introducing an IT-system is more an organizational than a technical problem since processes need to be customized and systems chosen – based on the fact that priorities are set by the company‘s main strategy. A professional Change Management becomes necessary as a result of the reconfiguration of processes along with direct and intensive involvement of employees.
Furthermore controlling has a decisive role in every project to guarantee a prompt achievement of the company‘s objectives.

Production Management B – Spring Semester 2009
Business Engineering & Software Selection L12 P. 12
Lecture 12
Page 12© WZL/FIR
Business Engineering Map
Bild 10
information- and communication systems
management
behavior
power
informationtechnology
transformation of the company
business strategy
business processes
Notes:
What leads a project to success? Project Management, Know-how, Technology, Change Management? Restriction of the project‘s complexity, splitting it into manageable parts and a systematic proceeding, which connects the single results, eminently raise a project‘s chances of success.
Main views of change processes are the professional dimension and the politic-cultural dimension. The professional dimension focuses on methods and models of the technological observation, which include developments of strategy, process and system. So-called “human factors“, such as motivation and management, behavior, communication or proportions of power are objectives of the politic-cultural dimension.
Business Engineering splits transformation into projects (within the project portfolio), a project into the professional concept and the management of change. The professional concept then is split into the levels ‘strategy’, ‘process’ and ‘system’. Doing so, Business Engineering creates small, hand able results in form of documents. Finally a procedure model connects these activities to an appropriate order within the project‘s plan.
Business Engineering aims at making the transformation fast and safe and minimizes the effort needed. It makes the transformation guidable.

Production Management B – Spring Semester 2009
Business Engineering & Software Selection L12 P. 13
Lecture 12
Page 13© WZL/FIR
Integration as a premise to realize Business Networking strategies
Process level
Information-systems level
Strategic level
customersupplier
customersupplier
Business CollaborationInfrastructure
customersupplier
Business CollaborationInfrastructure
Strategy-specific elements:• customer segments• customer covered processes• positioning within the value chain
Process-specific elements:• customer process• cooperation processes• internal processes• portal efforts
IS-specific elements:• portal applications• BCI-applications• EAI-applications• standards• internal applications
Business CollaborationInfrastructure
BCI = Business Collaboration Infrastructure
EAI = Enterprise Application Infrastructure
Bild 11
Notes:
The Business Engineering Model shown is meant to be a framework. Its aim is to help the Business Engineer understand single projects and project activities in the entire context.
Most of the time the process of Business Engineering is initiated by IT-innovations, sometimes as well by changes of the general framework, branches, markets, customer behavior and the change of values. As a consequence the process is based on methods and models of the IT- and technology-managements in their early stages.
At the level of strategy the business architectures, models and strategies are therefore monitored. This part of Business Engineering is based on methods and models of strategic management (see lectures PM I L11 and L12).
Having formulated appropriate strategies and specification of the business model, appropriate business processes and finally appropriate information- and communication-systems for systematically supportable parts of the process are developed in a next step (see lectures PM I L9 and L10 for the modeling of companies and processes).
The complexity of transformation requires an engineering-, method- and model-based procedure. Networked business architectures and the possibility to direct business models either to production processes or to customer processes mark this complexity. Innovations only become effective when being implemented within strategy-, process- or system-levels. Doing so, the information und communication techniques bring along restrictions, which need to be beard in mind at all levels.

Production Management B – Spring Semester 2009
Business Engineering & Software Selection L12 P. 14
Lecture 12
Page 14© WZL/FIR
Principles of Business Engineering
Meta-Model of Business Engineering
Strategie
System
StrategischesGeschäftsfeld
Markt Marktleistungbeeinflusst
produziert /konsumiert
bietet an
Aufgabe Prozessbesteht
aus
Leistung
Funktion Applikationführt aus
Datensammlunggreift zu auf
IT-Komponente
läuft auf
strategy
process
system
business unitmarket market serviceaffects
can be
produces / requires
uses
offers
task processconsists of
service
function
supports
applicationcarries out
data poolaccesses
IT-components
uses
resultwhat?
activitywhereby?
roleswho?
techniquehow?
stakeholderfor whom?
Meta-model
prob
lem
-au
tono
mou
spr
oble
m-s
peci
fic
concretion
Notes:
Basic principles of the Method Engineering help making projects more stringent. The figure above shows the meta-model of Business Engineering. It contains essential objects and their connections.
Business Engineering acts on the assumption of the problem-independent meta-model, which then is specifically being adapted to the problem. Methods consist of five elements: meta-model, results, techniques, activities and roles.
The question of Stakeholder Value come to the foreground at the same time, which is a criterion for a business solution. On the strategy-level business logic defines factors for success, which are to be consulted on all levels for measurement of the project- and business-successes. An important part of this is the consideration of cost effectiveness, for example in form of Return on Investment (ROI).
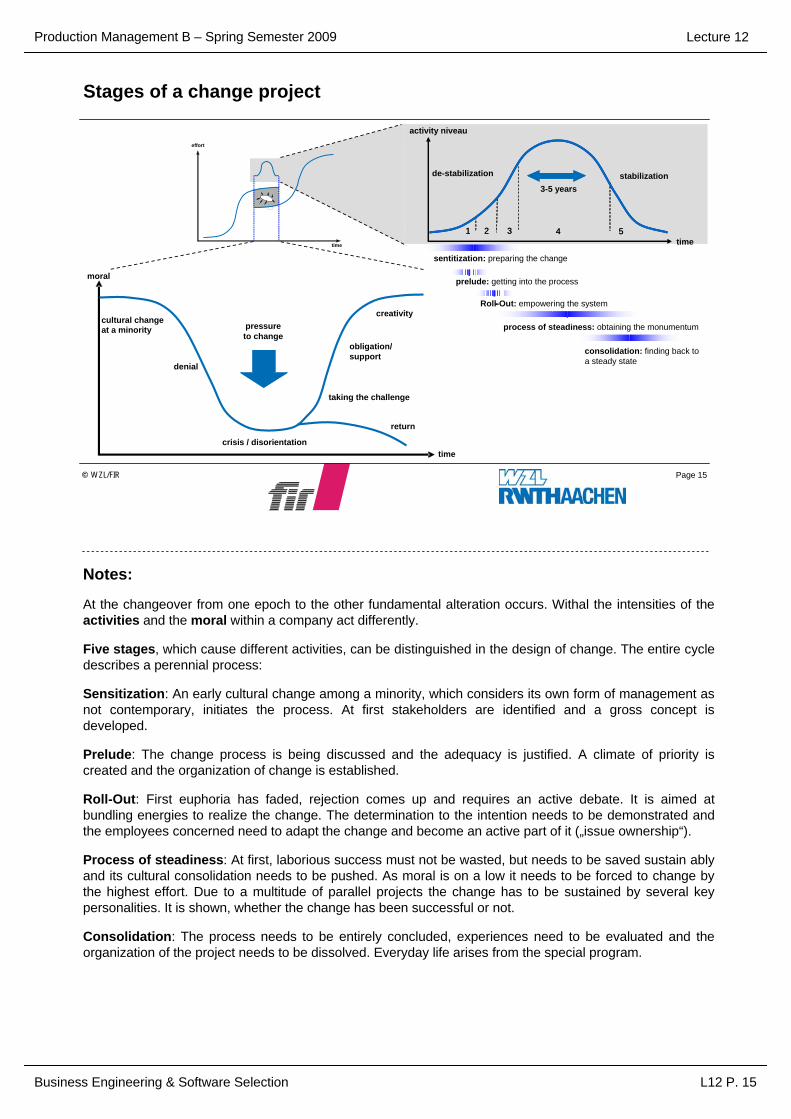
Production Management B – Spring Semester 2009
Business Engineering & Software Selection L12 P. 15
Lecture 12
Page 15© WZL/FIR
Stages of a change project
cultural changeat a minority
denial
obligation/ support
creativity
return
taking the challenge
pressure to change
moral
timecrisis / disorientation
1 32 54
prelude: getting into the process
Roll-Out: empowering the system-
process of steadiness: obtaining the monumentum
consolidation: finding back to a steady state
1 32 54
activity niveau
de-stabilization
time
stabilization3-5 years
sentitization: preparing the change
-
effort
time
Notes:
At the changeover from one epoch to the other fundamental alteration occurs. Withal the intensities of the activities and the moral within a company act differently.
Five stages, which cause different activities, can be distinguished in the design of change. The entire cycle describes a perennial process:
Sensitization: An early cultural change among a minority, which considers its own form of management as not contemporary, initiates the process. At first stakeholders are identified and a gross concept is developed.
Prelude: The change process is being discussed and the adequacy is justified. A climate of priority is created and the organization of change is established.
Roll-Out: First euphoria has faded, rejection comes up and requires an active debate. It is aimed at bundling energies to realize the change. The determination to the intention needs to be demonstrated and the employees concerned need to adapt the change and become an active part of it („issue ownership“).
Process of steadiness: At first, laborious success must not be wasted, but needs to be saved sustain ably and its cultural consolidation needs to be pushed. As moral is on a low it needs to be forced to change by the highest effort. Due to a multitude of parallel projects the change has to be sustained by several key personalities. It is shown, whether the change has been successful or not.
Consolidation: The process needs to be entirely concluded, experiences need to be evaluated and the organization of the project needs to be dissolved. Everyday life arises from the special program.

Production Management B – Spring Semester 2009
Business Engineering & Software Selection L12 P. 16
Lecture 12
Page 16© WZL/FIR
Controlling of realization
audit BalancedScorecard
financial controlling
concept realization result
managementwork
feedback
tproject
Bild 19
Notes:
Often the consistence of implementation is crucial for success or failure of an IT-introduction. In many cases only a small part of all possible potentials is achieved with the start of the new IT-solution. It is not until a continuous optimization of the new processes and the new systems that an IT-solution unfolds its complete range of possibilities.
Blind activism harms the project. Therefore the management needs to concentrate on goals with the highest benefit and must fully activate its employees. In order to realize this, goals need to be set consequently and lastingly realized in a sustainable way.
This can be achieved by appropriate methods within the different stages of a project:
Methods of resolution for the given tasks are rated in an audit by the management. A solution is selected and the appropriate realization is initiated.
A Balanced Scorecard helps tracking the course of realization (cp. PM I lecture 1). It even helps tracking down the strategy and goals to single areas and employees. In terms of selected key figures and corresponding methods each employee is pointed up his role in and contributions to the process of realization with individual aims.
By means of the controlling of finance values (cp. PM I, lecture 1) the prosperousness of the IT-project for the company can be judged retroactively.

Production Management B – Spring Semester 2009
Business Engineering & Software Selection L12 P. 17
Lecture 12
Page 17© WZL/FIR
Gliederung
Introduction into Business Engineering1
Web-based ERP Selection Process in comparison to traditional methods2
Summary and Conclusion3

Production Management B – Spring Semester 2009
Business Engineering & Software Selection L12 P. 18
Lecture 12
Page 18© WZL/FIR
Overview of the different procedures for the software selection
Functionsorientedselection
Process orientedselection
Strategyorientedselection
Provider orientedselection
Benefit orientedselection
Limitedselection
Internalselection
„Irrational“selection
-+ A B
Notes:

Production Management B – Spring Semester 2009
Business Engineering & Software Selection L12 P. 19
Lecture 12
Page 19© WZL/FIR
Procedure of 3PhaseConcept
The 3PhaseConcept combines the advantages of the different procedures throughindividual configuration and emphasis.
PhaseConcept
Functionsorientedselection
Processorientedselection
Strategyorientedselection
Provider orientedselection
Benefit orientedselection
Limitedselection
Internalselection
„Irrational“selection
-+ A B
Notes:
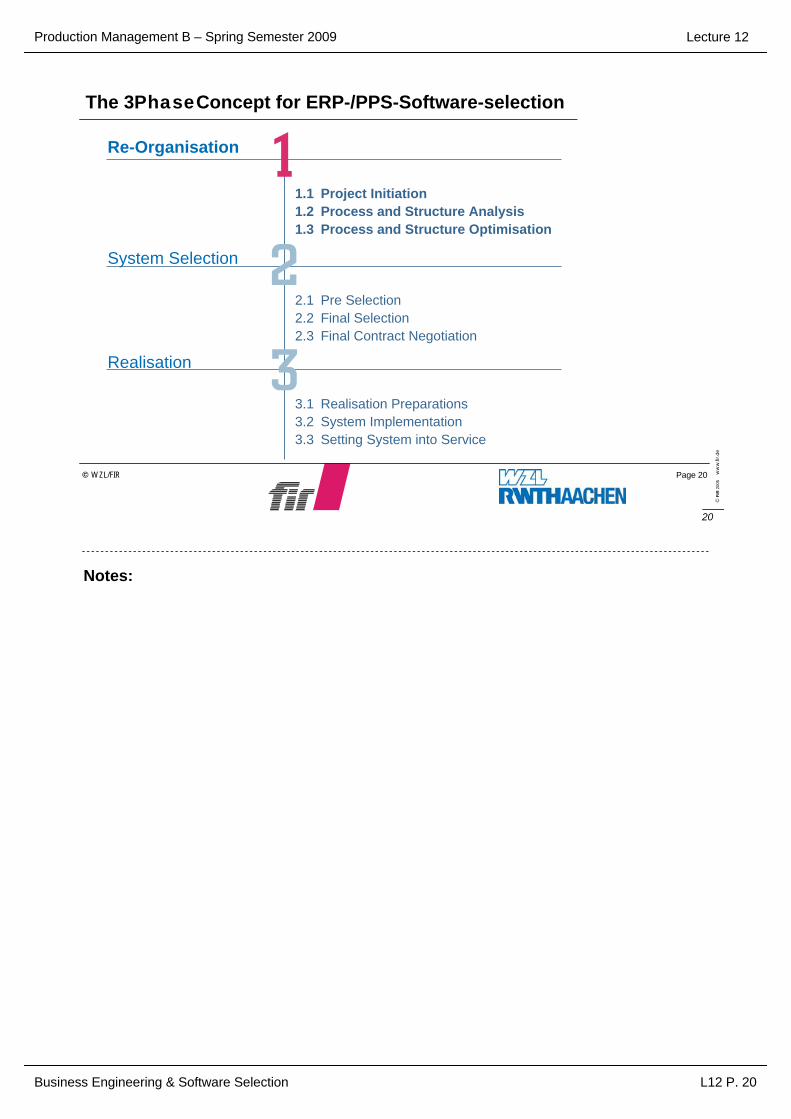
Production Management B – Spring Semester 2009
Business Engineering & Software Selection L12 P. 20
Lecture 12
Page 20© WZL/FIR
The 3PhaseConcept for ERP-/PPS-Software-selection
©FI
R20
05w
ww
.fir.d
e
20
Project InitiationProcess and Structure AnalysisProcess and Structure Optimisation
1.11.21.3
Pre SelectionFinal Selection Final Contract Negotiation
2.12.22.3
Realisation PreparationsSystem Implementation Setting System into Service
3.13.23.3
Re-Organisation
System Selection
Realisation
Notes:

Production Management B – Spring Semester 2009
Business Engineering & Software Selection L12 P. 21
Lecture 12
Page 21© WZL/FIR
Example for Business-Process-Modelling
Erstellung derArbeitsplan-
konzepte
AV- Arbeitsplankonzept
mit Auftragsdatenund Fertigungszeiten
22
20
EDV-Erfassung derArbeitsplan-
konzepte
FS- Laufkarte
(Arbeitsplänemit Materialdatenund Terminen)
- Lohnscheine- Rückmeldescheine
- Strukturplan (aus TP)
Zusammenführung der Zeichnungen
und Arbeitspapiere
FS
- Zeichnungen- Laufkarte (immer an der
Zeichnung/Werkstück)(Arbeitsplänemit Materialdatenund Terminen)
- Terminkarte (Kopie der Laufkarte; Verbleibin der Meisterei)
- Lohnscheine- Rückmeldescheine
- Hängeordner fürdie Fertigung(Terminkarte, Lohn-scheine, Rückmelde-scheine, Laufkartemit Zeichnung)
Fehlende zeitliche Abhängigkeitzwischen den Arbeitsplänen
AV
Kalkulationsdateneingehalten?
21
- Kalkulationsdaten
Ggf. Korrektur derStücklisten und
Zeichnung
AV, KS- Geänderte Stückliste
an EDV- Geänderte Zeichnung
- Stücklisten- Zeichnung
ja
nein
Laufkarte in Neuenkirchengleich Entnahmekarte
WT: ReferenzierungBaugruppenliste zu
Kurz-LV fehlt teilweise
2 - 6Wo.
DLZ Output EDVBemerkung InputThroughput-
time
Nescad
Dakoda
InformationFlow
IT-Support
Weeknesses
Department
Task
additionalinformation
Manuelle Erstellungder Arbeitsplankonzepte
- Erstellung der komplettenFertigungsunterlagen fürden Vorrichtungsbau(Rheine)
Fehlende Kopplung mit dem Strukturplan
Fehlende Prüfung aufvollständige Vorgaben
Guter Zugriffauf archivierteArbeitspläne
Arbeitstechnische Opti-mierung der Stücklisteund Zeichnung zu spät
Notes:
The analyses of processes and information flows is the starting point in the reorganisation phase. Theuse of modelling software is recommended (e.g. Visio, Bonapart, ARIS or Powerpoint).
Cross-departmental processes should also be taken into account. In the example, first the involvedorganisational units as well as the process steps are documented.
In parallel, weak points and lead times are analysed. Subsequently,improvement measures can bedetermined.

Production Management B – Spring Semester 2009
Business Engineering & Software Selection L12 P. 22
Lecture 12
Page 22© WZL/FIR
The 3PhaseConcept for ERP-/PPS-Software-selection
©FI
R20
05w
ww
.fir.d
e
22
Project InitiationProcess and Structure AnalysisProcess and Structure Optimisation
1.11.21.3
Pre SelectionFinal Selection Final Contract Negotiation
2.12.22.3
Realisation PreparationsSystem Implementation Setting System into Service
3.13.23.3
Re-Organisation
System Selection
Realisation
Notes:

Production Management B – Spring Semester 2009
Business Engineering & Software Selection L12 P. 23
Lecture 12
Page 23© WZL/FIR
Analysis and Evaluation of the ERP-Market
Control
Periodical testing of the collected dataon site by FIR-engineersPeriodical testing of the collected dataon site by FIR-engineers
Quarterly conducted marketresearch to collect generaldata from 230 ERP-System suppliers
Quarterly conducted marketresearch to collect generaldata from 230 ERP-System suppliers Evaluation of the grade of
functionality of ERP-SystemsEvaluation of the grade offunctionality of ERP-Systems
Validation Completeness
Data Collection Data Usage
Actuality Indepen-dency
TROVARIT AG:
Technology-Provider
TROVARIT AG:TROVARIT AG:
Technology-Provider
ITIT--MatchmakerMatchmaker
Notes:
The market for ERP systems is observed and analyzed for over 20 years by FIR. Since May 2000, market survey is published by the IT Matchmaker (www.it matchmaker.com) the Trovarit AG, a spin off of the FIR.
The IT Matchmaker is an internet platform which supports an online, web-based selection of enterprise software solutions (e.g. ERP systems).
Up to 1.500 respectively 2,200 characteristics are seized in a standard catalog for each system. The processes of data acquisition, control/data examination as well as data use are arranged in such a manner that the topicality, the validity and the completeness of the collected data are ensured.

Production Management B – Spring Semester 2009
Business Engineering & Software Selection L12 P. 24
Lecture 12
Page 24© WZL/FIR
Scope of ERP Systems – Overview of Functionalities
Organisational Structure Bill of Materiall Resource Mgt. Order ProcessingProduction Planning Purchasing Inventory Mgt. Controlling
Fulfi
llmen
t
0
200
400
600
800
1000
1200
1400
1600
100% 1 4 13 25 28 37 34 49 31 43 61 67 73 79Systems (anonymous)
Source: www.it-matchmaker.com, 11/2002
23
Notes:
Depicted is a standard evaluation done with the IT-Matchmaker (ranking).

Production Management B – Spring Semester 2009
Business Engineering & Software Selection L12 P. 25
Lecture 12
Page 25© WZL/FIR
Efficient Software Selection Through a Ranking Procedure
Produkt- und Produktstrukturverwaltung+Allgemeine Fragen0Materialstammverwaltung0Stücklistenverwaltung+Identifizierung/ Klassifizierung++
Arbeitsplanung+Arbeitsplanverwaltung++Ressourcenverwaltung+
Auftragskoordination++Angebotsbearbeitung+Auftragsklärung+Auftragsgrobterminierung++Auftragsführung++Preisfindung0Versand+Retouren-Servicemanagement++
Kapitel
Unter-kapitel
Kapitel
Unter-kapitel
KapitelUnter-kapitel
VeryImportant Important Not so
important
270 442 0
Kritische Merkmale
Critical
34
Weighting of chapters of the criteria catalogue
++ + 0 - - -
3,0 1,5 -1 0,5
82,2
83,1
84,0
84,3
84,6
85,8
86,1
90,6
92,6
95,0
0 10 20 30 40 50 60 70 80 90 100
m
S
S
5
S
A
S
1
2
3
Narrowing down the selection to 3 preferred systems!
24
Notes:
The characteristics that are collected in the standard catalog can be assigned individual chapters and subchpaters depending on the topic.
The weighting of the importance of individual characteristics, sub chapter or chapters leads to a rankingof systems subscibed to the IT Matchmaker.

Production Management B – Spring Semester 2009
Business Engineering & Software Selection L12 P. 26
Lecture 12
Page 26© WZL/FIR
Future Trends -System Functionalities in ERP-Systems
FutureTrendsE-Business-
Functionalities
Web-Shop, Content managementSpare part ordering and associated services via Inter-Front-end...
Mapping of ComplexOrganisation Structures
Item Data Management in Multi-Site Production CompaniesMaterials Management in Multi-Site Production CompaniesSales Planning in Decentralised Sales Organisations...
Advanced Planning & Scheduling (APS)-Functionality
Constraint-based Delivery Date Calculation (Available to Promise)Simultaneous Production Planning in Real-Time...
Workflow undEvent Control
Workflow Support for indirect Departments (e.g. Engineering)Integration of E-Mail in the Workflow...
Notes:
The increasing requirements on the part of the enterprises regarding the optimization of the enterprise-internal and external business processes led to new trends with ERP systems.
The illustration of complex organisational structures supports the job execution over several production sites, up to complex distribution structures. APS (Advanced Planning) functionalities improve current, MRP–based ERP systems.
A Workflow possible and an event support makes the inclusion and co-ordination of all coworkers concerned by a business transaction within shortest time.
E-Business-functionalities make an efficient completion possible of business processes including the Internets as communication medium.

Production Management B – Spring Semester 2009
Business Engineering & Software Selection L12 P. 27
Lecture 12
Page 27© WZL/FIR
Decision Support: Current Types of Standard-ERP-Systems
Incr
ease
of
inst
alla
tions
Product life cycle
techno-logicalinnovation
functional features
B
C
A
Features : systems with a balanced ratio of technical innovation andextensive functionality
Type of choice : balanced ratio ofsecurity, risk and potential
Features : extensive functionality on cost of technological innovation
Type of choice : high security at lowpotential
B
C
Features : high grade of innovative systemswith limited functionality
Type of choice : high risk and highpotential
A
= System n time
B CA
relevant area of selection
Notes:

Production Management B – Spring Semester 2009
Business Engineering & Software Selection L12 P. 28
Lecture 12
Page 28© WZL/FIR
IT consultancies and Sales partners – Additional Dimension to ERP Selection and Implementation
ERP Systems(approx. 100 Standard-ERP-Systems on the
German market)
IT consultancy(approx 5000 different IT consultanciesand Sales partners for ERP systems)
Industry
Examples: ERP Software Providers and number of IT consultancies
SAP: approx. 100 (only Germany)ABAS: 27 (Europe)
NAVISION: 97 (only Germany)
27
Notes
In the context of a selective procedure not only the software providers have to be considered, but additionally a multiplicity of associated system implementation partners or IT consultancies. The IT consultancies differ e.g. by a different industry experience, by different pre-setting of the ERP system (pre-customized).

Production Management B – Spring Semester 2009
Business Engineering & Software Selection L12 P. 29
Lecture 12
Page 29© WZL/FIR
Summary – Selection Criteria in ERP-Projects
Focus
„System“
Focus
„System Vendor“
Performance-based Selection Criteria
Strategic Selection Criteria
Implementation Concept
Quality and Availability of Professional Consultants
Quality und Responsiveness of Support
...
Market Position and Stability of System Vendor
Management Board of the System Vendor
R&D PotentialStrategy of the System Vendor (e.g. Industry focus)...
Match of “System Philosophy” and Corporate PhilosophyModernity of System TechnologySystem Flexibility Previous System Implementations with other Clients...
Aachen Model of PPC
Notes:

Production Management B – Spring Semester 2009
Business Engineering & Software Selection L12 P. 30
Lecture 12
Page 30© WZL/FIR
The 3PhaseConcept for ERP-/PPS-Software-selection
©FI
R20
05w
ww
.fir.d
e
30
Project InitiationProcess and Structure AnalysisProcess and Structure Optimisation
1.11.21.3
Pre SelectionFinal Selection Final Contract Negotiation
2.12.22.3
Realisation PreparationsSystem Implementation Setting System into Service
3.13.23.3
Re-Organisation
System Selection
Realisation
Notes:

Production Management B – Spring Semester 2009
Business Engineering & Software Selection L12 P. 31
Lecture 12
Page 31© WZL/FIR
2-Day Workshops with Software Providers (System Demonstration)
Create Checklist- Requirements, Questions- Sample Data
„Script“ for the Test
Grade Significance Characteristic
The system offers a better solution to the requirement as expected.
The requirement posed is fully fulfilled. Functionality is suitable
The fulfilment of the requirements is acceptable. However weaknesses exist
The requirement posed is fulfilled insufficient. Crucial points of the requirement can be not sufficiently covered by the system.
The requirement posed is not fulfilled. The system does not offer any support
1
2
3
4
5
The system fulfills demanded functionality in the standard
The system will offer functionality at the time of the introduction in the standard.
Functionality can be covered after slight adjustment
Functionality can be provided, however major programmingrequired
A system adjustment to the requirements is not possible
A
B
C
D
E
Graded by User Company Graded by Software Vendor
30
Grade
Notes:At the beginning of the test, an agenda is established containing some introductory information.
The agenda for the system test is organized around two parts:
1) Total „screenplay“/“script“
This includes the core processes e.g. from purchasing, production to sales. For each core process the company or team evaluates:
• Which information must be available in the system?
• How many graphical user interfaces have to be called in order to obtain the necessary information?
• which information must be entered into the system, e.g. selection lists, plausibility checks, assistance during the input etc.,
2) Individual „screenplay“/“script“
This part includes specific and detailed requirements and questions that have to be answered in the system test.
A final section contains question about previous experiences of the software provider in implementation projects or necessary adjustments of the software.

Production Management B – Spring Semester 2009
Business Engineering & Software Selection L12 P. 32
Lecture 12
Page 32© WZL/FIR
Evaluation of the Final Selection
insufficient
System test
ABCD
StandardAt Implementation Standard1/2 MD Programmingx MD Programming
Functional Spectrum (What?)Su
pplie
r1234
outstandinggoodsatisfactorysufficient
Performance (How?)
Proj
ectte
am
1
2
3
2
3
Consultancy
Programming
1
2
3
XX
X
XA B C D Approvement of fulfilment
of Requirements 500,- 1000,- 1500,-
500,- 1000,- 1500,-Critical Requirements
Preparation EvaluationProcess optimisationBAPSY-Preselection
++ - Criteria
TestdataCompany data
Test guideOverall test guideSpecific test guide
Functional Spectrumbefore after Programming
1 2 3
One-time/on-going costs
1 2 3 1 2 3
Daily Rate 1
System System
costs costs
System
Fulfilment
IndividualRequirements
TOP-Systems1
2 3
5
Notes:
The system test offers the project members the possibility of grading the ERP system according to theirrequirements. These requirements are demonstrated during the system test by the software provider.
The evaluation follows a uniform evaluation guideline (see also previous slide).
The total ranks of the systems are determined by taking into consideration different criteria, i.e. functionality, cost, ease of use etc.
The results of the system test are consolidated in a requirement specification document, which forms thebasis for contract negotiations with the software provider.

Production Management B – Spring Semester 2009
Business Engineering & Software Selection L12 P. 33
Lecture 12
Page 33© WZL/FIR
Adjustment of / Fine-Tuning ERP Systems
Standard SoftwareStandard Software Means of AdjustmentMeans of Adjustment AreaArea
Parametrization • System Parameters
Modularisation • Functional Building Blocks, e.g. Sales, Purchasing, Production
List and Report Generator • Lists, Reports
Maskengenerator • Adjustment of Graphical User Interfaces (GUI)
Rule Based Heuristics • Product Configuration• Material Requirements Planning
Code Generator • Program Development
35
Notes:

Production Management B – Spring Semester 2009
Business Engineering & Software Selection L12 P. 34
Lecture 12
Page 34© WZL/FIR
Agenda
Introduction into Business Engineering1
Web-based ERP Selection Process in comparison to traditional methods2
Summary and Conclusion3

Production Management B – Spring Semester 2009
Business Engineering & Software Selection L12 P. 35
Lecture 12
Page 35© WZL/FIR
Summary and ConclusionThe market situation for ERP systems is characterized by a large heterogeneity. More than 150 standard ERP systems exist in Germany
Differences in software functionality are significant
Not only the right system, but the also the adequate implementation partner is a criteria in the selection process
– In Germany, around 5.000 of these implementation partners exist!
Internet platforms can support the software selection process
Particularly private platforms offer the possibility also to streamline the selection process by providing a standard workflow and standardized communication between potential customers and software providers

Production Management B – Spring Semester 2009
Business Engineering & Software Selection L12 P. 36
Lecture 12
Questions:• What are the central elements to be taken into account in a it-system
selection process?
• Who should be involved in a software system selection process?
• Which points should be clarified before a ERP-system selection?
Production Management B – Spring Semester 2009
Business Engineering & Software Selection L12 P. 37
Lecture 12
Bibliography:
Martin, R; Lempp, P.; Mauterer, H.: Wie Software wirklich Nutzen bringt. Harvard Business Manager, Juni 2003, S. 71ff
Müller-Stewens, G.; Lechner, C.: Strategisches Management. Stuttgart: Schäffer-Poeschel Verlag , 2. Auflage, 2003
Österle, H.; Winter, R.: Business Engineering. Berlin: Springer Verlag , 2000
Österle, H.: Business Engineering – Prozeß- und Systementwicklung. Berlin: Springer Verlag, 1995
VDI-Gem.ausschuß CIM: CIM-Management. Rechnerintegrierte Konstruktion und Produktion Band 1. Düsseldorf: VDI-Verlag, 1990
VDI-Gem.ausschuß CIM: Kommunikation und Datenbanktechnik. Rechnerintegrierte Konstruktion und Produktion Band 6. Düsseldorf: VDI-Verlag, 1991