laboratory manual of biochemistry · laboratory manual of biochemistry . ... and quantitative...
TRANSCRIPT

KERALA AGRICULTURAL UNIVERSITY PINEAPPLE RESEARCH STATION
Vazhakulam, Muvattupuzha, Ernakulam, Kerala, PIN-686 670
Tel. & Fax: 0485-2260832, Mobile: 9446010905
Email: [email protected], [email protected]
Web: www.kau.edu/prsvkm, http://prsvkm.tripod.com
2015
Joy P P, Surya S. and Aswathy C.
Laboratory Manual of Biochemistry

Joy P P, Surya S. and Aswathy C. 2015. Pineapple Research Station (Kerala Agricultura l University) Vazhakulam-686670 Muvattupuzha, Ernakulam, Kerala. Tel.: 0485-2260832, 9446010905, Email: [email protected], Web: prsvkm.kau.in
2 Laboratory Manual of Biochemistry
CONTENTS
Sl. No.
Title
Page
A Biochemistry: An Introduction 1 Introduction and Scope of Biochemistry 4 1.1 Objectives of Biochemistry 4
1.2 Scope and Importance of Biochemistry in Agriculture 5
B General Laboratory Principles
2 Laboratory Safety Rules, Requirements and Regulations 6
2.1 Safety in the Laboratory 6
2.2 First Aid in the Laboratory 8
2.3 Laboratory Requirements 9
2.4 Regulations in the Laboratory 10
2.5 Keeping Records and Communicating Experimental Data 11
2.6 Using Biochemical Reagents and Solutions 13
2.7 Quantitative Transfer of Liquids 15
2.8 Statistical Analysis and Experimental Data 19
C Biochemistry Lab Techniques
3 Basic Instrumentation Practices 20
D Fruit Analysis 4 Pineapple 85
4.1 Basic Fruit Analysis of Pineapple 86
4.2 Determination of Constituents by Physical Methods 87
4.3 Sample Preparation for Chemical Analysis 90
5 Passion fruit 91 5.1 Basic Fruit Analysis of Passion fruit 93
5.2 Determination of Constituents by Physical Methods 94
5.3 Sample Preparation for Chemical Analysis 97
E Quality Indices of Fruits
6 Sensory Attributes of Fruit 98
7 9 Point Hedonic Scale 99
F General Biochemical Parameters
8 Proximate Analysis 100
8.1 Determination of Moisture Content by Hot Air Oven Method 102
8.2 Determination of Crude Ash content Using Muffle Furnace 102
8.3 Determination of Total Protein 103
8.3.1 Determination of Crude Protein by Kjeldahl Method 103
8.3.2 Determination of Total Protein by Biuret Method 104
8.3.3 Dete i atio of Total P otei Lo s Method 105
8.3.4 Determination of Total Protein by Bradford Method 106
8.4 Determination of Crude Fat by Soxhlet Method 106
8.5 Determination of Total Carbohydrate 107 8.5.1 Determination of Total carbohydrate by Furfural Colorimetric Method 107
8.5.2 Determination of Total Carbohydrate by Anthrone Reagent 108
8.5.3 Determination of Total Carbohydrate by Phenol Sulphuric Acid Method 108
8.6 Determination of Crude Fibre 109

Joy P P, Surya S. and Aswathy C. 2015. Pineapple Research Station (Kerala Agricultura l University) Vazhakulam-686670 Muvattupuzha, Ernakulam, Kerala. Tel.: 0485-2260832, 9446010905, Email: [email protected], Web: prsvkm.kau.in
3 Laboratory Manual of Biochemistry
G Determination of Chemical Constituents
9 Estimation of Titrable Acidity 111
9.1 Titrimetric Method 111
9.2 pH Meter Method 112
10 Estimation of Total Soluble Solids 113
11 Estimation of Total Phenolic Compounds 114 11.1 Estimation of Total Phenols 114
11.2 Estimation of O-dihydroxy Phenols 115
11.3 Estimation of Total Flavanoid Content 115
11.4 Estimation of Flavanols 116
12 Estimation of Total Antioxidant Activity (TAA) 116
13 Estimation of Reducing Sugar 117
13.1 Estimation of Reducing Sugar by Titration Method 117
13.2 Estimation of Reducing Sugar by Nelson-“o og i s Method 118
13.3 Estimation of Reducing Sugar by Dinitro Salicylic Method 119
14 Estimation of Total Sugar 120
15 Estimation of Non-Reducing Sugar 121
16 Estimation of Starch by Anthrone Reagent 121
17 Determination of Amylases 122
18 Extraction of Bromelain 123
19 Esti atio of β-Carotene 124
20 Estimation of Ascorbic Acid 125
20.1 Volumetric Method 125
20.2 Colorimetric Method 126
21 Determination of Dietary Fibre 127
22 Estimation of Mineral Content 129 22.1 Determination of Phosphorus by Colorimetric Method 130
22.2 Determination of Sodium and Potassium Using Flame Photometry 130
22.3 Determination of Calcium Using Flame Photometry 131
22.4 Determination of Zinc by Colorimetric Dithizone Method 131
22.5 Determination of Iron by Colorimetric Method 133
H Appendices
23 Appendix I- Abbreviations 135
24 Appendix II - Glossary 137
25 Appendix III - Definitions 141
26 Appendix IV - Major Chemicals and Reagents Used in Biochemistry 142
27 Appendix V - System International (SI) Units, Conversions and Derivations 144
28 Appendix VI - Solution Preparation 149
29 Appendix VII - Fruit Composition and Nutritive Value 156

Joy P P, Surya S. and Aswathy C. 2015. Pineapple Research Station (Kerala Agricultura l University) Vazhakulam-686670 Muvattupuzha, Ernakulam, Kerala. Tel.: 0485-2260832, 9446010905, Email: [email protected], Web: prsvkm.kau.in
4 Laboratory Manual of Biochemistry
A. Biochemistry: An Introduction
1. Introduction and Scope of Biochemistry
Biochemistry is the branch of life science which deals with the study of chemical reactions occurring in
li i g ells a d o ga is s. The te Bio he ist as fi st i t odu ed the Ge a Che ist Ca l Neuberg in 1903. It takes into account the studies related to the nature of the chemical constituents of
living matter, their transformations in biological systems and the energy changes associated with these
transformations. Biochemistry may thus be treated as a discipline in which biological phenomena are
analyzed in terms of chemistry. The branch of Biochemistry for the same reason, it has been variously
a ed as Biologi al Che ist o Che i al Biolog . Mode io he ist has t o a hes, descriptive biochemistry and dynamic biochemistry. Descriptive biochemistry deals with the qualitative
and quantitative characterization of the various cell components and the dynamic biochemistry deals
with the elucidation of the nature and the mechanism of the reactions involving these cell components.
Many newer disciplines have been emerged from biochemistry such as enzymology (study of enzymes),
endocrinology (study of hormones), clinical biochemistry (study of diseases), molecular biochemistry
(study of biomolecules and their functions) etc. Along with these branches certain other specialties have
also come up such as agricultural biochemistry, pharmacological biochemistry etc. Biochemistry is
related to almost all the life sciences and without biochemistry background and knowledge, a thorough
understanding of health and well-being is not possible. Those who acquire a sound knowledge of
biochemistry can tackle the two central concerns of the biomedical sciences (1) the understanding and
maintenance of health, and (2) the understanding and treatment of diseases.
1.1. Objectives of Biochemistry
The major objective of biochemistry is the complete understanding of all the chemical processes
associated with living cells at the molecular level. To achieve this objective, biochemists have attempted
to isolate numerous molecules found in cells, to determine their structures a nd to analyze how they
function. Biochemical studies have illuminated many aspects of disease and the study of certain diseases
has opened up new therapeutic approaches. In brief the objectives can be listed as follows:
Isolation, structural elucidation and the determination of mode of action of biomolecules
Identification of disease mechanisms
Study of inborn errors of metabolism
Study of oncogenes in cancer cells
The relationship of biochemistry with genetics, physiology, immunology, pharmacology,
toxicology etc.
Biochemistry is the study and application of substances, reactions and processes in animals, plants,
bacteria and viruses. Biochemistry has vast scope. Biochemists work in hospitals, industry, drug design
and development, environmental sciences, forestry, agriculture, dietetics, hormone production, vaccine
research, virology, immunology, microbiology, toxicology, food science, plant science and associated
areas and in areas from marine biology to entomology not just to carry out R&D work and develop new
products but also to monitor the production, quality and safety of the product. Biochemists provide
diagnostic service, carrying out tests on blood, urine and other body fluids, while researching the
underlying causes of disease and methods of treatment. They find jobs in pharmaceutical and

Joy P P, Surya S. and Aswathy C. 2015. Pineapple Research Station (Kerala Agricultura l University) Vazhakulam-686670 Muvattupuzha, Ernakulam, Kerala. Tel.: 0485-2260832, 9446010905, Email: [email protected], Web: prsvkm.kau.in
5 Laboratory Manual of Biochemistry
agrochemical companies, food brewing and biotechnology industry. The postgraduate degree in
biochemistry also provides opportunity for advanced teaching in universities, colleges, medical, dental
and veterinary schools and consulting or allied work. Observational, organizational, computational skills,
planning and team work are important for biochemists.
1.2. Scope and importance of Biochemistry in agriculture
To evaluate nutritive value of cereals, pulses, poultry and cattle feed
Development and exploitation of better genotypes
Removal and inactivation of toxic or anti nutritional factors present in food grains in general and
grain legumes in particular by breeding and chemical treatments E.g. BOAA in Lakhodi dal
(Lathyrus sativus), trypsin inhibitors of soybean, aflatoxins of groundnut
Food preservation and processing technology and post-harvest physiology of fruit crops and
vegetables and their nutritional quality
Biochemistry of disease and pest resistance
Biochemistry of drought resistance: Proline and hydroxyproline imparts drought resistance to
Jowar
Formulation of balanced diet
Use of non-conventional sources of protein foods viz., single cell proteins, fish protein
concentrates, mushrooms and leaf proteins
Developments in the field of intermediary metabolism i.e. synthesis and degradation of
constituents of living tissues

Joy P P, Surya S. and Aswathy C. 2015. Pineapple Research Station (Kerala Agricultura l University) Vazhakulam-686670 Muvattupuzha, Ernakulam, Kerala. Tel.: 0485-2260832, 9446010905, Email: [email protected], Web: prsvkm.kau.in
6 Laboratory Manual of Biochemistry
B. General Laboratory Principles
2. Laboratory Safety Rules, Requirements and Regulations
Biochemistry laboratory provides controlled conditions in which scientific or technological
research, experiments, and measurement may be performed. Laboratories used for scientific research
take many forms because of the differing requirements of specialists in the various fields of science and
engineering.
2.1. Safety in the Laboratory
Safety in the biochemistry laboratory involves a cautious attitude and an awareness of potential
hazards. Usually potential accidents can be anticipated and prevented. If safety precautions are
followed, fewer accidents will occur. The number of laboratory accidents can be reduced if every
student follows all of the directions given for the experiment and by the instructor. Special note should
be taken of specific instructions that are given in an experiment to eliminate recognize d potential
hazards. Total awareness of hazards and dangers and what to do in case of an accident is the
responsibility of the student and the instructor. Work in the biochemistry laboratory involves the use of
inflammable solvents, some corrosive and toxic chemicals, and apparatus which, if used improperly, can
cause minor to severe injury. All work with solvents and chemicals must be performed in the fume
hoods not on the bench top. Safety glasses and shoes must be worn at all times while in the laboratory.
2.1.1. Solvents
Never heat inflammable solvents, even small amounts, with or near a flame. As for refluxing or
distillation, never place solvents in an open beaker. Pouring solvents in the vicinity of a flame is
extremely hazardous. Use an oil bath, steam bath, water bath, heating mantle, or hot plate as a
heat source whenever possible.
Ethyl ether and Petroleum ether (bp 30-60°) are especially dangerous. Never heat them on a hot
plate; always use a water or steam bath, and collect the distillate in an ice-cooled flask. In the
case of Ethyl ether, the receiver should be a filtering or distilling flask connected to the
condenser with a cork and with a piece of rubber tubing leading from side tube on the flask to
the floor. This allows the heavy Ether vapours to spread along the floor instead of the desktop
where they may be ignited by burners. Carbon disulphide is extremely hazardous. It has been
known to ignite from hot steam pipes or electrical sparks, as from the thermostat on a hot plate,
or the motor on a stirrer.
If an inflammable solvent is spilled, have all workers at the desk turn off their burners and clean
it up immediately using a cloth. Wring (squeeze)the solvent from the cloth into the solvent
waste can and then rinse the cloth in the sink with much water. Use gloves.
Fig.1. A Biochemistry Laboratory

Joy P P, Surya S. and Aswathy C. 2015. Pineapple Research Station (Kerala Agricultura l University) Vazhakulam-686670 Muvattupuzha, Ernakulam, Kerala. Tel.: 0485-2260832, 9446010905, Email: [email protected], Web: prsvkm.kau.in
7 Laboratory Manual of Biochemistry
If Acetone is used to aid in drying glassware, use it sparingly and not near a flame.
Inflammable solvents which you may have contact with are: Ether, Ligroin (Petroleum ether),
Cyclohexane, Toluene, Xylene, Alcohols, Ethyl acetate, Carbon disulphide, Acetone, Dioxane etc.
If in doubt about the inflammability of a solvent, assume that it is hazardous.
Benzene and chlorinated solvents are toxic. In some cases, the toxic effect is cumulative. Avoid
contact with the skin and inhalation of solvent vapours.
Many organic solvents freely permeate latex gloves commonly used in laboratories, and are
therefore inadequate protection of the skin from solvent vapours. Thicker neoprene or butyl
rubber gloves are recommended.
2.1.2. Chemicals
Especially corrosive substances which give off noxious fumes (e.g., Bromine, Acetyl chloride,
Benzyl chloride, Phosphorus trichloride, Acetic anhydride, fuming Nitric and Sulphuric acids,
Chlorosulphonic acid, Benzene sulfonyl chloride, etc.) should be handled in the hoods. Use
proper gloves. Do not spill these chemicals on yourself or on the desktops. They will cause very
painful burns. Do not put any of these in organic waste cans.
Over the last several years a number of organic compounds have been confirmed as carcinogens
and the list is steadily growing. It is best to assume that all chemicals are toxic, and possibly
carcinogenic.
Sodium and Potassium metals react explosively with water. They are rapidly corroded by the
atmosphere and should be stored in kerosene or oil. These metals should not be allowed to
come into contact with the skin. They may be handled with dry filter paper or tweezers. Unused
pieces of metal may be destroyed by dropping into 95% Ethyl alcohol, or they may be returned
to the bottle. Avoid all contact between chlorinated solvents and Sodium or Potassium.
Concentrated acids and alkalis are corrosive to the desktops, clothing and skin. If there is a spill,
first dilute with large volume of water. If an acid, neutralize with solid Sodium bicarbonate; and
if a base, with 3% Acetic acid. Sulfuric acid is troublesome, since drops adhering to the tops of
bottles tend to absorb moisture and run down the outside of the bottle.
Mercury and its vapour are poisonous. Avoid spilling; the Institute should have special facilities
for cleaning up mercury spills.
2.1.3. Apparatus
Approved safety glasses, goggles, or a face shield must be worn at all times when in the lab.
Normal prescription lenses are insufficient due to the possibility of explosion.
When inserting tubing or thermometers into bored stoppers, it is wise to take some simple
precautions. The tubing and stopper should be held by a towel, so that if the tubing breaks the
towel will reduce the impact of the jagged edge. If the tubing does not enter the hole in the
stopper easily, the hole may be made larger with a file (if a cork) or lubricated with water,
alcohol, or Glycerine. Hold the tubing close to the stopper. In removing tubing from stoppers,
follow the same technique. Serious cuts have resulted from carelessness in inserting tubes in
stoppers.
Closed systems are liable to explode if heated. Never carry out an atmospheric pressure
distillation in a closed system.

Joy P P, Surya S. and Aswathy C. 2015. Pineapple Research Station (Kerala Agricultura l University) Vazhakulam-686670 Muvattupuzha, Ernakulam, Kerala. Tel.: 0485-2260832, 9446010905, Email: [email protected], Web: prsvkm.kau.in
8 Laboratory Manual of Biochemistry
Do not support apparatus on books, boxes, pencils, etc. Use large, strong wooden blocks, rings,
or lab jacks. Assemblies with a high centre of gravity (as when a reagent is added through the
top of a condenser) should be assembled and operated with much care.
Use glass stirring rods with care for breaking up solids. They are liable to break.
Do not evacuate Erlenmeyer flasks larger than 50 ml (except filtering flasks). They may collapse.
Oil baths and melting point baths can cause severe burns if spilled. Make sure they are well
supported. Be especially careful not to get water into oil baths. Use electric heating mantles in
preference to oil baths when possible.
Dewar flasks and vacuum desiccators, implode easily when tipped over or dropped. Make sure
the ones you use are wound on the outside with friction tape or are contained in protective
shields, so they will not shower glass around the laboratory if broken.
2.1.4. Accidents
2.1.4.1. Fire
Personal safety is most important. If a pe so s lothi g at hes fire, he/she needs immediate help.
Prevent him/her from running. If he/she is close enough, put him/her under the safety shower because
it is more effective than a blanket. If not, make him/her lie down and smother (obstruct) the flames by
rolling, wrapping with lab coats, blankets, towels, etc. Never turn a Carbon dioxide extinguisher on a
person. If a fire breaks out, turn off all burners and remove solvents if time allows. Carbon dioxide
extinguishers are must in the laboratory, their positions and operation should be known. Point the
extinguisher at the base of the flames. Very small fires can be put out with a damp towel by smothering.
The priority should be the safety of all than the matter of extinguishing the fire is considered. A few
seconds delay can result in very serious injury, every person in the laboratory should plan in advance
what he/she will do in case of such an emergency.
2.1.4.2. Chemicals
If corrosive chemicals are spilled on the clothing, immediate showering (with clothing on) is the best
remedy. Safety showers are located by each door. If chemicals are spilled on the skin, wash them off
with large volumes of water. Bromine should be washed off with water and the skin then massaged with
Ethanol or Glycerine. Do not apply a burn ointment. If the chemical is spilled in the eye, it should
immediately be washed out thoroughly with water using the eyewash sprayer in the sinks. If acid wa s
involved, a weak solution of Sodium bicarbonate in an eyecup should then be used. If a base, Boric acid
is effective. If corrosive chemicals are spilled on the desk, dilute them with a large volume of water and
then neutralize with Sodium bicarbonate if an acid, or dilute Acetic acid if a base.
2.2. First Aid in the Laboratory
Accidents do not often happen in well-equipped laboratories if one of them understands safe laboratory
procedures and are careful in following them. When an occasional accident does occur, it is likely to be a
minor one. The following information will be helpful to you if an accident occurs.
In accidental swallowing of acids or alkali, the mouth must be thoroughly rinsed with water. In
the case of acid; rinse the mouth with dilute Sodium carbonate and in case of alkali; with dilute

Joy P P, Surya S. and Aswathy C. 2015. Pineapple Research Station (Kerala Agricultura l University) Vazhakulam-686670 Muvattupuzha, Ernakulam, Kerala. Tel.: 0485-2260832, 9446010905, Email: [email protected], Web: prsvkm.kau.in
9 Laboratory Manual of Biochemistry
Citric acid. If proper swallowing has occurred, the person should be made to drink water
followed by milk in case of acids and lemon juice in case of alkali.
Skin burns should be washed under running water or ice water and then apply Petroleum jelly or
burn ointment and cover with sterile gauge.
Inhalation injury by toxic fumes is best treated by shifting the person to an open fresh air
atmosphere. Irritation to throat can be soothened with hot water vapour inhalation or a warm
drink.
Chemical injury to eyes must be treated by thorough washing with water and then applying 2%
Sodium carbonate drops till referred to a specialist.
2.2.1. Hazards in the Lab - Important Terms
Severe Toxicity- adverse effects of a substance
that result either from a single exposure or
from multiple exposures in a short space of
time (usually less than 24 hours)
Irritant- causes redness, inflammation
Corrosive- eats a a tissue g aduall
Carcinogenic- causes cancer
Flammable- easily set on fire
Bio hazard- substances that pose a threat to
the health of living organisms, primarily that of
humans.
2.2.2. Personal Protective Equipment (PPE)
Personal Protective Equipment or PPE (Fig.3) refers
collectively to equipment such as safety glasses,
goggles, aprons, lab coats, gloves, protective shoes,
respiratory protective equipment, ear defenders and
similar equipment used to protect the person during
their work.
2.3. Laboratory Requirements
The basic requirements of a biochemistry laboratory include: good computer attached with a printer,
temperature control or cold room, dark room, sinks, and instruments such as autoclave, microscope,
water distillation units, hot air ovens, titration assembly, chemical fume hoods, laminar f low work
stations, incubators, deep freezer, refrigerators, water baths, refrigerated centrifuges, micro centrifuge,
pH meter, trans-illuminator equipped with a camera or electronic imaging system, photometric
assembly, electrophoresis units, chromatography assembly, PCR , blotting apparatus, microwave oven,
balances, and many other miscellaneous things.
The laboratory needs a variety of glassware including reagent bottles, beakers, measuring cylinders,
conical flasks, standard flasks, test tubes, burettes, pipettes, watch glass, glass slides, cover slips, glass
rods, petridishes, and other culture vessels. Other requirements include syringes, needles, forceps,
scalpels, membrane filters (to sterilize heat labile liquids), magnetic stirrers, orbital shakers, inoculation
loops, stop watches, nitro cellulose membranes, parafilm, saran wrap, aluminium foil, marker pens, filter
paper, ice buckets, latex gloves, plastic boxes, plastic bags, UV goggles, besides plastic bottles and
Fig.3. Personal Protective Equipment (PPE)
Fig.2. Hazards in the Lab

Joy P P, Surya S. and Aswathy C. 2015. Pineapple Research Station (Kerala Agricultura l University) Vazhakulam-686670 Muvattupuzha, Ernakulam, Kerala. Tel.: 0485-2260832, 9446010905, Email: [email protected], Web: prsvkm.kau.in
10 Laboratory Manual of Biochemistry
containers etc. A good supply of chemicals is a very essential aspect of equipping a laboratory as are
uninterrupted power and water supply.
2.4. Regulations in the Laboratory
Safety glasses must be worn at all times by students and instructors. Visitors to the lab must be
appropriately warned and safety glasses should be made available to them.
Fume hoods must be used while working with chemicals that produce hazardous fumes.
The location of fire extinguishers, safety showers, and eyewash stations must be known.
There must be no unsupervised or unauthorized work going on in the laboratory.
A laboratory is never a place for practical jokes or pranks.
The toxicity of all the chemicals you will be working with must be known. Consult the instructor
to aware on material safety data sheets (MSDSs), safety charts, and container labels for safety
information about specific chemicals. Recently, many common organic chemicals, such as
Benzene, Carbon tetra chloride, and Chloroform, have been deemed unsafe.
Eating, drinking, or smoking in the laboratory is never allowed. Never use laboratory containers
(beakers or flasks) to drink beverages.
Shoes (not open-toed) must always be worn; hazardous chemicals may be spilled on the floor or
feet.
Long hair should always be tied back.
Mouth pipetting is never allowed.
Cuts and burns must be immediately treated. Use ice on new burns and consult a doctor for
serious cuts.
I the e e t of a id spilli g o o e s od , flush thoroughly with water immediately. Be aware
that acid–water mixtures will produce heat. Removing clothing from the affected area while
water flushing may be important, so as to not trap hot acid–water mixtures against the skin.
Fig.5. Laboratory Glasswares Fig.4. Laboratory Instruments

Joy P P, Surya S. and Aswathy C. 2015. Pineapple Research Station (Kerala Agricultura l University) Vazhakulam-686670 Muvattupuzha, Ernakulam, Kerala. Tel.: 0485-2260832, 9446010905, Email: [email protected], Web: prsvkm.kau.in
11 Laboratory Manual of Biochemistry
Acids or acid–water mixtures can cause very serious burns if left in contact with skin, even if
only for a very short period of time.
Weak acids (such as Citric acid) should be used to neutralize base spills, and weak bases (such as
Sodium carbonate) should be used to neutralize acid spills. Solutions of these should be readily
available in the lab in case of emergency.
Dispose all aste he i als f o the e pe i e ts a o di g to ou i st u to s di e tio s.
In the event of an accident, report immediately to your instructor, regardless of how minor you
perceive it to be.
Always be watchful and considerate of others working in the laboratory. It is important not to
jeopardize their safety or yours.
Always use equipment that is in good condition. Any piece of glassware that is cracked or
chipped should be discarded and replaced.
It is impossible to foresee all possible hazards that may manifest themselves in a laboratory. Therefore,
it is very important for all students to listen closely to their instructor and obey the rules of their
particular laboratory in order to avoid injury.
2.5. Keeping Records and Communicating Experimental Results
2.5.1. The Laboratory Notebook
All students need to maintain a laboratory notebook. The notebook should be used for the recording of
laboratory data and calculations, and is critically important for writing your lab reports. The purpose of a
laboratory notebook is to allow anyone with some biochemical knowledge to understand exactly what
you did. You need to record the information in sufficient detail so as to be able to repeat it, and you
must be able to understand exactly what your results were. You will need good notes to be able to write
your lab reports; in addition, as your understanding of biochemistry improves, your notebook may allow
you to figure out why some parts of your experiments did not work as expected.
A lab notebook should contain many things:
A Table of Contents to aid navigation of the notebook
A date on each page
A written introduction / explanation to yourself of the importance of the experiment
Procedural notes (if following a published procedure, there is no need to copy the procedure.
Just reference it, and note changes)
Values collected (i.e., if a protocol called for using 5.0g of NaCl, how much did you actually use ?
4.998 g?)
All esults olle ted, alo g ith o se atio s did the tu e tu pi k, a d the p oto ol did t e tio that? That s a o se atio !
Analysis of the data – legible tables, graphs, and calculations
Brief conclusions
Answers to analysis and comprehension questions for the future.

Joy P P, Surya S. and Aswathy C. 2015. Pineapple Research Station (Kerala Agricultura l University) Vazhakulam-686670 Muvattupuzha, Ernakulam, Kerala. Tel.: 0485-2260832, 9446010905, Email: [email protected], Web: prsvkm.kau.in
12 Laboratory Manual of Biochemistry
Lab reports are a more formal presentation of your results. Instead, they focus on clearly explaining the
significance of the experiment, and give a careful, well-reasoned and clearly worded analysis of the
results, leading the reader to the conclusion.
2.5.2. Experimental Write-up
Below is an outline that may be used as a guideline to write a complete report on an experiment.
2.5.3. Communicating Results from Biochemistry Research
A scientific project is not complete until its discoveries have been communicated to colleagues around
the world. The three most important methods or tools for communication are: the scientific paper, the
oral presentation, and the poster. Although there are many differences in how to prepare for these
three common methods of introducing new biochemical information, they all have one thing in common
- the sharing of experimental results and conclusions. The distinct rules and traditions of each of the
methods will be described and compared here.
2.5.3.1. The Scientific Paper
A paper published in a biochemical journal is a formal way to report research results to colleagues in the
international biochemical community. Before writing such a document, one must first determine the
journal to which the article will be submitted. The best advice is to submit the manuscript to the most
prestigious journal that has a large audience interested in his or her specialized topic. You write up the
results from an experiment in the form of a journal article, so it is important to understand the
conventions used in preparing a manuscript for publication. Most biochemical journal articles have the
same basic organization: Title, Abstract, Introduction, Experimental Methods, Results, Discussion, and
References. The specific requirements for each of these sections vary among the many journals, so it is
important to review several articles in different journals to get a flavour of what is expected.
I. Introduction
(a) Objective or purpose
(b) Theory
II. Experimental
(a) Table of materials and reagents
(b) List of equipment
(c) Flowchart
(d) Record of procedure
III. Data and Calculations
(a) Record of all raw data including printouts
(b) Method of calculation with statistical analysis
(c) Present final data in tables, graphs, or figures when appropriate
IV. Results and Discussion
(a) Conclusions
(b) Compare results with known values
(c) Discuss the significance of the data
(d) Was the original objective
(e) Literature references
Pre lab
Fig.6. Experimental Write-up

Joy P P, Surya S. and Aswathy C. 2015. Pineapple Research Station (Kerala Agricultura l University) Vazhakulam-686670 Muvattupuzha, Ernakulam, Kerala. Tel.: 0485-2260832, 9446010905, Email: [email protected], Web: prsvkm.kau.in
13 Laboratory Manual of Biochemistry
2.5.3.2. The Oral Presentation
The purpose and mechanics of an oral presentation are quite different from preparing and publishing a
paper. In an oral presentation, you have a fleeting moment to present data and attempt to convince
your audience of the importance of your work. One advantage of the oral presentation, however, is that
it provides an opportunity for more direct contact with your audience than does a paper; thus the
opportunity exists for immediate questions and feedback. Presentations usually range from 15 to 60
minutes. Shorter presentations cover a much smaller unit of a research project, whereas 60-minutes
talks (often called seminars) can give a broader exposure to the research area. Scientific presentations
involve mixed media - oral and visual. The important verbal points are reinforced with the use of a visual
aid such as a figure, graph, or other element. Scientific presenters today most often use power point,
computer software that projects electronic slides onto a screen, although overhead transparencies are
also acceptable and efficient. In visual aid, the slides must be carefully constructed with special concern
for the total number of slides and the amount of information on each. The organization of a talk is
similar to that of a paper-introduction, experimental methods, results, discussion, conclusions, and
questions/comments.
2.5.3.3. The scientific poster
Scientific poster is a communication method that may be considered a hybrid, as it combines elements
of the oral presentation (verbal expression and visual aids) with elements of a paper (printed text and
figures). The poster has become the primary medium by which new scientific information is exchanged
at all professional conferences, including local, regional, national, and international meetings. The
poster, however, may be available to readers for long periods of time in the absence of the presenter.
2.6. Using Biochemical Reagents and Solutions
2.6.1. Water Purity
Water is the most common and widely-used substance in the biochemistry laboratory. Both the quality
and quantity of water required must be considered for each lab application.
Applications of water usage include:
(1) Solvent for preparing most buffer and reagent solutions;
(2) Column chromatography;
(3) High-performance liquid chromatography;
(4) Tissue culture; and
(5) Washing glassware.
Ordinary tap water contains a variety of impurities including particulate matter, dissolved organics, in
organics, and gases; and microorganisms and the natural degradation of microorganisms leads to the
presence of byproducts called pyrogens. For most laboratory procedures, it is recommended that some
form of purified water be used. The purity of water is usually measured in terms of resistivity. Unit for
resistivity is Megohms- cm. There are five basic water purification technologies distillation, ion
exchange, activated carbon adsorption, reverse osmosis, and membrane filtration. For most procedures

Joy P P, Surya S. and Aswathy C. 2015. Pineapple Research Station (Kerala Agricultura l University) Vazhakulam-686670 Muvattupuzha, Ernakulam, Kerala. Tel.: 0485-2260832, 9446010905, Email: [email protected], Web: prsvkm.kau.in
14 Laboratory Manual of Biochemistry
carried out in the biochemistry lab, water purified by ion-exchange, reverse osmosis, or distillation is
usually acceptable. Of these three processes, distillation is the slowest, least energy efficient, least pure
and most high maintenance especially in areas with hard water (needs regular de-scaling). Distilled
water must also be stored to prevent contamination by microbes. For special procedures such as buffer
standardization, liquid chromatography, and tissue culture, ultra-pure water, which is usually bottled
and available commercially, should be used. Water that is purified only by ion-exchange will be low in
metal-ion concentration, but may contain certain organics that are washed from the ion-exchange resin.
These contaminants will increase the UV-absorbance properties of water. If sensitive UV-spectroscopic
measurements are to be made, distilled water is better than de-ionized. If large volumes of high-purity
water are required reverse osmosis should be the choice.
2.6.2. Cleaning Laboratory Glassware
The results of your experimental work will depend, to a great extent, on the cleanliness of your
equipment, especially glassware used for preparing and transferring solutions. There are at least two
important reasons for this: (1) many of the chemicals and biochemicals will be used in milligram,
microgram, or even nanogram amounts. Any contamination, whether on the inner walls of a beaker, in a
pipette, or in a glass cuvette, could be a significant percentage of the total experimental sample; (2)
many biochemicals and biochemical processes are sensitive to one or more of the following common
contaminants: metal ions, detergents, and organic residues. The preferred method for cleaning
glassware is to begin with hot tap water. Rinse the glassware at least 10 times with this; then rinse 4–6
times with distilled or de-ionized water. Occasionally it is necessary to use a detergent for cleaning. Use
a dilute detergent solution (0.5% in water) followed by 5–10 water rinses with distilled or de-ionized
water. When you needed dry glassware in the organic laboratory, you probably rinsed the glassware
with Acetone, which rapidly evaporated, leaving a dry surface. But, this technique coats the surface with
an organic residue consisting of nonvolatile contaminants found in the Acetone. Because this residue
could interfere with your experiments, it is best to refrain from acetone washing. Never clean cuvettes
or any optically polished glassware with ethanolic KOH or other strong base, as this will cause etching.
All glass cuvettes should be cleaned carefully with hot tap water or 0.5% detergent solution, in a
sonicator bath or in a cuvette washer, followed by thorough rinsing with purified water.
2.6.3. Solutions: Concentrations
The concentrations for solutions used in the biochemistry laboratory may be expressed in several
different units. The most common units are:
Molarity (M): concentration based on the number of moles of solute per litre of solution.
Percent by weight (% wt/wt): concentration based on the number of grams of solute per 100 g
of solution.
Percent by volume (% wt/vol): concentration based on the number of grams of solute per 100
ml of solution.
Weight per volume (wt/vol): concentration based on the number of grams, milligrams, or
micrograms of solute per unit volume.

Joy P P, Surya S. and Aswathy C. 2015. Pineapple Research Station (Kerala Agricultura l University) Vazhakulam-686670 Muvattupuzha, Ernakulam, Kerala. Tel.: 0485-2260832, 9446010905, Email: [email protected], Web: prsvkm.kau.in
15 Laboratory Manual of Biochemistry
2.6.4. Preparing and Storing Solutions
In general, solid solutes should be weighed on weighing paper or plastic weighing boats, with the use of
an electronic analytical or top-loading balance. Liquids are more conveniently dispensed by volumetric
techniques; however, this assumes that the density is known. If a small amount of a liquid is to be
weighed, it should be added to a tared flask by means of a disposable Pasteur pipette with a latex bulb.
The storage conditions of reagents and solutions in the biochemistry lab are especially critical. It is good
practice to store all solutions in a closed container. Often it is necessary to store some solutions in a
refrigerator at 4oC. This inhibits bacterial growth and slows decomposition of the reagents. Some
solutions may require storage below 0oC. Stored solutions must always have a label containing the name
and concentration of the solution, the date prepared, and the name of the preparer. All stored
containers, whether at room temperature, or below freezing, must be properly sealed. This reduces
contamination by bacteria and vapours in the laboratory air (Carbon dioxide, Ammonia, HCl, etc.).
Volumetric flasks, of course, have glass stoppers, but test tubes, Erlenmeyer flasks, bottles, and other
containers should be sealed with screw caps, corks, or hydrocarbon foil (Parafilm). Remember that
hydrocarbon foil, a wax, is dissolved by solutions containing non-polar organic solvents like Chloroform,
Diethyl ether, and Acetone. Bottles of pure chemicals and reagents should also be properly stored.
2.7. Quantitative Transfer of Liquids
2.7.1. Pipettes Fillers
The use of any pipette requires some means of drawing reagent into the
pipette. Liquids should never be drawn into a pipette by mouth suction on
the end of the pipette! Small latex bulbs are available for use with
disposable pipettes. For volumetric and graduated pipettes, two types of
bulbs are available. The features are special conical fitting that
accommodates common sizes of pipettes.
To use these, first place the pipette tip below the surface of the liquid. Squeeze the bulb with the left
hand and then hold it tightly to the end of the pipette. Slowly release the pressure on the bulb to allow
liquid to rise to 2 or 3 cm above the top graduated mark. Then, remove the bulb and quickly grasp the
pipette with your index finger over the top end of the pipette. The level of solution in the pipette will fall
slightly, but should not fall below the top graduated mark. If it does fall too low, use the bulb to refill.
2.7.1.1. Safety Pipette Fillers
Mechanical pipette fillers (made of silicone and somet imes called safety pipette fillers, propipettes, or
pi-fillers) are more convenient than latex bulbs. These fillers are equipped with a system of hand-
operated valves and can be used for the complete transfer of a liquid.
The three valves (A valve, S valve and E valve) release air, draw liquid in to the pipette, and accurately
release liquid.
Never allow any solvent or solution to enter the pipette bulb! To avoid this, two things must be kept in
mind:
Fig.7. Pipette Fillers

Joy P P, Surya S. and Aswathy C. 2015. Pineapple Research Station (Kerala Agricultura l University) Vazhakulam-686670 Muvattupuzha, Ernakulam, Kerala. Tel.: 0485-2260832, 9446010905, Email: [email protected], Web: prsvkm.kau.in
16 Laboratory Manual of Biochemistry
1. Always maintain careful control while using valve S to fill the pipette.
2. Never use valve S unless the pipette tip is below the surface of the liquid. If the tip moves above the
surface of the liquid, air will be sucked into the pipette and solution will be flushed into the bulb.
2.7.2. Pipettes
2.7.2.1. Disposable Pasteur Pipettes
Often it is necessary to perform a semi-quantitative transfer of a small
volume (1–10 ml) of liquid from one vessel to another. Because pouring
is not efficient, a Pasteur pipette with a small latex bulb may be used.
Pasteur pipettes are available in two lengths (15 and 23 cm) and hold
about 2 ml of solution. Used disposable pipettes should be discarded in
special containers for broken glass.
2.7.2.2. Calibrated Pipettes
When a quantitative transfer of a specific and accurate volume of liquid is required, some form of
calibrated pipette must be used.
2.7.2.2.1. Volumetric Pipettes
Used for the delivery of liquids required in whole-millilitre amounts
(1, 2, 5, 10, 15, 20, 25, 50, and 100 ml). To use these pipettes, draw
liquid with a latex bulb or mechanical pipette filler to a level 2–3 cm
above the fill line. Release liquid from the pipette until the bottom
of the meniscus is directly on the fill line. Touch the tip of the
pipette to the inside of the glass wall of the container from which it
was filled.
Transfer the pipette to the inside of the second container and release the liquid. Hold the pipette
vertically; allow the solution to drain until the flow stops, and then wait an additional 5–10 seconds.
Touch the tip of the pipette to the inside of the container to release the last drop from the outside of
Fig.9. Disposable Pasteur Pipettes
Fig.10. Volumetric Pipettes
Fig.8. Safety Pipette Fillers

Joy P P, Surya S. and Aswathy C. 2015. Pineapple Research Station (Kerala Agricultura l University) Vazhakulam-686670 Muvattupuzha, Ernakulam, Kerala. Tel.: 0485-2260832, 9446010905, Email: [email protected], Web: prsvkm.kau.in
17 Laboratory Manual of Biochemistry
the tip. Remove the pipette from the container. Some liquid may still remain in the tip. Most volumetric
pipettes a e ali ated as TD To Deliver), which means the intended volume is transferred without
final blow-out; that is; the pipette delivers the correct volume.
Fractional volumes of liquid are transferred with graduated pipettes, which are available in two types:
2.7.2.2.2. Mohr Pipettes
Mohr pipettes are available in long- or short-tip styles. All Mohr pipettes
are TD, and they are available in many sizes (0.1 to 10 ml). The use of a
Mohr pipette is similar to that of a volumetric pipette.
2.7.2.2.3. Serological Pipettes
Serological pipettes are similar to Mohr pipettes, except that they are
graduated downward to the very tip and are designed for blowout. Their
use is identical to that of a Mohr pipette except that the last bit of solution
remaining in the tip must be forced out into the receiving container with a
rubber bulb. This final blow-out should be done after 15–20 seconds of
draining.
2.7.3. Cleaning and Drying Pipettes
Special procedures are required for cleaning glass pipettes. Immediately after use, every pipette sho uld
be placed, tip up, in a vertical cylinder containing warm tap water or a dilute detergent solution (less
than 0.5%). The pipette must be completely covered with solution. This ensures that any reagent
remaining in the pipette is forced out through the tip. If reagent solutions are allowed to dry inside a
pipette, the tips can easily become clogged and are very difficult to open. After several pipettes have
accumulated in the water or detergent solution, the pipettes should be transferred to a pipette rinser.
Pipette rinsers continually cycle fresh water through the pipettes. Immediately after detergent wash,
tap water may be used to rinse the pipettes, but distilled water should be used for the final rinse.
Pipettes may then be dried in an oven.
2.7.4. Automatic Pipetting Devices / Micropipettes
For most quantitative transfers, including many repeated small-volume transfers, a mechanical
microlitre pipettor (i.e., Eppendorf type, Pipetteman) is ideal. This allows accurate, precise, and rapid
dispensing of fixed volumes from 1 to 10,000 µl . to l . The pipette s push-button system can
be operated with one hand, and it is fitted with detachable polypropylene tips. The advantage of
polypropylene tips is that the amount of reagent film remaining in the pipette after delivery is much less
than for glass tips.
Fig.11. Mohr Pipettes
Fig.12. Serological Pipettes

Joy P P, Surya S. and Aswathy C. 2015. Pineapple Research Station (Kerala Agricultura l University) Vazhakulam-686670 Muvattupuzha, Ernakulam, Kerala. Tel.: 0485-2260832, 9446010905, Email: [email protected], Web: prsvkm.kau.in
18 Laboratory Manual of Biochemistry
How to use an adjustable pipetting device?
Set the desired volume with the digital micrometer or plunger button. Attach a new disposable tip to
the shaft of the pipette. Press tip on firmly with a slight twisting motion. Depress the plunger to the first
positive stop, immerse the disposable tip into the sample liquid to a depth of 2–4 mm, and allow the
pushbutton to return slowly to the up position and wait 1–2 seconds. To dispense sample, place the tip
end against the side wall of the receiving vessel and depress the plunge slowly to the first stop. Wait 2–3
seconds, and then depress the plunger to the second stop to achieve final blow-out. Withdraw the
device from the vessel carefully with the tip sliding along the inside wall of the vessel. Allow the plunger
to return to the up position. Discard the tip by depressing the tip ejector button.
Fig.13. Automatic Pipetting Device / Micropipette
A-C, three positions of the button of the pipette
D-H, liquid handling with pipettes
D, adjusting the volume
E, fastening an appropriate tip
F, drawing of the liquid
G, transferring the liquid into an Eppendorf tube
H, dispensing the liquid

Joy P P, Surya S. and Aswathy C. 2015. Pineapple Research Station (Kerala Agricultura l University) Vazhakulam-686670 Muvattupuzha, Ernakulam, Kerala. Tel.: 0485-2260832, 9446010905, Email: [email protected], Web: prsvkm.kau.in
19 Laboratory Manual of Biochemistry
2.8. Statistical Analysis of Experimental Data
2.8.1. Statistical Analysis
An error in an experimental measurement is defined as a deviation of an observed value from the true
value. There are two types of errors, determinate and indeterminate. Determinate errors are those that
can be controlled by the experimenter and are associated with malfunctioning equipment, improperly
designed experiments, and variations in experimental conditions. These are sometimes called human
errors because they can be corrected or at least partially alleviated by careful design and performance
of the experiment. Indeterminate errors are those that are random and cannot be controlled by the
experimenter.
Two statistical terms involving error analysis that are often used and misused are accuracy and
precision. Precision refers to the extent of agreement among repeated measurements of an
experimental value. Accuracy is defined as the difference between the experimental value and the true
value for the quantity. Because the true value is seldom known, accuracy is better defined as the
difference between the experimental value and the accepted true value. Several experimental
measurements may be precise (that is, in close agreement with each other) without being accurate. If an
infinite number of identical, quantitative measurements could be made on a biosystem, this series of
numerical values would constitute a statistical population. The average of all of these numbers would be
the true value of the measurement. The alternative is to obtain a relatively small sample of data, which
is a subset of the infinite population data. The significance and precision of these data are then
determined by statistical analysis.
2.8.2. The Mean, Sample Deviation, and Standard Deviation
The arithmetic average, or mean, of the numbers is calculated by totaling all the experimental values
observed for a sample (the counting rates, the velocity of the reaction, or protein concentration) and
dividing the total by the number of times the measurement was made. Sample deviation is defined as
the difference between the value for an observation and the mean value. A more useful statistical term
for error analysis is standard deviation, a measure of the spread of the observed values.
2.8.3. Spreadsheet Statistics
A spreadsheet is an interactive computer application program for organization, analysis and storage of
data in tabular form. It is common practice today to use computer spreadsheet programs for statistical
analysis of biochemical data. The graphing abilities of spreadsheets make it easy to inspect data for
errors and outliers, look for nonlinear relationships and non-normal distributions, and display the final
results. Even to use something like SPSS, SAAS and SyStat, there will be many times when it s easier to
enter the data in to a spreadsheet first, inspect it for errors, sort and arrange it, then export it in to a
format suitable for statistics package.

Joy P P, Surya S. and Aswathy C. 2015. Pineapple Research Station (Kerala Agricultura l University) Vazhakulam-686670 Muvattupuzha, Ernakulam, Kerala. Tel.: 0485-2260832, 9446010905, Email: [email protected], Web: prsvkm.kau.in
20 Laboratory Manual of Biochemistry
C. Biochemistry Lab Techniques
3. Basic Instrumentation Practices
3.1. Mortar and Pestle
General Description
A mortar and pestle can be used to prepare ingredients or substances by
crushing and grinding them in to a fine paste or powder. The mortar is a bowl,
typically made of hard wood, ceramic or stone. The pestle is a heavy and blunt
club shaped object, the end of which is used for crushing and grinding. The
substance to be ground is placed in the mortar and ground, crushed or mixed
using the pestle.
3.2. Desiccator
General Description
Desiccators are sealable enclosures containing desiccants used for
preserving moisture sensitive items. A common use for desiccators is to
protect chemicals which are hygroscopic or which react with water
from humidity. Desiccators are sometimes used to remove traces of water
from an almost dry sample. To prevent adsorption of moisture from the
surrounding air, glassware is cooled in desiccators.
Where, desiccators alone are unsatisfactory, the sample may be dried at
elevated temperature using Abderhalden's drying pistol.
Parts of a Desiccator
In laboratory use, the most common desiccators are circular and made of heavy glass. There is usually a
removable platform on which the items to be stored are placed. The desiccant, usually an otherwise
inert solid such as Silica gel, freshly calcined quicklime or Anhydrous Calcium chloride to absorb water,
fills the space under the platform. The ground glass rim of the desiccator lid must be greased with a thin
layer of Petroleum jelly or other lubricant to ensure an airtight seal. A stopcock may be included to
permit the desiccators to be evacuated. Suc h models are usually known as vacuum desiccators. When a
vacuum is to be applied, it is a common practice to criss cross the vacuum desiccators with tape, or to
place it behind a screen to minimize damage or injury caused by an implosion. To maintain a good seal,
vacuum grease is usually applied to the flanges.
3.3. Bunsen burner
General Description
A Bunsen burner, named after Robert Bunsen, is a common piece of laboratory
equipment that produces a single open glass flame, which is used for heating,
sterilization and combustion. The gas can be natural gas which is mainly Methane
or a liquefied petroleum gas, such as Propane, Butane or a mixture of both.
Fig.15. Vacuum desiccators
(left) & Desiccators (right)
Fig.14. Mortar and Pestle
Fig.16. Bunsen burner

Joy P P, Surya S. and Aswathy C. 2015. Pineapple Research Station (Kerala Agricultura l University) Vazhakulam-686670 Muvattupuzha, Ernakulam, Kerala. Tel.: 0485-2260832, 9446010905, Email: [email protected], Web: prsvkm.kau.in
21 Laboratory Manual of Biochemistry
Parts of a Bunsen burner
A Bunsen burner is made entirely of metal. In order to function properly, Bunsen burners must have:
(A) Barrel, that's approximately five inches long
(B) Collar with (C) air holes
(D)Gas intake
(E)Gas valve
(F)Stand, to keep all of the pieces from making
contact with a work surface.
Principle
The amount of air mixed with the gas stream affects the completeness of the combustion reaction. Less
air yields an incomplete and thus cooler reaction, while a gas stream well mixed with air provides
oxygen in an equimolar amount and thus a complete and hotter reaction. The air flow can be controlled
by opening or closing the slot openings at the base of the barrel.
Working
Once connected to a source of fuel, usually Methane, the Bunsen burner can be ignited with a spark.
Incoming gas reacts with oxygen in a one-to-three ratio to produce a blue flame that comes out of the
top of the barrel.
Adjusting the gas valve and on the Bunsen burner then changes the volume of gas flow; the more gas
entering the burner, the larger the flame. The collar at the base of the barrel contains air holes to
control the amount of oxygen reacting with the gas. The collar can be rotated to adjust oxygen intake. In
general, the more oxygen present, the more intense and blue the flame will be. Less oxygen lends to a
weaker yellow flame. The more oxygenated blue flame is both hotter and more controlled than the
oxygen-deprived flame; scientists generally prefer a controlled blue flame.
1. Air hole closed (safety flame used for lighting or default)
2. Air Hole slightly open
3. Air hole half open
4. Air hole fully opens (Roaring blue flame)
Fig.16.3. Bunsen burner flames depend on air flow in the
throat holes
This Fig.3.3.2 shows the burner producing two sets of blue flames. The
inner flame is a smaller and a brighter blue, while the other flame is
larger and a darker blue. The flame is hottest between the tip of the
smaller flame and the tip of the larger flame.
1 2 3 4
Fig.16.1. Parts of a Bunsen burner
Fig.16.2. Burner Flame

Joy P P, Surya S. and Aswathy C. 2015. Pineapple Research Station (Kerala Agricultura l University) Vazhakulam-686670 Muvattupuzha, Ernakulam, Kerala. Tel.: 0485-2260832, 9446010905, Email: [email protected], Web: prsvkm.kau.in
22 Laboratory Manual of Biochemistry
3.4. Micro Centrifuge
General Description
A micro centrifuge, also called a microfuge, is an important piece of lab
equipment; it is used to spin small (2 ml or less) liquid samples at high speeds
(generally tens of thousands times g-force).
Working
Choose a flat area on your table
Put the line chord into a suitable 220 V 50 Hz power plug
Timer can be set in pulse mode. Timed cycles from 1-15 minutes in increment of 1 minute and
continuous mode
The RESET- OFF key is to be pressed whenever time or rpm setting is to be changed.
An audible beep sounds at the beginning and on completion of the cycle
Points to Remember
After centrifugation wipe the inner chamber and keep open to be dried.
Clean the rotor after use. There are chances for any spill of liquids used.
Notice if any voltage fluctuation occurs.
It shows drive fault if any error occurs. In that case switch off and then enter the program.
Always make sure the required temperature is attained before the rotor starts.
3.5. Vortex mixer
General Description
A vortex mixer, or vortexer, is a simple device used commonly in laboratories to mix
small vials of liquid. The vortex mixer was invented by the Kraft brothers (Jack A.
Kraft and Harold D. Kraft). In a biochemical or analytical laboratory they may be
used to mix the reagents of an assay or to mix an experimental sample and
a dilutant.
Parts of a Vortex mixer
It consists of an electric motor with the drive shaft oriented vertically and attached to a cupped rubber
piece mounted slightly off-center. As the motor runs the rubber piece oscillates rapidly in a circular
motion.
Working
When a test tube or other appropriate container is pressed into the rubber cup (or touched to its edge)
the motion is transmitted to the liquid inside and a vortex is created. Most vortex mixers have variable
speed settings and can be set to run continuously, or to run only when downward pressure is applied to
the rubber piece.
Fig.18. Vortex mixer
Fig.17. Micro Centrifuge

Joy P P, Surya S. and Aswathy C. 2015. Pineapple Research Station (Kerala Agricultura l University) Vazhakulam-686670 Muvattupuzha, Ernakulam, Kerala. Tel.: 0485-2260832, 9446010905, Email: [email protected], Web: prsvkm.kau.in
23 Laboratory Manual of Biochemistry
3.6. Rotary Shaker
General Description
Rotary Shakers are ideal for mixing and development of cultures,
chemicals, solvents, assays, etc. and for production of basic chemicals,
pathological work, and various other applications. The shaker is also
widely used for shaking solutions in Erlenmeyer flasks.
Rotary Shaker extracting, dissolving slow-reacting samples; cultivation of cells; extraction of mineral oil
from soil, tissue culture for analytical diagnostics; de-aeration of tested biodegradable materials and
samples; rotating closed containers for dialysis in a circular fashion.
Components of a Rotary Shaker
A typical shaker has a table board that oscillates horizontally, powered by an electric motor. The liquids
to be stirred are held in beakers, jars, or Erlenmeyer flasks that are placed over the table; or, sometimes,
in test tubes or vials that are nested into holes in the plate. Orbital shakers also exist, that shake the
vessel in a circular fashion.
3.7. Homogenizer
General Description
A homogenizer is a piece of laboratory or industrial equipment used for the
homogenization of various types of material, such as tissue, plant, food, soil, and many
others. Homogenization is a very common sample preparation step prior to the analysis
of nucleic acids, proteins, cells, metabolism, pathogens, and many other targets.
Principle
High speed mechanical and hydraulic shear forces are real key to the success of this instrument. Rotor
and stator generates a shearing action which insures that materials being processed are subjected to
thousands of shearing actions each minute.
3.8. Fume hood
General Description
A fume hood or fume cupboard is a type of local ventilation device that
is designed to limit exposure to hazardous or toxic fumes,
vapours or dusts. A fume hood is typically a large piece of equipment
enclosing five sides of a work area, the bottom of which is most
commonly located at a standing work height. Two main types
exist, ducted and recirculating (ductless).
Principle
The speed of the air moving through the hood opening is known as face velocity. Air is drawn in from
the front (open) side of the cabinet, and either expelled outside the building or made safe
through filtration and fed back into the room.
Fig.19. Rotary Shaker
Fig.21. Fume hood
Fig.20. Homogenizer

Joy P P, Surya S. and Aswathy C. 2015. Pineapple Research Station (Kerala Agricultura l University) Vazhakulam-686670 Muvattupuzha, Ernakulam, Kerala. Tel.: 0485-2260832, 9446010905, Email: [email protected], Web: prsvkm.kau.in
24 Laboratory Manual of Biochemistry
Instrumentation
A fume hood structure is basically a cabinet, with an open side (or sides) for access to the interior of the
hood. A transparent, movable sash, allows the user to restrict or enlarge the fume hood opening. The
hood is connected, via ductwork, to an exhaust fan, usually located on the roof of the building in which
the hood is located. The exhaust fan draws air from the room in which the hood is in through the hood
opening and out through the ductwork.
3.9. Laminar Air Flow Cabinet
General Description
A laminar flow cabinet or laminar flow closet or tissue culture hood is
a carefully enclosed bench designed to prevent contamination of
semiconductor wafers, biological samples, or any particle sensitive
materials.
Principle
The principle behind laminar air flow is the passage of continuous air flow at uniform velocity. HEPA
filters designed to create a particle free working environment and provide product protection. Air taken
through the filtration system is then exhausted across the work surface. Commonly, the filtration system
comprises of a prefilter and a HEPA filter. The laminar air flow cabinet is enclosed on the sides and
constant positive air pressure is maintained to prevent the intrusion of contaminated room air.
Instrumentation
A laminar flow hood consists of a filter pad, a fan and a HEPA (High Efficiency Particulate Air) filter. The
fan sucks the air through the filter pad where dust is trapped. After that the prefiltered air has to pass
the HEPA filter where contaminating fungi, bacteria, dust etc. are removed. Now the sterile air flows
into the working (flasking) area where you can do all your flasking work without risk of contamination.
AUVC germicidal lamp to sterilize the interior and contents when not in use (It is important to switch
this light off during use, to limit exposure to skin and eyes as stray ultraviolet light emissions can cause
cancer and cataracts).
3.10. Electronic Weighing Balance
General Description
Balances are designed to meet the specific weighing requirement in
the laboratory working environment. These balances come in
precision designs and operating characteristics that allows making
quick and accurate measurements.
Principle
Electronic weighing balance accurately measures the weight of chemicals. Calibrate the balance by
internal calibration. Place the weighing boat and tare the weight. Wait till it becomes zero. Chemical
Fig.22. Laminar Air Flow Cabinet
Fig.23. Electronic Weighing Balance

Joy P P, Surya S. and Aswathy C. 2015. Pineapple Research Station (Kerala Agricultura l University) Vazhakulam-686670 Muvattupuzha, Ernakulam, Kerala. Tel.: 0485-2260832, 9446010905, Email: [email protected], Web: prsvkm.kau.in
25 Laboratory Manual of Biochemistry
should be weighed slo l a o di g to the eed. Wait till the s ol g sta ilizes e t to the eight shown.
Note
Always have the knowledge about the maximum and minimum quantity which can be weighed using the
balance. Never spill the chemicals on the weighing pan, if it happens wipe off with tissue. Switch off fan
and close windows nearby when working with it as it may cause fluctuations in the value due to
interaction with air density. Always use weigh boats or butter paper to weigh.
3.11. Magnetic Stirrer
General Description
Magnetic stirrer employs a rotating magnetic field to cause a stir bar (also called "flea") immersed in a
liquid to spin very quickly, thus stirring it. The rotating field may be created either by a
rotating magnet or a set of stationary electromagnets, placed beneath the vessel with the liquid.
A stir bar is the magnetic bar placed within the liquid which provides the stirring action. The stir bar's
motion is driven by another rotating magnet or assembly of electromagnets in the stirrer device,
beneath the vessel containing the liquid. Stir bars are typically coated in teflon, or less often in glass.
Components of a Magnetic Stirrer
A stirrer magnet placed in the liquid and a magnetic drive located outside the vessel. Bo th, stirrer
magnet and magnetic drive form a magnetic circuit. For trouble-free stirring in liquids with different
viscosities the magnetic drive shall have a wide range of different speeds.
Principle
In principle, it is difficult to find the most effective magnetic stirring bar for a particular application, but
important factors are the vessel shape and the viscosity of the stirring medium. The ideal configuration
is where the magnet of the stirring bar and the magnet of the drive are of equal length and with a
minimum distance between them.
Fig.24. Magnetic Stirrer Fig.24.1. Stir bars

Joy P P, Surya S. and Aswathy C. 2015. Pineapple Research Station (Kerala Agricultura l University) Vazhakulam-686670 Muvattupuzha, Ernakulam, Kerala. Tel.: 0485-2260832, 9446010905, Email: [email protected], Web: prsvkm.kau.in
26 Laboratory Manual of Biochemistry
3.12. Water Bath
General Description
A water bath is made from a container filled with heated water. It is
used to incubate samples in water at a constant temperature over a
long period of time. All water baths have a digital or
an analogue interface to allow users to set a desired temperature.
Utilizations include warming of reagents, melting of substrates or incubation of cell cultures. It is also
used to enable certain chemical reactions to occur at high temperature. Water bath is a preferred heat
source for heating flammable chemicals instead of an open flame to prevent ignition. Different types of
water baths are used depending on application. For all water baths, it can be used up to 99.9°C.
Principle
It is a system for the control of temperature in which a vessel containing the material to be heated is set
into or over one containing water and receiving the heat directly.
Working
It has a double walled, outer body made of MS sheet, powder coated, inner body made of stainless
steel, and 304 quality sheet glass wool insulation, fitted with 30oC to 110oC thermostat. By means of
these, heat is transferred to the medium (water or oil) until reaching the temperature selected with a
control device (thermostat or similar). It is provided with concentric rings with a diameter of 75 mm
suitable to work on 220V AC supply. It is accompanied with a digital display temperature controller. In
general they use water, but some baths use oil.
Before using the water bath, verify that it is clean and that accessories needed are installed. The steps
normally followed are:
Fill the water bath with fluid to keep the temperature constant (water or oil). Verify that once
the containers to be heated are placed, the fluid level is between 4 and 5 cm from the top of the
tank.
Install the control instruments needed, such as thermometers and circulators. Use additional
mounts provided fo this pu pose. Ve if the positio of the the o ete s ul o the al probe to ensure that the readings are correct.
If water is used as the warming fluid, verify that it is clean. Some manufacturers recommend
adding products which prevent the formation of fungus or algae.
Put the main switch No.1 in the ON position (the numbers identifying the controls herein
correspond to those shown in the diagram). Some manufacturers have incorporated controls
with microprocessors which initiate auto-verification routines once the ON switch is activated.
Select the operation temperature using the menu No.2 buttons and the buttons for adjusting
the parameters.
Select the cut-off temperature (in water baths with this control). This is a safety control which
cuts off the supply of electricity if it exceeds the selected temperature. This is selected also by
using the menu button and is controlled by the parameter adjustment buttons.
Fig.25. Water Bath

Joy P P, Surya S. and Aswathy C. 2015. Pineapple Research Station (Kerala Agricultura l University) Vazhakulam-686670 Muvattupuzha, Ernakulam, Kerala. Tel.: 0485-2260832, 9446010905, Email: [email protected], Web: prsvkm.kau.in
27 Laboratory Manual of Biochemistry
Avoid using the water bath with the substances indicated below:
Bleach
Liquids with high Chlorine content
Weak saline solutions such as Sodium chloride, Calcium chloride or chromium compounds
Strong concentrations of any acid
Strong concentrations of any salt
Weak concentrations of Hydrochloric, Hydrobromic, Hydroiodic, Sulphuric or Chromic acids
Deionised water, as it causes corrosion and perforation in the stainless steel
Safety
Avoid the use of the water bath in environments where there are flammable and combustible
materials. The equipment has components (resistors generating very high temperatures) which
could start an accidental fire or explosion.
Always connect the equipment to an electrical outlet with a ground pole to protect the user and
the equipment from electrical discharges.
Use the water bath exclusively with non-corrosive or non-flammable liquids.
When working with substances that generate vapours, place the water bath under a chemical
hood or in a well-ventilated area.
Remember that liquids incubated in the water bath tank can produce burns if hands are
inadvertently placed inside it.
Take into account that the water bath is designed for use with a liquid inside the tank. If the
inside is dry, the temperature of the tank can become very high. Use the diffusing tray for
placing the container inside of the filled tank of the water bath. This has been designed for
distributing the temperature in a uniform way.
Avoid using the water bath if any of its controls is not working, e.g. the temperature or limit
controls.
Cleaning
Frequency: Monthly
Turn off and disconnect the equipment. Wait until it cools to avoid the risk of burns and
accidents.
Remove the fluid used for heating. If it is water, it can be poured through a siphon. If it is oil;
collect into a container with an adequate capacity.
Remove the thermal diffusion grid located at the bottom of the tank.
Disassemble the circulator and clean to remove scale and potential algae present.
Clean the interior of the tank with a mild detergent. If there is any indication of corrosion, use
substances for cleaning stainless steel. Rub lightly with synthetic sponges or equivalent. Avoid
using steel wool to remove rust stains as these leave particles of steel which could accelerate
corrosion.
Avoid bending or striking the temperature control capillary tube generally located at the bottom
of the tank.
Clean the exterior and interior of the water bath with clean water.

Joy P P, Surya S. and Aswathy C. 2015. Pineapple Research Station (Kerala Agricultura l University) Vazhakulam-686670 Muvattupuzha, Ernakulam, Kerala. Tel.: 0485-2260832, 9446010905, Email: [email protected], Web: prsvkm.kau.in
28 Laboratory Manual of Biochemistry
3.13. pH Meter
General Description
pH meter used for potentiometrically measuring the pH, which is either
the concentration or the activity of hydrogen ions, of an aqueous
solution. It usually has a glass electrode plus a calomel reference
electrode, or a combination electrode. pH meters are usually used to
measure the pH of liquids, though special probes are sometimes used
to measure the pH of semi-solid substances.
Components of a pH meter
Basic potentiometric pH meters simply measure the voltage between two electrodes and display the
result converted into the corresponding pH value. They comprise a simple electronic amplifier and a pair
of probes, or a combination probe, and some form of display calibrated in pH. The probe is the key part;
it is a rod-like structure usually made of glass, with a bulb containing the sensor at the bottom. Frequent
calibration with solutions of known pH, perhaps before each use, ensures the best accuracy. To measure
the pH of a solution, the probe is dipped into it.
Principle
pH measurement is based on the use of a pH sensitive electrode (usually glass), a reference electrode,
and a temperature element to provide a temperature signal to the pH analyzer. The pH electrode uses a
specially formulated, pH sensitive glass in contact with the solution, which develops a potential (voltage)
proportional to the pH of the solution. The reference electrode is designed to maintain a constant
potential at any given temperature, and serves to complete the pH measuring circuit within the solution.
It provides a known reference potential for the pH electrode. The difference in the potentials of the pH
and reference electrodes provides a millivolt signal proportional to pH.
Working
Turn on pH Meter. Lift up the electrode and clean the electrode tip by pressing with tissue
paper.
Calibrate using buffer 4±0.01 and buffer 7±0.01
The buffers should come to the room temperature before calibration.
Place the electrode in the solution to know the pH.
If there is an increase in pH, stabilize it with adding 0.1N HCl which lowers the pH. If there is a
decrease in pH, stabilize it with adding 0.1N NaOH which increases the pH.
Add acid or alkali drop by drop and always stir well the solution with glass rod after each
addition.
Note
‘ead the pH he √A appea s. Always keep the electrode dipped in 3 mol/l KCl solution, never leave the electrode dry.
Be cautious about the electrode level displayed on the screen. It symbolizes the fitness of
electrode. Any kind of unusual appearance can cause pH fluctuation.
Buffer solutions should always be clear without any turbidity or mycelia growth. Same is the
case if the buffer is used to protect electrode.
Fig.26.pH Meter

Joy P P, Surya S. and Aswathy C. 2015. Pineapple Research Station (Kerala Agricultura l University) Vazhakulam-686670 Muvattupuzha, Ernakulam, Kerala. Tel.: 0485-2260832, 9446010905, Email: [email protected], Web: prsvkm.kau.in
29 Laboratory Manual of Biochemistry
Always prepare fresh buffer solutions every month for calibration.
Always prepare buffer solutions in sterile water.
Never mishandle the electrode like using it for stirring the solutions.
Always use sterile water to clean the electrode after dipping it in solutions.
Never place the electrode in solutions which are in extreme temperature conditions.
No hurry should be there for reading the pH.
Do not forget to make entry with appropriate comments in the log book.
The equipment and its premises should be clean if there is any spill.
3.14. Microscope
General Description
A microscope is an instrument used to see objects that are too small for the
naked eye. The science of investigating small objects using such an instrument is
called microscopy.
The most commonly used microscope for general purposes is the standard compound microscope. It
magnifies the size of the object by a complex system of lens arrangement.
Principle
It has a series of two lenses; (i) the objective lens close to the object to be observed and (ii) the ocular
lens or eyepiece, through which the image is viewed by eye. Light from a light source (mirror or electric
lamp) passes through a thin transparent object. The o je ti e le s p odu es a ag ified eal i age (first image) of the object. This image is again magnified by the ocular lens (eyepiece) to obtain a
ag ified i tual i age fi al i age , hi h a e see e e th ough the e epie e. As l ight passes
directly from the source to the eye through the two lenses, the field of vision is brightly illuminated.
That is why; it is a bright-field microscope.
Fig.27. Microscope
Fig.27.1. Working Principle of a Microscope

Joy P P, Surya S. and Aswathy C. 2015. Pineapple Research Station (Kerala Agricultura l University) Vazhakulam-686670 Muvattupuzha, Ernakulam, Kerala. Tel.: 0485-2260832, 9446010905, Email: [email protected], Web: prsvkm.kau.in
30 Laboratory Manual of Biochemistry
Parts of a Microscope
(I)Mechanical Parts: These are the parts, which support the optical parts and help in their adjustment
for focusing the object.
Base or Metal Stand: The whole microscope rests on this base. Mirror, if present, is fitted to it.
Pillars: It is a pair of elevations on the base, by which the body of the microscope is held to t he
base.
Inclination joint: It is a movable joint, through which the body of the microscope is held to the
base by the pillars. The body can be bent at this joint into any inclined position, as desired by the
observer, for easier observation.
Curved Arm: It is a curved structure held by the pillars. It holds the stage, body tube, fine
adjustment and coarse adjustment.
Body Tube: It is usually a vertical tube holding the eyepiece at the top and the revolving
nosepiece with the objectives at the bottom. The le gth of the d a tu e is alled e ha i al tu e le gth a d is usuall -180 mm (mostly 160 mm).
Draw Tube: It is the upper part of the body tube, slightly narrower, into which the eyepiece is
slipped during observation.
Coarse Adjustment: It is a knob with rack and pinion mechanism to move the body tube up and
down for focusing the object in the visible field. As rotation of the knob through a small angle
moves the body tube through a long distance relative to the object, it can perform coarse
adjustment.
Fine Adjustment: It is a relatively smaller knob. Its rotation through a large angle can move the
body tube only through a small vertical distance. It is used for fine adjustment to get the final
clear image.
Stage: It is a horizontal platform projecting from the curved arm. It has a hole at the centre,
upon which the object to be viewed is placed on a slide. Light comes from the light source below
the stage passes through the object into the objective.
Mechanical Stage (Slide Mover): Mechanical stage consists of two knobs with rack and pinion
mechanism. The slide containing the object is clipped to it and moved on the stage in two
dimensions by rotating the knobs, so as to focus the required portion of the object.
Revolving Nosepiece: It is a rotatable disc at the bottom of the body tube with three or four
objectives screwed to it. The objectives have different magnifying powers. Based on the
required magnification, the nosepiece is rotated, so that only the objective specified for the
required magnification remains in line with the light path.
(II) Optical Parts: These parts are involved in passing the light through the object and magnifying its size.
Light Source: Modern microscopes have in-built electric light source in the base. The source is
connected to the mains through a regulator, which controls the brightness of the field.
Diaphragm: If light coming from the light source is brilliant and all the light is allowed to pass to
the object through the condenser, the object gets brilliantly illuminated and cannot be
visualized properly. Therefore, an iris diaphragm is fixed below the condenser to control the
amount of light entering into the condenser.
Condenser: The condenser or sub-stage condenser is located between the light source and the
stage. It has a series of lenses to converge on the object, light rays coming from the light source.
After passing through the object, the light rays enter into the objective.

Joy P P, Surya S. and Aswathy C. 2015. Pineapple Research Station (Kerala Agricultura l University) Vazhakulam-686670 Muvattupuzha, Ernakulam, Kerala. Tel.: 0485-2260832, 9446010905, Email: [email protected], Web: prsvkm.kau.in
31 Laboratory Manual of Biochemistry
The light o de si g , light o e gi g o light gathe i g apa it of a o de se is alled u e i al ape tu e of the o de se . “i ila l , the light gathe i g apa it of a o je ti e is alled u e i al ape tu e of the o je ti e . If the o de se o e ges light i a ide a gle, its u e i al aperture is
greater and vice versa.
There are three types of condensers as follows:
(a) Abbe condenser (Numerical aperture=1.25): It is extensively used.
(b) Variable focus condenser (Numerical aperture =1.25)
(c) Achromatic condenser (Numerical aperture =1.40): It has been corrected for both spherical
and chromatic aberration and is used in research microscopes and photomicrographs.
Objective: It is the most important lens in a microscope. Usually three objectives with different
magnifying powers are screwed to the revolving nosepiece.
The objectives are:
(a) Low power objective (X 10): It produces ten times magnification of the object.
(b) High dry objective (X 40): It gives a magnification of forty times.
(c) Oil-immersion objective (X100): It gives a magnification of hundred times, when immersion
oil fills the space between the object and the objective.
The scanning objective (X4) is optional. The primary magnification (X4, X10, X40 or X100) provided by
each objective is engraved on its barrel. The oil-immersion objective has a ring engraved on it towards
the tip of the barrel.
3.15. Refra to eter A e’s Ha d Refra to eter
General Description
A refractometer is an optical instrument that is used to determine the refractive
index of a substance, measuring how light is bent as it moves through the
substance.
Principle
The instrument works on the critical angle principle, utilizing lenses and prisms to project a shadow line
onto a small glass reticle inside the refractometer, which is then viewed by the inspector through a
magnifying eyepiece.
The Fig.3.15.1 shows light enters from the left and passes through the liquid sample. When the light hits
the prism at the bottom of the liquid, it suddenly is slowed more than in the liquid because the prism
has a higher refractive index.
Fig.28. Refractometer

Joy P P, Surya S. and Aswathy C. 2015. Pineapple Research Station (Kerala Agricultura l University) Vazhakulam-686670 Muvattupuzha, Ernakulam, Kerala. Tel.: 0485-2260832, 9446010905, Email: [email protected], Web: prsvkm.kau.in
32 Laboratory Manual of Biochemistry
In the case of a refractometer, the light bends in proportion to the liquid's refractive index. As the light
then travels down the refractometer, it passes through lenses and lands on a scale. The bending of the
light at the liquid/prism interface sends the light higher or lower in the scale's grid. Observer then looks
through the viewfinder on the other end and read where the light is falling on the scale. Light covers a
portion of the scale, and the remainder is dark. The dividing line between light and dark is the place to
read the scale. Calibration is accomplished by turning the calibration screw, which raises or lowers the
reticle (the scale) relative to the path of the light.
Working
Operation consists of placing 1 or 2 drops of the water sample on the prism, closing a glass plate over
the sample, then looking through the eyepiece for the reading. The water sample is sandwiched
between the measuring prism and the cover plate. Light traveling through the sample is either passed
through or totally internally reflected. The net effect is that a shadow line is formed between the
illuminated area and the dark area. It is at the point that this shadow line crosses the scale that a
reading is taken.
3.16. Crude Fibre Apparatus
General Description
Crude fibre apparatus is used in the determination of crude fibre in
feed, food and other agricultural products. The Apparatus is a reflux
condenser designed to operate with speed and accuracy. The
procedure involves subjecting a sample to the stimulated action of the
digestion system. Samples are boiled in acid and washed and then
boiled in alkali and washed again. Remaining solids are isolated and
termed insoluble fibre or crude fibre - the indigestible parts of
agricultural products such as cellulose and other materials.
Principle
Crude fibre refers to the residue of a feed that is insoluble after successive boiling with dilute acid and
alkali. I the Wee de s ethod he the sa ple is su je ted to a id a d alkali digestio , e o tain a
Fig.28.1 Working Principle of a Refractometer
Fig.29. Crude Fibre Apparatus

Joy P P, Surya S. and Aswathy C. 2015. Pineapple Research Station (Kerala Agricultura l University) Vazhakulam-686670 Muvattupuzha, Ernakulam, Kerala. Tel.: 0485-2260832, 9446010905, Email: [email protected], Web: prsvkm.kau.in
33 Laboratory Manual of Biochemistry
residue comprising ash (mineral matter) of the feed and the resistant fraction of carbohydrate. When
the residue is ignited the organic matter gets oxidized leaving the inorganic residue or ash. Thus the
difference in weight of the residue before and after ashing gives the weight of crude fibre.
Instrumentation
Manifold Assembly- The hood features a molded, 6" diameter exhaust connection sized to allow
for a minimum of static pressure loss through the hood structure and one that still can provide a
good transport velocity through the exhaust system.
Condenser Head System- These cone shaped heads located above each heater provide an
essential part of the digestion process. The vapours from the boiling digestion medium are
condensed on the condenser heads and returned to the medium continually washing the sides
of the beakers in the process.
Heater System- Each 350 watt adjustable spring loaded heater provides an even distribution of
heat through the use of coiled heater wires embedded in a ceramic material.
Variable Heat Control Switch- Provides variable input from 20-100% of capacity to each heater.
Elevation Control Knob- Adjusts beakers positions.
Main Power Switch- Turn apparatus on and off without need of changing variable heat control
switches.
3.17. Soxhlet Extractor
General Description
A Soxhlet extractor is a piece of laboratory apparatus invented in 1879 by Franz von Soxhlet. It was
originally designed for the extraction of a lipid from a solid material. Typically, a Soxhlet extraction is
used when the desired compound has a limited solubility in a solvent, and the impurity is insoluble in
that solvent. It allows for unmonitored and unmanaged operation while efficiently recycling a small
amount of solvent to dissolve a larger amount of material.
Principle
The solvent is heated to reflux. The solvent vapour travels up a distillation arm and floods into the
chamber housing the thimble of solid. The condenser ensures that any solvent vapour cools, and drips
back down into the chamber housing the solid material. The chamber containing the solid material
slowly fills with warm solvent. Some of the desired compound dissolves in the warm solvent. When the
Soxhlet chamber is almost full, the chamber is emptied by the siphon. The solvent is returned to
the distillation flask. The thimble ensures that the rapid motion of the solvent does not transport any
solid material to the still pot. This cycle may be allowed to repeat many times, over hours or days.
During each cycle, a portion of the non-volatile compound dissolves in the solvent. After many cycles the
desired compound is concentrated in the distillation flask.
Instrumentation
A Soxhlet extractor has three main sections: A percolator (boiler and reflux) which circulates the solvent,
a thimble (usually made of thick filter paper) which retains the solid to be laved, and a siphon
mechanism, which periodically empties the thimble.

Joy P P, Surya S. and Aswathy C. 2015. Pineapple Research Station (Kerala Agricultura l University) Vazhakulam-686670 Muvattupuzha, Ernakulam, Kerala. Tel.: 0485-2260832, 9446010905, Email: [email protected], Web: prsvkm.kau.in
34 Laboratory Manual of Biochemistry
Working
Normally a solid material containing some of the desired compound is placed inside a thimble made
from thick filter paper, which is loaded into the main chamber of the Soxhlet extractor. The Soxhlet
extractor is placed onto a flask containing the extraction solvent. The Soxhlet is then equipped with a
condenser. The solvent is heated to reflux. The solvent vapour travels up a distillation arm and floods
into the chamber housing the thimble of solid. The condenser ensures that any solvent vapour cools,
and drips back down into the chamber housing the solid material. The chamber containing the solid
material slowly fills with warm solvent. Some of the desired compound will then dissolve in the warm
solvent. When the Soxhlet chamber is almost full, the chamber is automatically emptied by a siphon side
arm, with the solvent running back down to the distillation flask. This cycle may be allowed to repeat
many times, over hours or days. During each cycle, a portion of the non-volatile compound dissolves in
the solvent. After many cycles the desired compound is concentrated in the distillation flask. The
advantage of this system is that instead of many portions of warm solvent being passed through the
sample, just one batch of solvent is recycled. After extraction the solvent is removed, typically by
meansof a rotary evaporator, yielding the extracted compound. The insoluble portion of the extracted
solid remains in the thimble, and is usually discarded.
1: Stirrer bar
2: Still pot (the still pot should not be
overfilled and the volume of solvent in the
still pot should be 3 to 4 times the volume of
the Soxhlet chamber)
3: Distillation path
4: Thimble
5: Solid
6: Siphon top
7: Siphon exit
8: Expansion adapter
9: Condenser
10: Cooling water in
11: Cooling water out
Fig.30. Parts of a Soxhlet Extractor

Joy P P, Surya S. and Aswathy C. 2015. Pineapple Research Station (Kerala Agricultura l University) Vazhakulam-686670 Muvattupuzha, Ernakulam, Kerala. Tel.: 0485-2260832, 9446010905, Email: [email protected], Web: prsvkm.kau.in
35 Laboratory Manual of Biochemistry
3.18. Kjeldahl Apparatus
General Description
The Kjeldahl method was developed for
determining the nitrogen contents in
organic and inorganic substances. The
Kjeldahl method was developed in 1883 by
Johann Kjeldahl. The central basis used in
this procedure is the oxidation of the
organic compound using strong Sulphuric
acid. As the organic material is oxidized the
carbon it contains is converted to Carbon
dioxide and the hydrogen is converted into
water. The nitrogen, from the amine
groups found in the peptide bonds of the
polypeptide chains, is converted to
ammonium ion, which dissolves in the
oxidizing solution, and can later be
converted to ammonia gas.
Principle
A sample is digested with a strong acid so that it releases nitrogen which can be determined by a
suitable titration technique. The amount of protein present is then calculated from the nitrogen
concentration of the sample.
The method consists of heating a substance with Sulphuric acid, which decomposes the organic
substance by oxidation to liberate the reduced nitrogen as Ammonium sulphate. In this step Potassium
sulphate is added to increase the boiling point of the medium (from 337°F to 373°F / 169°C to
189°C). Chemical decomposition of the sample is complete when the medium has become clear and
colourless (initially very dark). The solution is then distilled with Sodium hydroxide (added in small
quantities) which converts the ammonium salt to ammonia. The amount of ammonia present (hence the
amount of nitrogen present in the sample) is determined by back titration. The end of the condenser is
dipped into a solution of Boric acid. The ammonia reacts with the acid and the remainder of the acid is
then titrated with a Sodium carbonate solution with a Methyl orange pH indicator.
Procedure
Step 1: Digestion of the Sample
This is the most time-consuming step in the analysis. The purpose of this step is to break down the
bonds that hold the polypeptides together, and convert them to simpler chemicals such as water,
Carbon dioxide and, of course, ammonia.
Such reactions can be considerably speeded up by the presence of a catalyst and by a neutral substance,
such as Potassium sulphate (K2SO4), which raises the boiling point of the digesting acid and thus the
temperature of the reaction.
Fig.31. Kjeldahl Apparatus

Joy P P, Surya S. and Aswathy C. 2015. Pineapple Research Station (Kerala Agricultura l University) Vazhakulam-686670 Muvattupuzha, Ernakulam, Kerala. Tel.: 0485-2260832, 9446010905, Email: [email protected], Web: prsvkm.kau.in
36 Laboratory Manual of Biochemistry
Catalysts are also used to help in the digestion process; many different ones have been tried including
selenium, mercury, copper, or ions of mercury or copper.
Digestion is accomplished by:
Weighing out approximately 1g of the sample containing prote in,
making a note of the weight, and placing the sample into a
digestion flask, along with 12-15 ml of concentrated Sulphuric
acid (H2SO4).
Adding seven grams of Potassium sulphate and a catalyst, usually
copper.
Bringing the digestion tube/flask and mixture to a "rolling boil"
(about 370oC to 400oC) using a heating block.
Heating the mixture in the tube/flask until white fumes can be
seen, and then continuing the heating for about 60-90 minutes.
Cooling the tube/flask and cautiously adding 250 ml of water.
Step 2: Distillation
The purpose of the next step, distillation, is to separate the ammonia (that is, the nitrogen) from the
digestion mixture. This is done by,
Raising the pH of the mixture using Sodium hydroxide (45% NaOH
solution). This has the effect of changing the ammonium (NH4+)
ions (which are dissolved in the liquid) to ammonia (NH3), which is
a gas.
Separating the nitrogen away from the digestion mixture by
distilling the ammonia (converting it to a volatile gas, by raising
the temperature to boiling point) and then trapping the distilled
vapours in a special trapping solution of about 15 ml HCl
(Hydrochloric acid) in 70 ml of water.
Removing the trapping flask and rinsing the condenser with water
so as to make sure that all the ammonia has been dissolved.
Step 3: Titration
As the ammonia dissolves in the acid trapping solution, it neutralizes
some of the HCl it finds there. What acid is left can then be "back
titrated", that is titrated with a standard, known solution of base
(usually NaOH). In this way the amount of ammonia distilled off from
the digestive solution can be calculated, and hence the amount of
nitrogen in the sample determined.
The quantities of acid, and hence ammonia are determined by,
Adding an indicator dye to the acid/ammonia trapping solution. This dye should turn a strong
colour, indicating that a significant amount of the original trapping acid is still present.
Fig.31.1. Step 1 Digestion
Fig.31.2. Step 2: Distillation
Fig.31.3. Step 3: Titration

Joy P P, Surya S. and Aswathy C. 2015. Pineapple Research Station (Kerala Agricultura l University) Vazhakulam-686670 Muvattupuzha, Ernakulam, Kerala. Tel.: 0485-2260832, 9446010905, Email: [email protected], Web: prsvkm.kau.in
37 Laboratory Manual of Biochemistry
Putting a standard solution of NaOH (Sodium hydroxide) into the burette (a long tube with a tap
at the end), very slowly, and adding small amounts of the Sodium hydroxide solution to the acid
solution with the dye.
Watching for the point at which the dye turns orange, indicating that the "endpoint" has been
reached and that now all the acid has been neutralized by the base.
Recording the volume of the neutralizing base (Sodium hydroxide solution) that was necessary
to reach the endpoint.
Performing a calculation to find out the amount of ammonia, and nitrogen came from the
sample.
3.19. Muffle Furnace
General Description
A muffle furnace is a front-loading box-type oven or kiln for high-
temperature applications such as fusing glass, creating enamel coatings,
ceramics and soldering and brazing articles. They are used in order to
determine what proportion of a sample is non-combustible and non-
volatile that is called as ash.
Principle
Muffle furnaces are usually heated to desired temperatures by conduction, convection, or blackbody
radiation from electrical resistance heating elements. Therefore there is (usually)
no combustion involved in the temperature control of the system, which allows for much greater
control of temperature uniformity and assures isolation of the material being heated from the
byproducts of fuel combustion.
Instrumentation
The furnace chamber is heated by electric resistance elements and is insulated with ceramic fibre
insulation. The controller is located under the furnace chamber and is well insulated from the heat
generated in the furnace chamber. A door safety switch removes power to the heating elements
whenever the furnace door is opened. The temperature is controlled by one of three types of
controllers.
3.20. Rotary Evaporator
General Description
A rotary evaporator or rotovap is a device used in chemical laboratories
for the efficient and gentle removal of solvents from samples
by evaporation.
Principle
Rotary evaporation is a technique which employs a rotary evaporator in order to remove excess solvents
from samples by applying heat to a rotating vessel at a reduced pressure. An impotant concept that this
technique applies is that liquids boil when the vapour pressure is equal to the external pressure or
atmospheric pressure. The machine utilizes a lower pressure than atmospheric pressure which allows
solvents to boil at lower temperatures. Furthermore, the rotation increases the surface area and
Fig.32. Muffle Furnace
Fig.33. Rotary Evaporator

Joy P P, Surya S. and Aswathy C. 2015. Pineapple Research Station (Kerala Agricultura l University) Vazhakulam-686670 Muvattupuzha, Ernakulam, Kerala. Tel.: 0485-2260832, 9446010905, Email: [email protected], Web: prsvkm.kau.in
38 Laboratory Manual of Biochemistry
therefore evaporation proceeds more rapidly. Rotary evaporation is useful for evaporating solvents that
have high boiling points. This is because evaporating these solvents at atmospheric pressure requires
high temperatures which may cause side reactions such as oxidation or decomposition of the compound
to occur. Therefore, by lowering the pressure and boiling at a lower temperature, solvents with high
boiling points are removed efficiently without the occurrence of unwanted side reactions.
Components of a rotary evaporator
A motor unit that rotates the evaporation flask or vial containing the sample.
A vapor duct that is the axis for sample rotation, and is a vacuum-tight conduit for the vapour
being drawn off the sample.
A vacuum system, to substantially reduce the pressure within the evaporator system.
A heated fluid bath (generally water) to heat the sample.
A condenser with either a coil passing coolant, or a "cold finger" into which coolant mixtures
such as dry ice and Acetone are placed.
A condensate-collecting flask at the bottom of the condenser, to catch the distilling solvent
after it re-condenses.
A mechanical or motorized mechanism to quickly lift the evaporation flask from the heating
bath.
Procedure
Ensure that both the aspirator pump and the recirculating water bath (5 gallon bucket) are filled
with ice.
Check that the power strip is turned on and plugged in.
Verify that the bump trap is clean and dry.
Add your sample to a round-bottomed flask. (Note: The RB flask should not be more than half
full with liquid.)
Attach the round-bottom flask to the ground glass joint of the bump trap at the end of the
distillation tube. (Note: Some assemblies will have an adapter between the bump trap and
round-bottom flask.)
Ensure that all glassware is held securely in place with a plastic Keck clip and/or ring cap.
Turn on the rotary evaporator motor (green switch).
Adjust the dial to rotate the flask at medium speed.
Turn the aspirator pump.
Seal the vacuum by closing the valve at the top of the diagonal rotary evaporator condenser.
(i.e. turn the knob until the arrow on it points straight down towards the attached tubing).
If necessary, carefully lower the round-bottom flask into the water heating bath. (Note: The hot
water should cover the liquid level in the flask. If the RB flask is more than half -way full, the
water should touch the bottom of the RB flask and as the liquid evaporates, the RB flask can be
further immersed in the water).
Stop the rotovap when there is no more liquid dripping from the condenser coils for 30 seconds.
(Note: For small volumes, dripping may not occur, wait 1-2 minutes and observe if there is any
change.)

Joy P P, Surya S. and Aswathy C. 2015. Pineapple Research Station (Kerala Agricultura l University) Vazhakulam-686670 Muvattupuzha, Ernakulam, Kerala. Tel.: 0485-2260832, 9446010905, Email: [email protected], Web: prsvkm.kau.in
39 Laboratory Manual of Biochemistry
Shutdown (Essentially the reverse of setup)
Lift the flask out of the water bath.
Break the vacuum by opening the top valve at the top of the rotary evaporator condenser.
Turn off the aspirator pump.
Turn the flask rotation dial down to zero.
Carefully remove the round-bottom flask.
3. 21. Titration Assembly
General Description
Titration, also known as titrimetry, is a common laboratory method of quantitative chemical
analysis that is used to determine the unknown concentration of an identified analyte.
Since volume measurements play a key role in titration, it is also known as volumetric analysis.
A reagent, called the titrant or titrator is prepared as a standard solution. A known concentration and
volume of titrant reacts with a solution of analyte or titrant to determine concentration. The volume of
titrant reacted is called titration volume.
Principle
Titration is a process by which the concentration of an unknown substance in solution is determined by
adding measured amounts of a standard solution that reacts with the unknown. Then the concentration
of the unknown can be calculated using the stoichiometry of the reaction and the number of moles of
standard solution needed to reach the so called end point.
The analyte: the solution of unknown concentration is known as the analyte. During titration the titrant
is added to the analyte in order to achieve the equivalence point and determine the concentration of
the analyte.
The standard solution: the solution of known concentration. An accurately measured amount of
standard solution is added during titration to the solution of unknown concentration until the
equivalence or endpoint is reached.
Components of a Titration Assembly
The technique uses a particular set of apparatus with which volumes of solutions can be measured to an
accuracy of greater than 0.1cm3.
Table.1. Titration Assembly
1. Burette Used to deliver and measure the volume of a solution.
2. Pipette Used to deliver an accurate volume (aliquot) of solution.
3.Volumetric flask Used to prepare and store a standard solution of known concentration.
4. Conical Flask
(Erlenmeyer Flask)
Used to contain the reaction mixture (the initial pipetted aliquot of solution plus
the addition of solution from the burette).
5.Glass Funnel Used to facilitate pouring of solution into the burette.
6. Beaker Used to facilitate the acquisition of an aliquot of solution using the pipette, and,
helps prevent possible contamination of stock solution.
4. Wash Bottle Perfect for dispensing liquids or for cleaning glasswares.

Joy P P, Surya S. and Aswathy C. 2015. Pineapple Research Station (Kerala Agricultura l University) Vazhakulam-686670 Muvattupuzha, Ernakulam, Kerala. Tel.: 0485-2260832, 9446010905, Email: [email protected], Web: prsvkm.kau.in
40 Laboratory Manual of Biochemistry
In a titration the pipette is used to transfer 25cm3 (usually to ±0.05 cm3) of a solution in to a conical flask
another solution reacts with the pipette solution in the conical flask is carefully added from a burette
until it has all exactly reacted. This is called the end point of the titration (or equivalence point of the
titration). There needs to be a way of knowing when the end point is reached. An indicator of some kind
may be needed. For example, in the titration of strong acid and a strong base a few drops of Methyl
orange or Phenolphthalein could be used.
Procedure
A typical titration begins with a beaker or Erlenmeyer flask containing a very precise volume of the
analyte and a small amount of indicator placed underneath a calibrated burette or chemistry pipetting
syringe containing the titrant. Small volumes of the titrant are then added to the analyte and indicator
until the indicator changes colour in reaction to the titrant saturation threshold, reflecting arrival at
the endpoint of the titration. Depending on the endpoint desired, single drops or less than a single drop
of the titrant can make the difference between a permanent and tempora ry change in the indicator.
When the endpoint of the reaction is reached, the volume of reactant consumed is measured and used
to calculate the concentration of analyte by,
Ca =
Where, Ca is the concentration of the analyte, typically in molarity; Ct is the concentration of the titrant,
typically in molarity; Vt is the volume of the titrant used, typically in liters; M is the mole ratio of the
analyte and reactant from the balanced chemical equation; and Va is the volume of the analyte used,
typically in liters.
1 2 3
4 5 6 7
Fig.34. Components of a Titration Assembly
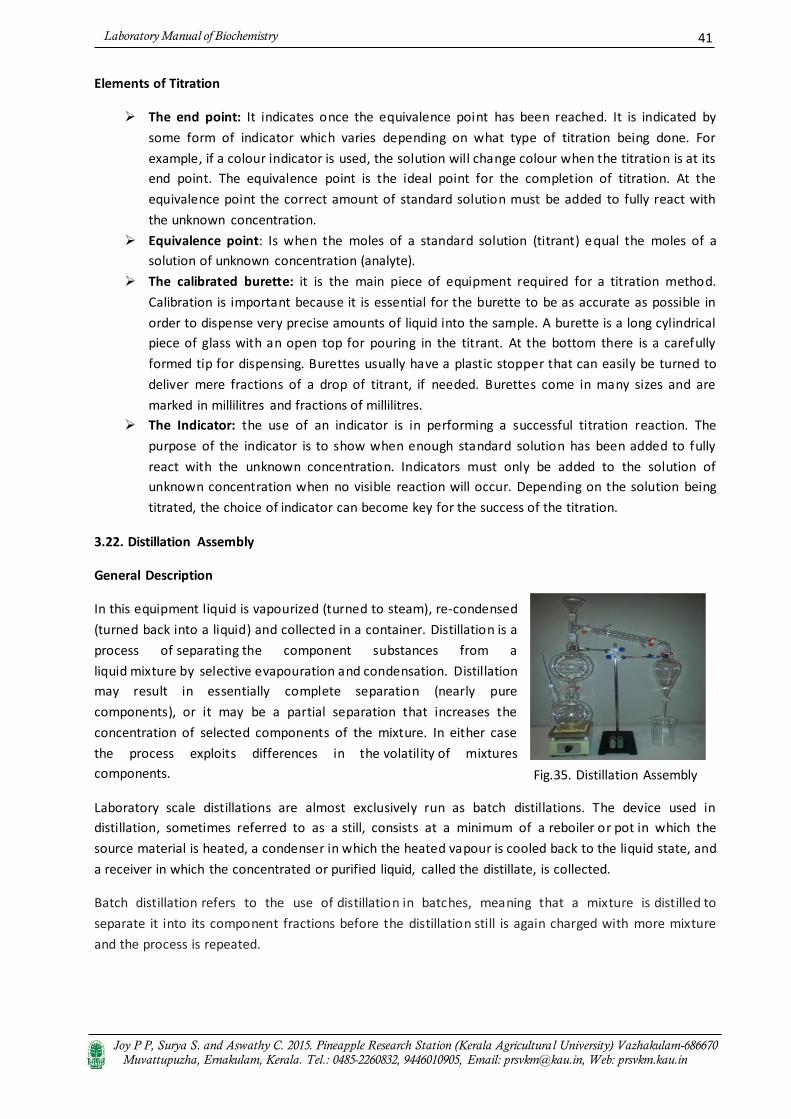
Joy P P, Surya S. and Aswathy C. 2015. Pineapple Research Station (Kerala Agricultura l University) Vazhakulam-686670 Muvattupuzha, Ernakulam, Kerala. Tel.: 0485-2260832, 9446010905, Email: [email protected], Web: prsvkm.kau.in
41 Laboratory Manual of Biochemistry
Elements of Titration
The end point: It indicates once the equivalence point has been reached. It is indicated by
some form of indicator which varies depending on what type of titration being done. For
example, if a colour indicator is used, the solution will change colour when the titration is at its
end point. The equivalence point is the ideal point for the completion of titration. At the
equivalence point the correct amount of standard solution must be added to fully react with
the unknown concentration.
Equivalence point: Is when the moles of a standard solution (titrant) equal the moles of a
solution of unknown concentration (analyte).
The calibrated burette: it is the main piece of equipment required for a titration method.
Calibration is important because it is essential for the burette to be as accurate as possible in
order to dispense very precise amounts of liquid into the sample. A burette is a long cylindrical
piece of glass with an open top for pouring in the titrant. At the bottom there is a carefully
formed tip for dispensing. Burettes usually have a plastic stopper that can easily be turned to
deliver mere fractions of a drop of titrant, if needed. Burettes come in many sizes and are
marked in millilitres and fractions of millilitres.
The Indicator: the use of an indicator is in performing a successful titration reaction. The
purpose of the indicator is to show when enough standard solution has been added to fully
react with the unknown concentration. Indicators must only be added to the solution of
unknown concentration when no visible reaction will occur. Depending on the solution being
titrated, the choice of indicator can become key for the success of the titration.
3.22. Distillation Assembly
General Description
In this equipment liquid is vapourized (turned to steam), re-condensed
(turned back into a liquid) and collected in a container. Distillation is a
process of separating the component substances from a
liquid mixture by selective evapouration and condensation. Distillation
may result in essentially complete separation (nearly pure
components), or it may be a partial separation that increases the
concentration of selected components of the mixture. In either case
the process exploits differences in the volatility of mixtures
components.
Laboratory scale distillations are almost exclusively run as batch distillations. The device used in
distillation, sometimes referred to as a still, consists at a minimum of a reboiler or pot in which the
source material is heated, a condenser in which the heated vapour is cooled back to the liquid state, and
a receiver in which the concentrated or purified liquid, called the distillate, is collected.
Batch distillation refers to the use of distillation in batches, meaning that a mixture is distilled to
separate it into its component fractions before the distillation still is again charged with more mixture
and the process is repeated.
Fig.35. Distillation Assembly

Joy P P, Surya S. and Aswathy C. 2015. Pineapple Research Station (Kerala Agricultura l University) Vazhakulam-686670 Muvattupuzha, Ernakulam, Kerala. Tel.: 0485-2260832, 9446010905, Email: [email protected], Web: prsvkm.kau.in
42 Laboratory Manual of Biochemistry
Principle
The separation of components from a liquid mixture via distillation depends on the dif ferences in boiling
points of the individual components. Also, depending on the concentrations of the components present,
the liquid mixture will have different boiling point characteristics. Therefore, distillation processes
depend on the vapour pressure characteristics of liquid mixtures. A liquid boils when its vapour pressure
equalizes with the surroundings.
Components of a Distillation Assembly
3.23. Mixer Grinder
General Description
In a laboratory, most materials required for sampling are, in practice,
non-homogenous mixtures. The best method of obtaining a small
representative sample of the non-uniform whole is to take a quantity
of the material large enough to be compositionally representative and
reduce it to a fine homogenous powder. For this purpose a grinder is
usually used. Fig.36. Mixer Grinder
1: A source of heat
2: Still pot
3: Still head
4: Thermometer/
Boiling point temperature
5: Condenser
6: Cooling water in
7: Cooling water out
8: Distillate/receiving flask
9: Vacuum/gas inlet
10: Still receiver
11: Heat control
12: Stirrer speed control
13: Stirrer/heat plate
14: Heating (Oil/sand) bath
15: Stirring means e.g. boiling
chips or mechanical stirrer
16: Cooling bath.
Fig.35.1. Components of a Distillation Assembly

Joy P P, Surya S. and Aswathy C. 2015. Pineapple Research Station (Kerala Agricultura l University) Vazhakulam-686670 Muvattupuzha, Ernakulam, Kerala. Tel.: 0485-2260832, 9446010905, Email: [email protected], Web: prsvkm.kau.in
43 Laboratory Manual of Biochemistry
Principle
In grinder samples grinding them between opposite cutter plates and then separated by centrifugal
force. Most of the devices are powered electrically and in some cases are operated manually.
3.24. Microwave Oven
General Description
Microwave ovens are used for heating and defrosting in laboratories.
Microwave heating, which uses electromagnetic energy in the frequency
range 300- 3000 MHz, can be used successfully to heat many dielectric
materials.
However, improper use of a microwave can pose a number of hazards including:
Ignition of flammable vapours
Electrical shock from ungrounded or faulty units
Ignition of materials being heated
Pressure build-up in sealed containers
Integrity of containers holding materials
Sudden boiling of liquid in an open container following removal
Principle
A microwave oven heats samples by passing microwave radiation through it. Microwaves are radio
waves. In the case of microwave ovens, the commonly used radio wave frequency is roughly 2,500
Megahertz (2.5 gigahertz). Radio waves in this frequency range have an interesting property: they are
absorbed by water, fats and sugars. When they are absorbed they are converted directly into atomic
motion and motion is converted into heat. Microwaves in this frequency range have another interesting
property: they are not absorbed by most plastics, glass or ceramics. And metal reflects microwaves,
which is why metals cause spark in a microwave oven. The reason that metal reflects microwaves is that
no electronic waves resident in inside of conductor because conductors conductivity is infinity as we
studied in our course. The property is possible because the frequency 2,500 megahertz is resonance
frequency of water. Molecules of all food are consist of a dipole and have positive charge in one side
and have negative charge in another side. If we put electromagnetic fields in this, all molecules are
rearranged: positive charge is to negative.
Pole and charge is to positive pole. In this process molecules heat is produced by Friction. The frequency
of microwave oven is 2,500 megahertz as we saw before. Then Microwave of this frequency change the
direction of electromagnetic fields 2,500,000,000 times in 1 second. Consequently the heat efficiency of
a microwave oven is high. In a conventional oven, the heat has to migrate (by conduction) from the
outside of the food toward the middle. In microwave cooking, the radio waves penetrate the food and
e ite ate a d fat ole ules p ett u h e e l th oughout the food. The e is o heat ha i g to ig ate to a d the i te io o du tio . The e is heat e e he e all at o e e ause the olecules
are all excited together. There are limits of course. Radio waves penetrate unevenly in thick pieces of
food the do t ake it all the a to the iddle , a d the e a e also hot spots aused a e interference. The whole heating process is different. In a microwave oven, the air in the oven is at room
Fig.37. Microwave Oven
Joy P P, Surya S. and Aswathy C. 2015. Pineapple Research Station (Kerala Agricultura l University) Vazhakulam-686670 Muvattupuzha, Ernakulam, Kerala. Tel.: 0485-2260832, 9446010905, Email: [email protected], Web: prsvkm.kau.in
44 Laboratory Manual of Biochemistry
te pe atu e, so the e is o a to fo a ust. That is e ause it heats up foods i o a es i stead of heat o du tio .
Steps to Working Safely with Microwaves
Never attempt to heat, flammable liquids or solids, hazardous substances or radioactive
materials in any type of microwave oven.
Do not place metal items inside the microwave, including aluminum foil and plastic coated
magnetic stirrer bars.
Do not modify the microwave in any way, including the removal of the grounding pin or change
of the plug.
Never use a laboratory microwave for food preparation (or kitchen microwave for laboratory
materials).
Do not heat sealed containers in a microwave. Even a loosened cap or lid poses a significant risk
since microwaves can heat material so quickly that the container explodes either in the oven or
shortly after removal.
Take care to avoid overheating liquids. It is possible to raise water to a temperature greater than
normal boiling point; when this occurs, any disturbance to the liquid can trigger violent boiling
that could result in severe burns.
Additional safety measures must be considered when using a microwave to melt agar
Large amounts (e.g. 250 ml) of solidified agar should not be warmed in a microwave unless first
chopped up with a sterile spatula. Not doing this can cause explosive vapourization in solid agar
where vapour cannot escape.
Use loose fitting sterile foam plugs or loose 'Kim wipe" plugs, rather than just relying on loosely
placed cap.
Ensure a good amount of headspace is available in the container above the material being
heated.
Set the power and timings correctly. Do not overheat.
Thermal gloves and a face shield must be worn when removing a container from the microwave.
Care should be taken when placing the container on the bench as not to cause unnecessary
disturbance of the agar, which may cause the agar to boil over.
3.25. Refrigerator
General Description
Laboratory refrigerators are used to cool samples or specime ns for preservation.
They differ from standard refrigerators used in homes or restaurant because they
need to be totally hygienic and completely reliable.
Principle
The refrigerating effect in refrigeration systems is based on the use and control of the phase transition
processes of evapouration. As the refrigerant evapourates it absorbs energy (heat) from its surroundings
and by placing an object in thermal contact with the evapo urating refrigerant it can be cooled to low
temperature.
Different substances have different melting and boiling points. Gold for example melts at 1064°C,
chocolate at 26°C and most refrigerants melt at temperatures around -100°C.
Fig.38. Refrigerator

Joy P P, Surya S. and Aswathy C. 2015. Pineapple Research Station (Kerala Agricultura l University) Vazhakulam-686670 Muvattupuzha, Ernakulam, Kerala. Tel.: 0485-2260832, 9446010905, Email: [email protected], Web: prsvkm.kau.in
45 Laboratory Manual of Biochemistry
For a substance that is present in two of its phases at the same time or undergoing a phase change
pressure and temperature become dependent. If the two phases exist in a closed container and the two
phases are in thermal equilibrium the condition is said to be saturated. If the temperature of the two
phase mixture is increased the pressure in the containe r will also increase. The relationship between
pressure and temperature for saturated conditions (liquid and vapour) is typically called the vapour
pressure curve. Using the vapour pressure curve one can determine what the pressure will be for an
evapourating or condensing process. The evapouration process in a refrigeration system is one of the
processes where the term superheat is used. Superheat is a very important term in the terminology of
refrigeration but it is unfortunately used in different ways. It can be used to describe a process where
refrigerant vapour is heated from its saturated condition to a condition at higher temperature. The term
superheat can also be used to describe or quantify the end condition of the before mentioned process.
Superheat can be quantified as a temperature difference between the temperature measured with a
thermometer and the saturation temperature of the refrigerant measured with a pressure gauge.
Superheat mined from a single measurement of temperature alone a measurement of pressure or
saturation temperature is also needed. When superheat is quantified it should be quantified as a
temperature difference and, consequently, be associated with the unit [K]. If quantified in [°C] it can be
the cause of mistakes where the measured temperature is taken for the superheat or vice versa.
3.26. Deep Freezer
General Description
Deep freezers are elegantly designed with the best quality refrigeration
system to meet the elevated standards of performance and controlled
temperature storage needs of the pharmacy, medical, industry, biotech and
clinical applications.
Principle
The basic principle behind a freezer is evapo uration. When a liquid evapourates, it causes the
surrounding area to cool. Water can't be used in freezer though, because it evapourates at too high a
temperature. But some liquids evapourate at very low temperatures. For example, Isobutene (becoming
more common in domestic freezers) evapourates at very low temperatures. This ability to evapourate at
very low temperatures means that it cools surfaces which are already very cold.
Instrumentation
Evapourator: Evapouration is affected by air pressure. The higher the air pressure, the less a
liquid will evapourate.
The compressor takes in the refrigerant (as gas); raise the air pressure which converts the
refrigerant gas to liquid.
As the refrigerant liquid flows from the compressor to the expansion valve the high air pressure
stops it evapourating and instead it gives off heat and becomes cooler. The refrigerant liquid
flows through the expansion valve where the air pressure is much lower .This cause the
refrigerant liquid to evaporate which cause the pipe to become very cold inside the freezer.
One key component of the freezer is the thermostat. The thermostat senses the temperature
inside the freezer and when it drops below a certain temperature it turns off the motor so the
flow of the refrigerant liquid stops. When the temperature rises above a certain level the
thermostat turns on the motor and the refrigeration process restarts.
Fig.39. Deep Freezer

Joy P P, Surya S. and Aswathy C. 2015. Pineapple Research Station (Kerala Agricultura l University) Vazhakulam-686670 Muvattupuzha, Ernakulam, Kerala. Tel.: 0485-2260832, 9446010905, Email: [email protected], Web: prsvkm.kau.in
46 Laboratory Manual of Biochemistry
Refrigerant Liquids: Different freezers have different refrigerant liquids. Which liquid is used is
important for two main reasons. Firstly different liquids are more or less efficient for use in a
freezer. Less efficient liquids will use more electricity and therefore cost you more to run your
freezer. Secondly, some refrigerant liquids contribute significantly more than others to global
warming and destruction of the ozone layer. Pre-1990 many freezers used CFC which caused
significant environmental damage to the atmosphere. This was then replaced with MFC which
does not destroy the ozone layer but still does contribute to global warming. Currently HC and
Isobutene are used as refrigerant liquids in most domestic freezers. Both are a good with
Isobutene being the best.
3.27. BOD Incubator
General Description
BOD incubators often called low temperature incubators, which is one of most
important lab equipment in many research centres, hospitals and other
pharmaceutical labs. Bacteriological incubators are known as exceptional lab
incubators specially designed for a variety of incubation and testing
applications. The series of BOD incubator is perfect for BOD testing and other
related jobs of research.
Principle
The major principle behind the BOD incubator is to maintain constant environment condition for any
particular kind of study such as cell cultures, microbiological etc.
3.28. Hot Air Oven
General Description
It is a dry heat sterilization unit. A dry heat cabinet is easy to install and
has relatively low operating costs; it is nontoxic and does not harm the
environment and it is noncorrosive for metal and sharp instruments.
Principle
Sterilization by dry heat is accomplished through conduction. The heat is absorbed by the outside
surface of the equipment, and then passes towards the centre of it, layer by layer. The entire system will
eventually reach the temperature required for sterilization. Dry heat does most of the damage by
oxidizing molecules. The essential cell constituents are destroyed and the organism dies. The
temperature is maintained for almost an hour to kill the most difficult of the resistant spores. The most
common time-temperature relationships for sterilization with hot air sterilizers are:
1.170oC (340oF) for 60 minutes,
2.160oC (320oF) for 120 minutes,
3.150oC (300oF) for 150 minutes or longer depending upon the volume
Fig.40. BOD Incubator
Fig.41. Hot Air Oven

Joy P P, Surya S. and Aswathy C. 2015. Pineapple Research Station (Kerala Agricultura l University) Vazhakulam-686670 Muvattupuzha, Ernakulam, Kerala. Tel.: 0485-2260832, 9446010905, Email: [email protected], Web: prsvkm.kau.in
47 Laboratory Manual of Biochemistry
Working
Working principle of hot air oven is the forced circulation of hot air inside the chamber of oven. As it is a
universal scientific fact that in any chamber hot air rises above, so by utilizing this principle when the hot
air reaches the top of chamber it is circulated back to bottom by a fan installed inside the chamber and
hence optimum amount of heat is achieved gradually inside the hot air oven.
There are two types of dry-heat sterilizers: one is the static-air type and the other is forced-air type. The
static-air type is referred to as the oven-type sterilizer as heating coils in the bottom of the unit cause
the hot air to rise inside the chamber via gravity convection. This type of dry-heat sterilizer is much
slower in heating, requires longer time to reach sterilizing temperature, and is less uniform in
temperature control throughout the chamber than is the forced-air type.
Note
Dry heat sterilization technique requires longer exposure time (1.5 to 3 hours) and higher temperatures
than moist heat sterilization. Dry heat ovens are used to sterilize items that might be damaged by moist
heat or that are impenetrable to moist heat (e.g., powders, petroleum products, sharp instruments).
The hot air oven is mounted on four rubber foots to prevent slipping and this protects the bench
surface. The control panel houses a main ON/OFF switch indicator lamp and temperature setting knob.
The scale is calibrated in 5°C steps.
3.29. Autoclave
General Description
An autoclave is a large pressure cooker. It is a moist sterilization
unit. It is a pressure chamber used to sterilize equipment and
supplies by subjecting them to high pressure saturated steam at
121°C (249°F) for around 15–20 minutes depending on the size
of the load and the contents. It was invented by Charles
Chamberland in 1879.
Parts of an Autoclave
Autoclaves have four basic parts
Water Intake- An autoclave needs water to make the steam used for sterilization. A water
intake hookup or hose, it allowing the user to pump water directly into the machine.
Chamber- The chamber is the space where the user places items to sterilize. In the chamber are
wire racks, which will hold various items upright or lying down and allow for steam penetration
from all angles.
Control Panel- The control panel allows the user to customize the autoclaving process. Some
materials can withstand higher temperatures, while some must be autoclaved at lower
temperatures for longer time.
Machinery- Autoclaves must have an air pump system to remove the oxygen in the chamber
and create a vacuum which then fills with pressurized steam created from the water in the
Fig.42. Autoclave

Joy P P, Surya S. and Aswathy C. 2015. Pineapple Research Station (Kerala Agricultura l University) Vazhakulam-686670 Muvattupuzha, Ernakulam, Kerala. Tel.: 0485-2260832, 9446010905, Email: [email protected], Web: prsvkm.kau.in
48 Laboratory Manual of Biochemistry
reservoir. The water becomes heated either via a heating element inside the water reservoir or
a heat-generating mechanism that completely surrounds the reservoir.
Principle
It operates under the principle of steam under pressure as the sterilizing agent. High pressures enable
steam to reach high temperatures, thus increasing its heat content and killing power. Most of the
heating power of steam comes from its latent heat of vapourization (the amount of heat required to
convert boiling water to steam).
Steam is able to penetrate objects with cooler temperatures because once the steam contacts a cooler
surface; it immediately condenses to water, producing a concomitant 1,870 fold decreases in steam
volume. This creates negative pressure at the point of condensation and draws more steam to the area.
A condensation continues so long as the temperature of the condensing surface is less than that of
steam; once temperatures equilibrate, a saturated steam environment is formed. Achieving high and
even moisture content in the steam-air environment is important for effective autoclaving. The ability of
air to carry heat is directly related to the amount of moisture present in the air. The more moisture
present, the more heat can be carried, so steam is one of the most effective carriers of heat. Steam
therefore also results in the efficient killing of cells and the coagulation of proteins.
Moist heat is thought to kill microorganisms by causing coagulation of essential proteins. Another way
to explain this is that when heat is used as a sterilizing agent, the vibratory motion of every molecule of
a microorganism is increased to levels that induce the cleavage of intramolecular hydrogen bonds
Fig.42.1. Principle of Autoclave

Joy P P, Surya S. and Aswathy C. 2015. Pineapple Research Station (Kerala Agricultura l University) Vazhakulam-686670 Muvattupuzha, Ernakulam, Kerala. Tel.: 0485-2260832, 9446010905, Email: [email protected], Web: prsvkm.kau.in
49 Laboratory Manual of Biochemistry
between proteins. Death is therefore caused by an accumulation of irreversible damage to all metabolic
functions of the organism. Death rate is directly proportional to the concentration of microorganisms at
any given time. The time required to kill a known population of microorganisms in a specific suspension
at a particular temperature is referred to as thermal death time (TDT). All autoclaves operate on a
time/temperature relationship; increasing the temperature decreases TDT, and lowering the
temperature increases TDT.
Standard temperatures/pressures employed are 115¡C/10 psi 121¡C/15 psi and 132¡C/27 psi.
(Psi=pounds per square inch).
Working
Steam enters the chamber jacket, passes through an operating valve and enters the rear of the chamber
behind a baffle plate. It flows forward and down through the chamber and the load, exiting at the front
bottom. A pressure regulator maintains jacket and chamber pressure at a minimum of 15 psi, the
pressure required for steam to reach 121oC (250oF).Overpressure protection is provided by a safety
valve. The conditions inside are thermostatically controlled so that heat (more steam) is applied until
121oC is achieved, at which time the timer starts, and the temperature is maintained for the selected
time.
Note
Please note that after loading and starting the autoclave, the processing time is measured after the
autoclave reaches normal operating conditions of 121¡C (250¡F) and 15 psi pressure, not simply from the
time you push the "on" button. Due to the fact that autoclaves utilize steam, heat and pressure the risk
of personal exposure and potential harm is great. Personnel should wear proper personal protective
equipment, i.e. heat resistant gloves, eye protection and a lab coat, particularly when unloading the
autoclave. Regularly inspect the autoclave for proper operation. Do not assume that the temperature
and pressure is down before opening the chamber. Look at the gauges. Even if the pressure gauge
sho s " ", ope the ha e a efull ; a k the doo to allo stea to dissipate do t fli g the doo open, as steam might come out and burn you). After opening the door, let items sit for 5 minutes before
handling. This will reduce the chance of boil-over and burns. Never place sealed containers in an
autoclave they might explode. This allows for expansion during the cycle. Caps must be slightly loose so
that pressure created during the cycle does not cause the vessel to break. For screw-cap containers, you
can make the lid hand tight and then loosen the lid by one-half turn. Always leave a few inches of "head
oo " i ou o tai e s. That a , if the ite oils, it o t sp a out i to ou fa e. Li uid s to be
autoclaved must be in an autoclavable vessel that is at least twice as large as the volume to be
autoclaved (i.e. If you are autoclaving 1 litre of media, you need to put it in a flask that hold at least 2
litres) . Agar will clog the drain in the autoclave and break it.
Do not autoclave items containing solvents, volatile or corrosive chemicals (Phenol, Trichloro acetic acid,
Ether, Chloroform, etc.) or any radioactive materials.

Joy P P, Surya S. and Aswathy C. 2015. Pineapple Research Station (Kerala Agricultura l University) Vazhakulam-686670 Muvattupuzha, Ernakulam, Kerala. Tel.: 0485-2260832, 9446010905, Email: [email protected], Web: prsvkm.kau.in
50 Laboratory Manual of Biochemistry
3.30. Gel Documentation System
General Description
A gel doc, also known as a gel documentation system, gel image
system or gel imager, is equipment widely used in molecular
biology laboratories for the imaging and documentation of nucleic
acid and protein suspended within polyacrylamide or agarose gels.
These gels are typically stained with Ethidium bromide or
other fluorophores such as SYBR Green.
Principle
Principle of fluorescence with fluorescent staining of nucleic acids, a fluorescent substance that has
bound to nucleic acids is excited by ultraviolet irradiation and emits fluorescent light. The fluorescent
substance Ethidium bromide binds specifically to nucleic acid and the amount of binding depends on the
molecular weight and concentration of the nucleic acid. In other words, a band for a large molecular
weight or large amount will shine brighter; conversely, fluorescence will be weaker for a band for a small
molecular weight or small amount.
Instrumentation
Source of irradiation: UV Transilluminator 20 x 20 cm, 312 nm (254 nm selectable)
Base Plate: A sample tray, a gel viewer
A set of filters
Imaging device: A camera (CCD with high resolution) unit integrated with darkroom, camera
controller, video monitor and printer.
Readout system: Computerized system
3.31. Centrifuge
General Description
A centrifuge is the equipment generally driven by an electric motor that
puts an object to rotate around fixed axis, and a perpendicular force is
applied to axis. The particles get separated according to their size, shape,
density, viscosity of the medium and rotor speed.
Principle
The centrifuge involves principle of sedimentation, where the acceleration at centripetal force causes
denser substance to separate out along the radial direction at the bottom of the tube. In centrifugation,
the lysate is rotated at a certain speed (expressed as rotations per minute (RPM)). This rotation imposes
a force on the particles perpendicular to the axis of rotation. The force is called a relative centrifugal
fo e ‘CF , e p essed as a ultiple of the fo e of Ea th s g a itatio al fo e g . Whe n a particle is
subjected to centrifugal force, it will migrate away from the axis of rotation at a rate dependent on the
pa ti le s size a d de sit .
Fig.43. Gel Documentation System
Fig.44. Centrifuge

Joy P P, Surya S. and Aswathy C. 2015. Pineapple Research Station (Kerala Agricultura l University) Vazhakulam-686670 Muvattupuzha, Ernakulam, Kerala. Tel.: 0485-2260832, 9446010905, Email: [email protected], Web: prsvkm.kau.in
51 Laboratory Manual of Biochemistry
Instrumentation
That part of the centrifuge that holds the centrifugation tubes is called the centrifuge rotor.
Centrifuges are designed so that a number of different rotors can be used by the instrument.
There are three types of centrifuge rotors: fixed-angle rotors, swinging-bucket rotors,
and vertical rotors.
Fixed-angle and swinging-bucket rotors are the most commonly used. In a fixed-angle rotor, the
centrifuge tubes are spun at a fixed angle, which is usually approximately 35 degrees. They are
most commonly used for pelleting cells and subcellular components.
With swinging-bucket rotors, the tubes are free to swing out perpendicular to the axis of
rotation as the rotor rotates. This rotor is particularly useful in density-gradient centrifugation
schemes.
Differential Centrifugation
Fig.44.2. Differential Centrifugation
Fig.44.1. Rotors and Centrifugation

Joy P P, Surya S. and Aswathy C. 2015. Pineapple Research Station (Kerala Agricultura l University) Vazhakulam-686670 Muvattupuzha, Ernakulam, Kerala. Tel.: 0485-2260832, 9446010905, Email: [email protected], Web: prsvkm.kau.in
52 Laboratory Manual of Biochemistry
Differential centrifugation is one of two major types of centrifugation schemes. Differential
centrifugation is the sequential centrifugation of a cell lysate at progressively increasing centrifugation
force, isolating cellular components of decreasing size and density. The separation of the cellular
components is based solely on their sedimentation rate through the centrifugation medium, which, in
turn, is dependent on the size and shape of the cellular components. In differential centrifugation, each
centrifugation step results in the production of a pellet, usually containing a mixture of cellular
components of the same size and/or density. The fluid resting above the pellet, the supernatant can be
removed and subjected to additional centrifugations to generate pellets containing other cellular
components of lesser size and / or density.
3.32. Refrigerated Centrifuge
General Description
It is extensively used in chemistry, biology, and biochemistry for
isolating and separating suspensions. It additionally provides the
cooling mechanism to maintain the uniform temperature throughout
the operation of the sample.
Principle
Refrigerated centrifuge works on the concept of sedimentation principle by holding up the sample tubes
with a capacity of 2ml, 10ml and 50ml in rotation around a fixed axis. In this, the centripetal force causes
the denser substances to separate out along the radial direction in the bottom of the centrifuge tube.
The rate of the centrifugation is calculated by the acceleration applied to the sample and it is typically
measured in revolution per minute (RPM) or relative centrifugal force (RCF). The particles settling
velocity during centrifugation depends on the function of their size and shape, centrifugal acceleration,
the volume fraction of solids present, the density difference between the particle and the liquid, and the
viscosity.
Working
Switch on the mains. The power indicator will get illuminated.
Setting the Program Number: Press the PROG button. The required program number can be set
by using the UP or DOWN.
Setting the timer: Press the PROG button again. The display panel will show Zero and the timer
setting is initialized. The required time setting can be made by pressing the UP arrow for the
increment and DOWN arrow for decreasing the time. Set the time required for the program and
release the button.
Setting the temperature: Press the PROG again. Now the system is ready for temperature
setting. Set the required temperature by pressing the UP or DOWN arrow till the required
temperature is set. Release the button.
Selection of RPM: Press the PROG button again. The option to select the display mode to read
normal display in RPM\RCF can be selected by using the UP or DOWN
Setting the rotor speed: Press the PROG button again. Use the UP or DOWN arrow to set the
required speed. Release the button
Setting the acceleration time: Press the PROG button again. Use UP or DOWN arrow to set the
acceleration time within the range of 60-240 seconds. Release the button.
Fig.45. Refrigerated Centrifuge

Joy P P, Surya S. and Aswathy C. 2015. Pineapple Research Station (Kerala Agricultura l University) Vazhakulam-686670 Muvattupuzha, Ernakulam, Kerala. Tel.: 0485-2260832, 9446010905, Email: [email protected], Web: prsvkm.kau.in
53 Laboratory Manual of Biochemistry
Setting the deceleration time: Press the PROG button again. The system is ready to set the
deceleration time. Use UP or DOWN arrow to set the deceleration time within the range of 45-
240 seconds. Release the button.
Rotor Selection: Press the PROG button again. The system is ready to set the rotor selection. The
rotor heads are numbered and select the specific rotor head number which you plan to use in
this program. Use arrow UP or DOWN select the specific number of the rotor head you plan to
use. Release the button, saving the setting and locking the program.
Now you have completed the setting of the parameters for the first program and the same is
automatically registered and saved as parameters of the set program number as program 1.
Press the RETURN key to come back to Normal Display mode.
3.33. Thermal Cycler (PCR machine)
General Description
The thermal cycler (also known as a thermo cycler, PCR
machine or DNA amplifier) is a laboratory apparatus used to
amplify segments of DNA via the Polymerase Chain Reaction
(PCR). The device has a thermal block with holes where tubes
holding the PCR reaction mixtures can be inserted. The cycler
then raises and lowers the temperature of the block in discrete,
preprogrammed steps.
Polymerase Chain Reaction (PCR)
PCR stands for the Polymerase Chain Reaction and was developed in 1987 by Kary Mullis (which won
him a Nobel Prize) and associates. With this technique it is possible to make virtually unlimited copies of
a single DNA molecule even though it is initially present in a mixture containing many different DNA
molecules. It is used to amplify a specific DNA (target) sequence lying between known positions (flanks)
on a double-stranded (ds) DNA molecule. The polymerase chain reaction can be used to amplify both
double and single stranded DNA.
Principle
The cycling reactions: There are three major steps in a PCR, which are repeated for 30 or 40 cycles. This
is done on an automated cycler, which can heat and cool the tubes with the reaction mixture in a very
short time.
1. Denaturation: This step is the first regular cycling event and consists of heating the reaction to 94-
98°C for 20-30 seconds. It causes DNA melting of the DNA template by disrupting the hydrogen bonds
between complementary bases, yielding single-stranded DNA molecules.
2. Annealing: The reaction temperature is lowered to 50-65°C for 20-40 seconds allowing annealing of
the primers to the single-stranded DNA template. This temperature must be low enough to allow
for hybridization of the primer to the strand, but high enough for the hybridization to be specific, i.e.,
the primer should only bind to a perfectly complementary part of the template. If the temperature is
too low, the primer could bind imperfectly. If it is too high, the primer might not bind. Typically the
annealing temperature is about 3-5°C below the Tm of the primers used. Stable DNA-DNA hydrogen
bonds are only formed when the primer sequence very closely matches the template sequence. The
polymerase binds to the primer-template hybrid and begins DNA formation.
Fig.46. Thermal Cycler (PCR machine)

Joy P P, Surya S. and Aswathy C. 2015. Pineapple Research Station (Kerala Agricultura l University) Vazhakulam-686670 Muvattupuzha, Ernakulam, Kerala. Tel.: 0485-2260832, 9446010905, Email: [email protected], Web: prsvkm.kau.in
54 Laboratory Manual of Biochemistry
3. Extension: The temperature at this step depends on the DNA polymerase used; Taq polymerase has
its optimum activity temperature at 75-80°C, and commonly a temperature of 72°C is used with this
enzyme. At this step the DNA polymerase synthesizes a new DNA strand complementary to the DNA
template strand by adding dNTPs that are complementary to the template in 5' to 3' direction,
condensing the 5'-phosphate group of the dNTPs with the 3'-hydroxyl group at the end of the nascent
(extending) DNA strand. At each extension step, the amount of DNA target is doubled, leading to
exponential (geometric) amplification of the specific DNA fragment.
4.Final elongation: This single step is occasionally performed at a temperature of 70-74°C for 5-15
minutes after the last PCR cycle to ensure that any remaining single-stranded DNA is fully extended.
5. Final hold: This step at 4-15°C for an indefinite time may be employed for short-term storage of the
reaction.
Requirements
DNA template: That contains the DNA region (target) to be amplified.
Two primers (Forward primer & Backward primer): Which are complementary to the DNA
regions at the 5' (five prime) or 3' (three prime).
A thermostable DNA polymerase: Such as Taq polymerase.
Deoxynucleoside triphosphates (dNTPs): The building blocks from which the DNA polymerases
synthesizes a new DNA strand.
Buffer solution: Providing a suitable chemical environment for optimum activity and stability of
the DNA polymerase.
Divalent cations: Magnesium or manganese ions; generally Mg2+ is used.
Nuclease free water
Fig.46.1. Principle of Polymerase Chain Reaction

Joy P P, Surya S. and Aswathy C. 2015. Pineapple Research Station (Kerala Agricultura l University) Vazhakulam-686670 Muvattupuzha, Ernakulam, Kerala. Tel.: 0485-2260832, 9446010905, Email: [email protected], Web: prsvkm.kau.in
55 Laboratory Manual of Biochemistry
Procedure
1. The DNA molecule carrying a target sequence is denatured by heat at 90-95oC for 20 seconds. The two
strands separate due to breakage of the hydrogen bonds holding them together. Oligonucleotide
primers are added.
2. A reaction mixture containing all four deoxynucleotide triphosphates (dATP, dCTP, dGTP, dTTP) and a
thermostable DNA polymerase is added. A DNA polymerase (Taq) that is not denatured by the high
temperature needed to separate the DNA strands is used. It is usually sourced from Thermus aquaticus,
a bacterium isolated from hot springs.
3. The mixture is allowed to cool to a lower temperature (50-65oC). Each strand of DNA molecule
becomes annealed with an oligonucleotide primer complementary to either end of the target sequence.
Primer annealing takes 20 seconds.
4. The temperature is raised to 60-75oC and primers are extended by the action of DNA polymerase for
30 seconds. The polymerase synthesizes complementary sequence the 5' to 3' direction away from each
of the primers. If the template contains a n A nucleotide, the enzyme adds on a T nucleotide to the
primer. If the template contains a G, it adds a C to the new chain. Polymerization continues until each
newly synthesized strand has proceeded far enough to contain the site recognized by the other p rimer.
At this point there would be exactly two copies of the target DNA sequence.
5. The mixture is heated again at 90-95oC to denature the molecules and separate the strands and the
cycle repeated. Each new strand then acts as a template for the next cycle of synthesis. Thus
amplification proceeds at an exponential (logarithmic) rate, i.e. amount of DNA produced doubles at
each cycle. The amplified product at the end of PCR is called amplicon.
3.34. Blotting Techniques
General Description
Blotting is the technique in which nucleic acids or proteins are immobilized onto a solid support
generally nylon or nitrocellulose membranes. Blotting of nucleic acid is the central technique for
hybridization studies. Nucleic acid labeling and hybridization on membranes have formed the basis for a
range of experimental techniques involving understanding of gene expression, organization, etc. Blotting
techniques are used to identify unique proteins and nucleic acid sequences. They have been developed
to be highly specific and sensitive and have become important tools in both molecular biology and
clinical research.
Principle
The blotting methods are fairly simple and usually consist of four separate steps: electrophoretic
separation of protein or of nucleic acid fragments in the sample; transfer to and immobilization on
paper support; binding of analytical probe to target molecule on paper; and visualization of bound
probe. Molecules in a sample are first separated by electrophoresis and then transferred on to an easil y
handled support medium or membrane. This immobilizes the protein or DNA fragments, provides a
faithful replica of the original separation, and facilitates subsequent biochemical analysis. After being
transferred to the support medium the immobilized protein or nucleic acid fragment is localized by the
use of probes, such as antibodies or DNA, that specifically bind to the molecule of interest. Finally, the
position of the probe that is bound to the immobilized target molecule is visualized usually by

Joy P P, Surya S. and Aswathy C. 2015. Pineapple Research Station (Kerala Agricultura l University) Vazhakulam-686670 Muvattupuzha, Ernakulam, Kerala. Tel.: 0485-2260832, 9446010905, Email: [email protected], Web: prsvkm.kau.in
56 Laboratory Manual of Biochemistry
autoradiography. Three main blotting techniques have been developed and are commonly called
Southern, Northern and Western blotting.
3.34.1. Southern blot
Southern blot is a method used to check for the presence of a DNA sequence in a DNA sample. The
method is named after its inventor, the British biologist Edwin Southern.
Procedure
Restriction endonucleases are used to cut high molecular weight DNA strands into smaller
fragments, which are then electrophoresed on an agarose gel to separate them by size.
If the DNA fragments are larger than 15 kb, then prior to blotting, the gel may be treated with
an acid, such as dilute HCl, which depurinates the DNA fragments, breaking the DNA into smaller
pieces, thus allowing more efficient transfer from the gel to membrane.
If alkaline transfer methods are used, the DNA gel is placed into an alkaline solution (containing
NaOH) to denature the double-stranded DNA. The denaturation in an alkaline environment may
improve binding of the negatively charged DNA to a positively charged membrane, separating it
into single DNA strands for later hybridization to the probe and destroys any residual RNA that
may still be present in the DNA.
A sheet of nitrocellulose (or nylon) membrane is placed on top of (or below, depending on the
direction of the transfer) the gel. Pressure is applied evenly to the gel (either using suction, or by
placing a stack of paper towels and a weight on top of the membrane and gel), to ensure good
and even contact between gel and membrane. Buffer transfer by capillary action from a region
of high water potential to a region of low water potential (usually filter paper and paper tissues)
is used to move the DNA from the gel on to the membrane; ion exchange interactions bind the
DNA to the membrane due to the negative charge of the DNA and positive charge of the
membrane.
The membrane is then baked in a vacuum or regular oven at 80°C for 2 hours or exposed to
ultraviolet radiation (nylon membrane) to permanently attach the transferred DNA to the
membrane. The membrane is then exposed to a hybridization probe a single DNA fragment
with a specific sequence whose presence in the target DNA is to be determined. The probe DNA
is labeled so that it can be detected, usually by incorporating radioactivity or tagging the
molecule with a fluorescent or chromogenic dye.
After hybridization, excess probe is washed from the membrane and the pattern of
hybridization is visualized on x-ray film by autoradiography in the case of a radioactive or
fluorescent probe or by development of colour on the membrane if a chromogenic detection
method is used.
Hybridization of the probe to a specific DNA fragment on the filter membrane indicates that this
fragment contains DNA sequence that is complementary to the probe. The transfer step of the DNA
from the electrophoresis gel to a membrane permits easy binding of the labeled hybridization probe
to the size-fractionated DNA. Southern blots performed with restriction enzyme-digested genomic
DNA may be used to determine the number of sequences (e.g., gene copies) in a genome. A probe
that hybridizes only to a single DNA segment that has not been cut by the restriction enzyme will
produce a single band on a Southern blot, whereas multiple bands will likely be observed when the
probe hybridizes to several highly similar sequences (e.g., those that may be the result of sequence
duplication). Modification of the hybridization conditions (i.e., increasing the hybridization

Joy P P, Surya S. and Aswathy C. 2015. Pineapple Research Station (Kerala Agricultura l University) Vazhakulam-686670 Muvattupuzha, Ernakulam, Kerala. Tel.: 0485-2260832, 9446010905, Email: [email protected], Web: prsvkm.kau.in
57 Laboratory Manual of Biochemistry
temperature or decreasing salt concentration) may be used to increase specificity and decrease
hybridization of the probe to sequences that are less than 100% similar.
3.34.2. Northern blot
The Northern blot technique is used to study gene expression by detection of RNA (or isolated mRNA) i n
a sample. With Northern blotting it is possible to observe cellular control over structure and function by
determining the particular gene expression levels during differentiation, morphogenesis, as well as
abnormal or diseased conditions. This technique was developed in 1977 by James Alwine, David Kemp
and George Stark at Stanford University. Northern blotting takes its name from its similarity to the first
blotting technique, the Southern blot. The major difference is that RNA, rather than DNA, is analyzed in
the Northern blot.
Procedure
The blotting procedure starts with extraction of total RNA from a homogenized tissue sample. The
mRNA can then be isolated through the use of oligo (DT) cellulose chromatography to maintain only
those RNAs with a poly (A) tail. RNA samples are then separated by gel electrophoresis. A nylon
membrane with a positive charge is the most effective for use in Northern blotting since the negatively
charged nucleic acids have a high affinity for them. The transfer buffer used for the blotting usually
contains formamide because it lowers the annealing temperature of the probe-RNA interaction
preventing RNA degradation by high temperatures. Once the RNA has been transferred to the
membrane it is immobilized through covalent linkage to the membrane by UV light or heat. Af ter a
probe has been labeled, it is hybridized to the RNA on the membrane. The membrane is washed to
ensure that the probe has bound specifically. The hybrid signals are then detected by x-ray film and can
be quantified by densitometry.
Fig.47. Southern Blot

Joy P P, Surya S. and Aswathy C. 2015. Pineapple Research Station (Kerala Agricultura l University) Vazhakulam-686670 Muvattupuzha, Ernakulam, Kerala. Tel.: 0485-2260832, 9446010905, Email: [email protected], Web: prsvkm.kau.in
58 Laboratory Manual of Biochemistry
3.34.3. Western blot
The Western blot (alternatively, immunoblot) is used to detect specific proteins in a given sample of
tissue homogenate or extract. The method originated from the laboratory of George Stark at Stanford.
The name Western blot was given to the technique by W. Neal Burnette.
Procedure
The first step in a Western blot is to prepare the protein sample by mix ing it with a detergent called
Sodium dodecyl sulfate, which makes the proteins unfold into linear chains and coats then with a
negative charge. Next, the protein molecules are separated according to their sizes using a method
called gel electrophoresis. Following separation, the proteins are transferred from the gel onto a
blotting membrane. Although this step is what gives the technique the name "Western blotting," the
term is typically used to describe the entire procedure.
Once the transfer is complete, the membrane carries all of the protein bands originally on the gel. Next,
the membrane goes through a treatment called blocking, which prevents any nonspecific reactions from
occurring. The membrane is then incubated with an antibody called the primary antibody, which
specifically binds to the protein of interest. Following incubation, any unbound primary antibody is
washed away, and the membrane is incubated yet again, but this time with a secondary antibody that
specifically recognizes and binds to the primary antibody. The secondary antibody is linked to a reporter
enzyme that produces colour or light, which allows it to be easily detected and image d. These steps
permit a specific protein to be detected from among a mixture of proteins.
Fig.48. Northern Blot

Joy P P, Surya S. and Aswathy C. 2015. Pineapple Research Station (Kerala Agricultura l University) Vazhakulam-686670 Muvattupuzha, Ernakulam, Kerala. Tel.: 0485-2260832, 9446010905, Email: [email protected], Web: prsvkm.kau.in
59 Laboratory Manual of Biochemistry
3.35. Electrophoresis
General Description
The term electrophoresis means Electro= electric field + Phoresis= migration. So as the name indicates,
electrophoresis is a method of separation of charged molecules in an electric field.
The charged molecules under the influence of electric field migrate towards oppositely charged
electrodes. The molecules with positive charge move towards cathode and molecules with negative
charge move towards Anode. The migration is due to charge on the molecules and potential applied
across the electrodes.
Fig.50. Movement of charged particles in an electric field
Fig. 49.Western blot
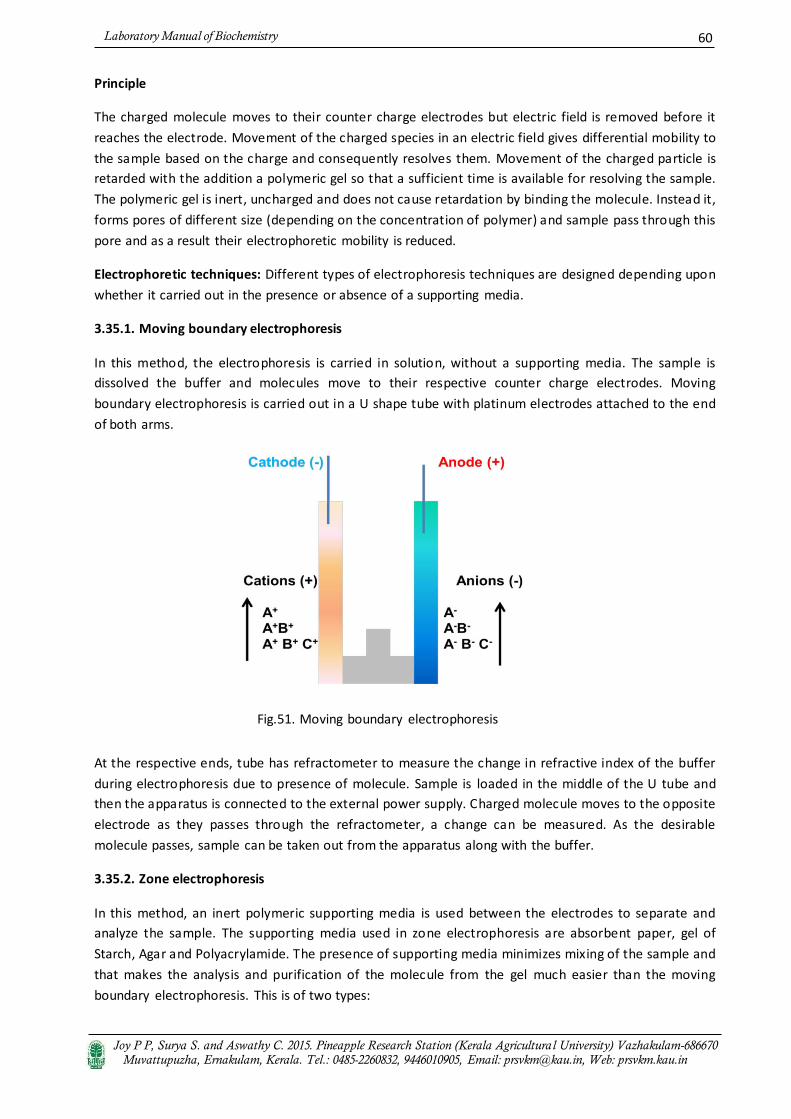
Joy P P, Surya S. and Aswathy C. 2015. Pineapple Research Station (Kerala Agricultura l University) Vazhakulam-686670 Muvattupuzha, Ernakulam, Kerala. Tel.: 0485-2260832, 9446010905, Email: [email protected], Web: prsvkm.kau.in
60 Laboratory Manual of Biochemistry
Principle
The charged molecule moves to their counter charge electrodes but electric field is removed before it
reaches the electrode. Movement of the charged species in an electric field gives differential mobility to
the sample based on the charge and consequently resolves them. Movement of the charged particle is
retarded with the addition a polymeric gel so that a sufficient time is available for resolving the sample.
The polymeric gel is inert, uncharged and does not cause retardation by binding the molecule. Instead it,
forms pores of different size (depending on the concentration of polymer) and sample pass through this
pore and as a result their electrophoretic mobility is reduced.
Electrophoretic techniques: Different types of electrophoresis techniques are designed depending upon
whether it carried out in the presence or absence of a supporting media.
3.35.1. Moving boundary electrophoresis
In this method, the electrophoresis is carried in solution, without a supporting media. The sample is
dissolved the buffer and molecules move to their respective counter charge electrodes. Moving
boundary electrophoresis is carried out in a U shape tube with platinum electrodes attached to the end
of both arms.
At the respective ends, tube has refractometer to measure the change in refractive index of the buffer
during electrophoresis due to presence of molecule. Sample is loaded in the middle of the U tube and
then the apparatus is connected to the external power supply. Charged molecule moves to the opposite
electrode as they passes through the refractometer, a change can be measured. As the desirable
molecule passes, sample can be taken out from the apparatus along with the buffer.
3.35.2. Zone electrophoresis
In this method, an inert polymeric supporting media is used between the electrodes to separate and
analyze the sample. The supporting media used in zone electrophoresis are absorbent paper, gel of
Starch, Agar and Polyacrylamide. The presence of supporting media minimizes mixing of the sample and
that makes the analysis and purification of the molecule from the gel much easier than the moving
boundary electrophoresis. This is of two types:
Fig.51. Moving boundary electrophoresis

Joy P P, Surya S. and Aswathy C. 2015. Pineapple Research Station (Kerala Agricultura l University) Vazhakulam-686670 Muvattupuzha, Ernakulam, Kerala. Tel.: 0485-2260832, 9446010905, Email: [email protected], Web: prsvkm.kau.in
61 Laboratory Manual of Biochemistry
3.35.2.1. Paper electrophoresis
Is a technique which employs a Whatman filter paper No.1 which is moistened by a buffer and then
connected at two ends to two opposite charged electrodes.
Then sample is applied on to one end and let for separation of components under electric field. After
separation, the paper is dried and stained to get coloured bands.
3.35.2. 2. Gel electrophoresis
3.35.2.2.1. Vertical Gel Electrophoresis
The electrophoresis in this system performed in a discontinuous way with buffer in the upper and lowe r
tank connected by the gel slab.
3.35.2.2.1. 1. SDS-Polyacrylamide gel electrophoresis (SDS-PAGE)
PAGE: Polyacrylamide gel electrophoresis (PAGE) is probably the most common analytical technique
used to separate and characterize proteins. A solution of Acryl amide and Bis-acryl amide is polymerized.
Acrylamide alone forms linear polymers. The Bis-acrylamide introduces cross links between
polyacrylamide chains. The 'pore size' is determined by the ratio of Acrylamide to Bis-acrylamide, and by
the concentration of Acryl amide. A high ratio of Bis-acryl amide to Acrylamide and a high Acrylamide
concentration cause low electrophoretic mobility. Polymerization of Acrylamide and Bis-acrylamide
monomers is induced by Ammonium per sulphate (APS), which spontaneously decomposes to form free
radicals. TEMED, a free radical stabilizer, is generally included to promote polymerization.
SDSPAGE: Sodium dodecyl sulfate (SDS) is an amphipathic detergent. It has an anionic head group and a
lipophilic tail. It binds non-covalently to proteins, with a stoichiometry of around one SDS molecule per
two amino acids. SDS causes proteins to denature and disassociate from each other (excluding covalent
cross-linking). It also confers negative charge. In the presence of SDS, the intrinsic charge of a protein is
Fig.52.Paper electrophoresis

Joy P P, Surya S. and Aswathy C. 2015. Pineapple Research Station (Kerala Agricultura l University) Vazhakulam-686670 Muvattupuzha, Ernakulam, Kerala. Tel.: 0485-2260832, 9446010905, Email: [email protected], Web: prsvkm.kau.in
62 Laboratory Manual of Biochemistry
masked. During SDS PAGE, all proteins migrate toward the anode (the positively charged electrode).
SDS-treated proteins have very similar charge-to-mass ratios, and similar shapes. During PAGE, the rate
of migration of SDS-treated proteins is effectively determined by molecular weight.
Instrument
It has two buffer chambers, upper chamber and a lower chamber. Both chambers are fitted with the
platinum electrodes connected to the external power supply from a power pack which supplies a direct
current or DC voltage. The upper and lower tank filled with the running buffer is connected by the
electrophoresis gel casted in between two glass plates (rectangular and notched). There are additional
accessories needed for casting the Polyacrylamide gel such as comb (to prepare different well), spacer,
gel caster etc.
Buffer and reagent for electrophoresis
N, N, N', N'-tetramethylethylenediamine (TEMED) - it catalyzes the Acrylamide polymerization.
Ammonium persulphate (APS)-it is an initiator for the Acrylamide polymerization.
Tris-HCl- it is the component of running and gel casting buffer.
Glycine- it is the component of running buffer.
Bromophenol blue- it is the tracking dye to monitor the progress of gel electrophoresis.
Coomassie brilliant blue R250- it is used to stain the Polyacrylamide gel.
Sodium dodecyl sulphate- it is used to denature and provide negative charge to the protein.
Acryl amide (a potent neurotoxin)-monomeric unit used to prepare the gel.
Bis-acrylamide- cross linker for polymerization of Acrylamide monomer to form gel.
Fig.53. SDS-PAGE Instrument

Joy P P, Surya S. and Aswathy C. 2015. Pineapple Research Station (Kerala Agricultura l University) Vazhakulam-686670 Muvattupuzha, Ernakulam, Kerala. Tel.: 0485-2260832, 9446010905, Email: [email protected], Web: prsvkm.kau.in
63 Laboratory Manual of Biochemistry
Casting of the gel
The Acrylamide solution (a mixture of monomeric Acrylamide and a bifunctional cross linker Bis-
acrylamide) is mixed with the TEMED and APS and poured immediately in between the glass plate fitted
into the gel caster. Ammonium persulphate in the presence of TEMED forms oxygen free radicals and
induces the polymerization of Acryl amide monomer to form a linear polymer. These linear monomers
are interconnected by the cross linking with Bis-acrylamide monomer to form a 3-D mesh with pores.
The size of pore is controlled by the concentration of Acryl amide and amount of Bis-acrylamide in the
gel.
In a vertical gel electrophoresis system, we cast two types of gels, stacking gel and resolving gel. First the
resolving gel solution is prepared and poured into the gel cassette for polymerization. A thin layer of
organic solvent (such as butanol or isopropanol) is layered to stop the entry of oxygen (oxygen
neutralizes the free radical and slow down the polymerization) and make the top layer smooth. After
polymerization of the resolving gel, a stacking gel is poured and comb is fitted into the gel for
construction of different lanes for the samples.
Fig.53.1 Casting of the Gel

Joy P P, Surya S. and Aswathy C. 2015. Pineapple Research Station (Kerala Agricultura l University) Vazhakulam-686670 Muvattupuzha, Ernakulam, Kerala. Tel.: 0485-2260832, 9446010905, Email: [email protected], Web: prsvkm.kau.in
64 Laboratory Manual of Biochemistry
Running of the gel
The sample is p epa ed i the loadi g d e o tai i g “D“, β- mercaptoethanol in glycerol to denature
the sample and presence of glycerol facilitates the loading of sample in the well. As the samples are
filled vertically there is a distance drift between the molecules at the top Vs at the bottom in a lane. This
problem is taken care once the sample runs through the stacking gel. The pH of the stacking gel is 6.8
and at this pH, glycine is moving slowly in the front whereas Tris- HCl is moving fast. As a result, the
sample gets sandwiched between Glycine-Tris and get stacked in the form of thin band. As the sample
enters into the resolving gel with a pH 8.8, the glycine is now charged, it moves fast and now sample
runs as per their molecular weight (due to SDS they have equal negative charge). After tracking dye
reaches to the bottom of the gel, gel is taken out from the glass plate with the help of a spatula and it is
stained with Coomassie brilliant blue R250 dye. The dye stains protein present on the gel.
3.35.2.2.2. Horizontal Gel Electrophoresis
The electrophoresis in this system is performed in a continuous way and the electrophoresis is
performed in the horizontal direction.
Fig.53.2.Running of the Gel Fig.53.3. Stained Gel
Fig.54. Horizontal Gel Electrophoresis

Joy P P, Surya S. and Aswathy C. 2015. Pineapple Research Station (Kerala Agricultura l University) Vazhakulam-686670 Muvattupuzha, Ernakulam, Kerala. Tel.: 0485-2260832, 9446010905, Email: [email protected], Web: prsvkm.kau.in
65 Laboratory Manual of Biochemistry
The electrophoresis in this gel system is performed in a continuous fashion with both electrodes and gel
cassette submersed within the buffer. The electrophoresis chamber has two platinum electrodes placed
on the both ends are connected to the external power supply from a power pack which supplies a direct
current or DC voltage. The tank filled with the running buffer and the gel casted is submerged inside the
buffer. There are additional accessories needed for casting the agarose gel such as comb (to prepare
different well), spacer, gel caster etc.
Buffer and reagent for electrophoresis
1. Agarose-polymeric sugar used to prepare horizontal gel for DNA analysis.
2. Ethidium bromide (a potent carcinogen)-for staining of the agarose gel to visualize the DNA.
3. Sucrose- For preparation of loading dye for horizontal gel.
4. Tris-HCl- The component of the running buffer.
5. Bromophenol blue-Tracking dye to monitor the progress of the electrophoresis.
Casting of the agarose gel
The Agarose powder is dissolved in a buffer (TAE or TBE) and heated to melt the Agarose. Hot Agarose is
poured into the gel cassette and allowed it to set. A comb can be inserted into the hot Agarose to cast
the well for loading the sample. In few cases, we can add Ethidium bromide within the gel so that it
stains the DNA while electrophoresis.
Fig.54.1. Casting of the Agarose Gel

Joy P P, Surya S. and Aswathy C. 2015. Pineapple Research Station (Kerala Agricultura l University) Vazhakulam-686670 Muvattupuzha, Ernakulam, Kerala. Tel.: 0485-2260832, 9446010905, Email: [email protected], Web: prsvkm.kau.in
66 Laboratory Manual of Biochemistry
Running and staining
The gel cassette is placed in the electrophoresis tank submerged completely and DNA loaded into the
well with the help of pipetman and run with a constant voltage. DNA runs from negative to positive end
and Ethidium bromide (EtBr) present in the gel stain the DNA. Observing the agarose gel in a UV-
chamber shows the DNA stained with EtBr as orange coloured fluorescence.
3.36. Chromatography
General Description
Chromatography is a physicochemical method for separation of complex mixtures.
Principle
Chromatography is a separation process that is achieved by distributing the components of a mixture
between two phases, a stationary phase and a mobile phase. Those components held preferentially in
the stationary phase are retained longer in the system than those that are distributed selectively in the
mobile phase. As a consequence, solutes are eluted from the system as local concentrations in the
mobile phase in the order of their increasing distribution coefficients with respect to the stationary
phase: a separation is achieved.
Types of Chromatography
3.36.1. On the basis of interaction of solute to stationary
3.36.1.1. Adsorption Chromatography
Adsorption chromatography utilizes a mobile liquid or gaseous
phase that is adsorbed onto the surface of a stationary solid
phase. The equilibration between the mobile and stationary
phase accounts for the separation of different solutes.
Here the molecules or components of the mixture travel with
different rates due to differences in their affinity towards
stationary phase.
Fig.54.2.Running of the Gel Fig.54.3. Visualization of the Gel
Fig.55. Adsorption Chromatography

Joy P P, Surya S. and Aswathy C. 2015. Pineapple Research Station (Kerala Agricultura l University) Vazhakulam-686670 Muvattupuzha, Ernakulam, Kerala. Tel.: 0485-2260832, 9446010905, Email: [email protected], Web: prsvkm.kau.in
67 Laboratory Manual of Biochemistry
Adsorption means a physical attachment between the compound and the particles of stationary phase.
Based on the nature, polar compounds adsorb with stronger or greater intensity to the polar stationary
phase while non-polar compounds adsorb better to the non-polar stationary phase than
polar components. Hence during separation of components, when we use a polar stationary phase,
polar components elute out late due to greater adsorption and non-polar components get out of the
column or elute out first. This is exactly reverse on using a non-polar stationary phase.
3.36.1.2. Partition Chromatography
This form of chromatography is based on a thin film formed on
the surface of a solid support by a liquid stationary phase.
Solute equilibrates between the mobile phase and the
stationary liquid.
Here the molecules get preferential separation in between
two phases. i.e. both stationary phase and mobile phase are
liquid in nature. So molecules get dispersed into either phase
preferentially.
Polar molecules get partitioned into polar phase and vice-verse. This mode of partition
chromatography applies to liquid-liquid, liquid-gas chromatography and not to solid-gas
chromatography. Because partition is the phenomenon in between a liquid and liquid or liquid and gas
or gas and gas. But not in solid involvement.
3.36.1.3. Ion Exchange Chromatography
In this type of chromatography, the use of a resin (the stationary solid phase) is used to covalently
attach anions or cations onto it. Solute ions of the opposite charge in the mobile liquid phase are
attracted to the resin by electrostatic forces. Ion exchange chromatography is commonly used to
separate charged biological molecules such as proteins, peptides, amino acids or nucleotides.
The amino acids that make proteins are zwitterionic
compounds that contain both positively and
negatively charged chemical groups. Depending on
the pH of the environment, proteins may carry a
net positive charge, a net negative charge, or no
charge. The pH at which a molecule has no net
charge is called its isoelectric point or PI.
In a buffer with a pH greater than the PI of the
protein of the interest, the protein will carry a net
negative charge; therefore, a positively charged
anion exchange resin is chosen to capture this
protein.
In a buffer with a pH greater than the PI of the
protein of interest, the protein will carry a net
negative charge; therefore, a positively charged
anion exchange resin is chosen to capture this
protein.
Fig.56. Partition Chromatography
Fig.57. Ion Exchange Chromatography

Joy P P, Surya S. and Aswathy C. 2015. Pineapple Research Station (Kerala Agricultura l University) Vazhakulam-686670 Muvattupuzha, Ernakulam, Kerala. Tel.: 0485-2260832, 9446010905, Email: [email protected], Web: prsvkm.kau.in
68 Laboratory Manual of Biochemistry
In a buffer with a pH lower than the pI of the protein of interest, the protein will carry a net positive
charge; therefore, a negatively charged cation exchange resin is chosen.
When an ion exchange chromatography column is loaded with a sample at a particular pH, all proteins
that are appropriately charged will bind to the resin.
3.36.1.4. Molecular Exclusion Chromatography
Also known as gel permeation or gel filtration, this between the stationary phase and solute. The liquid
or gaseous phase passes through a porous gel which separates the molecules according to its size. The
pores are normally small and exclude the larger solute molecules, but allow smaller molecules to enter
the gel, causing them to flow through a larger volume. This causes the larger molecules to pass through
the column at a faster rate than the smaller ones.
Molecular exclusion chromatography
separates molecules based on their size by
filtration through gel. The gel consists of
spherical beads containing pores of a
specific size distribution.
Separation occurs when molecules of
different sizes are included or excluded
from the pores within the matrix. Small
molecules diffuse in to the pores and their
flow through the column is retarded
according to their size, while large
molecules do not enter the pores and are
eluted in the columns void volume.
Consequently, molecules separate based on
their size as they pass through the column
and are eluted in order of decreasing
molecular weight.
3.36.2. On the basis of chromatographic bed
3.36.2.1. Column Chromatography
Column chromatography is a separation technique in which the stationary bed is within a tube. The
particles of the solid stationary phase or the support coated with a liquid stationary phase may fill the
whole inside volume of the tube (packed column) or be concentrated on or along the inside tube wall
leaving an open, unrestricted path for the mobile phase in the middle part of the tube (open tubular
column). Differences in rates of movement through the medium are calculated to different retention
times of the sample.
In Column chromatography, the stationary phase, a solid adsorbent, is placed in a vertical glass (usually)
column. The mobile phase, a liquid, is added to the top and flows down through the column by either
gravity or external pressure. Column chromatography is generally used as a purification technique: it
isolates desired compound from a mixture.
Fig.58. Molecular Exclusion Chromatography

Joy P P, Surya S. and Aswathy C. 2015. Pineapple Research Station (Kerala Agricultura l University) Vazhakulam-686670 Muvattupuzha, Ernakulam, Kerala. Tel.: 0485-2260832, 9446010905, Email: [email protected], Web: prsvkm.kau.in
69 Laboratory Manual of Biochemistry
The mixture to be analyzed by column chromatography is placed inside the top of the column. The liquid
solvent (or eluent) is passed through the column by the application of air pressure. An equilibrium is
established between the solute adsorbed on the adsorbent and the eluting solvent flowing down
through the column.
3.36.2.2. Planar Chromatography
Planar chromatography is a separation technique in which the stationary phase is present as or on a
plane. The plane can be a paper, serving as such or impregnated by a substance as the stationary bed
(paper chromatography) or a layer of solid particles spread on a support such as a glass plate (thin layer
chromatography). Different compounds in the sample mixture travel different distances according to
how strongly they interact with the stationary phase as compared to the mobile phase. The specific
Retention factor (Rf) of each chemical can be used to aid in the identification of an unknown substance.
Fig.59. Column Chromatography

Joy P P, Surya S. and Aswathy C. 2015. Pineapple Research Station (Kerala Agricultura l University) Vazhakulam-686670 Muvattupuzha, Ernakulam, Kerala. Tel.: 0485-2260832, 9446010905, Email: [email protected], Web: prsvkm.kau.in
70 Laboratory Manual of Biochemistry
3.36.2.2.1. Paper Chromatography
Paper chromatography is a technique that involves placing a small dot or line of sample solution onto a
strip of chromatography paper. The paper is placed in a jar containing a shallow layer of solvent and
sealed. As the solvent rises through the paper, it meets the sample mixture which starts to travel up the
paper with the solvent. This paper is made of Cellulose, a polar substance, and the compounds within
the mixture travel farther if they are non-polar. More polar substances bond with the cellulose paper
more quickly, and therefore do not travel as far.
3.36.2.2.2. Thin Layer Chromatography
Thin layer chromatography (TLC) is a widely employed
laboratory technique and is similar to paper
chromatography. However, instead of using a
stationary phase of paper, it involves a stationary
phase of a thin layer of adsorbent like Silica gel,
Alumina, or Cellulose on a flat, inert substrate.
Compared to paper, it has the advantage of faster
runs, better separations, and the choice between
different adsorbents. For even better resolution and
to allow for quantification, high-performance TLC can
be used.
3.36.2.3. Techniques by physical state of mobile
3.36.2.3.1. Gas Chromatography
Gas chromatography (GC) is a separation technique in which the
mobile phase is a gas. Gas chromatography is always carried out in
a column, which is typically "packed" or "capillary". Gas
chromatography (GC) is based on a partition equilibrium of analyte
between a solid stationary phase (often a liquid silicone-based
material) and a mobile gas (most often Helium).
Fig.60. Paper Chromatography
Fig.61.Thin Layer Chromatography
Fig.62. Gas Chromatography

Joy P P, Surya S. and Aswathy C. 2015. Pineapple Research Station (Kerala Agricultura l University) Vazhakulam-686670 Muvattupuzha, Ernakulam, Kerala. Tel.: 0485-2260832, 9446010905, Email: [email protected], Web: prsvkm.kau.in
71 Laboratory Manual of Biochemistry
The stationary phase is adhered to the inside of a small-diameter glass tube (a capillary column) or a
solid matrix inside a larger metal tube (a packed column). It is widely used in analytical chemistry;
though the high temperatures used in GC make it unsuitable for high molecular weight biopolymers or
proteins (heat will denature them), frequently encountered in biochemistry, it is well suited for use in
the petrochemical, environmental monitoring, and industrial chemical fields. It is also used extensively
in chemistry research.
3.36.2.3.2. Liquid Chromatography
Liquid chromatography (LC) is a separation technique in which
the mobile phase is a liquid. Liquid chromatography can be
carried out either in a column or a plane. Present day liquid
chromatography that generally utilizes very small packing
particles and a relatively high pressure is referred as high
performance liquid chromatography (HPLC).
3.36.2.3.3. Affinity Chromatography
Affinity chromatography is based on selective non-covalent interaction between an analyte and specific
molecules. Examples include antibody/antigen, enzyme/substrate, and enzyme/substrate interactions. It
is very specific, but not very robust. It is often used in biochemistry in the purification of proteins bound
to tags. These fusion proteins are labeled with compounds such as His-tags, biotin or antigens, which
bind to the stationary phase specifically. After purification, some of these tags are usually removed and
the pure protein is obtained. Affinity chromatography often utilizes a biomolecules affinity for a metal
(Zn, Cu, Fe, etc.).
3.36.2.3.4. High Performance Liquid Chromatography (HPLC)
HPLC instruments could develop up to 6,000 psi of pressure, and
incorporated improved injectors, detectors, and columns. With continued
advances in performance during this time smaller particles, even higher
pressure), the acronym HPLC remained the same, but the name was
changed to high performance liquid chromatography. High performance
liquid chromatography is now one of the most powerful tools in analytical
chemistry. It has the ability to separate, identify, and quantitate the
compounds that are present in any sample that can be dissolved in a liquid.
Fig.63. Liquid Chromatography
Fig.64. Affinity Chromatography
Fig.65. HPLC

Joy P P, Surya S. and Aswathy C. 2015. Pineapple Research Station (Kerala Agricultura l University) Vazhakulam-686670 Muvattupuzha, Ernakulam, Kerala. Tel.: 0485-2260832, 9446010905, Email: [email protected], Web: prsvkm.kau.in
72 Laboratory Manual of Biochemistry
Instrumentation
A reservoir (Solvent Delivery) holds the solvent (called the mobile phase, because it moves).
A high-pressure pump solvent manager is used to generate and meter a specified flow rate of
mobile phase, typically milliliters per minute.
An injector (sample manager or auto sampler) is able to introduce (inject) the sample into the
continuously flowing mobile phase stream that carries the sample into the HPLC column.
The column contains the chromatographic packing material needed to effect the separation.
This packing material is called the stationary phase because it is held in place by the column
hardware.
A detector is needed to see the separated compound bands as they elute from the HPLC column
(most compounds have no colour, so we cannot see them with our eyes). The mobile phase
exits the detector and can be sent to waste, or collected, as desired.
When the mobile phase contains a separated compound band, HPLC provides the ability to
collect this fraction of the eluate containing that purified compound for further study. This is
called preparative chromatography.
The high-pressure tubing and fittings are used to interconnect the pump, injector, column, and
detector components to form the conduit for the mobile phase, sample, and separated
compound bands.
The detector is wired to the computer data station, the HPLC system component that records
the electrical signal needed to generate the chromatogram on its display and to identify and
quantitate the concentration of the sample constituents.
Fig.65.1. HPLC Instrumentation

Joy P P, Surya S. and Aswathy C. 2015. Pineapple Research Station (Kerala Agricultura l University) Vazhakulam-686670 Muvattupuzha, Ernakulam, Kerala. Tel.: 0485-2260832, 9446010905, Email: [email protected], Web: prsvkm.kau.in
73 Laboratory Manual of Biochemistry
Since sample compound characteristics can be very different, several types of detectors have been
developed. For example, if a compound can absorb ultraviolet light, a UV-absorbance detector is used. If
the compound fluoresces, a fluorescence detector is used. If the compound does not have either of
these characteristics, a more universal type of detector is used, such as an evaporative-light-scattering
detector (ELSD). The most powerful approach is the use multiple detectors in series. For example, a UV
and/or ELSD detector may be used in combination with a mass spectrometer (MS) to analyze the results
of the chromatographic separation. This provides, from a single injection, more comprehensive
information about an analyte. The practice of coupling a mass spectrometer to an HPLC system is called
LC/MS.
3.37. Photometry and Spectrophotometry
Photometry is the measurement of the luminous intensity of light or the amount of luminous light falling
on a surface from such a source. Spectrophotometry is the measurement of the intensity of light at
selected wavelengths. The term photometric measurement was defined originally as the process used to
measure light intensity independent of wavelength. Modern instruments isolate a narrow wavelength
range of the spectrum for measurements. Those that use filters for this purpose are referred to as filter
photometers, where as those that use prisms or gratings are called spectrophotometers.
Principle
Light can be described as a wave. This wave has an electric component and a magnetic component
which are perpendicular to each other. Electromagnetic radiation exhibits a direction of propagation
and wave-like properties (i.e., oscillations).
The energy of electromagnetic radiation is defined as:
E = h / = hʋ
Where, E = e e g , h = Pla k's o sta t, = the speed of light, = the a e le gth, a d ʋ= frequency
Light behaves both as a wave and as a particle. The conceptual particle of light is called a photon and is
represented by hʋ. Electromagnetic radiation exhibits a wide spectrum and specific ranges of
wavelengths have names. The energy of electromagnetic radiation is inversely proportional to its
wavelength.
Fig.66. Definition of Light

Joy P P, Surya S. and Aswathy C. 2015. Pineapple Research Station (Kerala Agricultura l University) Vazhakulam-686670 Muvattupuzha, Ernakulam, Kerala. Tel.: 0485-2260832, 9446010905, Email: [email protected], Web: prsvkm.kau.in
74 Laboratory Manual of Biochemistry
When a light wave encounters a particle, or molecule, it can be either
scattered (i.e., direction changed) or absorbed (energy transferred).
Molecules can only absorb discreet packets of energy, or quanta. Absorption
occurs when the energy of the photon corresponds to differences between
energy levels in that particular molecule. Absorption of the energy from the
photon elevates the molecule to an excited state.
A molecule or substance that absorbs light is known as a chromophore. Chromophore exhibit unique
a so ptio spe t a a d a e defi ed a a ele gth of a i u a so ptio , o a . A la ge number of biological molecules absorb light in the visible and ultraviolet (UV) range.
The net effect of absorption is that the intensity of the light decreases as it passes through a solution
containing a chromophore. The amount of light absorbed depends on the nature of the chromophore,
the concentration of the chromophore, the thickness of the sample, and the conditions (e.g.: pH,
solvent, etc.)
Absorption is governed by the Beer-Lambert Law:
I = Io10-εd
or log(I/Io) = -εd
Where,
Io = initial light intensity, I = final light intensity, ε = molar extinction coefficient, d = thickness, and
c = molar concentration.
Absorption (A) will be defined by: A = -log I/Io = εd
Fig.67. Electro Magnetic Spectrum
Fig.68. A light Wave
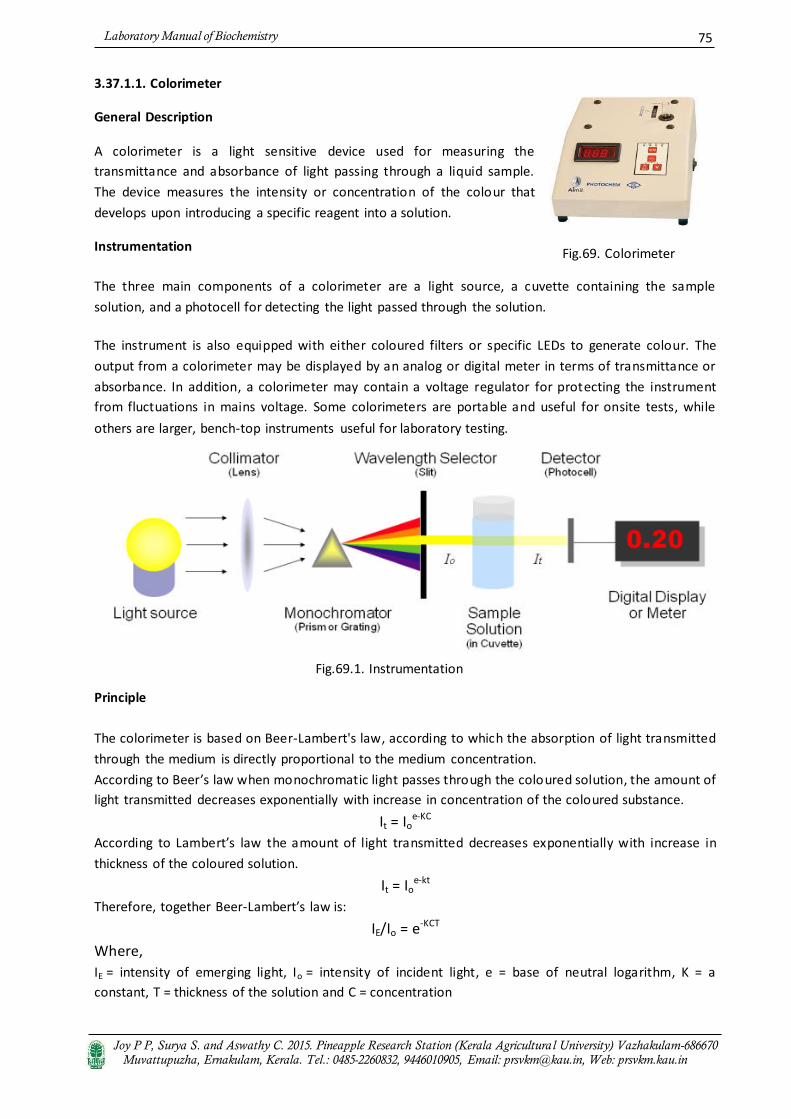
Joy P P, Surya S. and Aswathy C. 2015. Pineapple Research Station (Kerala Agricultura l University) Vazhakulam-686670 Muvattupuzha, Ernakulam, Kerala. Tel.: 0485-2260832, 9446010905, Email: [email protected], Web: prsvkm.kau.in
75 Laboratory Manual of Biochemistry
3.37.1.1. Colorimeter
General Description
A colorimeter is a light sensitive device used for measuring the
transmittance and absorbance of light passing through a liquid sample.
The device measures the intensity or concentration of the colour that
develops upon introducing a specific reagent into a solution.
Instrumentation
The three main components of a colorimeter are a light source, a cuvette containing the sample
solution, and a photocell for detecting the light passed through the solution.
The instrument is also equipped with either coloured filters or specific LEDs to generate colour. The
output from a colorimeter may be displayed by an analog or digital meter in terms of transmittance or
absorbance. In addition, a colorimeter may contain a voltage regulator for protecting the instrument
from fluctuations in mains voltage. Some colorimeters are portable and useful for onsite tests, while
others are larger, bench-top instruments useful for laboratory testing.
Principle
The colorimeter is based on Beer-Lambert's law, according to which the absorption of light transmitted
through the medium is directly proportional to the medium concentration.
A o di g to Bee s la he o o h o ati light passes th ough the oloured solution, the amount of
light transmitted decreases exponentially with increase in concentration of the coloured substance.
It = Ioe-KC
According to La e t s law the amount of light transmitted decreases exponentially with increase in
thickness of the coloured solution.
It = Ioe-kt
Therefore, together Beer-La e t s la is: IE/Io = e
-KCT
Where,
IE = intensity of emerging light, Io = intensity of incident light, e = base of neutral logarithm, K = a
constant, T = thickness of the solution and C = concentration
Fig.69. Colorimeter
Fig.69.1. Instrumentation

Joy P P, Surya S. and Aswathy C. 2015. Pineapple Research Station (Kerala Agricultura l University) Vazhakulam-686670 Muvattupuzha, Ernakulam, Kerala. Tel.: 0485-2260832, 9446010905, Email: [email protected], Web: prsvkm.kau.in
76 Laboratory Manual of Biochemistry
3.37.1.2. Spectrophotometer
General Description
The spectrophotometer is an instrument which measures the
amount of light of a specified wavelength which passes through a
medium. They produce monochromatic light and then accurately
measure the light intensity.
Principle
Spectrophotometer works with the principle of Beer-Lambert Law.
Instrumentation
The major components of a spectrophotometer are the light source, a monochromator, sample holder,
a light detector (phototube), and a meter.
In most instruments a tungsten lamp is used for the visible range and either high pressure H2 or D2 lamps
are used for UV range. Monochromatic light is generated by either
1) A movable prism,
2) A diffraction gradient, or
3) Filters.
Working
1. White light from a bulb (source) is focused into a narrow beam by passing it through a thin slit.
2. A prism is used to split the beam of white light into its component colours, in the same way that
water droplets can split sunlight into its component colours to make a rainbow. Different colours of light
have a different wavelength: the distance between the peaks of the light waves, measured in
nanometres (where 1 nanometre is 10-9metres).
3. A second thin slit, just after the prism, can be moved from side to side to select just one colour of light
to pass through to the sample.
4. The light passes through a container with the liquid sample inside (usually the light passes through 1
cm thickness of the liquid).
Fig.69.2. Spectrophotometer
Fig.69.3. Instrumentation

Joy P P, Surya S. and Aswathy C. 2015. Pineapple Research Station (Kerala Agricultura l University) Vazhakulam-686670 Muvattupuzha, Ernakulam, Kerala. Tel.: 0485-2260832, 9446010905, Email: [email protected], Web: prsvkm.kau.in
77 Laboratory Manual of Biochemistry
5. A light detector measures how much light is transmitted through the sample, and compares this with
how much light was emitted by the source. The difference between these values gives a measure of how
much light was absorbed by the sample: i.e., the absorbance (A), often also called the optical
density(OD). The absorbance varies with wavelength, so measurements of this type always specify the
wavelength of light that was shone through the sample.
3.37.1.3. Flame Photometer
General Description
Flame photometry is a branch of atomic spectroscopy is used for
inorganic chemical analysis for determining the concentration of
certain metal ions such as sodium, potassium, lithium, calcium,
cesium etc. In flame photometry the species (metal ions) used in
the spectrum are in the form of atoms.
Principle
The basis of flame photometric working is that, the species of alkali metals (Group I) and alkaline earth
metals (Group II) are dissociated due to the energy provided by the flame source. Atoms of many
metallic elements, when given sufficient energy such as that supplied by a hot flame, emit this energy at
wavelengths characteristic for the element. A specific amount or quantum of thermal energy is
absorbed by an orbital electron. The electrons being unstable in this high energy (excited) state, release
their excess energy as photons of a particular wavelength as they change from the excited state to their
previous or ground state. If the energy is dissipated as light, the light may consist of one or more than
one energy level and therefore of different wavelengths. These line spectra are characteristic for each
element. Under constant and controlled conditions, the light intensity of the characteristic wavelength
produced by each of the atoms is directly proportional to the number of atoms that are emitting e nergy,
which in turns directly proportional to the concentration of the substance of interest in the sample.
Table.2. Elements, Emitted wavelength and Characteristic colour on Flame photometry
Instrumentation
A cylinder of compressed gas: Various combinations of gases include acetylene and oxygen for
the hottest flame and natural gas acetylene and propane in combination with either O2 or
compressed air.
Name of the element Emitted wavelength range (nm) Observed colour of the flame
Potassium (K) 766 Violet
Calcium (Ca) 622 Orange
Sodium (Na) 589 Yellow
Magnesium (Mg) 285 Blue
Fig.70. Flame Photometer

Joy P P, Surya S. and Aswathy C. 2015. Pineapple Research Station (Kerala Agricultura l University) Vazhakulam-686670 Muvattupuzha, Ernakulam, Kerala. Tel.: 0485-2260832, 9446010905, Email: [email protected], Web: prsvkm.kau.in
78 Laboratory Manual of Biochemistry
Two stage pressure regulator: High pressure tubing must be used to lead the gases to the
flame.
Source of flame: A burner that provides flame and can be maintained in a constant form and at
a constant temperature.
Nebulizer and mixing chamber: Helps to transport the homogeneous solution of the substance
into the flame at a steady rate.
Optical system (optical filter): The optical system comprises three parts: convex mirror, lens and
filter. The convex mirror helps to transmit light emitted from the atoms and focus the emissions
to the lens. The convex lens help to focus the light on a point called slit. The reflections from the
mirror pass through the slit and reach the filters. This will isolate the wavelength to be
measured from that of any other extraneous emissions. Hence it acts as interference type colour
filters.
Photo detector: Detect the emitted light and measure the intensity of radiation emitted by the
flame. That is, the emitted radiation is converted to an electrical signal with the help of photo
detector. The produced electrical signals are directly proportional to the intensity of light.
Working
Nebulisation: The solution of the substance to be analyzed is first aspirated into the burner, which is
then dispersed into the flame as fine spray particles.
Overview of the Process
The solvent is first evaporated leaving fine divided solid particles.
This solid particles move towards the flame, where the gaseous atoms and ions are produced.
The ions absorb the energy from the flame and excited to high energy levels.
When the atoms return to the ground state radiation of the characteristic element is emitted.
The intensity of emitted light is related to the concentration of the element.
Fig.70.1. Instrumentation

Joy P P, Surya S. and Aswathy C. 2015. Pineapple Research Station (Kerala Agricultura l University) Vazhakulam-686670 Muvattupuzha, Ernakulam, Kerala. Tel.: 0485-2260832, 9446010905, Email: [email protected], Web: prsvkm.kau.in
79 Laboratory Manual of Biochemistry
3.37.1.4. Atomic Absorption Spectrophotometer
General Description
Atomic absorption Spectrophotometry (AAS) is widely used for the
quantitative determination of chemical elements using the
absorption of optical radiation (light) by free atoms in the gaseous
state. In AAS two main types of atomization sources used, flame and
graphite furnace.
Principle
Atomic Absorption (AA) occurs when a ground state atom absorbs energy in the form of light of a
specific wavelength and is elevated to an excited state. The amount of light energy absorbed at this
wavelength will increase as the number of atoms of the selected element in the light path increases.
The relationship between the amount of light absorbed and the concentration of analytes present in
known standards can be used to determine unknown sample concentrations by measuring the amount
of light they absorb.
Instrumentation
Atomic absorption spectrophotometry requires a primary light source, an atom source. The light source
normally used is a hollow cathode lamp (HCL) or an electrode less discharge lamp (EDL). In general, a
different lamp is used for each element to be determined, although in some cases, a few elements may
be combined in a multi-element lamp. The light from the lamp is directed through a flame onto a
monochromator, which selects the preferred analytical wavelength. The light from the monochromator
is detected by a photo multiplier tube and converted to an electrical signal.
Fig.70.2. Overall Process occurs in a Flame Photometer
Fig.71. Atomic Absorption Spectrophotometer

Joy P P, Surya S. and Aswathy C. 2015. Pineapple Research Station (Kerala Agricultura l University) Vazhakulam-686670 Muvattupuzha, Ernakulam, Kerala. Tel.: 0485-2260832, 9446010905, Email: [email protected], Web: prsvkm.kau.in
80 Laboratory Manual of Biochemistry
Working
In general, after choosing the proper hollow cathode lamp for the analysis, the lamp should be allowed
to warm up for a minimum of 15 minutes unless operated in a double beam mode. During this period,
align the instrument, position the monochromator at the correct wavelength, select the proper
o o h o ato slit idth, a d adjust the hollo athode u e t a o di g to the a ufa tu e s recommendation. Subsequently, light the flame and regulate the flow of fuel and oxidant, adjust the
burner and nebulizer flow rate for maximum percent absorption and stability, and balance the
photometer. Run a series of standards of the element under analysis and construct a calibration curve
by plotting the concentrations of the standards against the absorbance. For those instruments which
read directly in concentration set the curve corrector to read out the proper concentration. Aspirated
the samples and determined the concentrations either directly or from the calibration curve. Standards
must be run each time a sample or series of samples are run.
3.37.1.4.1. Graphite furnace AAS
Graphite Furnace Atomic Absorption Spectrometry (GFAAS) (also
known as Electro thermal Atomic Absorption Spectrometry (ETAAS))
is a type of spectrometry that uses a graphite-coated furnace to
vaporize the sample. In GFAAS, samples are deposited in a
small graphite or pyrolytic carbon coated graphite tube, which can
then be heated to vapourize and atomize the analyte.
Fig.71.1. Instrumentation
Fig.72. Graphite furnace AAS

Joy P P, Surya S. and Aswathy C. 2015. Pineapple Research Station (Kerala Agricultura l University) Vazhakulam-686670 Muvattupuzha, Ernakulam, Kerala. Tel.: 0485-2260832, 9446010905, Email: [email protected], Web: prsvkm.kau.in
81 Laboratory Manual of Biochemistry
Principle
Graphite furnace AAS (GFAAS) involves electro thermal atomization inside a graphite tube furnace
instead of flame atomization.
Instrumentation
A source of light (lamp) that emits resonance line radiation.
An atomization chamber (graphite tube) in which the sample is vapourized.
A monochromator for selecting only one of the characteristic wavelengths (visible or ultraviolet)
of the element of interest.
A detector, generally a photomultiplier tube.
A signal processor, computer system.
Working
With Graphite Furnace Atomic Absorption (GFAA), the sample is introduced directly into a graphite tube,
which is then heated in a programmed series of steps to remove the solvent and major matrix
components and to atomize the remaining sample. All of the analyte is atomized, and the atoms are
retained within the tube (and the light path, which passes through the tube) for an extended period of
time.
Due to the small volume of the tube (9 x 50 mm), small volumes (1-100µl) of sample can be analyzed
and the technique is more sensitive than flame AAS. Detection l imits for most metals are 100-1000
lower with GFAAS than with flame AAS. GFAAS may be used to analyze those samples which contain
metal concentrations below the detection limit of the flame AAS.
3.37.1.5. Mass spectrometer
Mass spectrometry is a powerful technique that is used to
identify unknown compounds, to quantify known compounds,
and to elucidate the structure and chemical properties of
molecules. Detection of compounds can be accomplished with
very minute quantities (as little as 10-12 to 10-15 molecules for a
compound of mass 1000 Daltons). The compounds can be
identified at very low concentrations in chemical complex
mixtures.
Fig.72.1. Instrumentation
Fig.73. Mass spectrometer

Joy P P, Surya S. and Aswathy C. 2015. Pineapple Research Station (Kerala Agricultura l University) Vazhakulam-686670 Muvattupuzha, Ernakulam, Kerala. Tel.: 0485-2260832, 9446010905, Email: [email protected], Web: prsvkm.kau.in
82 Laboratory Manual of Biochemistry
Principle
A Mass spectrometer is an instrument that measures the masses of individual molecules that have been
converted into ions, i.e., molecules that have been electrically charged.
Components of a Mass Spectrometer
Components of the mass spectrometer are:
Inlet system
Ion source
Mass analyzer and
Detector
Samples can be introduced to the mass spectrometer directly via. Solids probe, or in the case of
mixtures, by the intermediary of chromatography devices (e.g. Gas chromatography, Liquid
chromatography). Once in the source, sample molecules are subjected to ionization. Ions formed in the
source acquire some kinetic energy and leave the source. A calibrated analyzer then analyzes the
passing ions as function of their mass to charge ratios. Different kind of analyzer can be used viz .
Magnetic, Quadrupole, Ion trap, Fourier Transform, Time of Flight etc. The ion beam exiting the analyzer
assembly is then detected and the signal is registered.
The analyzer and detector of the mass spectrometer and often the ionization source too, are maintained
under high vacuum to give the ions a reasonable chance of travelling from one end of the instrument to
the other without any hindrance process also, is under complete data system control on modern mass
spectrometers.
Methods of Sample Ionization
Electron Ionization and Chemical Ionization
Electron Ionization (EI) is widely used in mass spectrometry for relatively volatile samples that are
insensitive to heat and have relatively low molecular weight. The spectra, usually containing many
fragmentation peaks, are useful for structural characterization and identification. Small impurities in the
sample are easy to detect. Chemical Ionization (CI) is used to enhance the abundance of the molecular
ion. For both ionization methods, the molecular weight range is 50 to 800 Da.
Fig.73.1. Instrumentation

Joy P P, Surya S. and Aswathy C. 2015. Pineapple Research Station (Kerala Agricultura l University) Vazhakulam-686670 Muvattupuzha, Ernakulam, Kerala. Tel.: 0485-2260832, 9446010905, Email: [email protected], Web: prsvkm.kau.in
83 Laboratory Manual of Biochemistry
Fast Atom Bombardment Ionization
Fast atom bombardment ionization is a softer ionization method than EI. The spectrum often contains
peaks from the matrix, which is necessary for ionization, a few fragments and a peak for a protonated or
deprotonated sample molecules. FAB is used to obtain the molecular weight of sensitive, non-volatile
compounds.
MALDI-TOF
Matrix-assisted laser desorption/ionization (MALDI) is a soft ionization technique used in mass
spectrometry, allowing the analysis of biomolecules (biopolymers such as DNA, proteins, peptides and
sugars) and large organic molecules such as polymers and other macromolecules, which tend to be
fragile and fragment when ionized by more conventional ionization methods. It is similar in character to
electro spray ionization (ESI) in that both techniques are relatively soft ways of obtaining large ions in
the gas phase, though MALDI produces far fewer multiply charged ions.
Electron spray Ionization (ESI)
Electron spray Ionization allows production of molecular ions directly from samples in solution. It can be
used for small and large molecular-weight biopolymers (proteins, peptides, carbohydrates and DNA
fragments), and lipids. ESI is different than other atmospheric pressure ionization processes (e.g. MALDI)
since it may produce multiply charged ions, effectively extending the mass range of the analyzer to
accommodate the kDa-MDa orders of magnitude observed in proteins and their associated polypeptide
fragments.
ESI uses electrical energy to assist the transfer of ions from solution into the gaseous phase before they
are subjected to mass spectrometric analysis. Ionic species in solution can thus be analyzed by ESI -MS
with increased sensitivity. Neutral compounds can also be converted to ionic form in solution or in
gaseous phase by protonation or cationisation (e.g. metal cationisation), and hence can be studied by
ESI-MS.
The transfer of ionic species from solution into the gas phase by ESI involves three steps:
(1) Dispersal of a fine spray of charge droplets, followed by
(2) Solvent evaporation and
(3) Ion ejection from the highly charged droplets.
Tube, which is maintained at a high voltage (e.g. 2.5 – 6.0 KV) relative to the wall of the surrounding
chamber. A mist of highly charged droplets with the same polarity as the capillary voltage is generated.
The application of a nebulising gas (e.g. nitrogen), which shears around the eluted sample solution,
enhances a higher sample flow rate. The charged droplets, generated at the exit of the electro spray tip,
pass down a pressure gradient and potential gradient toward the analyzer region of the mass
spectrometer. With the aid of an elevated ESI-source temperature and/or another stream of nitrogen
drying gas, the charged droplets are continuously reduced in size by evaporation of the solvent, leading
to an increase of surface charge density and a decrease of the droplet radius. Finally, the electric field
strength within the charged droplet reaches a critical point at whic h it is kinetically and energetically
possible for ions at the surface of the droplets to be ejected into the gaseous phase. The emitted ions

Joy P P, Surya S. and Aswathy C. 2015. Pineapple Research Station (Kerala Agricultura l University) Vazhakulam-686670 Muvattupuzha, Ernakulam, Kerala. Tel.: 0485-2260832, 9446010905, Email: [email protected], Web: prsvkm.kau.in
84 Laboratory Manual of Biochemistry
are sampled by a sampling skimmer cone and are then accelerated into the mass analyzer for
subsequent analysis of molecular mass and measurement of ion intensity.
Fig.73.2. Electron spray Ionization

Joy P P, Surya S. and Aswathy C. 2015. Pineapple Research Station (Kerala Agricultura l University) Vazhakulam-686670 Muvattupuzha, Ernakulam, Kerala. Tel.: 0485-2260832, 9446010905, Email: [email protected], Web: prsvkm.kau.in
85 Laboratory Manual of Biochemistry
D. Fruit Analysis
4. Pineapple
Pineapple, Ananas comosus, belongs to the Bromeliaceae family. It
originated in America and later spread in European countries. Now it is
widely available in India. It is the most amazing fruit packed with nutrients
and health benefits. Pineapples are actually not just one fruit but a
composite of many flowers whose individual fruitlets fuse together around
a central core. Each fruit let can be identified by an "eye," the rough spiny
marking on the pineapples surface. Pineapples have a wide cylindrical
shape, a scaly green, brown or yellow skin and a regal crown of spiny, blue-
green leaves. The fibrous flesh of pineapple is yellow in colour and has a
vibrant tropical flavour that balances the tastes of sweet and tart. The area
closer to the base of the fruit has more sugar content and therefore a
sweeter taste and more tender texture.
Calcium, Magnesium and Phosphorus
Provide strength to bones
Copper
Helps red blood corpuscle synthesis
Vitamin A and β-Carotene
Improving the working efficiency of the immune system,
Perking up eyesight strength and defending from free radicals
Vitamin B and its derivatives B-1, B-3, B-5, B-6, B-9 and Iron
Good for mouth
Potassium
Supports in scheming the heart rate and blood pressure
Manganese, Sodium, Selenium and Zinc
Essential for optimum growth and development of the body
Bromelain
Help to eliminate arthritis, Diminish blood clots, Relief from
constipation, cancer, Improve immunity, Anti -inflammatory
property
Vitamin C
Boost up the immune system, Avert cough and cold, Excellent for
skin, Anti-oxidant possessions, Improve immunity
Vitamin B1 and Vitamin B6
Superior for vigor manufacture and the breakdown of sugars
and starches in digestive track of body.
Principle Nutrient
Value
Percentage of
RDA (%)
Energy 50 Kcal 2.5
Carbohydra
tes
13.52 g 10
Protein 0.54 g 1
Total Fat 0.12 g <1
Cholesterol 0 mg 0
Dietary
Fiber
1.40 g 4
Vitamins
Folates 18 µg 4.5
Niacin 0.500 mg 4
Pyridoxine 0.112 mg 9
Riboflavin 0.018 mg 1.5
Thiamin 0.079 mg 6.5
Vitamin A 58 IU 2
Vitamin C 47.8 mg 80
Vitamin E 0.02 mg <1
Vitamin K 0.07 µg 0.5
Minerals
Sodium 1 mg 0
Potassium 109 mg 2.5
Calcium 13 mg 1.3
Copper 0.110 mg 12
Iron 0.29 mg 3.5
Magnesium 12 mg 3
Manganese 0.927 mg 40
Phosphorus 8 mg 1
Selenium 0.1 µg <1
Zinc 0.12 mg 1
Phyto Nutrients
Carotene-β 35 µg --
Crypto-
xanthin-β
0 mcg -- Fig.75. Health Benefits of Pineapple
Fig.74. Pineapple
(Ananas comosus)
Table.3. Pineapple
Nutritive Value per 100 g

Joy P P, Surya S. and Aswathy C. 2015. Pineapple Research Station (Kerala Agricultura l University) Vazhakulam-686670 Muvattupuzha, Ernakulam, Kerala. Tel.: 0485-2260832, 9446010905, Email: [email protected], Web: prsvkm.kau.in
86 Laboratory Manual of Biochemistry
4.1. Basic Fruit Analysis of Pineapple
4.1.1. Collection of Pineapple fruit Samples
4.1.1.1. Selection of Fruits
All the fruits are required for the physical or chemical
studies. Selection is randomized or individual fruits are
selected for studies. Select a pineapple that is plump and
fresh-looking. The leaves in the crown should be fresh and
green, and the body of the pineapple firm. The first method
is to look at the scales on the side of the pineapple. These
are called eyes. If a pineapple has eyes of a uniform size all
the a to the top, that s a good sig the pi eapple is ipe.
Avoid the ones where the eyes near the top are significantly smaller than the ones at the base. The
second is to smell the bottom of the pineapple where the cut stem is located. It should have a faint
pineapple scent, but should not smell too strong or fermented. Too strong a pineapple smell means that
the pineapple is overripe and might be mushy. Picking the small leaves on the top of the pineapple near
the centre of the rosette can also tell you if it is ready, as long as the leaves are not wilted.
4.1.1.2. Method of Plucking
Plucking of pineapple fruit is actually done with a sharp cutting
instrument, can be a cutter or a knife which gives a clean and
smooth cut on the stock. Try to get a uniform stock length.
Proper documentation and labeling were done prior and after
harvesting.
4.1.1.3. Sorting
Fruits for analysis are sorted. The fruits showing any symptom of infection or damage on surface should
be scrupulously rejected and only healthy are sorted for conducting study.
4.1.1.4. Surface Cleaning
After cutting off the stalks or other foliage parts which remain attached to the fruits after harvest, they
should be meticulously cleaned before use. Surface cleaning can be done by using clean dry/ moistened
cloth piece.
4.1.1.5. Bringing to analytical laboratory
Fruits of pineapple are brought to the laboratory as soon as possible after they are plucked and stored
in the same atmosphere conditions to maintain the minimal change of the physio-chemical conditions.
Fig.76. Selection of Pineapple Fruits
Fig.77. Plucking of Pineapple Fruit

Joy P P, Surya S. and Aswathy C. 2015. Pineapple Research Station (Kerala Agricultura l University) Vazhakulam-686670 Muvattupuzha, Ernakulam, Kerala. Tel.: 0485-2260832, 9446010905, Email: [email protected], Web: prsvkm.kau.in
87 Laboratory Manual of Biochemistry
4.1.2. Determination of Constituents by Physical Methods
There may in fact, be a large number of physical characteristics of fruits that are worthy to test. Those
are as follows
4.1.2.1. Weight
Weight of a fruit is considered to be an important factor in judging its
compactness, maturity, juice content, carbohydrate and other chemical
constituents. It is done by physical balance. Balance should be properly set,
placed and leveled, accuracy ensured before use, weighing done accurately
and the reading noted carefully.
4.1.2.2. Volume
Volume that is the size of a fruit is another important factor. In market consumers prefer large-sized
ones for many fruits. Volume of the fruit can be determined by measuring the volume of a liquid that is
water which is actually displaced by it.
4.1.2.3. Overall Length
The length of a fruit is referred to by many as the space, that is, straight line distance between its stalk-
end and the stylar end. It appears to be more appropriate to consider the total length of a fruit, which
may be termed as its overall length. This can be done by slide calipers, L-shaped sets etc.
4.1.2.4. Maximum width
To refer width, the diameter of a fruit in its centre is emphasized. It can be done by measuring the
distance from the extreme points at two sides using slide calipers, L-shaped sets etc.
4.1.2.5. Shape
Fruits belonged to a species or a variety of it has some characteristic shape of their own, although
variation within some limit is not considered to be an uncommon feature.
Fig.78. Balance
Fig.79. Slide caliper

Joy P P, Surya S. and Aswathy C. 2015. Pineapple Research Station (Kerala Agricultura l University) Vazhakulam-686670 Muvattupuzha, Ernakulam, Kerala. Tel.: 0485-2260832, 9446010905, Email: [email protected], Web: prsvkm.kau.in
88 Laboratory Manual of Biochemistry
4.1.2.6. Firmness/ Pulp firmness
Firmness of a healthy fruit is linked to the degree of its physiological maturity. With
progress of development, maturation and ripening either in the pre-harvest or in the
post-harvest condition, the fruits undergo gradual softening to a greater or a lesser
extent depending on species, varieties, environment and the use of agro-inputs.
Enzymatic conversion of pectic compounds may cause this. This can be measured by
penetrometer, by hand-feeling, and by pin drop method.
4.1.2.7. Peel colour
The colour of the fruit surface is an important factor in determining an appeal to the consumers. The
change in colour is due to accumulation of one or more forms of pigments in different combinations.
This can be measured by, the use of colour-dictionary, eye-estimation etc.
4.1.2.8. Peel smoothness
The peels of fruits get smoothened with advancement of their development, maturation and ripening. In
pineapple, the eyes become less raised. It can be judged by hand feeling of a group of testers.
4.1.2.9. Peel wax
Plant wax is an ester of a higher fatty acid with long chain alcohol other that glycerol. It can be done by
simply rubbing the surface with fingers or using a tissue paper.
Fig.80. Penetrometer
Fig.81. Peel colour
Fig.82. Peel smoothness

Joy P P, Surya S. and Aswathy C. 2015. Pineapple Research Station (Kerala Agricultura l University) Vazhakulam-686670 Muvattupuzha, Ernakulam, Kerala. Tel.: 0485-2260832, 9446010905, Email: [email protected], Web: prsvkm.kau.in
89 Laboratory Manual of Biochemistry
4.1.2.10. Peel thickness
The thickness of the peel is considered to be a character of importance of many fruits. To measure the
peel thickness, it has to be excoriated from the fruit. It should be carefully cut out with a knife in order
to separate from the inner part of the fruit. Slide calipers are used to measure the thickness.
4.1.2.11. Colour of the edible part
The colour of the inside part undergoes change with progress of their development. The color changes
are due to various combinations of chlorophylls, carotene, xanthophylls, anthocyanin, anthoxanthin etc.
So, by estimating the relative intensity of the colour may be done by chemical analysis of pigments or by
several group eye estimations. Juice colour can be determined by optical density value, which is done in
colorimeter. Absorbance is obtained against distilled water.
4.1.2.12. Edible matter content
Although in fruit culture, the quantitative productivity of a fruit crop is
conventionally determined in considering the yield of the whole fruits or
the number of them that are harvested from a given number of trees or
an unit area of land, it is more apposite to determine how much matter
that is consumable to the human beings has actually been obtained from
the same trees or plants or the same area of land. In pineapple outer
rachis, bract, perianth and pericarp all fused together. In it usually we get
approximately 68% of human consumable matter. It can be measured by,
Fig.83. Peel thickness
Fig.84. Colour of the edible part
Fig.85. Edible matter content

Joy P P, Surya S. and Aswathy C. 2015. Pineapple Research Station (Kerala Agricultura l University) Vazhakulam-686670 Muvattupuzha, Ernakulam, Kerala. Tel.: 0485-2260832, 9446010905, Email: [email protected], Web: prsvkm.kau.in
90 Laboratory Manual of Biochemistry
Weight of consumable matter (g)/weight of whole intact fruits (g) x 100
or
Volume of juice (ml)/ weight of the whole intact fruit (g) x 100
4.1.2.13. Flavour
Flavour is charm to a fruit. Flavour is due to the existence of adverse type of volatile compounds e.g.,
alcohols, esters, aldehydes, ketones, ethers, halides, hydrocarbons and others in different proportions.
It will change with development. It can be measured by ultra-sophisticated chemical procedures or by
smelling power of expert persons.
4.1.2.14. Seed content
Presence of seeds in a fruit is considered a demerit or a merit. Consumers always prefer seedless fruits.
But seeds are required for the production of seedlings. Seed content can be measured by conventional
way, cutting and removed by rubbing and washing. Records to keep usually include the number of bold
and less bold seeds per fruit and weight of one hundred seeds. Viability of seeds also sometimes
considered.
4.3. Sample Preparation for Chemical Analysis
Pineapple is belonging to the pulpy fruits. The pulpy fruit consists of those, fleshy pulp of which serves
as the edible part.
Firstly, the fleshy edible part of a pulpy fruit should be scrupulously taken out from the given sample of
fruit. The non-edible parts of them have no use and hence, are discarded. Then the pulpy fruit is cut into
very small pieces after which, the pieces should thoroughly mixed together and piled at a place. The pile
is then disrupted to make several lots from it at random basis. From each lot, some pieces are picked up
randomly and these are mixed together and heaped again while the remaining ones are discarded. This
heap of pieces is broken and several lots are made in the same way as before. This process is repeated
several times and lastly, the representative sample for analysis is obtained.
Fig.86. Seed content

Joy P P, Surya S. and Aswathy C. 2015. Pineapple Research Station (Kerala Agricultura l University) Vazhakulam-686670 Muvattupuzha, Ernakulam, Kerala. Tel.: 0485-2260832, 9446010905, Email: [email protected], Web: prsvkm.kau.in
91 Laboratory Manual of Biochemistry
5. Passion fruit
Passion fruit is a member of Passiflora and grows on a climbing plant. Passion fruit is native from Brazil.
It is a woody, perennial vine that bears a delicious fruit .There is mainly three types of passion fruit
under cultivation. They are the yellow passion fruit (Passif lora edulis forma flavicarpa) which is
suited to tropical conditions or the plains, the purple passion fruit (Passif lora edulis forma edulis )
which grows best under sub-tropical conditions or high altitudes and the giant
granadilla (Passif lora quadrangularis).
The plants have a weak taproot and extensive ivory-coloured lateral roots. The stem is usually solitary,
up to 7 cm in basal diameter, extends 5 to 10 m or more into the crowns of trees, and is covered by a
thin, flaky, light brown bark. The stem-wood is light and brittle. The twigs are yellow-green, turning
brown, and support themselves on vegetation by means of tendrils that arise at the leaf axils. The leaves
are alternate, green to yellow-green, three-lobed (on mature plants) with serrate edges. The petioles
are 3 to 6 cm long and the blades are 5 to 11 cm long by 4 to 10 cm broad. Solitary flowers arise at the
leaf axils. The flowers measure 5 to 7 cm across with five greenish-white sepals and five white petals
topped with a fringe-like corona of straight purple and white rays. There are five stamens with large
anthers and a triple-branched style. The fruit is globose or ovoid, purple or yellow and 4 to 7 cm in
diameter. Inside a thick rind are many dark-brown to black seeds enveloped in small sacs filled with
aromatic yellow or orange juice.
Giant granadilla (Passiflora quadrangularis)
The giant granadilla, Passiflora quadrangularis, produces the largest
fruit any species within the genus Passiflora. The fruit appears to be
in round or ovoid shape and measuring about 20 to 30 centimetres
in length and 18 centimetres in diameter. The fruit has a tough peel
with a waxy nature; the peel ranges in shade from dark purple to
light yellow or pumpkin colour which is sweet and acidulous.
Health Benefits of Giant Granadilla
Use as an antiscorbutic (prevention or relief of scurvy) and
stomachic.
The flesh is set as a sedative to get relieve from the nervous
headache, asthma, diarrhea, dysentery, neurasthenia and
insomnia.
The leaf decoction is a vermifuge (a medicine that expels
intestinal worms) and is used for bathing skin afflictions
(Pain or suffering).
Leaf poultices are applied for liver complaints.
Powdered root when mixed with oil is used as a soothing
poultice.
The leaf extraction is used as a medicine to treat intestinal
writhes cured.
Principle Thick Flesh
Arils and Seeds
Moisture 94.4 g 78.4 g
Protein 0.112 g 0.299 g
Fat 0.15g 1.29 g
Crude Fiber 0.7 g 3.6 g
Ash 0.41 g 0.80 g
Minerals
Calcium 13.8 mg 9.2 g
Phosphorus 17.1 mg 39.3 g
Iron 0.80 mg 2.93 mg
Vitamins
Thiamine 0.004 mg 0.019 mg
Riboflavin - 0.003 mg
Niacin 0.033 mg 0.120 mg
Ascorbic Acid 0.378 mg 15.3 mg
Phyto Nutrients
Carotene 14.3 mg -
Fig.87. Giant granadilla
(Passif lora quadrangularis)
Table.4. Giant granadilla
Nutritive Value per 100 g
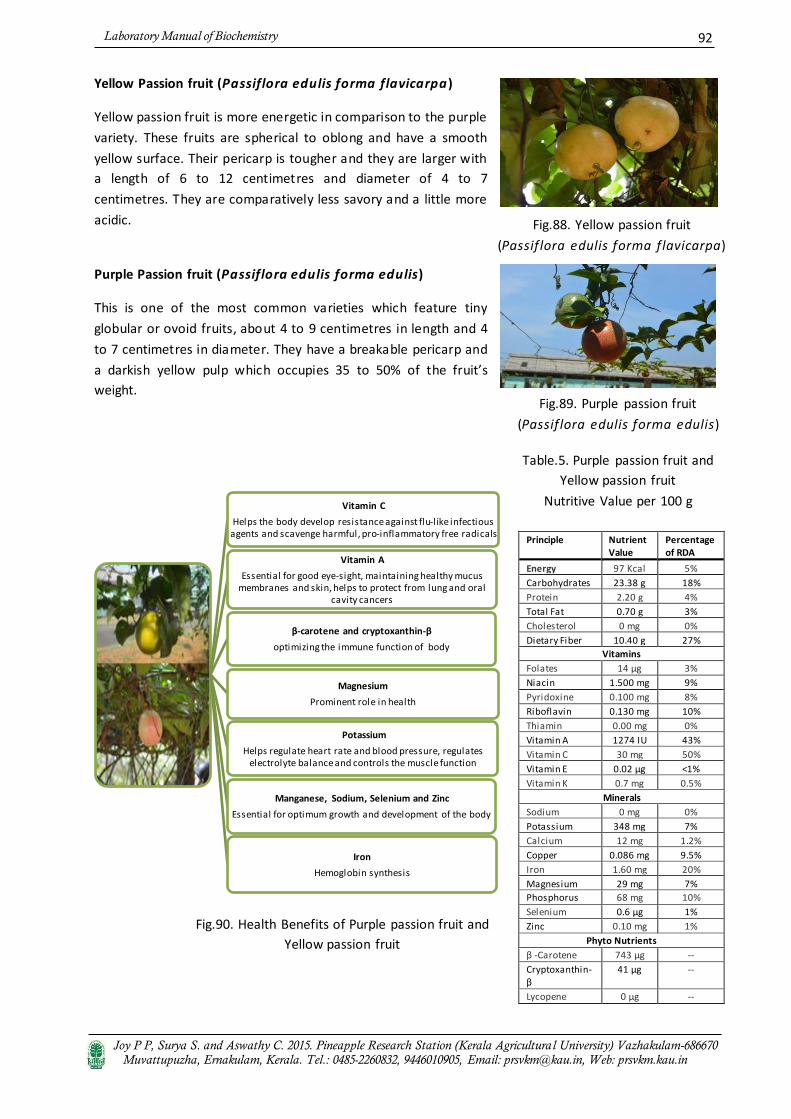
Joy P P, Surya S. and Aswathy C. 2015. Pineapple Research Station (Kerala Agricultura l University) Vazhakulam-686670 Muvattupuzha, Ernakulam, Kerala. Tel.: 0485-2260832, 9446010905, Email: [email protected], Web: prsvkm.kau.in
92 Laboratory Manual of Biochemistry
Yellow Passion fruit (Passiflora edulis forma flavicarpa )
Yellow passion fruit is more energetic in comparison to the purple
variety. These fruits are spherical to oblong and have a smooth
yellow surface. Their pericarp is tougher and they are larger with
a length of 6 to 12 centimetres and diameter of 4 to 7
centimetres. They are comparatively less savory and a little more
acidic.
Purple Passion fruit (Passiflora edulis forma edulis)
This is one of the most common varieties which feature tiny
globular or ovoid fruits, about 4 to 9 centimetres in length and 4
to 7 centimetres in diameter. They have a breakable pericarp and
a darkish yellow pulp which occupies 35 to 50% of the f uit s weight.
Vitamin C
Helps the body develop resistance against flu-l ike infectious
agents and scavenge harmful, pro-inflammatory free radicals
Vitamin A
Essential for good eye-sight, maintaining healthy mucus
membranes and skin, helps to protect from lung and oral
cavity cancers
β-carotene and cryptoxanthin-β
optimizing the immune function of body
Magnesium
Prominent role in health
Potassium
Helps regulate heart rate and blood pressure, regulates
electrolyte balance and controls the muscle function
Manganese, Sodium, Selenium and Zinc
Essential for optimum growth and development of the body
Iron
Hemoglobin synthesis
Principle Nutrient Value
Percentage of RDA
Energy 97 Kcal 5%
Carbohydrates 23.38 g 18%
Protein 2.20 g 4%
Total Fat 0.70 g 3%
Cholesterol 0 mg 0%
Dietary Fiber 10.40 g 27%
Vitamins
Folates 14 µg 3%
Niacin 1.500 mg 9%
Pyridoxine 0.100 mg 8%
Riboflavin 0.130 mg 10%
Thiamin 0.00 mg 0%
Vitamin A 1274 IU 43%
Vitamin C 30 mg 50%
Vitamin E 0.02 µg <1%
Vitamin K 0.7 mg 0.5%
Minerals
Sodium 0 mg 0%
Potassium 348 mg 7%
Calcium 12 mg 1.2%
Copper 0.086 mg 9.5%
Iron 1.60 mg 20%
Magnesium 29 mg 7%
Phosphorus 68 mg 10%
Selenium 0.6 µg 1%
Zinc 0.10 mg 1%
Phyto Nutrients
β -Carotene 743 µg --
Cryptoxanthin-
β
41 µg --
Lycopene 0 µg --
Fig.89. Purple passion fruit
(Passif lora edulis forma edulis)
Fig.88. Yellow passion fruit
(Passif lora edulis forma flavicarpa)
Fig.90. Health Benefits of Purple passion fruit and
Yellow passion fruit
Table.5. Purple passion fruit and
Yellow passion fruit
Nutritive Value per 100 g

Joy P P, Surya S. and Aswathy C. 2015. Pineapple Research Station (Kerala Agricultura l University) Vazhakulam-686670 Muvattupuzha, Ernakulam, Kerala. Tel.: 0485-2260832, 9446010905, Email: [email protected], Web: prsvkm.kau.in
93 Laboratory Manual of Biochemistry
5.1. Basic Fruit Analysis of Passion Fruit
5.1.1. Collection of Passion fruit Samples
5.1.1.1. Selection of Fruits
All the fruits are required for the physical or chemical studies. Selection is randomized or individual
fruits are selected for studies. Select a passion fruit looking wrinkled skin, indicating it is ripe.
5.1.1.2. Method of Plucking
Plucking of passion fruit is actually done with a sharp cutting instrument which gives a clean and smooth
cut on the part and hence, cutting with a knife or pulling a fruit by hand is not considered to be a correct
procedure.
5.1.1.3. Sorting
The fruits for analysis are collected at random basis, not only the healthy ones but those infected with
insect pests or diseases, or mechanically damaged may also be plucked. At the first step, the fruits
showing any symptom of infection or dama ge on surface should be rejected such that only those which
at least outwardly look healthy are only sorted out for conducting study.
5.1.1.4. Surface Cleaning
The fruits are surface cleaned by rubbing it with a piece of dry clean cloth, or rubbing it with moistened
and then with a dry cloth-piece. If this procedure is not enough to clean it properly, washing with clean
and preferably running water.
5.1.1.5. Bringing to analytical laboratory
Passion fruits are brought to the laboratory as soon as possible after they are plucked and stored in the
same atmosphere conditions to maintain the minimal change of the physio-chemical conditions.
Fig.91. Selection of Fruits
Fig.92. Sorting

Joy P P, Surya S. and Aswathy C. 2015. Pineapple Research Station (Kerala Agricultura l University) Vazhakulam-686670 Muvattupuzha, Ernakulam, Kerala. Tel.: 0485-2260832, 9446010905, Email: [email protected], Web: prsvkm.kau.in
94 Laboratory Manual of Biochemistry
5.1.2. Determination of Constituents by Physical Methods
There may in fact, be a large number of physical characteristics of fruits that are worthy to test. Those
are as follows
5.1.2.1. Weight
Weight of a fruit is considered to be an important factor in judging its
compactness, maturity, juice content, carbohydrate and other chemical
constituents. It is done by physical balance. Balance should be properly set,
placed and leveled, accuracy ensured before use, weighing done accurately and
the reading noted carefully.
5.1.2.2. Volume
Volume that is the size of a fruit is another important factor. In market consumers prefer large-sized
ones for many fruits. Volume of the fruit can be determined by measuring the volume of a liquid that is
water which is actually displaced by it.
5.1.2.3. Overall Length
The length of a fruit is referred to by many as the space, that is, straight line distance between its stalk-
end and the stylar end. It appears to be more appropriate to consider the total length of a fruit, which
may be termed as its overall length. This can be done by slide calipers, L-shaped sets etc.
5.1.2.4. Maximum Width
To refer width, the diameter of a fruit in its centre is emphasized. It can be done by measuring the
distance from the extreme points at two sides using slide calipers, L-shaped sets etc.
The practice lies in testing whether the fruit passes or not through a ring of desired diameter. If the fruit
passes out, it is considered not to have fully grown, till then for which it is left to grow further in-situ
instead of harvesting at that stage. On the other hand, if it fails to pass through the ring, it is considered
to have grown to desired degree and hence, it is harvested then.
Fig.94. Slide caliper
Fig.93. Balance

Joy P P, Surya S. and Aswathy C. 2015. Pineapple Research Station (Kerala Agricultura l University) Vazhakulam-686670 Muvattupuzha, Ernakulam, Kerala. Tel.: 0485-2260832, 9446010905, Email: [email protected], Web: prsvkm.kau.in
95 Laboratory Manual of Biochemistry
5.1.2.5. Shape
Fruits belonged to a species or a variety of it has some characteristic shape of their own, although
variation within some limit is not considered to be an uncommon feature.
5.1.2.6. Firmness/ Pulp firmness
Firmness of a healthy fruit is linked to the degree of its physiological maturity. With
progress of development, maturation and ripening either in the pre-harvest or in the
post-harvest condition, the fruits undergo gradual softening to a greater or a lesser
extent depending on species, varieties, environment and the use of agro-inputs.
Enzymatic conversion of pectic compounds may cause this. This can be measured by
penetrometer, by hand-feeling, and by pin drop method.
5.1.2.7. Peel colour
The colour of the fruit surface is an important factor in determining an appeal to the consumers. The
change in colour is due to accumulation of one or more forms of pigments in different combinations.
This can be measured by, the use of colour-dictionary, eye estimation etc.
5.1.2.8. Peel smoothness
The peels of fruits get smoothened with advancement of their development, maturation and ripening.
5.1.2.9. Peel wax
Plant wax is an ester of a higher fatty acid with long chain alcohol other that glycerol. It can be done by
simply rubbing the surface with fingers or using a tissue paper.
5.1.2.10. Peel thickness
The thickness of the peel is considered to be a character of importance of many fruits. To measure the
peel thickness, it has to be excoriated from the fruit. It should be carefully cut out with a knife in order
to separate from the inner part of the fruit. Slide – calipers is used to measure the thickness.
Fig.95. Penetrometer
Fig.96. Peel thickness
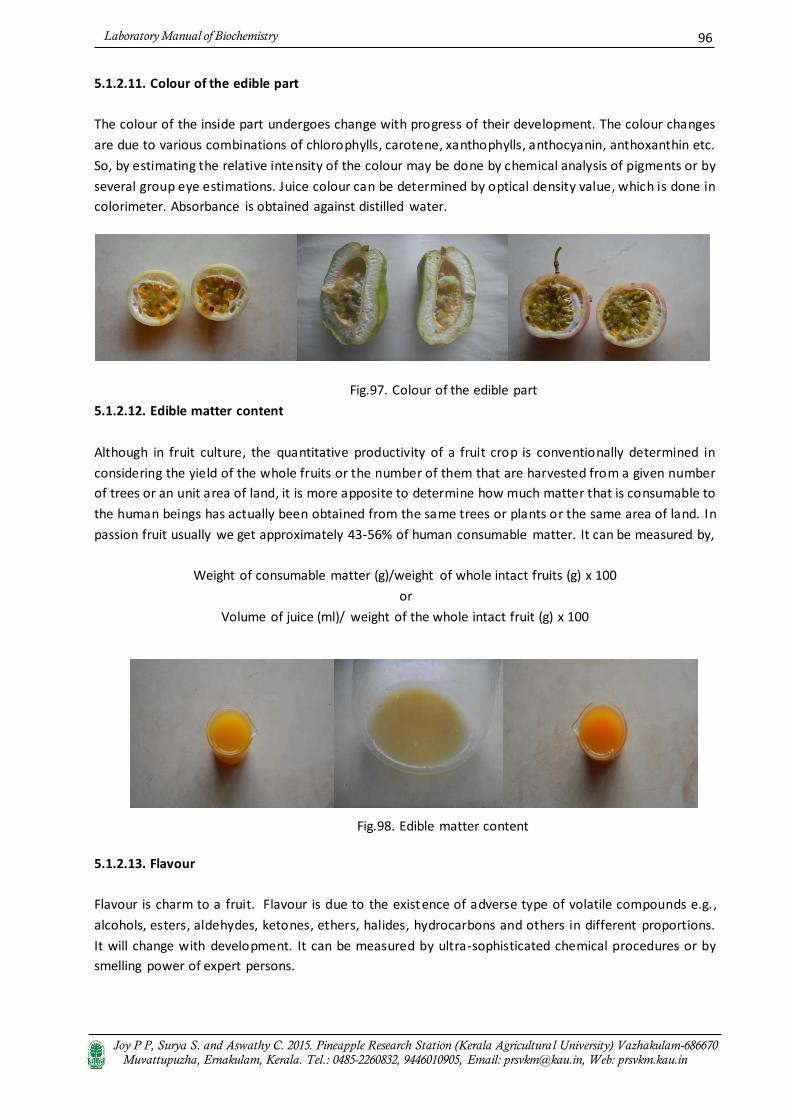
Joy P P, Surya S. and Aswathy C. 2015. Pineapple Research Station (Kerala Agricultura l University) Vazhakulam-686670 Muvattupuzha, Ernakulam, Kerala. Tel.: 0485-2260832, 9446010905, Email: [email protected], Web: prsvkm.kau.in
96 Laboratory Manual of Biochemistry
5.1.2.11. Colour of the edible part
The colour of the inside part undergoes change with progress of their development. The colour changes
are due to various combinations of chlorophylls, carotene, xanthophylls, anthocyanin, anthoxanthin etc.
So, by estimating the relative intensity of the colour may be done by chemical analysis of pigments or by
several group eye estimations. Juice colour can be determined by optical density value, which is done in
colorimeter. Absorbance is obtained against distilled water.
5.1.2.12. Edible matter content
Although in fruit culture, the quantitative productivity of a fruit crop is conventionally determined in
considering the yield of the whole fruits or the number of them that are harvested from a given number
of trees or an unit area of land, it is more apposite to determine how much matter that is consumable to
the human beings has actually been obtained from the same trees or plants or the same area of land. In
passion fruit usually we get approximately 43-56% of human consumable matter. It can be measured by,
Weight of consumable matter (g)/weight of whole intact fruits (g) x 100
or
Volume of juice (ml)/ weight of the whole intact fruit (g) x 100
5.1.2.13. Flavour
Flavour is charm to a fruit. Flavour is due to the existence of adverse type of volatile compounds e.g.,
alcohols, esters, aldehydes, ketones, ethers, halides, hydrocarbons and others in different proportions.
It will change with development. It can be measured by ultra-sophisticated chemical procedures or by
smelling power of expert persons.
Fig.97. Colour of the edible part
Fig.98. Edible matter content
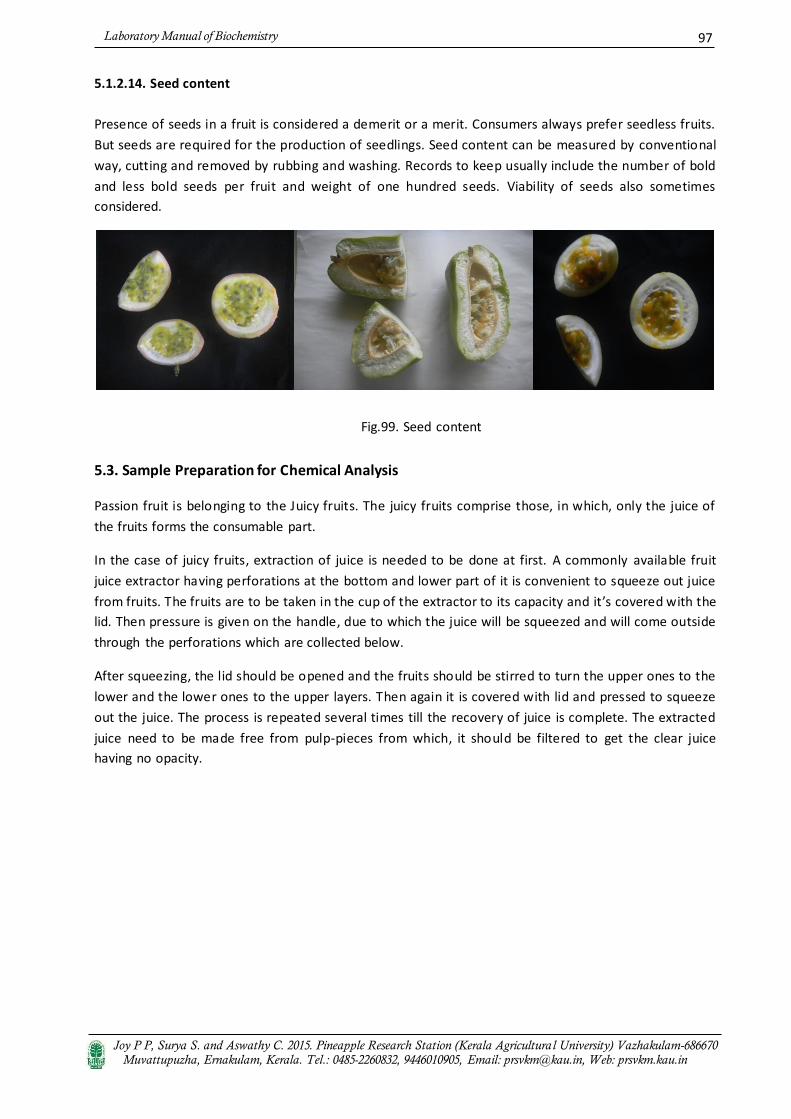
Joy P P, Surya S. and Aswathy C. 2015. Pineapple Research Station (Kerala Agricultura l University) Vazhakulam-686670 Muvattupuzha, Ernakulam, Kerala. Tel.: 0485-2260832, 9446010905, Email: [email protected], Web: prsvkm.kau.in
97 Laboratory Manual of Biochemistry
5.1.2.14. Seed content
Presence of seeds in a fruit is considered a demerit or a merit. Consumers always prefer seedless fruits.
But seeds are required for the production of seedlings. Seed content can be measured by conventional
way, cutting and removed by rubbing and washing. Records to keep usually include the number of bold
and less bold seeds per fruit and weight of one hundred seeds. Viability of seeds also sometimes
considered.
5.3. Sample Preparation for Chemical Analysis
Passion fruit is belonging to the Juicy fruits. The juicy fruits comprise those, in which, only the juice of
the fruits forms the consumable part.
In the case of juicy fruits, extraction of juice is needed to be done at first. A commonly available fruit
juice extractor having perforations at the bottom and lower part of it is convenient to squeeze out juice
from fruits. The fruits are to be taken in the cup of the extractor to its capacity and it s covered with the
lid. Then pressure is given on the handle, due to which the juice will be squeezed and will come outside
through the perforations which are collected below.
After squeezing, the lid should be opened and the fruits should be stirred to turn the upper ones to the
lower and the lower ones to the upper layers. Then again it is covered with lid and pressed to squeeze
out the juice. The process is repeated several times till the recovery of juice is complete. The extracted
juice need to be made free from pulp-pieces from which, it should be filtered to get the clear juice
having no opacity.
Fig.99. Seed content

Joy P P, Surya S. and Aswathy C. 2015. Pineapple Research Station (Kerala Agricultura l University) Vazhakulam-686670 Muvattupuzha, Ernakulam, Kerala. Tel.: 0485-2260832, 9446010905, Email: [email protected], Web: prsvkm.kau.in
98 Laboratory Manual of Biochemistry
E. Quality Indices of Fruits
Quality in fruits, as in other products, is that combination of characteristics which makes them desirable
to the buyer or user. Fruits are ordinarily chosen by appearance, because other methods for
determination of quality are rarely available to the casual purchaser. Thus, to the vendor of fruits,
whether at the field, the wholesale display, or in the retail store, such factors as size, shape, colour and
freedom from external defects, are of compelling importance.
6. Sensory Attributes of Fruit
Sensory analysis is a scientific discipline used to evoke measure, analyze and interpret reactions to those
characteristics of foods as they are perceived by the senses of sight, smell, taste, touch and hearing. The
consumer acceptance of fruits most often relies upon the inherent flavour and textural quality of the
product. Incorporating sensory evaluation will help in the selling a consumer friendly product with
increased acceptance. When done properly, sensory information can provide reliable and useful
information about fruits and vegetables which no instrument can measure their perceptual
characteristics.
The sensory properties of foods are related to three major attributes:
Appearance - colour, size, shape
Flavour - odour, taste and
Texture - mouth feel, viscosity and hearing
The consumer integrates all of those sensory inputs such as appearance, aroma, flavour, hand-feel,
mouth-feel and chewing sounds into a final judgment of the acceptability of that fruit.
6.1. Appearance and Colour of Fruit
Present emphasis is on the matter of eye appeal. Unless a commodity has eye appeal it is difficult to
market, even though flavour and nutritional characteristics of the product or variety may be quite
superior. Size is another factor that affects market acceptance of the fruit that is produced. Standard
sizes have become rather generally adopted, and fruit not within those limits, usually has to be
marketed as culls or processing in to some by product other than fresh product.
An important factor in eye appeal is good colour. External amount and intensity of surface colour on a
fruit of any type or cultivar is of prime importance to its appeal in the market place. Colour is the one
ha a te isti that ake f uit disti ti e a d att a ts the u e s e e. Colou is su h i po ta t aspe ts of fruit quality that grade standards almost universally specify the amount and shade of characteristic
colour required to meet a designated gra de. The determination of internal colour in an intact fruit
enables periodic measurement of chlorophyll as related to its decrease during ripening, or changes in
internal plant pigments such as carotenes or anthocyanins.
6.2. Texture/Mouth feel
Texture is an important component of fruit quality. Flavour may be affected by texture because release
of taste compounds in the mouth is related to tissue structure. Texture is related to those attributes of
quality associated with the sense of feel, as experienced by the fingers, the hand or in the mouth.

Joy P P, Surya S. and Aswathy C. 2015. Pineapple Research Station (Kerala Agricultura l University) Vazhakulam-686670 Muvattupuzha, Ernakulam, Kerala. Tel.: 0485-2260832, 9446010905, Email: [email protected], Web: prsvkm.kau.in
99 Laboratory Manual of Biochemistry
Included in texture are such sensations as hardness, softness, crispness, meatiness, juiciness and
toughness.
Sounds produced by a food during mastication (chewing) or physical handling. It includes pitch
(frequency of sound), loudness (intensity of the sound) and persistence (endurance of sound over time).
Viscosity of the fruits related to the temperature and the nature of the compounds present.
6.3. Flavour of Fruit
Fruit flavour is difficult to determine by chemical means, primarily because a complex group of volatile
compounds is combined in most to provide the typical flavour. Often the same compounds are present
in genetically unrelated fruits, with the proportion of each, or the presence or absence of a few,
resulting in vastly different flavours.
Flavour, is the combined impression perceived via the chemical senses from a product in the mouth, i.e.,
it does not include appearance and texture. It includes aromatics, taste and chemical feeling factors.
Odour of a product is detected when food volatiles enter the nasal passage and are perceived by the
olfactory system.
7. 9 Point Hedonic Scale
The 9-point hedonic scale, originally developed by Peryam and Girardot (1952), is the most commonly
used scale for assessing liking and preferences of foods. It is a balanced scale around a neutral point
with category labels that have been determined by Jones and Thurstone (1955) to be fairly evenly
spaced psychologically.The adjectives used to label the nine points also aid in interpretation of panel
means. Typically, the hedonic scale is used with untrained panelists who frequently use the product of
interest, and it is considered the gold standard for assessing degree of liking.
Table.6. 9 Point Hedonic Scale
Like extremely 9
Like very much 8
Like moderately 7
Like slightly 6
Neither like nor dislike 5
Dislike slightly 4
Dislike moderately 3
Dislike very much 2
Dislike extremely 1

Joy P P, Surya S. and Aswathy C. 2015. Pineapple Research Station (Kerala Agricultura l University) Vazhakulam-686670 Muvattupuzha, Ernakulam, Kerala. Tel.: 0485-2260832, 9446010905, Email: [email protected], Web: prsvkm.kau.in
100 Laboratory Manual of Biochemistry
F. General Biochemical Parameters
8. Proximate Analysis
This refers to the determination of the major constituents of feed and it is used to assess if a feed is
within its normal compositional parameters or somehow been adulterated. This method partitioned
nutrients in feed into: total protein, crude fat, carbohydrate, ash, and moisture reported as the
percentage composition of the product, which are expressed as the content (%) in the feed respectively.
Moisture (Water, Volatile substances)
The active ingredients from the view of feed nutrition are present in the part of dry matter (solid
matter); therefore the level of moisture content is an important factor in both economy and storage. As
the assay for moisture in the feed measures loss on drying by heating at normal pressure as moisture,
the result includes most of volatile substances other than H2O. Therefore, it may be more appropriate
to be referred to as volatile matter rather than moisture for accuracy. Organic acids such as acetic acid
and butyric acid in silage as well as ammonia and flavour components in feed materials are also
vapourized and thus measured as moisture. When the feed is spread on sheet and left at rest, moisture
absorption or release proceeds, and under a constant relative humidity comes to equilibrium at the
moisture content corresponding to the constant relative humidity (RH) (equilibrium moisture content),
which indicates comparatively stable water content of the feed in the air-dry state.
Total Ash (soluble & insoluble minerals including macro & micro forms)
A sample is incinerated by heating to be crude ash. When a sample is incinerated without special
treatment, there always is contamination with charred organic matter, resulting in a blackish colo ur.
Therefore, it cannot be considered as pure ash (inorganic salts), and is referred to as crude ash. Ash
content of a material represents inorganic residue remaining after destruction of organic matter, which
is generally considered equivalent to the mineral content.
Crude Protein (True Protein & Non Protein Nitrogen)
Crude protein is actually a chemical analysis of the food where by the amount of nitrogen present is
used to estimate the amount of protein in the food. It is defined as the value obtained by quantitating
nitrogen in a sample by the Kjeldahl method (in which nitrogen compounds in the sample is degraded by
Sulphuric acid to become Ammonia, Sodium hydroxide is added, steam distillation is conducted under
Food Sample
Moisture
Drymatter
Organic Matter
Crude Protein
Crude Fat
Carbohydrate
Crude Fiber
Nitrogen Free Extracts
Inorganic Matter(Crude
Ash)
Fig.100. Proximate Composition

Joy P P, Surya S. and Aswathy C. 2015. Pineapple Research Station (Kerala Agricultura l University) Vazhakulam-686670 Muvattupuzha, Ernakulam, Kerala. Tel.: 0485-2260832, 9446010905, Email: [email protected], Web: prsvkm.kau.in
101 Laboratory Manual of Biochemistry
the alkaline conditions, distilled ammonia is absorbed in acid and measured by titration) and multiplying
the result by the factor 6.25.
Note: Generally the nitrogen content of protein is 16 % on average; thus the inverse number of this
(100/16 = 6.25) is used as the factor.
Crude Fat (Lipids, pigments)
Crude fat is the term used to refer the crude mixture of fat soluble material present in a sample. It is also
known as the ether extract or the free lipid content and is the traditional measure of fat in food
products. The common approach for total crude fat determination is based on the solubility of lipids in
non-polar organic solvents such as Hexane, Petroleum ether or supercritical liquid Carbon dioxide with
or without a solvent modifier.
A sample is extracted with ether using the Soxhlet extractor, to obtain the extract as ether extract. Ether
extract contains, in addition to fat, oil-soluble dyes (such as chlorophyll and carotenoids), wax, free fatty
acids, lecithin, cholesterin, and phospholipids, etc. Generally, ether extract of oil meal is around 1 % and
the major component is oil and fat, therefore the energy value is high. When feeds are stored for a long
period, a phenomenon is observed in that moisture does not change while ether extracts decreases
gradually. This is because unsaturated fatty acids contained in feeds are oxidatively polymerized
absorbing oxygen in the air and becomes insoluble in ether.
Crude Fibre (cellulose, fiber with nitrogen attached & alkali insoluble lignin)
A sample is boiled sequentially with dilute acid and then with dilute alkali, and then sequentially washed
with Ethanol and Diethyl ether, and the residue is subtracted by its ash, and the result is defined as
crude fibre. Crude fibre is primarily measured to comprehend indigestible parts in feeds, and is
consisted mainly of a part of lignin, pentosan, chitin, etc., in addition to cellulose. These compounds are
collectively called as fibre.
Crude fibre consists largely of cellulose and lignin (97%) plus some mineral matter. It represents only
60% to 80% of the cellulose and 4% to 6% of the lignin.
Total Carbohydrate
Carbohydrate is important components of storage and structural materials in the plants. They exist as
free sugars and polysaccharides. The basic unit of carbohydrates is the monosaccharides which cannot
be split by hydrolysis in to simpler sugars. The carbohydrate content can be measured by hydrolyzing
the polysaccharides in to simple sugars by acid hydrolysis and estimating the resultant monosaccharides.
Nitrogen Free Extract (sugars, organic acids, pectin, hemicelluloses and alkali soluble lignin)
Nitrogen free extract consisting of carbohydrates, sugars, starches, and a major portion of materials
classed as hemicelluloses in feeds. When crude protein, fat, water, ash and fibre are added and the sum
is subtracted from 100, the difference is NFE.

Joy P P, Surya S. and Aswathy C. 2015. Pineapple Research Station (Kerala Agricultura l University) Vazhakulam-686670 Muvattupuzha, Ernakulam, Kerala. Tel.: 0485-2260832, 9446010905, Email: [email protected], Web: prsvkm.kau.in
102 Laboratory Manual of Biochemistry
8.1. Determination of Moisture Content by Hot Air Oven Method
Principle
The water content of dried food stuffs is kept very low in order to extent shelf life.
Procedure
The sample is thoroughly homogenize in a domestic mixer
Weigh 2-10 g (±1 mg) of homogenize material in a clean dried petri-dish pre-dried at 98oC for 60
minutes
Dry the sample by heating for a period ranging from 2 to 3 hours to overnight in a hot air oven
at 100±1°C
Weigh the sample periodically until it reaches a constant weight
The percent moisture content can be calculated from the difference between the initial sample
weight (WI) and the final sample weight after drying (WD)
Calculation
% Moisture =
Where, WI - Initial sample weight
WD- Final sample weight
8.2. Determination of Crude Ash Content Using Muffle Furnace
Principle
Ash is the residue obtained after incineration of the dry material at high temperatures and appears as
grey-white coloured powder.
Procedure
Heat a platinum crucible to 600oC in a muffle furnace for 1 hour, cool in a desiccator and weigh
(W1)
Weigh accurately 2 g of the dried sample (W2) in to a crucible and heat at low flame by keeping
on a clay triangle to char the organic matter
Keep the charred material inside the previously set muffle furnace and heat for 6 to 8 hours to
greyish white ash
Cool the crucible in a desiccator and weigh (W3)
Heat the crucible again for further 30 minutes to confirm completion of ashing, cool and weigh
Calculation
% of ash content (g /100 g) =
WI - WD
WI
× 100
(W3 – W1) × 100
(W2 – W1)

Joy P P, Surya S. and Aswathy C. 2015. Pineapple Research Station (Kerala Agricultura l University) Vazhakulam-686670 Muvattupuzha, Ernakulam, Kerala. Tel.: 0485-2260832, 9446010905, Email: [email protected], Web: prsvkm.kau.in
103 Laboratory Manual of Biochemistry
Where, W1- Weight of crucible
W2- Weight of dry matter with crucible taken for ashing
W3- Weight of crucible with ash
8.3. Determination of Total Protein
8.3.1. Determination of Crude Protein by Kjeldahl Method
Principle
The nitrogen compounds in the sample are converted in Ammonium sulphate on treated with
concentrated Sulphuric acid. Upon distillation with excess alkali, the ammonia is liberated which is
absorbed in 2% Boric acid and is estimated by titration with standard excess N/50 Sulphuric acid.
Procedure
Weigh 1 – 2 g of homogenized wet sample in to a Kjeldahl flask of 100 ml capacity
Add a few glass beads and a pinch of digestion mixture (a mixture of CuSO4 and K2SO4in the ratio
of 1:8) and 10 ml of concentrated Sulphuric acid
Digest over a burner till solution turns colourless
To the digested solution in digestion flask add distilled water in small quantities with shaking
and cooling till the addition of water does not generate heat
Transfer quantitatively in to a 100 ml standard flask and make up the volume
Pipette 5 ml of the makeup solution and transfer to the reaction chamber of the micro Kjeldahl
distillation apparatus
Rinse down with distilled water
Add 2 drops of Phenolphthalein indicator and 40% Sodium hydroxide till the indicator changes
to pink
Distilled for 4 minutes and absorbed the ammonia liberated in 2% Boric acid containing a drop
of Tashi o s i di ato a d dete i ed the a ou t of a o ia t eati g ith N/ “ulphu i acid.
Fig.101. Kjeldahl Method 1. Digestion, 2. Neutralization and Distillation, 3. Titration

Joy P P, Surya S. and Aswathy C. 2015. Pineapple Research Station (Kerala Agricultura l University) Vazhakulam-686670 Muvattupuzha, Ernakulam, Kerala. Tel.: 0485-2260832, 9446010905, Email: [email protected], Web: prsvkm.kau.in
104 Laboratory Manual of Biochemistry
Calculation
% of Crude protein =
or
8.3.2. Determination of Total Protein by Biuret method
Principle
Under alkaline conditions copper ions present in Biuret reagent interact with –CO-NH-groups present in
adjacent dipeptide and form a purple coloured complex. This can measure spectrophotometrically at
540nm. The method is fairly specific and there is little interference with other compound containing –CO-NH-groups like urea and other like reducing sugar can interact with cupric ions.
Reagents
Standard protein solution (Bovine Serum Albumin (BSA) 5 mg/ml): Dissolve 500 mg of BSA and
make up the final volume 100 ml with distilled water
Biuret reagent: Dissolve 3 g of CuSO4 and 9 g Sodium potassium tartarate in 500 ml of 0.2M
NaOH. Add 5 g of KI and make up the final volume 1 litre with 0.2 M NaOH
Distilled water
Test sample
Procedure
Pipette 0.2, 0.4, 0.6, 0.8 and 1 ml of the working standard into a series of test tubes
Pipette 0.5 ml and 1 ml of the sample extract in two other test tubes
Make up the final volume 2 ml with distilled water along with the blank tubes
Add 3 ml Biuret reagent in all tubes. Mix all the reagents properly and incubated at ⁰C fo minutes
Measure the colour complex spectrophotometrically at 520 nm
Draw the standard curve of concentration of BSA vs. Optical Density (O.D.)
Put the OD of the unknown solution and calculate the concentration of the protein present in
given sample from standard graph and formula express result in mg%
Calculation
Concentration of the Protein (mg %) =
OD (test)
OD (std)
×
Aliquot (test)
Conc (std)
× 100
14
50
× vol N
50
× H2SO4 × 100 100 × 6.25 ×
5 × weight of sample × 1000
N × 14 × 6.25
Wt. of sample

Joy P P, Surya S. and Aswathy C. 2015. Pineapple Research Station (Kerala Agricultura l University) Vazhakulam-686670 Muvattupuzha, Ernakulam, Kerala. Tel.: 0485-2260832, 9446010905, Email: [email protected], Web: prsvkm.kau.in
105 Laboratory Manual of Biochemistry
8.3.3. Deter i atio of Total Protei y Lowry’s Method
Principle
The blue colour developed by the reduction of the Phosphomolybdic-Phophotungstic components in the
Folin-Ciocalteau reagent by the amino acids Tyrosine and Tryptophan present in the protein plus the
colour developed by the Biuret reaction of the protein with the Alkaline cupric tartarate are measured in
the Lo s ethod.
Reagents
2% Sodium carbonate in 0.1 N Sodium hydroxide (Reagent A)
0.5% Copper sulphate (CuSO4.5H2O) and 1% Potassium sodium tartarate in 100 ml distilled water
(Reagent B)
Alkaline copper solution: Mix 50 ml of A and 1 ml of B prior to use (Reagent C)
Folin-Ciocalteau Reagent (Reagent D)- Reflux gently for 10 hours a mixture consisting of 100 g
Sodium tungstate (Na2WoO4.2H2O), 25 g Sodium molybdate (Na2MoO4.2H2O), 700 ml distilled
water, 50 ml of 85% Phosphoric acid, and 100 ml of concentrated Hydrochloric acid in a 1.5 litre
flask. Add 150 g Lithium sulphate, 50 ml distilled water and a few drops of Bromine water. Boil
the mixture for 15 minutes without condenser to remove excess bromine. Cool, dilute to 1 litre
and filter. The reagent should have no greenish tint (Determine the acid concentration of the
reagent by titration with 1 N NaOH to a Phenolphthalein end-point)
Protein Solution (Stock Standard) - Weigh accurately 50 mg of bovine serum albumin and
dissolve in distilled water and make up to 50 ml in a standard flask
Working Standard- Dilute 10 ml of the stock solution to 50 ml with distilled water in a standard
flask. 1 ml of this solution contains 200 µg protein
Procedure
Extraction of Protein from sample: Extraction is usually carried out with buffers used for the
enzyme assay. Weigh 500 mg of the sample and grinded well with a pestle and mortar in 5-10 ml
of the buffer. Centrifuged and used the supernatant for protein estimation
Pipette 0.2, 0.4, 0.6, 0.8 and 1 ml of the working standard into a series of test tubes
Pipette 0.1 ml and 0.2 ml of the sample extract in two other test tubes
Make up the volume to 1 ml in all the test tubes. A tube with 1 ml of water serves as the blank
Add 5 ml of reagent C to each tube including the blank. Mix well and allow standing for 10
minutes
Then add 0.5 ml of reagent D, mix well and incubated at room temperature in the dark for 30
minutes. Blue colour is developed
Take the readings at 660 nm
Draw a standard graph and calculate the amount of protein in the sample and express the
amount of protein in mg/g or 100 g sample
Calculation
Concentration of the Protein (mg %) =
OD (std) Aliquot (test)
OD (test) Conc (std) × × 100

Joy P P, Surya S. and Aswathy C. 2015. Pineapple Research Station (Kerala Agricultura l University) Vazhakulam-686670 Muvattupuzha, Ernakulam, Kerala. Tel.: 0485-2260832, 9446010905, Email: [email protected], Web: prsvkm.kau.in
106 Laboratory Manual of Biochemistry
8.3.4. Determination of Total Protein by Bradford Method
Principle
The assay is based on the ability of proteins to bind Coomassie brilliant blueG250 and form a complex
whose extinction coefficient is much greater than the free dye.
Reagents
Standard Protein Solution (BSA) 20 µg/ml: Prepare stock solution (1 mg/ml) and dilute with
distilled water to make concentration 20 µg/ml.
Bradford Reagent: Dissolve 100 mg of Coomassie brilliant blueG250 in 50 ml of 95% Ethanol.
Cover it tightly and incubate for an hour. Slowly add 100 ml of 85% concentrated Ortho-
Phosphoric acid and make the volume to 1 litre with distilled water. Filter the reagent through
Whatman filter paper No.1 and store in amber bottle. Reagent is stable only for 2-3 weeks
0.2 M Phosphate Buffer (pH – 7.5): Prepare 0.2 M Monobasic Sodium phosphate and 0.2 M
Dibasic Sodium phosphate and mix until the pH becomes 7.5
Procedure
Pipette 0.2, 0.4, 0.6, 0.8 and 1 ml of the working standard into a series of test tubes
Pipette 0.5 ml and 1 ml of the sample extract in two other test tubes. A tube with 2 ml of
phosphate buffer and 2 ml of Bradford reagent serves as the blank
Make up the final volume 2 ml with phosphate buffer and added 2 ml Bradford reagent in all
tubes
Mix all the reagents properly and incubate at ⁰C fo i utes
Measure the colour complex spectrophotometrically at 595 nm
Draw the standard curve of concentration of BSA vs. Optical Density (O.D)
Put the OD of the unknown solution and calculate the concentration of the protein present in
given sample from standard graph and formula express result in mg%
Calculation
Concentration of the Protein (mg %) =
8.4. Determination of Crude Fat by Soxhlet Method
Principle
Fat soluble in organic solvents can be extracted from moisture free samples by using solvents like
Petroleum ether, Ethyl ether etc. The solvent is evaporated and fat is estimated gravimetrically.
Procedure
Weigh, accurately 5-10 g (W1) of dry sample into a thimble and keep a cotton plug on top of it
Place the thimble in a Soxhlet apparatus and add ½ volumes of Ether into a pre-weighed flat-
bottom flask (W2) and distilled for 16 hours (Cool the apparatus and filter the solvent into a pre-
weighed conical flask (W2)
OD (std) Aliquot (test)
OD (test) Conc (std) × 100 ×

Joy P P, Surya S. and Aswathy C. 2015. Pineapple Research Station (Kerala Agricultura l University) Vazhakulam-686670 Muvattupuzha, Ernakulam, Kerala. Tel.: 0485-2260832, 9446010905, Email: [email protected], Web: prsvkm.kau.in
107 Laboratory Manual of Biochemistry
Rinse the flask of the apparatus with small quantities of Ether and then added washings to the
above flask)
Remove Ether by evapouration and dried the flask with fat at 80-100C, cool in a desiccator and
weigh (W3)
Calculation
Fat content (g / 100%) =
Where, W1- Weight of dry matter taken for extraction
W2- Weight of flat bottom flask
W3- Weight of flask with fat
Conversion of dry weight to wet weight basis
Wet Weight =
8.5. Determination of Total Carbohydrate
8.5.1. Determination of Total carbohydrate by Furfural Colorimetric Method
Principle
Carbohydrate is determined by the furfural colorimetric method after treatment with concentrated
Sulphuric acid. The intensity of the pink colour is measured at 520 nm.
Procedure
About 30-50 mg of material is weigh out into a 20 ml centrifuge tube and heat in a boiling water
bath for 30 minutes with 4 ml 10% Tri Chloro acetic acid (TCA) and about 30 mg of Ag2SO4
After centrifuging, the clear supernatant and the subsequent washings of the residue with the
TCA solution were transferred to a 25 ml graduated flask and make up to the volume
2 ml aliquots were taken in duplicates and carefully layered over a 6 ml of concentrated H2SO4
taken in a boiling tube
The tubes were quickly agitate to mix the contents thoroughly and heated for 6.5 minutes in a
vigorously boiling water bath
After rapid cooling to room temperature the optical density is measure at 520 nm
Blanks were run with each batch of analysis and Glucose is use to observe the standard curve
X × (100 - moisture)
100
(W3-W2) × 100
W1
= X
Weight of fat × 100
Weight of sample
= X
Fat content (g/ 100%) =

Joy P P, Surya S. and Aswathy C. 2015. Pineapple Research Station (Kerala Agricultura l University) Vazhakulam-686670 Muvattupuzha, Ernakulam, Kerala. Tel.: 0485-2260832, 9446010905, Email: [email protected], Web: prsvkm.kau.in
108 Laboratory Manual of Biochemistry
8.5.2. Determination of Total carbohydrate by Anthrone Reagent
Principle
Carbohydrates are first hydrolyzed in to simple sugars using dilute Hydrochloric acid. In hot acidic
medium Glucose is dehydrated to Hydroxyl methyl furfural. This compound forms with Anthrone a
green coloured product with an absorption maximum at 630 nm.
Reagents
2.5N HCl
Anthrone reagent: Dissolve 200 mg anthrone in 100 ml of ice-cold 95% Sulphuric acid. Prepare
fresh before use
Standard Glucose (stock): Dissolve 100 mg in 100 ml distilled water
Working standard: 10 ml of stock diluted to 100 ml with distilled water. Store refrigerated after
adding a few drops of Toluene
Procedure
Weigh 100 mg of the sample in to a boiling tube
Hydrolyze by keeping it in a boiling water bath for 3 hours with 5 ml of 2.5 N HCl and cool to
room temperature
Neutralize with solid Sodium carbonate until the effervescence ceases
Make up the volume to 100 ml and centrifuge
Collect the supernatant and take 0.5 and 1 ml aliquots for analysis
Prepare the standards by taking 0, 0.2, 0.4, 0.6, 0.8 and 1 ml of the working sta da d, se es as blank
Make up the volume to 1 ml in all the tubes including the sample tubes by adding distilled water
Then add 4 ml of Anthrone reagent
Heat for 8 minutes in a boiling water bath
Cool rapidly and read the green to dark green colour at 630 nm
Draw a standard graph by plotting concentration of the standard on the X-axis versus
absorbance on the Y-axis
From the graph calculate the amount of carbohydrate present in the sample tube
Calculation
Amount of carbohydrate present in 100 mg of the sample =
Note
Cool the contents of all the tubes on ice before adding ice cold anthrone reagent.
8.5.3. Determination of Total Carbohydrate by Phenol Sulphuric Acid Method
Principle
In hot acidic medium Glucose is dehydrated to Hydroxyl methyl furfural. This forms a green coloured
product with Phenol and has absorption maximum at 490 nm.
mg of glucose
Volume of test sample
× 100

Joy P P, Surya S. and Aswathy C. 2015. Pineapple Research Station (Kerala Agricultura l University) Vazhakulam-686670 Muvattupuzha, Ernakulam, Kerala. Tel.: 0485-2260832, 9446010905, Email: [email protected], Web: prsvkm.kau.in
109 Laboratory Manual of Biochemistry
Reagents
Phenol 5%: Redistilled (Reagent grade) phenol (50 g) dissolved in water and diluted to 1 litre
Sulphuric acid 96% reagent grade
Standard glucose Stock: Dissolve 100 mg in 100 ml of water
Working standard: 10 ml of stock diluted to 100 ml with distilled water
Procedure
Follow the steps 1 to 4 as given in anthrone method for sample preparation
Pipette 0.2, 0.4, 0.6, 0.8 and 1 ml of the working standard in to a series of test tubes
Pipette 0.1 and 0.2 ml of the sample solution in two separate test tubes. Make up the volume in
each tube to 1 ml with water
Set a blank with 1 ml of water
Add 1 ml of phenol solution to each tube
Add 5 ml of 96% Sulphuric acid to each tube and shake well
After 10 minutes shake the contents in the tubes and place in a water bath at 25 to 30oC for 20
minutes
Read the colour at 490 nm
Calculate the amount of total carbohydrate present in the sample solution using the standard
graph
Calculation
Absorbance corresponds to 0.1 ml of the test = X mg of glucose
100 ml of the sample solution contains =
8.6. Determination of Crude Fibre
The crude fibre content in sample was determined by sequential acid and alkali hydrolysis method.
Principle
During the acid and subsequent alkali treatment, oxidative hydrolytic degradation of the native cellulose
and considerable degradation of lignin occur. The residue obtained after final filtration is weighed,
incinerated. Cooled and weighed again. The loss in weight gives the crude fibre content.
Reagents
Sulphuric acid solution (0.255 ± 0.005 N): 1.25 g concentrated Sulphuric acid diluted to 100 ml
(Concentration must be checked by titration)
Sodium hydroxide solution (0.313 ± 0.005 N): 1.25 g Sodium hydroxide in 100 ml distilled water
(Concentration must be checked by titration with standard acid)
X
0.1
× 100 mg of glucose = % of total carbohydrate present
Joy P P, Surya S. and Aswathy C. 2015. Pineapple Research Station (Kerala Agricultura l University) Vazhakulam-686670 Muvattupuzha, Ernakulam, Kerala. Tel.: 0485-2260832, 9446010905, Email: [email protected], Web: prsvkm.kau.in
110 Laboratory Manual of Biochemistry
Procedure
Extract 2 g of ground material with Ether or Petroleum ether to remove fat (Initial boiling
temperature 35-38oC and final temperature 52oC). If fat content were below 1%, extraction may
be omitted
After extraction with Ether boil 2 g of dried material with 200 ml of Sulphuric acid for 30 minutes
with bumping chips
Filter through muslin and washed with boiling water until washings are no longer acidic
Boil with 200 ml of Sodium hydroxide solution for 30 minutes
Filter through muslin cloth again and wash with 25 ml of boiling 1.25% H2SO4, three 50 ml
portions of water and 25 ml alcohol
Remove the residue and transfer to ashing dish (pre weighed dish W1)
Dry the residue for 2 hours at 130 ± 2oC. Cool the dish in a desiccator and weigh (W2)
Ignite for 30 minutes at 600 ± 15oC
Cool in a desiccator and reweighed (W3)
Calculation
% Crude fibre in ground sample =
Loss in weight on ignition (W2 – W1) – (W3 – W1)
× 100
Weight of the sample

Joy P P, Surya S. and Aswathy C. 2015. Pineapple Research Station (Kerala Agricultura l University) Vazhakulam-686670 Muvattupuzha, Ernakulam, Kerala. Tel.: 0485-2260832, 9446010905, Email: [email protected], Web: prsvkm.kau.in
111 Laboratory Manual of Biochemistry
G. Determination of Chemical Constituents
9. Estimation of Titrable Acidity
The acid content of foods directly affects their flavour. Practically all foods contain an acid or a mixture
of acids. These acids may occur naturally, may be produced by action of microorganisms, or may be
added in such products as ketch up or chili sauce during their manufacture. Total acidity determinations
are useful as a measure of this tartness. In some cases a high concentration of acid may be an indication
of spoilage and rancidity while in other cases high acid content is necessary for preservation.
Total acid is usually determined by titrating an aliquot of sample with a base of known strength using a
suitable indicator to determine the end point.
9.1 Titrimetric Method
Reagents
Sodium hydroxide: 0.1 N
Phenolphthalein indicator: Dissolve 1 g of indicator in 60 ml of 95 per cent Ethyl alcohol and
dilute to 100 ml with distilled water
Procedure
Preparation of sample
Juices: All fruit juices should be thoroughly mixed by shaking to ensure uniformity of sampling.
Filter the juice through filter paper to remove the coarse particles which can result in an
inaccurate measured sample
Fresh fruits: In order to secure a sample of the water soluble acids, the fresh fruits must be
crushed. This can be accomplished by placing the fruit in a small hand operated press type juice
extractor or a layer of cheese cloth and squeezing it tightly until the pulp is fairly dry. If the juice
sample contains fibres and particles, the liquid should be centrifuged, or filtered until the juice is
clear
Weigh 25 g of macerated sample or pipette a 25 ml sample and transfer to a 250 ml volumetric
flask
Dilute to 100 ml with distilled water. Shake and filter through Whatman No. 4 filter paper
Pipette 50 ml of the filtrate into a 250 ml Erlenmeyer flask and added 50 ml of distilled water
Add 0.3 ml of 1% Phenolphthalein solution and titrate with 0.1 N Sodium hydroxide solution
until the pink colour develops
Record the volume of the Sodium hydroxide used and calculate the acidity
Calculations
Total acid may be expressed on three different bases
1. As volume (ml) of 0.1 N NaOH per 100 ml of sample
Let x ml of 0.1 N NaOH is used for 50 ml of the solution
The amount of 0.1 N NaOH used / 100 ml Juice =
X
50
× 100

Joy P P, Surya S. and Aswathy C. 2015. Pineapple Research Station (Kerala Agricultura l University) Vazhakulam-686670 Muvattupuzha, Ernakulam, Kerala. Tel.: 0485-2260832, 9446010905, Email: [email protected], Web: prsvkm.kau.in
112 Laboratory Manual of Biochemistry
2. As grams of acid
To calculate results in terms of grams of acid, all acid present are calculated in terms of one acid. In
general, the predominant acid present in the juice or product is used for calculation purposes using the
theo eti al ather than the actual equivalent weight.
Calculate grams of acid in the aliquot titrated
Gram acid in aliquot =
3. As percent of acid (titrating with 0.1 N NaOH)
% acid =
Table.7. Factor for calculating acidity
Note: For liquid sample, if the specific gravity of the sample is approximately 1.0 (same as water) it is
not necessary to weigh out the sample for titration as the volume and weight of the sample will be the
same. So volume in ml will be equivalent to weight in gram. However, for samples of specific gravity
greater or less than 1.0, the aliquot should be weighed.
9.2. pH Meter Method
The point of neutrality i.e. the end point of titration may also be determined using a pH meter.
Checking the pH meter
Make sure the pH meter has warmed up before use - allow about 30 minutes
Remove the electrode from the distilled water in the storage beaker and dry
Acid Formula weight Equivalent weight Factor Acetic 60.05 60.05 0.0060
Butyric 88.10 88.10 0.0088
Citric 192.12 64.04 0.0064
Lactic 90.08 90.08 0.0090
Malic 134.09 67.05 0.0067
Oleic 282.46 282.46 0.282
Oxalic 90.04 45.02 0.0045
Succinic 118.09 59.05 0.0059
Stearic 284.47 284.47 0.0284
Tartaric 150.08 75.04 0.0075
ml of 0.1 N NaOH × equivalent wt. of acid
10000
ml 0.1 N NaOH × factor
Volume of sample in ml
× 100

Joy P P, Surya S. and Aswathy C. 2015. Pineapple Research Station (Kerala Agricultura l University) Vazhakulam-686670 Muvattupuzha, Ernakulam, Kerala. Tel.: 0485-2260832, 9446010905, Email: [email protected], Web: prsvkm.kau.in
113 Laboratory Manual of Biochemistry
Place the electrode into the beaker containing a buffer solution of pH 7 and calibrate the meter
to the same figure
Whenever readings are taken, ensure that the electrode is not in contact with the sides or base
of the beaker
Remove the electrode and after rinsing in distilled water, place in the solution to be tested; the
electrode should not have any contact with the glass
Procedure
Ensure the tap on the burette is shut and using a funnel pour the 0.1 M solution of NaOH into
the burette until it reaches the zero mark. Do not spill the solution onto the skin
Slowly titrate the NaOH into the juice/water solution. Care must be taken that the NaOH is
dropped directly into the solution and does not adhere to the glass; otherwise the reading may
be false
While titrating care must be taken to continually swirl the solution in the beaker to keep it
thoroughly mixed. This is essential, particularly when the solution nears neutrality. It is
important to determine the point of neutrality or the end point of titration very exactly. The end
point can easily be missed, which will give an inaccurate reading for the test. It is important
therefore that towards the end of the titration the NaOH is added a drop at a time
Using a pH meter, while titrating the digital readout will be seen to climb from around 4 or 5.
When the reading reaches 7 proceed carefully. The point of neutrality or the end point of
titration is reached at pH 8.1. If this figure is exceeded the test is not acceptable and must be
repeated
When the pH meter reads 8.1 read off the amount of NaOH used on the burette and record
Remove the electrode and rinse it in distilled water ready for the next test. Do not allow it to
become contaminated
Refill the burette for each subsequent test
Clean the equipment thoroughly and rinse with distilled water. Detergents must not be used
Note: When testing very acidic juices e.g. lemons and limes a larger amount of NaOH is required.
Therefore, when the NaOH reaches the 25 ml mark on the scale the burette tube should be recharged as
described above. When the end point is reached the various readings are added together and recorded
to produce a figure of NaOH used for each titration.
10. Estimation of Total Soluble Solids
Total soluble solids (TSS) of a given sample of fruit juice representing various chemical substances
present in it in soluble form. It indicates a measure of sugars present in the sample. The amount of TSS
present in the juice of a fruit is also considered to be a reliable index in judging its maturity. In
accordance with the harvest – maturity of many fruits is assessed in considering the TSS of their juices.
Principle
The TSS of a given fruit juice sample is determined in a quicker way with the help of the refractometer.
The instrument works on the principle of refractive index of the sample and gives the refractive index as ◦Brix.
Joy P P, Surya S. and Aswathy C. 2015. Pineapple Research Station (Kerala Agricultura l University) Vazhakulam-686670 Muvattupuzha, Ernakulam, Kerala. Tel.: 0485-2260832, 9446010905, Email: [email protected], Web: prsvkm.kau.in
114 Laboratory Manual of Biochemistry
Procedure
The lid that is covering plate of the refractometer which rest over the prism-plate and is
attached with it at the base end with a hinge which can be unfolded backward. By doing so, both
the lid and the prism plate are exposed
The lid and the prism plate are then carefully wash with a jet of clean water to ensure that they
have no stain on its surface
Water adhered on the prism plate and the lid as well as the surrounding parts of them, if any is
completely wipe off with blotting paper or absorbent cotton
The lid of the prism plate is then wash with distilled water and the water adhered on them is
blotted out. The cleaning is best done by rubbing the lid and the prism plate gently and carefully
with absorbent cotton, soaked with rectified spirit
Then, with the help of a previously cleaned dropper or a glass rod, a drop of distilled water is
carefully dropped on the surface of the prism plate. The lid is folded forward and placed over
the prism plate to cover it. At this position, the lid and the prism plate are firmly held together
with fingers to avoid unfolding of the lid
The refractometer is held to point towards light. The eyepiece of it is brought close to any eye of
the observer who should look into the eyepiece to have a view of the image of the scale. The
scale focusing knob should be conveniently rotated to adjust it at such a position where the
scale is most clearly visible. The shaded part would be seen to insert the unshaded part at zero
position of the scale which indicates no reading with respect to distilled water. If it is not there
then the reading should be brought to zero by rotating the scale calibrating screw
The lid is then folded backward. The distilled water that remains adhered over the lid and the
prism plate is completely blotted out and dried in air for a few minutes
A clear sample of fruit juice, TSS of which is to be determined is taken in the dropper, or a drop
may be taken with the glass rod. A drop of juice is then carefully placed on the prism-plate
Reading of the juice sample as oBrix is obtained and amount of TSS is expressed accordingly
11. Estimation of Total Phenolic Compounds
Phenols, the aromatic compounds with hydroxyl groups, are widespread in plant kingdom. They include
an array of compounds like tannin; flavanols etc. and occur in all parts of the plants where they offer
resistance to diseases and pests. Estimate the phenolic compounds using the same extract prepared for
soluble sugar estimation.
11.1. Estimation of Total Phenols
Phenols react with Phospho molybdic acid in Folin-Ciocalteau reagent in alkaline medium and produce
blue coloured complex (molybdenum blue).
Reagents
Folin-ciocalteau reagent: Dilute the Folin-ciocalteau reagent (2 N) with distilled water in 1:1 (v/v)
ratio before use
Saturated Sodium carbonate solution: Dissolve the Anhydrous Sodium carbonate (35.0 g) in 100
ml of distilled water by heating on a water bath at 70-80°C. Cool the contents for overnight and
use the supernatant

Joy P P, Surya S. and Aswathy C. 2015. Pineapple Research Station (Kerala Agricultura l University) Vazhakulam-686670 Muvattupuzha, Ernakulam, Kerala. Tel.: 0485-2260832, 9446010905, Email: [email protected], Web: prsvkm.kau.in
115 Laboratory Manual of Biochemistry
Procedure
Take 1 ml of the extract in a test tube and dilute with distilled water (7.5 ml)
Mix well the contents. Add to this, 0.5 ml of dilute Folin- ciocalteau reagent
Shake the tubes thoroughly and after 3 minutes, add 1 ml of saturated Sodium carbonate and
make total volume to 10 ml with distilled water
Allow the tubes to stand for 1 hour and read the absorbance at 725 nm using
spectrophotometer
Use distilled water in place of sample extract as reagent blank and rest of procedure for blank is
same
Determine the amount of total phenols in the sample from the standard curve prepare
simultaneously by taking tannic acid as the standard phenol and express the data as mg g -1 dry
weight
11.2. Estimation of O-dihydroxy Phenols
Reagents
A o s eage t
(a) 10 g Sodium nitrite
(b) Sodium molybdate - 10 g Dissolve these in distilled water separately, mix
and make volume to 100 ml with distilled water.
0.5 N HCl
0.5 N NaOH
Procedure
Take 2 ml of the sample extract in a test tube
To this, add 2 ml of 0.5 N HCl, 1 l of A o s eage t a d ml of distilled water in succession
Add 2 ml of 0.5 N NaOH, pink colour will appear. Now, shake the solution
Make volume to 15 ml with distilled water and measure the intensity of the colour at 515 nm
Run blank simultaneously without the addition of A o s eage t a d al ulate the amount of
O-dihydric phenols by taking Chlorogenic acid as standard and express the data as mg g -1 dry
weight
11.3. Estimation of Total Flavanoid Content
Reagents
HCl
CH3OH
Cinnamaldehyde
Catechin

Joy P P, Surya S. and Aswathy C. 2015. Pineapple Research Station (Kerala Agricultura l University) Vazhakulam-686670 Muvattupuzha, Ernakulam, Kerala. Tel.: 0485-2260832, 9446010905, Email: [email protected], Web: prsvkm.kau.in
116 Laboratory Manual of Biochemistry
Procedure
Make up the sample volume to 1 ml
Add 5 ml of Chromogen reagent (HCl + CH3OH + Cinnamaldehyde in 1:3:0.004 ratio) and take the
absorbance at 640 nm
Use Catechin as a standard and express the result as microgram Catechin equivalents per
illig a g CE/ g sa ple
11.4. Estimation of Flavanols
Reagents
Aluminium chloride (0.1 M): Dissolve 24.143 g of Aluminium chloride in 1 litre of distilled water
Procedure
Take 1 ml of the extract in a test tube and evapourate to dryness on a water bath maintain at
60-70°C
Dissolve the residue in 10 ml of 0.1 M Aluminium chloride solution and thereafter, read the
absorbance of the solution at 420 nm using spectrophotometer
Prepare a blank simultaneously and calculate the amount of flavanols by taking rutin as
standard and express the data as mg g -1 dry weight
12. Estimation of Total Antioxidant Activity (TAA)
Antioxidant compounds in food play an important role as a health protecting factor. Scientific evidence
suggests that antioxidants reduce the risk of chronic diseases including cancer and heart disease.
Primary sources of naturally occurring antioxidants are whole grains, fruits and vegetables.
The antioxidant activity of a sample is checked on the basis of 1, 1-diphenyl-2-picrylhydrazyl (DPPH) free
radical scavenging activity. The reaction between an antioxidant and DPPH can be presented as follows.
When an antioxidant reduces DPPH° to DPPH-H, decrease in absorbance occurs. Thus, the degree of
discolouration shows the scavenging potential of an antioxidant in terms of hydrogen donating ability.
Procedure
Mix DPPH l, . mM in methanol) solution with sample extract and make up the volume
to 3.5 ml with methanol
Incubate the mixture in dark for 45 minutes at room temperature and record the absorbance at
515 nm in a spectrophotometer
Use Butylated hydroxy anisol (BHA) as a standard antioxidant compound
Calculate the DPPH radical scavenging activity by using the formula
Calculation
DPPH° scavenging activity (%) = [(Ac-As)/Ac] x 100
Where, Ac is the absorbance of positive control solution and
As is the absorbance of test solution

Joy P P, Surya S. and Aswathy C. 2015. Pineapple Research Station (Kerala Agricultura l University) Vazhakulam-686670 Muvattupuzha, Ernakulam, Kerala. Tel.: 0485-2260832, 9446010905, Email: [email protected], Web: prsvkm.kau.in
117 Laboratory Manual of Biochemistry
13. Estimation of Reducing Sugar
In fruits both reducing and non-reducing sugars are present in varying amount. Reducing sugars are
those hexose (C6H12O6) sugars, which can reduce compounds such as alkaline (ammoniacal) silver nitrate
solution, cupric salt solution etc., because they themselves are oxidized.
Hexose sugars are divided in to two main groups, which are aldo hexose and keto hexose. Aldo hexose
or aldose contains aldehydes group and keto hexose or ketose contains ketone group. Aldehydes are
strong reducing agents. Hexose which contain aldehyde groups e.g., glucose, galactose, mannose etc.
are reducing sugars. Ketones are however more resistant to oxidation than aldehydes, because it
involves the breaking of a relatively stable C-C bond. Hence they do not ordinarily reduce Alkaline silver
nitrate or Cupric salt solution. But that fructose contains ketone, it is able to reduce readily as easily
oxidizable CO-CH2OH group is present in it and it act as reducing sugar.
Non reducing sugar e.g., Sucrose is a disaccharide and cannot reduce Alkaline silver nitrate or Cupric salt
solution.
The reducing sugars will be often expressed in terms of Glucose, since Glucose is the most predominant
reducing sugar present in fruits.
13.1. Estimation of Reducing Sugar by Titration Method
Principle
The reducing sugar present in the sample reduces the alkaline solution of cupric sa lt Fehli g s solutio )
to red cuprous oxide. Methylene blue, a redox indicator is employed to detect the end point of the
titration. The red colour of the cuprous oxide formed during the reaction will be the intense blue colour
of the indicator. But when all the cupric ions of the Fehli g s solutio a e edu ed to up ous the sugar solution, then the next few drops of sugar solution added reduce and thus decolourize. The
indicator so that the red colour of the cuprous oxide become visible which is taken as the end point of
the titration.
Reagents
Fehling solution A: Dissolve 69.28 g CUSO4.5H2O in water and make up to 1 litre
Fehling solution B: Dissolve 346 g of Rochelle salt (Potassium sodium tartarate, KNaC4H4O6.4H20)
and 100 g of NaOH in water and make up to 1 litre
Methylene blue indicator solution, 1% in distilled water
Neutral Lead acetate (C2H3O22pb, 3H2O) solution, 45% in distilled water
Potassium oxalate solution, 22% in distilled water
Standard Glucose solution: 5 mg/ml
Procedure
Pulp the fruit in a blender and filter through Whatman No.4 filter paper
Weigh and transfer about 25 g of the filtered juice in to a 250 ml volumetric flask
Add about 100 ml of water and neutralize with 1 N NaOH
Add 2 ml of Lead acetate solution, shake, and allow standing for 10 minutes
Add 22 ml of Potassium oxalate solution to remove the excess of lead make up the volume with
water and filter

Joy P P, Surya S. and Aswathy C. 2015. Pineapple Research Station (Kerala Agricultura l University) Vazhakulam-686670 Muvattupuzha, Ernakulam, Kerala. Tel.: 0485-2260832, 9446010905, Email: [email protected], Web: prsvkm.kau.in
118 Laboratory Manual of Biochemistry
Pipette 5 l ea h of Fehli g s solutio s A a d B i to a ml conical flask
Add about 50 ml of distilled water and 2 or 3 glass beads
Boil the content vigorously and while boiling add the clarified fruit juice taken in a burette, till
the blue colour just disappears
Add 0.5 ml of Methylene blue indicator and allow it to boil for 1 minute
While boiling, complete the titration as quickly as possible by a dding 2-3 drops of sugar solution
at 5-10 seconds intervals, until the indicator is completely decolourize and the brick red colour
of cuprous oxide becomes dominant
Calculate the content of reducing sugars as gram of Glucose per 100 g of the juice (percentage)
Calculation
Weight of the fruit juice taken for analysis = W (25 g)
Volume made up to = 250 ml
Volume of the clarified juice reacted with 10 l of Fehli g s solutio A+B = T.V l
l of Fehli g s solutio A+B = . g of glucose
Percentage of reducing sugars in the juice (g of glucose per 100 g of juice) =
13.2. Estimation of Reducing Sugars by Nelson-So ogyi’s Method
Principle
The reducing sugars when heated with Alkaline copper tartarate reduce the copper from the cupric to
cuprous state and thus cuprous oxide is formed. When cuprous oxide is treated with Arsenomolybdic
acid, the reduction of Molybdic acid to molybdenum blue takes place. The blue colour developed is
compared with a set of standards in a colorimeter at 620 nm.
Reagents
Alkaline copper tartarate: dissolve 2.5 g Anhydrous Sodium carbonate, 2 g Sodium bicarbonate,
2.5 g Potassium sodium tartarate and 20 g Anhydrous Sodium sulphate in 80 ml water and make
up to 10 ml (solution A). Dissolve 15 g Copper sulphate in a small volume of distilled water. Add
1 drop of H2SO4 and make up to 100 ml (solution B) before use
Arsenomolybdate reagent: dissolve 2.5 g Ammonium molybdate in 45 ml distilled water. Add 2.5
ml H2SO4 and mix well. Then add 0.3 g Disodium hydrogen arsenate dissolved in 25 ml distilled
water. Mix well and incubate at 370C for 24 to 48 hours
Standard stock Glucose solution: 100 ml distilled water
Working standard: dilute 10 ml of stock solution to 100 ml with distilled water (100 µg/ml)
Procedure
Weigh 100 mg of the sample and extract the sugars with hot 80% alcohol twice (5 ml each time)
Collect the supernatant and evaporate on water bath
Add 10 ml of water and dissolve the sugars
Pipette aliquots of 0.1 or 0.2 ml of alcohol free extract to separate tubes
Pipette 0.2, 0.4, 0.6, 0.8 and 1 ml of the working standard solution into a series of test tubes
Make up the volume in both sample and standard tubes to 2 ml; with distilled water
0.05 × 250
T.V
100
W ×

Joy P P, Surya S. and Aswathy C. 2015. Pineapple Research Station (Kerala Agricultura l University) Vazhakulam-686670 Muvattupuzha, Ernakulam, Kerala. Tel.: 0485-2260832, 9446010905, Email: [email protected], Web: prsvkm.kau.in
119 Laboratory Manual of Biochemistry
Pipette 2 ml distilled water into a separate tube to serve as a blank
Add 1 ml of Alkaline copper tartarate reagent to each time
Place the tubes in boiling water for 10 minutes
Cool the tubes and add 1 ml of Arsenomolybdic acid reagent to all the tubes
Make up the volume in each tube to 10 ml with water
Read the absorbance of blue color at 620 nm after 10 minutes
From the graph drawn, calculate the amount of reducing sugars present
Calculation
Reducing sugars in sample (%) =
Note: Although the colour is stable, determine the absorbance at a fixed time after the addition of
Arsenomolybdate reagent.
13.3. Estimation of Reducing Sugar by Dinitro Salicylic Method
For sugar estimation an alternative to Nelson-“o og i s ethod i the Di nitro salicylic acid method-
simple, sensitive and adoptable during handling of a large number of samples at a time.
Materials
Dinitro Salicylic acid reagent (DNS reagent): Dissolve by stirring 1 g Dinitro salicylic acid ,200 mg
crystalline Phenol and 50 mg Sodium sulphite in 100 ml 1% NaOH. Store at 4C. Since the
reagent deteriorates due to Sodium sulphite, if long storage is required, Sodium sulphite may be
added at time of use
40% Rochelle Salt Solution (Potassium Sodium Tartarate)
Procedure
Follow, steps 1 to 3 as in Nelson- “o og i s ethod to e t a t the edu i g sugars from the test
material
Pipette 0.5 to 3 ml of the extract in test tubes and equalize the volume to 3 ml with water in all
the test tubes
Add 3 ml of DNS reagent
Heat the contents in a boiling water bath for 5 minutes
When the contents of the tubes are still warm, add 1ml of 40% Rochelle salt solution
Cool and read the intensity of dark red colour at 510 nm
Run a series of standards using glucose (0 to 500 µg) and plot a graph
Calculation
Calculate the amount of reducing sugars present in the sample using the standard graph.
Sugar value from graph (g)
Aliquot sample used (0.1 or 0.2 ml)
1
Weight of sample 100
×
Total volume of alcohol free extracts (10 ml)
×

Joy P P, Surya S. and Aswathy C. 2015. Pineapple Research Station (Kerala Agricultura l University) Vazhakulam-686670 Muvattupuzha, Ernakulam, Kerala. Tel.: 0485-2260832, 9446010905, Email: [email protected], Web: prsvkm.kau.in
120 Laboratory Manual of Biochemistry
14. Estimation of Total sugar
The non-reducing sugars which are not titratable are first hydrolyzed to reducing sugars. Thus after
hydrolysis, the non-reducing sugars are converted to reducing sugars while the reducing sugars that are
already present in the sample remain unchanged. Accordingly, all the sugars that are present after
hydrolysis remain as reducing sugars. This is conveniently termed as total sugars.
Principle
The non-reducing sugar of the sample (sucrose) is hydrolyzed to reducing monosaccharides by
treat e t ith dilute a id. The total edu i g suga s a e the esti ated tit atio ith Fehli g s solution.
Reagents
Fehling solution A: Dissolve 69.28 g CUSO4.5H2O in water and make up to 1 litre
Fehling solution B: Dissolve 346 g of Rochelle salt (Potassium sodium tartarate,
KNaC4H4O6.4H20) and 100 g of NaOH in distilled water and make up to 1litre
Methylene blue indicator solution, 1% in distilled water
Citric acid, solid
NaOH solution, 1 N
Procedure
Pipette 50 ml of the clarified juice solution (prepared for the estimation of reducing sugars) in to
a 250 ml conical flask
Add 5 g of Citric acid and 50 ml of distilled water
Boil gently for 10 minutes to complete the inversion of sucrose and then cool
Transfer the content to a 250 ml volumetric flask and neutralize with 1 N and make up the
volume
Titrate the made up solution with 10 l of Fehli g s solutio as detailed in the estimation of
reducing sugars
Express the total sugars as g of glucose per 100 g of the original juice
Calculation
Weight of the fruit juice taken for analysis = W (g)
Volume made up to = 250 ml
Volume of the clarified juice used for the inversion = 50 ml
Percentage of total sugars in the juice (g of glucose per 100 g of juice) =
0.05 T.V
250
50 W
100 250 × × ×

Joy P P, Surya S. and Aswathy C. 2015. Pineapple Research Station (Kerala Agricultura l University) Vazhakulam-686670 Muvattupuzha, Ernakulam, Kerala. Tel.: 0485-2260832, 9446010905, Email: [email protected], Web: prsvkm.kau.in
121 Laboratory Manual of Biochemistry
15. Estimation of Non-Reducing Sugar
The difference between the total sugars and the reducing sugars will represent the non-reducing
sugar
The non-reducing sugar will be expressed as gram of sucrose per 100 g of the juice
Calculation
Percentage of Non-reducing sugars in the juice (g of glucose per 100 g of juice)
= Percentage of Total sugars – Percentage of Reducing sugars
16. Estimation of Starch by Anthrone Reagent
Starch is an important polysaccharide. It is the storage form of carbohydrate in plants abundantly found
in roots, tubers, stems, fruits and cereals. Starch, which is composed of several glucose molecules, is a
mixture of two types of components namely amylase and amylopectin. Starch is hydrolyzed in to simple
sugars by dilute acids and the quantity of simple sugars is measured colorimetrically.
Principle
The sample is treated with 80% alcohol to remove sugars and then starch is extracted with Perchloric
acid. In hot acidic medium starch is hydrolyzed to Glucose and dehydrated to hydroxy methyl furfural.
This compound forms a green coloured product with Anthrone.
Requirements
Anthrone reagent: Dissolve 200 mg Anthrone in 100 ml of ice cold 95% Sulphuric acid. Prepare
fresh before use
80% Ethanol
52% Perchloric acid
Standard Glucose (stock): Dissolve 100 mg in 100 ml distilled water
Working standard: 10 ml of stock diluted to 100 ml with distilled water
Procedure
Homogenize 0.1 to 0.5 g of the sample in hot 80% Ethanol to remove sugars. Centrifuge and
retain the residue. Wash the residue repeatedly with hot 80% Ethanol till the washings do not
give colour with Anthrone reagent. Dry the residue well over a water bath
To the residue add 5.0 ml of water and 6.5 ml of 52% Perchloric acid
Extract at 0oC for 20 minutes. Centrifuge and save the supernatant
Repeat the extraction using fresh Perchloric acid. Centrifuge and pool the supernatants and
make up to 100 ml.
Pipette 0.1 or 0.2 ml of the supernatant and make up the volume to 1 ml with distilled water
Prepare the standards by taking 0.2, 0.4, 0.6, 0.8 and 1 ml of the working standard and make up
the volume to 1 ml in each tube with distilled water
Add 4 ml of Anthrone reagent to each tube
Heat for 8 minutes in a boiling water bath
Cool rapidly and read the intensity of green to dark green colour at 630 nm

Joy P P, Surya S. and Aswathy C. 2015. Pineapple Research Station (Kerala Agricultura l University) Vazhakulam-686670 Muvattupuzha, Ernakulam, Kerala. Tel.: 0485-2260832, 9446010905, Email: [email protected], Web: prsvkm.kau.in
122 Laboratory Manual of Biochemistry
Calculation
Find out the glucose content in the sample using the standard graph. Multiply the value by a factor 0.9
to arrive at the starch content.
17. Determination of Amylases
α-1, 4 glucan 4-glucanohydrolase EC 3.2.1.1 a d α-1, 4 glucan maltohydrolaseEC 3.2.1.2)
Starch degrading enzymes - universally distributed - a t o gl oge a d elated pol sa ha ides. α-
a lase ause e do lea age of su st ates a d h d ol ses α- 1, 4 linkages in a random manner. It has
the a ilit to pass α- 1, 6 branch points. The viscosity reduction of the substrate is fast but the
p odu tio of edu i g suga s is slo . β- Amylase hydrolyses alternate bonds from the non-reducing end
of the substrate. The enzyme degrades amylase, amylopectin or glycogen in an exo or stepwise fashion
by hydrolyzing alternative gl osidi o ds. The e d p odu t is β- altose. β- Amylase is incapable of
bypassing branch points i.e., 1, 6- glycosidic linkages amylopectin and glycogen. This results in about
55% conversion of amylopectin to maltose. The other product is a large limit dextrin. The viscosity
edu tio of the su st ate due to β- amylase action is slow but the production of reducing sugars is fast.
Principle
The reducing sugars produced by the action of α-a d/o β- amylase react with Dinitro salicylic acid and
reduce it to a brown coloured product, Nitro amino salicylic acid.
Reagents
Sodium acetate buffer, 0.1 M pH 4.7
Starch, 1% solution: Prepare a fresh solution by dissolving 1 g starch in 100 ml Acetate buffer.
Slightly warm, if necessary
Dinitro Salicylic Acid reagent (DNS reagent): Dissolve by stirring 1 g Dinitro salicylic acid, 200 mg
crystalline Phenol and 50 mg Sodium sulphite in 100 ml 1% NaOH. Store at 4oC. Since the
reagent deteriorates due to Sodium sulphite, if long storage is required, Sodium sulphite may be
added at the time of use
40% Rochelle Salt Solution (Potassium sodium tartarate)
Maltose solution: Dissolve 50 mg Maltose in 50 ml distilled water in a standard flask and store it
in a refrigerator
Extraction of amylases: Extract 1 g of sample material with 5-10 volumes of ice cold 10 mM
Calcium chloride solutions overnight at 4oC or for 3 hours at room temperature. Centrifuge the
extract at 54,000 g at 4oC for 20 minutes. The supernatant is used as enzyme source
E t a tio of β- Amylases (Free and Bound): The free β- amylase is extracted from Acetone
defatted sample material in 66 mM Phosphate buffer (pH 7.0) containing 0.5 M NaCl. The
extract is centrifuged at 20,000 rpm for 15 minutes. The supernatant is used as a sou e f ee β-
amylase. The pellet is then extracted with Phosphate buffer containing 0.5% 2-
e aptoetha ol. The lea e t a t is used as sou e of ou d β- amylase. All operations are
carried out at 4oC

Joy P P, Surya S. and Aswathy C. 2015. Pineapple Research Station (Kerala Agricultura l University) Vazhakulam-686670 Muvattupuzha, Ernakulam, Kerala. Tel.: 0485-2260832, 9446010905, Email: [email protected], Web: prsvkm.kau.in
123 Laboratory Manual of Biochemistry
Procedure
Pipette 1 ml of starch solution and 1 ml of properly diluted enzyme in a test tube
Incubate it at 27oC for 15 minutes
Stop the reaction by the addition of 2 ml of Dinitro salicylic acid reagent
Heat the solution in a boiling water bath for 5 minutes
While the tubes are warm, add 1 ml Potassium sodium tartarate solution
Then cool it in running tap water
Make up the volume to 10 ml by addition of 6 ml water
Read the absorbance at 560 nm
Terminate the reaction at zero time in the control tubes
Prepare a standard graph with 0-100 µg Maltose
Calculation
A u it of α- o β- Amylase is expressed as mg of maltose produced during 5 minutes incubation with 1%
starch.
18. Extraction of Bromelain
Bromelain is a general name for a family of sulpha hydril proteolytic enzymes that are found in tissues of
plant family Bromeliaceae, of which pineapple, Ananas comosus, is best known.
Procedure
Note: All the steps of bromelain extraction should be maintained at 4oCto prevent protein denaturation
during the process.
Peel pineapple, remove its eyes, and wash with distilled water
Pineapple and its stem part are cut in to small pieces. Weigh 50 g of each part (Remaining steps
have to be separately done for both fruit and stem)
Add chilled aquadest (4oC) in the ratio of 1:1 (50 g fruit part : 50 ml aquadest)
Homogenize the samples in a blender
Filter both the homogenates (crude extract) through muslin cloth to remove the solid parts
40 ml of each sample is taken for centrifugation
Centrifuge each sample at 5000 rpm for 10 minutes to obtain sediment and supernatant
Collect the supernatant and centrifuge at 10000 rpm for 10 minutes, dispose the supernatant
Mixed the sediments from both the centrifugation process and dilute with 25 ml cold aquadest
Transfer the sediment mixture in to a beaker and stirr using magnetic stirrer maintained in an
ice bath (The process is done to homogenize all of the sediment)
The mixture of sediment is subject to further centrifugation at 10000 rpm for 10 minutes at 4oC.
The supernatant obtained is the crude enzyme and it is stored at 4oC till further procedure
Purification of Bromelain
The purification of bromelain by size exclusion chromatography is carried out at cold room 4oC.

Joy P P, Surya S. and Aswathy C. 2015. Pineapple Research Station (Kerala Agricultura l University) Vazhakulam-686670 Muvattupuzha, Ernakulam, Kerala. Tel.: 0485-2260832, 9446010905, Email: [email protected], Web: prsvkm.kau.in
124 Laboratory Manual of Biochemistry
Procedure
1 g of Sephadex G-50 superfine is weigh in a clean beaker and mix with 10 ml of buffer
solution pH of 7.4
The matrix suspension is transfer in to glass column; the column is set vertically with the
bottom valve close. Let the matrix settle for 15 minutes until the Sephadex is precipitated
The buffer is drain by opening the bottom valve and the valve is closed afterward. 15 ml
more of buffer is add to the clean Sephadex that trap to the column and then drain the
buffer
10 ml extracted enzyme is carefully add to the column. In addition 30 ml of PBS (Phosphate
Buffer Solution) is also added. Allow the system to settle for 5 minutes
10 tubes are prepared and place under the column. The valve is open and the enzyme
sample is allowed to be filter through the Sephadex according to the molecular weight. Each
tube is filled with 4 ml eluate
The valve is close. 10 tubes containing eluate are collect and test for the protein content and
enzyme activity
Enzyme Activity Determination
Procedure
In to Eppendorf tube,250 µl of 1% casein and is mix with 250 µl of 0.05 M buffer pH 7.4 and 250
µl enzyme sample – 0.04 mM CaCl2 mixture (1:1) is mixed
The mixture is incubating at 37oC for 20 minutes
The reaction is stop with 750 µl 5% TCA (Trichloro acetic acid)
The mixture is centrifuge at 8000 rpm for 10 minutes at 4oC
In two clean Eppendorf tube add 300 µl supernatant, 1000 µl 0.5 M Na2CO3 and 200 µl Folin–Ciocalteau reagent, which is diluted by miliq water (Folin–Ciocalteau: Miliq water = 1:2) and mix
well
The absorbance is measure with spectrophotometrically at 578 nm
As standard, tyrosine which concentration of 0.625, 1.25, 2.5 and 5 mM is use instead of enzyme
19. Esti atio of β-carotene
β-Carotene is a red-orange pigment abundant in fruits, vegetables and cereals. It is precursor of vitamin
A.
Reagent
Water saturated n-butanol: Mix n-butanol and water in ratio of 6:2 (v/v) and shake vigorously.
Then allow to stand till it separates into two phases; the upper clear laye r is water saturated n-
butanol
Procedure
Disperse 10 g of sample in 50 ml water saturated n-butanol to make a homogenous suspension
Shake gently and allow to stand overnight (16 hours) at room temperature in dark
Shake the suspension again and filter through Whatman filter paper no. 14. Make the volume of
filtrate to 100 ml

Joy P P, Surya S. and Aswathy C. 2015. Pineapple Research Station (Kerala Agricultura l University) Vazhakulam-686670 Muvattupuzha, Ernakulam, Kerala. Tel.: 0485-2260832, 9446010905, Email: [email protected], Web: prsvkm.kau.in
125 Laboratory Manual of Biochemistry
Measure the absorbance (A) of the clear filtrate at 440 nm in spectrophotometer using
saturated n-butanol as a blank
Calculation
β-carotene content (ppm) = 0.0105 + 23.5366 × A
20. Estimation of Ascorbic Acid
Ascorbic acid otherwise known as Vitamin C is an antiscorbutic. It is a good antioxidant when present in
reduced form and is widely distributed in fresh fruits. It is a water soluble and heat labile vitamin.
20.1 Volumetric Method
Principle
Ascorbic acid reduces the 2,6-dichlorophenol indophenol dye to a colourless leucobase. The ascorbic
acid gets oxidized to dehydroascorbic acid. Though the dye is a blue coloured compound, the end point
is the appearance of pink colour. The dye is pink coloured in acid medium. Oxalic acid is used as the
titrating medium.
Reagents
Oxalic acid 4%
Dye solution: Weigh 42 mg Sodium bicarbonate in to a small volume of distilled water. Dissolve
52 mg 2,6-dichloro indophenols in it and make up to 200 ml with distilled water
Stock standard solution: Dissolve 100 mg ascorbic acid in 100 ml of 4% oxalic acid solution in a
standard flask (1 mg/ml)
Working standard: Dilute 10 ml of the stock solution to 100 ml with 4% oxalic acid. The
concentration of the working standard is 100 µg/ml
Procedure
Pipette 5 ml of the working standard solution in to a 100 ml conical flask
Add 10 ml of 4% oxalic acid and titrate against the dye (V1ml). End point is the appearance of
pink colour, which is persists for a few minutes. The amount of the dye consumed is equivalent
to the amount of ascorbic acid
Extract the sample (0.5 – 5 g depending on the sample) in 4% Oxalic acid and make up to a
known volume (100 ml) and centrifuge
Pipette 5 ml of this supernatant, add 10 ml of 4% Oxalic acid and titrate against the dye (V2ml)
Calculation
Amount of Ascorbic acid mg / 100 g sample =
Note
Acetic- metaphosphoric acid mixture may also be used instead of 4% Oxalic acid.
0.05
V1 ml ×
V2
5 ml ×
100 ml
Weight of the sample × 100

Joy P P, Surya S. and Aswathy C. 2015. Pineapple Research Station (Kerala Agricultura l University) Vazhakulam-686670 Muvattupuzha, Ernakulam, Kerala. Tel.: 0485-2260832, 9446010905, Email: [email protected], Web: prsvkm.kau.in
126 Laboratory Manual of Biochemistry
20.2. Colorimetric Method
Ascorbic acid is also determined colorimetrically. The dehydroascorbic acid alone reacts quantitatively
and not the other reducing substances present in the sample extract. Thus this method given an
accurate analysis of ascorbic acid content than the dye method.
Principle
Ascorbic acid is first dehydrogenated by bromination. The dehydroascorbic acid then react with 2,4-di
nitro phenyl hydrazine to form osazone and dissolved in Sulphuric acid to give an orange-red colour
solution which is measured at 540 nm.
Materials
4% Oxalic acid solution
0.5% Sulphuric acid
2% 2,4-di nitro phenyl hydrazine (DNPH) reagent – Dissolve by heating 2 g DNPH in 100 ml 0.5 N
H2SO4. Filter and use
10% Thiourea solution
80% Sulphuric acid
Bromine water – Dissolve 1-2 drops of liquor bromine in approximately 100 ml cool water
Ascorbic acid stock solution – See previous procedure
Extraction
Grind 0.5-5 g of sample material either mechanically or using a pestle and mortar in 25-50 ml 4% oxalic
acid solution. Centrifuge or filter and collect the liquid
Transfer an aliquot (10 ml) to a conical flask and add Bromine water drop wise with constant mixing. The
enolic hydrogen atoms in ascorbic acid are removed by Bromine. When the extract turns orange yellow
due to excess bromine, expel it by blowing in air. Make up to a known volume (25 or 50 ml) with 4%
Oxalic acid solution.
Similarly, convert 10 ml of stock ascorbic acid solution in to dehydro form by bromination
Procedure
Pipette 10-100 µg standard dehydro ascorbic acid solution in to a series of test tubes
Similarly pipette different aliquots (0.1 ml-2 ml) of brominated sample extract
Make up the volume in each tube to 3 ml by adding distilled water
Add 1 ml of DNPH reagent followed by 1-2 drops of thiourea to each tube
Set a blank as above but with distilled water in place of ascorbic acid solution
Mix the contents of the tubes thoroughly and incubate at 37oC for 3 hours
After incubation dissolve the orange-red osazone crystals formed by adding 7 ml of 80%
Sulphuric acid.
Measure absorbance at 540 nm
Plot a graph ascorbic acid concentration versus absorbance and calculate the ascorbic acid
content in the sample

Joy P P, Surya S. and Aswathy C. 2015. Pineapple Research Station (Kerala Agricultura l University) Vazhakulam-686670 Muvattupuzha, Ernakulam, Kerala. Tel.: 0485-2260832, 9446010905, Email: [email protected], Web: prsvkm.kau.in
127 Laboratory Manual of Biochemistry
21. Determination of Dietary Fibre
Dietary fibre part of plant material in the diet which is resistant to enzymatic digestion which includes
cellulose, non-cellulosic polysaccharides such as hemicelluloses, pectin substances, gums, u ilage s
and a non-carbohydrate component lignin. The diets rich in fibre such as cereals, nuts, fruits and
vegetables have a positive effect on health since their consumption has been related to decreased
incidence of several diseases. Dietary fibre can be determined by different methods; Enzymic
gravimetric and Enzymic-chemical method.
Principle
The sample is defatted; starch is gelatinized with α-amylase, and then removed, along with the protein
by enzymatic digestion using protease and Amyloglucosidase. The fibre is precipitated with Ethanol and
filtered to produce a residue. Total dietary fibre is then determined gravimetrically with a correction for
protein and ash.
Total dietary fibre= weight (residue) - weight (ash + protein)
Reagents
Petroleum ether
Ethyl alcohol
Acetone
Sodium phosphate
Dibasic anhydrous Sodium phosphate; Monobasic anhydrous Sodium phosphate
Sodium hydroxide
1.0 N, Hydrochloric acid
1.0 M HCl
Preparation of Reagents
Use distilled or deionized water to prepare solutions.
78% Ethanol: Place 207 ml of distilled water into 1 liter volumetric flask. Dilute to volume with
95% Ethanol. Mix and bring to volume again with 95% Ethanol if necessary. Mix
Phosphate Buffer, 0.08 M, pH 6.0: Dissolve 1.4 g of Na2HPO4 and 8.4 g of NaH2PO4, anhydrous in
approximately 700 ml of distilled water. Dilute to 1 litre with distilled water. Check pH and
adjust if necessary with either NaOH or H3PO4. Store in tightly capped container at room
temperature
Sodium Hydroxide Solution, 0.275 N: Dilute 275 ml of 1.0 N NaOH solution to 1 litre with
distilled water in a volumetric flask. Store in a tightly capped container at room temperature
Hydrochloric Acid Solution, 0.325 M: Dilute 325 ml of 1.0 M HCl solution to 1 litre with distilled
water in a volumetric flask. Store in a tightly capped container at room temperature

Joy P P, Surya S. and Aswathy C. 2015. Pineapple Research Station (Kerala Agricultura l University) Vazhakulam-686670 Muvattupuzha, Ernakulam, Kerala. Tel.: 0485-2260832, 9446010905, Email: [email protected], Web: prsvkm.kau.in
128 Laboratory Manual of Biochemistry
Enzymic-gravimetric Method
Procedure
Sample Preparation: Fresh fruits are clean with water and external moisture wipe with a dry
cloth. The edible portion of the individual fruits is separate, weigh and homogenize thoroughly
in a mixer and a known weight of the sample is quantitatively transfer into 500 ml round bottom
flasks (glass) and lyophilized. Freeze dried sample is extract with Diethyl ether to remove the fat
content. The total soluble free sugars present in the sample are extracted with 80% hot Ethanol.
The sample is rinse with Acetone to remove any traces of moisture f o the sa ple a d fi all , dry in a hot air oven at 50⁰C for 1 hour. The dried samples are then powdered in to fine powder
Weigh four 1 g samples of each material to be tested into tall form beakers. Sample weights
should not differ by more than 20 mg. Record weights to 0.1 mg
Add 50 ml of pH 6.0 Phosphate buffer to each beaker
Add 0.10 ml α-Amylase to each beaker and mix well
Cover each beaker with aluminum foil and place in a boiling water bath. Agitate beakers gently
at 5 minutes intervals. Incubate for 15 minutes after the internal temperature of the beakers
reaches 95oC
Allow solutions to cool to room temperature
Adjust the pH of the solutions to 7.5 ± 0.2 by adding 10 ml of 0.275 N NaOH to each beaker.
Check pH; adjust if necessary with either NaOH or HCl
Immediately before use, make a 50 mg/ml solution of protease in phosphate buffer. Pipette 0.1
ml (5 mg Protease) into each beaker
Cover each beaker with aluminum foil and place in 60oC water bath. With continuous agitation,
Incubate for 30 minutes after the internal temperature of the beakers reaches 60oC
Allow solutions to cool to room temperature
Adjust the pH of the solutions to between pH 4.0 and 4.6 by adding 10 ml of 0.325 M HCl to
each beaker. Check pH; adjust if necessary with either NaOH or HCl
Add 0.1 ml of Amyloglucosidase to each beaker
Cover each beaker with aluminum foil and place in 60oC water bath. With continuous agitation,
incubate for 30 minutes after the internal temperature of the beakers reaches 60oC
Add 4 volumes of 95% Ethanol to each beaker
Let solutions set overnight at room temperature to allow complete precipitation
Filtration: Wet and redistribute the bed of Celite in each crucible using 78% Ethanol. Apply
gentle suction to draw Celite onto frit as an even mat. Maintain gentle suction and
quantitatively transfer the precipitate and suspension from each beaker to its respective
crucible. Wash the residue with three 20 ml portions of 78% Ethanol, two 10 ml portions of 95%
Ethanol, and two 10 ml portions of Acetone. A gum may form with some samples, trapping
liquid. Breaking the surface film with a spatula will improve the rate of filtration. Be sure to rinse
any material adhering to the spatula into the crucible. The time for filtration and washing will
vary from 0.1 to 6 hours per crucible, averaging about 0.5 hour per crucible
Dry crucibles containing residues overnight in a 105oC air oven or 70oC vacuum oven
Cool all crucibles in a desiccator, weigh to nearest 0.1 g, a d e o d this eight as ‘esidue +
Celite+ Crucible Weight" or W2

Joy P P, Surya S. and Aswathy C. 2015. Pineapple Research Station (Kerala Agricultura l University) Vazhakulam-686670 Muvattupuzha, Ernakulam, Kerala. Tel.: 0485-2260832, 9446010905, Email: [email protected], Web: prsvkm.kau.in
129 Laboratory Manual of Biochemistry
Analyze the residues from two samples and two blanks for protein by Kjeldahl nitrogen analysis.
Use 6.25 as the factor to convert ammonia determined in the analysis to protein except where
nitrogen content in the protein sample is known
Ash the residue in the crucibles from two samples and two blanks for 5 hours at 525oC. Cool in
desiccator, weigh to nearest 0.1 mg and record this weight as "Ash + Celite + Crucible Weight" or
W3.
Calculation
Residue Weight = W2-W1
Ash Weight = W3-W1
Where, W1- Celite + Crucible Weight,
W2- Residue + Celite+ Crucible Weight,
W3- Ash + Celite + Crucible Weight
B = R Blank – P Blank - A Blank
% TDF = [(R Sample – P Sample – A Sample - B)/SW] X 100
Where, TDF = Total Dietary Fiber
R = Average Residue Weight (mg)
P = Average Protein Weight (mg)
A = Average Ash Weight (mg)
SW = Average Sample Weight (mg)
22. Estimation of Mineral Content
Minerals help the body to grow, develop and stay healthy and perform many different functions from
building strong bones to transmitting nerve impulses. Some minerals are also used to make hormones or
maintain a normal heart-beat. Minerals are also important components of various enzymes,
hemoglobin, chlorophyll in plants and electron transport system.
Reagents
Diacid mixture – Mix Nitric acid and Perchloric acid in 4:1 ratio just before use
Hydrochloric acid (1%) – Add 1 ml of concentrated HCl in 50 ml double distilled water and make
volume 100 ml with double distilled water
Procedure
Digest 1 g powdered sample with 15 ml of diacid mixture (4 HNO3 : 1 HClO4) in a conical flask by
heating on hot plate in open space till clear white precipitates settle down at the bottom of the
conical flask
Dissolve the precipitates in 1% HCl prepared in double distilled water, filter and make volume of
the filtrate to 50 ml with double distilled water

Joy P P, Surya S. and Aswathy C. 2015. Pineapple Research Station (Kerala Agricultura l University) Vazhakulam-686670 Muvattupuzha, Ernakulam, Kerala. Tel.: 0485-2260832, 9446010905, Email: [email protected], Web: prsvkm.kau.in
130 Laboratory Manual of Biochemistry
A. Micronutrients
The contents of iron (Fe), zinc (Zn) may be estimated, from the extract prepared,
B. Macronutrients
The amount of phosphorus, potassium, sodium, calcium and magnesium may be estimated from the
same extract by the procedures mentioned below
22.1. Determination of Phosphorus by Colorimetric Method
Reagents
Ascorbic acid (10%): Prepare by dissolving 10 g Ascorbic acid to 100 ml of distilled water
Ammonium molybdate 2.5%: Prepare by dissolving 2.5 g Ammonium molybdate to 100 ml of
distilled water
Reagent C: Prepare by mixing 6 N Sulphuric acid, distilled water, 2.5% Ammonium molybdate
and 10% Ascorbic acid in the ratio of 1:2:1:1 (v/v) at the time of use
Procedure
Take 1 ml of the diluted extract (1 ml extract + 9 ml distilled water), in a test tube and make
volume to 4 ml with distilled water
Then, add 4 ml of reagent C to it and mix well
Incubate the contents at 37oC in a water bath for 90 minutes and cool at room temperature
Read the absorbance at 820 nm against a suitable blank and calculate the phosphorus content
with the help of a calibration curve of Mono potassium dihydrogen orthophosphate a nd
express as mg g-1 dry weight
22.2. Determination of Sodium and Potassium Using Flame Photometry
Principle
In flame Photometry, sample is sprayed under constant and controlled condition the light intensity of
the characteristic wavelength is produced by each of the atom is directly proportional to the nu mber of
atoms that are emitting energy, which in turn is directly proportional to the concentration of the
substance of interest in the sample.
Reagents
Double distilled deionized water- The method is very sensitive; the water must be free of metal
ions
Stock Standard Sodium Solution – 1000 ppm
Stock standard potassium solution – 1000 ppm
Test sample
Procedure
Prepare 20, 15, 10 and 5 ppm sodium and potassium standards by dilution of the standard
solutions using deionised water. Deionised water is used as the blank solution
To 10 ml of the fruit juice, add 50 ml of deionized water

Joy P P, Surya S. and Aswathy C. 2015. Pineapple Research Station (Kerala Agricultura l University) Vazhakulam-686670 Muvattupuzha, Ernakulam, Kerala. Tel.: 0485-2260832, 9446010905, Email: [email protected], Web: prsvkm.kau.in
131 Laboratory Manual of Biochemistry
Filter the fruit juice solution through an ashless filter paper (e.g. Whatman 540) into a litre
volumetric flask. Ensure that the solid particles retained by the paper are washed thoroughly,
collecting the washings into the same 1 litre flask. Dilute to the mark with deionized water and
mix by inversion
Switch on the instrument and allow it to warm up for 4-5 minutes
Turn on the knob for the air supply and regulate the air pressure
Turn the gas supply on and light with and obtain a non-luminous flame
Spray in to the flame by dipping the tubing for the spray in take in water
Calibrate the instrument using standards
Then inject the diluted sample in to the flame and note the readings and calculate the
concentration in milli equivalence
22.3. Determination of Calcium Using Flame Photometry
Reagents
Standard Calcium solution 100 mg/l (containing 50 ml 4 M Perchloric acid per litre)
1% Ammonium oxalate solution
25% Ammonia solution
4 M Perchloric acid
Procedure
Pipette 5 ml fruit juice into a 10 ml graduated stoppered centrifuge tube
Add 5 ml of 1% Ammonium oxalate and 3 drops ammonia solution
Shake and allow standing for 30 minutes
Centrifuge at 300 rpm for 2 minutes
Decant the supernatant and allow the tube to drain inverted for 30 seconds
Add 0.5 ml 4 M Perchloric acid and shake
Heat for 1 minute in a boiling water bath
Cool and dilute to the 10 ml mark with distilled water
Calibrate the flame photometer using a 100 mg/l calcium standard solution containing 50 ml 4
M Perchloric acid
Aspirate the sample directly into the flame photometer
The calcium concentration is calculated in milli equivalence
22.4. Determination of Zinc by Colorimetric Dithizone Method
Principle
The sample is wet or dry ashed. Zinc is extracted are Zinc dithizonate with CCl4 for colour measurement.
Reagents
Copper sulphate solution 2 mg Cu/ml: Dissolve 8 g of CuSO4.5H2O in water and diluted to 1000
ml
Ammonium citrate solution: Dissolve 225 g of (NH4)2HC6H5O7 in water and make alkaline to
phenol red with NH4OH (pH 7.5), and add 75 ml in excess. Dilute to 2000 ml. Extract this solution
immediately before use as follows. Add slight excess of dithizone and extract with CCl4 until
solvent layer is clear bright green. Remove excess dithizone by repeated extraction with CHCl3,
and finally with CCl4. Excess dithizone must be entirely removed

Joy P P, Surya S. and Aswathy C. 2015. Pineapple Research Station (Kerala Agricultura l University) Vazhakulam-686670 Muvattupuzha, Ernakulam, Kerala. Tel.: 0485-2260832, 9446010905, Email: [email protected], Web: prsvkm.kau.in
132 Laboratory Manual of Biochemistry
Dimethyl glyoxime solution: Dissolve 2 g of reagent in 10 ml of NH4OH and 200-300 ml water,
filter, and dilute to 1000 ml with water
α-nitroso- β-naphthol solution: Dissolve 0.25 g in CHCl3 and dilute to 500 ml
Chloroform
Di phenyl thio carbazone solution: Dissolve 0.05 of dithizone in 2 ml of NH4OH and 100 ml of
water and extract repeatedly with CCl4 until solvent layer is clear bright green. Discard solvent
layer and filter aqueous portion through washed ashless filter paper
Carbon tetrachloride
Dilute hydrochloric acid (0.04 N): Dilute required amount of HCl with water
Zinc standard solution:
Stock solution (500 µg Zn/ml): Dissolve 0.0500 g pure Zinc in slight excess of dilute HCl and
dilute to 100 ml
Working solution (5 µg/ml): Dilute 10 ml of stock solution to 1000 ml with 0.04 N HCl
Procedure
Preparation of sample
Sample preparation is done by following anyone of the two procedures given below.
Wet ashing: Accurately, weigh into 300 or 500 ml Kjeldahl flask, representative sample of about
25 g. Evapourate the liquid sample to small volume. Add Concentrated HNO3 and heat
cautiously until first vigorous reaction subsides and then add 2 to 5 ml Concentrated H2SO4.
Continue heating, adding more HNO3 in small portions and need to prevent charring, until
solution is clear and almost colourless. Continue heating until dense fumes of H2SO4 evolve and
all HNO3 has been remove. Cool, dilute with approximately 25 ml of water filter, if necessary
through prewashed fast filter paper and dilute the filtrate through 100 ml with water.
Dry ashing: Accurately, weigh into a clean platinum or silica dish, a representative portion of
sample (about 25 g). Char the sample and ash at temperatures not exceeding 500C. raise the
temperature of the muffle furnace slowly to avoid ignition. When ash is carbon free, dissolve
ash under watch glass in, minimum volume of HCl. Add about 20 ml of water and evapourate to
near dryness on team bath. Add 20 ml 0.1 N HCl and continue heating for 5 minutes. Filter
through pre washed fast filter paper into 100 ml volumetric flask. Wash dish and filter with 5 to
10 ml portions of 0.1 N HCl. Cool and dilute to volume with 0.1 N HCl.
Isolation and determination
To a suitable aliquot of ash solution of sample, add 2 drops of Methyl red indicator and 1 ml of CuSO4
solution and neutralize with NH4OH. Add enough HCl to make solution about 0.15 N with respect to HCl.
Adjust the pH of this solution, as measured with glass electrode, to 1.9 to 2.1. Pass stream of H2S in
solution until precipitation is complete. Filter through fine paper. Receive the filtrate in 250 ml beaker,
wash flask and filter with 3 or 4 small portions of water. Gently boil filtrate until odour of H2S can no
longer be detected. Add 5 ml of saturated-bromine water and continue boiling until bromine free. Cool,
neutralize to Phenol red with NH4OH and make slightly acid with HCl. Dilute resultant solution to definite
volume. At this stage, for optimum conditions of measurement, the solution should contain 0.2 to 1 µg
of Zn/ml.

Joy P P, Surya S. and Aswathy C. 2015. Pineapple Research Station (Kerala Agricultura l University) Vazhakulam-686670 Muvattupuzha, Ernakulam, Kerala. Tel.: 0485-2260832, 9446010905, Email: [email protected], Web: prsvkm.kau.in
133 Laboratory Manual of Biochemistry
To 20 ml aliquot of this prepared solution, in a 125 ml separator, add 5 ml of Ammonium citrate
solution, 2 ml Dimethyl glyoxime solution and 10 ml of α-nitroso- β-naphthol solution and shake for 2
minutes. Discard solvent layer and extract with 10 ml of CHCl3. Discard solvent layer.
The aqueous phase following removal of cobalt and nickel, which at this point has pH 8.0 to 8.2, add 2
ml of dithizone solution and 10 ml of CCl4 and shake for 2 minutes. Let phases separate and remove
aqueous layer as completely as possible, withdrawing liquid with pipette attached to vacuum line. Wash
down sides of separator with about 25 ml of water and without shaking again draw of aqueous layer.
Add 25 ml of 0.04 N HCl and shake 1 minute. Drain and discard solvent, being careful to dislodge and
remove drops of solvent that floats on surface. To acid solution, add 5.0 ml of Ammonium citrate
solution and 10.0 ml of CCl4 (pH of solution at this point should be 8.8 to 9.0). Determine the volume of
dithizone solution and shake for 2 minutes. Pipette exactly 5.0 ml of solvent layer into clean, dry test
tube, dilute with 10.0 ml of CCl4 a d i ell a d dete i e a so a e A at nm.
Co e t a so a e A to µg of zi f o sta da d u e a d al ulate ) o te t of sa ple.
Determination of volume of Dithizone to be added
To separator containing Zinc standard solution equivalent to 20 µg Zinc and diluted to 25 ml with 0.04 N
HCl, add 5.0 ml citrate solution, 10.0 ml of CCl4 and add dithizone reagent in 0.1 ml increments , shaking
briefly after each addition until faint yellow in aqueous phase indicates bare excess of reagent.
Multiply the volume of dithizone solution required by 1.5 and adds this volume (to nearest 0.05 ml) to
all samples.
Preparation of standard curve
Prepare series of separators containing 0, 5, 10, 15 and 20 µg of Zinc diluted to 25 ml with 0.04 N HCl.
Add to each separator, 5.0 ml of citrate solution, 10 ml of CCl4 and determined volume of dithizone
solution and shake for 2 minutes. Pipette exactly 5.0 ml of solvent layer into clean, dry test tube. Dilute
with 10.0 ml of CCl4. Mix well and read absorbance at 540 nm
Plot A agai st o e t atio a d draw smooth curve through points.
22.5. Determination of Iron by Colorimetric Method
Principle
Organic matter in the sample is destroyed by ashing, and the resulting ash is dissolved in Hydrochloric
acid and diluted to a known volume with water.
Whole of the Iron present in the aliquot of ash solution is reduced with Hydroxylamine hydrochloride
and Fe (II) is determined spectrophotometrically as its colou ed o ple ith α-α-dipyridyl, the solution
being buffered with acetate buffer solution. Absorption of resulting complex is read at 510 nm.
Reagents
Magnesium nitrate solution (50% w/v): Dissolve 50 g of Mg(NO3)2.6 H2O in distilled water and
dilute to 100 ml with distilled water
Concentrated Hydrochloric acid

Joy P P, Surya S. and Aswathy C. 2015. Pineapple Research Station (Kerala Agricultura l University) Vazhakulam-686670 Muvattupuzha, Ernakulam, Kerala. Tel.: 0485-2260832, 9446010905, Email: [email protected], Web: prsvkm.kau.in
134 Laboratory Manual of Biochemistry
Hydroxylamine hydrochloride solution (10% w/v): Dissolve 10 g H2NOH. HCl in distilled water
and dilute to 100 ml
Acetate buffer solution: Dissolve 8.3 g Anhydrous NaOAC (previously dried at 100C) in distilled
water, add 12 ml of Glacial acetic acid and dilute to 100 ml
α-α-dipyridyl solution (0.1% w/v): Dissolve 0.1 g of α-α-dipyridyl in distilled water and dilute to
100 ml. Keep this reagent in cool and dark place.
Iron standard solution(0.01mg Fe/ml):
Dissolve 0.3412 g Fe(NH4)2(SO4)2.6 H2O in distilled water, add 2 drops of concentrated
HCl and dilute to 100 ml
Dilute 5 ml of solution to 250 ml
Ortho phenanthroline solution (0.1% w/v): Dissolve 0.1 g of O-phenanthroline in 80 ml of
distilled water at 80C, cool and dilute to 100 ml with distilled water. Keep in cool and dark
place.
Preparation of sample
Weigh accurately, a suitable quantity of well homogenized sample, into a clean and tared silica dish. If
sample contains more water, dry on a water bath. Char the sample (in the dish) on low flame of a burner
till all the volatile matter escapes and smoking ceases. Transfer the dish to a cold muffle furnace and
raise the temperature slowly to 450C. Continue ashing at 450C till practically carbon-free ash is
obtained. (If carbon is present in ash even after 4 to 5 hour of ashing, remove the dish from furnace,
cool and moisten the ash with 1 ml of Magnesium nitrate solution, dry on water bath and ash in furnace
at 450C. After the ash is carbon free remove the dish from furnace and cool.
Add 5 ml of concentrated HCl letting acid rinse the upper portion of the dish and evapo urate to dryness
on a water bath. Dissolve residue by adding exactly 2.0 ml of concentrated HCl, heat for 5 minutes on
steam bath with watch glass covering the dish. Rinse watch glass with water, filter i nto a 100 ml
volumetric flask, cool and dilute to volume.
Determination of Iron
Pipette 10 ml aliquot of ash solution into 25 ml volumetric flask, and add 1 ml hydroxylamine
hydrochloride solution. After 5 minutes, add 5 ml buffer solution and 1 ml of O-phenanthroline solution
or 2 ml of Dipyridyl solution and dilute to volume. Determine absorbance of solution at 510 nm. From
absorbance reading, determine Fe content present in aliquot of ash solution taken by referring to
standard curve.
Preparation of Standard curve
Pipette 0, 0.5, 1, 1.5, 2.0, 3.0 and 4.0 ml of Fe standard solution into a series of 25 ml volumetric flasks
and add to each of them exactly 0.2 ml of concentrated HCl dilute each of them to exactly 10 ml with
water, and then add reagents in the same way as for the sample, plot the quantity of Fe (in mg) against
the absorbance.
Calculation
Iron content of sample (mg Fe/ 100 gm sample)
=
Quantity of Fe in aliquot of ash solution
× × 100
Aliquot of ash solution taken for determination Weight of the sample taken for ashing
Total volume of ash solution

Joy P P, Surya S. and Aswathy C. 2015. Pineapple Research Station (Kerala Agricultura l University) Vazhakulam-686670 Muvattupuzha, Ernakulam, Kerala. Tel.: 0485-2260832, 9446010905, Email: [email protected], Web: prsvkm.kau.in
135 Laboratory Manual of Biochemistry
H. Appendices
23. Appendix I - Abbreviations
A Absorbance
AAS Atomic Absorption Spectrometry
AOAC Association of Official Analytical Chemists
APS Ammonium Per Sulphate
BHA Butylated Hydroxy Anisol
BOAA β- N- oxalyl- amino- L- alanine
BOD Biological Oxygen Demand
bp Boiling Point
BSA Bovine serum albumin
CFC Chlorofluro Carbon
CI Chemical Ionization
DNPH 2,4 – di nitro Phenyl Hydrazine
DNS Di Nitro Salicylate
dNTP s Deoxy Nucleoside Tri Phosphates
DPPH 1,1- di phenyl -2- picrylhydrazyl
EDL Electrode less Discharge Lamp
EDTA Ethylene Diamine Tetra Acetic acid
EI Electron Ionization
ELSD Evapourative Light Scattering Detector
Eq. wt Equivalent weight
ESI Electron Spray Ionization
ETAAS Electro Thermal Atomic Absorption Spectrometry
EtBr Ethidium Bromide
FAAS Flame Atomic Absorption Spectrometry
FAB Fast Atom Bombardment
FCR Folin-Ciocalteau reagent
GC Gas Chromatography
GFAAS Graphite Furnace-AAS
GLP Good Laboratory Practice
HC Hydro Carbon
HCL Hollow Cathode Lamp
HEPA High Efficiency Particulate Air
HPLC High-performance liquid chromatography
M Molarity
MALDI Matrix Assisted Laser Desorption / Ionization
MFC Mixed Fluid Cascade
MS Mass spectrometry
MSDS Material safety data sheet
NaOAc Sodium Acetate
NFE Nitrogen Free Extract
nm Nanometre(s) = 10-9 metre
OD Optical Density

Joy P P, Surya S. and Aswathy C. 2015. Pineapple Research Station (Kerala Agricultura l University) Vazhakulam-686670 Muvattupuzha, Ernakulam, Kerala. Tel.: 0485-2260832, 9446010905, Email: [email protected], Web: prsvkm.kau.in
136 Laboratory Manual of Biochemistry
PA Poly Acrylamide
PBS Phosphate buffered saline triphosphate
PC Paper chromatography
PCR Polymerase chain reaction
PMT Photomultiplier Tube
PPE Personal Protective Equipment
RCF Relative Centrifugal Force
R&D Research and Development
RDA Recommended Dietary Allowance
Rf Relative mobility in chromatography
RH Relative Humidity
rpm Revolution Per Minute
SD Standard Deviation
SDS Sodium Dodecyl Sulphate
SI “ ste e I te atio al d U ites
TCA Tri Chloro Acetic acid
TD To Deliver
TDF Total Dietary Fibre
TDT Thermal Death Time
TEMED N,N,N1,N1 Tetramethylethylenediamine
TLC Thin layer chromatography
TM Melting Temperature
TSS Total Soluble Solids
UV Ultraviolet
VIS Visible

Joy P P, Surya S. and Aswathy C. 2015. Pineapple Research Station (Kerala Agricultura l University) Vazhakulam-686670 Muvattupuzha, Ernakulam, Kerala. Tel.: 0485-2260832, 9446010905, Email: [email protected], Web: prsvkm.kau.in
137 Laboratory Manual of Biochemistry
24. Appendix II - Glossary
Absorbance (A): A measure of the amount of light absorbed by a substance suspended in a matrix.
The matrix may be gaseous, liquid, or solid in nature. Most biologically active compounds (e.g., proteins)
absorb light in the Ultra Violet (UV) or visible light portion of the spectrum. Absorbance is used to
quantitate the concentration of the substance in question.
Absorption: From the Latin ab, away, and sorbere, to suck into. Absorption is the taking up of nutrients,
water etc. by assimilation.
Acid: A substance that contains hydrogen atoms in its molecular structure, with a pH in the range from
0-6, which will react with a base to form a salt. Acids normally taste sour and feel slippery.
Affinity chromatography: A technique for separating a protein from a mixture on the basis of a property
specific to that particular protein. For example, one substrate for lactate dehydrogenase is NADH; a
column with NADH or a structurally related molecule may bind lactate dehydrogenase (and probably
other dehydrogenases) with high affinity, while not binding the vast majority of other proteins.
Alkali solutions: When preparing concentrated alkali solutions (e.g., 40% NaOH) dissolve the alkali in
distilled water under cooling.
Amylase: A term that is used to refer to a category of enzymes that catalyzes the chemical reaction in
which amylose (starch) molecules are hydrolytically cleaved to molecular pieces (e.g., the
polysac ha ides altose, altot iose, α-dextrin etc.).
Angstrom (Å): A unit used for measuring lengths shorter than 100 Å such as those of atoms and
molecules (nanometer, nm is used for longer dimensions);
1 Å = 10 -10 metre or 10 -8 centimetre or 0.1 nanometre
Anion: Negatively-charged particle or ion
Aquadest: Distilled water
Assay: A test that measures a response to a test substance or the efficacy of the test substance.
Ascorbic Acid: Ascorbic acid is a naturally occurring organic compound with antioxidant properties. It is
white solid and soluble in water. Ascorbic acid is one form of vitamin C. It was originally called L-
hexuronic acid, but, when it was found to have vitamin C activity in animals.
Band: A chromatographic zone that is a region where the separated substance is concentrated.
Biochemistry: The study of chemical processes that comprise living things (systems); the chemistry of
life and living matter. It takes into account the studies related to the nature of the chemical constituents
of living matter, their transformations in biological systems and the e nergy changes associated with
these transformations. Biochemistry may thus be treated as a discipline in which biological phenomena
are analyzed in terms of chemistry.
Buffer: A solution containing both a weak acid and its conjugate weak base whose pH changes only
slightly on the addition of acid or alkali.
Joy P P, Surya S. and Aswathy C. 2015. Pineapple Research Station (Kerala Agricultura l University) Vazhakulam-686670 Muvattupuzha, Ernakulam, Kerala. Tel.: 0485-2260832, 9446010905, Email: [email protected], Web: prsvkm.kau.in
138 Laboratory Manual of Biochemistry
Carbohydrates (saccharides): A large class of carbon-hydrogen-oxygen compounds. Monosaccharides
are called simple sugars, of which the most abundant is D-glucose. It is both the major fuel for most
organisms and constitutes the basic building block of the most abundant polysaccharides, such as starch
and cellulose. While starch is a fuel source, cellulose is the primary structural material of plants.
Carbohydrates are produced by photosynthesis in plants. Most, but not all, carbohydrates are
represented chemically by the formula Cx(H2O)n, where x and n are variable numbers, e.g. glucose:
C6H12O6. On the basis of their chemical structures, carbohydrates are classified as polyhydroxy
aldehydes, polyhydroxy ketones, and their derivatives.
Cation: Positively-charged particle or ion
Centrifuge: A machine that is used to separate heavier from lighter molecules and cellular components
and structures.
Chromatogram: A series of separated bands or zones detected either visually, as in paper
chromatographic or thin layer chromatographic separations or indirectly by a detection system.
Chromatography: A method, often used in laboratories, which enables the easy and efficient separation
of mixtures of chemical compounds using the phenomenon of adsorption. The technique's strengths are
especially manifested in the separation of isomers and natural materials.
Desiccation: The process by which a substance is dried out and the moisture removed; desiccation is
often carried out in a desiccator, which contains a substance which will take up water.
EDTA: Ethylene diamine tetra acetic acid is an amino poly carboxylic acid and a colourless, water-soluble
solid. Its conjugate base is named ethylene diamine tetra acetate. It is an organic molecule is able to
chelate (bind) certain other molecules such as divalent metal cations due to chemical groups at their
juxtaposition within that molecule.
Effluent: Mobile phase that has exited from the column
Electrophoresis: Electrophoresis is an analytical method frequently used in molecular biology and
medicine. It is applied for the separation and characterization of proteins, nucleic acids and subcellular
sized particles like viruses and small organelles. Its principle is that the charged particles of a sample
migrate in an applied electrical field. If conducted in solution, samples are separated according to their
surface net charge density. The most frequent applications, however, use gels (Polyacrylamide, Agarose)
as a support medium. The presence of such a matrix adds a sieving effect so that particles can be
characterized by both charge and size. Protein electrophoresis is often performed in the presence of a
charged detergent like Sodium dodecyl sulphate (SDS) which usually equalizes the surface charge and,
therefore, allows for the determination of protein sizes on a single gel. Additives are not necessary for
nucleic acids which have a similar surface charge irrespective of their size.
Eluate: A compound or mixture that has been separated in and exited from the column.
Eluent: Mobile phase
Elution: Removal of solute from a stationary phase by passage of a suitable mobile phase.
Enzyme: Enzymes are proteins that have catalytic functions indispensable to maintenance and activity of
life. All chemical reactions occurring in a living organism are dependent on the catalytic actions of
enzymes, and this is why enzymes are called biotransformers. Each enzyme is highly specific with regard

Joy P P, Surya S. and Aswathy C. 2015. Pineapple Research Station (Kerala Agricultura l University) Vazhakulam-686670 Muvattupuzha, Ernakulam, Kerala. Tel.: 0485-2260832, 9446010905, Email: [email protected], Web: prsvkm.kau.in
139 Laboratory Manual of Biochemistry
to the type of chemical reaction that it catalyzes, and to the substances (called substrates) upon which it
acts. All enzymes are proteins; containing additional non-protein components called coenzymes.
Experiment: The test of a hypothesis
Ion-Exchange Chromatography: Separation of ionic compounds (which include nucleic acids and
proteins) in a chromatographic column containing a polymeric resin (i.e., the stationary phase) having
fixed charge groups. The process works in that charges of the column (stationary phase) interact with
the opposite charges of the material which has dissolved in the material that is flowing through the
column (mobile phase). The charge interaction between the column material and, i.e., the protein has
the effect of slowing down the rate of movement of protein through the column. The other molecule,
meanwhile, which not interact with the column, flow right on-through. This constitutes the separation
process.
Lakhodi dal (Lathyrus sativus : It is also k o as khesa i it g o a d o su ed all o e Maha asht a by the rural for production and sale.
Microscope: An optical instrument that uses a lens or a combination of lenses to produce magnified
images of small objects, especially of objects too small to be seen by the unaided eye.
Miliqwater: Ultrapure laboratory grade water that has been filtered and purified by reverse osmosis.
Mobile phase: The mixture of solvents that is percolated through the column.
Mobility: The velocity of a particle or ion attains for a given voltage. A relative measure of how quickly
an ion moves in an electric field.
Molecular sieving: Separation of molecules on the basis of their effective sizes.
Northern Blotting: A research test/methodology used to transfer RNA fragments from an agarose gel
(e.g., following gel electrophoresis) to a filter paper without changing the relative positions of the RNA
fragments (e.g., re electrophoresis separation grid).
Polyacrylamide Gel: A sie i g gel, hich is used in electrophoresis
Polymerase Chain Reaction (PCR): A reaction that uses the enzyme DNA polymerase to catalyze the
formation of more DNA strands from an original one by the execution of repeated cycles of DNA
synthesis. Functionally, this is accomplished by heating and melting double-stranded DNA (hydrogen
bonded) into single-stranded DNA (non-hydrogen bonded) and producing an oligo nucleotide primer
complementary to each DNA strand. The primers bind to DNA and mark it in such a way that the
addition of DNA polymerase and deoxy nucleoside tri phosphates causes a new strand of DNA, which is
complementary to the target section of DNA. The process described previously is repeated (trait,
product etc.) again and again to produce millions of copies (amplicons) of the desired strand of DNA.
Resolution: The degree of separation between two components by chromatography.
Retention time: The time that has elapsed from the injection of sample into the chromatographic
system to the recording of the peak maximum of the component in the chromatogram.
Reverse phase: A chromatographic mode in which the mobile phase is more polar than the stationary
phase.

Joy P P, Surya S. and Aswathy C. 2015. Pineapple Research Station (Kerala Agricultura l University) Vazhakulam-686670 Muvattupuzha, Ernakulam, Kerala. Tel.: 0485-2260832, 9446010905, Email: [email protected], Web: prsvkm.kau.in
140 Laboratory Manual of Biochemistry
Rf: A ratio used in paper chromatography, and thin-layer chromatography that is the difference from the
origin to the centre of the separated zone divided by the distance from the origin to the solvent front.
SDS: Sodium dodecyl sulphate, also known as Sodium lauryl sulphate (SLS) is a surfactant used in
biochemical and biotechnological applications for the solubilization of membrane components and hard-
to- solubilize molecules. The SDS/PA in water solution helps to separate out contaminants commonly
present in samples from plant tissues. Because DNA molecules are much more soluble in SDS/PA
solution than are those contaminant molecules. Above a critical concentration, SDS forms micelles in
water are thought to be responsible for its solubilizing action.
Southern Blot Analysis: A test that is performed on biological samples such as plant DNA. Gel
electrophoresis is used to separate the DNA fragments according to size, and then those fragments are
transferred to a filter (blot). Radio labeled DNA probes or RNA probes are added, and the ones which are
complementary to each of the fragments will hybridize to those respective DNA fragments. The location
(on the blot a d adioa ti e la el of those h idized p o es a the e utilized to dete i e the nature of the DNA that was in those plant cells.
Southern Blot: Is a kind of electro blot, in which the substances separated and transferred are nucleic
acids.
Stationary Phase: The portion of separation system that is immobilized in the column.
Support: The particles on which the stationary phase is held.
Ultracentrifuge: A high-speed centrifuge that can attain revolving speeds up to 85,000 rpm and
centrifugal fields up to 500,000 times gravity. The machine is used to sediment (i.e., cause to settle out)
macromolecular structures in a mixture/solution. In general, a centrifuge is a machine that whirls test
tubes around rapidly, like a merry-go-round, to force the heavier suspended materials to the bottoms of
those test tubes before the lighter material.
Ultra filtration: A separation methodology that uses the ability of synthetic semi permeable membranes
to discriminate between molecules in the mixture, primarily on the basis of size and shape of the
molecule. Invented and developed by Dr. Roy J. Taylor in the 1950s and 1960s, ultra filtration is typically
used for the separation of relatively high-molecular-weight solutes (e.g., proteins, gums, polymers and
other complex organic molecules) and colloidally dispersed substances (e.g., minerals, microorganisms,
etc.) from their solvents.
Units (U): A measure of biological activity of a substance, as defined by various standardized assays.
Western Blot: Is a kind of electro blot, in which the substances separated and transferred are proteins.

Joy P P, Surya S. and Aswathy C. 2015. Pineapple Research Station (Kerala Agricultura l University) Vazhakulam-686670 Muvattupuzha, Ernakulam, Kerala. Tel.: 0485-2260832, 9446010905, Email: [email protected], Web: prsvkm.kau.in
141 Laboratory Manual of Biochemistry
25. Appendix III - Definitions
1. Atomic weight: The average mass of atoms of an element, calculated using the relative
abundance of isotopes in a naturally occurring element.
2. Molecular weight: The sum of the atomic weights of all the atoms in a molecule is its molecular
weight.
3. Equivalent weight: Equivalent weight of a substance is the number of grams of the substance
required to react with, replace one mole of H2O+ or OH-.The equivalent weight of an acid is the
weight that contains one atomic weight of acidic hydrogen. i.e., the hydrogen that reacts during
neutralization of acid with base.
4. Percent Solution (w/v): One percent solution of a substance contains one gram of the substance
in 100 ml of the solvent. If v/v is given, it means 1 ml in 100 ml of solvent.
5. Molar solution (M): One molar solution of a substance contains one mole or one molecular
weight of the substance in one litre of solution.
6. Normal solution (N): One normal solution of a substance contains one equivalent or one gram
equivalent weight of the substance in one litre solution.
7. Buffer: A solution containing both a weak acid and its conjugate weak base whose pH changes
only slightly on the addition of acid or alkali.
8. pH: pH is a value taken to represent the acidity or alkalinity of an aqueous solution. It is defined
as logarithm of the reciprocal of the hydrogen ion concentration of the solution.
i.e., pH= log
9. Acidic buffer solutions: An acidic buffer solution is simply one which has a pH less than 7. Acidic
buffer solutions are commonly made from a weak acid and one of its salts - often a sodium
salt. A common example would be a mixture of Ethanoic acid and Sodium ethanoate in solution.
Change the pH of the buffer solution by changing the ratio of acid to salt, or by choosing a
different acid and one of its salts.
10. Alkaline buffer solutions: An alkaline buffer solution has a pH greater than 7. Alkaline buffer
solutions are commonly made from a weak base and one of its salts. A frequently used example
is a mixture of ammonia solution and Ammonium chloride solution.
11. Dilute acids: While preparing dilute acids, add slowly to water preferable under cooling.
12. Alkali solutions: When preparing concentrated alkali solutions (e.g., 40% NaOH) dissolve the
alkali in distilled water under cooling.
Conversion Units of Temperature
Temp. in0F= (Temp. in 0Cх . +
Temp. in0C= (Temp. in 0F- х /
Temp. in K = (Temp. in 0F+ . х /
Units of Length
i o = µ= µ = х -6 m
Ǻ= . = х -4 µ = х -10 m
= Ǻ= х -3 µ = х -9m
1
[H+]

Joy P P, Surya S. and Aswathy C. 2015. Pineapple Research Station (Kerala Agricultura l University) Vazhakulam-686670 Muvattupuzha, Ernakulam, Kerala. Tel.: 0485-2260832, 9446010905, Email: [email protected], Web: prsvkm.kau.in
142 Laboratory Manual of Biochemistry
26. Appendix IV - Major Chemicals and Reagents Used in Biochemistry
Acetic acid An organic acid; is one of the simplest carboxylic acids
Acetone An organic compound; simplest example of the ketones
Acetylene A hydrocarbon and the simplest alkyne; widely used as a fuel and chemical
building block
Ammonia inorganic; the precursor to most nitrogen-containing compounds; used to
make fertilizer
Ammonium hydroxide
Aqueous ammonia; used in traditional qualitative inorganic analysis
Baeyer's reagent An alkaline solution of Potassium permanganate; used in organic chemistry as
a qualitative test for the presence of unsaturation, such as double bonds;
N-Bromosuccinimide Used in radical substitution and electrophilic addition reactions in organic
chemistry
Butanone (methyl ethyl ketone)
Organic compound; similar solvent properties to Acetone but has a
significantly slower evaporation rate
Carbon disulfide A non-polar solvent; used frequently as a building block in organic chemistry
Carbon tetrachloride Toxic, and its dissolving power is low; consequently, it has been largely
superseded by deuterated solvents
Collins reagent Used to selectively oxidize primary alcohols to an aldehyde
Copper(I) iodide Useful in a variety of applications ranging from organic synthesis to cloud
seeding
Diethyl ether Organic compound; a common laboratory solvent
Dimethyl ether The simplest ether; a useful precursor to other organic compounds and
an aerosol propellant
Dimethylformamide Organic compound; a common solvent for chemical reactions
Ethanol A powerful psychoactive drug; used in alcoholic beverages, in thermometers,
as a solvent, and as a fuel Fehling's reagent Used to differentiate between water-soluble aldehyde and ketone functional
groups
Formaldehyde The simplest aldehyde; an important precursor to many other chemical
compounds, such as polymers and polyfunctional alcohols
Formic acid The simplest carboxylic acid; often used as a source of the hydride ion
Grignard reagents The most common application is for alkylation of aldehydes and ketones
Hydrochloric acid A highly corrosive, strong mineral acid with many industrial uses
Hydrofluoric acid Valued source of fluorine, precursor to numerous pharmaceuticals; highly
corrosive
Hydrogen peroxide An oxidizer commonly used as a bleach
Imidazole An organic compound; this aromatic heterocyclic is a diazole and is classified as
an alkaloid
Isopropyl alcohol Simplest example of a secondary alcohol; dissolves a wide range of non-polar
compounds
Manganese dioxide Used as a pigment and as a precursor to other manganese compounds; used as
a reagent in organic synthesis for the oxidation of allylic alcohols

Joy P P, Surya S. and Aswathy C. 2015. Pineapple Research Station (Kerala Agricultura l University) Vazhakulam-686670 Muvattupuzha, Ernakulam, Kerala. Tel.: 0485-2260832, 9446010905, Email: [email protected], Web: prsvkm.kau.in
143 Laboratory Manual of Biochemistry
Methyl tert-butyl ether
A gasoline additive; also used in organic chemistry as a relatively inexpensive
solvent
Millon's reagent An analytical reagent used to detect the presence of soluble proteins
Nitric acid Highly corrosive and toxic strong acid; used for the production of fertilizers,
production of explosives, and as a component of aqua regia
Palladium(II) acetate A catalyst for many organic reactions by combining with many common classes
of organic compounds to form reactive adduct
Perchloric acid A powerful oxidizing agent; readily forms explosive mixtures; mainly used in
the production of rocket fuel
Phosphoric acid A mineral acid with many industrial uses; commonly used in the laboratory
preparation of hydrogen halides
Phosphorus pentachloride
One of the most important phosphorus chlorides; a chlorinating reagent. Also
used as a dehydrating agent for oximes which turn them into nitriles
Phosphorus tribromide
used for the conversion of alcohols to alkyl bromides
Phosphorus trichloride
Most important of the three phosphorus chlorides; used to manufacture
organophosphorus compounds; used to convert primary and secondary
alcohols into alkyl chlorides, or Carboxylic acids into acyl chlorides
Potassium dichromate
A common inorganic chemical reagent, most commonly used as an oxidizing
agent in various laboratory and industrial applications
Potassium hydroxide A strong base; precursor to most soft and liquid soaps as well as numerous
potassium-containing chemicals
Potassium permanganate
A strong oxidizing agent; can be used to quantitatively determine the total
oxidizable organic material in an aqueous sample; a reagent for the synthesis
of organic compounds
Raney nickel An alternative catalyst for the hydrogenation of vegetable oils; in organic
synthesis, used for desulfurization
Silver oxide Used to prepare other silver compounds; in organic chemistry, used as a
mild oxidizing agent
Silver nitrate Precursor to many other silver compounds; commonly used in inorganic
chemistry to abstract halides
Sodium hydride A strong base used in organic synthesis
Sodium hydroxide Strong base with many industrial uses; in the laboratory, used with acids to
produce the corresponding salt, also used as an electrolyte
Sodium nitrite Used to convert amines into diazo compounds
Sulfuric acid Strong mineral acid; major industrial use is the production of Phosphoric acid
Tetra hydro furan One of the most polar ethers; a useful solvent; its main use is as a precursor to
polymers

Joy P P, Surya S. and Aswathy C. 2015. Pineapple Research Station (Kerala Agricultura l University) Vazhakulam-686670 Muvattupuzha, Ernakulam, Kerala. Tel.: 0485-2260832, 9446010905, Email: [email protected], Web: prsvkm.kau.in
144 Laboratory Manual of Biochemistry
27. Appendix V - System International (SI) Units, Conversions and Derivations
The French Syste e I ter atio al d’ U ites (the SI system) is accepted conversion for all units of
measurements.
Table.8. SI Units of Mass
Weight Symbol Multiple of gram Lower equivalent
Megagram M 106 1000 kilogram
Kilogram K 103 1000 gram
Gram G 1 1000 milligram
Milligram M 10-3 1000 microgram
Microgram µ 10-6 1000 nanogram
Nanogram N 10-9 1000 picogram
Picogram P 10-12 1000 femtogram
Table.9. SI units – Basic
Quantity SI unit Symbol (basic SI units)
Quantity SI unit Symbol (basic SI units)
Basic units Basic units
Length Metre M Plane angle Degree o
Mass Kilogram Kg Plane angle Minute Time Second S Plane angle Second
Electric current Ampere A Length Foot Temperature Kelvin K Length Inch
Luminous
intensity
Candela Cd Length Angstrom A
Amount of
substance
Mole Mol Area Barn B
Time Minute Min Volume Litre L
Time Hour H Mass Tonne T
Time Day D Pressure Bar Bar
Table.10. Constants of Acids and Bases
Acid or base Formula Molecular weight
Commercial concentrated reagent
Specific gravity % by weight Molarity(M) Acetic acid CH3COOH 60.1 1.05 99.5 17.4
Ammonium
hydroxide
NH4OH 35.0 0.89 28 14.8
Formic acid HCOOH 46.0 1.20 90 23.4
Hydrochloric acid HCl 36.5 1.18 36 11.6
Nitric acid HNO3 63.0 1.42 71 16.0
Perchloric acid HClO4 100.5 1.67 70 11.6
Phosphoric acid H3PO4 80.0 1.70 85 18.1
Sulphuric acid H2SO4 98.1 1.84 96 18.0

Joy P P, Surya S. and Aswathy C. 2015. Pineapple Research Station (Kerala Agricultura l University) Vazhakulam-686670 Muvattupuzha, Ernakulam, Kerala. Tel.: 0485-2260832, 9446010905, Email: [email protected], Web: prsvkm.kau.in
145 Laboratory Manual of Biochemistry
Table.11. SI units – Derived
Table.12. SI prefixes and multiplication factors
Multiplication factor Prefix Symbol
1 000 000 000 000 000 000 000 000 =1024 yotta Y
1 000 000 000 000 000 000 000 =1021 zetta Z
1 000 000 000 000 000 000 =1018 exa E
1 000 000 000 000 000 =1015 peta P
1 000 000 000 000 =1012 tera T
1 000 000 000 =109 giga G
1 000 000 =106 mega M
1 000 =103 kilo K
100 =102 hecto H
10 =101 deca Da
0.1 =10-1 deci D
0.01 =10-2 centi C
0.001 =10-3 milli M
0.000 001 =10-6 micro
0.000 000 001 =10-9 nano N
0.000 000 000 001 =10-12 pico P
0.000 000 000 000 001 =10-15 femto F
0.000 000 000 000 000 001 =10-18 atto A
0.000 000 000 000 000 000 001 =10-21 zepto Z
0.000 000 000 000 000 000 000 001 =10-24 yocto Y
Quantity SI unit Symbol (basic
SI units)
Definition
of SI unit
Equivalent in SI
units
Force Newton N kgms-2 Jm-1
Energy, work, heat Joule J kgm2s-2 Nm
Power, radiant flux Watt W kgm2s-2 Js-1
Electric charge, quantity Coulomb C As JV-1
Electric potential difference Volt V kgm2s-3A-1 JC-1
Electric resistance Ohm Ω kgm2s-2A-2 VA-1
Pressure Pascal Pa kgm-1S-2 Nm-2
Frequency Hertz Hz S-1
Magnetic flux density Tesla T kgS-2A-1 Vsm-2
Other units based on SI
Area Square metre m2
Volume Cubic metre m3
Density Kilogram per cubic metre kgm-3
Concentration Mole per cubic metre mol m-3

Joy P P, Surya S. and Aswathy C. 2015. Pineapple Research Station (Kerala Agricultura l University) Vazhakulam-686670 Muvattupuzha, Ernakulam, Kerala. Tel.: 0485-2260832, 9446010905, Email: [email protected], Web: prsvkm.kau.in
146 Laboratory Manual of Biochemistry
Table.13. SI Units and Conversion Table
SI Units Conversion Table Length and area fps Units SI Units Reciprocal
Micron (m, ) =10-6 m Length
Angstrom (A) =10-10 m 1 inch (in) =2.54 x 10⁻²m 39.370079
Fermi (fm) =10-15 m 1 foot (ft) =0.3048 m 3.280839
Are (a) =100 m2 1 yard (yd) =0.9144 m 1.093613
Barn (b) =10-28 m2 1 fanthom =1.8288 m 0.546806
Mass 1 chain =20.1168 m 4.97097 x 10⁻²
Tonne (t) =106g=1000kg 1 furlong =2.01168 x 10² m 4.97097 x 10⁻³
fps Units 1 mile (mi) 1.609344 x 10³ m 6.213712 x 10⁻⁴
Length Area
12 inches =1 foot (ft) 1 in2 =6.4516 x 10⁻⁴m2 1.550003 x 10³
3 feet =1 yard (yd) 1 ft2 =9.290304 x 10⁻²m2 10.763910
22 yards =1 chain 1 yd2 =0.836127 m2 1.195990
10 chains =1 furlong 1 mi2 =2.589988 x 10⁶ m2 3.861022 x 10⁻⁷
8 furlongs =1 mile (mi) 1 acre =4.046856 x 10³ m2 2.471054 x 10⁻⁴
6 feet =1 fanthom Volume
6080 feet =1UK nautical mile 1 in3 =1.638706 x 10⁻⁵ m3 6.102374 x 10⁴
Area 1 ft3 =2.831685 x 10⁻²m3 35.31467
4840 yard2 =1 acre 1yd3 =0.764555 m3 1.307950
640 acres =1 mile2 1 fluid ounce (fl oz) =2.841306 x 10⁻⁵m3 3.519508 x 10⁴
Mass 1 pint (pt) 5.682613 x 10⁻⁴m3 1.759754 x 10³
16 ounces (oz) =1 pound (lb) 1 quart (qt) =1.136523 x 10⁻³m3 8.798770 x 10²
14 pounds =1 stone 1 gallon (gal) =4.54609 x 10⁻³m3 2.199692 x 10²
28 pounds =1 quarter 1 bushel (bu) =0.036369 m3 27.495944
4 quarters =1 hundredweight 1 US gallon (=231in3) =3.785412 x 10⁻³ m3 2.641721 x 10²
20 hundredweight =1 ton Mass
Volume 1 ounce (oz) =2.834952 x 10⁻² kg 35.273962
20 fluid ounces =1 pint (pt) 1 pound (lb) =0.45359237 kg 2.204623
2 pints =1 quart (qt) 1 stone =6.350293 kg 0.158473
4 quarts =1 gallon 1 quarter =12.700586 kg 7.873652 x 10⁻²
1 hundredweight =50.802345 kg 1.968413 x 10⁻²
1 ton =1.016047 x 10³ kg 9.842065 x 10⁻⁴
Table.14. Designation of large numbers
USA UK 106 Million Million 109
1012
billion
trillion
Milliard
Billion
1015
1018
quadrillion
quintillion
Billiard
Trillion

Joy P P, Surya S. and Aswathy C. 2015. Pineapple Research Station (Kerala Agricultura l University) Vazhakulam-686670 Muvattupuzha, Ernakulam, Kerala. Tel.: 0485-2260832, 9446010905, Email: [email protected], Web: prsvkm.kau.in
147 Laboratory Manual of Biochemistry
Table.15. Conversion Factors
Table.16. Soil test rating
Table.17. Electromagnetic and visible spectra
Parameter Conversion Reciprocal P2O5 =P x 2.29 0.43668
K2O
Urea
=K x 1.2
=N x 2.174
0.83333
0.46
SSP
MOP
=P2O5 x 6.25
=K2O x 1.67
0.16
0.275438
Organic matter % =C x 1.74 0.5747
Parameter Low Medium High
O.C. %
N kg/ha
< 0.5
< 280
0.5-0.75
280-560
> 0.75
> 560
P kg/ha < 10 10-25 > 25
K kg/ha < 110 110-280 > 280
10-12
cm
Cosmic rays
10-10
Gamma rays
4000
A Violet
10-8
X-rays
Indigo
Blue
10-6
Ultraviolet rays
5000
Green
10-4
Visible light
Yellow
10-2
Infrared rays
6000 Orange
Red
10
Short hertzian waves
102
7000 Deep red
104
Radio waves and long
electrical oscillations
106 108

Joy P P, Surya S. and Aswathy C. 2015. Pineapple Research Station (Kerala Agricultura l University) Vazhakulam-686670 Muvattupuzha, Ernakulam, Kerala. Tel.: 0485-2260832, 9446010905, Email: [email protected], Web: prsvkm.kau.in
148 Laboratory Manual of Biochemistry
Useful data 1 atom = 764 mm Hg = 1036 cm water = 1013 mbar = pF 3 = 1.03329 kg/cm2 = 1013231 dynes/cm2
1 ha = 0.01 km2 = 10000 m2 = 2.471 ac = 0.003861 mile2
1 ac = 100 cents = 0.4 ha = 4047m2 = 43560ft2,1 cent = 40.47m2 = 436ft2
1 mile = 8 furlong = 80chains = 1760yards = 5280ft
1 ton = 20 hundredweight (cwt) = 80 quarter = 2240 pounds = 35840 ounces
1 HP = 76.0404 kg.m/s = 745.7 watts = 550 ft.lb/s
Erosion: v velocity, v2 erosive power, v5 amount eroded, v6 size of materials carried away.
When slope is increased 4 times: increase in velocity 2 times, erosivity 4 times, quantity 32 times, size
64 times.
Construct bunds every 3 ft vertical drop or 300 ft length whichever is less
Solar constant: 2cal/cm2/minute. Average energy received on earth from sun.
Plants use only 0.4-0.5% energy. Algae use the maximum, 2.5%
Bee s la I=Ioe-KL
Hopkins bioclimatic law: Crop phonological events are delayed by 1 day for every 1o latitude, 5o
longitude and 400 ft altitude.
15 cm 1 ha furrow slice = 2.2 million kg
1 ha 1 mm water = 10 m3
1 cusec (cubic foot/s) = ft3/s = 28.3 l/s = 1 acre inch/hour
1 cumes (cubic metre/s) = m3/s = 35.3 cusecs oC = (oF – 32) 5 9 ; oF = 1.8oC + 32
Balanced fertilizer application based on balanced ratio of NPK 4:16:1 in the economic part.
Protein contains 16% N, Protein % =N% x 6.25
Organic matter contains 58% carbon, Organic matter % =C % x 1.724
Soil water potential, =m/p + o/s + g + a
Pan evaporation, Eo=4-6 mm/day, Eto=Eo x 0.6-0.8
Irrigation requirement: depth=3-8cm, interval=8-10days, IW/CPE=0.9 for sensitive crops, 0.6 for hardy
crops
N x Eq. wt=g/l, N=Eq. wt/l, ppm=g/ml=mg/l=me/l x Eq. wt.
mmhos/cm, EC x 640=TSS, ppm; EC x 0.064=TSS%; EC x 10=TSS, me/l; EC x –0.36=o/s (+ osmotic
pressure)
NPK recovery by crop: <40, <20, 80-90%
Cation adsorption to clay: Al>Fe>Si>H>Ca>Mg>K>Na
Anion adsorption to clay: SiO4>PO4>MO4>SO4>NO3>Cl
(Cation and anion leaching in reverse order)
Anion toxicity to crops: HCO3>CO3>Cl>SO4>NO3
Anaerobic reduction during flooding: O>NO3>Mn>Fe>S>C
Lyophilic series/Displacement capacity of anions: F>OH>HCO3>PO4>SiO4
Plant mobile nutrients: N, P, K, Mg, Cl, S
Plant immobile elements: Ca, Fe, Mn, Zn, Cu, Mo, B
Particle size: solution < 10A colloid 1000A > suspension
Neutralising value (Ca equivalent): CaCO3 100, MgCO3 119, Ca(OH)2 136, CaO 179
Residual (equivalent) acidity: CaNH4NO3 zero, Urea 80, NH4NO3 60, (NH4)2SO4 110, (NH4)3PO4 86, NH4Cl
128, anhydrous NH3 148
Essential elements: C, H, O, N, P, K, Ca, Mg, S, Fe, Mn, Zn, Cu, Mo, B, Cl, Co
Soils having >20% o.m. = organic; >70% sand = sandy; >40% clay = clayey; 27-52% silt = silty soil

Joy P P, Surya S. and Aswathy C. 2015. Pineapple Research Station (Kerala Agricultura l University) Vazhakulam-686670 Muvattupuzha, Ernakulam, Kerala. Tel.: 0485-2260832, 9446010905, Email: [email protected], Web: prsvkm.kau.in
149 Laboratory Manual of Biochemistry
28. Appendix VI - Solution Preparation
I. Buffers
A uffe , as defi ed Va “lake is a su sta e hi h its p ese e i solutio i eases the a ou t
of a id o alkali that ust e added to ause u it ha ge i pH . Buffe s a e thus e i po ta t components in experiments designed to study biological reactions by maintaining a constant
concentration of hydrogen ions within the physiological range.
Measurement of pH
pH can be measured in many ways. An accurate and practical method for measuring pH involves the use
of pH meter. It consists of a glass electrode with a glass bulb made of very thin glass that is permeable to
hydrogen ions. Standardization against a buffer of known H+ concentration is required since
concentration of H+ inside the bulb of glass electrode changes with time.
The pH scale usually runs from 0 to 14, with 7 representing neutrality and pH value above 7 characterize
basic conditions and pH value below 7 represent acidic conditions.
The pH of the mobile phase (eluent) is adjusted to improve component separation and to extend the
column life.
This pH adjustment should involve not simply dripping in an acid or alkali but using buf fer solutions.
A buffer solution is prepared as a combination of weak acids and their salts (sodium salts, etc.) or of
weak alkalis and their salts. Common preparation methods include:
i. Dripping an acid (or alkali) into an aqueous solution of a salt while measuring the pH with a pH
meter.
ii. Making an aqueous solution of acid with the same concentration as the salt and mixing while
measuring the pH with a pH meter. However, if the buffer solution is used as an HPLC mobile
phase, even small errors in pH can lead to problems with separation reproducibility. Therefore,
it is important to diligently inspect and calibrate any pH meter that is used. This page introduces
a method that does not rely on a pH meter. The method involves weighing theoretically
calculated fixed quantities of a salt and acid (or alkali) as shown in the table below. Consider the
important points below.
Denoting Buffer Solutions
A buffer solution denoted, "100 mM Phosphoric acid (sodium) buffer solution pH = 2.1," for example,
contains Phosphoric acid as the acid, sodium as the counter ion, 100 mM total concentration of the
Phosphoric acid group, and a guaranteed buffer solution pH of 2.1.
Maximum Buffer Action Close to the Acid (or Alkali) pKa
When an Acetic acid (sodium) buffer solution is prepared from 1:1 Acetic acid and Sodium acetate, for
example, the buffer solution pH is approximately 4.7 (near the Acetic acid pKa), and this is where the
maximum buffer action can be obtained.
Buffer Capacity Increases as Concentration Increases

Joy P P, Surya S. and Aswathy C. 2015. Pineapple Research Station (Kerala Agricultura l University) Vazhakulam-686670 Muvattupuzha, Ernakulam, Kerala. Tel.: 0485-2260832, 9446010905, Email: [email protected], Web: prsvkm.kau.in
150 Laboratory Manual of Biochemistry
The buffer capacity of an Acetic acid (sodium) buffer solution is larger at 100 mM concentration than at
10 mM, for example. However, precipitation occurs more readily at higher concentrations.
Beware of Salt Solubility and Precipitation
The salt solubility depends on the type of salt, such as potassium salt or sodium salt. Salts precipitate
out more readily when an organic solvent is mixed in.
In addition, avoid using buffer solutions based on organic acids (carboxylic acid) as much as possible for
highly sensitive analysis at short UV wavelengths.
Tabe.18. Technical Programme for the Preparation of Buffer Solutions
100 mM phosphoric acid (sodium) buffer solution (pH=2.1)
Sodium di hydrogen phosphate di hydrate (M.W.=156.01)..50 mmol (7.8 g)
Phosphoric acid (85 %, 14.7 mol/l).........................50 mmol (3.4 ml)
Add water to make up to 1 l
10 mM phosphoric acid (sodium) buffer solution (pH=2.6)
Sodium di hydrogen phosphate di hydrate (M.W.=156.01)..5 mmol (0.78 g)
Phosphoric acid (85 %, 14.7 mol/l).........................5 mmol (0.34 ml)
Add water to make up to 1 l
(Alternatively, dilute 100 mM phosphoric acid (sodium) buffer solution (pH=2.1) ten times.)
50 mM phosphoric acid (sodium) buffer solution (pH=2.8)
Sodium di hydrogen phosphate di hydrate (M.W.=156.01)..40 mmol (6.24 g)
Phosphoric acid (85 %, 14.7 mol/l).........................10 mmol (0.68 ml)
Add water to make up to 1 l
100 mM phosphoric acid (sodium) buffer solution (pH=6.8)
Sodium di hydrogen phosphate di hydrate (M.W.=156.01)..50 mmol (7.8 g)
Sodium di hydrogen phosphate 12-hydrate (M.W.=358.14)..50 mmol (17.9 g)
Add water to make up to 1 l
10 mM phosphoric acid (sodium) buffer solution (pH=6.9)
Sodium di hydrogen phosphate di hydrate (M.W.=156.01)..5 mmol (0.78 g)
Sodium di hydrogen phosphate 12-hydrate (M.W.=358.14)..5 mmol (1.79 g)
Add water to make up to 1 l
(Alternatively, dilute 100 mM phosphoric acid (sodium) buffer solution (pH=6.8) ten times.)
20 mM citric acid (sodium) buffer solution (pH=3.1)
Citrate di hydrate (M.W.=210.14)...............16.7 mmol (3.51 g)
Sodium citrate di hydrate (M.W.=294.10)..3.3 mmol (0.97 g)
Add water to make up to 1 l
20 mM citric acid (sodium) buffer solution (pH=4.6)
Citrate di hydrate (M.W.=210.14)...............10 mmol (2.1 g)
Sodium citrate di hydrate (M.W.=294.10)..10 mmol (2.94 g)
Add water to make up to 1 l
20mM (acetic acid) ethanolamine buffer solution pH=9.6
Monoethanolamine (M.W.=61.87, d=1.017)...20 mmol (1.22 ml)

Joy P P, Surya S. and Aswathy C. 2015. Pineapple Research Station (Kerala Agricultura l University) Vazhakulam-686670 Muvattupuzha, Ernakulam, Kerala. Tel.: 0485-2260832, 9446010905, Email: [email protected], Web: prsvkm.kau.in
151 Laboratory Manual of Biochemistry
Acetic acid (glacial acetic acid, 17.4 mol/l)..................10 mmol (0.575 ml)
Add water to make up to 1 l
100 mM acetic acid (sodium) buffer solution (pH=4.7)
Acetic acid (glacial acetic acid) (99.5 %, 17.4 mol/l)..................50 mmol (2.87 ml)
Sodium acetate trihydrate (M.W.=136.08)........50 mmol (6.80 g)
Add water to make up to 1 l
100 mM boric acid (potassium) buffer solution (pH=9.1)
Boric acid (M.W.=61.83)...............100 mmol (6.18 g)
Potassium hydroxide (M.W.=56.11)...............50 mmol (2.81 g)
Add water to make up to 1 l
100 mM boric acid (sodium) buffer solution (pH=9.1)
Boric acid (M.W.=61.83)...............100 mmol (6.18 g)
Sodium hydroxide (M.W.=40.00)...............50 mmol (2.00 g)
Add water to make up to 1 l
Glycine-NaOH Buffer
Stock Solutions
A: 0.2 M solution of glycine (15.01 g in 1 l)
B: 0.2 M NaOH
50 ml of A+ x ml of B, diluted to a total of 200 Ml
Table.19. Glycine-NaOH Buffer - Stock Solutions
X pH 4.0 8.6
6.0 8.8
8.8 9.0
12.0 9.2
16.8 9.4
22.4 9.6
27.2 9.8
32.0 10.0
38.6 10.4
45.6 10.6
Phosphate Buffer
Stock solutions
A: 0.2 M solution of monobasic phosphate (27.8 g in 1000 ml)
B: 0.2 M solution of the dibasic sodium phosphate (53.65 g of Na2 HPO4.7H2O or 71.7 g of Na2
HPO4.12H2O in 1000 ml)
x ml of A, y ml of B, diluted to a total of 200 Ml

Joy P P, Surya S. and Aswathy C. 2015. Pineapple Research Station (Kerala Agricultura l University) Vazhakulam-686670 Muvattupuzha, Ernakulam, Kerala. Tel.: 0485-2260832, 9446010905, Email: [email protected], Web: prsvkm.kau.in
152 Laboratory Manual of Biochemistry
Table.20. Phosphate Buffer - Stock solutions
X Y pH X Y pH 93.5 6.5 5.7 45.0 55.0 6.9
92.0 8.0 5.8 39.0 61.0 7.0
90.0 10.0 5.9 33.0 67.0 7.1
87.7 12.3 6.0 28.0 72.0 7.2
85.0 15.0 6.1 23.0 77.0 7.3
81.5 18.5 6.2 19.0 81.0 7.4
77.5 22.5 6.3 16.0 84.0 7.5
73.5 26.5 6.4 13.0 87.0 7.6
68.5 31.5 6.5 10.5 89.5 7.7
62.5 37.5 6.6 8.5 91.5 7.8
56.5 43.5 6.7 7.0 93.0 7.9
51.0 49 6.8 5.3 94.7 8.0
II. Preparation and Dilution of Solutions
a. Percent solution
Solution in the exact concentration of the solute in 100 ml of liquid is known percentage
solution. The concentration may be expressed as weight or volume.
Percentage (v/v) = x ml in 100 ml of solution
Percentage (w/v) = x g in 100 ml solution
III. Preparation of Concentrated Solutions
a. Molar solution (M) (mole): The SI unit of amount of substances, equal to the quantity containing
as many elementary units as there are atoms in 0.012 kg of Carbon-12 or One gram molecular
weight of the solute dissolved in 1000 ml of solvent
b. Normal solution (N): One gram equivalent weight of the solute dissolve d in 1000 ml of distilled
water
c. Molar (mol): containing one mole of solute per kilogram of solvent
IV. Preparation of Standard Solutions
1. Standard NaOH Solutions (0.1 M or 0.1 N)
Reagents
Approximately 0.1 N NaOH solution: Prepare a saturated solution of sodium hydroxide as
follows. Add in small portions about 100g of AR grade NaOH to 100 ml of water in a flask,
stopper and allow to stand for a few days or until the Na2CO3 settles to the bottom. The clear
solution which is carbonate-free contains about 50 g of NaOH/100 ml (approx. 50% solution or
12.5 M). From this solution, pipette out 5.3ml of clear supernatant liquid and transfer to a 1.0
litre rubber stoppered bottle and dilute up to the mark
Standard HCl solution (0.1 N): Prepare and standardize as described before
Phenolphthalein solution: Dissolve 0.5 g of phenolphthalein in 100 ml of 95% alcohol
Joy P P, Surya S. and Aswathy C. 2015. Pineapple Research Station (Kerala Agricultura l University) Vazhakulam-686670 Muvattupuzha, Ernakulam, Kerala. Tel.: 0485-2260832, 9446010905, Email: [email protected], Web: prsvkm.kau.in
153 Laboratory Manual of Biochemistry
Method
Using a pipette, transfer 20 ml of standard HCl solution into 150 ml beaker. Add 25 ml of water and one
drop of phenolphthalein indicator. Titrate with the sodium hydroxide (approx. 0.1 N) until a faint pink
colour is obtained. Repeat titration 2-3 times.
Calculation
The exact normality of NaOH using the relationship N1 V1 = N2 V2
2. Standard H2SO4 Solution (0.05 M/0.1 N)
Reagents
Approximately 0.05 M/0.1 N H2SO4 Solution: Dilute 3.0 ml of pure concentrated H2SO4 solution
(sp. Gr. 1.84, 96%) to 1.0 l with water in a volumetric flask and mix thoroughly)
Anhydrous Na2CO3 solution (0.1 N): Prepare as described under standard HCl
Methyl orange indicator: Prepare as described under standard HCl
Method
Fill a clean, dry burette with H2SO4 solution (0.05 M/0.1 N) and titrate against a known volume (10 ml) of
anhydrous Na2CO3 solution using 2 drops of methyl orange as an indicator until an orange or faint pink
color end point is obtained. Repeat titration 2-3 times.
Calculation
The exact normality of H2SO4 using the relationship N1 V1 = N2 V2
3. Standard HCl Solution (0.1 M or 0.1 N)
Reagents
Approximately 0.1 M or 0.1 N HCl Solution: Dilute 9.0 ml (sp. Gr. 1.18, 35%) or 8.5 ml (sp. Gr.
1.19, 37%) of pure concentrated HCl to 1.0 litre with distilled water in a volumetric flask. Invert
several times and transfer to a clean, dry bottle.
Anhydrous Na2CO3 solution (0.1 N): Dry the pure anhydrous Na2CO3 on a watch glass in the oven
at 110C quantitatively to a beaker and dissolve in about 20 ml of water. Transfer to 100ml
volumetric flask with washings, up to the mark and mix.
Methyl orange indicator solution: Dissolve 0.5 g of Methyl orange in 1.0 litre of distilled water
Method
Fill a clean, dry burette with HCl solution (approx0.1M or 0.1N) and titrate against a known volume (10
ml) of Sodium carbonate (0.1 N) using 2 drops of Methyl orange as an indicator until an orange or faint
pink colour end point is obtained. Note the titre value and repeat titration 2-3 times.
Calculation
UsingN1 V1 = N2 V2 relationship, the exact normality of HCl can be calculated.

Joy P P, Surya S. and Aswathy C. 2015. Pineapple Research Station (Kerala Agricultura l University) Vazhakulam-686670 Muvattupuzha, Ernakulam, Kerala. Tel.: 0485-2260832, 9446010905, Email: [email protected], Web: prsvkm.kau.in
154 Laboratory Manual of Biochemistry
Where, N1 – Normality of HCl to be calculated
N2 - Normality of Na2CO3 = 0.1N
V1 - Volume of HCl (titre value)
V2 –Volume of Na2CO3 (10ml)
Note:
Methyl red also may be used in place of Methyl orange as an indicator provided the CO2 in solution is
expelled by boiling before the end point is reached.
4. Standard Potassium Permanganate Solution (0.1N)
Reagents
Potassium Permanganate Solution (0.1 N approximate): Dissolve about 3.2g of pure crystals of
Potassium permanganate in 200 ml of hot water and allow to stand for 60 minutes at about
100C. The mouth of the container is well closed with a glass-stopper to disallow any addition of
dust particles into the permanganate solution. The solution is then filtered after 2 days standing
through either a sintered filter or a filter of glass wool but never filter through a filter paper
because the latter reduces the strength of permanganate considerably. The solution is kept in
dark because of its sensitivity to light
Oxalic acid (H2C2O4. 2H2O) or Sodium oxalate (COONa)2(0.1N): Dissolve 6.3 g of pure crystals of
oxalic acid in 200 ml of water and transfer to a litre flask. Make up with water or slowly heat 6.7
g of pure sodium oxalate salt in a platinum crucible until the flame of carbon monoxide formed
disappears. Dissolve the contents of crucible with water and make up to 1.0 litre
4N H2SO4
Method
Dilute 10 ml of standard Oxalic acid or oxalate solution to 20 ml water and treat with 15 ml of 4 N
H2SO4. Heat the solution to 70-80C and titrate against permanganate solution until the solution
becomes slightly pink. The colour is permanent. Calculate the normality of permanganate solution using
the relationship
Calculation
UsingN1 V1 = N2 V2 relationship, normality of permanganate solution can be calculated.
5. Sta dardizatio of the Fehli g’s Solutio
Reagents
Fehli g s solutio A Copper sulphate solution): Dissolve 34.639 g of CuSO4.5H2O (pure
recrystallized) in distilled water, dilute to 500 ml and filter
Fehli g s solutio B Alkaline tartarate solution): Dissolve 173 g of Rochelle salt (Sodium
potassium tartarate) and 50 g of NaOH in distilled water dilute to 500 ml. Allow to stand for 2
days and filter. Mix equal volumes (5 ml each) of both immediately before use
Standard glucose solution (0.5%): Dissolve accurately 0.5 g of pure Anhydrous Glucose powder
in distilled water and dilute to 100 ml with distilled water
1.0% Methylene blue: Dissolve 1.0 g in 100 ml 95% alcohol

Joy P P, Surya S. and Aswathy C. 2015. Pineapple Research Station (Kerala Agricultura l University) Vazhakulam-686670 Muvattupuzha, Ernakulam, Kerala. Tel.: 0485-2260832, 9446010905, Email: [email protected], Web: prsvkm.kau.in
155 Laboratory Manual of Biochemistry
Method
Into a conical flask, pipette out 5.0 l of ea h of Fehli g s solutio s A a d B. Dilute ith a out ml of
water and add 3 glass beads to it. Keep the flask over a wire gauze or hot plate and bring to boil. Add
from the burette the standard glucose solution slowly, 1ml at a time till the colour just turns from blue
to red. Then add 3-4 drops of 1.0% Methylene blue indicator which gives a blue colour to the solution
and continue to add the glucose solution drop-wise till a brick red colour end point of solution is
obtained.
Agai i a othe o i al flask, take . l of ea h of the Fehli g s solutio s A a d B, dilute ith a out
ml of water and add 3 glass beads into it. Boil the contents as above and add from the burette the
standard glucose solution 2.0ml less than the quantity required in the first titration. Then add 3-4 drops
of Methylene blue indicator and continue the titration till the brick red coloured end point is obtained.
Repeat the whole process of titration 3-4 times and calculate the mean of the last three readings
(excluding the first reading). From the mean titration reading, calculate the amount of anhydrous
glucose corresponding to 10 ml of the i ed Fehli g s solutio s A a d B.
Note:
The titration should be completed within total boiling time of about 3 minute s. Note down the first
burette reading.
Calculation
Let a l e the ea tit atio eadi g.
l of Fehli g s A&B togethe = a l of std. glucose solution.
Now, 100 ml of standard glucose solution = 0.5 g of glucose
a l of std. glu ose solutio = . х g of glucose
10 l of Fehli g s solutio s = . х g of glucose

Joy P P, Surya S. and Aswathy C. 2015. Pineapple Research Station (Kerala Agricultura l University) Vazhakulam-686670 Muvattupuzha, Ernakulam, Kerala. Tel.: 0485-2260832, 9446010905, Email: [email protected], Web: prsvkm.kau.in
156 Laboratory Manual of Biochemistry
29. Appendix VII – Fruit Composition and Nutritive Value
Table.21. Fruit Composition and Sugar Contents (Grams per 100 g of Edible Portion)
Table.22. Vitamin and Mineral Content of Fruits (Value per 100 g of Edible Portion)
Fruit Water Carbohydrates Protein Fat Fibre Fructose Glucose Sucrose Maltose Total sugar
Apple 86 12 0.3 Tr 2 5.6 1.8 2.6 - 10
Apricot 88 9.5 0.8 Tr 2.1 0.4 1.9 4.4 - 6.7
Avocado 79 5.9 1.5 12 1.8 0.1 0.1 - - 0.2
Banana 75 20 1.2 0.3 3.4 2.9 2.4 5.9 - 11.3
Cherry 80 17 1.3 0.3 1.2 6.1 5.5 - - 11.6
Grape 82 16.1 0.6 Tr 0.9 6.7 6 0 0 12.9
Guava 82 15.7 1.1 0.4 5.3
Kiwi fruit 84 9.1 1 0.4 2.1
Mango 84 15 0.6 0.2 1 3.8 0.6 8.2 - 12.7
Melon 92 6 0.1 Tr 1
Orange 87 10.6 1 Tr 1.8 2 1.8 4.4 - 8.3
Papaya 89 9.8 0.6 0.1 1.8
Passion fruit P
Passion fruit Y
Peach 89 9 0.6 Tr 1.4 4 4.5 0.2 - 8.7
Pear 86 11.5 0.3 Tr 2.1 5.3 4.2 1.2 - 10.7
Pineapple 84 12 1.2 Tr 1.2
Plum 84 9.6 0.8 Tr 2.2 3.2 5.1 0.1 0.1 8.6
Raspberry 86 11.9 1.2 0.6 6.5
Strawberry 91 5.1 0.7 0.3 2.2 2.3 2.6 1.3 - 6.2
Watermelon 93 8 1 Tr 0.6 2.7 0.6 2.8 - 6.2
Fruit Vitamin C (mg)
Vitamin E (mg) (a tocopherol)
Vitamin A (fg RAE)
Thiamin (mg)
Riboflavin (mg)
Niacin (mg)
Pyridoxine (mg)
Folate (fg)
Fe (mg)
Ca (mg)
P (mg)
Mg (mg)
K (mg)
Na (mg)
Zn (mg)
Cu (mg)
Se (fg)
Apple 4.6 0.18 3 0.017 0.026 0.091 0.041 3 0.12 6 11 5 107 1 0.04 0.027 0
Apricot 10 0.89 96 0.03 0.04 0.6 0.054 9 0.39 13 23 10 259 1 0.2 0.078 0.1
Avocado 10 2.07 7 0.067 0.13 1.738 0.257 58 0.55 12 52 29 485 7 0.64 0.19 0.4
Banana 8.7 0.1 3 0.031 0.073 0.665 0.367 20 0.26 5 22 27 358 1 0.15 0.078 1
Cherry 7 0.07 3 0.027 0.033 0.154 0.049 4 0.36 13 21 11 222 0 0.07 0.06 0
Grape 10.8 0.19 3 0.069 0.07 0.188 0.086 2 0.36 10 20 7 191 2 0.07 0.127 0.1
Guava 183.5 0.73 31 0.05 0.05 1.2 0.143 14 0.31 20 25 10 284 3 0.23 0.103 0.6
Kiwi fruit 75 - 9 0.02 0.05 0.5 - - 0.41 26 40 30 332 5 - - -
Orange 53.2 0.18 11 0.087 0.04 0.282 0.06 30 0.1 40 14 10 181 0 0.07 0.045 0.5
Papaya 61.8 0.73 55 0.027 0.032 0.338 0.019 38 0.1 24 5 10 257 3 0.07 0.016 0.6
Passion fruit 30 0.02 64 0 0.13 1.5 0.1 14 1.6 12 68 29 348 28 0.1 0.086 0.6
Passion fruit P
Passion fruit Y
Peach 6.6 0.73 16 0.024 0.031 0.806 0.025 4 0.25 6 20 9 190 0 0.17 0.068 0.11
Pear 4.2 0.12 1 0.012 0.025 0.157 0.028 7 0.17 9 11 7 119 1 0.1 0.082 0.1
Pineapple 36.2 0.02 3 0.079 0.031 0.489 0.11 15 0.28 13 8 12 115 1 0.1 0.099 0.1
Plum 9.5 0.26 17 0.02 0.026 0.417 0.029 5 0.17 6 16 7 157 0 0.1 0.057 0
Raspberry 26.2 0.87 2 0.032 0.038 0.598 0.055 21 0.69 25 29 22 151 1 0.42 0.09 0.2
Strawberry 58.8 0.29 1 0.024 0.022 0.386 0.047 24 0.42 16 24 13 153 1 0.14 0.048 0.4