laboratory of medical physics second semester of... · laboratory of medical physics second...
TRANSCRIPT

Higher education Ministry
Baghdad University
College of Pharmacy Department clinical Laboratory science
Laboratory of Medical Physics
Second Semester
1st Stage
2015 /2016

The Simple pendulum
Purpose : To determine the acceleration of free fall by means of simple pendulum.
Apparatus : 1. Pendulum bob (a metal sphere with a hook attached or with a
hole bored through its center.
2. Stopwatch .
3. meter scale . L
4. Stand and clamp .
Procedure :
1. Tie a meter length of the cotton to the pendulum bob and
suspend the cotton from the jaws of the improvised vice , such
as two small plates held in a clamp , or any other method of
suspension . 2. Place a piece of paper with a vertical mark on it behind the
pendulum so that when the latter is at rest it hides the vertical
mark from the observer standing in front of the pendulum .
3. Set the pendulum bob swinging through a small arc of about
10˚ . with a stop-watch measure the time for 20 complete
oscillation , setting the watch going when the pendulum passes
the vertical mark and stopping it 20 complete later when it
passes the mark in the same direction . Repeat the timing and
record both times .
Exp.1

4. Measure the length (L) of the cotton from the point of
suspension to the middle of the bob .
5. Shorten the length of the pendulum by successive amounts of 5
or 6 cm by pulling the cotton through the vice and for each
length take two observation of the time for 20 oscillations .
Theory : The periodic time T is given by
T = 2π L/g
Where g is the acceleration of free fall .
4 π2 L
Therefore , g = cm . s-2
T2
Readings and calculation : 1.Tabulate the reading as follows :
The length
of pendulum
L (cm)
Time for 20
oscillations (sec )
Time for one
oscillation,
periodic time
T (sec )
T2
(sec2)
g
(cm.s-2
)
t1 t2
tmean
2. Plot a graph with the values of T2 sec
2 as ordinates against

the corresponding values of L cm as abscissa .
from which it is seen that the graph of T2 against L will be straight
line whose slope is ( AB/BC ) , measured from two convenient and
will-separated points A & C on the line , is numerically equal to 4
π2/g .
Thus : A
AB s2 4 π2
=
BC cm g A
4 π2 BC
g = cm . s-2
AB C B
L(cm)
3. from the table find g´ where g´ = ( ∑ gi )/n .
4. calculate the variance from the formula :
V = ( ∑ (g´ -gi) / n
Then find the standard deviation :
S = V
5. the final value of the Acceleration is :
g = g´ ± S
T2 s
2

Questions
1. is the Acceleration depend of the weight of pendulum .
2. What is the effect of displacement to the time of vibration
3. What is the relation between L and T .
Exp.No. :
Name of exp. :
Reading & Calculation
The length
of pendulum
L (cm)
Time for 20
oscillations (sec )
Time for one
oscillation,
periodic time
T (sec )
T2
(sec2)
g
(cm.s-2
)
t1 t2
tmean
100
90
80
70
60
50

The density of liquid
Purpose : To determination the density of liquid by a loaded test tube
Apparatus : 1. test tube or boiling tube wide enough to allow weights to be placed
inside .
2. millimeter graph paper cut to make a scale.
3. 1 gm , 2 gm , and 5 gm weight .
4. a liquid , e.g. water or methylated spirit .
5. calipers , beaker , sand , and lead shot .
Theory : From fig (1) , assuming the test tube to have uniform cross-section ,
each additional 1 gm load will produce the same increment in the depth
of the immersion . The extra weight of the tube is balanced by the
upward thrust due to the extra weight of liquid displaced .
π d2
Area of cross-section of tube =
4
where d= diameter of the test tube ,measured in m.
If an additional load m produces an additional immersion depth x in a
liquid of density ρ, π d2x
The extra volume of liquid displaced =
4
Exp.2

π d2 ρ x
and the extra mass of liquide displaced =
4
π d2 ρ x
Hence, by Archimedes principle =
4
4m
therefore , ρ = ……………………. (1)
π d2x
by plotting a graph of depth of immersion , x against additional load in
fig. (2) . the mean value of m/x is obtained from the graph and is
equal to :
QNx10-3
kg QN
or (kg . m -1
)
PNx10-3
m PN
Substituting the value of d (in m ) and the calculated value of m/x
in equation (1) , the value of ρ is obtained ,
ρ = kg.m-3
paper mm scale
Fig (1)
50
40
30
20
10
0

Procedure :
1- cut and fold the graph paper as a lining to the inside of the test
tube to serve as a suitable scale .
2- load the test tube with sand or lead short so that it floats vertically
in the liquid with the zero mark just immersed .
3- Note the depth of immersion hº of the zero mark .
4- Add a 1gm weight to the test tube and record the new depth of
immersion h of the zero mark .
5- Continue to add a 1gm weight to the test tube and measure the
new depth of immersion each time .
6- Tabulate the recorded reading as shown in the table below:
7- Plot a graph with values of x (mm) as ordinates against
corresponding values of the additional load m (gm) as abscissa .
P
Q N
Additional load , m (gm )
Fig (2)
8- With the calipers , after checking and recording the zero error if
any , measure the external diameter of the test tube in two
perpendicular directions at one place and two other places along
the test tube , and deduce the mean diameter ,d(in mm ) of the test
tube .
9- Repeat the procedure steps ( 1 to 7 ) for a different liquid then
obtain the ratio of the two densities as calculated .
Dep
th o
f im
mer
sion ,
x (
mm
)

The focal length of the convex lens
Purpose : To determine te focal length of the converging lens by using:
1. A plane mirror .
2. A graphical method.
Apparatus : 1. Converging lens.
2. Holder.
3. Plane mirror.
4. Meter scale.
5. Mounted pin (object).
6. Screen.
Procedure : Part 1
1. Obtain a rough value F´ for the focal length of the lens by
focusing the image of the window on a screen.
2. Measure the distance between the lens and the image (F´ )
3. Repeat two times at different places along the optical bench or
scale and take the mean of the results.
F´ = rough value for the focal length of the lens .
window (object) screen (image )
F´
Exp.3

Part 2
1. place an object pin at a distance from the lens equal to 2 F´.
Measure
the distance between the object and lens , which is called (U).
2. Locate the position of is real image on the other side of the lens, by
using a screen .Measure the distance between the image and lens ,
Which is called (V) .
3. Move the object to other position both nearer to and farther away
from the lens , locating the new position of the image each time .
Pin lens
Object Screen
Image
Reading :
Distance of object
from lens (U) cm
Distance of image
from lens (V) cm
1/U (cm-1) 1/V (cm-1)
1. Plot a graph of 1/U against 1/V .
2. Drow the straight line through the pointed and produce it to
intersect both axes .

Theory and calculation :
1/F = 1/U +1/V
1. A straight line inclined at 45º o each axis is obtained.
2. The intercept on the 1/V axis is the numerical value for which
1/U =0 .
1/F1 =1/U +1/V = 0 + 1/V
F1 = V …………….. (1)
3. Similarity for the intercept on the 1/V axis . F2=U
4. Take the mean value of the two intercepts .
F1 +F2
F = = ( ……) cm
2
F2 intercept on the 1/U-axis
Straight line
F1 intercept on the 1/V-axis
1/V cm-1
Question
Plot the shape for every case in the procedure .
1/U
cm
-1

Viscosity of liquid
Purpose : To determine the viscosity of the medium by using a small sphere falls
with constant terminal velocity.
Apparatus : 1. A long glass tube about 50 cm long closed at one end .
2. Oil .
3. Meter scale .
4. Small sphere .
5. Rubber bands . h(cm) Rubber bands
6. Magnet .
7. stop watch Small sphere
Theory:
The following equation use to deduce the viscosity ( η ) for liquid :
g (ρ – σ) d2
η = ……………… (1)
18 v
ρ = density of sphere σ = density of liquid
d= diameter of sphere v = velocity (slope)
g = 980 m/sec2 slope = h/t
h(cm slope = h/t
t (sec )
Exp.4

Procedure : 1. Adjust the distance between the rubber band .
2. Record the distance (h) between them . ( about 30 cm ).
3. Drop a sphere centrally down the jar & with stop-watch find the
time it take to traverse the distance between the rubber band .
4. Obtain two values of the time of fall.
5. Repeat the experiment for different value of ( h ) & obtain two
values of the time of fall for each new distance apart .
Reading :
Distance between
rubber bands
H(cm)
Time of fall
T1(sec) T2(sec) Tmean(sec)
Plot a graph with values of (h) cm as ordinates against the
corresponding values of t(sec) as abscissa .
From the graph calculate the terminal velocity .
Slope = h / t = velocity ( cm / sec )
Calculate the viscosity from equation (1)

Boyle´s Law
Purpose : Verify Boyle´s Law by measurement the pressure of the atmosphere .
Apparatus : Glass tube containing mercury as shown .
Theory:
He equation used to find the atmosphere pressure is :
C 1
H = * - B …………….. (1)
K L
Where C&K = constants .
h & L the length as shown in fig (1) .
B =atmosphere pressure .
Open end
C
Y
A h fig (1)
L
X
B D
Exp.5

Procedure : 1. keep the mercury levels X and Y in the same position .
Record the scale reading of these levels and also the scale
reading of (A) , the inside of the closed end of the tube
(AB). This is the balance point (i.e. X=Y ) .
2. Rising the tube CD (above the balance point ) , and recored
the scale reading of X and Y levels .
3. Take about four sets of reading over the balance point .
4. Now, lowering the tube CD below the balance point , and
record the scale reading of X and Y levels .
6. Take about four sets of reading below the balance point .
Readings and calculation : 1. Make the following table :
Scale reading / cm A-X=L Y-X=h 1/L
A X Y Cm Cm cm-1
2. Plot a graph for the values of h(cm) as ordinates against the
corresponding values of 1/L (cm-1) as abscises .
3. If the plot of h against 1/L yields a straight line , Boyles law is
verified and the negative intercept on the h-axis is numerically
equal to B ( atmospheric pressure ~ Barometric height =76 cm )
4. from the graph ; if h=0 , find the value of 1/L =?
B=76 cm .find the value of C/K from equation (1).
h(cm)
0
1/L cm-1
B

Speed of sound
Purpose : To determine the speed of sound from the sound waves set up in the
closed resonance tube .
Apparatus : 1. Closed A tube of variable length .
2. Meter scale .
3. Tuning forks of different frequencies .
4. Rubber bad .
5. Thermometer .
Theory:
The formula using to find the speed of sound at 0˚ C is :
C = C0 273 + t …………….. (1)
√ 273
t = room temperature . C = the speed of sound in laboratory .
where C = 2F (L 2 - L 1 ) (m/s) …………. (2)
F = the frequency of fork L 2 & L 1 is the length of air in the tube
(as shown in fig (1) ) .
L1 Fig (1)
L2
Exp.6

Procedure : 1. select the fork of highest frequency
2. Strike it smartly on a rubber pad and hold it over the mouth of the
tube .
3. Adjust the length of the resonance column until resonance occurs .
4. Measure the length of the air in the tube .
5. Repeat the measurement two or three times and take the mean ( L1
) .
6. Now , find the second and different position of resonance using
the same fork , but with about three times the length of air and
again take the mean ( L 2 ) of several readings of the length when
resonance occurs .
7. Obtain different values of L 1 and L 2 using other forks.
8. Record the room temperature .
Readings and calculation :
Frequency
F (HZ)
First resonance
position length of
air column L 1
(cm)
Second
resonance
position length of
air column L 2
(cm)
Speed of sound
(C)
C=2F(L2 - L 1 )
1. find the speed of sound in laboratory (C) for each frequency from
equation (2).
2. Find the mean value of C :
C 1 + C 2 + C 3
C = (m/s)
3
3. Find the speed of sound at 0˚ C by using equation (1).

Ostwald´s Viscometer
Purpose : To compare the viscosities of two liquids.
Apparatus : 1. ostwald´s viscometer .
2. stop-watch .
3. thermometer .
4. two liquids of different viscosity .
Theory:
The rate of flow v/t of the liquid through capillary is directly
proportional to the applied hydrostatic pressure hpg and inversely
proportional to the coefficient of viscosity η .
Since the volume of the two liquids in the apparatus are the same so are
the corresponding values of h at all the various stages in the descent of
the level from X to Y .
Hence ,
V hpA g V hpB g
—— = K ——— and —— = K ———
tA ηA tB ηB
ηA tApA
—— = ——— ……….. (1)
ηB tBpB
where K is constant , the densities pA and pB of the two liquids
are obtained from tables .
Exp.7

Procedure : 1. record room temperature
2. Allow the two liquids to attain room temperature .
3. Wit the pipette pour a known volume of the first liquid in to the
side Q of the viscometer .
4. Drop the liquid through the capillary tube until it appears above
the mark X above P and hold it by closing the clip C .
5. Open clip C , then measure the time for the liquid level to fall
from the upper mark X to the lower mark Y . Repeat the
timing two more times .
6. Repeat the experiment with the second liquid .
7. Tabulate the readings as follows :
Time of fall of level from X to Y
Liquid A Liquid B
t 1
(sec)
t 2
(sec)
t 3
(sec)
Mean
t A
(sec)
t 1
(sec)
t 2
(sec)
t 3
(sec)
Mean
t B
(sec)
c
x
p
y
Q

Part II
Viscosity
Viscosity means resistance to flow under apply stress ( pressure) if you have
capillary and have water and glycerin , water flow faster but it is less viscous .
The more viscosity is the more the force required to make it flow at a certain
rate .
gm . Cm -1
. Sec-1
= poise =dyne . Sec .cm-2
Dyne =gm .Cm . Sec-2
Poise = gm .Cm . Sec-2
. Sec .cm-2
poise = gm . Cm -1
. Sec-1
poise = 100 centipoises
Viscosity of water =1 centipoises = 0,01 poise .
It measures by capillary viscometer , by measure the time required for the liquid
to flow between two mark through a vertical capillary tube of certain diameter .
ηunknown ρ unknown . tunknown
=
ηw ρw . tw
η = η (1= 2.5 θ ) Einstein equation
θ = vol. fraction of particle related directly to conc.
Θ is a vol. of particle divided by a total vol of disposion ( also equal
conc.)
Apparatus : Distilled water , glycerin pure , viscometer
Objective : In order to determine the viscosity ( Relative of a liquid (
glycerin) in different conc. By using a capillary viscometer .

: Prepare different conc. of glycerin in water such as 2% , Procedure
5% , 10 % , 15 % , 20 % , 25 % ( w/w)
To prepare 50 gm of 5% w/w
2.5 gm pure glycerin + 47.5 gm of water
Density of pure glycerin = 1.26 gm/cm3
So 2.5/1.26 = 1.984 ml of glycerin Aethal to 47.5 ml of water to
get 50 gm of 5% w/w and shake well Lρ = 1.005
V=
To prepare 50 gm of each conc. %
%w/w Glycerin (gm) Glycerin (ml) Water
(ml=gm)
2% 1 .793 49
5% 2.5 1.984 47.5
10% 5 3.96 45
15% 7.5 5.95 42.5
20% 10 7.93 40
25% 12.5 9.93 37.5 Use one of conc. As unknown .
Then measure the viscosity of each conc. By using viscometer ( measure the
time required for a liquid to flow between 2 mark through vertical capillary
tube . also measure the time of water by a viscometer ( also for unknown ).
ηunknown ρ unknown . tunknown
=
ηw ρw . tw

Result
Conc. w/w% time centipoises relative
2% 1.003
5% 1.005 1.148
10% 1.018 1.198
15% 1.03 1.324
20% 1.037 1.48
25% 1.044 1.789
By divided by w what ever a medium
here . i.e the is relative to of water

Conclusion
From The curve we can find the concentration of unknown :
concentration increase the time measured to flow will increase also .
the viscosity is increased
Where
F = Force applied ( dyne ) ( gm.cm/sec2)
dv = different in the distance between parallel plate of a liquid ( cm )
A = area of the block of water ( cm 2 ) .
= ( ) gm.cm-1
.Sec-1
= Poise
A- To determine the M.wt of gelatin
From Exist equation :-
= ( 1 + 2.5 )
= relative = 1 + 2.5
Conc.
= reduced = K1 = 2.5
int = intercept
[] int = KMα
K = 1.7 10-5
constant
α = 1
M = Molecular weight .
intercept
C% w/w

Objective
To determined the Mint of a polymer such as gelatin
Apparatus
gelatin 1% w/w .
20 gm gelatin .
1980 gm water = 1980 ml water
Viscometer
Procedure
Prepare different Conc. Of gelatin solution from 1 % w/w gelatin solution (
density equal 1.3 gm /cm3 )
Conc. %
w/w
Density Water 1% ml of
1%
Gm/ml of
water 0.2 1.05 10 7.6 40 0.4 1.08 20 15.3 30 0.6 1.11 30 23.7 20 0.8 1.2 40 30.76 10 1 1.3 50 38.46
To prepare 50 gm of 0.2% w/w from 1% w/w
1% w = 0.2 50 gm
w = 10 gm of 1% w/w
= 7.6 ml of 1% w/w + 40 ml .gm water .
- measure the viscosity of each Conc. by using capillary viscometer
by measuring the time required for liquid to flow between two marks
through vertical capillary tube , ( also water ) .

Result
Conc. %
w/w
Density Time (sec) cettipoise
0.2 1.05 0.4 1.08 0.6 1.11 0.8 1.2 1 1.3
=
= reduced ( reducing viscosity )
(Centipoise)
[]int = KMα
M = 40670 gm / mole for gelatin
K and are constant characteristic of the particle polymer solvent
system .which are approximately independent of Mwt from the curve
we determine the intrinsic viscosity and the M.wt .
0.8 0.6 0.4 0.2 1
Intercept = [ ]intrinsic
Conc.% w/w

B- To determine the radius of Particle by Plotting rel against
molar concentration
Objective
For determination of radius of particle of glycerin
Apparatus
20% w/v glycerin solution
20 gm 100 ml
= 15.87 ml glycerin 100 ml water
317.4 ml glycerin 2l water
Procedure
Prepare different Conc. of glycerin from 20% w/v such as 3% ,6%
,9%,12%,15% w/v .
c1v1 =c2v2
20% v = 350ml
= 7.5 ml of 20% w/v to 50 ml to obtain 50ml
of 3% w/v .
- measure the viscosity of each Conc. by viscometer by measuring the
time required for the liquid to flow between 2 mark through vertical
capillary tube , also for water .
=
To
Density of glycerin
To
20 20
To
Complete
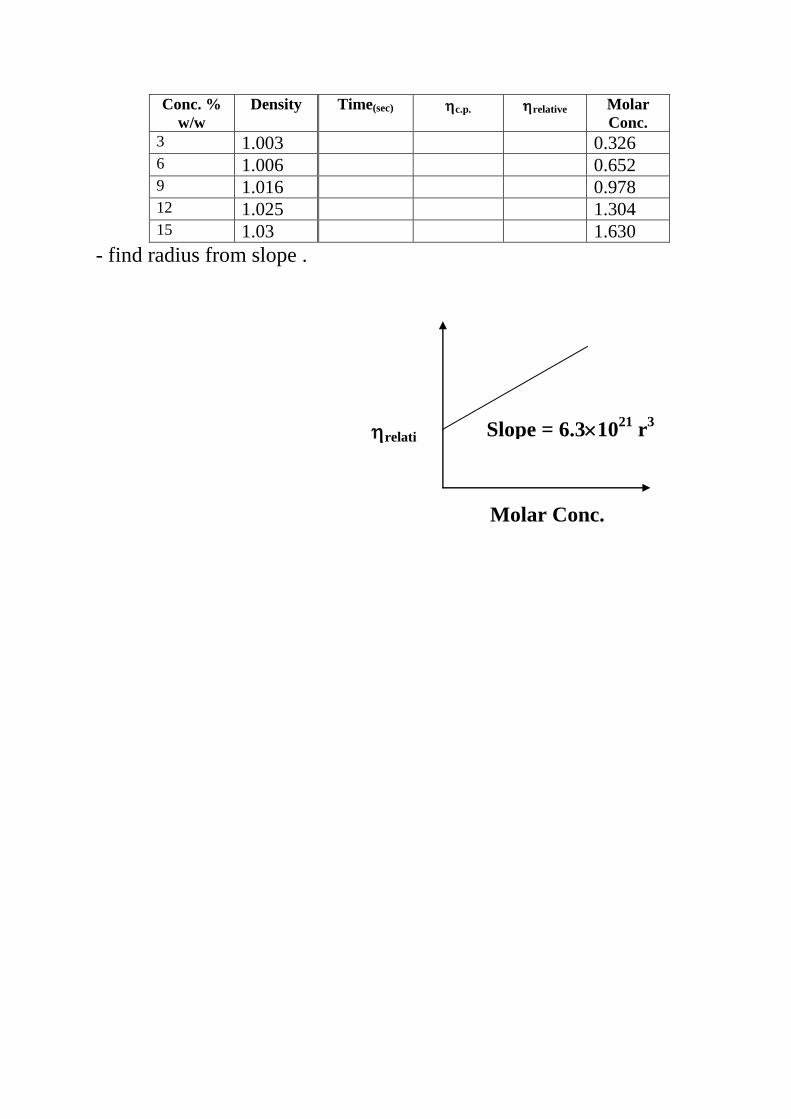
Conc. %
w/w
Density Time(sec) c.p. relative Molar
Conc.
3 1.003 0.326 6 1.006 0.652 9 1.016 0.978 12 1.025 1.304 15 1.03 1.630
- find radius from slope .
relati
ve
Molar Conc.
Slope = 6.31021
r3

The surface tension
Purpose :
To calculate the surface tension of water by the capillary tube method
Apparatus :
1. Set of three capillary tubes .
2. Traveling microscope or glass scale .
3. Beaker . h
4. stand and clamp .
5. thermometer .
Theory:
In fig (1) , r is the radius of the capillary tube ,
Then the liquid touch the tube along line length of
it is ( 2π r ) , and the total force in the upper direction
effect to the cylinder of liquid (y) is : Fig (1)
F = 2π r γ cos θ
Where γ is the coefficient of surface tension .
θ is the contact angle .
and the total force in the down direction is the
weight of te cylinder W
W = ρ g π r2 y
d1 d2
ρ = the density of liquid , g = the Acceleration
but the liquid in the capillary tube is in balance fig (2)
therefore: 2π r γ cos θ = ρ g π r2 y
Exp.8

ρ g r y
γ =
2 cos θ
if the liquid is water then the contact angle is θ , and we take the
shadow area (see fig (3) ) in the calculation then :
ρ g r 1
γ = ( y + r )
2 3
fig (3)
Procedure : 1. Fill the beaker to overflowing with water so that the water level
stands up above the glass , as shown in fig (1) .
2. Hold the capillary tube in a clamp with its lower end immersed
in water .
3. Measure the height (h) to which the water level rises in the
capillary tube above the level of the water in the beaker
4. Also , measure the internal diameter of the capillary tube by
using a traveling microscope , ( d = d1 – d2 ) (show fig (2) ) .
5. Repeat all the measurement with the other capillary tubes .
6. Record the temperature of the water , because the surface
tension changes with change in temperature .

Readings and calculation : Tabulate the reading as follows :
Capillary tube diameter d
(cm)
Height
h(cm)
Surface
tension (γ)
(1)
(2) mean
1st
tube
2nd
tube
3rd
tube
Mean=
Nm-1
Calculate the surface tension from the relation (1) .
The mean value of the measured surface tension ,
γ =……………. ( N m-1
) at …… ˚C
Questions
1. What is the effect of change the length of tube input liquid .
2. What is the relation between change the radius and height of liquid
in the capillary tube .
3. What is the effect of temperature to the surface tension .

The density of liquids
Purpose : To compare between the density of two liquids by used hare´s
apparatus .
Apparatus : A
1. glass tube as shown in fig (1) .
2. two beakers .
3. stand and clamp . fig (1)
4. scale meter . h h0
5. two different liquids.
Y X
Theory:
hare´s apparatus used to compare between the density of two liquids
without merge them with the other .
if the pressure of air in the curve part of the tube to the surface of the
two liquids = P, then ,
the pressure in X is PX = P +ρ0 g h0
the pressure in Y is Py = P +ρ g h
but PX & Py = the pressure of atmosphere (P0 ) then :
P +ρ0 g h0 = P + ρ g h Or
ρ h0
ρ0 h
Exp.9

if the water is one of the two liquids then ρ0 = 1 gm/cm3 and we can
calculate the density of the other liquid .
Procedure : 1. put Hare´s apparatus vertically by stand and clamp , and place the
meter scale behind it ( see fig (1) .
2. put the two end of the tube in two beakers ,one of them contain a
water and the other contain the liquid have to measure it density .
3. pull some of air in the curve part from point A then close it very
well , and measure h & h0 .
4. Repeat the last point (2) several times to get a group of reading by
change the pressure of air (P) in the apparatus .
Readings and calculation : 1. tabulate your reading as shown :
ρ h0
ρ0 h
Height of
water( h0)
Height of
water (h)
Mean h0/h=
2. Plot a curve between h0 against h , then calculate slope ,
Where slope = h0 / h = ρ / ρ0
ρ = ρ0 ( slop )

: Questions 1. is it necessary put the level of surface of liquids in the beaker in the
same horizontal level .
2. is the radius of the two tube of hare´s apparatus must be equal each
other .

The flow of water through a capillary tube as an
life-introduction to decay curves and the study of half
Purpose : study decay curves and the of half-life .
Apparatus :
Bureite of 50cm length of 1cm diameter glass tubing AB joined by rubbr tubing
to about 10-15 cm of 1mm diameter capillary tubing CD and set up with a
verticalscale as shown in the diagram , Stop watch , Beakers .
A
L
h
C
B
D
Exp.10

Theory: Wherever the rate of decay of any quantity is proportional to the quantity itself ,
as the rate of fall of h in this experiment is proportional to h , the head of liquid ,
this can be expressed mathematically by :
dh
- α h
dt
dh
Rearranging α -dt
h
dh
= - λdt ( where λ is a constant )
h
integrating h dh t
∫ = - λ ∫dt
h0
h 0
h
log e = - λ t
h0
changing the base of the logs :
h
log10 = - k t ………………….(1)
h0
Where k is another constant = ( λ log10 e)
The equation may be written
log10 h = - k t log10 h0
and therefor represents a straight line of negative slope k .
From this straight line the half-life T1/2 may be calculated by letting T1/2 be the
value of t when h = ½ h0
Substitution of these values in (1) gives
log10 (1/2) = -k T1/2

log10 2
Or half-life T1/2 =
K
0.301
T1/2 = PN
Slope
QN
Procedure : Adjust the exit level D of the water to a convenient mark on the scale ( e.g.
Zero)
Fill the large tube with water to within 1cm of the top , and when water is
flowing freely from the capillary tube record the level of the water
L , and hence the head of water h at 15- seconed intervals and recored the
level of water . Repeat the experiment twice to obtain two additional
confirmatory readings for each value of h taking care to start the timings when
the same initial level for L is reached each time .
Tabulate the readings :
Time (sec) Head of water Log 10 h/cm
h1 (cm) h2(cm) Mean h/cm
0
15
30
45
…..
Plot two graph :
1- Plot values of h/cm as ordinates againest corresponding values of t/s as
abscissae .

Y0 h/cm
Y1
1/2 Y0
1/2 Y1 T1/2
T1/2
t/sec
Take any two ordinates , one of wich is half the other ( e.g. in the fig. above Y0
and ½ Y0 ) and deduce the correspnding distance between these pairs of
ordinates , Note that it is reasonably costant , This value in seconed is the half-
life T1/2 ( i.e. The time in which any value of h is halved ) .
2- Plot values of log10h /cm as ordinates againest corresponding values of t/s
as abscissae . A stright line should be obtained from which the half-life
T1/2 is equal to :
0.301
T1/2 = PN
Slope
QN

The value of T1/2 obtained from this graph should be compared with the
values obtained from the first graph .
P
Log10h/cm
Q
N
t/sec
: Questions 1- what is the relation between rat of flow the liquid and h .
2- define half-life .

Optical Fiber Loss ( bend ) Measurement
Purpose
To demonstrate the loss ( bend loss ) occurs in optical fiber .
Theory : -
To consider the propagation of light within an optical fiber utilizing the ray
theory model it is necessary to take account of the refractive index of the
dielectric medium . The refractive index of a medium is defined as the ratio of
the velocity of light in a vacuum to the velocity of light in the medium . A ray
of light travels more slowly in a optically dense medium than in one that less
dense , and the refractive index gives a measure of this effect . There are many
types of losses : -
1- Material absorption losses .
2- Scattering losses .
3- Optical fiber bend loss .
Optical fiber suffers radiation losses at bends or curve on their path . This is due
the energy in the evanescent field at the bend exceeding the velocity of light in
the cladding and hence the guidance mechanism is inhibited , which , causes
light energy to be radiation from fiber . An illustration of this situation is shown
in figure 1 . The part of mode which is on the outside of the bend is required to
travel faster than that on the inside so that a wave from perpendicular to the
direction of propagation is maintained
Exp.11

Figure ( 1) An illustration of the radiation loss at a fiber bends . The part of the
mode in the cladding outside the dashed arrowed line may be required to travel
faster than the velocity of light in order to maintain a plane wave front . Since it
cannot do this . The energy contained in this part of mode is radiated away .
Procedures
1- Connect the fiber terminal on the fiber laser transmitter and the second
and on the fiber laser receivers .
2- Bend the fiber on ( R1 = ) and record the output voltage
R1 =
N 1 2 3 4 5
V (volt )
3- Bend the fiber on (R2 = ) and record the output voltage .
R2 =
N 1 2 3 4 5
V (volt )
4- Bend the fiber on (R3 = ) and record the output voltage .
R3 =
N 1 2 3 4 5
V (volt )

Spectrophotometer
Introduction
When light falls on a liquid , some is reflected and the rest is partly and partly
transmitted . Spectra Photometric method of analysis is usually concerned with
measurement of the amount of light absorbed or with comparison of the
absorption or transmission of two solution one of which is a standard of known
composition .
I = transmitted light
I I
Sample
Where t represent transmission .
The Percentage of transmission % = transmission Light 100
There are two type of spectrophotometer
1- U.v which read absorbance for colorless solution wavelength () 200 – 400
nm .
2- Visible which read absorbance for colored solution wavelength () 400 –
740 nm .
Absorption depend on: -
Exp.12

1- Concentration of sample .
2- Molecular Composition of sample .
3- Frequency of light .
Blank Solution is the medium which contains all the substance in the sample
except the active ingredient which required to be measured .
Purpose
To prepare a calibration curve of salicylic acid from a series of standard
solution to use it as a reference curve to obtain the concentration of unknown
sample .
Note
Salicylic acid is slightly soluble in water so in this experiment we use sod.
salicylate which is more soluble in water .
Apparatus
1- Spectrophotometer .
2- Blank Solution .
3- Stock solution .
Procedure Prepare 250 ml of sod. Salicylic contains the equivalent of 200 mg
S.A / 100 ml solution .

Note
S.A is sparingly soluble in cold water ( one part acid in 550 part water
) more soluble in hot water one part in 15 parts of boiling water , from
which it can re crystallized .
Method to prepare solution
M.wt sod.salicylate M.wt.S.A
160 138
2mg
231.8 100
250
Salicylate dilute to 250 ml .
O
O – C – CH3
O
C – OH
COOH
OH COONa
OH
Aspirin S.A Sad . salicylate

2-From the stock solution of sod . salicylate using volum procedure
to accurately prepare solution containing the equivalent of
50,40,30,20,10 mg S.A / 100 ml ( prepare it 100 ml volumetric flask )
c1v1 = c2v2
v1 =
50 ml
v1 =
100 ml
3- Take 1 ml of each solution and add 5ml of colour developing
reagent which is composed of
- F colour developing reagent .
- Mercaonc Hcl
Mix well then determine the absorbance in spectrum 20 at 530 nm
against a blank at 530 nm
A complex will be formed between the hydroxyl group in the
salicylate with femcion of C.D.R resulting the violet color seen

when both solution are mixed which read the best absorbance at
530nm ― this reaction must be occur in acidic medium ).
4- Plot the absorbance vs conc. of S.A ( eye filling ) .
5- Apply the least square method to calculate the b ( slope ) and
C(intersect point ). Using regression .
6- Analysis equation to calculate .
= c + bx
7- Draw the line of best fit curve result and calculation .
Arrange your result in the table
Abs Conc. mg/ml
slope
Absorban
ce
Cmg/ml
c

Laser application for measurement of single slit
Aim:- To study the diffraction of laser by a single narrow slit.
Apparatus:- Laser source (diode laser) of wavelength =(630nm) , Screen ,
Single slit , Ruler.
Theory:- Laser is an electromagnetic radiation produced by light
amplification of stimulated emission of radiation. It has all the
characteristics of light and the law, of reflection and refraction are
applied on it laser has the following characteristics:
1- It is coherent light i.e. the photons of laser beam has the same
frequency, direction and phase.
2- It has very high intensity.
3- It has very low diffraction.
4- It can be used as continuous or pulse wave depending on the kind
of source and the required application for exampel pulse wave are
normally used in medical applications.
5- It can deliver large energy at very short time.
6- It can be transmitted through optical fibers to minimize the
diffraction of laser been i.e. to minimize the waste of laser energy and
also it can be transmitted through flexible fibers to different part of
the body from different openings like mouth, nose…..ect.
Exp.13

Method:- 1- Switch on the laser apparatus and notice the red beam of laser.
2- Arrange the slit so that the laser will be transmitted through the
slit and incident on the screen.
3- Move the screen forward and backward until you get the most
clear fringes on the screen.
4- Measure the distance between the center of the central fringe
and each of the bright fringes.
1st fringe(X1), 2
nd fringe (X2)……………as follows:
n X
1 X1
2 X2
3 X3
5-Apply Snell law: n=d sin
but is very small therefore sin ≈
X n d
n = d------------- ----------- = -----------------
D x D
n
Slop = -------------------
X
d=width signal slit.
D=distance between the slit and screen.

Screen
Signal Slit
-------------------------
D
O
O
O
O O
O O
Laser Source