laboratory study of heavy metal phytoremediation by three
TRANSCRIPT

International Journal of Phytoremediation, 8:245–259, 2006Copyright C© Taylor & Francis Group, LLCISSN: 1522-6514 print / 1549-7879 onlineDOI: 10.1080/15226510600846798
LABORATORY STUDY OF HEAVY METALPHYTOREMEDIATION BY THREEWETLAND MACROPHYTES
Jeff WeissBarr Engineering Company, Minneapolis, Minnesota, USA
Miki HondzoDepartment of Civil Engineering, St. Anthony Falls Lab, University of Minnesota,Minneapolis, Minnesota, USA
David BiesboerDepartment of Plant Biology, University of Minnesota, St. Paul, Minnesota, USA
Michael SemmensDepartment of Civil Engineering, University of Minnesota, Minneapolis,Minnesota, USA
Detention ponds and constructed wetlands have proven to be effective in reducing peakstormwater runoff volume and flow, and recent interest has extended to utilizing them toimprove stormwater runoff quality. A review of stormwater runoff studies indicated that lead,zinc, copper, cadmium, phosphorus, and chloride are contaminants of primary concern. Inlaboratory settings, the uptake of contaminants by three wetland plant species, Glyceriagrandis, Scirpus validus, and Spartina pectinata, was examined and removal rates fromnutrient solutions in flow and nonflow reactors were measured. The removal rates varied byplant species and target contaminant, and no one species was the best accumulator of all sixcontaminants. Belowground tissues of all three species accumulated higher concentrationsof the four heavy metals and aboveground tissues accumulated higher concentrationsof phosphorus and chloride. Plants grown in flow reactors showed significantly higheraccumulation rates than those grown in nonflow reactors. Also, plants grown hydroponicallyaccumulated higher concentrations of the six target contaminants than those grown in sandreactors. However, those grown in sand had a much greater increase of biomass and removeda greater mass of the six target contaminants. Removal rates measured in these experimentscan be used to design detention ponds to maximize stormwater remediation.
KEY WORDS: bioconcentration factor, detention ponds, heavy metals, phytoremediation
INTRODUCTION
Highway stormwater runoff has been studied by many researchers (Moxness, 1986,1987, 1988; Driscoll, Shelley, and Strecker, 1990; Sansalone and Buchberger, 1997;Drapper, Tomlinson, and Williams, 2000; Fritioff and Greger, 2003; Kamalakkannan et al.,
Address correspondence to Jeff Weiss, Barr Engineering Company, 4700 W 77th St., Minneapolis, MN55435, USA. E-mail: [email protected]
245
246 J. WEISS ET AL.
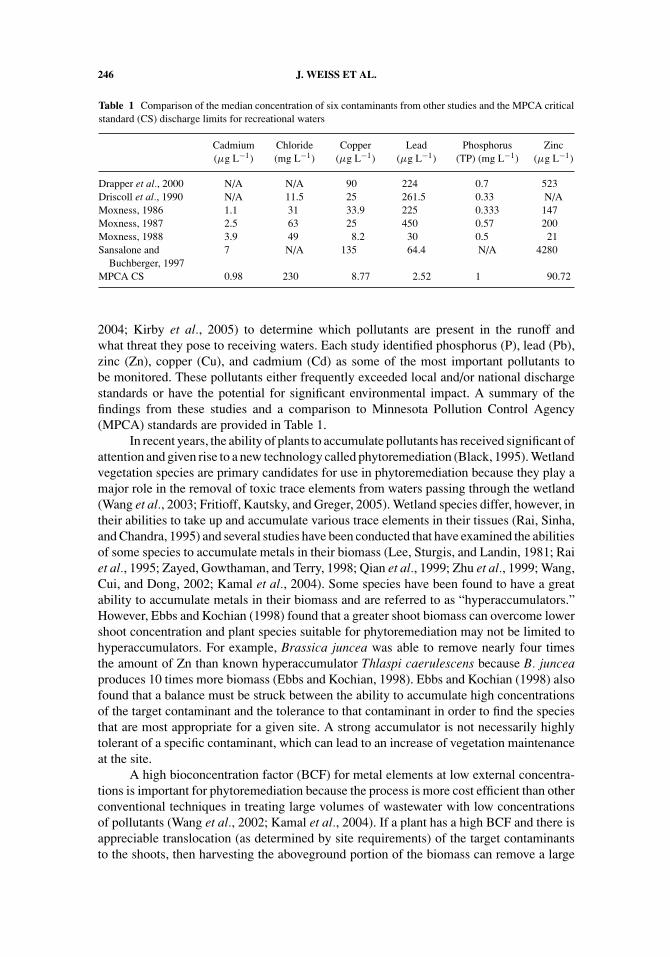
Table 1 Comparison of the median concentration of six contaminants from other studies and the MPCA criticalstandard (CS) discharge limits for recreational waters
Cadmium(µg L−1)
Chloride(mg L−1)
Copper(µg L−1)
Lead(µg L−1)
Phosphorus(TP) (mg L−1)
Zinc(µg L−1)
Drapper et al., 2000 N/A N/A 90 224 0.7 523Driscoll et al., 1990 N/A 11.5 25 261.5 0.33 N/AMoxness, 1986 1.1 31 33.9 225 0.333 147Moxness, 1987 2.5 63 25 450 0.57 200Moxness, 1988 3.9 49 8.2 30 0.5 21Sansalone and
Buchberger, 19977 N/A 135 64.4 N/A 4280
MPCA CS 0.98 230 8.77 2.52 1 90.72
2004; Kirby et al., 2005) to determine which pollutants are present in the runoff andwhat threat they pose to receiving waters. Each study identified phosphorus (P), lead (Pb),zinc (Zn), copper (Cu), and cadmium (Cd) as some of the most important pollutants tobe monitored. These pollutants either frequently exceeded local and/or national dischargestandards or have the potential for significant environmental impact. A summary of thefindings from these studies and a comparison to Minnesota Pollution Control Agency(MPCA) standards are provided in Table 1.
In recent years, the ability of plants to accumulate pollutants has received significant ofattention and given rise to a new technology called phytoremediation (Black, 1995). Wetlandvegetation species are primary candidates for use in phytoremediation because they play amajor role in the removal of toxic trace elements from waters passing through the wetland(Wang et al., 2003; Fritioff, Kautsky, and Greger, 2005). Wetland species differ, however, intheir abilities to take up and accumulate various trace elements in their tissues (Rai, Sinha,and Chandra, 1995) and several studies have been conducted that have examined the abilitiesof some species to accumulate metals in their biomass (Lee, Sturgis, and Landin, 1981; Raiet al., 1995; Zayed, Gowthaman, and Terry, 1998; Qian et al., 1999; Zhu et al., 1999; Wang,Cui, and Dong, 2002; Kamal et al., 2004). Some species have been found to have a greatability to accumulate metals in their biomass and are referred to as “hyperaccumulators.”However, Ebbs and Kochian (1998) found that a greater shoot biomass can overcome lowershoot concentration and plant species suitable for phytoremediation may not be limited tohyperaccumulators. For example, Brassica juncea was able to remove nearly four timesthe amount of Zn than known hyperaccumulator Thlaspi caerulescens because B. junceaproduces 10 times more biomass (Ebbs and Kochian, 1998). Ebbs and Kochian (1998) alsofound that a balance must be struck between the ability to accumulate high concentrationsof the target contaminant and the tolerance to that contaminant in order to find the speciesthat are most appropriate for a given site. A strong accumulator is not necessarily highlytolerant of a specific contaminant, which can lead to an increase of vegetation maintenanceat the site.
A high bioconcentration factor (BCF) for metal elements at low external concentra-tions is important for phytoremediation because the process is more cost efficient than otherconventional techniques in treating large volumes of wastewater with low concentrationsof pollutants (Wang et al., 2002; Kamal et al., 2004). If a plant has a high BCF and there isappreciable translocation (as determined by site requirements) of the target contaminantsto the shoots, then harvesting the aboveground portion of the biomass can remove a large
HEAVY METAL PHYTOREMEDIATION BY WETLAND MACROPHYTES 247
amount of the target contaminants (Falbo and Weaks, 1990; Qian et al., 1999). Thus,phytoremediation is generally considered to be a relatively low-cost alternative for siteswith low to moderate contamination (Fritioff and Greger, 2003; Weis and Weis, 2004).
The selection of species to be used in a detention pond or constructed wetland islargely governed by location and site conditions. However, with knowledge of the rates atwhich selected species accumulate target contaminants for a particular site, it is theoreticallypossible to design a detention pond system specifically for the phytoremediation oftarget contaminants. The Minnesota Department of Transportation (Mn/DOT) uses favoredspecies, such as Glyceria grandis, Scirpus validus, and Spartina pectinata, in its detentionponds due to their abilities to tolerate a variety of site conditions, such as fluctuating waterlevels, varying exposure to sunlight, and high salinity, with minimal maintenance. What isnot known about the species used by Mn/DOT is their abilities to accumulate contaminantscommonly found in stormwater runoff from roads and highways. The primary objectiveof these experiments was to determine the rate at which G. grandis, S. validus, and S.pectinata accumulate some of the most problematic contaminants detected in highwayrunoff, primarily Cd, chloride (Cl), Cu, P, Pb, and Zn (Table 1). These accumulation ratescan then be used to develop enhanced design criteria for future detention ponds, so theycan be more effectively designed for both water quantity and quality considerations.
EXPERIMENTAL MATERIALS AND METHODS
Plant Selection
Three wetland species, soft-stem bulrush (Scirpus validus), prairie cordgrass(Spartina pectinata), and reed manna grass (Glyceria grandis), were chosen by the Mn/DOTto be studied for phytoremediation capabilities. They are perennial species, native toMinnesota, and already planted in detention ponds by Mn/DOT.
Nonflow Reactor Experiment
The nonflow reactor experiment used 1-qt (0.95-L) sized canning jars as nonflowreactors, meaning that there was no fluid flow in any reactor. Each reactor was acidwashed and then filled with the Standard Methods (1995) Duckweed Nutrient Solution.The “spiked” reactors contained the following initial concentrations: Cd: 10 µg L −1; Cl: 63mg L−1; Cu: 100 µg L−1; P: 1 mg L−1; Pb: 300 µg L−1; and Zn: 250 µg L−1. These initialconcentrations were to simulate typical concentrations reported in runoff from highways(see Table 1) and also were high enough to be well within detention limits of the analyticalequipment. The “control” reactors contained only the nutrient solution without elevatedconcentrations of the target contaminants. The pH in each reactor was adjusted to 7.5 byadding small aliquots of 6N NaOH.
Flats of each species were purchased from Hild and Associates nursery in River Falls,WI (www.hildnatives.com). Glass canning jars were used as reactors and one plant wasplaced in each reactor by placing the plant into a sliced foam rubber “plug,” which was thenplaced into a hole that was punched into the lid of each reactor. The plugs held each plantat the lower end of the stem such that the entire root system was immersed in the solution.Four reactors for each species and nutrient solution were set up for sampling on days 1, 2,4, 7, 14, 21, and 35 after the start of the experiment. All reactors were put together on Day0, placed under growth lights on a 16–8-h light/dark cycle, and held at constant temperature
248 J. WEISS ET AL.
at 20◦C. On each sampling day (i.e., Day 1, Day 2, etc.), all four reactors for each specieswere disassembled. The aboveground and belowground tissues of the plant in each reactorwere separated, rinsed with deionized (DI) water, placed into envelopes, and placed in anoven at 103◦C to dry for 3 d. Plant samples were stored at 4◦C until all samples were readyfor analysis. Plant samples were analyzed for P, Cd, Cu, Pb, and Zn by inductively coupledplasma atomic emission spectroscopy (ICP-AES). ICP-AES requires a sample size of 1 gdry weight of in order to run duplicates and leave enough leftover sample material to re-runthe analysis if necessary. In the nonflow reactor experiment, the dry weight for each plantsample was too low to analyze each individual sample. Therefore, aboveground tissuesfrom all four replicates on each sampling day were combined to form a composite sample,and the same was done for the belowground tissues.
Nutrient solution samples were taken by filling 50-mL sample vials with solutionfrom each reactor. Each sample was acidified with metals grade HNO3 to pH <2 andkept at 4◦C until analysis. Prior to each sampling day, 50-mL plastic sampling vials wereacid-washed with 10% HNO3. A 50-mL sample was taken from each reactor. Each samplewas acidified with metals grade HNO3 to pH <2 and stored at 4◦C until analysis. Phosphorusconcentrations were measured by using the ascorbic acid method (Standard Methods, 1985)and using a DR/4000V UV-Vis Spectrophotometer at 880 nm. Chloride concentrationswere measured with a MicrOhm ion chromatograph and heavy metals were done by aPerkin-Elmer 5100 Zeeman Graphite Furnace Atomic Adsorption Spectrophotometer.
Flow Reactor Experiment
The flow reactor experiment was designed to measure the accumulation of the targetcontaminants from flow reactors to simulate the uptake processes in detention ponds. Forthis experiment, 1/4 strength Hoagland’s nutrient solution was used as the base nutrientsolution with the following final concentrations (mM): 1.25 Ca(NO3)2, 0.5 KH2PO4, 1.5KNO3, 0.5 MgSO4, and 0.25 NaCl; and (µM) 11.5 H3BO3, 2.3 MnCl3, 0.026H2MoO4,and 22.4 FeSO4 (Hoagland and Arnon, 1938; Qian et al., 1999; Zhu et al., 1999). Forspiked reactors, CdCl2, ZnCl2, PbNO3, and CuSO4 were added to result in the same finalconcentrations as in the nonflow reactor experiment.
After noticing higher-than-expected background concentrations in the plants receivedfor the nonflow reactor experiment, it was decided to use plants ground from seed for theflow reactor experiment. Seeds were obtained from Hild and Associates, Inc., and wereplanted in sand in flats and placed in a greenhouse under growth lights on a 16–8-h light/darkcycle. Seeds of G. grandis and S. pectinata germinated well. However, the germination rateof S. validus seeds was very low. Therefore, flats of S. validus were ordered from Hild andAssociates, Inc., and the plants arrived at full height. The substrate was removed from allplants prior to inserting them into the reactors. For each species, 10 plants of approximatelythe same size were placed in each reactor for that species. Ten plants were used in eachreactor to even out differences in health and growth rate between individual plants and alsoto provide a sufficient safeguard in the event that any of the plants died.
Flow reactors were constructed out of 5-gallon buckets with 10 plants in each reactor(Figure 1A). There were two sets of reactors (spiked and control) for each species with 12reactors per set. Within each set of reactors, half were grown in sand and the other half weregrown hydroponically. Plants in the hydroponic reactors were suspended in the solution bycutting Styrofoam to fit into the reactors at the target water level. Holes were cut in theStyrofoam and individual plants were suspended in the holes with foam rubber plugs in

HEAVY METAL PHYTOREMEDIATION BY WETLAND MACROPHYTES 249
Figure 1 (A) Photo of one set of 12 reactors used in the flow reactor experiment; (B) plan view; (C) profile view.
the same way as in the nonflow reactor experiment. Hydroponic flow reactors were paintedblack to prevent algae growth and because root growth is inhibited by light. Plants in sandreactors were planted directly into the sand and Styrofoam was cut to cover the exposedsolution and sand between the plants to prevent algae growth.
The reactors were set up with slight differences in elevation and adjacent reactorswere connected at the desired water levels (Figure 1B). Each set of 12 reactors had a mainreservoir of nutrient solution. Overflow from the reservoir flowed into the first reactor.Overflow from the first reactor then cascaded into the second reactor, and so on. Actualflow in the reactors was from top to bottom with a spigot at the bottom of each reactor anda pinch valve on the effluent tube to control the flow rate. Three reactors from each of thetwo substrates were set at a flow rate of 6 L/d and the other three reactors per substrate wereset at 2 L/d. The effluents of all 12 reactors for each species/solution combination weretied together in parallel through a peristaltic pump. The effluent of the peristaltic pump
250 J. WEISS ET AL.
then went into the reservoir. Water levels were monitored daily and DI water was added asneeded to maintain consistent water levels.
Once per week, 50-mL samples of the nutrient solution were taken from the reservoirof each recirculating setup. Samples were acidified to pH <2 with metals-grade HNO3,filtered through a 0.45-µm filter, and stored at 4◦C until analyzed, in the same way asExperiment 1. At the end of the experiment, the plants were removed from the reactorsand each individual plant height was measured to determine overall growth. Belowgroundtissues were separated from aboveground tissues and all of the aboveground tissues fromeach reactor were then placed in a labeled paper bag and placed in a drying oven at 105◦Cfor 3 d. The same was done for all of the belowground tissues from each reactor. Dryweights were measured and samples were submitted for ICP analysis for determination ofall target pollutants.
RESULTS AND DISCUSSION
Growth Rates
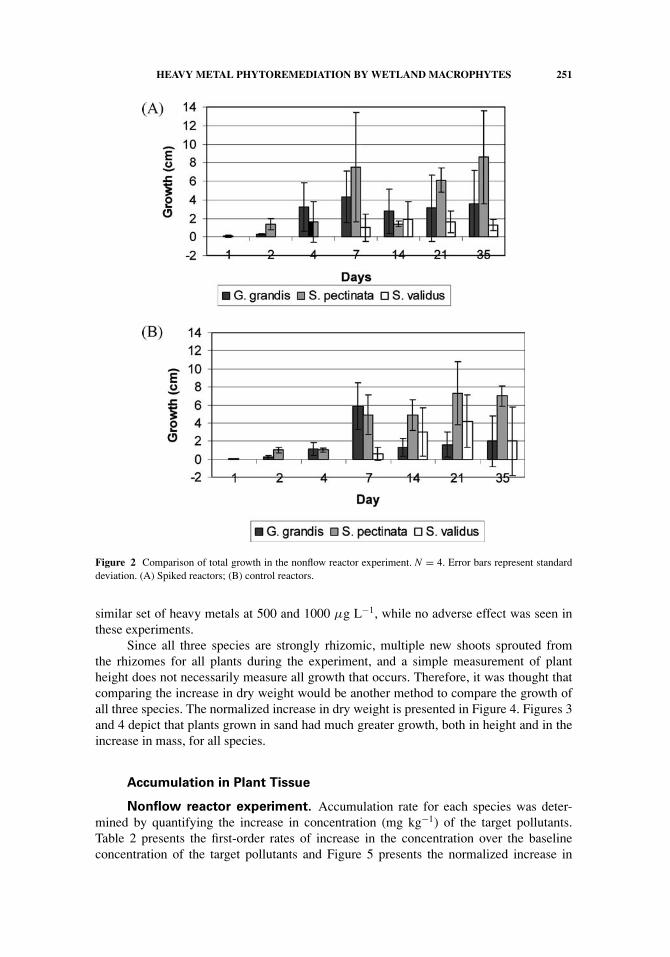
Nonflow reactor experiment. In the nonflow reactor experiment, there were nosignificant trends when comparing growth between species or between plants that weregrown in spiked or control reactors (Figure 2). Analysis of the growth of individual plantsrevealed that there are some general trends present. S. validus plants in control reactors hadbetter growth than spiked reactors for all days except Day 7, while G. grandis plants incontrol reactors showed better growth than those in spiked reactors for every day exceptDay 7. S. pectinata showed no general trend. T-tests were performed on the data andrevealed that there were no significant differences (p < 0.05) between the growth in spikedand control reactors for the same species except for Day 14 for G. grandis.
Besides the isolated days where there was a significant difference in growth betweenthe two species, a few general trends can be noted. For all three species, the spikedconcentrations of the contaminants seemed to have no harmful effect on growth. All threespecies had some days when the spiked reactors showed better growth and other dayswhen the control reactors showed better growth. There was no general trend of increasedoverall growth rate with time for any of the three species. It would be expected that Day35 would have shown the greatest overall growth for all species, but that was only true forS. pectinata and, even for that species, there was not a strong trend of increased growth foreach sampling day.
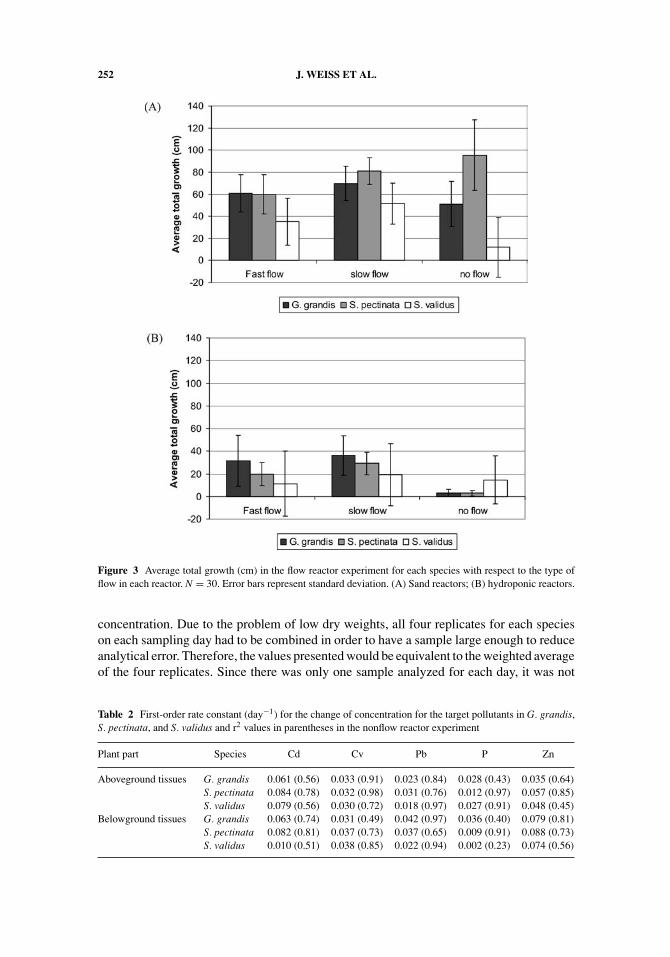
Flow reactor experiment. Total growth in the flow reactor experiment was muchgreater than in the nonflow reactor experiment, probably due to the fact that the flow reactorexperiment took place in a greenhouse with higher temperatures and more natural light.Figure 3 shows total growth in the flow reactor experiment. It is interesting to note that thespiked solution actually seemed to increase growth in all three species. It is acknowledgedthat the levels of contamination present in the reactors are generally not sufficiently highto cause any significant toxicity to the species involved. For example, Zayed et al. (1998)did not observe an effect on growth or chlorosis in duckweed until concentrations of Cdand Pb reached 5 mg L −1. Even though each species will have different toxicity thresholdsto different contaminants, 5 mg L−1 is approximately 500 and 15 times more concentratedfor Cd and Pb, respectively, than were used in this experiment. However, Lee, Sturgis,and Landin (1981) observed an adverse effect on growth for S. validus when exposed to a
HEAVY METAL PHYTOREMEDIATION BY WETLAND MACROPHYTES 251
Figure 2 Comparison of total growth in the nonflow reactor experiment. N = 4. Error bars represent standarddeviation. (A) Spiked reactors; (B) control reactors.
similar set of heavy metals at 500 and 1000 µg L−1, while no adverse effect was seen inthese experiments.
Since all three species are strongly rhizomic, multiple new shoots sprouted fromthe rhizomes for all plants during the experiment, and a simple measurement of plantheight does not necessarily measure all growth that occurs. Therefore, it was thought thatcomparing the increase in dry weight would be another method to compare the growth ofall three species. The normalized increase in dry weight is presented in Figure 4. Figures 3and 4 depict that plants grown in sand had much greater growth, both in height and in theincrease in mass, for all species.
Accumulation in Plant Tissue
Nonflow reactor experiment. Accumulation rate for each species was deter-mined by quantifying the increase in concentration (mg kg−1) of the target pollutants.Table 2 presents the first-order rates of increase in the concentration over the baselineconcentration of the target pollutants and Figure 5 presents the normalized increase in
252 J. WEISS ET AL.
Figure 3 Average total growth (cm) in the flow reactor experiment for each species with respect to the type offlow in each reactor. N = 30. Error bars represent standard deviation. (A) Sand reactors; (B) hydroponic reactors.
concentration. Due to the problem of low dry weights, all four replicates for each specieson each sampling day had to be combined in order to have a sample large enough to reduceanalytical error. Therefore, the values presented would be equivalent to the weighted averageof the four replicates. Since there was only one sample analyzed for each day, it was not
Table 2 First-order rate constant (day−1) for the change of concentration for the target pollutants in G. grandis,S. pectinata, and S. validus and r2 values in parentheses in the nonflow reactor experiment
Plant part Species Cd Cv Pb P Zn
Aboveground tissues G. grandis 0.061 (0.56) 0.033 (0.91) 0.023 (0.84) 0.028 (0.43) 0.035 (0.64)S. pectinata 0.084 (0.78) 0.032 (0.98) 0.031 (0.76) 0.012 (0.97) 0.057 (0.85)S. validus 0.079 (0.56) 0.030 (0.72) 0.018 (0.97) 0.027 (0.91) 0.048 (0.45)
Belowground tissues G. grandis 0.063 (0.74) 0.031 (0.49) 0.042 (0.97) 0.036 (0.40) 0.079 (0.81)S. pectinata 0.082 (0.81) 0.037 (0.73) 0.037 (0.65) 0.009 (0.91) 0.088 (0.73)S. validus 0.010 (0.51) 0.038 (0.85) 0.022 (0.94) 0.002 (0.23) 0.074 (0.56)

HEAVY METAL PHYTOREMEDIATION BY WETLAND MACROPHYTES 253
Figure 4 Normalized increase in dry weight in the flow reactor experiment. N = 3. Error bars represent standarddeviation. (A) Sand reactors; (B) hydroponic reactors.
possible to determine a standard deviation or conduct any statistical tests. Furthermore,due to the small sample sizes, it was not possible to analyze the plant samples for chlorideconcentrations. However, rates of depletion of chloride from the nutrient solution in thereactors were able to be analyzed and the results are presented below.
It can be seen in Table 2 that the uptake rate for each element varies between species.Also, it can be noted that, except for phosphorus, the uptake rates are much higher forthe belowground tissues than they are for the aboveground tissues. This phenomenon hasbeen noted by other researchers (Qian et al., 1999; Zhu et al., 1999). Several explanationsare possible. It is possible that the harmful elements, like the heavy metals, are simplysequestered into waste areas in the belowground tissues while beneficial elements, likephosphorus, are readily transferred to the aboveground tissues where they are needed.

254 J. WEISS ET AL.
Figure 5 Normalized increase in concentration C/Co for the target pollutants in the nonflow reactor experiment.
Another possibility is that the heavy metals simply sorb onto the outside of the belowgroundtissues and are not incorporated into the biomass at all.
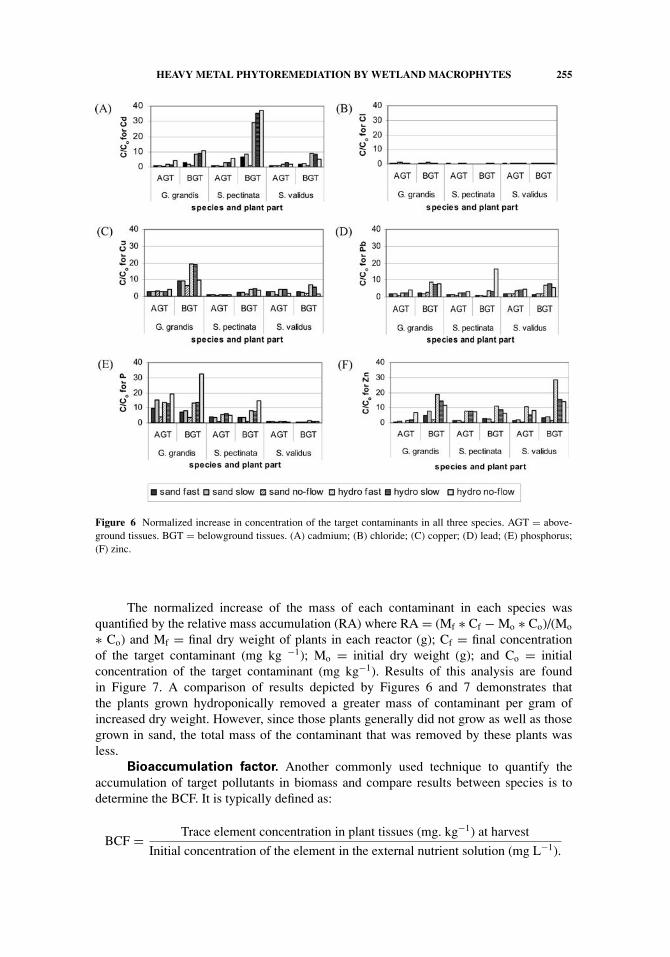
Flow reactor experiment. As was done in the nonflow reactor experiment, therates of accumulation in the plants were determined. However, unlike the nonflow reactorexperiment, in which plant and water samples were taken on the same days, plant sampleswere only taken on the final day of the experiment. This was done due to the problemin the nonflow reactor experiment, where individual plant samples were too small and allreplicates had to be combined. This concern was unfounded and it would probably havebeen possible to sample plants each day that water samples were taken. However, if that hadbeen done, then the reduction in the number of plants in each reactor would have affectedthe depletion rates of the target contaminants in the water. Figure 6 presents normalizedincrease in contaminant concentration (C/Co).
Analysis of the data for the increase on concentration of the contaminants in theplants reveals that, for the heavy metals, the belowground tissues resulted in a much greaterincrease in concentration than the aboveground tissues. This was very similar to the resultsin the nonflow reactor experiment and to the results from several researchers, includingLee et al. (1981), Zayed et al. (1998), and Zhu et al. (1999). The opposite was true for Cl,as the aboveground tissues had a greater increase in concentration and there were mixedresults for P. One interesting note is that there was a decrease in the concentration of P inS. validus. However, as can be seen below in the analysis of the depletion of concentrationsin the water, the reactors with S. validus resulted in the greatest overall decrease in P inthe nutrient solution. So, while the analysis of the increase in concentration in the plants isinteresting, it is obvious that it does not fully explain the removal of P.
HEAVY METAL PHYTOREMEDIATION BY WETLAND MACROPHYTES 255
Figure 6 Normalized increase in concentration of the target contaminants in all three species. AGT = above-ground tissues. BGT = belowground tissues. (A) cadmium; (B) chloride; (C) copper; (D) lead; (E) phosphorus;(F) zinc.
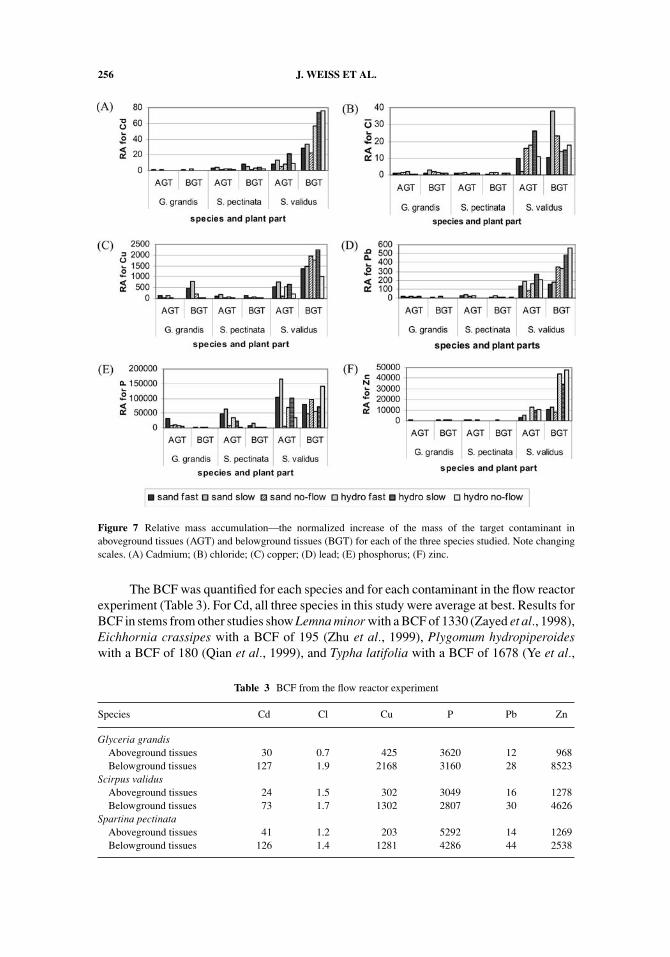
The normalized increase of the mass of each contaminant in each species wasquantified by the relative mass accumulation (RA) where RA = (Mf ∗ Cf − Mo ∗ Co)/(Mo
∗ Co) and Mf = final dry weight of plants in each reactor (g); Cf = final concentrationof the target contaminant (mg kg −1); Mo = initial dry weight (g); and Co = initialconcentration of the target contaminant (mg kg−1). Results of this analysis are foundin Figure 7. A comparison of results depicted by Figures 6 and 7 demonstrates thatthe plants grown hydroponically removed a greater mass of contaminant per gram ofincreased dry weight. However, since those plants generally did not grow as well as thosegrown in sand, the total mass of the contaminant that was removed by these plants wasless.
Bioaccumulation factor. Another commonly used technique to quantify theaccumulation of target pollutants in biomass and compare results between species is todetermine the BCF. It is typically defined as:
BCF = Trace element concentration in plant tissues (mg. kg−1) at harvest
Initial concentration of the element in the external nutrient solution (mg L−1).
256 J. WEISS ET AL.
Figure 7 Relative mass accumulation—the normalized increase of the mass of the target contaminant inaboveground tissues (AGT) and belowground tissues (BGT) for each of the three species studied. Note changingscales. (A) Cadmium; (B) chloride; (C) copper; (D) lead; (E) phosphorus; (F) zinc.
The BCF was quantified for each species and for each contaminant in the flow reactorexperiment (Table 3). For Cd, all three species in this study were average at best. Results forBCF in stems from other studies show Lemna minor with a BCF of 1330 (Zayed et al., 1998),Eichhornia crassipes with a BCF of 195 (Zhu et al., 1999), Plygomum hydropiperoideswith a BCF of 180 (Qian et al., 1999), and Typha latifolia with a BCF of 1678 (Ye et al.,
Table 3 BCF from the flow reactor experiment
Species Cd Cl Cu P Pb Zn
Glyceria grandisAboveground tissues 30 0.7 425 3620 12 968Belowground tissues 127 1.9 2168 3160 28 8523
Scirpus validusAboveground tissues 24 1.5 302 3049 16 1278Belowground tissues 73 1.7 1302 2807 30 4626
Spartina pectinataAboveground tissues 41 1.2 203 5292 14 1269Belowground tissues 126 1.4 1281 4286 44 2538
HEAVY METAL PHYTOREMEDIATION BY WETLAND MACROPHYTES 257
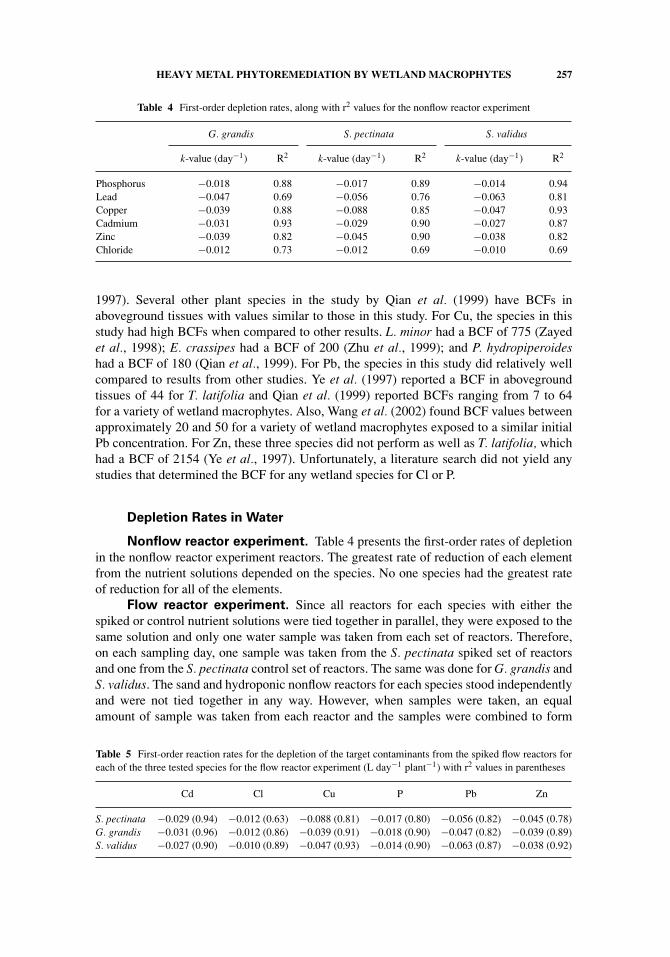
Table 4 First-order depletion rates, along with r2 values for the nonflow reactor experiment
G. grandis S. pectinata S. validus
k-value (day−1) R2 k-value (day−1) R2 k-value (day−1) R2
Phosphorus −0.018 0.88 −0.017 0.89 −0.014 0.94Lead −0.047 0.69 −0.056 0.76 −0.063 0.81Copper −0.039 0.88 −0.088 0.85 −0.047 0.93Cadmium −0.031 0.93 −0.029 0.90 −0.027 0.87Zinc −0.039 0.82 −0.045 0.90 −0.038 0.82Chloride −0.012 0.73 −0.012 0.69 −0.010 0.69
1997). Several other plant species in the study by Qian et al. (1999) have BCFs inaboveground tissues with values similar to those in this study. For Cu, the species in thisstudy had high BCFs when compared to other results. L. minor had a BCF of 775 (Zayedet al., 1998); E. crassipes had a BCF of 200 (Zhu et al., 1999); and P. hydropiperoideshad a BCF of 180 (Qian et al., 1999). For Pb, the species in this study did relatively wellcompared to results from other studies. Ye et al. (1997) reported a BCF in abovegroundtissues of 44 for T. latifolia and Qian et al. (1999) reported BCFs ranging from 7 to 64for a variety of wetland macrophytes. Also, Wang et al. (2002) found BCF values betweenapproximately 20 and 50 for a variety of wetland macrophytes exposed to a similar initialPb concentration. For Zn, these three species did not perform as well as T. latifolia, whichhad a BCF of 2154 (Ye et al., 1997). Unfortunately, a literature search did not yield anystudies that determined the BCF for any wetland species for Cl or P.
Depletion Rates in Water
Nonflow reactor experiment. Table 4 presents the first-order rates of depletionin the nonflow reactor experiment reactors. The greatest rate of reduction of each elementfrom the nutrient solutions depended on the species. No one species had the greatest rateof reduction for all of the elements.
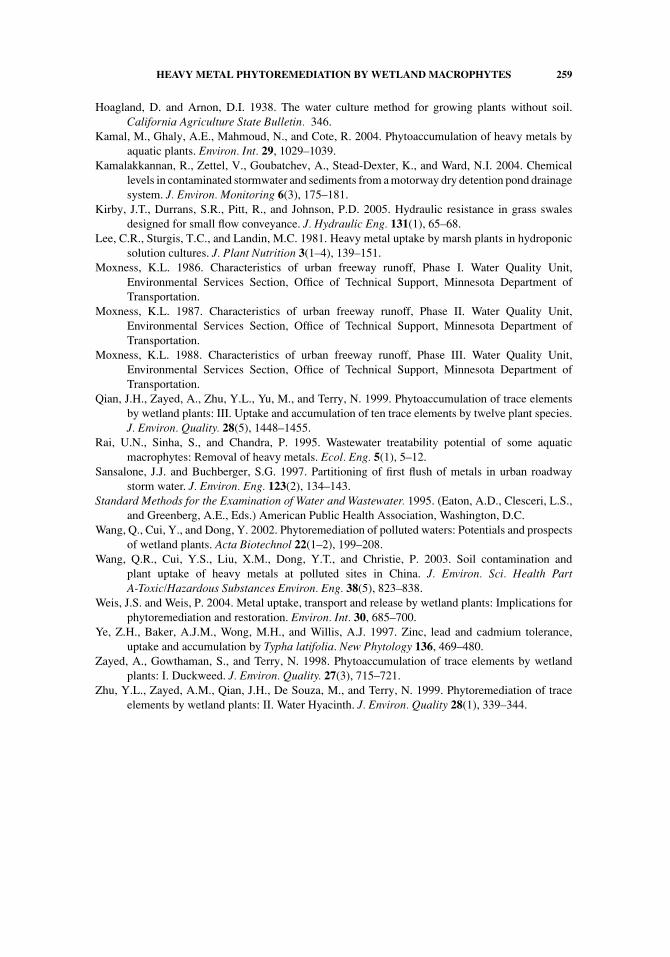
Flow reactor experiment. Since all reactors for each species with either thespiked or control nutrient solutions were tied together in parallel, they were exposed to thesame solution and only one water sample was taken from each set of reactors. Therefore,on each sampling day, one sample was taken from the S. pectinata spiked set of reactorsand one from the S. pectinata control set of reactors. The same was done for G. grandis andS. validus. The sand and hydroponic nonflow reactors for each species stood independentlyand were not tied together in any way. However, when samples were taken, an equalamount of sample was taken from each reactor and the samples were combined to form
Table 5 First-order reaction rates for the depletion of the target contaminants from the spiked flow reactors foreach of the three tested species for the flow reactor experiment (L day−1 plant−1) with r2 values in parentheses
Cd Cl Cu P Pb Zn
S. pectinata −0.029 (0.94) −0.012 (0.63) −0.088 (0.81) −0.017 (0.80) −0.056 (0.82) −0.045 (0.78)G. grandis −0.031 (0.96) −0.012 (0.86) −0.039 (0.91) −0.018 (0.90) −0.047 (0.82) −0.039 (0.89)S. validus −0.027 (0.90) −0.010 (0.89) −0.047 (0.93) −0.014 (0.90) −0.063 (0.87) −0.038 (0.92)
258 J. WEISS ET AL.
one composite sample from the three reactors in each combination. Table 5 presents thefirst-order reaction rates for the uptake of the target contaminants from the spiked nutrientsolutions.
CONCLUSIONS
This study has focused on the laboratory measurements of contaminants uptake bythree wetland macrophytes. Consistent with other studies (Qian et al., 1999; Zhu et al.,1999), all three species accumulate a higher concentration of the target contaminants intheir belowground tissues than they do in their aboveground tissues. The depletion ratesof the target contaminants from the nutrient solution depended on the contaminant inquestion and the species accumulating the contaminant. None of the three species removedthe target contaminants from the nutrient solution superiorly. All three of these speciesperformed very similarly to each other using BCF criteria. A comparison with studies ofother plant species revealed very good removal rates for Cu, good removal rates for Pb andZn, average removal rates for Cd. These results suggest that the BCF may not always be thebest measure to determine which species would be most appropriate for phytoremediation(Ebbs and Kochian, 1998). The presented data also demonstrate that quantifying the totalaccumulation of the contaminants in plant tissue (RA values) provides another measure toevaluate the phytoremediation capabilities of a particular species. For example, analyzingPb exclusively, using the BCF as a criterion for determining which of the three speciesstudied in this research is the best for removing Pb from stormwater runoff would lead tothe choice of S. pectinata. However, using RA as a selection criterion shows that S. validusis the clear choice. BCF is still a valuable tool, but it is not the only tool with which toevaluate phytoremediation capabilities.
These data also demonstrate that plants grown hydroponically had a higher concen-tration of contaminants than those grown in sand and that plants grown in flow reactorsremoved a greater mass of contaminants than those grown in nonflow reactors. Therefore,this suggests that a design of a system that would enable plants to be grown hydroponicallyat full height, as a promising solution for the remediation of stormwater runoff in detentionponds.
REFERENCES
Black, J. 1995. Absorbing possibilities: Phytoremediation. Environ. Health Perspectives. 103, 1106–1108.
Drapper, D., Tomlinson, R., and Williams, P. 2000. Pollutant concentrations in road runoff: SoutheastQueensland case study. J. Environ. Eng. 126(4), 313–320.
Driscoll, E.D., Shelley, P.E., and Strecker, E.W. 1990. Pollutant loadings and impacts from highwaystormwater runoff, Volume 1-IV. Federal Highway Administration FHWA-RD-88–006.
Ebbs, S.D. and Kochian, L.V. 1998. Phytoextraction of zinc by oat (Avena sativa), barley (Hordeumvulgare), and Indian mustard (Brassica juncea). Environ. Sci. Technol. 32(6), 802–806.
Falbo, M.B. and Weaks, T.E. 1990. A comparison of Eichhornia crasspes (Pontederiaceae) andSphagnum quinquefarium (Sphagnaceae) in treatment of acid mine water. Econ. Botany 44,40–49.
Fritioff, A. and Greger, M. 2003. Aquatic and terrestrial plant species with potential to remove heavymetals from stormwater. Int. J. Phytoremed. 5(3), 211–224.
Fritioff, A., Kautsky, L., and Greger, M. 2005. Influence of temperature and salinity on heavy metaluptake by submersed plants. Environ. Pollution. 133(2), 265–274.
HEAVY METAL PHYTOREMEDIATION BY WETLAND MACROPHYTES 259
Hoagland, D. and Arnon, D.I. 1938. The water culture method for growing plants without soil.California Agriculture State Bulletin. 346.
Kamal, M., Ghaly, A.E., Mahmoud, N., and Cote, R. 2004. Phytoaccumulation of heavy metals byaquatic plants. Environ. Int. 29, 1029–1039.
Kamalakkannan, R., Zettel, V., Goubatchev, A., Stead-Dexter, K., and Ward, N.I. 2004. Chemicallevels in contaminated stormwater and sediments from a motorway dry detention pond drainagesystem. J. Environ. Monitoring 6(3), 175–181.
Kirby, J.T., Durrans, S.R., Pitt, R., and Johnson, P.D. 2005. Hydraulic resistance in grass swalesdesigned for small flow conveyance. J. Hydraulic Eng. 131(1), 65–68.
Lee, C.R., Sturgis, T.C., and Landin, M.C. 1981. Heavy metal uptake by marsh plants in hydroponicsolution cultures. J. Plant Nutrition 3(1–4), 139–151.
Moxness, K.L. 1986. Characteristics of urban freeway runoff, Phase I. Water Quality Unit,Environmental Services Section, Office of Technical Support, Minnesota Department ofTransportation.
Moxness, K.L. 1987. Characteristics of urban freeway runoff, Phase II. Water Quality Unit,Environmental Services Section, Office of Technical Support, Minnesota Department ofTransportation.
Moxness, K.L. 1988. Characteristics of urban freeway runoff, Phase III. Water Quality Unit,Environmental Services Section, Office of Technical Support, Minnesota Department ofTransportation.
Qian, J.H., Zayed, A., Zhu, Y.L., Yu, M., and Terry, N. 1999. Phytoaccumulation of trace elementsby wetland plants: III. Uptake and accumulation of ten trace elements by twelve plant species.J. Environ. Quality. 28(5), 1448–1455.
Rai, U.N., Sinha, S., and Chandra, P. 1995. Wastewater treatability potential of some aquaticmacrophytes: Removal of heavy metals. Ecol. Eng. 5(1), 5–12.
Sansalone, J.J. and Buchberger, S.G. 1997. Partitioning of first flush of metals in urban roadwaystorm water. J. Environ. Eng. 123(2), 134–143.
Standard Methods for the Examination of Water and Wastewater. 1995. (Eaton, A.D., Clesceri, L.S.,and Greenberg, A.E., Eds.) American Public Health Association, Washington, D.C.
Wang, Q., Cui, Y., and Dong, Y. 2002. Phytoremediation of polluted waters: Potentials and prospectsof wetland plants. Acta Biotechnol 22(1–2), 199–208.
Wang, Q.R., Cui, Y.S., Liu, X.M., Dong, Y.T., and Christie, P. 2003. Soil contamination andplant uptake of heavy metals at polluted sites in China. J. Environ. Sci. Health PartA-Toxic/Hazardous Substances Environ. Eng. 38(5), 823–838.
Weis, J.S. and Weis, P. 2004. Metal uptake, transport and release by wetland plants: Implications forphytoremediation and restoration. Environ. Int. 30, 685–700.
Ye, Z.H., Baker, A.J.M., Wong, M.H., and Willis, A.J. 1997. Zinc, lead and cadmium tolerance,uptake and accumulation by Typha latifolia. New Phytology 136, 469–480.
Zayed, A., Gowthaman, S., and Terry, N. 1998. Phytoaccumulation of trace elements by wetlandplants: I. Duckweed. J. Environ. Quality. 27(3), 715–721.
Zhu, Y.L., Zayed, A.M., Qian, J.H., De Souza, M., and Terry, N. 1999. Phytoremediation of traceelements by wetland plants: II. Water Hyacinth. J. Environ. Quality 28(1), 339–344.
