laboratory testing methods for centrifugal sludge …
TRANSCRIPT

LABORATORY TESTING METHODS
FOR CENTRIFUGAL SLUDGE DE-
WATERING PROCESSES
Kaisa Kätkä
Bachelor’s thesis
January 2013
Degree Programme in Environmental
Engineering

2
ABSTRACT
Tampereen ammattikorkeakoulu
Tampere University of Applied Sciences
Environmental Engineering
KAISA KÄTKÄ:
Laboratory Testing Methods for Centrifugal Sludge Dewatering Processes
Bachelor’s thesis 30 pages, appendices 1 page.
January 2013
Sludge dewatering is an important part of the municipal and industrial wastewater
treatment. The purpose of sludge dewatering is to reduce organic ingredients, as well as
the volume and weight of the sludge. Sludge treatment removes odour, improves hy-
giene by removing pathogenic organisms and prepares sludge for further utilisation or
disposal. Although different instrumentation and process steps vary from one
wastewater treatment plant to another, the sludge dewatering part of the process remains
one of the most costly parts of the process, and the most challenging in terms of the
chemistry involved. It is also the most highly regulated area of the industry. During the
last decade, centrifugal sludge dewatering has largely replaced a great number of other
instrumentation set-ups such as belt filter presses or drying beds in the municipal
wastewater treatment plants. Due to the high shear force environment, demanding per-
formance requirements are created for the dewatering-aid chemicals used in centrifugal
sludge dewatering.
The heart of the dewatering process lies in the detailed chemical composition of the
sludge dewatering chemicals. The sludge dewatering chemicals are typically different
compositions of charged acrylamide-co-polymers, with different structural elements
such as charge, molecular weight and structuring. The application research and product
development are highly dependent on accurate laboratory methods, fine-tuned to de-
scribe the process environment with the real application.

3
CONTENTS
1 INTRODUCTION ....................................................................................................... 5
2 BACKGROUND ........................................................................................................... 6
2.1 Sludge quantities and characteristics ..................................................................... 6
2.2 Sludge types .......................................................................................................... 8
2.2.1 Primary sludge ............................................................................................ 8
2.2.2 Secondary sludge ........................................................................................ 8
2.2.3 Tertiary sludge ............................................................................................ 9
2.3 Sludge treatment .................................................................................................. 10
2.3.1 Sludge conditioning .................................................................................. 10
2.3.2 Thickening and dewatering ....................................................................... 11
Belt Filter Press .................................................................................................. 13
Pressure Filter Press ........................................................................................... 14
Drying Beds ....................................................................................................... 14
Centrifugal dewatering ...................................................................................... 15
2.3.3 Use of polymers in sludge treatment ........................................................ 16
3 MATERIALS AND METHODS ................................................................................. 19
3.1 Capillary suction time, CST ................................................................................ 19
3.2 Gravity filtration, polytest ................................................................................... 21
3.3 Centrifugal filtration ............................................................................................ 22
4 RESULTS AND DISCUSSION .................................................................................. 23
4.1 CST test with four polymer products .................................................................. 23
4.2 CST test with ageing sludge ................................................................................ 24
4.3 Dewatering with polymer mixtures vs subsequent addition of the
components ........................................................................................................ 25
4.4 Determination of optimum blending ratio ........................................................... 26
4.5 Polytest with two polymer products .................................................................... 27
5 CONCLUSIONS .......................................................................................................... 28
6 REFERENCES .......................................................................................................... 29
APPENDICES ................................................................................................................ 30
Appendix 1. Wastewater treatment process at Suomenoja. ...................................... 30

4
GLOSSARY
BFP Belt Filter Press
BOD5 The biochemical Oxygen Demand of wastewater during de-
composition occurring over a 5-day period.
CST Capillary suction time
NTU Normalized Turbidity Unit
PAM Polyacrylamide
TS Total Solids

5
1 INTRODUCTION
Sludge is the final product after wastewater purification processes; its quality depends
on used purification methods and the source of wastewater. The sludge consists of nu-
trients, such as nitrogen, phosphorous, micronutrients and organic matter, why treated
sludge can be used as a fertilizer and as an organic soil improver. The amount of potas-
sium in sludge in general is low. Besides, sludge contains heavy metals, poorly biode-
gradable trace organic compounds and potential pathogenic organisms like viruses and
bacteria. These pathogen organisms are removed in sludge treatment. The amount of
heavy metals varies depending on the sludge quality of the municipality and industry.
Also the characteristics of industrial sludge depend on the branch of industry and the
treatment processes that are used. (Pöyry Environment Oy 2007, 4)
The concentration of the total solid substance in digested sludge has an impact on the
total quantity of the consisting sludge. When the dewatering process is optimized, less
sludge need to be transported to dumping grounds or incineration, and great cost sav-
ings can be achieved. The aim of this thesis work is to find out optimal parameters for
centrifugal sludge dewatering process. In this work it is investigated, whether the in-
strumental techniques typically used for determination of the polymeric sludge dewater-
ing ability can point out flock strength properties.
The highest flock strength evidently leading to higher sludge dry solids can be accom-
plished with acrylamide polymers possibly carrying some amount of structuring agent
in the chemical composition. The characteristics of different polymer products used in
sludge dewatering were also an object of interest. In this study, two acrylamide polymer
“families”, linears and structured, are used in laboratory tests. The laboratory work was
done in Kemira research center in Espoo.

6
2 BACKGROUND
2.1 Sludge quantities and characteristics
The annual amount of sludge consisting in water treatment plants in Finland is approx-
imately 840 000 t/a, which equals to 160 000 t TS/a. (Total Solids, TS). Agriculture is
the biggest producer of sludge; according to the number of cattle, agricultural sludge is
generated about 20Mm3/a every year. Other sources of sludge are domestic use of wa-
ter, industries such as pulp and paper processing, food and beverage processing, metal
and chemical processing. (Pöyry Environment Oy 2007, 4)
Municipal sludge is handled at municipal wastewater treatment plants, but also sludge
from cesspits and septic tanks from sparsely populated areas are transported to munici-
pal wastewater treatment plants. At some plants also sludge from industry and fisheries,
garden waste, manure from farms and horse stable, and other bio waste are treated.
Sludge collected and concentrated on the wastewater treatment plants is dried mechani-
cally with chemical aid typically with spin-dryer (Pöyry Environment Oy 2007, 5).
The most common way to treat agricultural sludge is drying with dehydrating agent.
Another common treatment is to treat manure as manure sludge. Manure is utilized as
fertilizer on fields, but in large farms storing and utilizing manure may be problematic
(Pöyry Environment Oy 2007, 6-7). Before using sludge in agriculture, it must be treat-
ed for example by digesting or lime stabilization, to decrease the number of harmful
bacteria, odour and other health and environment related disadvantages. Also the
amount of heavy metals in sludge or the cultivating area shouldn’t overstep set secure
limits. There are also some restrictions regarding the type of cultivation where the
sludge can be utilized; sludge can be used as fertilizer when growing corn, sugar beet,
oil plant and plants that are not grown for human food. The amount of sludge for ferti-
lizing is proportioned always to the cultivating field and the nutrient need of plants.
(Lohiniva et al. 2001, 30.)
Sludge from food and beverage processing includes often lots of organic material and is
thus applicable for the raw material of digestion. Part of organic waste is utilized in feed
production. Some sludge from food industry can be used as raw material in regional
biogas production sites. Other industrial sludge can be composted, if there’s no possibil-
ity for digestion or bio gas production. Sludge generated in forest industry is often treat-

7
ed at wastewater plants of the industrial sites, and finally incinerated at the sites. ( Pöyry
Environment Oy 2007, 6-7)
FIGURE 1. Total sludge amounts. Image adapted from Pöyry Environment Oy 2007, 4.
FIGURE 2. Sludge contents after mechanical wastewater treatment.
Image adapted from Pöyry Environment Oy 2007, 19.
Raw sludge Decomposed
sludge
Mixed sludge from
pulp industry
Sludge from
paper industry
Organic
material
Ash
Water
Municipal use 842
Sparsely populated area 242
Agriculture21300
Small industries in countryside 56
Food industry 68
Total amount of sludge (1000 t)
Municipal use 842
Sparsely populated area 242
Small industries in countryside56
Food industry 68
Total amount of sludge (1000 t)
without agricultural sludge

8
2.2 Sludge types
Types of sludge and other solids in wastewater, such as screenings, grit and scum vary
according to the type of plant. Most of the medium and large sized wastewater treatment
plants in Finland and Europe are activated sludge plants. An activated sludge treatment
process is illustrated in figure 1. There are three separate phases used in the treatment
process; mechanical (primary), biological (secondary) and chemical (tertiary) treatment.
The sludge which is not treated biologically or chemically for volatile solids or patho-
gen reduction is called raw sludge. Raw sludge contains dry solids (3-5%), which con-
sist mostly of organic materials (70%). Sludge produced can be later digested by aero-
bic or anaerobic biologic process in order to reduce the amount of sludge and the patho-
gens including the sludge. After the treatment of the sludge, it can be classified by the
treatment such as aerobically digested, anaerobically digested, alkaline stabilized, com-
posted and thermally dried. Wastewater treatment process at Suomenoja is represented
in appendices 1. (Lohiniva et al. 2001, 17-18.)
2.2.1 Primary sludge
Primary sludge is the product after gravity settling at the beginning of the process in
wastewater treatment plant. At first, raw sludge is treated mechanically to remove large
particles in screening and grit removal. In primary sedimentation large particles are set-
tling in the ground, and obtained primary sludge is fed to sludge processing in pre-
thickening. In mechanical treatment 50-70% of total solids and 35-40 % BOD5 can be
removed. (Lohiniva et al. 2001, 17-18.) Primary sludge can be dewatered faster than
biological and chemical sludge because it is comprised of discrete particles and debris.
2.2.2 Secondary sludge
Biological treatment follows mechanical treatment. The concept of biological treatment
is simple: small organic particles are removed as a bacteria feedstock. These bacteria are

9
often referred to as activated sludge bacteria. Thus biological sludge is produced after
primary settling when the bacteria consume soluble and insoluble organics.
Activated sludge and trickling filter sludge contain solids concentration of 0.4 to 1.5%
and 1 to 4% in dry solids weight, respectively. (Turovskiy et al. 2006, 32.) Solid organic
material is converted to gas and cell tissue. Since cell tissue is lighter than water, it can
be removed from top of the sludge reservoir. Nitrogen removal is done in microbial
simultaneous nitrification-denitrification process, where heterotrophic organisms are
responsible for denitrification and reduction of nitrate NO3- to nitrogen gas N2. These
heterotrophic organisms use carbon from organic compounds in the sludge. (Lohiniva et
al. 2001, 18.)
Although the concept of biological treatment by activated sludge is simple, the control
of the treatment process is complex. There are numerous variables affecting the process,
such as changes in the composition of bacterial flora of the treatment tanks and changes
in the sewage passing into the plant. The influent wastewater may vary in flow rate, in
chemical composition, pH and temperature. Toxic chemicals may also inhibit the func-
tioning of the activated sludge bacteria or kill them.
2.2.3 Tertiary sludge
Tertiary sludge, also called chemical sludge is obtained from the processes of chemical
precipitation and filtration. Chemicals are used in precipitation and removal of hard-to-
remove substances, and in improvement of suspended solids removal. Phosphorus is a
typical example of chemical precipitation. Phosphorus is removed by precipitation with
ferric sulfate or aluminum sulfate. Chemicals can be added in the biological process
with the biological sludge, but in most treatment plants chemicals are applied to sec-
ondary effluent, when tertiary clarifiers or tertiary filters are used in chemical precipi-
tate removal. Added chemicals may cause unwanted side effects like depression of pH
and alkalinity of wastewater. Addition of alkaline chemicals can be used then to adjust
these parameters. (Turovskiy et al. 2006, 32-33.)

10
2.3 Sludge treatment
The main target of sludge management is to produce clean biosolids that could be used
beneficially later. The moisture content of final sludge has to be limited for lower costs,
and to decrease environmentally harmful impacts caused by pathogen organisms. It is
also beneficial to gather valuable nutrients such as phosphorus and nitrogen for nutrient
reuse. Sludge is also a valuable source for the reuse of inorganic material and energy
production.
2.3.1 Sludge conditioning
To enhance solid-liquid separation, sludge is treated biologically, chemically or physi-
cally before thickening and dewatering of the sludge. This process is called sludge con-
ditioning. Sludge conditioning can be made by inorganic or organic chemicals, power
plant or sludge incinerator ash, or by physical processes such as heating, elutriation,
freezing and thawing. Sludge characteristics which affect thickening and dewatering
and which determine thus needed conditioning method, are source of sludge (primary,
waste activated sludge, chemical sludge, digested biosolids), solids concentration, sur-
face charge and degree of hydration, particle size and distribution, pH and alkalinity.
The source of sludge indicates suitable amounts of conditioner doses for thickening and
dewatering. Primary sludge, in general, requires less chemical conditioning than biolog-
ical sludge. Aerobically and anaerobically digested sludge has usually similar condition-
ing requirements as secondary digested biological sludge. Conditioning requirements
for different chemical sludge again vary a lot.
Solids concentration is related to the activity of interaction; when the concentration of
solids increases, also the interaction increases. Sludge conditioning is often about neu-
tralization of the surface charge of sludge particles by oppositely charged organic poly-
electrolytes or inorganic chemical complexes. Thus coagulant dose is expressed as a
percentage of dry solids or as kilograms of coagulant per ton of dry solids of the sludge.
Sludge solids repel one another, because of surface charge and hydration. There’s a lay-
er of water binding the surface of a solid preventing close approach between other sol-

11
ids. Sludge solids are also negatively charged, why conditioning is to overcome both the
effects of hydration and electrical repulsion.
When determining the dewaterability of sludge, particle size is probably the most im-
portant factor. Increased surface area of small sludge particles increases the hydration
and chemical demand, increasing the resistance to dewatering as well. Therefore the
interest in conditioning is to increase particle size by combining small particles into
large ones.
pH and alkalinity affect mainly the use of inorganic conditioners. Inorganic condition-
ers, such as iron and aluminum reduce the water pH.
Some physical factors such as storage, pumping, mixing and other sludge treatment
processes affect the characteristics of sludge, and thus, the process of thickening and
dewatering. Pumping and mixing processes with high shear forces decreases the size of
sludge particles, which also increases chemical demand and increases resistance to de-
watering. (Turovskiy et al. 2006, 62-64.)
2.3.2 Thickening and dewatering
Thickening is a process for increasing the solids concentration of sludge and for de-
creasing its volume by removing water. Decreasing the volume of sludge is important
because of efficiency and to decrease the costs of following sludge-processing steps.
Dewatering is also removing water from sludge, where the volume reduction is greater
than in thickening. After dewatering the sludge is solid-semisolid material and easier to
handle. Dewatering is required before thermal drying or incineration, so that less energy
is required for evaporation the excess moisture ( Turovskiy et al. 2006, 61).
The volume of water that can be removed during dewatering depends on the sludge
quality and the physical water distribution in the sludge, and the dewatering process.
(Lohiniva et al. 2001, 52.) In sewage sludge suspension different types of water can be
distinguished; surface water, which is bound on the surface of the particle by adsorption
or adhesion andinterstitial water, which is bound by capillary forces between the sludge
particles or trapped inside the flocks of solids. Interstitial water can be removed with a
strong mechanical force. Free water is not bound to sludge particles, and it can be re-

12
moved during mechanical dewatering. Intracellular water is chemically bound. (Vii-
tanen 2006, 25-26)
FIGURE 3. Various water phases in sludge. Image adapted from Viitanen 2006, 26.
After reducing the sludge volume, the costs for transporting sludge to disposal sites be-
come lower. Dewatering of sludge is necessary before composting to improve airflow
and texture, and to reduce requirements for additives. Since the year 2001, it has been
obligatory to treat sludge by thickening and dewatering before disposing it in landfills.
Dewatering limits leachate production at the landfill site, and prevents the spread of
harmful waste. ( Viitanen 2006, 12.)
FIGURE 4. Dry solids contents of sludge after different treatment steps. Image reprinted from Lohiniva et
al. 2001, 52.

13
There are several techniques used in dewatering devices; dewatering can be done either
with the help of presses or centrifuges, which is referred as mechanical dewatering.
Other common processes used are filtration and physical and biological processes in
drying beds. Mechanical dewatering and filtration often require the use of chemicals
(coagulants and flocculants) to enhance the process. The main differences between dif-
ferent dewatering processes are solids concentration and flow rate of the feed stream,
chemical demand, the solids concentration of the dewatered sludge cake, and side
stream. The selection of certain dewatering process is based on the type and volume of
sludge to be dewatered, characteristics such as dryness required of the dewatered
sludge, and space available at the site. (Turovskiy et al. 2006, 106).
Belt Filter Press
A belt filter press (BFP) is a continuous-feed sludge dewatering machine, which has
two porous moving belts including a gravity drainage zone and mechanically applied
pressure zones. Belt filter presses have been used first for dewatering paper pulp, later
also for dewatering wastewater sludge. It can dewater secondary sludge economically
and its energy consumption is lower compared to centrifuges. Belt filter press is one of
the most used dewatering equipment in the world. (Turovskiy et al. 2006, 110).
Belt filter press includes several combined processes and applications such as chemical
conditioning, gravity drainage and mechanical shearing and compression for removing
water and dry up of the sludge. Chemical conditioning is the first step in the process:
polymer is added into a sludge-polymer mixer placed in the feed line to the press. The
conditioned sludge is then fed into the gravity drainage section, where the sludge is
thickened further. Most of the water is removed there and the water is collected in a
sump. From the gravity drainage section, the sludge is transferred through a conveyor
belt driven by a series of rollers, which apply pressure to expel almost all free water
from the slurry. At the last roller, the final sludge cake is removed by using mechanical
scrapper blades. (WasteWater System 2009).

14
FIGURE 5. Schematic of a belt filter press. Source of the picture: Wikiwayman 2009.
Pressure Filter Press
Pressure filter press dewatering is a batch process where water is forced from the sludge
under high pressure. As the result, the achieved final sludge cake is drier compared to
other dewatering alternatives. Disadvantages include high capital cost, relatively high
operation and maintenance costs, high chemical costs and a large area requirement for
the equipment in small wastewater treatment plants. Pressure filter press is a good
choice when the sludge has poor dewaterability or when it’s needed to dewater sludge to
solids content of greater than 35%. (Turovskiy et al.2006, 116-118).
Drying Beds
Drying beds are most widely used method of municipal wastewater sludge dewatering
in the United States. In Russia and other Eastern Europe countries, more than 80% of
the municipal wastewater plants use drying beds. The advantages of sludge drying beds
are low capital cost, low energy consumption, low chemical consumption, low operator
skill and attention is required. Disadvantages include large space requirement, since a
large open space area away from residential population is needed to avoid odour com-
plaint. With the use of greenhouse setup, the weather conditions and odour won’t be
restrictions anymore (Turovskiy et al. 2006, 121).

15
Centrifugal dewatering
Centrifugal dewatering is widely used in municipal wastewater treatment plants in the
United States and Europe. The main components of a solid bowl centrifuge are shown
in Figure 6. The conveyor scroll fits inside the rotating bowl, and it rotates at slightly
lower or faster than the bowl. The difference in speed between the bowl and the con-
veyer scroll enables the solids to be conveyed from the feed pipe to the dewatering
beach, where the sludge cake is discharged. The differential speed is controlled by the
gear unit and the back drive.
Many physical conditioning methods have been used for centrifugal dewatering, but the
most effective method has been polymer conditioning. Positively charged polyacryla-
mides (cationic polymers) are used as flocculation chemical in centrifugal dewatering.
Performance of a centrifuge is measured by the dewatered cake solids concentration and
the determination of total solids content (Turovskiy et al. 2006, 106-110).
FIGURE 6. Schematic of a solid bowl centrifuge. The sludge feed enters through the large diameter end
of the bowl, and the sludge cake is conveyed toward the opposite end. Source of the picture: R. Castel-
nuovo 2005.
16
2.3.3 Use of polymers in sludge treatment
Organic polyelectrolytes are type of polymers; they are common applied as sludge-
conditioning agents. In sludge treatment, they have several cost saving advantages over
inorganic chemicals. Polymers are easy to handle and their feeding system takes less
space. Needed polymer doses are several times smaller than doses of inorganic chemi-
cals.
Organic polyelectrolytes are water-soluble organic molecules in a long chain. They con-
sist of small units, monomers. If the monomer units have ionizable groups, they can
become charged. Sludge-conditioning polymers are classified according to their electri-
cal charge as anionic (negative), cationic (positive) and nonionic (uncharged). There
may be great differences in charge density. Polymers are also classified by form as dry,
liquid, emulsion and gel. Molecular weight of polymer varies from a few thousand up to
several millions monomer units. By structure they are either linear or have branching.
( Turovskiy et al. 2006, 75).
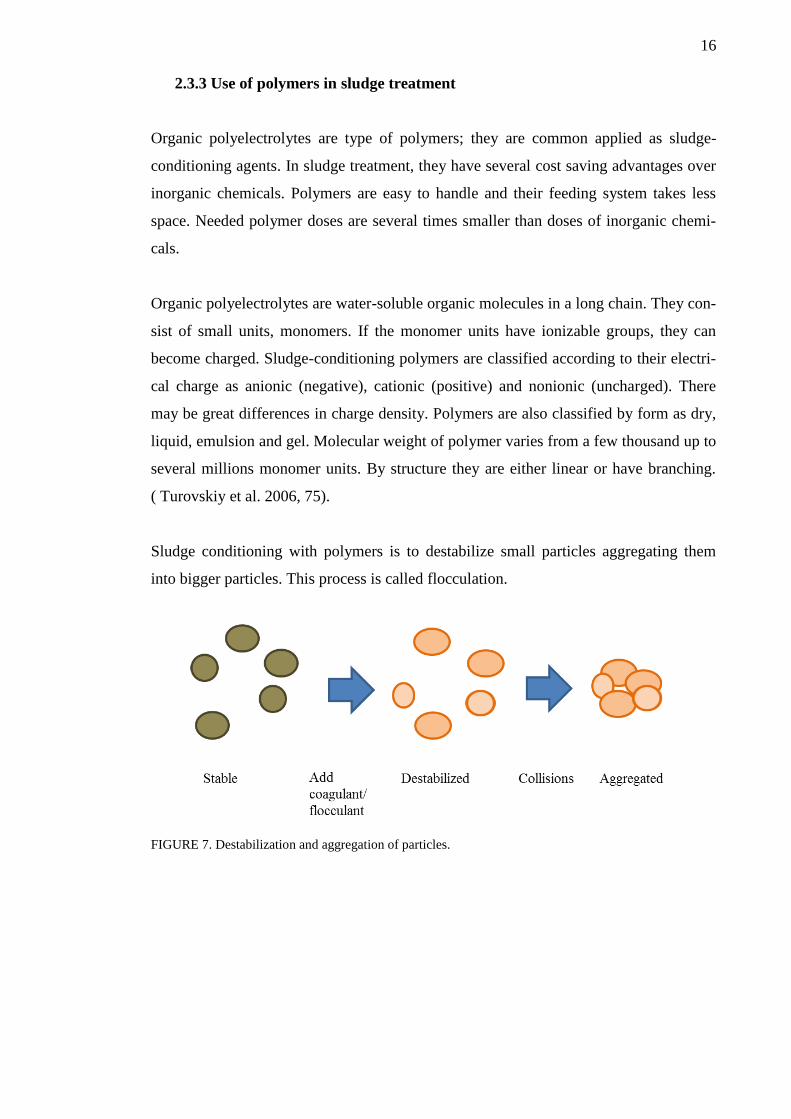
Sludge conditioning with polymers is to destabilize small particles aggregating them
into bigger particles. This process is called flocculation.
FIGURE 7. Destabilization and aggregation of particles.

17
Factors affecting flocculation are the type of sludge, the polymer dose and type, electri-
cal charges, mixing rate and time. In flocculation, polyelectrolytes are thought to form
bridges between sludge particles. The strength of aggregates formed in polymer condi-
tioning influence the efficiency of dewatering. Thus sludge particles which are condi-
tioned with polymer flocculants form more rigid structures; polymer bridging produces
strong flocks that can grow quite large. Adding polymer to sludge breaks the jelly-like
layer of sludge particles, which enables the water to be released and separated. In floc-
culated activated sludge, the water is fragmented in interfloc and intrafloc parts. The
binding energy needed for water is smaller than for bound water. Further more, the total
network energy is lower at the optimum polymer dose, when more water is released
within flocs.
The optimum polymer dose is determined more by the colloidal material in sludge than
by the floc solids. (Viitanen 2006, 14-16.) Although polymer conditioned flocs are
strong and withstand high shear forces, they may not reform if the flocs get broken.
Polymers with high molecular weight are found to be more effective flocculants than
polymers with low molecular weight. For a given molecular weight, linear polymers are
found to be more effective than branched or cross-linked structures. Highly charged
chains tend to adopt a more expanded configuration and might thus be more effective
bridging agents. For some signs of charge (anionic polyacrylamides, PAM, and nega-
tive particles) highly charged polyelectrolytes are less readily adsorbed, which is related
to less effective flocculants. For this reason, there may be an optimum charge density
for most effective flocculation. (Gregory 2006, 139-140)
Particles in natural waters, effluents and in most industrial suspensions are negatively
charged. In these cases the most effective flocculants are positively charged cationic
polyelectrolytes, since they attract negatively charged particles. The cationic groups of
polyelectrolytes stick to the negatively charged part of sludge flocs, linking them to-
gether and closer to each other. This way the water is pressed out from the flocs and the
sludge becomes dryer. Thus, cationic polymers seem to be the most effective condition-
er for wastewater sludge. If aluminum and ferric salts have been predosed excessively,
anionic polymers may give a better result. (Gregory 2006, 139-140)

18
If the role of cationic polyelectrolyte is to neutralize particle charge, then the charge
density of the polyelectrolyte should be more important factor affecting flocculating
than molecular weight. Adsorption is sometimes so strong that it continues beyond the
point of charge neutralization causing charge reversal. This confirms the thought men-
tioned above that there’s an optimum polymer dosage for the most effective floccula-
tion. (Gregory 2006, 139-140)

19
3 MATERIALS AND METHODS
The testing methods presented below are common procedures used for determining
sludge conditioning effectiveness for thickening and dewatering. The changes in sludge
dewaterability during flocculation and floc breakage were tested with Capillary suction
time, gravity filtration and centrifugal filtration. Sludge used in the tests is decomposed
municipal sludge from Suomenoja wastewater treatment plant. The solids content of the
sludge was measured before running each method. This is done by weighing approxi-
mately 10g of sludge in a cup, drying the sludge sample at 105ºC from 15 to 24h, then
cooling down in a desiccator and weighing the sludge sample again.
The formula for calculating total solids (TS) content:
X = ((m2-m1) / m ) * 100%
X= Total solids (TS), %
m1= mass of the cup, g
m2= mass of the cup and dried sludge sample, g
m= mass of the total sludge sample, g
3.1 Capillary suction time, CST
Capillary suction time (CST) is a fast and simple method for screening dewatering aids,
and commonly used for determining the optimal dose of polymer. The dewaterability of
sludge was mainly tested with this method. The CST test relies on gravity and capillary
suction time of a piece of thick filter paper to draw out the water from a sample of con-
ditioned sludge.
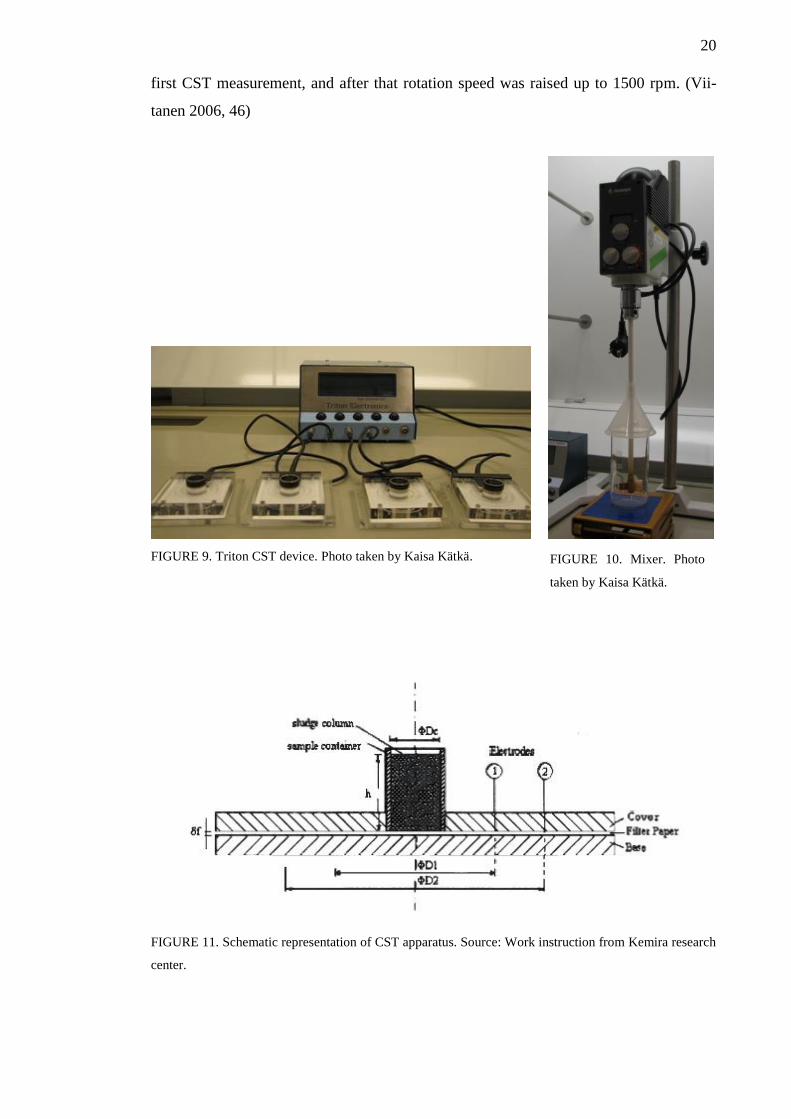
First 100g of sludge is mixed with polymer for a certain time (15s) in a beaker (Figure
10).Then a sludge sample (4,5 ml) was taken by a pipette and placed in a cylindrical
cell, which is centered in the middle of two concentric electrodes resting on a filter pa-
per (Figure 11).The electrodes are located at diameters D1 and D2. The time in seconds
it takes for the water in sludge to spread from the inner electrode D1 to the outer elec-
trode D2 (about 10mm distance) is the CST. The CST is recorded electronically. The
CST is written down, also the size of flocs and free water in the sludge are observed and
described. After this, CST was measured from the same sample after mixing another 15
seconds. This is called CST 30 s. CST 60 s means a CST result after 60 s of total mix-
ing, likewise CST 90 s after 90 s mixing. Rotation speed was set as 1000 rpm for the
20
first CST measurement, and after that rotation speed was raised up to 1500 rpm. (Vii-
tanen 2006, 46)
FIGURE 9. Triton CST device. Photo taken by Kaisa Kätkä.
FIGURE 11. Schematic representation of CST apparatus. Source: Work instruction from Kemira research
center.
FIGURE 10. Mixer. Photo
taken by Kaisa Kätkä.

21
Dilute sludge has usually a low CST value, why it’s essential to compare CST values of
sludge with similar suspended solids concentration. Addition of polyelectrolyte increas-
es the viscosity of sludge water and the rate of adsorption time by filter paper decreases.
CST for unconditioned sludge is about 200 seconds. A CST of 10 seconds or less is
considered as a good value for excellent dewatering performance.
( Turovskiy et al. 2006, 64).
It is commonly believed that the sludge characteristic changes already during the first
days. That’s why the sludge from Suomenoja water treatment plant used in this research
was always of same age: the sludge was got to the laboratory on Mondays and the tests
were started on Tuesdays. Same sludge could be used until Friday, but new sludge had
to be got on next week. Because one doesn’t really know, how the sludge characteristic
changes and what the actions of varying aged sludge on CST test results are, a test with
ageing sludge with certain polymer products was also tested.
3.2 Gravity filtration, polytest
Gravity filtration, also called Polytest, is used for
defining the optimal polymer dose for dewatering.
At first, sludge sample is mixed with polymer by
pouring the mixture between two beakers for several
times. Mixing can be done also with an electric mix-
er as in CST test. Then the sludge sample is filtered
via filtration funnel, and the filtration time is meas-
ured. After the filtration, turbidity of the filtrate is
measured. (Viitanen 2006, 50)
Turbidity is a measure of the amount of scattering
when light passes through water. It reflects the pres-
ence of suspended solids and their fineness, color
and shape. Turbidity values are stated in turbidity
units, NTU. Water treatment plants have often sev-
eral on-line turbidimeters, which continuously FIGURE 12. Gravity filtration
measuring set-up. Photo taken by
Kaisa Kätkä.

22
measure raw, filtered and treated water. (Binnie et al. 2002, 18-19.)
3.3 Centrifugal filtration
In centrifugal filters, pressure difference moves the fluid inside the filtration chamber.
The pressure gradient changes with rotational radius and with time. Centrifugation-
filtration doesn’t require a density difference between the solids and the suspending
liquid. Centrifugal filtration operates as follows: A similarly sized receiving cell is at-
tached beneath a filter cell in centrifugation-filtration device. A filter medium is set be-
tween the filter and receiving cell. Sludge sample is set inside the filter, and during the
rotational acceleration water is filtered through the filter media, accumulating in the
receiving cell. Thus the dry sludge cake is formed inside the filter. Centrifugal filtration
filters and cells are represented in figure 13. (Viitanen 2006, 40-41)
FIGURE 13.Centrifugal filtration filters and cells.

23
4 RESULTS AND DISCUSSION
Several laboratory tests were done by using previous mentioned methods CST, polytest
and centrifugal filtration, of which only the most interesting results are presented below.
In CST tests, the polymer dosage is mixed with sludge for a certain period of time when
flocs are formed and CST is measured. In the experiment, the CST reaches a minimum
value , indicating efficient release of free water from the sludge particles, and these val-
ues are of the main interest. The lower the minimum CST is, the better polymer floccu-
lates after the respective mixing time. Minimum CST is recorded at the end of the min-
imum CST region in the CST curve. After minimum CST flocs resist the continuing
mixing, and the formed flocs get broken. The lower the minimum CST is and the longer
time the minimum CST is kept, the better the polymer works.
4.1 CST test with four polymer products
The data presented in the figure 14, describes four different polymer products tested
with the CST method described earlier. These polymer products differ only a little from
each other by their cationity level and molecular size. Under low shear forces, with rota-
tion speed 1000 rpm and mixing time 15 s, all four polymers seem to react similarly.
Product B seems to reach lower CST time (20 s) in the beginning as the others reach
results between 35 and 40 s. When the shear forces are raised up, product B seem to
succeed the best, since its CST time stays lowest and also its minimum CST time is kept
the longest. Thus Product B works the best of these polymer products.
FIGURE 14. CST test results with four polymer products.
Lasse Kyllönen, Municipal&Industry 10/15/2012 13
Product A Product B Product C Product D

24
4.2 CST test with ageing sludge
In the following figure, CST tests with two polymer products A and D are performed
with the same ageing sludge. Both products were tested on three consecutive days. Pa-
rameters for the test are same as for the previous one: blue line 15 s, 1000 rpm, red line
30 s 1500 rpm, green line 60 s 1500 rpm and violet 90 s 1500 rpm. In this experiment,
there are no clear differences with the test results between three consecutive days. CST
test results vary within the shear forces, but it’s hard to see a significant, linear change
in the CST curve between the three days. Therefore, based on this test, the sludge
doesn’t change in an explicable way affecting the CST results during three consecutive
days.
FIGURE 15. CST test results with ageing sludge.
Product A, day 1 Product A, day 2 Product A, day 3
Product D, day 1 Product D, day 2 Product D, day 3
25
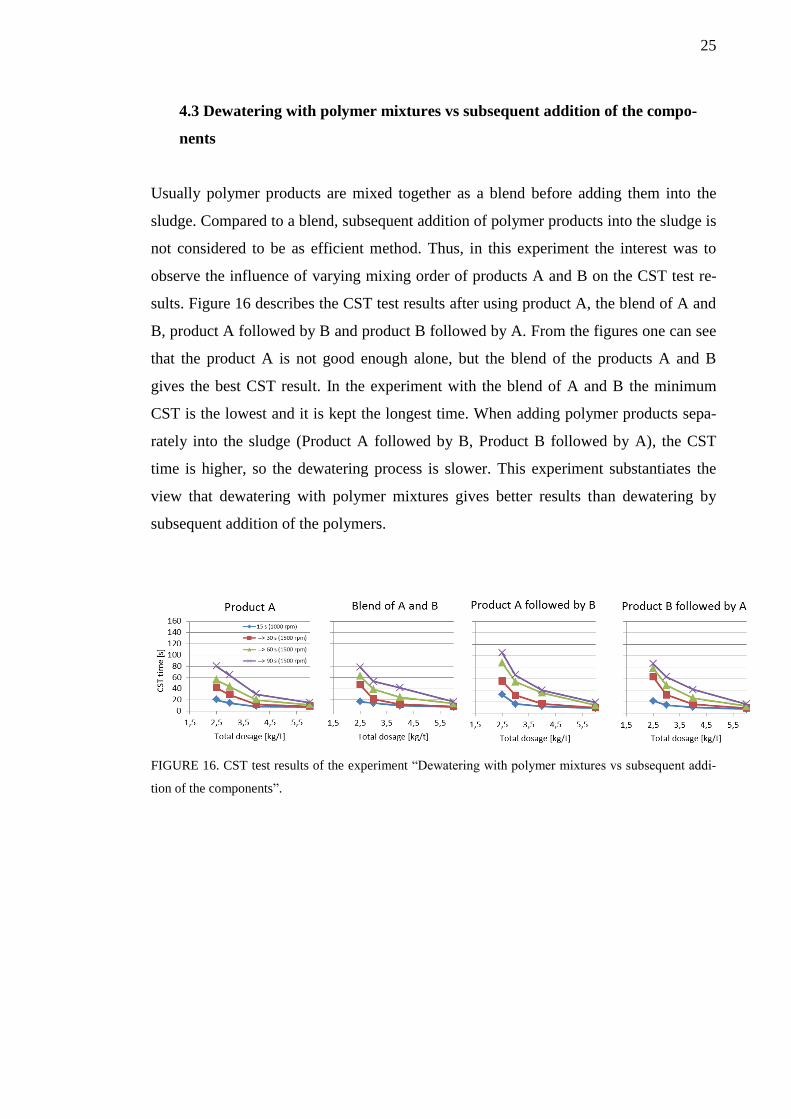
4.3 Dewatering with polymer mixtures vs subsequent addition of the compo-
nents
Usually polymer products are mixed together as a blend before adding them into the
sludge. Compared to a blend, subsequent addition of polymer products into the sludge is
not considered to be as efficient method. Thus, in this experiment the interest was to
observe the influence of varying mixing order of products A and B on the CST test re-
sults. Figure 16 describes the CST test results after using product A, the blend of A and
B, product A followed by B and product B followed by A. From the figures one can see
that the product A is not good enough alone, but the blend of the products A and B
gives the best CST result. In the experiment with the blend of A and B the minimum
CST is the lowest and it is kept the longest time. When adding polymer products sepa-
rately into the sludge (Product A followed by B, Product B followed by A), the CST
time is higher, so the dewatering process is slower. This experiment substantiates the
view that dewatering with polymer mixtures gives better results than dewatering by
subsequent addition of the polymers.
FIGURE 16. CST test results of the experiment “Dewatering with polymer mixtures vs subsequent addi-
tion of the components”.

26
4.4 Determination of optimum blending ratio
The test was performed for investigating an optimum blending ratio for products A and
B. Products A and B differ from each other by their charge, molecular weight and struc-
turing. The objective here is to combine the benefits of both products, bringing them
together in a new product.
During blending from product A to product B, the flock strengths for blends c, d, e and f
revealed to be close to each other. Blends d and e give interestingly very similar results.
To see more differences between blends c, d and e, and to understand their characteris-
tics, it’s worth continuing studies with these mixtures. These kinds of tests give valuable
information about product characteristics, and how product characteristics of two differ-
ent products appear in their combinations.
FIGURE 17. CST test results, when blending from product A to product B.
Product A was mixed with Product B in following rations:
a) Product A
b) Product B/ Product A -20%
c) Product B/ Product A -50%
d) Product B/ Product A -70%
e) Product B/ Product A -90%
f) Product B
a) b) c)
d) e) f)

27
4.5 Polytest with two polymer products
The polytest method was applied to investigate the optimal polymer dose for dewater-
ing. In this experiment, two different polymer products A and B were tested with Poly-
test funnel to find out dewatering times for three polymer portions.
First a sludge sample was mixed with polymer using an electric mixer; the rotation time
was 1500rpm, and the mixing times were 15, 30 and 60s. The portion of the products
were 4, 6 and 7,5 kg/t. The sludge sample was filtered via filtration funnel for 30s, and
during this time the filtration time (dewatering, s) was being measured.
According to the figure 18, polymer portion 4 kg/t for products A and B is probably too
low, since differences between dewatering times after varying mixing times didn’t come
out. Polymer portions 6 kg/t and 7,5 kg/t again give significantly different results. To
investigate flock strength and dewatering with products A and B further, it’s beneficial
to use polymer doses 6 kg/t and 7,5 kg/t and doses greater to these.
FIGURE 18. Polytest with polymer products A and B.
a) Product A, 4 kg/t
b) Product A, 6 kg/t
c) Product A, 7,5 kg/t
d) Product B, 4 kg/t
e) Product B, 6 kg/t
f) Product B, 7,5 kg/t
a) b) c)
d) e) f)

28
5 CONCLUSIONS
Three instrumental techniques, CST test, Polytest and centrifugal filtration were used
for determination of the polymeric sludge dewatering ability. Based to several tests that
have been run during this experiment, CST test succeeded to point out flock strength
properties the best. It was also confirmed that dewatering with polymer blends gives
better results than dewatering by subsequent addition of the polymers into the sludge.
Determining an optimal blending ratio for two different polymer products is an interest-
ing test, but also challenging and time-consuming; after selecting polymer dosages and
blending rations for the first test, one will continue tests by changing one parameter at a
time and by comparing test results.
The tests run during this research work give valuable information for further studies to
find out right polymer products and their doses, while maximizing the separation of
water from the flock. Centrifugal dewatering of digested sludge is a complex process,
and right polymer dosages for each sludge type can be found by continuous monitoring
and measuring.

29
6 REFERENCES
Binnie C, Kimber M, Smethurst G, 2002. Basic water treatment. London: Thomas Tel-
ford Publishing.
Gregory John 2006. Particles in water, properties and processes. London: IWA Pub-
lishing.
Lohiniva E, Mäkinen T & Sipilä K, 2001. Lietteiden käsittely. Uudet ja käytössä olevat
tekniikat. Valtion teknillinen tutkimuskeskus. VTT Tiedote 2081. Espoo: Valtion teknil-
linen tutkimuskeskus. Read 7.9.2012.
http://www.vtt.fi/inf/pdf/tiedotteet/2001/T2081.pdf
Pöyry Environment Oy 2007. Lietteenkäsittelyn nykytila Suomessa ja käsittelymene-
telmien kilpailukyky. Suomen itsenäisyyden juhlarahasto (Sitra). Read 12.9.2012.
http://www.sitra.fi/julkaisu/2011/lietteenkasittelyn-nykytila-suomessa-ja-
kasittelymenetelmien-kilpailukyky-selvitys
R. Castelnuovo 2005. Read 16.4.2013.
http://commons.wikimedia.org/wiki/File:Dec_Cen.png
Spencer Davies Peter 2005. The Biological Basis of Wastewater Treatment. Read
8.10.2012.
http://bartec-benke.nl/media/1000154/thebiologicalbasisofwastewatertreatment.pdf
SSWM, Sustainable Sanitation and Water management. Read 15.11.2012.
http://www.sswm.info/category/implementation-tools/wastewater-
treatment/hardware/sludge-treatment/mechanical-dewatering
Turovskiy Izrail S & Mathai P.K. 2006. Wastewater sludge processing. New Jersey:
John Wiley & Sons.
Viitanen, Anna-Kristiina 2006. Methods for testing polymers for dewatering. Research
report. Kemira, Oulu research centre.
WasteWater System 2009. Read 15.11.2012
http://www.wastewatersystem.net/2010/10/application-performance-of-belt-filter.html
Wikiwayman 2009. Read 16.4.2013
http://commons.wikimedia.org/wiki/File:BeltPress.svg

30
APPENDICES
Appendix 1. Wastewater treatment process at Suomenoja.
http://www.hsy.fi/vesi/Documents/J%C3%A4tevedenpuhdistus/Wastewater_treatment_
process_Suomenoja.pdf. Read 17.9.2012