labour market assessment 2014 - canada.ca
TRANSCRIPT

1
Labour Market Assessment 2014
Ottawa, Canada March 25, 2014
www.pbo-dpb.gc.ca

Labour Market Assessment 2014
i
Prepared by: Randall Bartlett and Helen Lao* __________________________________________________________________________________________
* The authors thank Mostafa Askari, Patricia Brown, Jason Jacques, Jean-François Nadeau, Jocelyne Scrim, and Trevor Shaw for their helpful comments. Any errors or omissions are the responsibility of the authors. Please contact Mostafa Askari (e-mail: [email protected]) for further information.
The mandate of the Parliamentary Budget Officer (PBO) is to provide independent analysis to Parliament on the state of the nation’s finances, the government’s estimates and trends in the Canadian economy; and upon request from a committee or parliamentarian, to estimate the financial cost of any proposal for matters over which Parliament has jurisdiction. The following report was prepared based on data available as of March 25, 2014.

Labour Market Assessment 2014
ii
Summary
This report provides parliamentarians with an assessment of the current state of the Canadian labour market by examining labour market indicators relative to trend, trends in wages and compensation, and the evidence of labour shortages and skills mismatches. Overall, the Parliamentary Budget Officer (PBO) finds that most labour market indicators remain below trend, although continue to recover from the 2008-09 recession. The weakness in the labour market is also reflected in the modest growth in wages and compensation over the recovery. In an attempt to explain the continued weakness in the labour market, PBO examined indicators of labour shortages and skills mismatches but found little evidence in support of a national labour shortage or skills mismatch in Canada. Trends in the Canadian Labour Market The Canadian labour market continues to recover from the 2008-09 global recession, as demonstrated by the improvement in most labour market indicators since the release of PBO’s October 2012 labour market assessment.1 However, most indicators remain below trend, including average weekly hours worked and the employment rate (Summary Figure 1). This contributes to a level of real output below trend and, hence, a negative output gap2, pointing to continued excess capacity in the Canadian labour market, and the Canadian economy more broadly. This said, most indicators do not appear to be broadly out of line when compared to past recoveries, although average weekly hours worked remains comparatively weaker than trend while unemployment remains elevated.
1 PBO (2012). http://www.pbo-
dpb.gc.ca/files/files/Labour_Note_EN.pdf. 2 The output gap is the per cent difference between the actual
and trend real output.
Summary Figure 1
Summary of Labour Market Indicators, 2013Q4
per cent, unless otherwise indicated
Sources: Office of the Parliamentary Budget Officer; Statistics Canada. Note: Labour market indicators are expressed relative to trend. The employment rate, participation rate, and unemployment rate are expressed as the percentage point difference from trend. Trend estimates used in this analysis are from PBO (2013).
Trends in Wages and Compensation Reflecting this weakness, growth in wages and compensation remained muted over the recovery, as is broadly illustrated by the modest growth in real average wages and stagnation in real median wages since the 2008-09 recession (Summary Figure 2). This is further borne out by a general weakness in real average wage growth across most industries relative to a comparable pre-recession period.
0.2
0.0
-0.2
-0.6
0.0
-0.6
-1.0
-2.0 -1.5 -1.0 -0.5 0.0 0.5 1.0
unemployment rate
participation rate
employment rate
average hours
employment
labour input
PBO output gap
Higher than trend
Canada's Labour Market
Lower than trendCanada's Macroeconomy

Labour Market Assessment 2014
iii
Summary Figure 2
Real Hourly Wages, 2006Q1 to 2013Q4
2002 dollars per hour
Sources: Office of the Parliamentary Budget Officer; Statistics Canada. Note: PBO seasonally adjusted these series using the Census X12 approach. Total CPI inflation is used as the deflator.
Trends in Labour Demand and Supply In an attempt to explain the continued weakness in the labour market, PBO also examined evidence of labour shortages and skills mismatches. Specifically, there is little evidence to suggest a national labour shortage exists in Canada (Summary Figure 3-3), although there appear to be regional and sectoral pockets of labour market tightness (for example, in the case of Saskatchewan). Further, while some skills mismatch is normal, 3 there is no evidence in support of a more acute national skills mismatch today than prior to the 2008-09 recession, although the aggregate numbers may obscure what is occurring in some regions and sectors. These conclusions are based on the lower job vacancy rates and higher unemployment rates nationally and generally across most provinces and sectors relative to pre-recession levels.
3 Some skills mismatch is normal due to, for example,
technological change rendering some skills obsolete.
Summary Figure 3
Business Outlook Suvey Labour Shortages and PBO Output Gap, 1998Q4 to 2013Q4
per cent per cent
Sources: Office of the Parliamentary Budget Officer; Bank of Canada; Statistics Canada.
Discussion of the Government of Canada’s Labour Market Analysis Finally, while the Government of Canada’s analysis of the Canadian labour market, entitled Jobs Report: The State of the Canadian Labour Market, is welcome, there may be areas for improving the relevance of such analysis for parliamentarians, such as:
Analyzing labour market indicators relative to
trend to determine whether the evolution of
the indicators is the result of business cycles or
structural factors;
Comparing labour market indicators against
past recoveries to provide historical context;
Analyzing indicators over consistent time
periods, as examining different time periods
could portray different results;
Discussing wages in the context of the state of
the labour market as it indicates capacity; and
Providing international comparisons of indicators determined on a comparable basis.
15
16
17
18
19
20
15
16
17
18
19
20
2006Q1 2007Q2 2008Q3 2009Q4 2011Q1 2012Q2 2013Q3
Average
Median
-5
-4
-3
-2
-1
0
1
2
3
4
5
0
10
20
30
40
50
60
70
80
1998Q4 2000Q4 2002Q4 2004Q4 2006Q4 2008Q4 2010Q4 2012Q4
BOS - labour shortages (left axis)BOS - 1998Q4-2008Q3 average (left axis)PBO output gap (right axis)
Labour Market Assessment 2014
1
1. Trends in the Canadian Labour Market
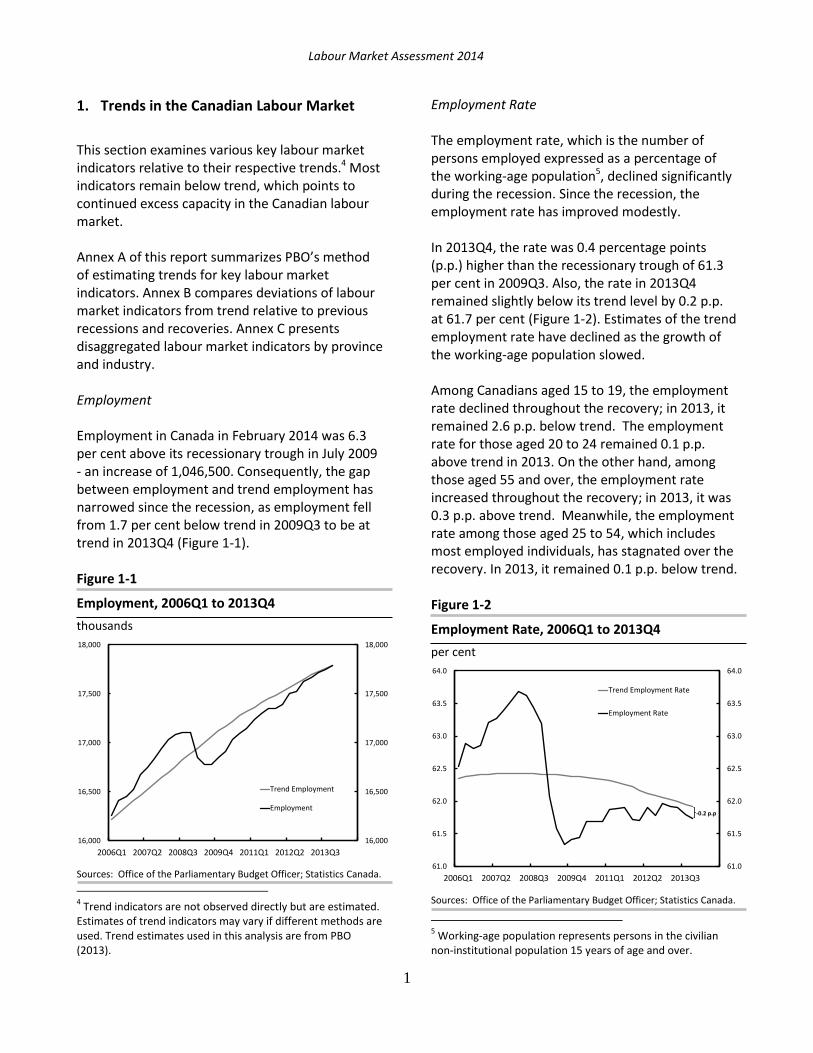
This section examines various key labour market indicators relative to their respective trends.4 Most indicators remain below trend, which points to continued excess capacity in the Canadian labour market. Annex A of this report summarizes PBO’s method of estimating trends for key labour market indicators. Annex B compares deviations of labour market indicators from trend relative to previous recessions and recoveries. Annex C presents disaggregated labour market indicators by province and industry. Employment Employment in Canada in February 2014 was 6.3 per cent above its recessionary trough in July 2009 - an increase of 1,046,500. Consequently, the gap between employment and trend employment has narrowed since the recession, as employment fell from 1.7 per cent below trend in 2009Q3 to be at trend in 2013Q4 (Figure 1-1). Figure 1-1
Employment, 2006Q1 to 2013Q4
thousands
Sources: Office of the Parliamentary Budget Officer; Statistics Canada.
4 Trend indicators are not observed directly but are estimated.
Estimates of trend indicators may vary if different methods are used. Trend estimates used in this analysis are from PBO (2013).
Employment Rate The employment rate, which is the number of persons employed expressed as a percentage of the working-age population5, declined significantly during the recession. Since the recession, the employment rate has improved modestly. In 2013Q4, the rate was 0.4 percentage points (p.p.) higher than the recessionary trough of 61.3 per cent in 2009Q3. Also, the rate in 2013Q4 remained slightly below its trend level by 0.2 p.p. at 61.7 per cent (Figure 1-2). Estimates of the trend employment rate have declined as the growth of the working-age population slowed. Among Canadians aged 15 to 19, the employment rate declined throughout the recovery; in 2013, it remained 2.6 p.p. below trend. The employment rate for those aged 20 to 24 remained 0.1 p.p. above trend in 2013. On the other hand, among those aged 55 and over, the employment rate increased throughout the recovery; in 2013, it was 0.3 p.p. above trend. Meanwhile, the employment rate among those aged 25 to 54, which includes most employed individuals, has stagnated over the recovery. In 2013, it remained 0.1 p.p. below trend. Figure 1-2
Employment Rate, 2006Q1 to 2013Q4
per cent
Sources: Office of the Parliamentary Budget Officer; Statistics Canada.
5 Working-age population represents persons in the civilian
non-institutional population 15 years of age and over.
16,000
16,500
17,000
17,500
18,000
16,000
16,500
17,000
17,500
18,000
2006Q1 2007Q2 2008Q3 2009Q4 2011Q1 2012Q2 2013Q3
Trend Employment
Employment
61.0
61.5
62.0
62.5
63.0
63.5
64.0
61.0
61.5
62.0
62.5
63.0
63.5
64.0
2006Q1 2007Q2 2008Q3 2009Q4 2011Q1 2012Q2 2013Q3
Trend Employment Rate
Employment Rate
-0.2 p.p
Labour Market Assessment 2014
2
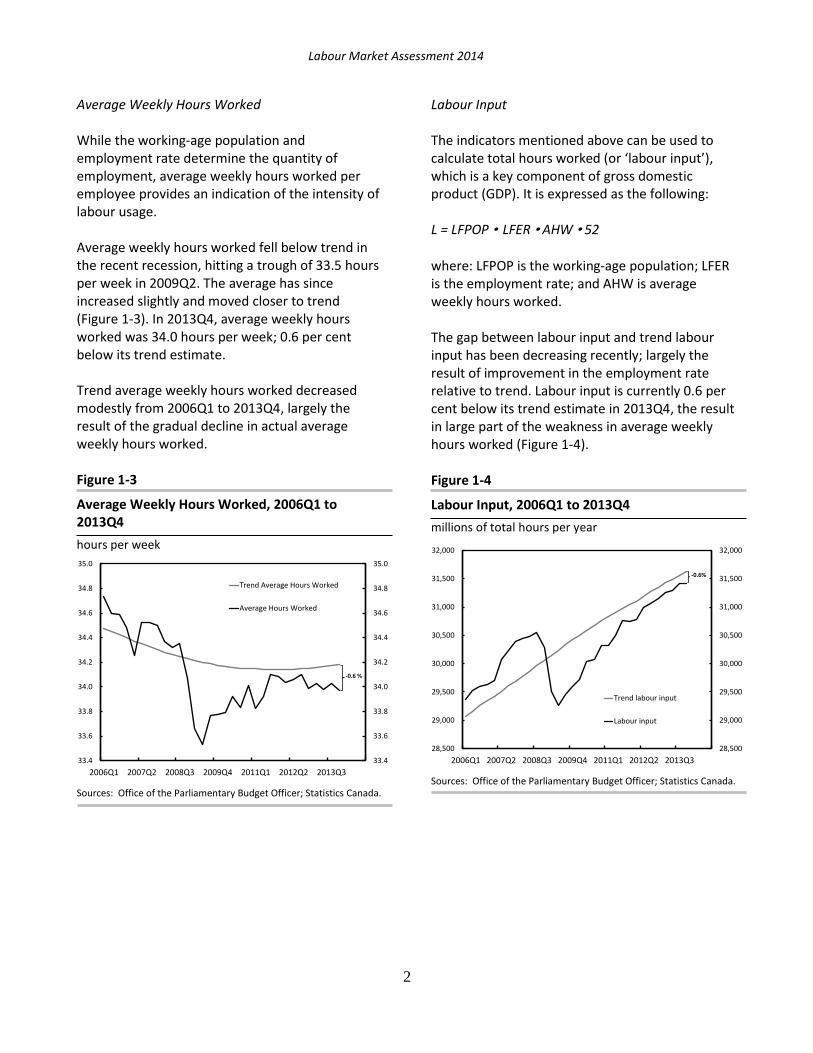
Average Weekly Hours Worked While the working-age population and employment rate determine the quantity of employment, average weekly hours worked per employee provides an indication of the intensity of labour usage. Average weekly hours worked fell below trend in the recent recession, hitting a trough of 33.5 hours per week in 2009Q2. The average has since increased slightly and moved closer to trend (Figure 1-3). In 2013Q4, average weekly hours worked was 34.0 hours per week; 0.6 per cent below its trend estimate. Trend average weekly hours worked decreased modestly from 2006Q1 to 2013Q4, largely the result of the gradual decline in actual average weekly hours worked. Figure 1-3
Average Weekly Hours Worked, 2006Q1 to 2013Q4
hours per week
Sources: Office of the Parliamentary Budget Officer; Statistics Canada.
Labour Input The indicators mentioned above can be used to calculate total hours worked (or ‘labour input’), which is a key component of gross domestic product (GDP). It is expressed as the following: L = LFPOP • LFER • AHW • 52 where: LFPOP is the working-age population; LFER is the employment rate; and AHW is average weekly hours worked. The gap between labour input and trend labour input has been decreasing recently; largely the result of improvement in the employment rate relative to trend. Labour input is currently 0.6 per cent below its trend estimate in 2013Q4, the result in large part of the weakness in average weekly hours worked (Figure 1-4). Figure 1-4
Labour Input, 2006Q1 to 2013Q4
millions of total hours per year
Sources: Office of the Parliamentary Budget Officer; Statistics Canada.
33.4
33.6
33.8
34.0
34.2
34.4
34.6
34.8
35.0
33.4
33.6
33.8
34.0
34.2
34.4
34.6
34.8
35.0
2006Q1 2007Q2 2008Q3 2009Q4 2011Q1 2012Q2 2013Q3
Trend Average Hours Worked
Average Hours Worked
-0.6 %
28,500
29,000
29,500
30,000
30,500
31,000
31,500
32,000
28,500
29,000
29,500
30,000
30,500
31,000
31,500
32,000
2006Q1 2007Q2 2008Q3 2009Q4 2011Q1 2012Q2 2013Q3
Trend labour input
Labour input
-0.6%

Labour Market Assessment 2014
3
Participation Rate The participation rate, defined as the labour force 6 (which can be thought of as the population willing to work) relative to working-age population, has declined since its pre-recession peak of 67.7 per cent in 2008Q1. In 2013Q4, the participation rate remained below its pre-recession peak level at 66.4 per cent (Figure 1-5). However, the participation rate also reached its trend estimate in 2013Q4. This was largely due to falling trend participation rate estimates as a result of a slowdown in growth of the working-age population over time. Among Canadians aged 15 to 19, the participation rate declined throughout the recovery; in 2013, it was 1.9 p.p. below its trend. On the other hand, the rate for those aged 55 and above increased during the same period, and was 0.3 p.p. above trend in 2013. Among individuals aged 20 to 24 and 25 to 54, which includes most people in the labour force, participation rates remained broadly at trend in 2013. Figure 1-5
Participation Rate, 2006Q1 to 2013Q4
per cent
Sources: Office of the Parliamentary Budget Officer; Statistics Canada.
6 Labour force is defined as the number of civilian, non-
institutionalized persons 15 years of age and over who, during the reference week, were employed or unemployed and actively seeking work.
Unemployment Unemployment is defined as the number of persons who are without work but who are actively looking for work.7 In the recent recession, unemployment increased by about 479,000 from October 2008 to August 2009 to nearly 1.6 million. Unemployment was 21.7 per cent above its trend estimate in 2009Q3. Since then, the gap between unemployment and trend unemployment has narrowed significantly, falling to about 3.9 per cent above trend in 2013Q4. Unemployment in 2013Q4 stayed around 1.3 million, about 21 per cent (or 234,500 people) above its pre-recession level in 2008Q3 (Figure 1-6). Figure 1-6
Unemployment, 2006Q1 to 2013Q4
thousands
Sources: Office of the Parliamentary Budget Officer; Statistics Canada.
7 Strictly speaking, the unemployed were available for work
during the reference week — the week with the 15th day of the month — but were not working in paid employment. The unemployed also includes those with a job but who were on temporary layoff and those who had a job to start within the next four weeks. This report does not specifically analyze people who are not working and are not looking for work (non-participants in the labour force). However, they are included in working age population.
66.0
66.5
67.0
67.5
68.0
66.0
66.5
67.0
67.5
68.0
2006Q1 2007Q2 2008Q3 2009Q4 2011Q1 2012Q2 2013Q3
Trend Participation Rate
Participation rate1,000
1,100
1,200
1,300
1,400
1,500
1,600
1,700
1,000
1,100
1,200
1,300
1,400
1,500
1,600
1,700
2006Q1 2007Q2 2008Q3 2009Q4 2011Q1 2012Q2 2013Q3
Trend Unemployment
Unemployment
3.9 %

Labour Market Assessment 2014
4
It is worth noting that even if the level of unemployment was to be at trend (cyclical unemployment is zero), some unemployment would still exist because of two factors. The first is the search time required to find a job upon becoming unemployed (frictional unemployment). The second is structural changes that occur in the economy over time (structural unemployment) as a result, for example, of the introduction of new technologies leading to mismatches between the skills of displaced workers and the skills required by employers. Unemployment Rate
The unemployment rate, which is the level of unemployment as a percentage of labour force, is an important indicator of labour market slack. As was the case with unemployment, the unemployment rate declined over the recovery, from the peak of 8.5 per cent in 2009Q3 to 7.0 per cent in 2013Q4. The unemployment rate has moved closer to trend since then, from 1.5 p.p. above trend in 2009Q3 to 0.2 p.p. in 2013Q4 (Figure 1-7). Figure 1-7
Unemployment Rate, 2006Q1 to 2013Q4
per cent
Sources: Office of the Parliamentary Budget Officer; Statistics Canada.
In 2013, the unemployment rate was 1.8 p.p. above trend among Canadians aged 15 to 19, while the unemployment rate for those aged 20 to 24 was 0.2 p.p. below trend in 2013. Meanwhile, among individuals aged 25 to 54, the unemployment rate was 0.1 p.p. above trend in 2013. For individuals aged 55 and over, the unemployment rate is 0.1 p.p. below trend in 2013. Supplementary Unemployment Rate
Statistics Canada provides a broader look at the unemployment situation in Canada by calculating alternative unemployment rates, such as the ‘R8’ unemployment rate.8 This rate is generally referred to as the labour underutilization rate. It combines the unemployed with discouraged searchers, those waiting for recalls, long-term future starts, and a portion of involuntary part-time workers. As a result, the ‘R8’ unemployment rate is the highest of all the unemployment rate measures. In 2009Q3, the R8 unemployment rate peaked at 11.8 per cent; by 2013Q4, it had declined to 10.1 per cent (Figure 1-8). The official unemployment rate has been 3.2 p.p., on average, below the labour underutilization rate throughout the recession and recovery.9
8 http://www.statcan.gc.ca/pub/75-001-
x/2011001/article/11410-eng.htm#a3. 9 The R8 unemployment rate was, on average, 2.7 p.p. higher
than the official unemployment rate from 2006Q1 to 2009Q2.
5.5
6.0
6.5
7.0
7.5
8.0
8.5
9.0
5.5
6.0
6.5
7.0
7.5
8.0
8.5
9.0
2006Q1 2007Q2 2008Q3 2009Q4 2011Q1 2012Q2 2013Q3
Trend Unemployment Rate
Unemployment Rate
0.2 p.p

Labour Market Assessment 2014
5
Figure 1-8
Unemployment and Labour Underutilization Rates, 2006Q1 to 2013Q4
per cent
Sources: Office of the Parliamentary Budget Officer; Statistics Canada. Note: PBO seasonally adjusted the ‘R8’ series using the Census X12 approach.
Canada-U.S. Unemployment Rate Comparison Statistics Canada also calculates the Canadian unemployment rate to match the definition of the U.S. unemployment rate (the ‘R3’), allowing comparison between the two countries. In 2009Q4, the U.S. unemployment rate peaked at 9.9 per cent, while during the same quarter the Canadian ‘R3’ unemployment rate peaked at 7.6 per cent. Unemployment rates have declined in both countries since the recession. In 2013Q4, the U.S. unemployment rate was an estimated 7.0 per cent, while Canada’s ‘R3’ rate was 6.1 per cent (Figure 1-9).10
10
For more information on the state of the U.S. labour market, see CBO (2014).
Figure 1-9
Canada and U.S. Unemployment Rates, 2006Q1 to 2013Q4
per cent
Sources: Office of the Parliamentary Budget Officer; Statistics Canada. Note: PBO seasonally adjusted the ‘R3’ series using the Census X12 approach.
International Comparison The Organization for Economic Cooperation and Development (OECD) produces harmonized unemployment rates, which are useful tools for cross-country comparison of unemployment rate.11 According to the OECD, the harmonized unemployment rate for Canada has decreased steadily since the recession. It is currently equal to the G7 and the United States at 7.0 per cent (Figure 1-10)12.
11
Methodology of compiling the OECD harmonized unemployment rate is available at: http://www.oecd.org/employment/labour-stats/44743407.pdf 12
OECD harmonized unemployment rate for G7 is based on the assumption that the December rate is equivalent to its November value.
5
6
7
8
9
10
11
12
5
6
7
8
9
10
11
12
2006Q1 2007Q2 2008Q3 2009Q4 2011Q1 2012Q2 2013Q3
Official unemployment rate
R8
4
5
6
7
8
9
10
4
5
6
7
8
9
10
2006Q1 2007Q2 2008Q3 2009Q4 2011Q1 2012Q2 2013Q3
Canada (adjusted to U.S.methodology)United States
Canada (official rate)

Labour Market Assessment 2014
6
Figure 1-10
Harmonized Unemployment Rates, 2006Q1 to 2013Q4
per cent
Sources: OECD; Office of the Parliamentary Budget Officer.
2. Trends in Wages and Compensation Wages tend to be suppressed in times when the number of available workers exceeds the number of available jobs.13As a reflection of excess capacity in the labour market, growth in wages and compensation remained modest over the recovery, with real average wage growth lower after the recession than before the recession across most industries.
Nominal wages increased through the recession and recovery (Figure 2-1). However, average real wages stagnated during the recession, while median real wages continued to grow until 2010Q1 (Figure 2-2). Since 2010Q1, average real wages have increased, while median real wages stagnated. In 2013Q4, the real median hourly wage was approximately equivalent to the level in 2010Q4, suggesting the real purchasing power of workers has remained roughly unchanged since then.
13 PBO does not estimate trend levels of wage and compensation indicators.
The gap between real median and average wages has increased since the beginning of the recovery. The gap was widest in 2013Q4, rising from about $2.17 per hour in 2006Q1 to $2.86 per hour. This indicates that the growth in real wages was concentrated in the upper half of the wage distribution. Figure 2-1
Nominal Hourly Wages, 2006Q1 to 2013Q4
dollars per hour
Sources: Office of the Parliamentary Budget Officer; Statistics Canada. Note: PBO seasonally adjusted these series using the Census X12 approach.
Figure 2-2
Real Hourly Wages, 2006Q1 to 2013Q4
2002 dollars per hour
Sources: Office of the Parliamentary Budget Officer; Statistics Canada. Note: PBO seasonally adjusted these series using the Census X12 approach. Total CPI inflation is used as the deflator.
4
5
6
7
8
9
10
4
5
6
7
8
9
10
2006Q1 2007Q2 2008Q3 2009Q4 2011Q1 2012Q2 2013Q3
Canada
U.S.
G7
16
18
20
22
24
26
16
18
20
22
24
26
2006Q1 2007Q2 2008Q3 2009Q4 2011Q1 2012Q2 2013Q3
Average
Median
15
16
17
18
19
20
15
16
17
18
19
20
2006Q1 2007Q2 2008Q3 2009Q4 2011Q1 2012Q2 2013Q3
Average
Median

Labour Market Assessment 2014
7
At the industry level, most industries experienced lower average growth in real average hourly wages after the recession than before the recession, further supporting the notion of continued slack in the labour market (Table 2-1). In contrast, an increase in real wages would be expected if industries were facing labour shortages or skill mismatches. Although certain industries such as forestry, fishing, mining, oil and gas and professional, scientific and technical services currently show higher average real wage growth than other industries, they showed the same pattern in the pre-recession period. Table 2-1
Average Quarterly Growth in the Real Average Hourly Wage
per cent
Sources: Office of the Parliamentary Budget Officer; Statistics Canada. Note: PBO seasonally adjusted wage data using the Census X12 approach. Total CPI inflation is used as the deflator.
Further, real wages would be expected to increase as labour productivity increases because of the greater real output to each hour worked. However, after experiencing gains through the 2008-09 recession, the real total compensation rate14 broadly stagnated through the recovery while labour productivity15 continued to increase (Figure 2-3). 16 However, examining these measures over a longer period, growth in labour productivity has outpaced growth in the real total compensation rate since the mid-1990s (Figure 2-4). The weaker growth in real compensation relative to productivity explains, at least in part, the trend decline in wages and salaries as a share of nominal GDP over the past 30 years (Figure 2-5).
Figure 2-3
Real Total Compensation Rate and Labour Productivity, 2006Q1 to 2013Q4
index, 2006Q1=100
Sources: Office of the Parliamentary Budget Officer; Statistics Canada.
14
According to Statistics Canada, the total compensation for all jobs consists of all payments in cash or in kind made by domestic producers to workers for services rendered. It includes the salaries and supplementary labour income of paid workers, plus an imputed labour income for self-employed workers. The total compensation rate refers to total compensation per hour worked, while the real total compensation rate refers to the total compensation rate deflated by GDP inflation. 15
Labour productivity is defined as real output per hour worked. Labour productivity data is taken from Statistics Canada’s indexes of labour productivity and related variables. 16
The sharp increase in the real total compensation rate during the recession in part reflected the sharp decline in GDP inflation and total hours worked.
2004Q1-2008Q3 2009Q3-2013Q4
Goods Sector 0.3 0.1
Agriculture 0.6 0.0
Construction 0.3 0.1
Forestry, fishing, mining, oil and gas 0.5 0.4
Manufacturing 0.2 0.0
Utilities 0.2 0.1
Services Sector 0.3 0.1
Trade 0.2 0.1
Transportation and warehousing 0.2 0.1
Finance, insurance, real estate 0.4 0.2
Professional, scientific and technical services0.3 0.3
Business, building and other support services0.2 -0.1
Educational services 0.2 0.2
Health care and social assistance 0.2 0.0
Information, culture and recreation 0.1 0.1
Accommodation and food services 0.2 0.1
Other services 0.3 0.2
Public administration 0.2 0.2
96
98
100
102
104
106
108
96
98
100
102
104
106
108
2006Q1 2007Q2 2008Q3 2009Q4 2011Q1 2012Q2 2013Q3
Real total compensation rate
Labour productivity

Labour Market Assessment 2014
8
Figure 2-4
Real Total Compensation Rate and Labour Productivity, 1981Q1 to 2013Q4
index, 1981Q1=100
Sources: Office of the Parliamentary Budget Officer; Statistics Canada.
Figure 2-5
Wages and Salaries and Corporate Profits before Taxes, 1981Q1 to 2013Q4
per cent of GDP per cent of GDP
Sources: Office of the Parliamentary Budget Officer; Statistics Canada. Note: The Statistics Canada series used for corporate profits before taxes is v66462652 found in Table 380-0086.
3. Trends in Labour Demand and Supply In addition to the labour market indicators examined in Sections 1 and 2, other indicators also suggest that there is excess capacity in the Canadian labour market. Specifically, there is little evidence to suggest a national labour shortage exists in Canada, although there appears to be regional and sectoral pockets of labour market tightness. Further, there does not appear to be a more acute national skills mismatch in Canada than prior to the 2008-09 recession, although there may be exceptions in some regions and sectors. 17 However, a comparison with past recoveries is not possible due to data limitations. Box 1 provides definitions of some key concepts in this section.
17
This conclusion is supported by the work of TD Economics (2013), among others. http://www.td.com/document/PDF/economics/special/JobsInCanada.pdf.
90
100
110
120
130
140
150
90
100
110
120
130
140
150
1981Q1 1984Q4 1988Q3 1992Q2 1996Q1 1999Q4 2003Q3 2007Q2 2011Q1
Real Total Compensation Rate
Labour Productivity
0
5
10
15
20
25
30
30
35
40
45
50
55
1981Q1 1984Q4 1988Q3 1992Q2 1996Q1 1999Q4 2003Q3 2007Q2 2011Q1
Wages and salaries (left axis)
Corporation profits before taxes (right axis)
Key Concepts Labour Shortage is defined as an insufficient number of workers available to meet the number of available jobs (assuming the presence of some frictional and structural unemployment), independent of skill requirements. Skills Mismatch is defined as an insufficient number of workers with the needed skills available to satisfy the number of available jobs. It should be noted that some skills mismatch will always exist due to, for example, technological change rendering some skills obsolete.

Labour Market Assessment 2014
9
The Bank of Canada Business Outlook Survey (BOS)18 provides a measure of labour shortages, defined as the proportion of surveyed firms that respond affirmatively to the question: Does your firm face any shortages of labour that restrict your ability to meet demand? In the Winter 2013-14 BOS19, 26 per cent of firms stated that they faced labour shortages in 2013Q4 (see Figure 3-1). This was the 22nd consecutive quarter in which the proportion of firms experiencing labour shortages remained below the pre-recession average of 40.4 per cent20. It, therefore, suggests that no national labour shortage exists in Canada. According to the Bank of Canada, “instances of labour shortages were not widespread and were cited largely in relation to hiring for specific positions, skill sets or regions. In general, firms consider the intensity of labour shortages to be similar to the situation 12 months ago.” In fact, according to the BOS, the period of acute labour shortages in Canada occurred in the late-1990s, early-2000s. In addition, PBO’s estimate of the output gap closely follows the BOS measure of labour shortages during the period from 1998Q4 to 2013Q4, further supporting the assertion that there continues to be slack in the Canadian economy.21
18
The Business Outlook Survey summarizes interviews conducted by the Bank’s regional offices with the senior management of about 100 firms selected in accordance with the composition of Canada’s gross domestic product. The balance of opinion can vary between +100 and -100. 19
http://www.bankofcanada.ca/wp-content/uploads/2014/01/bos_winter2013.pdf. 20
The average is over the period 1998Q4-2008Q3. 21
The output gap in 2013Q4 was estimated to be -1.0 per cent.
Figure 3-1
Business Outlook Suvey Labour Shortages and PBO Output Gap, 1998Q4 to 2013Q4
per cent per cent
Sources: Office of the Parliamentary Budget Officer; Bank of Canada; Statistics Canada.
Additionally, the Canadian Federation of Independent Business (CFIB) also provides measures of labour shortages for both skilled and un/semi-skilled labour through its Business Barometer.22 According to the CFIB, 32.8 per cent of firms surveyed in 2013Q4 reported experiencing skilled labour shortages, while 16.5 per cent reported experiencing un/semi-skilled labour shortages. The CFIB further indicated that the shortage of skilled labour was an important limitation on sales or production growth, second only to insufficient domestic demand. Although these values were broadly in line with that of the BOS in 2013Q4, the short history of the CFIB data (beginning in 2009Q2) does not allow for comparison over the business cycle.
22
http://www.cfib-fcei.ca/cfib-documents/rr3319.pdf.
-5
-4
-3
-2
-1
0
1
2
3
4
5
0
10
20
30
40
50
60
70
80
1998Q4 2000Q4 2002Q4 2004Q4 2006Q4 2008Q4 2010Q4 2012Q4
BOS - labour shortages (left axis)BOS - 1998Q4-2008Q3 average (left axis)PBO output gap (right axis)

Labour Market Assessment 2014
10
Another indicator of labour market demand is the Help-Wanted Index (HWI) provided by the Conference Board of Canada (Figure 3-2). The index reached 87.7 in February 2014, surpassing its recessionary trough of 74.8 reached in March 2009 but remaining well below its pre-recession peak of 114.9 reached in July 2008.23 Figure 3-2
Conference Board of Canada Help-Wanted Index, September 2005 to February 2014
index, 2007 = 100
Source: Conference Board of Canada.
Figure 3-3 presents the year-over-year growth in the HWI over history, as a combination of the HWI published by Statistics Canada from January 1981 to April 200324,25 and the HWI published by the Conference Board of Canada from April 2005 to February 2014 26,27.
23
Annex D provides additional information on source specific methodological and data considerations. 24
http://www23.statcan.gc.ca/imdb-bmdi/document/2606_D2_T9_V1_B.pdf. 25
The quality of the Statistics Canada HWI was negatively impacted by movement away from paper based job postings toward the end of the sample period. 26
The method used by the Conference Board of Canada to calculate the HWI is similar to that used historically by Statistics Canada. However, one index may not be used to complete the other on a time series. The methodology for Statistics Canada's HWI can be found at the following link: http://www23.statcan.gc.ca/imdb/p2SV.pl?Function=getSurvey&SDDS=2606&Item_Id=890. 27
It should be noted that the number of websites used to determine the number of job vacancies has increased from 23
It is apparent from Figure 3-3 that, over history, growth in the HWI has closely tracked employment growth, and that the recent deceleration in employment growth has been closely mirrored by the deceleration in the growth of the HWI. Figure 3-3
Year-over-year Growth in the Help-Wanted Index and Employment, January 1982 to February 2014
per cent per cent
Sources: Office of the Parliamentary Budget Officer; Conference Board of Canada; Statistics Canada.
This indicates that growth in labour demand (as measured by the sum of employment and job vacancies) has also decelerated. Recent employment growth also appears to be more muted compared with past post-recession recoveries. The Conference Board of Canada also provides the ratio of the level of unemployment to the number of job vacancies, which outlines the number of Canadians available to work for each available job (Figure 3-4). 28,29
in 2005, 44 in 2006, 53 in 2007, 79 beginning in July 2009, to 80 today. This suggests that the number of job vacancies in earlier years may have been underestimated, thereby underestimating the HWI and job vacancy rate. Further, with the release of February 2014 data, the Conference Board of Canada adjusted the vacancy data collection methodology to reflect more accurately labour market trends. 28
The Conference Board of Canada refers to this ratio as the Indicator of Labour Market Tightness, where the level of
40
60
80
100
120
40
60
80
100
120
Sep 2005 Sep 2007 Sep 2009 Sep 2011 Sep 2013
-6
-4
-2
0
2
4
6
-80
-60
-40
-20
0
20
40
60
80
Jan 1982 Jan 1988 Jan 1994 Jan 2000 Jan 2006 Jan 2012
Help-Wanted Index (Statistics Canada) (left axis)
Help-Wanted Index (Conference Board of Canada) (left axis)
Employment (right axis)

Labour Market Assessment 2014
11
Figure 3-4
Unemployed-to-Vacancy Ratio, September 2005 to February 2014
ratio
Source: Conference Board of Canada.
According to this measure, the ratio of unemployed to job vacancies reached a peak of 4.6 in November 2009; by February 2014, it had declined steadily to 2.8, but remained above its pre-recession trough of 2.2 per cent reached in January 2008.30 This decline largely reflected a 41.3 per cent increase in the number of job vacancies from November 2009 to February 2014, although the level of unemployment also fell over this period, albeit by a more modest 13.4 per cent. Together, this suggests a substantial number of job vacancies remain unfilled despite the existing pool
unemployment is taken from Statistics Canada’s Labour Force Survey (LFS) (seasonally adjusted by Statistics Canada) and the number of vacancies is provided by WANTED Technologies (seasonally adjusted using the Census X12 method). 29
Statistics Canada also prepares a measure of unemployment to job vacancies, although it is only available from March 2011 to December 2013, and is calculated as the non-seasonally adjusted 3-month moving average of the monthly series. It is therefore of limited usefulness in drawing conclusions regarding capacity in the Canadian labour market. http://www23.statcan.gc.ca/imdb/p2SV.pl?Function=getSurvey&SDDS=5202&Item_Id=132635. 30
It must be noted that the smaller number of websites examined by WANTED Technologies early in the sample period may have biased the number of job vacancies downward.
of unemployed Canadians, pointing to a potential skills mismatch as opposed to a labour shortage. The job vacancy rate is a useful indicator of labour demand that remains unmet. It can be calculated using data provided by the Conference Board of Canada to derive the level of job vacancies in Canada. The rate is defined as job vacancies as a per cent of labour demand measured by the sum of employment and job vacancies. As illustrated in Figure 3-5, after reaching a recessionary trough of 1.9 per cent in November 2009, the job vacancy rate rose to 2.6 per cent in February 2014, but remained below its pre-recession peak of 2.8 per cent reached in July 2008. Meanwhile, the job vacancy rate determined using vacancy data from the CFIB also suggests that the private-sector job vacancy rate in Canada remains below its pre-recession peak, experiencing a trend broadly similar to that observed using Conference Board of Canada data.31,32 Much of the difference in the job vacancy rates in Figure 3-5 appears to reflect differences in methodology (see Annex D). Additionally, while duplicates are removed from the Conference Board of Canada data, the vacancy numbers may be higher than the CFIB’s because of the continued consolidation of job vacancy websites over time and the presence of some jobs that continue to be posted despite being filled. Also, some of the difference between the job vacancy rates could be explained by the absence of public-sector job vacancies in the CFIB data.
31
http://www.cfib-fcei.ca/cfib-documents/rr3324.pdf. 32
Statistics Canada also provides a measure of the job vacancy rate which suffers from similar problems as the ratio of unemployed-to-job vacancies.
2
3
4
5
6
7
2
3
4
5
6
7
Sep 2005 Sep 2007 Sep 2009 Sep 2011 Sep 2013
Conference Board of Canada

Labour Market Assessment 2014
12
Figure 3-5
Vacancy Rate, September 2005 to February 2014
per cent
Sources: Office of the Parliamentary Budget Officer; Conference
Board of Canada; CFIB; Statistics Canada. Note: The CFIB job vacancy rate is available on a quarterly basis through 2013Q4, whereas the job vacancy rate from the Conference Board of Canada is available on a monthly basis.
Finally, it is also worth noting that a higher portion of temporary foreign workers (TFWs) in the private sector could also be putting downward pressure on the private-sector job vacancy rate, as the presence of the Temporary Foreign Worker Program (TFWP) leaves labour demand broadly unaffected while reducing the number of job vacancies, thereby reducing the job vacancy rate. 33
While the impact of the TFWP on the job vacancy rate is uncertain, the impact may be substantial. For instance, in 2012, the increase in the number of Labour Market Opinion (LMO) confirmations was equivalent to 25.6 per cent of the increase in employment, despite total LMO confirmations representing only 1.1 per cent of the labour force.34
33
This analysis does not include a behavioral response of employers and the labour force to the presence of temporary foreign workers in the labour market. 34
Some LMO confirmations may not result in employment while some TFWs do not require LMO confirmations.
Particularly illustrative is the relationship between the job vacancy rate and the unemployment rate, known as the Beveridge curve. For instance, if the unemployment rate increases while the job vacancy rate remains unchanged, this would suggest an increase in the supply of available labour without a commensurate change in labour demand. As a result, this may indicate an excess supply of labour. In contrast, an increase in the job vacancy rate without a corresponding change in the unemployment rate may suggest a labour shortage. Further, an increase in the unemployment rate complemented by an increase in the job vacancy rate may indicate the presence of a skills mismatch, as an increase in vacancies remains unfilled despite an increase in unemployed, while a decline in the unemployment rate complemented by an increase in the job vacancy rate may indicate a labour shortage. In Figure 3-6, it is clear that there has been a shift in the Beveridge curve to the right, illustrating that the unemployment rate is higher at various levels of the job vacancy rate than was the case prior to the recent recession. This suggests that there was surplus labour during and after the 2008-09 recession. However, the Beveridge curve has begun to move up and to the left, as the job vacancy rate is rebounding, while the available supply of unemployed persons in the labour force is falling. That said, the job vacancy rate continues to remain below its pre-recession peak while the unemployment rate remains elevated. By comparison, the Beveridge curve constructed using CFIB job vacancy data also indicates that the private-sector job vacancy rate has stagnated recently along with the unemployment rate. Taken together, these results do not indicate the presence of a national labour shortage or skills mismatch in Canada, and instead point to continued excess capacity in the Canadian labour market (supporting the conclusions reached in
1.0
1.5
2.0
2.5
3.0
1.0
1.5
2.0
2.5
3.0
Sep 2005 Sep 2007 Sep 2009 Sep 2011 Sep 2013
Conference Board of Canada
CFIB

Labour Market Assessment 2014
13
Sections 1 and 2). This said, the lack of evidence of a national labour shortage or skills mismatch in Canada does not rule out regional- and sector-specific labour shortages or skills mismatches. Figure 3-6
Beveridge Curve, February 2006 to February 2014
job vacancy rate (per cent)
unemployment rate (per cent)
Sources: Office of the Parliamentary Budget Officer; Conference Board of Canada; Statistics Canada.
Examining regional relationships in job vacancy and unemployment rates by constructing provincial Beveridge curves, using data from the Conference Board of Canada, illustrates that the Atlantic Provinces, along with Quebec, Ontario, Manitoba, Alberta and British Columbia, continue to have a job vacancy rate at or below pre-recession levels, partnered with an unemployment rate at or above pre-recession levels. This suggests varying degrees of excess slack in the labour markets of these provinces. These results are broadly similar to those reached using CFIB data. 35,36 On the other hand, Saskatchewan has seen the job vacancy rate rebound accompanied by a broadly unchanged unemployment rate relative to pre-recession levels. This result suggests a potential
35
Annex E provides greater detail on provincial Beveridge curves. 36
It can be expected that, over time, some of the differences in provincial Beveridge curves will diminish as workers migrate across provinces.
labour shortage in Saskatchewan; a conclusion that is also supported by CFIB data. As a result, provincial data suggests that, with the exception of Saskatchewan, there are no other provinces experiencing more acute province-wide labour shortages or skills mismatches relative to before the 2008-09 recession. To examine industry-specific labour shortages and skills mismatches, PBO uses industry-specific private-sector only job vacancy rates from the CFIB to construct sectoral Beveridge curves.37 Overall, sectoral Beveridge curves illustrate that the goods-producing sector is generally subject to both higher job vacancy and unemployment rates, and also much larger cyclical changes, than is the case for the services-providing sector.38 More specifically, the Beveridge curves suggest that the goods-producing sector has broadly returned to similar levels of the job vacancy rate and unemployment rate compared with pre-recession levels, albeit at generally lower underlying levels of job vacancies, employment, unemployment and the labour force (Figure 3-7). The services-producing sector also appears to be returning to pre-recession job vacancy rates and unemployment rates, albeit it more slowly and at generally higher levels of job vacancies, employment, unemployment and the labour force than before the 2008-09 recession (Figure 3-8).
37
Industry-specific vacancy data is unavailable from the Conference Board of Canada and is beyond the resources of PBO to purchase from WANTED Technologies. 38
Annex F provides Beveridge curves for all major private-sector dominated industries.
1.5
2.0
2.5
3.0
1.5
2.0
2.5
3.0
5 6 7 8 9
Feb 2006
Feb 2008
Feb 2010
Feb 2012
Feb 2014

Labour Market Assessment 2014
14
Figure 3-7
Goods-Sector Beveridge Curve, 2004Q1 to 2013Q4
job vacancy rate (per cent)
unemployment rate (per cent)
Sources: Office of the Parliamentary Budget Officer; CFIB; Statistics Canada. Note: Figure 3-7 reflects the private sector only.
Figure 3-8
Services-Sector Beveridge Curve, 2004Q1 to 2013Q4
job vacancy rate (per cent)
unemployment rate (per cent)
Sources: Office of the Parliamentary Budget Officer; CFIB; Statistics Canada. Note: Figure 3-8 reflects the private sector only.
This evidence does not suggest a national labour shortage in either the private goods-producing or services-providing sectors. Further, sectoral job vacancy rates continue to broadly remain at or
below pre-recession levels in most private-sector dominated industries, although relative unemployment rate levels remain mixed. This suggests any national private-sector skills mismatch remains materially unchanged relative to before the 2008-09 recession. This conclusion is supported by the finding that real average wage growth has been relatively weaker in the post-recession period across major sectors of the economy, as a sectoral labour shortage or skills mismatch would be expected to be complemented by an increase in real average wage growth in that sector. While there does not appear to be a more acute national labour shortage or skills mismatch in Canada than before the recession, research by Desjardins and Rubenson (2011) and Statistics Canada (2011) suggest that there exists a mismatch between the measured literacy skills of the workers and the extent to which those literacy skills are used on the job, particularly among youth. More specifically, among the youngest age groups, there tends to be more people with medium to high literacy skills who have jobs that engage only medium-low literacy skills.39 PBO has conducted similar analysis using the latest Survey of Adults Skills (PIAAC) from the OECD and these results confirmed that the literacy skills are higher among younger age groups, on average, than are required by the jobs they engage in. Internationally, many advanced economies saw a similar evolution in their respective Beveridge curves to that of Canada during and following the 2008-09 recession. According to International Monetary Fund (IMF) (2012), these include the United States, Portugal, Spain, Sweden and the United Kingdom. Countries such as Australia, Austria, Belgium, France, Germany, Japan, the Netherlands, Norway and Switzerland remain roughly in line with their respective pre-2008 Beveridge curves.
39
http://www.statcan.gc.ca/pub/89-604-x/89-604-x2011001-eng.pdf.
1.5
2.0
2.5
3.0
3.5
1.5
2.0
2.5
3.0
3.5
5 6 7 8 9 10 11
2004Q1
2006Q1
2008Q1
2010Q1
2012Q1
2013Q4
1.0
1.5
2.0
2.5
1.0
1.5
2.0
2.5
3.5 4.0 4.5 5.0 5.5 6.0 6.5
2004Q1
2006Q1
2008Q1
2010Q1
2012Q1
2013Q4

Labour Market Assessment 2014
15
Examining the first five countries more closely, IMF (2012) found that “(w)hat emerges from a comparison of the evidence across countries and over time is a surprisingly consistent story. The displacement of a large part of the labor force during deep recessions results in mismatch in the labor market, which leads to a decline in measured match efficiency. This tends to be accompanied by a decline in the quits rate which partially offsets the effect of the reduction in match efficiency on the position of the Beveridge curve. The common policy response to reduce the burden of displacement for the unemployed by increasing the generosity and duration of unemployment insurance further contributes to the rightward shift of the Beveridge curve.” These same factors appear to have also contributed to the rightward shift in the Canadian Beveridge curve.40 That said, in the case of the United States, IMF (2012) found that recent studies indicate that the factors driving the shift in the Beveridge curve are mostly transitory. This may also be the case for Canada.
4. Discussion of the Government of Canada’s Labour Market Analysis Accompanying Budget 2014, the Department of Finance Canada released a report providing its analysis of the Canadian labour market, entitled Jobs Report: The State of the Canadian Labour Market (the ‘Jobs Report’). While this report is a welcome contribution to the national debate on the state of the Canadian labour market, there may be areas for improving the relevance of such analysis for parliamentarians.
40
Similar steady-state analysis for Canada, while possible, would likely not be fruitful due to the short duration of job vacancy data.
First, it is useful to examine labour market indicators relative to their respective trends, in order to determine whether the recent evolution of these measures is the result of changes in the business cycle or structural factors. However, the Jobs Report does not include a discussion of labour market indicators relative to their structural levels, despite the Department of Finance having previously calculated trend estimates of labour market indicators in ‘Annex – Update of Long-Term Economic and Fiscal Projections’ in the 2013 Update of Economic and Fiscal Projections. Building on the comparison to trend for the recent period, comparing the recovery in labour market indicators against past recoveries provides important historical context. However, the Jobs Report does not analyse how the recent recession and recovery compares to those in the past. Instead, the Jobs Report uses broad generalizations in place of cycle-over-cycle analysis. For example, the text on page 30 of the Jobs Report states that “Canadian firms are experiencing more difficulty in hiring than the unemployment situation would normally warrant.” This is a conclusion that cannot be supported by cycle-over-cycle analysis as a result of the limited job vacancy data available over history. Further, it is important to analyze labour market indicators over consistent time periods as analysis over differing periods may portray different results. However, while the Jobs Report describes the development of labour market indicators over time, the time periods selected differ for reasons that are unexplained. For instance, while much of the analysis presented in Budget 2014 and the Jobs Report begins in early 2006, some indicators presented in the Jobs Report only compare indicators in recent and recessionary periods, such as the comparison of job vacancy rates in 2009 and 2013 on pages 31 and 32 of the Jobs Report. In the context of the negative real output growth experienced in 2009, it should come as no surprise that the job vacancy rate is higher in 2013.

Labour Market Assessment 2014
16
In addition, it is important to discuss wages in the context of the state of the labour market. For instance, the weakness in wage growth since the 2008-09 recession supports the assertion that there is excess slack in the labour market. Even the Jobs Report recognizes that “recruitment difficulties correspond to a lack of an appropriate number of skilled workers on the market at the existing wage.” However, the Jobs Report does not include analysis of wage growth through the recovery. Finally, international comparisons are particularly useful if the indicators are determined on a comparable basis. For instance, the figure on page 11 of the Jobs Report includes a measure of the Canadian unemployment rate determined on the same basis as the U.S. unemployment rate (the ‘R3’). However, except for the unemployment rate, no other international comparisons in the Jobs Report were made between indicators that are determined on a comparable basis.

Labour Market Assessment 2014
17
References
Bank of Canada, Business Outlook Survey, Winter 2013-14 Survey, Vol. 10.4, January 13, 2014. http://www.bankofcanada.ca/wp-content/uploads/2014/01/bos_winter2013.pdf Congressional Budget Office (CBO), The Slow Recovery of the Labor Market, February 2014. http://www.cbo.gov/sites/default/files/cbofiles/attachments/45011-LaborMarketReview.pdf Department of Finance, Updated of Economic and Fiscal Projections, November 12, 2013. http://www.fin.gc.ca/efp-pef/2013/pdf/efp-pef-13-eng.pdf Department of Finance, Budget 2014, February 11, 2014. http://www.budget.gc.ca/2014/docs/plan/pdf/budget2014-eng.pdf Department of Finance, Jobs Report: The State of the Canadian Labour Market, February 11, 2014. http://www.budget.gc.ca/2014/docs/jobs-emplois/pdf/jobs-emplois-eng.pdf Desjardins, R. and K. Rubenson (2011), "An Analysis of Skill Mismatch Using Direct Measures of Skills", OECD Education Working Papers, No. 63, OECD Publishing. http://dx.doi.org/10.1787/5kg3nh9h52g5-en International Monetary Fund (IMF), Beveridge Curve Shifts across Countries since the Great Recession, November 2012. http://www.imf.org/external/np/res/seminars/2012/arc/pdf/HS.pdf
Mallett, Ted, Help Wanted, Private sector job vacancies in Canada: Q4 2013, Canadian Federation of Independent Business, March 2014. http://www.cfib-fcei.ca/cfib-documents/rr3324.pdf Mallett, Ted, Business Barometer: January 2014 SME business outlook survey results, Canadian Federation of Independent Business, January 30, 2014. http://www.cfib-fcei.ca/cfib-documents/rr3319.pdf Office of the Parliamentary Budget Officer, Estimating Potential GDP and the Government’s Structural Budget Balance, January 2010. http://www.pbo-dpb.gc.ca/files/files/Publications/Potential_CABB_EN.pdf Office of the Parliamentary Budget Officer, An Assessment of Canada’s Labour Market Performance, October 2012. http://www.pbo-dpb.gc.ca/files/files/Labour_Note_EN.pdf Office of the Parliamentary Budget Officer, Fiscal Sustainability Report 2013, September 2013. http://www.pbo-dpb.gc.ca/files/files/FSR_2013.pdf TD Economics, Jobs in Canada: Where, What and For Whom?, October 22, 2013. http://www.td.com/document/PDF/economics/special/JobsInCanada.pdf.

Labour Market Assessment 2014
18
Annex A PBO Methodology for Estimating Labour Market Trends and Potential GDP
This annex summarizes PBO’s methodology for estimating trends for key labour market indicators. For more details, see PBO (2010). As described by the identity below, labour input (total hours worked) is determined by the size of the working-age population (LFPOP), the aggregate employment rate (LFER) and the average weekly hours worked (AHW):
52 AHWLFERLFPOPL
To construct trend labour input, PBO estimates the respective trends of each of these components. Working-Age Population
The first component of labour input is the working-age population, which comprises individuals aged 15 and over. These data, which are provided by Statistics Canada, are disaggregated by age and sex over history. Employment Rate
The second component of labour input is the employment rate, which is defined as the share of the labour force population that is employed. PBO estimates the trend employment rate using a model augmented filtering approach. To construct the trend employment rate, PBO applies a Hodrick-Prescott (HP) filter to individual employment rates by age and sex over the entire historical and projection period (to address the end-of-sample problem). The aggregate trend employment rate is then calculated by weighting the individual employment rates by their population shares.
Average Weekly Hours Worked
The third component of labour input is average weekly hours worked, the trend for which is also estimated using a model augmented filtering approach. These historical data are augmented using the projected average weekly hours worked series by individual age and sex. The augmented series are then filtered using an HP filter. Trend Unemployment Rate
While PBO does not estimate the trend unemployment rate directly, an estimate can be determined residually. Specifically, PBO applies its methodology to the labour force participation rate using the same specification for estimating the trend employment rate, described above. The trend unemployment rate can then be calculated using the following equation:
LFPR
LFERLFUR 1
where LFUR is the unemployment rate; LFER is the employment rate; and LFPR is the participation rate. Trend Labour Productivity
The final component required to estimate potential GDP is trend labour productivity. PBO estimates trend labour productivity using the model augmented filtering methodology. PBO estimates and projects labour productivity using an autoregressive integrated moving average (ARIMA) model and smoothes the series using an HP filter. Potential GDP
Potential GDP is then constructed by combining the trend labour input (L) and trend labour productivity (Y/L) estimates based on the following identity:

Labour Market Assessment 2014
19
L
YLY
Output Gap
The output gap is the difference between real and potential GDP as a per cent of potential GDP. The output gap is an important concept since it is a more appropriate way to assess the state of the economy across business cycles than analyzing output growth on its own. According to PBO calculations, the output gap in 2013Q4 was -1.0 per cent (Figure A-1). Figure A-1
Output Gap, 2006Q1 to 2013Q4
per cent
Sources: Office of the Parliamentary Budget Officer; Statistics Canada.
-5
-4
-3
-2
-1
0
1
2
3
4
-5
-4
-3
-2
-1
0
1
2
3
4
2006Q1 2007Q2 2008Q3 2009Q4 2011Q1 2012Q2 2013Q3

Labour Market Assessment 2014
20
Annex B Cycle-Over-Cycle Analysis of Labour Market Indicators
The deviation in the level of employment from its trend was not as dramatic in the recent recession as it was in previous recessions, but has not rebounded as quickly as in the early-1980s (Figure B-1). Figure B-1
Employment Gap Comparison with Past Cycles
per cent
quarters
Sources: Office of the Parliamentary Budget Officer; Statistics Canada. Note: Time t=0 corresponds to the employment gap peak.
As the level of the population is assumed to be at trend, a similar pattern is apparent in the employment rate (Figure B-2). Meanwhile, the deviation of average weekly hours worked from its trend followed previous recessions closely until the beginning of 2012, when the recovery to trend stalled (Figure B-3).
Figure B-2
Employment Rate Gap Comparison with Past Cycles
percentage point
quarters
Sources: Office of the Parliamentary Budget Officer; Statistics Canada. Note: Time t=0 corresponds to the employment gap peak.
Figure B-3
Average Weekly Hours Worked Gap Comparison with Past Cycles
per cent
quarters
Sources: Office of the Parliamentary Budget Officer; Statistics Canada. Note: Time t=0 corresponds to the employment gap peak.
-5
-4
-3
-2
-1
0
1
2
3
4
5
-5
-4
-3
-2
-1
0
1
2
3
4
5
t = -4 0 4 8 12 16 20
1980Q2 to 1987Q1
1989Q1 to 1995Q4
2007Q1 to 2013Q4
-3
-2
-1
0
1
2
3
-3
-2
-1
0
1
2
3
t = -4 0 4 8 12 16 20
1980Q2 to 1987Q1
1989Q1 to 1995Q4
2007Q1 to 2013Q4
-2
-1
0
1
2
-2
-1
0
1
2
t = -4 0 4 8 12 16 20
1980Q2 to 1987Q1
1989Q1 to 1995Q4
2007Q1 to 2013Q4
Labour Market Assessment 2014
21
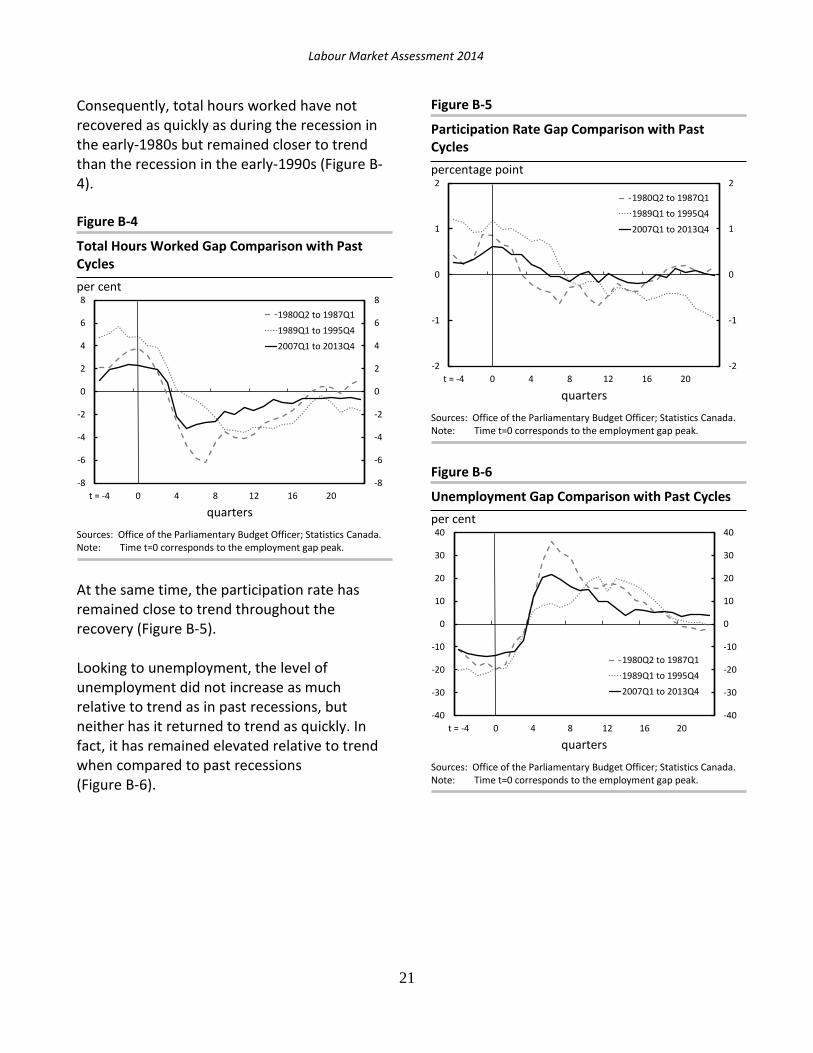
Consequently, total hours worked have not recovered as quickly as during the recession in the early-1980s but remained closer to trend than the recession in the early-1990s (Figure B-4). Figure B-4
Total Hours Worked Gap Comparison with Past Cycles
per cent
quarters
Sources: Office of the Parliamentary Budget Officer; Statistics Canada. Note: Time t=0 corresponds to the employment gap peak.
At the same time, the participation rate has remained close to trend throughout the recovery (Figure B-5). Looking to unemployment, the level of unemployment did not increase as much relative to trend as in past recessions, but neither has it returned to trend as quickly. In fact, it has remained elevated relative to trend when compared to past recessions (Figure B-6).
Figure B-5
Participation Rate Gap Comparison with Past Cycles
percentage point
quarters
Sources: Office of the Parliamentary Budget Officer; Statistics Canada. Note: Time t=0 corresponds to the employment gap peak.
Figure B-6
Unemployment Gap Comparison with Past Cycles
per cent
quarters
Sources: Office of the Parliamentary Budget Officer; Statistics Canada. Note: Time t=0 corresponds to the employment gap peak.
-8
-6
-4
-2
0
2
4
6
8
-8
-6
-4
-2
0
2
4
6
8
t = -4 0 4 8 12 16 20
1980Q2 to 1987Q1
1989Q1 to 1995Q4
2007Q1 to 2013Q4
-2
-1
0
1
2
-2
-1
0
1
2
t = -4 0 4 8 12 16 20
1980Q2 to 1987Q1
1989Q1 to 1995Q4
2007Q1 to 2013Q4
-40
-30
-20
-10
0
10
20
30
40
-40
-30
-20
-10
0
10
20
30
40
t = -4 0 4 8 12 16 20
1980Q2 to 1987Q1
1989Q1 to 1995Q4
2007Q1 to 2013Q4

Labour Market Assessment 2014
22
As a result, the unemployment rate has displayed a trend similar to that of the level of unemployment through the recovery and relative to previous recoveries. It remains elevated relative to trend when compared to past recessions (Figure B-7). Figure B-7
Unemployment Rate Gap Comparison with Past Cycles
percentage point
quarters
Sources: Office of the Parliamentary Budget Officer; Statistics Canada. Note: Time t=0 corresponds to the employment gap peak.
-4
-3
-2
-1
0
1
2
3
4
-4
-3
-2
-1
0
1
2
3
4
t = -4 0 4 8 12 16 20
1980Q2 to 1987Q1
1989Q1 to 1995Q4
2007Q1 to 2013Q4

Labour Market Assessment 2014
23
Annex C Disaggregated Labour Market Indicators by Province and Industry
The aggregate labour market indicators examined in the main body of the paper can be disaggregated by province and sector. PBO does not determine provincial or industrial trend labour market indicators. Labour Market Indicators by Province Levels of employment for all provinces are higher in 2013Q4 than before the recession began, except for New Brunswick and Nova Scotia. Five of the ten provinces – Alberta, Saskatchewan, Prince Edward Island, Quebec and Newfoundland and Labrador – were above the national average for quarterly employment growth between 2008Q3 and 2013Q4 (Figure C-1). Figure C-1
Change in Provincial Employment, 2008Q3 to 2013Q4
per cent
Sources: Office of the Parliamentary Budget Officer; Statistics Canada. Note: The pre-recession peak is assumed to be 2008Q3 for all
provinces, as this was the pre-recession employment peak nationally.
The labour force population in every province except New Brunswick is higher than before the recession (Figure C-2). However, when employment is divided by working-age population, the employment rates for every province remain below their pre-recession peaks, except for Saskatchewan, Prince Edward Island and Newfoundland and Labrador (Figure C-3). Figure C-2
Change in Provincial Labour Force Population, 2008Q3 to 2013Q4
per cent
Sources: Office of the Parliamentary Budget Officer; Statistics Canada. Note: The pre-recession peak is assumed to be 2008Q3 for all
provinces, as this was the pre-recession employment peak nationally.
-4
-2
0
2
4
6
8
10
-4
-2
0
2
4
6
8
10
BC AB SK MB ON QC NB NS PE NL
Employment growth
National average
-2
0
2
4
6
8
10
12
-2
0
2
4
6
8
10
12
BC AB SK MB ON QC NB NS PE NL
Labour force population growth
National average

Labour Market Assessment 2014
24
Figure C-3
Change in Provincial Employment Rate, 2008Q3 to 2013Q4
percentage points
Sources: Office of the Parliamentary Budget Officer; Statistics Canada. Note: The pre-recession peak is assumed to be 2008Q3 for all
provinces, as this was the pre-recession employment peak nationally.
Since most provinces have a lower employment rate than before the recession, most of the provinces also have higher unemployment rates than before the recession (Figure C-4). In contrast, Saskatchewan and Newfoundland and Labrador had lower unemployment rates in 2013Q4 than before the recession because in both cases the levels of unemployment in 2013Q4 were lower than the levels of unemployment in 2008Q3. In 2013Q4, the national unemployment rate was 7.0 per cent. Saskatchewan had the lowest unemployment rate in 2013Q4 among the provinces at 3.9 per cent (Figure C-5). Newfoundland and Labrador and Prince Edward Island had the highest at 11.3 per cent. Compared with the national unemployment rate, Ontario, Quebec, New Brunswick, Nova Scotia, Prince Edward Island and Newfoundland and Labrador had unemployment rates above the national average.
Figure C-4
Change in Provincial Unemployment Rate, 2008Q3 to 2013Q4
percentage points
Sources: Office of the Parliamentary Budget Officer; Statistics Canada. Note: The pre-recession peak is assumed to be 2008Q3 for all
provinces, as this was the pre-recession employment peak nationally.
Figure C-5
Unemployment Rate by Province, 2013Q4
per cent
Source: Statistics Canada.
Labour Market Indicators by Industry Goods-sector employment dropped by 8.8 per cent from 2008Q3 to 2009Q3 (Figure C-6). Although employment in the goods sector has increased gradually since then, it remained 3.4 per cent below its pre-recession level as of 2013Q4, largely
-5
-4
-3
-2
-1
0
1
2
3
4
-5
-4
-3
-2
-1
0
1
2
3
4
BC AB SK MB ON QC NB NS PE NL
Employment rate National average
-3
-2
-1
0
1
2
3
-3
-2
-1
0
1
2
3
BC AB SK MB ON QC NB NS PE NL
Unemployment rate
National average
0
2
4
6
8
10
12
0
2
4
6
8
10
12
BC AB SK MB ON QC NB NS PE NL

Labour Market Assessment 2014
25
the result of continued decline in employment in the manufacturing sector.41 On the other hand, nearly three-quarters of the jobs created in the recovery were in the services- producing sector. As of 2013Q4, employment in the services sector was 6.3 per cent above the pre-recession peak, equivalent to about 821,000 jobs. This was due largely to gains in employment in health care and social assistance, educational services and professional, scientific and technical services sectors. Since many of these sectors are closely tied to the public sector, growth in public sector employment during the recession and recovery outpaced that of the private sector (Figure C-7). Although employment in the services sector has increased, average real hourly wages in the sector remain below the goods sector (Figure C-8). Figure C-6
Employment by Industry, 2006Q1 to 2013Q4
index, 2006Q1=100
Sources: Office of the Parliamentary Budget Officer; Statistics Canada.
41
Employment in manufacturing peaked in November 2002, with close to 2,330,000 persons employed in the sector. Employment in manufacturing has steadily declined since then, with 1,743,700 persons employed in February 2014.
Figure C-7
Employment by Class of Worker, 2006Q1 to 2013Q4
index, 2006Q1=100
Sources: Office of the Parliamentary Budget Officer; Statistics Canada. Note: The private-sector employment series does not include the self-employed. Figure C-8
Real Average Hourly Wages by Industry, 2006Q1 to 2013Q4 2002 dollars per hour
Sources: Office of the Parliamentary Budget Officer; Statistics Canada. Note: Wage data is seasonally adjusted using the Census X12 approach.
90
95
100
105
110
115
90
95
100
105
110
115
2006Q1 2007Q2 2008Q3 2009Q4 2011Q1 2012Q2 2013Q3
Services-sector employment
Goods-sector employment
95
100
105
110
115
120
95
100
105
110
115
120
2006Q1 2007Q2 2008Q3 2009Q4 2011Q1 2012Q2 2013Q3
Public-sector employment
Private-sector employment
17
18
19
20
21
22
17
18
19
20
21
22
2006Q1 2007Q2 2008Q3 2009Q4 2011Q1 2012Q2 2013Q3
Services-sector Goods-sector
Labour Market Assessment 2014
26
Annex D Overview of Job Vacancy Data
The following is an overview of the characteristics of data underlying the analysis in Section 3. Trends in Labour Market Demand and Supply. First, both Statistics Canada and the Conference Board of Canada provide estimates of the Help-Wanted Index (HWI), albeit over different sample periods and using different data. Specifically:
The Statistics Canada HWI42 is available for the period January 1981 to April 2003. It was derived from a count of job advertisements published in the classified sections of 22 major metropolitan area newspapers. The base year was 1996, and the base value, set equal to 100 by convention, was a 12-month average of the number of ads published in 1996. Each month, this value was compared with a current count of ads. For example, if the base value equalled 1,000 and the count of ads for the current month was 1,200, the index would be 120. This value is interpreted as follows: for the newspapers surveyed, compared with the base period 1996, the index increased 20 points, or the number of help-wanted ads rose by 20 per cent.
The Conference Board of Canada HWI43 is available for the September 2005 to February 2014. It is based on the seasonally adjusted number of new, unduplicated jobs posted online during the month across 79 Canadian job-posting websites. The base year is 2007. When the number of new job postings increases, it translates into an increase in the HWI. Raw data are collected by WANTED
42
http://www23.statcan.gc.ca/imdb-bmdi/document/2606_D2_T9_V1_B.pdf. 43
The method used by the Conference Board of Canada to calculate the HWI is similar to that used historically by Statistics Canada. However, one index may not be used to complete the other on a time series. The methodology for Statistics Canada's HWI can be found at the following link: http://www23.statcan.gc.ca/imdb/p2SV.pl?Function=getSurvey&SDDS=2606&Item_Id=890.
Technologies, a Canada-based firm that provides information and analysis on hiring demand. Using a web spider, WANTED Technologies is able to identify unduplicated online job postings across Canada, the 10 provinces and 27 metropolitan areas. The monthly HWI does not account for existing ads posted during previous months. It must be noted that not all 79 websites existed at the beginning of the historical period.
Second, Statistics Canada and the Canadian Federation of Independent Business (CFIB) provide estimates of the job vacancy rate (JVR), while the Conference Board of Canada provides an Indicator of Labour Market Tightness (defined as the ratio of the number of unemployed individuals to the number of available ads posted online) from which the number of job vacancies and the job vacancy rate can be derived. Specifically:
The Statistics Canada JVR44 is available on a monthly basis from March 2011 to December 2013. It is calculated as the three-month moving average of the share of non-seasonally adjusted job vacancies and labour demand (job vacancies plus employment) from the Survey of Employment, Payroll and Hours (SEPH) program through the monthly Business Payrolls Survey (BPS) questionnaire. The initial BPS sample consists of 15,000 establishments out of a population of 900,000. A position is considered "vacant" if it meets all three of the following conditions: a specific position exists, work could start within 30 days, and the employer is actively seeking employees from outside the organization to fill the position.
The CFIB JVR45 is available on a quarterly basis from 2004Q1 to 2013Q4 by province, industry, and enterprise size. The CFIB defines job
44
http://www.statcan.gc.ca/daily-quotidien/131217/dq131217b-eng.pdf. 45
http://www.cfib-fcei.ca/cfib-documents/rr3324.pdf.

Labour Market Assessment 2014
27
vacancies as “openings that have been vacant for at least four months because business owners have been unable to find suitable employees.” This constitutes a more passive approach to filling job vacancies as opposed to the active approach required by Statistics Canada. The survey is conducted electronically each month with a grouped random sampling of ID-validated CFIB members. The 2013Q4 results are based on 3,088 responses from the latest quarter. The use of weighting and seasonal adjustment techniques results in slight revisions of historical figures over time. The CFIB assumes a fixed proportional relationship between vacancy rates in large enterprises compared with smaller size groupings. Aggregated employment and vacancies are then reweighted by province and industry, based on quarterly data from Statistics Canada’s Survey of Employment, Payroll and Hours (SEPH), subtracting out public-sector employment based on the CFIB’s custom tabulations from Statistics Canada’s Labour Force Survey (LFS). National quarterly data are seasonally adjusted and trended using Census X-12 methodology.
The Conference Board of Canada JVR (derived by PBO) is available from September 2005 to February 2014 based on the seasonally adjusted number of total unduplicated jobs posted online during the month across 79 Canadian job-posting websites collected by WANTED Technologies. As the number of job vacancies is taken from the total population of available vacancies, the job vacancy rate is determined using the aggregate level of employment for Canada and for each of the provinces from the LFS.
The JVR analysis is performed as much as possible with data from the Conference Board of Canada, as this is thought to be the best representation of the whole population of job vacancies. However, these data are available from the Conference Board of Canada only at the national and provincial levels. CFIB data are used to examine specific industries. It should be noted that, on the aggregate for Canada, the Conference Board of Canada reports a higher number of job vacancies as the CFIB. In part, this reflects the different methods used (count vs. survey, respectively) and different populations being examined (total employment vs. private-sector employment, respectively). However, as the national and provincial trends are broadly comparable with that of the Conference Board of Canada, the CFIB data at the very least illustrate trends in the labour market as a whole. Finally, given the short sample period and unusual calculation approach, the job vacancies from Statistics Canada are not analyzed.

Labour Market Assessment 2014
28
Annex E Provincial Beveridge Curves
Overall, job vacancy rates and unemployment rates have generally moved toward pre-recession levels since July 2009, as the economy continues to return to its level of potential output. However, overall slack in the labour market persists, although to varying degrees across regions. This regional variation is illustrated by the following provincial Beveridge curves, organized from West to East, using Conference Board of Canada (Figures E-1 to E-7) and Canadian Federation of Independent Business (CFIB) (Figures E-8 to E-14) job vacancy data.
Conference Board of Canada Figure E-1
British Columbia Beveridge Curve, February 2006 to February 2014
job vacancy rate (per cent)
unemployment rate (per cent)
Sources: Conference Board of Canada; Statistics Canada; Office of the Parliamentary Budget Officer.
Figure E-2
Alberta Beveridge Curve, February 2006 to February 2014
job vacancy rate (per cent)
unemployment rate (per cent)
Sources: Conference Board of Canada; Statistics Canada; Office of the Parliamentary Budget Officer.
Figure E-3
Saskatchewan Beveridge Curve, February 2006 to February 2014
job vacancy rate (per cent)
unemployment rate (per cent)
Sources: Conference Board of Canada; Statistics Canada; Office of the Parliamentary Budget Officer.
1
2
3
4
5
1
2
3
4
5
3 4 5 6 7 8 9
Feb 2006
Feb 2014
Feb 2008
Feb 2010
Feb 2012
1.5
2.0
2.5
3.0
3.5
1.5
2.0
2.5
3.0
3.5
2 3 4 5 6 7 8
Feb 2006
Feb 2008
Feb 2010
Feb 2012
Feb 2014
0
1
2
3
4
5
1
2
3
4
5
3.5 4.0 4.5 5.0 5.5 6.0
Feb 2006
Feb 2010
Feb 2012
Feb 2014
Feb 2008

Labour Market Assessment 2014
28
Figure E-4
Manitoba Beveridge Curve, February 2006 to February 2014
job vacancy rate (per cent)
unemployment rate (per cent)
Sources: Conference Board of Canada; Statistics Canada; Office of the Parliamentary Budget Officer.
Figure E-5
Ontario Beveridge Curve, February 2006 to February 2014
job vacancy rate (per cent)
unemployment rate (per cent)
Sources: Conference Board of Canada; Statistics Canada; Office of the Parliamentary Budget Officer.
Figure E-6
Quebec Beveridge Curve, February 2006 to February 2014
job vacancy rate (per cent)
unemployment rate (per cent)
Sources: Conference Board of Canada; Statistics Canada; Office of the Parliamentary Budget Officer.
Figure E-7
Atlantic Canada Beveridge Curve, February 2006 to February 2014
job vacancy rate (per cent)
unemployment rate (per cent)
Sources: Conference Board of Canada; Statistics Canada; Office of the Parliamentary Budget Officer. Note: Atlantic Canada includes Newfoundland and Labrador, Prince Edward Island, New Brunswick, and Nova Scotia.
0.5
1.0
1.5
2.0
2.5
3.0
3.5
1.0
1.5
2.0
2.5
3.0
3.5 4.0 4.5 5.0 5.5 6.0
Feb 2006
Feb 2014
Feb 2008
Feb 2010
Feb 2012
1.5
2.0
2.5
3.0
1.5
2.0
2.5
3.0
5.5 6.0 6.5 7.0 7.5 8.0 8.5 9.0 9.5
Feb 2006
Feb 2014
Feb 2008
Feb 2010Feb 2012
1.0
1.5
2.0
2.5
1.0
1.5
2.0
2.5
6.5 7.0 7.5 8.0 8.5 9.0
Feb 2006
Feb 2014Feb 2008
Feb 2010
Feb 2012
1.0
1.5
2.0
2.5
3.0
1.0
1.5
2.0
2.5
3.0
8.5 9.0 9.5 10.0 10.5 11.0
Feb 2006
Feb 2008
Feb 2014
Feb 2012
Feb 2010

Labour Market Assessment 2014
29
Canadian Federation of Independent Business Figure E-8
British Columbia Beveridge Curve, 2004Q1 to 2013Q4
job vacancy rate (per cent)
unemployment rate (per cent)
Sources: Office of the Parliamentary Budget Officer; CFIB; Statistics Canada.
Figure E-9
Alberta Beveridge Curve, 2004Q1 to 2013Q4
job vacancy rate (per cent)
unemployment rate (per cent)
Sources: Office of the Parliamentary Budget Officer; CFIB; Statistics Canada.
Figure E-10
Saskatchewan Beveridge Curve, 2004Q1 to 2013Q4
job vacancy rate (per cent)
unemployment rate (per cent)
Sources: Office of the Parliamentary Budget Officer; CFIB; Statistics Canada.
Figure E-11
Manitoba Beveridge Curve, 2004Q1 to 2013Q4
job vacancy rate (per cent)
unemployment rate (per cent)
Sources: Office of the Parliamentary Budget Officer; CFIB; Statistics Canada.
1.5
2.0
2.5
3.0
3.5
4.0
4.5
1.5
2.0
2.5
3.0
3.5
4.0
4.5
4.0 4.5 5.0 5.5 6.0 6.5 7.0 7.5 8.0 8.5
2004Q1
2013Q4
2009Q1
1.5
2.0
2.5
3.0
3.5
4.0
4.5
5.0
1.5
2.0
2.5
3.0
3.5
4.0
4.5
5.0
3.0 3.5 4.0 4.5 5.0 5.5 6.0 6.5 7.0 7.5
2004Q1
2013Q4
2009Q1
2.0
2.5
3.0
3.5
4.0
2.0
2.5
3.0
3.5
4.0
3.5 4.0 4.5 5.0 5.5 6.0
2004Q1
2013Q4
2009Q1
2.0
2.5
3.0
2.0
2.5
3.0
3.5 4.0 4.5 5.0 5.5 6.0
2004Q1
2013Q4
2009Q1

Labour Market Assessment 2014
30
Figure E-12
Ontario Beveridge Curve, 2004Q1 to 2013Q4
job vacancy rate (per cent)
unemployment rate (per cent)
Sources: Office of the Parliamentary Budget Officer; CFIB; Statistics Canada.
Figure E-13
Quebec Beveridge Curve, 2004Q1 to 2013Q4
job vacancy rate (per cent)
unemployment rate (per cent)
Sources: Office of the Parliamentary Budget Officer; CFIB; Statistics Canada.
Figure E-14
Atlantic Canada Beveridge Curve, 2004Q1 to 2013Q4
job vacancy rate (per cent)
unemployment rate (per cent)
Sources: Office of the Parliamentary Budget Officer; CFIB; Statistics Canada. Note: Atlantic Canada includes Newfoundland and Labrador, Prince Edward Island, New Brunswick, and Nova Scotia.
1.5
2.0
2.5
1.5
2.0
2.5
5.5 6.0 6.5 7.0 7.5 8.0 8.5 9.0 9.5
2004Q1
2013Q4
2009Q1
1.5
2.0
2.5
3.0
1.5
2.0
2.5
3.0
6.5 7.0 7.5 8.0 8.5 9.0
2004Q1
2013Q4
2009Q1
1.5
2.0
2.5
3.0
1.5
2.0
2.5
3.0
8.5 9.0 9.5 10.0 10.5 11.0
2004Q1
2013Q4
2009Q1

Labour Market Assessment 2014
31
Annex F Private-Sector Industry Beveridge Curves
Goods-Producing Sector Beveridge Curves
Figure F-1
Agriculture Beveridge Curve, 2004Q1 to 2013Q4
job vacancy rate (per cent)
unemployment rate (per cent)
Sources: Canadian Federation of Independent Business; Statistics Canada; Office of the Parliamentary Budget Officer.
Figure F-2
Resource Beveridge Curve, 2004Q1 to 2013Q4
job vacancy rate (per cent)
unemployment rate (per cent)
Sources: Canadian Federation of Independent Business; Statistics Canada; Office of the Parliamentary Budget Officer.
Figure F-3
Construction Beveridge Curve, 2004Q1 to 2013Q4
job vacancy rate (per cent)
unemployment rate (per cent)
Sources: Canadian Federation of Independent Business; Statistics Canada; Office of the Parliamentary Budget Officer.
Figure F-4
Manufacturing Beveridge Curve, 2004Q1 to 2013Q4
job vacancy rate (per cent)
unemployment rate (per cent)
Sources: Canadian Federation of Independent Business; Statistics Canada; Office of the Parliamentary Budget Officer.
2.0
2.5
3.0
3.5
4.0
2.0
2.5
3.0
3.5
4.0
4.0 4.5 5.0 5.5 6.0 6.5 7.0
2004Q1
2009Q1
2013Q4
1.5
2.0
2.5
3.0
3.5
1.5
2.0
2.5
3.0
3.5
6 7 8 9 10 11 12 13 14
2004Q1
2009Q1
2013Q4
2.5
3.0
3.5
4.0
4.5
5.0
2.5
3.0
3.5
4.0
4.5
5.0
5 6 7 8 9 10 11 12
2004Q1
2009Q1
2013Q4
1.0
1.5
2.0
2.5
1.0
1.5
2.0
2.5
4 5 6 7 8 9 10 11
2004Q1
2009Q1
2013Q4

Labour Market Assessment 2014
32
Services-Producing Sector Beveridge Curves
Figure F-5
Retail and Wholesale Trade Beveridge Curve, 2004Q1 to 2013Q4
job vacancy rate (per cent)
unemployment rate (per cent)
Sources: Canadian Federation of Independent Business; Statistics Canada; Office of the Parliamentary Budget Officer.
Figure F-6
Transportation Beveridge Curve, 2004Q1 to 2013Q4
job vacancy rate (per cent)
unemployment rate (per cent)
Sources: Canadian Federation of Independent Business; Statistics Canada; Office of the Parliamentary Budget Officer.
Figure F-7
Information Beveridge Curve, 2004Q1 to 2013Q4
job vacancy rate (per cent)
unemployment rate (per cent)
Sources: Canadian Federation of Independent Business; Statistics Canada; Office of the Parliamentary Budget Officer.
Figure F-8
Finance and Insurance Beveridge Curve, 2004Q1 to 2013Q4
job vacancy rate (per cent)
unemployment rate (per cent)
Sources: Canadian Federation of Independent Business; Statistics Canada; Office of the Parliamentary Budget Officer.
1.5
2.0
2.5
3.0
1.5
2.0
2.5
3.0
3.5 4.0 4.5 5.0 5.5 6.0 6.5
2004Q1
2009Q1
2013Q4
1.5
2.0
2.5
3.0
1.5
2.0
2.5
3.0
2.5 3.0 3.5 4.0 4.5 5.0 5.5 6.0 6.5 7.0
2004Q1
2009Q1
2013Q4
1.0
1.5
2.0
2.5
3.0
1.0
1.5
2.0
2.5
3.0
4.0 4.5 5.0 5.5 6.0 6.5 7.0 7.5 8.0
2004Q1
2009Q1
2013Q4
0.5
1.0
1.5
2.0
2.5
0.5
1.0
1.5
2.0
2.5
1.5 2.0 2.5 3.0 3.5 4.0
2004Q1
2009Q1
2013Q4

Labour Market Assessment 2014
33
Figure F-9
Professional Services Beveridge Curve, 2004Q1 to 2013Q4
job vacancy rate (per cent)
unemployment rate (per cent)
Sources: Canadian Federation of Independent Business; Statistics Canada; Office of the Parliamentary Budget Officer.
Figure F-10
Business Services Beveridge Curve, 2004Q1 to 2013Q4
job vacancy rate (per cent)
unemployment rate (per cent)
Sources: Canadian Federation of Independent Business; Statistics Canada; Office of the Parliamentary Budget Officer.
Figure F-11
Hospitality Services Beveridge Curve, 2004Q1 to 2013Q4
job vacancy rate (per cent)
unemployment rate (per cent)
Sources: Canadian Federation of Independent Business; Statistics Canada; Office of the Parliamentary Budget Officer.
Figure F-12
Other Services Beveridge Curve, 2004Q1 to 2013Q4
job vacancy rate (per cent)
unemployment rate (per cent)
Sources: Canadian Federation of Independent Business; Statistics Canada; Office of the Parliamentary Budget Officer.
1.5
2.0
2.5
3.0
3.5
1.5
2.0
2.5
3.0
3.5
2.0 2.5 3.0 3.5 4.0 4.5
2004Q1
2013Q4
2009Q1
1.5
2.0
2.5
3.0
1.5
2.0
2.5
3.0
7 8 9 10 11 12
2007Q4
2009Q1
2013Q4
2.0
2.5
3.0
3.5
4.0
4.5
2.0
2.5
3.0
3.5
4.0
4.5
6.0 6.5 7.0 7.5 8.0 8.5 9.0 9.5
2004Q1
2009Q1
2013Q4
2.5
3.0
3.5
4.0
4.5
2.5
3.0
3.5
4.0
4.5
3.0 3.5 4.0 4.5 5.0 5.5 6.0
2004Q1
2009Q1
2013Q4