labour market assessment 2015 - parliamentary … of contents executive summary 1 1. national...
TRANSCRIPT

Labour Market Assessment 2015
Ottawa, Canada 12 November 2015 www.pbo-dpb.gc.ca

The mandate of the Parliamentary Budget Officer (PBO) is to provide independent analysis to Parliament on the state of the nation’s finances, the Government’s estimates and trends in the Canadian economy; and, upon request from a committee or parliamentarian, to estimate the financial cost of any proposal for matters over which Parliament has jurisdiction.
This report was prepared by the staff of the Parliamentary Budget Officer. Helen Lao and Tim Scholz wrote the report. Mostafa Askari and Chris Matier provided comments. Patricia Brown and Jocelyne Scrim assisted with the preparation of the report for publication. Please contact [email protected] for further information.
Jean-Denis Fréchette Parliamentary Budget Officer

Table of Contents Executive Summary 1
1. National Indicators 3
2. Indicators by Province and Industry 12
3. Overqualification 14
Disaggregated Indicators 19 Appendix A:
Methodology for Assessing Qualification 24 Appendix B:
References 27
Notes 28

Labour Market Assessment 2015
1
Executive Summary This report provides parliamentarians with an assessment of the state of the Canadian labour market by examining indicators relative to their trend estimates, that is, the level that is estimated to occur if temporary shocks are removed.
To provide additional information on labour utilization that may not be captured by typical indicators for younger workers, PBO also examines how the educational credentials of younger university graduates match their occupational requirements.
PBO finds that at the national level, labour market indicators have improved or are unchanged over the past year. However, many remain below their trend estimates, suggesting continued slack in the Canadian labour market (Summary Figure 1).
Moreover, labour market indicators have deteriorated in major oil-producing provinces following the steep decline in oil prices that began in 2014Q3.
Despite the decline in oil prices, growth in employment strengthened, driven by increases in full-time employment, notably in services and the public sector. The level of employment has also improved relative to its trend.
Average hours worked, the participation rate and the employment rate increased relative to trend, helping to move labour input closer to its trend (Summary Figure 1). However, the unemployment rate deterioriated relative to trend over the past year as more people looked for work in 2015.

Labour Market Assessment 2015
2
Labour market indicators relative to trend, 2014Q3 vs. 2015Q3
Sources: Parliamentary Budget Officer and Statistics Canada. Note: Employment rate, participation rate and unemployment rate are expressed in
percentage points difference.
PBO estimates that based on educational credentials, the proportion of workers aged 25 to 34 with a university degree who were overqualified in their current position has been on an upward trend since the early 1990s, reaching 40 per cent in 2014. On the other hand, the proportion of those rightfully qualified has been on a downward trend, falling to just under 55 per cent (Summary Figure 2).
Educational credentials vs. occupational requirements for recent university graduates
Sources: Parliamentary Budget Officer and Statistics Canada.
0.3
-0.1
-0.2
0.2
-0.4
-0.2
-2.0 -1.5 -1.0 -0.5 0.0 0.5 1.0
unemployment rate
participation rate
employment rate
average hours
employment
labour input
2014Q32015Q3
Higher than trend Canada's Labour Market Lower than trend % relative to trend, unless otherwise indicated
30
35
40
45
50
55
60
65
1990 1992 1994 1996 1998 2000 2002 2004 2006 2008 2010 2012 2014
Rightfully qualified (LHS) Overqualified (RHS)
% of workers aged 25 to 34 with a university degree
Summary Figure 1
Summary Figure 2
Labour Market Assessment 2015
3
1. National Indicators This section examines various labour market indicators relative to their respective trend estimates.1 PBO assesses labour utilization variables relative to their trend to determine whether the evolution of the indicators is the result of business cycles or structural factors.
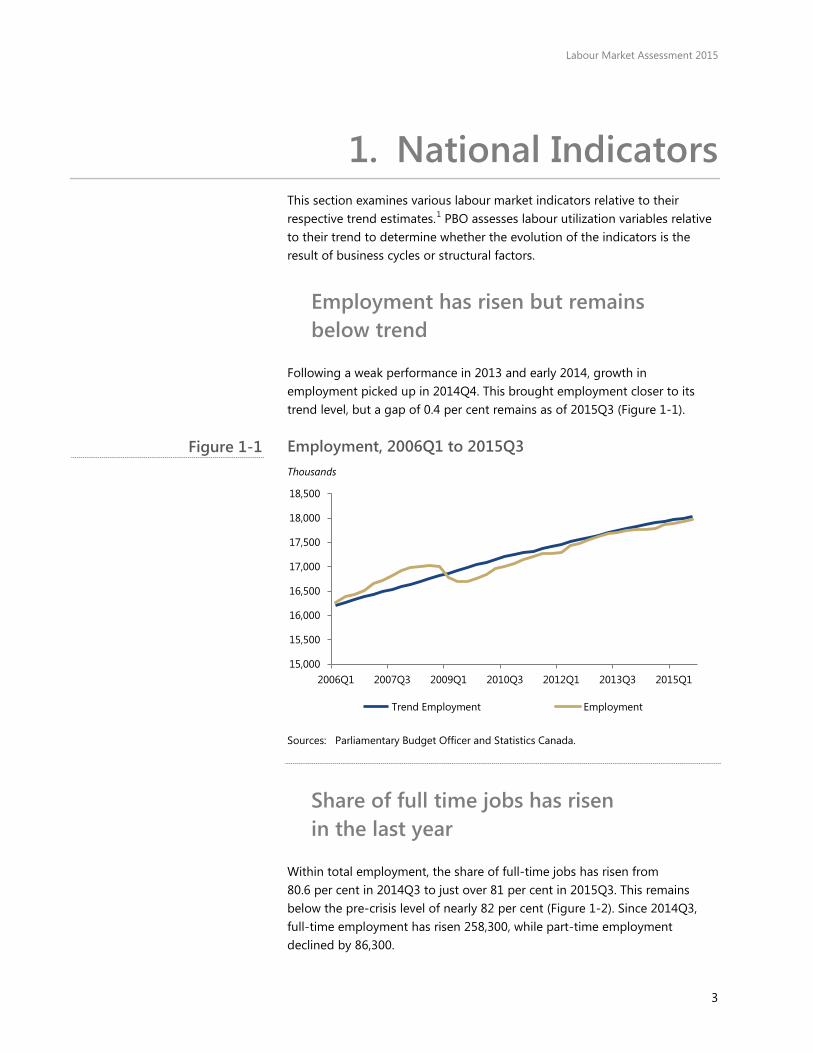
Employment has risen but remains below trend
Following a weak performance in 2013 and early 2014, growth in employment picked up in 2014Q4. This brought employment closer to its trend level, but a gap of 0.4 per cent remains as of 2015Q3 (Figure 1-1).
Employment, 2006Q1 to 2015Q3
Sources: Parliamentary Budget Officer and Statistics Canada.
Share of full time jobs has risen in the last year
Within total employment, the share of full-time jobs has risen from 80.6 per cent in 2014Q3 to just over 81 per cent in 2015Q3. This remains below the pre-crisis level of nearly 82 per cent (Figure 1-2). Since 2014Q3, full-time employment has risen 258,300, while part-time employment declined by 86,300.
15,000
15,500
16,000
16,500
17,000
17,500
18,000
18,500
2006Q1 2007Q3 2009Q1 2010Q3 2012Q1 2013Q3 2015Q1
Trend Employment Employment
Thousands
Figure 1-1

Labour Market Assessment 2015
4
Full-time employment as a share of total employment, 2006Q1 to 2015Q3
Sources: Parliamentary Budget Officer and Statistics Canada.
Participation rate remains below trend
The participation rate, defined as the labour force relative to the working-age population, dropped 0.1 percentage points to 65.8 per cent in 2015Q3 compared with 2014Q3. This was its lowest level since July 2000.
The participation rate was an estimated 0.1 percentage point lower than trend as of 2015Q3. The decline is due in part to pressure from an ageing population.
79
80
80
81
81
82
82
83
2006Q1 2007Q3 2009Q1 2010Q3 2012Q1 2013Q3 2015Q1
%
Figure 1-2

Labour Market Assessment 2015
5
Participation rate, 2006Q1 to 2015Q3
Sources: Parliamentary Budget Officer and Statistics Canada.
Unemployment fell sharply in the last year but rebounded in 2015
The unemployed are defined as the number of people who are without work but actively looking for work. Unemployment decreased by 4.7 per cent from 2014Q3 to 2014Q4, when it slipped below trend.
Since 2014Q4, unemployment in terms of numbers has increased to 4.0 per cent above trend in 2015Q3 (Figure 1-4), pushing the unemployment rate 0.3 percentage points above its trend estimate in 2015Q3.
65
65
66
66
67
67
68
68
2006Q1 2007Q3 2009Q1 2010Q3 2012Q1 2013Q3 2015Q1
Trend Participation Rate Participation Rate
%
Figure 1-3

Labour Market Assessment 2015
6
Unemployment, 2006Q1 to 2015Q3
Sources: Parliamentary Budget Officer and Statistics Canada.
Average weekly hours worked declined last year but rebounded in 2015
Average weekly hours worked declined to 33.8 hours per week in 2014Q3. However, by 2015Q3 average hours recovered to 34.0 hours per week (Figure 1-5) as full-time employment increased, which is 0.2 per cent above the trend estimate.
Average weekly hours worked, 2006Q1 to 2015Q3
Sources: Parliamentary Budget Officer and Statistics Canada.
1,000
1,100
1,200
1,300
1,400
1,500
1,600
2006Q1 2007Q3 2009Q1 2010Q3 2012Q1 2013Q3 2015Q1
Trend Unemployment Unemployment
Thousands
33.033.233.433.633.834.034.234.434.634.835.0
2006Q1 2007Q3 2009Q1 2010Q3 2012Q1 2013Q3 2015Q1
Trend Average Weekly Hours Worked Average Weekly Hours Worked
Hours worked per week
Figure 1-4
Figure 1-5

Labour Market Assessment 2015
7
Labour input declined relative to trend in 2014 but rebounded in 2015
PBO combines employment and average hours worked to construct a broader measure of labour input namely, total hours worked. Total labour input is a key driver of economic growth and well-being, as well as an important consideration in monetary and fiscal policy decisions. It is expressed as the following:
Where: LFPOP is the working-age population; LFER is the employment rate; and AHW is average weekly hours worked.
Between 2014Q3 and 2015Q3, the gap between labour input and trend labour input decreased, largely the result of improvement in average weekly hours worked and the participation rate.
Labour input was 0.9 per cent below its trend estimate in 2014Q3. But by 2015Q3, it had improved to 0.2 per cent below trend, as average weekly hours worked improved (Figure 1-6).
Labour input, 2006Q1 to 2015Q3
Sources: Parliamentary Budget Officer and Statistics Canada.
Average hourly wages increased in 2015
Nominal average hourly wages increased throughout the recession and recovery (Figure 1-7). From 2014Q1 to 2014Q4, real average hourly wages
52⋅⋅⋅= AHWLFERLFPOPL
28,000
28,500
29,000
29,500
30,000
30,500
31,000
31,500
32,000
32,500
2006Q1 2007Q3 2009Q1 2010Q3 2012Q1 2013Q3 2015Q1
Trend Labour Input Labour Input
Millions of hours worked
Figure 1-6

Labour Market Assessment 2015
8
stagnated at about $19.6 per hour. As average hours worked increased in 2015Q2 and 2015Q3, real average hourly wages also increased to $19.9 per hour in 2015Q2 and to $20.0 per hour in 2015Q3.
Despite the decline in oil prices, average hourly wages in the forestry, fishing, mining, oil and gas industry increased both in nominal and real terms relative to 2014Q3. The nominal wage for this industry increased 4.0 per cent from $34.9 per hour in 2014Q3 to $36.3 per hour in 2015Q3. Adjusted for inflation as measured by the Consumer Price Index, the average hourly wage increased from $27.8 per hour in 2014Q3 to $28.6 per hour in 2015Q3. Appendix A provides additional information on wages by industry.
Average nominal and real hourly wages, 2006Q1 to 2015Q3
Sources: Parliamentary Budget Officer and Statistics Canada. Note: PBO seasonally adjusted these series using the Census X12 approach. The total
CPI index is used to deflate the nominal wage, CPI index for 2015Q3 is based on estimate.
The real total compensation rate has increased from 2014Q2 to 2015Q1. However, real total compensation rate decreased 0.7 per cent in 2015Q2 from 2015Q1 while labour productivity decreased 0.5 per cent (Figure 1-8).
15
17
19
21
23
25
27
2006Q1 2007Q3 2009Q1 2010Q3 2012Q1 2013Q3 2015Q1
Nominal Average Hourly Wage Real Average Hourly Wage
Dollars per hour
Figure 1-7

Labour Market Assessment 2015
9
Real total compensation rate and labour productivity, 2006Q1 to 2015Q2
Sources: Parliamentary Budget Officer and Statistics Canada. Note: GDP deflator is used to deflate the nominal total compensation per hour worked.
Labour underutilization rate remains above its pre-recession level
The R8 measure is Statistics Canada’s most comprehensive measure of underutilized labour (Figure 1-9). This indicator shows that there is more slack in the Canadian economy than is measured by the official unemployment rate.
This rate combines the unemployed with discouraged searchers, those waiting for recall or replies, long-term future starts and a portion of involuntary part-time workers who report that they would prefer to work more hours.
The R8 measure has declined over the recovery but remains above its pre-recession level. Its movement tracks the official unemployment rate closely. The gap between the two series has been relatively constant both before and after the recession. However, although the official unemployment rate has increased to 6.8 per cent in 2015Q2 and to 7.0 per cent in 2015Q3, the R8 remained at 9.8 per cent during the same period. This is due to the increase in the number of unemployed being offset by declines in those working part time involuntarily or discouraged workers.
90
95
100
105
110
115
2006Q1 2007Q3 2009Q1 2010Q3 2012Q1 2013Q3 2015Q1
Real Total Compensation Rate Labour Productivity
Index, 2006=100
Figure 1-8

Labour Market Assessment 2015
10
Unemployment and labour utilization rate, 2006Q1 to 2015Q3
Sources: Parliamentary Budget Officer and Statistics Canada. Note: PBO seasonally adjusted the R8 series using the Census X12 approach.
Canada’s labour market has underperformed other economies from 2014Q3 to 2015Q3
Consistent with past reports, PBO compares the performance of Canada’s labour market with other advanced economies. PBO uses data compiled by international organizations that have been submitted by national statistical agencies and harmonized if necessary.
Between 2014Q3 and 2015Q3, the unemployment rate in Canada was unchanged but fell in the United States as well as the averages for G7 and Organisation of Economic Cooperation and Development (OECD) countries (Figure 1-10). As of September 2015, Canada’s unemployment rate was above averages for the United States, the OECD and the G7.
4
5
6
7
8
9
10
11
12
13
2006Q1 2007Q3 2009Q1 2010Q3 2012Q1 2013Q3 2015Q1
Official unemployment rate R8
%
Figure 1-9

Labour Market Assessment 2015
11
Unemployment rate, change from 2014Q3 to 2015Q3
Source: OECD harmonized unemployment rates.
Between 2014Q2 and 2015Q2, Canada’s employment rate rose by 0.4 percentage points. This was less than averages for the United States, the G7 and the OECD. However, Canada’s employment rate of 72.6 per cent in 2015Q2 remained above other international benchmarks.2
Employment rate, change from 2014Q2 to 2015Q2
Source: OECD.
-1.0
-0.9
-0.8
-0.7
-0.6
-0.5
-0.4
-0.3
-0.2
-0.1
0.0
Canada United States G7 OECD
%
0.0
0.1
0.2
0.3
0.4
0.5
0.6
0.7
0.8
Canada United States G7 OECD
%
Figure 1-10
Figure 1-11

Labour Market Assessment 2015
12
2. Indicators by Province and Industry This section reviews province-and industry-level labour market indicators over the past year, a period that coincided with a historically large decline in oil prices. PBO compares the change in the indicators from 2014Q3, before the fall of oil prices, to the most recent quarter of 2015Q3. PBO does not attribute entirely the change in the indicators between 2014Q3 to 2015Q3 to the drop in oil prices.
In the oil-producing provinces of Alberta and Saskatchewan, unemployment rates increased sharply, more than 1.0 percentage points, (Figure 2-1) between 2014Q3 and 2015Q3. In the case of both provinces, the unemployment rate remained below the national average.
During this year-long period, employment rates fell 0.5 percentage points in Alberta and 0.7 percentage points in Saskatchewan. At the same time, they rose 0.3 percentage points in Quebec and 0.2 percentage points in Manitoba and British Colombia.
Ontario, Quebec and Manitoba have seen various labour market indicators strengthen modestly since the fall in oil prices.
Detailed province-level indicators are provided in Appendix A.
Province- and industry-level indicators, change from 2014Q3 to 2015Q3
Sources: Parliamentary Budget Officer and Statistics Canada.
-5
-4
-3
-2
-1
0
1
2
-5
-4
-3
-2
-1
0
1
2
AB SK ON QC Mining,oil and gas
Services Totalemployment
Unemployment rate EmploymentPercentage points %
Figure 2-1

Labour Market Assessment 2015
13
Employment in the goods-sector decreased 0.6 per cent from 2014Q3 to 2015Q3, the result of a nearly 4 per cent decline in employment in the mining, oil and gas extraction industry (Figure 2-1).
Employment in manufacturing has risen 0.1 per cent, a modest gain given the sharp depreciation of the Canadian dollar.
Employment in service industries grew 1.4 per cent. It was the primary driver of total employment gains (1.0 per cent growth since 2014Q3) since the fall in oil prices.
Additional industry level indicators are provided in Appendix A.
Overall, labour market indicators have deteriorated in affected oil-producing provinces and industries. However, at the national level, indicators remained unchanged or improved over the past year. But they remained below their trend estimates as of 2015Q3.

Labour Market Assessment 2015
14
3. Overqualification There are additional measures of labour market utilization beyond the standard indicators discussed in the first section of this report.
For example, those who are working part time involuntarily or have left the labour force entirely are not included in the standard indicators. The Bank of Canada has developed a composite indicator designed to capture a broad range of such information including some of these variables.3
PBO considered an additional measure of labour utilization for recent university graduates. This measure is their educational credentials relative to the educational requirements of their occupation. Workers could be considered underutilized if their educational qualifications exceeded those required for their current position.
This has been studied extensively including recent work on overqualification in Canada by Statistics Canada.4 Our work builds on the existing literature by constructing a times series component of overqualification using monthly data from the Labour Force Survey.
As discussed by Uppal and Larochelle-Côté (2014), we would expect the level of overqualification to rise and fall with the level of unemployment. This is because those on the margin may face a choice between taking a lower paying job for which they are overqualified or being unemployed.
There are costs associated with a rising number of overqualified workers. These workers may face lower levels of job satisfaction and attachment, which could increase turnover rates for employers.
Moreover, it is costly to obtain educational credentials. Many university graduates forgo labour market earnings and experience to attain credentials for a position in their field of choice.5

Labour Market Assessment 2015
15
An important caveat of this methodology is that we use educational attainment as the sole measure of qualification; we do not account for factors such as experience or labour demand.
For this reason, we focus our analysis on the overqualification of recent university graduates, that is, those aged 25 to 34. The relative importance of educational qualifications in determining labour market outcomes would be most important for younger workers and, in particular, recent graduates from post-secondary education.
Overqualification among recent university graduates has risen over the past 25 years
PBO finds that between 1991 and 2014, the proportion of recent university graduates aged 25 to 34 who were overqualified based on their educational credentials increased from about 32 per cent to 40 per cent. The proportion of those who were rightfully qualified fell from 62 per cent to 55 per cent (Figure 3-1).
The number of overqualified university graduates increased following the 2008-2009 recession. While the unemployment rate of university graduates aged 25 to 34 increased from 4.3 per cent in 2008 to 5.7 per cent in 2010, it fell back to 5.3 per cent in 2011.
However, the overqualification rate among university graduates aged 25 to 34 rose from 38 per cent in 2008 to 40 per cent in 2014 (Figure 3-1).
Key Definitions
An individual is considered “rightfully qualified” if his or her highest educational attainment is equivalent to that usually required for their occupation.
An individual is considered “overqualified” if his or her highest educational attainment exceeds that usually required for their occupation.
An individual is considered “underqualified” if his or her highest educational attainment is lower that usually required for their occupation.

Labour Market Assessment 2015
16
Educational credentials vs. educational requirements for recent university graduates
Sources: Parliamentary Budget Officer and Statistics Canada.
PBO finds that in 2014, about 140,000, or 56 per cent of recent university graduates aged 24 or younger were overqualified; roughly 65 per cent were either overqualified or unemployed.
Among university graduates aged 25 to 34, about 600,000 or 40 per cent were overqualified in 2014 (Table 3-1).
Educational qualifications for university graduates by age group in 2014
Thousands of workers Right Over Unemployed
Ages 24 or younger 85 140 25 Ages 25 to 34 795 582 77
% of cohort total
Ages 24 or younger 34.1 55.9 9.9 Ages 25 to 34 54.7 40.0 5.3
Sources: Parliamentary Budget Officer and Statistics Canada. Note: Right refers to rightfully qualified, over refers to overqualified based on
educational credentials.
30
35
40
45
50
55
60
65
1990 1992 1994 1996 1998 2000 2002 2004 2006 2008 2010 2012 2014
Rightfully qualified (LHS) Overqualified (RHS)
% of workers aged 25 to 34 with a university degree
Table 3-1
Figure 3-1

Labour Market Assessment 2015
17
Overqualification among recent college graduates has declined in recent years
In contrast to recent university graduates, the rate of overqualification for recent college graduates declined from 37 per cent in 2006 to 34 per cent in 2014, roughly equivalent to mid-1990s levels.
The proportion of recent college graduates who were rightfully employed increased from 45 per cent in 1998 to 50 per cent in 2014.
Educational credentials vs. educational requirements for recent college graduates
Sources: Parliamentary Budget Officer and Statistics Canada.
LFS findings consistent with recent National Graduate Survey results
To provide an alternative estimate of overqualification among university graduates, PBO examined Statistics Canada’s most recent National Graduates Survey.6
By 2009/10, 30 per cent of the university graduates of 2009-10 reported “having more education than required to get last week’s job”; 39 per cent of the responded university graduates reported “having the same level of education as required to get last week’s job.”
25.0
30.0
35.0
40.0
40
45
50
55
1990 1992 1994 1996 1998 2000 2002 2004 2006 2008 2010 2012 2014
Rightfully qualified (LHS) Overqualified (RHS)
% of workers aged 25 to 34 with a college degree
Figure 3-2

Labour Market Assessment 2015
18
By 2013, about 34 per cent of the university graduates of 2009-10 reported “having more education than required to get last week’s job” while 38 per cent reported “having the same level of education as required.”
This is consistent with PBO’s finding that shows a rise in overqualified university graduates and a decline in rightfully qualified graduates since the recent recession.
Demand-related factors are key reasons for overqualification
Among the university graduates who reported “having more education than required to get last week’s job,” the two most popular answers provided for why their current job differed from intended occupation were: (1) they could not find jobs they wanted and (2) they could not wait for jobs they wanted. These were cited by about 33 per cent of those who reported having more education than required among graduates by 2009/2010 and about 31 per cent by 2013.7
Overqualification most prevalent in service occupations
According to Uppal and Larochelle-Côté, in 2011, “the vast majority of those who were overqualified were in just three fields of study: (1) business, management and public administration; (2) social and behavioural sciences and law; and (3) humanities.”
In occupations requiring only a high school education, PBO found that in 2014 overqualified individuals were most prevalent in clerical occupations (28 per cent of overqualified in occupations requiring just a high school diploma); sales and services occupations (20 per cent of the total); and retail sales and clerks (9 per cent of the total).
For occupations requiring some post-secondary education, overqualified individuals were most prevalent in insurance and real estate (14 per cent of overqualified in occupations requiring some post-secondary education); and in administrative and regulatory occupations (14 per cent).
Statistics Canada has recently released a survey of job vacancies (JVWS). Data for 2015Q1 finds the highest vacancies are reported for occupations requiring lower levels of skill.8

Labour Market Assessment 2015
19
Disaggregated Indicators Appendix A:The aggregate labour market indicators examined in the body of the report can be disaggregated by province and industry. PBO does not estimate provincial or industrial trends. Given the diversity of the Canadian labour market, PBO compares labour market indicators across provinces and industries.
Labour market indicators by province
Levels of employment for most provinces were higher in 2015Q3 than levels in the same quarter a year earlier.
Between 2014Q3 and 2015Q3, four of the ten provinces – British Colombia, Alberta, Manitoba and Quebec – posted employment growth above the national average (Figure A-1).
Employment growth, 2014Q3 to 2015Q3
Sources: Parliamentary Budget Officer and Statistics Canada.
Given the variation in the growth of the working-age population across provinces, it is useful to compare changes in the levels of the employment rate (Figure A-2).
The oil-producing provinces of Alberta and Saskatchewan experienced declines in their employment rates following 2014Q3 (Figure A-2). This coincided with the sharp decline in oil prices observed over the same period.
-1.0
-0.5
0.0
0.5
1.0
1.5
2.0
2.5
BC AB SK MB ON QC NB NS PE NL
Employment growth National average
%
Figure A-1

Labour Market Assessment 2015
20
Employment rates, change from 2014Q3 to 2015Q3
Sources: Parliamentary Budget Officer and Statistics Canada.
From 2014Q3 to 2015Q3, the labour force participation rate rose in six provinces: British Colombia, Alberta, Saskatchewan, Manitoba, Quebec and Newfoundland and Labrador. However, nationally it declined by 0.1 percentage points, with the largest declines in Ontario and Prince Edward Island (Figure A-3).
Labour force participation rates, change from 2014Q3 to 2015Q3
Sources: Parliamentary Budget Officer and Statistics Canada.
-1.0
-0.5
0.0
0.5
1.0
BC AB SK MB ON QC NB NS PE NL
Employment rate National average
Percentage points
-1.0
-0.5
0.0
0.5
1.0
BC AB SK MB ON QC NB NS PE NL
Participation rate National average
Percentage points
Figure A-2
Figure A-3

Labour Market Assessment 2015
21
Unemployment rates have risen significantly in Alberta, Saskatchewan and Prince Edward Island since 2014Q3. However, they have fallen notably in Ontario, reflecting the sizeable decline in labour force participation (Figure A-4).
In the Western provinces, unemployment rates as of 2015Q3 remained lower than in Ontario despite the decline in oil prices (Figure A-5).
Unemployment rates, change from 2014Q3 to 2015Q3
Sources: Parliamentary Budget Officer and Statistics Canada.
Unemployment rates, 2015Q3
Sources: Parliamentary Budget Officer and Statistics Canada.
-1.0
-0.5
0.0
0.5
1.0
1.5
BC AB SK MB ON QC NB NS PE NL
Unemployment rate National average
Percentage points
0
2
4
6
8
10
12
14
BC AB SK MB ON QC NB NS PE NL
Unemployment rate National average
%
Figure A-4
Figure A-5

Labour Market Assessment 2015
22
Labour market indicators by industry
The impact of the decline in oil prices is reflected in the industry-level data. Goods-sector employment decreased by 0.6 per cent from 2014Q3 to 2015Q3 (Figure A-6) as mining, oil and gas extraction fell nearly 4 per cent.
Employment in manufacturing increased 0.1 per cent, a modest gain given the sharp depreciation of the Canadian dollar.
Employment in service industries, the primary driver of total employment gains since the fall in oil prices, grew 1.4 per cent.
Between 2014Q3 and 2015Q3, the 1.1 per cent increase in public sector employment outpaced the 0.8 per cent growth in private sector employment (Figure A-7). During the same period, the 3.5 per cent growth in wages in service industries exceeded the 2.6 per cent increase in goods industries.
However, wages in the subgroup containing oil and gas extraction grew 3.9 per cent over this time despite the sharp fall in employment (Figure A-8).
Employment, change from 2014Q3 to 2015Q3
Sources: Parliamentary Budget Officer and Statistics Canada.
-5
-4
-3
-2
-1
0
1
2
Goods Mining, oil and gasextraction
Manufacturing Services
Employment All industries
%
Figure A-6

Labour Market Assessment 2015
23
Employment, change from 2014Q3 to 2015Q3
Sources: Parliamentary Budget Officer and Statistics Canada.
Employment, change from 2014Q3 to 2015Q3
Sources: Parliamentary Budget Officer and Statistics Canada.
0.0
0.2
0.4
0.6
0.8
1.0
1.2
1.4
1.6
1.8
Private sector Public sector Self employed
Employment All industries
%
0.0
0.5
1.0
1.5
2.0
2.5
3.0
3.5
4.0
4.5
Goods Forestry, fishing,mining, oil and gas
extraction
Manufacturing Services
Wages and salaries All industries
%
Figure A-7
Figure A-8

Labour Market Assessment 2015
24
Methodology for Assessing Appendix B:Qualification
Using microdata from the Labour Force Survey (LFS), 9 PBO analyzed how the educational credentials of recent university graduates corresponded with their job qualifications. The LFS provides the highest educational attainment level and the National Occupational Classification (NOC-S) for each individual in the survey.
Employment and Social Development Canada publishes the National Occupational Classification Matrix (2011) which classifies each NOC code into five skill levels.
Skill 0 occupations are management occupations. Skill A occupations usually require university education. Skill B occupations usually require college education or apprenticeship training. Skill C occupations usually require secondary school and/or occupation-specific training and Skill D requires only on-the-job training.
Table B-1 lists the matching of the NOC-S code reported in the LFS with the skill type identified using the NOC Matrix.
Using the NOC-S code and the highest educational attainment reported in the LFS, we can classify employment into four categories.
A worker is considered “rightfully qualified” for a position if their highest educational attainment matches that usually required for the position.
A worker is considered “overqualified” if their highest educational attainment exceeds that usually required for their position. For example, a person with a university degree and working as a sales associate (Skill C) would be considered overqualified.
A worker is considered “underqualified” if their highest educational attainment is below that of their position.
In this report, individuals working in management positions (Skill 0) are excluded in the calculation of overqualification and underqualification. This is because the qualification required for management positions may vary across sectors. Therefore, they are considered to be “rightfully-qualified.”

Labour Market Assessment 2015
25
NOC-S 2001 Skill Type
1. Senior Management Occupations 0 2. Specialist Managers 0 3. Managers in Retail Trade, Food and Accomodation Services 0 4. Other Managers N.E.C. 0 5. Professional Occupations in Business and Finance A 6. Finance and Insurance Administrative Occupations B 7. Secretaries B 8. Administrative and Regulatory Occupations B 9. Clerical Supervisors B 10. Clerical Occupations C 11. Professional Occupations in Natural and Applied Sciences A 12. Technical Occupations Related to Natural and
Applied Sciences B
13. Professional Occupations in Health A 14. Nurse Supervisors and Registered Nurses A 15. Technical and Related Occupations in Health B 16. Assisting Occupations in Support of Health Services C 17. Judges, Lawyers, Psychologists, Social Workers,
Ministers of Religion, and Policy and Program Officers A
18. Teachers and Professors A 19. Paralegals, Social Services Workers and Occupations in
Education and Religion, N.E.C. B
20. Professional Occupations in Art and Culture A 21. Technical Occupations in Art, Culture, Recreation and Sport B 22. Sales and Service Supervisors B 23. Wholesale, Technical, Insurance, Real Estate Sales
Specialists, and Retail, Wholesale and Grain Buyers B
24. Retail Salespersons and Sales Clerks C 25. Cashiers D 26. Chefs and Cooks B 27. Occupations in Food and Beverage Service C 28. Occupations in Protective Services B 29. Occupations in Travel and Accommodation Including
Attendants in Recreation and Sport C
30. Childcare and Home Support Workers C 31. Sales & Service Occupations N.E.C. C 32. Contractors and Supervisors in Trades and Transportation B 33. Construction Trades B 34. Stationary Engineers, Power Station Operators and Electrical
Trades and Telecommunications Occupations B
35. Machinists, Metal Forming, Shaping and Erecting Occupations B 36. Mechanics B 37. Other Trades N.E.C. B
Table B-1

Labour Market Assessment 2015
26
NOC-S 2001 Skill Type
38. Heavy Equipment and Crane Operators Including Drillers B 39. Transportation Equipment Operators and Related Workers,
Excl. Labourers C
40. Trades Helpers, Construction, and Transportation Labourers and Related Occupations
D
41. Occupations Unique to Agriculture Excluding Labourers C 42. Occupations Unique to Forestry Operations, Mining, Oil and
Gas Extraction,and Fishing, Excluding Laboourers C
43. Primary Production Labourers D 44. Supervisors in Manufacturing B 45. Machine Operators in Manufacturing C 46. Assemblers in Manufacturing C 47. Labourers in Processing, Manufacturing and Utilities D
Note: The NOC-S structure represents an alternate statistical aggregation of the NOC and consists of 47 major groups. The mapping between the NOC-S and NOC groups is based on Statistics Canada (2001).
Sources: Labour Force Survey and National Occupational Classification Matrix (2011).
Table B-1

Labour Market Assessment 2015
27
References Office of the Parliamentary Budget Officer, Labour Market Assessment 2014, March 2014, http://www.pbo-dpb.gc.ca/files/files/Labour_Note_EN.pdf.
Office of the Parliamentary Budget Officer, Pre-Budget Outlook, April 2015, http://www.pbo-dpb.gc.ca/files/files/PreBudgetOutlook2015.pdf.
Statistics Canada, Job Vacancy and Wage Survey, first quarter 2015, August 2015, http://www.statcan.gc.ca/daily-quotidien/150813/dq150813a-eng.htm.
Uppal Sharanjit; LaRochelle-Côté, Sébastien, Overqualification among recent university graduates in Canada, 2014.
Zmitrowitz and Kahn, Beyond the Unemployment Rate: Assessing Canadian and U.S. Labour Markets Since the Great Recession, 2014.

Labour Market Assessment 2015
28
NOTES
1. This report incorporates data up to and including 30 October 2015 unless otherwise indicated.
2. Canada’s employment rate remains persistently higher than the U.S., G7 and OECD averages due to higher levels of labour force participation, in particular by women.
3. Beyond the Unemployment Rate: Assessing Canadian and U.S. Labour Markets Since the Great Recession (Zmitrowitz and Kahn, 2014).
4. See Uppal and Larochelle-Côté (2014) for a discussion of this literature.
5. On the other hand, workers may willingly work in a position for which they are overqualified in order for greater job flexibility or autonomy (e.g., entrepreneur, real estate agent).
6. Statistics Canada, National Graduates Survey 2013.
7. It would be useful to compare the educational qualifications demanded with the supply of labour by educational attainments. Unfortunately, we could not find public national data of labour demand (i.e. job vacancies) by educational requirement or NOCs over history.
8. http://www.statcan.gc.ca/daily-quotidien/150813/dq150813a-eng.htm.
9. This report includes the LFS microdata from January 1990 to December 2014 and was compiled in January 2015. Since then, historical revision of the LFS microdata for 2001 to 2014 came out in February 2015 but would not significantly change the results of the analysis.