labour market transitions of young women and men … market transitions of young women and men in...
TRANSCRIPT

Labour market transitions of young women and men in Jamaica
Publication Series
The Statistical Institute of Jamaica; The Planning Institute of Jamaica
Youth Employment ProgrammeEmployment Policy Department
July 2014
No. 17
Lab
ou
r ma
rket tra
nsitio
ns o
f you
ng w
om
en a
nd m
en in
Jam
aica
iLo

Work4Youth Publication Series No. 17
Labour market transitions of young women and men in
Jamaica
The Statistical Institute of Jamaica; The Planning Institute of Jamaica
International Labour Office ● Geneva
July 2014

Copyright © International Labour Organization 2014
First published 2014
Publications of the International Labour Office enjoy copyright under Protocol 2 of the Universal Copyright Convention. Nevertheless, short
excerpts from them may be reproduced without authorization, on condition that the source is indicated. For rights of reproduction or
translation, application should be made to the Publications Bureau (Rights and Permissions), International Labour Office, CH-1211 Geneva
22, Switzerland, or by email: [email protected]. The International Labour Office welcomes such applications
Libraries, institutions and other users registered with reproduction rights organizations may make copies in accordance with the licences
issued to them for this purpose. Visit www.ifrro.org to find the reproduction rights organization in your country.
ILO Cataloguing in Publication Data
Labour market transitions of young women and men in Jamaica / International Labour Office ; The Statistical Institute of Jamaica ; The
Planning Institute of Jamaica. - Geneva: ILO, 2014
Work4Youth publication series , No.17; ISSN 2309-6780 ; 2309-6799 (web pdf ))
International Labour Office; Statistical Institute of Jamaica; Planning Institute of Jamaica
youth employment / youth unemployment / transition from school to work / data collecting / methodology / Jamaica
13.01.3
Cover design by: Creative Cow
The designations employed in ILO publications, which are in conformity with United Nations practice, and the presentation of material
therein do not imply the expression of any opinion whatsoever on the part of the International Labour Office concerning the legal status of
any country, area or territory or of its authorities, or concerning the delimitation of its frontiers.
The responsibility for opinions expressed in signed articles, studies and other contributions rests solely with their authors, and publication
does not constitute an endorsement by the International Labour Office of the opinions expressed in them.
Reference to names of firms and commercial products and processes does not imply their endorsement by the International Labour Office,
and any failure to mention a particular firm, commercial product or process is not a sign of disapproval.
ILO publications can be obtained through major booksellers or ILO local offices in many countries, or direct from ILO Publications,
International Labour Office, CH-1211 Geneva 22, Switzerland. Catalogues or lists of new publications are available free of charge from the
above address, or by email: [email protected]
Visit our website: www.ilo.org/publns
Printed by the International Labour Office, Geneva, Switzerland
iii
Preface
Youth is a crucial time of life when young people start realizing their aspirations,
assuming their economic independence and finding their place in society. The global jobs crisis
has exacerbated the vulnerability of young people in terms of: i) higher unemployment, ii)
lower quality jobs for those who find work, iii) greater labour market inequalities among
different groups of young people, iv) longer and more insecure school-to-work transitions, and
v) increased detachment from the labour market.
In June 2012, the International Labour Conference of the ILO resolved to take urgent
action to tackle the unprecedented youth employment crisis through a multipronged approach
geared towards pro-employment growth and decent job creation. The resolution “The youth
employment crisis: A call for action” contains a set of conclusions that constitute a blueprint
for shaping national strategies for youth employment.1 It calls for increased coherence of
policies and action on youth employment across the multilateral system. In parallel, the UN
Secretary-General highlighted youth as one of the five generational imperatives to be addressed
through the mobilization of all the human, financial and political resources available to the
United Nations (UN). As part of this agenda, the UN has developed a System-wide Action Plan
on Youth, with youth employment as one of the main priorities, to strengthen youth
programmes across the UN system.
The ILO supports governments and social partners in designing and implementing
integrated employment policy responses. As part of this work, the ILO seeks to enhance the
capacity of national and local-level institutions to undertake evidence-based analysis that feeds
social dialogue and the policy-making process. To assist member States in building a
knowledge base on youth employment, the ILO has designed the “school-to-work transition
survey” (SWTS). The current report, which presents the results of the survey in Jamaica, is a
product of a partnership between the ILO and The MasterCard Foundation. The “Work4Youth”
Project entails collaboration with statistical partners and policy-makers of 28 low- and middle-
income countries to undertake the SWTS and assist governments and the social partners in the
use of the data for effective policy design and implementation. This study is the first covering
the Caribbean region and the choice of Jamaica is strategic also given the previous engagement
of the country in the Youth Employment Network and the regular South-South cooperation
taking place in the Caribbean. The ILO looks forward to promote and exchange further with
similar ventures in the sub-region.
It is not an easy time to be a young person in the labour market today. The hope is that
with leadership from the UN system, with the commitment of governments, trade unions and
employers’ organizations and through the active participation of donors such as The
MasterCard Foundation, the international community can provide the effective assistance
needed to help young women and men make a good start in the world of work. If we can get
this right, it will positively affect young people’s professional and personal success in all future
stages of life.
Azita Berar Awad
Director
Employment Policy Department
Giovanni di Cola
Director
ILO Decent Work Team and Office for the
Caribbean
1 The full text of the 2012 resolution “The youth employment crisis: A call for action” can be found
on the ILO website at: http://www.ilo.org/ilc/ILCSessions/101stSession/texts-
adopted/WCMS_185950/lang--en/index.htm.


v
Contents
Page
Preface ............................................................................................................................ iii
Contents ............................................................................................................................ v
Acknowledgements ........................................................................................................................... xi
1. Introduction and main findings ............................................................................................... 1
1.1 Overview ....................................................................................................................... 1
1.2 Structure of the report ................................................................................................... 1
1.3 Main findings ................................................................................................................ 1
2. Overview of the labour market and survey methodology ....................................................... 3
2.1 The socio-economic context ......................................................................................... 3
2.1.1 Economic overview ............................................................................................ 4
2.1.2 Social and environmental overview ................................................................... 5
2.1.3 Developmental challenges and opportunities ..................................................... 6
2.2 Labour market overview ............................................................................................... 8
2.3 Survey objectives and methodology ............................................................................. 9
2.3.1 Sample design and selection ............................................................................... 10
2.3.2 Training of trainers ............................................................................................. 10
2.3.3 Training of interviewers ..................................................................................... 11
2.3.4 Fieldwork ............................................................................................................ 11
2.3.5 Data processing .................................................................................................. 12
3. Characteristics of youth in the sample survey ......................................................................... 12
3.1 Individual characteristics of youth ................................................................................ 12
3.1.1 Age and sex distribution ..................................................................................... 12
3.1.2 Area of residence and the migration of youth .................................................... 13
3.1.3 The household .................................................................................................... 14
3.1.4 Financial situation .............................................................................................. 17
3.1.5 Health problems .................................................................................................. 20
3.1.6 Primary caregivers/parents ................................................................................. 20
3.1.7 Education and training ........................................................................................ 23
3.1.8 Main goal in life ................................................................................................. 27
3.2 Economic activity of youth ........................................................................................... 28
3.2.1 Work study combination .................................................................................... 28
3.2.2 Status of economic activity ................................................................................ 29
3.3 Employed youth ............................................................................................................ 30
3.3.1 Informal employment and employment in the informal sector .......................... 33
3.3.2 Wage and salaried workers (employees) ............................................................ 34
3.3.3 Own-account workers and employers (self-employed) ...................................... 37
3.3.4 Contributing family workers .............................................................................. 38
3.3.5 Perceived adequacy of education/training and education mismatch .................. 39

vi
3.3.6 Time related underemployment and other inadequate employment situations .. 42
3.3.7 Future prospects.................................................................................................. 44
3.3.8 The job search..................................................................................................... 45
3.4 Unemployed youth ........................................................................................................ 47
3.4.1 Steps to find work ............................................................................................... 52
3.4.2 Discouraged youth .............................................................................................. 53
3.4.3 Details of the job search ..................................................................................... 55
3.5 Youth not in the labour force (inactive youth) .............................................................. 60
4. The stages of transition ........................................................................................................... 62
4.1 Defining school-to-work transition ............................................................................... 62
4.1.1 Concepts ............................................................................................................. 62
4.2 Stages of transition........................................................................................................ 63
4.3 History of economic activity ......................................................................................... 66
4.4 Youth who have successfully transited ......................................................................... 69
4.4.1 Paths of transition ............................................................................................... 72
4.4.2 Length of transition ............................................................................................ 74
4.5 Youth still in transition ................................................................................................. 76
4.5.1 Length of transition ............................................................................................ 78
4.6 Youth who have not yet started the transition .............................................................. 79
5. Relevant institutional and policy frameworks ......................................................................... 80
5.1 Institutional framework ................................................................................................. 80
5.2 Policy framework .......................................................................................................... 80
5.3 Relevant policies ........................................................................................................... 81
5.3.1 National Youth Policy ........................................................................................ 81
5.3.2 National Employment Policy ............................................................................. 82
5.4 Development framework .............................................................................................. 82
5.4.1 Vision 2030 – National Development Plan (NDP)............................................. 82
5.4.2 The Growth Inducement Strategy (2011) ........................................................... 84
5.5 International Monetary Fund (IMF).............................................................................. 84
5.6 Skills development framework ..................................................................................... 85
References ......................................................................................................................................... 89
Annex I. Key indicators of the Jamaican youth labour market ......................................................... 91
Annex II. Definitions of labour market statistics .............................................................................. 93
Annex III. Additional tables .............................................................................................................. 95
Annex IV. Persons involved in the survey ........................................................................................ 101

vii
Tables
2.1 Selected socio-economic indicators (2008–12)....................................................................... 5
2.2 Labour market indicators, April 2012-2013 ............................................................................ 8
2.3 Jamaican SWTS: Number of EDs and dwellings selected by geographic area and parish ..... 10
3.1 Jamaican youth by age and sex ............................................................................................... 12
3.2 Youth by area of residence, mobility and sex ......................................................................... 13
3.3 Youth by mean age of first marriage/common-law relationship ............................................. 15
3.4 Spouses of youth by economic activity and sex ...................................................................... 16
3.5 Youth with children by number of children and sex ............................................................... 16
3.6 Youth by socio-economic status, sex, age group and area of residence ................................. 17
3.7 Youth by level of difficulty in selected activities ................................................................... 20
3.8 Youth by level of formal education and enrolment in school/training programme (%) ......... 24
3.9 Youth by field currently studying, field would like to study and sex (%) .............................. 25
3.10 Out-of-school youth by level of formal education completed (%) ......................................... 26
3.11 Youth by main goal in life and suicidal tendency ................................................................... 27
3.12 Youth and economically active students by economic activity status .................................... 29
3.13 Employed youth by age group, geographical area, level of completed formal education and
sex ........................................................................................................................................... 30
3.14 Young wage and salaried workers by contract type, tenure and satisfaction with contract .... 34
3.15 Self-employed youth by employment category and reason for being self-employed (%) ...... 37
3.16 Youth by perceived appropriateness of education/training, level of education, sex, age
group, area of residence and wealth index quintile ................................................................. 40
3.17 ISCO major groups and education levels ................................................................................ 41
3.18 Shares of overeducated and undereducated young workers by major occupational category
(ISCO-08, %) .......................................................................................................................... 42
3.19 Youth by inadequate employment situation ............................................................................ 43
3.20 Mean hourly wages of young wage and salaried workers and self-employed workers by sex
and level of completed education (Jamaican dollars) ............................................................. 44
3.21 Youth by number of jobs applied for and interviews attended in the 12 months prior to
starting current job .................................................................................................................. 46
3.22 Employed youth who refused a job by reason for refusal ....................................................... 46
3.23 Unemployed youth by age group (%) ..................................................................................... 48
3.24 Youth unemployment rate and level of formal education completed (%) .............................. 49
3.25 Unemployed youth by type of father-figure caregiver (%) .................................................... 49
3.26 Unemployed youth by type of mother-figure caregiver (%) ................................................... 50
3.27 Youth by labour market and socio-economic status ............................................................... 51
3.28 Youth suicidal tendency by economic activity status (%) ...................................................... 52
3.29 Unemployed youth by sex and main reason for not actively seeking work ............................ 53
3.30 Discouraged unemployed youth by financial resources, outlook and perceived role of the
government (%) ....................................................................................................................... 54

viii
3.31 Unemployed youth by occupation sought, preferred employer and sex ................................. 55
3.32 Unemployed youth by details of refusing a job ...................................................................... 56
3.33 Unemployed youth by consideration to move to find work .................................................... 58
3.34 Unemployed youth by main obstacle to finding a job ............................................................ 58
3.35 Unemployed youth by perceived usefulness of education/training in finding a job by sex
(%) ........................................................................................................................................... 59
3.36 Youth not in the labour force by enrolment in school/training and sex .................................. 60
4.1 Youth by stage of transition and area of residence (%) .......................................................... 65
4.2 Youth by rate of transition and wealth index quintile (%) ...................................................... 66
4.3 Youth by contractual arrangement in first activity, job satisfaction, reasons for leaving first
job and sex .............................................................................................................................. 68
4.4 Transited youth by category and age group ............................................................................ 71
4.5 Transited youth by path of transition and selected demographic characteristics (%) ............. 73
4.6 Transited youth by category, sex and mean length of transition (months) ............................. 74
4.7 Transited youth by demographic characteristics and average length of transition (months) .. 75
4.8 Youth in transition by reason for wanting to change their work situation (%) ....................... 78
A.1 Youth by relationship to head of household and sex .............................................................. 95
A.2 Youth by relationship to head of household and age group .................................................... 95
A.3 Youth by marital status and sex .............................................................................................. 95
A.4 Youth by union status and age of first cohabitation ................................................................ 95
A.5 Youth by union status and average age of first cohabitation .................................................. 96
A.6 Youth by union status, age of first cohabitation and sex (%).................................................. 96
A.7 Youth enrolled in school or training programme by level of formal education and sex ......... 96
A.8 Young students by sex and ideal occupation (%) ................................................................... 96
A.9 Young students by sex and desired employer (%) .................................................................. 97
A.10 Out-of-school youth by highest level of education completed ............................................... 97
A.11 Early school leavers by reason for ending education .............................................................. 97
A.12 Youth by educational enrolment status and economic activity status ..................................... 97
A.13 Unemployed youth by educational enrolment status and unemployed students by level of
education ................................................................................................................................. 98
A.14 Economically active youth by employment status and wealth index quintile ........................ 98
A.15 Economically active youth by employment status, perceived household financial status and
most important goal in life ...................................................................................................... 98
A.16 Unemployed youth by sex, desire to work and main reason for not being available for work
(%) ........................................................................................................................................... 99
A.17 Discouraged youth by sex and main reason for not seeking work or trying to start a
business during the last 30 days .............................................................................................. 99
A.18 Transited youth by reason for leaving first job and sex .......................................................... 99
A.19 Transited youth by transition path, spells and sex .................................................................. 100
A.20 Youth who have not yet started their transition by educational enrolment status ................... 100
ix
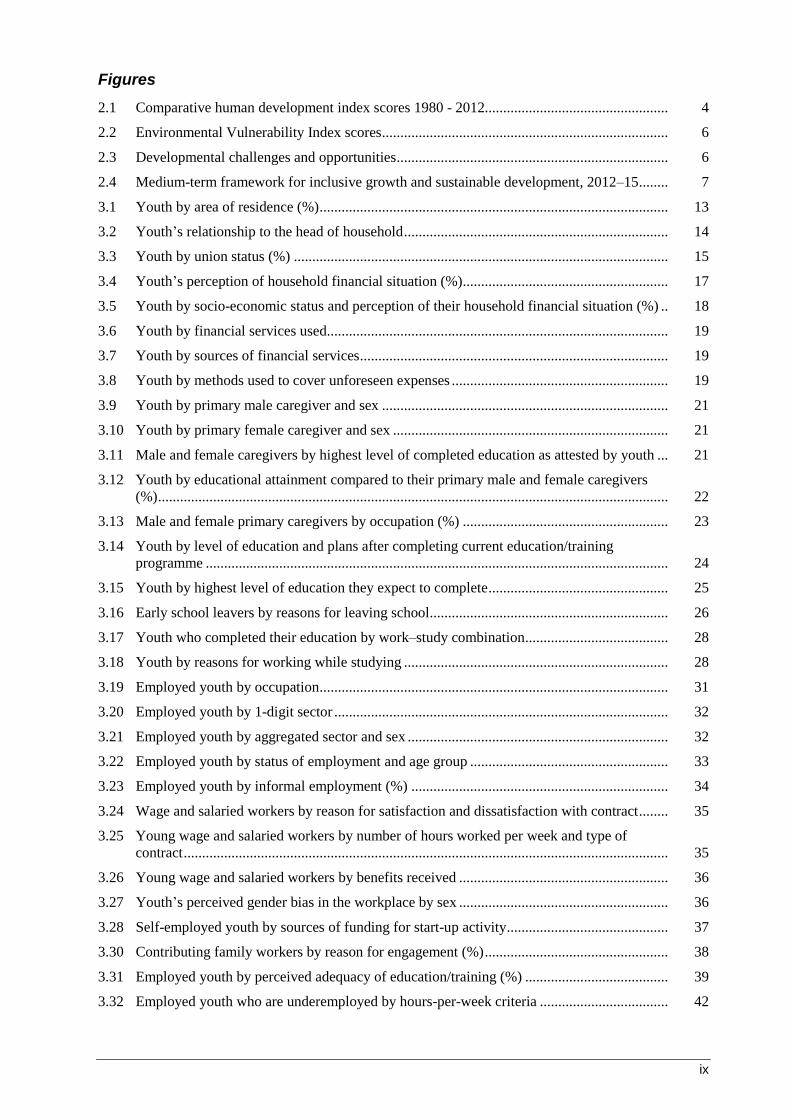
Figures
2.1 Comparative human development index scores 1980 - 2012.................................................. 4
2.2 Environmental Vulnerability Index scores .............................................................................. 6
2.3 Developmental challenges and opportunities .......................................................................... 6
2.4 Medium-term framework for inclusive growth and sustainable development, 2012–15 ........ 7
3.1 Youth by area of residence (%) ............................................................................................... 13
3.2 Youth’s relationship to the head of household ........................................................................ 14
3.3 Youth by union status (%) ...................................................................................................... 15
3.4 Youth’s perception of household financial situation (%)........................................................ 17
3.5 Youth by socio-economic status and perception of their household financial situation (%) .. 18
3.6 Youth by financial services used............................................................................................. 19
3.7 Youth by sources of financial services .................................................................................... 19
3.8 Youth by methods used to cover unforeseen expenses ........................................................... 19
3.9 Youth by primary male caregiver and sex .............................................................................. 21
3.10 Youth by primary female caregiver and sex ........................................................................... 21
3.11 Male and female caregivers by highest level of completed education as attested by youth ... 21
3.12 Youth by educational attainment compared to their primary male and female caregivers
(%) ........................................................................................................................................... 22
3.13 Male and female primary caregivers by occupation (%) ........................................................ 23
3.14 Youth by level of education and plans after completing current education/training
programme .............................................................................................................................. 24
3.15 Youth by highest level of education they expect to complete ................................................. 25
3.16 Early school leavers by reasons for leaving school................................................................. 26
3.17 Youth who completed their education by work–study combination ....................................... 28
3.18 Youth by reasons for working while studying ........................................................................ 28
3.19 Employed youth by occupation ............................................................................................... 31
3.20 Employed youth by 1-digit sector ........................................................................................... 32
3.21 Employed youth by aggregated sector and sex ....................................................................... 32
3.22 Employed youth by status of employment and age group ...................................................... 33
3.23 Employed youth by informal employment (%) ...................................................................... 34
3.24 Wage and salaried workers by reason for satisfaction and dissatisfaction with contract ........ 35
3.25 Young wage and salaried workers by number of hours worked per week and type of
contract .................................................................................................................................... 35
3.26 Young wage and salaried workers by benefits received ......................................................... 36
3.27 Youth’s perceived gender bias in the workplace by sex ......................................................... 36
3.28 Self-employed youth by sources of funding for start-up activity ............................................ 37
3.30 Contributing family workers by reason for engagement (%) .................................................. 38
3.31 Employed youth by perceived adequacy of education/training (%) ....................................... 39
3.32 Employed youth who are underemployed by hours-per-week criteria ................................... 42
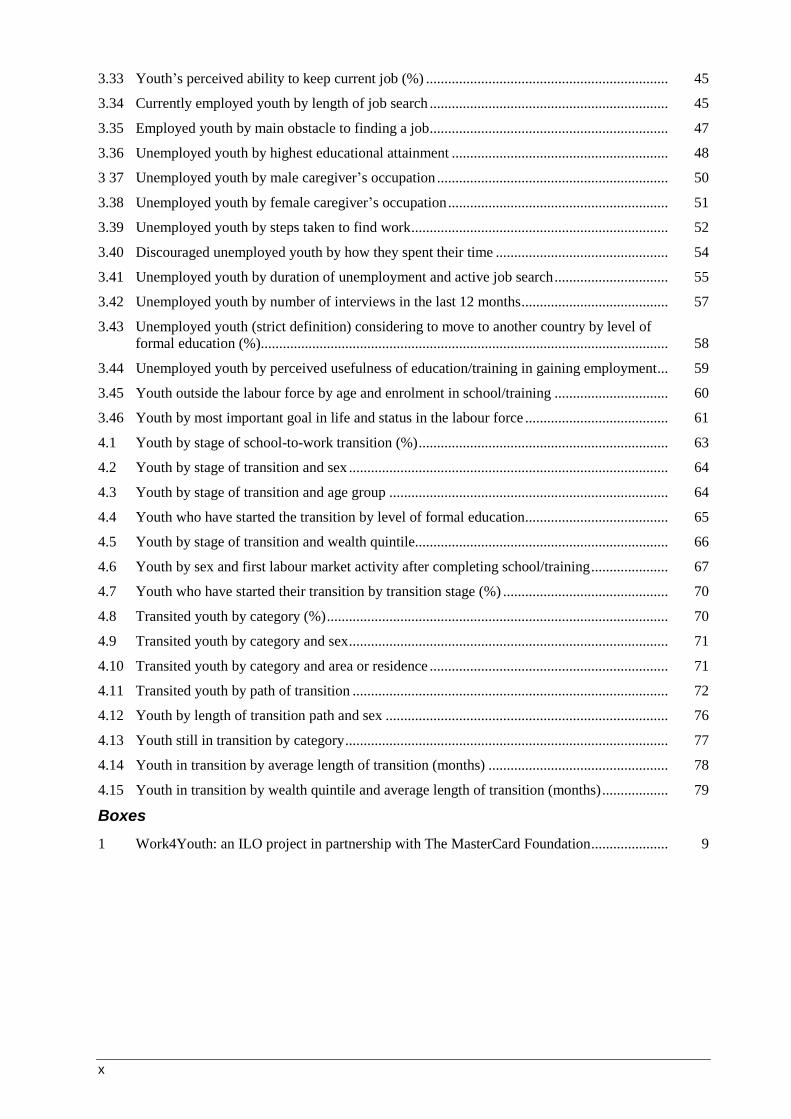
x
3.33 Youth’s perceived ability to keep current job (%) .................................................................. 45
3.34 Currently employed youth by length of job search ................................................................. 45
3.35 Employed youth by main obstacle to finding a job ................................................................. 47
3.36 Unemployed youth by highest educational attainment ........................................................... 48
3 37 Unemployed youth by male caregiver’s occupation ............................................................... 50
3.38 Unemployed youth by female caregiver’s occupation ............................................................ 51
3.39 Unemployed youth by steps taken to find work ...................................................................... 52
3.40 Discouraged unemployed youth by how they spent their time ............................................... 54
3.41 Unemployed youth by duration of unemployment and active job search ............................... 55
3.42 Unemployed youth by number of interviews in the last 12 months ........................................ 57
3.43 Unemployed youth (strict definition) considering to move to another country by level of
formal education (%)............................................................................................................... 58
3.44 Unemployed youth by perceived usefulness of education/training in gaining employment... 59
3.45 Youth outside the labour force by age and enrolment in school/training ............................... 60
3.46 Youth by most important goal in life and status in the labour force ....................................... 61
4.1 Youth by stage of school-to-work transition (%) .................................................................... 63
4.2 Youth by stage of transition and sex ....................................................................................... 64
4.3 Youth by stage of transition and age group ............................................................................ 64
4.4 Youth who have started the transition by level of formal education ....................................... 65
4.5 Youth by stage of transition and wealth quintile..................................................................... 66
4.6 Youth by sex and first labour market activity after completing school/training ..................... 67
4.7 Youth who have started their transition by transition stage (%) ............................................. 70
4.8 Transited youth by category (%) ............................................................................................. 70
4.9 Transited youth by category and sex ....................................................................................... 71
4.10 Transited youth by category and area or residence ................................................................. 71
4.11 Transited youth by path of transition ...................................................................................... 72
4.12 Youth by length of transition path and sex ............................................................................. 76
4.13 Youth still in transition by category ........................................................................................ 77
4.14 Youth in transition by average length of transition (months) ................................................. 78
4.15 Youth in transition by wealth quintile and average length of transition (months) .................. 79
Boxes
1 Work4Youth: an ILO project in partnership with The MasterCard Foundation ..................... 9
xi
Acknowledgements
The Statistical Institute of Jamaica (STATIN) wishes to thank all individuals,
agencies, groups and organizations that contributed in one way or another to this survey.
Thanks must also go to the International Labour Organization (ILO), which provided
technical and financial assistance for this survey.
We are especially thankful to the STATIN staff who were responsible for conducting
the survey and preparing this report. In this regard, special mention must be made of the
personal input from Douglas Forbes, Project Director, and Leesha Delatie-Budair, Project
Coordinator.
We also acknowledge the diligent work of other STATIN staff members, in particular
the Field Services Division headed by Merville Anderson and all the interviewers who
assisted with collecting data for the survey, and the Information and Technology Division,
headed by Howard Hamilton and supported by Sydna Amos and Avery Gaynor-Hylton
who, respectively, guided the data processing and provided the programme to generate the
data set. Special mention must be made of those who assisted in training the data collectors
and those who contributed to writing sections of this report.
Survey implementation and editing of the report were supported by Sara Elder and
Yves Perardel of the ILO Work4Youth team.
Mention must also be made, with gratitude, to the Steering Committee, which
included representatives of both the public and private sectors. The Committee was chaired
by Faith Innerarity, and then by Errol Miller from the Ministry of Labour and Social
Security (MLSS). Special mention is made also of Dawn Ellis-Francis, who served as
secretary for the Steering Committee. We appreciate the important role they played in
making this survey a reality. Special thanks to our equally valuable partner, the Planning
Institute of Jamaica (PIOJ), which contributed section 5 of this report.
Finally, this acknowledgement would not be complete without mentioning the
cooperation of the respondents – the thousands of youth – who gave their time to speak to
our interviewers. We appreciate the important role they played in the survey.
Carol Coy,
Director General,
Statistical Institute of Jamaica


1
1. Introduction and main findings
1.1 Overview
The school-to-work transition survey (SWTS) generates relevant labour market
information on young people aged 15–29, including longitudinal information on transitions
within the labour market. The SWTS thus serves as a unique tool to demonstrate the
increasingly tentative and indirect paths to decent and productive employment that today’s
young men and women face. The 2013 round of the SWTS was the second such survey to
be conducted in Jamaica, the first being in 2006. It proved to be a critical instrument in
assessing the challenges youth in Jamaica confront as they search for appropriate and
satisfactory employment.
The targeted age cohort is of particular interest to researchers and policy-makers, as
this is the time when youth aim to assert their independence and start on a path to realizing
their goals. One of youth’s major goals is to obtain decent and satisfactory employment
that will facilitate the attainment of their other goals. The employment goal, however,
continues to be elusive for many, especially in light of the global economic crisis that has
had far-reaching effects, particularly in small island developing states such as Jamaica.
This survey’s findings aim to shed light on the experiences of youth in Jamaica today
as they leave school and seek employment. It also provides insight into youth’s current
perceptions of their future prospects, life goals and aspirations.
1.2 Structure of the report
Section 2 presents a socio-economic overview of Jamaica and its labour force as
shown in the quarterly Labour Force Survey (LFS). It also outlines the survey processes,
detailing the sample design, data collection and data processing activities. The main results
of the Jamaican 2013 SWTS are presented in section 3. It begins with details on the
characteristics of youth, then continues with an in-depth analysis of youth in the labour
force and concludes with a look at youth who are outside it. Section 4 introduces the
concept of labour market transition and assesses its various stages. This section also
includes an analysis of the characteristics that increase the probability of a more successful
labour market outcome, particularly the attainment of stable and satisfactory employment.
The final part of the report, section 5, presents the policy framework affecting youth in
Jamaica, along with policy recommendations arising from the survey’s findings.
1.3 Main findings
Jamaican youth and higher education
Young Jamaicans understand the importance of gaining an education. The survey
found that 50.1 per cent of youth were better educated than their fathers, and 43.9 per cent
were better educated than their mothers. In addition, a majority of young students (58.4 per
cent) indicated that “university/tertiary” education was the highest level they expected to
complete, and another 21.5 per cent expected to complete postgraduate studies.
Interestingly, females had a greater expectation of completing higher education than their
male counterparts; approximately 62 per cent of females compared to 55 per cent of males
expect to complete university/tertiary-level education. Additionally, 25 per cent of females
compared to 18 per cent of males expect to complete postgraduate studies. Males were,

2
however, more inclined to pursue post-secondary vocational training (17.6 per cent) than
their female counterparts (9.2 per cent).
Despite the desire to obtain higher education, 64.8 per cent or approximately 491,200
youth were not enrolled in a school or training programme at the time of the survey. Of
this amount, more than one-half (53.5 per cent) were educated to the secondary level; 8.9
per cent had tertiary- or higher-level education, and 18.6 per cent had post-secondary
vocational training. Among youth not enrolled in school, 26.2 per cent were early school
leavers and did not complete their education or training programme. Economic reasons
was the primary response (45.1 per cent) when youth were asked to identify the main
reason for not completing their education or training.
Goals and aspirations of Jamaican youth
Jamaican youth largely desired career and personal success. When asked about their
main goal in life, 39.5 per cent indicated to be successful at work. “Having a good family”
(21.4 per cent) was the second most popular goal, while “making a contribution to society”
(14.0 per cent) was the third.
Youth enrolled in school or training were asked to indicate their ideal job. The
majority aspired to become “professionals” (54.3 per cent); other aspirations were “service
workers, shop and market sales workers” (13.0 per cent), “technicians and associate
professionals” (10.3 per cent) and “legislators, senior officials and managers” (9.6 per
cent). Most young students also indicated they would ideally like to work for the
“government” (51.2 per cent), for “themselves” (26.5 per cent) or for a “private company”
(17.7 per cent).
Economic activity of Jamaican youth
The survey found that 59.5 per cent of Jamaican youth were economically active, split
39.9 per cent employed and 19.6 per cent unemployed (using the strict definition of
unemployment). Using the relaxed definition, 72.4 per cent of youth were economically
active, split 39.9 per cent employed and 32.5 per cent unemployed.
Among the employed, the majority were male (58.2 per cent) and from urban areas
(57.9 per cent), and the largest age group was those aged 25–29 (46.6 per cent). Employed
youth primarily worked as service workers, shop and market sales workers (28.1 per cent)
in the services sector (75.1 per cent of the economy). Youth worked mainly in the informal
sector (42.0 per cent) and in informal employment outside the informal sector (33.2 per
cent).
Approximately 25 per cent of youth were entrepreneurs. Of these, 23.1 per cent were
own-account workers and 1.7 per cent employers. Youth entrepreneurs were asked to
indicate why they chose self-employment rather than being employed: the two main
reasons cited were the inability to find a wage or salaried job (38.1 per cent) and the desire
for greater independence (34.2 per cent).
Unemployed youth were mainly females (56.6 per cent), and the largest age group
was those aged 20–24 (46.9 per cent). The same pattern was evident for the relaxed
definition; Jamaican youth unemployment was 44.9 per cent using the relaxed definition,
and 33.0 per cent using the strict. In addition, the data show that the unemployment rate
decreased as the level of education increased. Unemployed youth were asked to state how
long they were without work and actively seeking employment: 38.0 per cent had sought
work for over 2 years; another 23.0 per cent were available and had actively been seeking
work for at least 1 but less than 2 years; and 18.5 per cent were unemployed and had been
seeking work for 6 months to less than 1 year.

3
Of the estimated 307,200 youth outside the labour force (strict), approximately
207,800 or 67.6 per cent were in school or training. The remaining 99,400 youth were
neither seeking work nor enrolled in school/training; the main reasons they cited for their
inactivity were “family responsibilities or housework” (31.5 per cent), “pregnancy” (20.2
per cent) and “Illness, injury or disability” (20.3 per cent).
The labour market transition
An estimated 269,000 or 35.5 per cent of Jamaican youth had successfully transited
from school to work. Another 310,800 or 41.0 per cent were still in transition and the
remaining 23.5 per cent had not yet started the transition. The survey showed that a higher
proportion of males (41.6 per cent) than females (29.3 per cent) had transitioned, while a
higher proportion of females (47.1 per cent) than males (35.5 per cent) were still in
transition.
Education appears to impact the ability to transition, as the proportion of transited
youth increases with educational attainment. Most transited youth did not have a smooth or
direct transition (32.4 per cent), but instead experienced “spells of unemployment with or
without spells of employment or activity” (38.7 per cent). On average, it took 33 months
for youth to successfully make the transition from school to stable or satisfactory
employment, with the average length of transition for females (33 months) slightly longer
than for their male counterparts (32 months).
Youth still in transition were mostly unemployed (78.6 per cent), or were inactive
non-students with future work aspirations (10.7 per cent). On average, youth in transition
were in this stage for 68 months, almost 3 years longer than youth who had transited.
Disaggregated by wealth index quintiles, the data show that youth from the poorest two
quintiles had the longest current duration of transition, which declined from 73 months for
the poorest quintile to 50 months for the wealthiest.
2. Overview of the labour market and survey methodology
2.1 The socio-economic context
With about 1 million hectares of land, Jamaica has a population of approximately 2.7
million, growing at an average annual rate of 0.3 per cent. The largest English-speaking
island in the Caribbean, Jamaica is classified as an upper-middle-income country
according to the United Nations Development Programme (UNDP) and is ranked 85th out
of 186 countries and territories on the 2012 Human Development Index (HDI). Jamaica’s
overall HDI score for 2012 was 0.730, placing it in the “middle human development”
category. While Jamaica has consistently scored below its regional counterparts on the
HDI, it generally ranks above the global average (figure 2.1).
The HDI represents a composite measure of three basic dimensions of human
development: health, education and income. The disaggregation of Jamaica’s HDI score
shows that the country scored highest in health (0.841), followed by education (0.748) and
income (0.621). A small island, Jamaica is a heavily indebted developing state; in 2012, it
was ranked as one of the five most indebted countries in the world with regard to public
debt (CIA, 2012). Coupled with the debt burden, Jamaica faces a high crime rate, low
productivity, a weak dollar and a high cost of doing business (Schwab, 2012).
4
Figure 2.1 Comparative human development index scores 1980–2012
Source: UNDP, Human Development Report 2012.
2.1.1 Economic overview
The Jamaican economy is heavily dependent on services, which account for nearly 75
per cent of gross domestic product (GDP). The country relies greatly on external factors,
and derives most of its foreign exchange from tourism, remittances, and the export of
bauxite and alumina. For the second quarter of 2013, remittances accounted for nearly 10
per cent of GDP, and bauxite and alumina made up over 40 per cent of exports. The
economy is very susceptible to external shocks, and has been adversely impacted by the
latest global economic recession.
Bauxite and alumina production was most affected by the global downturn, with
exports falling from 95,024 million Jamaican dollars (JMD) in 2008 to JMD 37,892
million in 2012. However, the tourism industry was resilient, with tourist arrivals
increasing more than 15 per cent over the same period. Tourism accounts for over 7 per
cent of GDP, as estimated by STATIN.
Jamaica’s economy has faced numerous challenges in recent years, with negative or
anaemic growth and repeated adverse shocks. Economic development has been constrained
by a series of natural disasters and external shocks. These include hurricanes in 2001,
2004, 2005, 2007, 2010 and 2011; the 11 September 2001 terrorist attacks in the United
States; international recessions in 2000 and 2007; and steep rises in oil prices, particularly
in the early 1970s and continuous bouts of increases from 2004 to the present. The
economy saw 14 consecutive quarters of negative growth in 2007–10, before recording
positive real GDP growth of 1.7 per cent in 2011. This was short lived, however, as the
economy returned to negative growth in 2012. The total public debt increased from 129.3
per cent of GDP in financial year (FY) 2009–10 to 131.6 per cent in FY 2011–12.
However, despite the difficult global economic environment, Jamaica showed
improvements in a number of its macroeconomic indicators (table 2.1). The fiscal balance
improved from -10.87 per cent of GDP in FY 2009–10 to -6.39 per cent of GDP in FY
2011–12, while the annual inflation rate declined from 16.8 per cent in 2008 to 8.0 per cent
in 2012. The average annual foreign exchange rate of the Jamaican dollar appreciated by
2.7 per cent, from JMD88.49 to one US dollar (US$) in 2009 to JMD86.08 to one US
dollar in 2011. This appreciation in the Jamaican dollar was short lived, however, as it slid
0.500
0.550
0.600
0.650
0.700
0.750
0.800
1980 1985 1990 1995 2000 2005 2006 2007 2008 2009 2010 2011 2012
High human development Latin America and the Caribbean World Jamaica

5
2.3 per cent in 2012 and 12 per cent in the first 10 months of 2013 compared to the US
dollar.
Table 2.1 Selected socio-economic indicators (2008–12)
Indicator 2008 2009 2010 2011 2012
GDP value added at market prices, constant (JMD million) 879 031 840 255 827 819 841 918 838 116
Real annual GDP growth, constant (%) -0.7 -4.4 -1.5 1.7 -0.5
Total debt/GDP (%) 117.25 129.68 131.63 128.02 134.07
Average annual unemployment rate (%) 10.8 11.4 12.4 12.6 13.7
Net remittances/GDP (%) 12.4 12.8 12.5 12.2 12.0
Contribution of services to GDP value added (%) 75.2 76.0 76.2 75.6 75.6
Average annual foreign exchange rate (JMD to US$1.00) 72.92 88.49 87.38 86.08 88.99
Annual inflation rate (%) 16.8 10.2 11.7 6.0 8.0
Population (‘000) 2 677 2 686 2 696 2 704 2 711
Population growth rate (%) 0.4 0.4 0.4 0.3 0.3
Poverty headcount at national poverty line (% of population) 12.3 16.5 17.6 – –
– = nil or negligible
Comparatively, Jamaica lags behind its regional counterparts in competitiveness. The
2013–14 Global Competitiveness Index (GCI) ranks Jamaica 94th out of 148 countries and
characterizes it as a country in the efficiency-driven stage of development. This means
that, although some elements of the competitiveness pillars exist, in most cases they are
not efficiently or effectively supporting Jamaica’s transition to the third stage of
development – that is, an innovation-driven economy. In the index, Jamaica is ranked 95th
in “pay and productivity” and 100th in “capacity to retain talent”, both within the Labour
Market Efficiency pillar. The country, however, ranked higher in “quality of education”
(85th) and “quality of the educational system” (66th), among others.
2.1.2 Social and environmental overview
As previously stated, Jamaica is ranked in the medium human development category
of the HDI, with a value of 0.730 and a rank of 85 out of 186 countries and territories in
the 2012 Index. The prevalence of poverty has increased to 17.6 per cent in 2010 (table
2.1), up from 9.9 per cent in 2007, with the highest prevalence of poverty in rural areas.
Amid the challenges of the global economic crisis, the government embarked on
reforming some social safety nets, with a view to widening the scope and reach in a cost-
effective and efficient manner. This included consolidating existing programmes such as
the Programme of Advancement Through Health and Education (PATH), and the reform
of the National Insurance Scheme.
Jamaica continues to rank high among developing countries on health indicators. In
2011, average life expectancy at birth was 70.40 years for men and 78.02 years for women.
The main causes of mortality and morbidity in Jamaica are chronic non-communicable
diseases (NCDs) such as hypertension, cardiovascular (heart) conditions, diabetes, obesity
and some cancers, as well as violence, injuries, mental illness, and lifestyle practices such
as tobacco consumption and substance abuse.
Jamaica has achieved universal access to early childhood, primary and lower-
secondary levels of education. The adult literacy rate, as reported by the Jamaica Survey of
Living Conditions in 2010, was 91.7 per cent compared to 86.8 per cent estimated in 2009
(based on United Nations Educational, Scientific and Cultural Organization projections).
6
During 2012, significant focus was placed on improving the literacy and numeracy of
school-aged children and enhancing the provision of education at the early childhood level.
Student performance at key national examinations at the various levels showed
overall improvement in 2012. Passes in the Grade 4 literacy test increased from 71 per cent
in 2011 to 74 per cent in 2012 for all schools (public and private). The Grade 4 numeracy
test saw passes increase from 49.2 to 54.3 per cent between 2011 and 2012. In the
Caribbean Examination Council’s Secondary Education Certification examinations, the
pass rate for English language declined significantly from 63.9 per cent in 2012 to 46.0 per
cent in 2011. There was a relatively small decline in the pass rate for mathematics, which
fell from 33.2 per cent in 2011 to 31.7 per cent in 2012.
Jamaica’s economic and social sustainability is dependent on its natural resources. Its
limited natural resource base and environmental vulnerability can easily negate any gains
on the social or economic front. In 2011, Jamaica was ranked as “extremely vulnerable” on
the Environmental Vulnerability Index (EVI),2 which is not uncommon given its Small
Island Developing State (SIDS) status.3 A vast majority of SIDS are ranked as vulnerable
(21.3 per cent), highly vulnerable (36.2 per cent) or extremely vulnerable (36.2 per cent)
(figure 2.2). With respect to environmental protection and sustainability, Jamaica ranked
63rd out of 147 countries in the 2012 Environmental Performance Index.
Figure 2.2 Environmental Vulnerability Index scores
Source: SOPAC.
2.1.3 Developmental challenges and opportunities
Despite the numerous challenges, Jamaica is on a quest for development, with the
creation of its first long-term development plan, Vision 2030. “This Plan aims to put
Jamaica in a position to achieve developed country status by 2030, as indicated by
enhanced quality of life for all citizens and world-class standards in areas including
2 The EVI, a vulnerability index for the natural environment, was developed by the South Pacific
Applied Geoscience Commission (SOPAC), the United Nations Environment Programme and their
partners. It assesses data gathered from 235 countries around the globe (SOPAC). 3 Forty-seven SIDS are represented in the EVI.
6.0
18.3
34.5
26.4
14.9
0.0
6.4
21.3
36.2 36.2
0
5
10
15
20
25
30
35
40
Resilient At risk Vulnerable Highlyvulnerable
Extremelyvulnerable
Ind
ex
Jamaica
SIDS

7
education, health care, nutrition, civility and social order, and access to environmental
goods and services” (PIOJ, 2009). The development challenges and opportunities were
further outlined in the medium-term socio-economic framework for inclusive growth and
sustainable development in 2012–15 (figure 2.3). The development and protection of
human capital (figure 2.4) is one of the framework’s eight themes; this speaks directly to
the ability of young people to transition effectively from the world of school to decent
employment.
Figure 2.3 Developmental challenges and opportunities
Source: PIOJ, 2012, p. 10.
Figure 2.4 Medium-term framework for inclusive growth and sustainable development, 2012–15
Developmental Challenges
•High levels of crime and violence
•Inefficient justice system
•Consistently low macroeconomic growth
•Lack of competitiveness and low productivity
•Persistent fiscal deficits and high public debt
•Inefficient tax system
•Rising levels of unemployment and poverty
•Low levels of student education outcomes, particularly among males
•Rising incidence of chronic diseases
•High dependency on imported petroleum and inefficient use of energy
•High cost of production inputs including energy and capital
•Poor environment management
•Vulnerability to disasters and the impact of climate change
•Inadequate transparency and accountability in governance
Developmental Opportunities
•Increasing access to regional and world markets
•Demographic dividend with growth of the working age population
•Growth in economic value of global cultural industries and markets
•Competitive advantages in creative industries and sport
•Expansion of the Panama Canal and regional cargo traffic
•Global advances in science, technology and innovation
•Development of the Green Economy
•Large Jamaican Diaspora
•Strength of Jamaica’s Nation Brand
•Strong relationship with international development partners
Economic Stability, Competitiveness and
Employment
National Security and Justice
Development and Protection of Human Capital

8
2.2 Labour market overview
The LFS conducted by STATIN on a quarterly basis is the primary source of
Jamaican labour market information. The survey covers the population aged 14 and older,
living in private households in all of Jamaica’s parishes. STATIN estimates the Jamaican
labour force comprised 1,322,500 people in April 2013, or 48.7 per cent of the total
population (table 2.2). Of the labour force, 83.7 per cent were employed and 16.3 per cent
unemployed. Approximately 753,700 people were estimated to be outside the labour force
for various reasons; this represents 36.3 per cent of the working-age population (aged 14+).
Table 2.2 Labour market indicators, April 2012 and 2013
Indicator April 2012 April 2013
Total population 2 070 600 2 713 300
Population aged 14 & older 1 283 600 2 076 200
Total labour force 1 283 600 1 322 500
Employed labour force 1 098 700 1 107 400
Unemployed labour force 184 900 215 100
Outside the labour force 787 000 753 700
Employment rate (%) 85.6 83.7
Unemployment rate (%) 14.4 16.3
Job seeking rate (%) 8.8 10.0
Population aged under 14 (%) 23.5 23.5
Population aged 14 & older (%) 76.5 76.5
Population aged 14 & older outside the labour force (%) 38.0 36.3
Labour force as % of total population 47.4 48.7
Labour force as % of population aged 14 & older 62.0 63.7
Source: STATIN, LFS.
The labour force was fairly equitably distributed across genders, with 54.1 per cent
male and 45.9 per cent female and, according to the survey’s categorization, it consisted
mainly of the following occupations: service workers, shop and market sales workers (20.4
per cent); professionals, senior officials and technicians (19.5 per cent); skilled agricultural
and fishery workers (15.7 per cent); and elementary occupations (13.8 per cent). As far as
sectors, people were mostly from the wholesale and retail, repair of motor vehicle and
equipment industry (20.5 per cent), agriculture, hunting, forestry and fishing (16.3 per
cent), construction (8.2 per cent), and hotel and restaurant services (6.9 per cent).
The informal sector4 is a primary employer in Jamaica, engaging an average 416,000
people or 38.3 per cent of the labour force in 2012, compared to 430,400 (39.6 per cent)
from the formal sector. According to the data, a majority of informal sector workers were
male (60.0 per cent). The largest proportion (31.8 per cent) was aged 35–44; 27.4 per cent
were aged 25–34 and 7.9 per cent were in the 20–24 age group.
As of April 2013, the 15–29 age group, classified as youth, accounted for 29.0 per
cent of the labour force. According to the LFS, 69.1 per cent of youth were employed,
4 Agricultural and domestic workers are not classified as formal or informal, but are presented
separately.

9
while 30.9 per cent were unemployed. Compared to the national unemployment rate, the
unemployment rate for youth was 14.6 percentage points higher.
2.3 Survey objectives and methodology
The main objective of the SWTS is to generate more and better information on the
challenges of young men and women in the labour market. Youth unemployment, and
situations in which young people give up on job searching or work under inadequate
conditions, incur costs to the economy, to society and to the individual and their families.
A lack of decent work, if experienced at an early age, threatens to compromise a person’s
future employment prospects and frequently leads to unsuitable labour behaviour patterns
that last a lifetime.
The SWTS offers important additional information over traditional labour force
surveys by providing an opportunity to produce indicators on labour market transitions.
This is achieved by including questions on the history of young respondents’ economic
activity. Currently, labour force surveys hardly capture indicators to demonstrate the
transitions from school to work. The SWTS also allows for the development of normative
indicators related to areas of decent work within the analytical framework. According to
the ILO, having “decent” work means having attained a stable or satisfactory job. This, it
argues, is the end goal for most young people in developing economies. The stages of
transition applied to SWTS results are therefore based on the various combinations of the
two variables, stability and satisfaction.
The SWTS is a household survey of young people aged 15–29. The survey was
introduced as part of the Work4Youth partnership. Work4Youth aims to strengthen the
production of labour market information specific to youth, and to work with policy-makers
on interpreting data, including transitions to the labour market and the design or
monitoring of youth employment policies and programmes. The partnership supports the
SWTS in 28 target countries, with data from the first round made available throughout
2013. A second round of the SWTS will take place in each of the 28 countries in 2014–15,
including Jamaica.
Box 1. Work4Youth: An ILO project in partnership with The MasterCard Foundation
The Work4Youth (W4Y) project is a partnership between the ILO Youth Employment Programme and The MasterCard Foundation. The project has a budget of US$14.6 million and will run for 5 years to mid-2016. Its aim is to “promot[e] decent work opportunities for young men and women through knowledge and action”. The immediate objective of the partnership is to produce more and better labour market information specific to youth in developing countries, focusing in particular on transition paths to the labour market. The assumption is that governments and social partners in the project’s 28 target countries will be better prepared to design effective policy and programme initiatives once armed with detailed information on:
• what young people expect in terms of transition paths and quality of work;
• what employers expect in terms of young applicants;
• what issues prevent the two sides – supply and demand – from matching; and
• what policies and programmes can have a real impact.
W4Y target areas and countries:
Asia and the Pacific: Bangladesh, Cambodia, Nepal, Samoa, Viet Nam
Eastern Europe and Central Asia: Armenia, Kyrgyzstan, the Republic of Moldova, the Russian Federation, The former Yugoslav Republic of Macedonia, Ukraine
Latin America and the Caribbean: Brazil, Colombia, El Salvador, Jamaica, Peru
Middle East and North Africa: Egypt, Jordan, Occupied Palestinian Territory, Tunisia
Sub-Saharan Africa: Benin, Liberia, Madagascar, Malawi, the United Republic of Tanzania, Togo, Uganda, Zambia

10
2.3.1 Sample design and selection
While the SWTS in Jamaica was conducted independently of the quarterly LFS, both
surveys employed the same concepts and definitions, thereby facilitating comparison of the
results. The sample design for the SWTS was a multi-stage probability sampling design,
with the first stage a selection of geographical areas called enumeration districts (EDs),
and the second stage a selection of dwellings within the selected EDs. All individuals
within the age cohort were selected. The main focus of this design was to select a
nationally representative sample that would provide estimates on the transition of youth
from school to work, at both the national and regional (and urban/rural) levels.
The sample’s target population comprised usual residents aged 15–29, who were
living in private dwelling units at the time of the survey. Excluded from the survey were
non-private dwellings including group dwellings (e.g. military camps, mental institutions,
hospitals, prisons).
The sample was stratified by urban and rural geographical areas and by parish. Of the
852 EDs in the Master Sample Frame, 187 EDs were selected. Twenty-five dwellings were
selected from each ED, making a total of 4,675 dwellings in the sample. From each of the
dwellings, all individuals within the age cohort were surveyed. This sample size allowed
for a response rate of 95 per cent of eligible respondents. Table 2.3 summarizes the number
of EDs and dwellings selected per parish.
Table 2.3 Jamaican SWTS: Number of EDs and dwellings selected by geographic area and parish
Parish EDs in master sample EDs selected Dwellings selected per parish
Urban Rural Total Urban Rural Total Urban Rural Total
Kingston 34 – 34 7 – 7 175 – 175
St Andrew 159 20 179 36 4 40 900 100 1 000
St Thomas 9 25 34 2 5 7 50 125 175
Portland 3 23 26 2 4 6 50 100 150
St Mary 10 34 44 2 6 8 50 150 200
St Ann 14 37 51 3 7 10 75 175 250
Trelawny 4 19 23 3 2 5 75 50 125
St James 34 26 60 8 6 14 200 150 350
Hanover 4 20 24 2 4 6 50 100 150
Westmoreland 10 38 48 2 9 11 50 225 275
St Elizabeth 6 40 46 2 8 10 50 200 250
Manchester 23 39 62 5 9 14 125 225 350
Clarendon 25 44 69 5 11 16 125 275 400
St Catherine 106 46 152 22 11 33 550 275 825
Total 441 411 852 101 86 187 2 525 2 150 4 675
Source: STATIN, SWTS Jamaica 2013.
2.3.2 Training of trainers
Training people who would then train the interviewers was an important stage of the
survey process. These people were instructed on the questionnaire’s content, particularly
on understanding each question so that they were able to train the interviewers. The
training of survey trainers, on 4 January 2013 in STATIN’s boardroom, was facilitated by
the project manager and the project coordinator. Fifteen people participated, including
11
eight trainers and resource people. Participants were exposed to the survey’s key concepts,
and were instructed on aspects of the survey to emphasize during the training of the
interviewers.
2.3.3 Training of interviewers
Interviewer training was conducted 8–11 January 2013 as part of the SWTS
implementation. Forty-eight people were selected to be trained from all parishes across the
island, and two trainers were assigned to each training class. The two instruments used in
the SWTS, namely the household and individual questionnaires, were explored in detail.
Specific areas covered in the training were:
With the aid of a survey manual, the training included class exercises, practice
interviews and a final test. The trainers kept in constant touch with each other by telephone
and email to ensure that all problems encountered were solved similarly to avoid any
measurement error.
Based on the final test results and trainer assessments, 10 people were chosen to be
supervisors and 35 were selected to be interviewers.
2.3.4 Fieldwork
Data collection for the SWTS in Jamaica started on 1 February 2013 in all parishes.
The survey’s initial sample design was a selection of 187 EDs, from which 15 dwellings
from each of the selected EDs were chosen for data collection. The design further stated
that data should be collected from all eligible members in the selected households.
After the third week of data collection, a significant number of the selected dwellings
were yielding very few eligible respondents. It was therefore decided to increase the
number of dwellings per ED from 15 to 25, and to extend the data collection period to the
end of April 2013.
At the end of the proposed data collection period, a decision was made to further
extend it, as a number of interviewers were experiencing problems locating the
Background and objectives of the
survey Sample Design
Maintaining confidentiality of the information collected
Role and responsibilities of the
interviewer in the field
Role of the Field Supervisor
Conducting and handling an interview
Field procedures Contacting households
Identifying eligible respondents
Making call-backs Returning work assignments
Supplies required for fieldwork
Understanding the map
Concepts and Definitions
Frequently asked questions by householders
General points on completing the questionnaire

12
respondents and had to make additional call-backs. Given the low response rate, it was
deemed necessary to extend the data collection an additional 2 weeks.
A total of 2,690 people (1,325 males and 1,365 females) within the target age group
were identified. Of these, 2,584 (1,270 males and 1,314 females) were successfully
interviewed. Given the target of 2,750 completed questionnaires, 94 per cent of the target
was completed.
A sample of 20 per cent of the selected dwellings was assigned for field verification
by all the field supervisors. Care was taken to ensure that all the interviewers’ work was
included in this verification exercise. If discrepancies were found, the supervisors were
instructed to re-interview the respondents.
2.3.5 Data processing
The editing and coding of SWTS questionnaires began on 18 March 2013 and was
completed within 1 week following data collection. A team of three editors/coders and four
data entry operators were involved in processing the data, and assisted in monitoring the
flow of the questionnaires from the field. The data entry programme was designed and
developed by STATIN’s Information and Technology Division using CS-Pro software,
which included consistency and error checks. The data entry began on 8 April 2013 and
was completed on 31 May 2013.
3. Characteristics of youth in the sample survey
The SWTS provides vital socio-demographic information on Jamaican youth aged
15–29. This section presents demographic characteristics of youth such as age, sex, marital
status, education and training, as well as the respondents’ wealth status, area of residence,
perceptions, aspirations and health.
3.1 Individual characteristics of youth
3.1.1 Age and sex distribution
According to 2012 population estimates, youth aged 15–29 in Jamaica accounted for
27.9 per cent of the total population, of which 49.8 per cent were females and 50.2 per cent
were males. When the youth population is disaggregated by age, both sexes are distributed
in similar proportions across the different age groups (table 3.1). The 15–19-year-olds
made up the largest subgroup (37.3 per cent of males; 36.2 per cent of females), closely
followed by those aged 20–24 (33.5 per cent of males; 33.3 per cent of females) and,
finally, the 25–29 age cohort (30.5 per cent of females; 29.1 per cent of males). The mean
age of respondents was 21.9 and the median age was 21. An analysis of youth by age in
years shows that the greatest in number were those aged 17 (8.1 per cent).
Table 3.1 Jamaican youth by age and sex
Age group Female Male Total
Number % Number % Number %
15–19 137 000 36.2 142 000 37.3 279 000 36.8
20–24 125 700 33.3 127 500 33.5 253 300 33.4
25–29 115 400 30.5 110 900 29.1 226 300 29.8
Total 378 100 100.0 380 400 100.0 758 600 100.0
Source: STATIN, SWTS Jamaica 2013.

13
3.1.2 Area of residence and the migration of youth
Information on the area of residence and youth mobility was also collected in this
survey. More than one-half of youth (53.6 per cent) lived in urban areas while the
remaining 46.4 per cent were from rural areas (figure 3.1). The majority (80.0 per cent)
indicated they had always lived in the area where they resided at the time of the survey.
Figure 3.1 Youth by area of residence (%)
Source: STATIN, SWTS Jamaica 2013.
In assessing youth mobility, those reporting that they previously resided elsewhere
were asked to give the area of their prior residence and their reason for moving (table 3.2).
As to where they previously lived, 49.8 per cent indicated in rural areas, 29.2 per cent in
other urban centres and 19.3 per cent in the Kingston metropolitan area. Fewer than 2 per
cent previously resided in another country.
Table 3.2 Youth by area of residence, mobility and sex
Area of residence and mobility Female Male Total
Number % Number % Number %
Area of residence
Urban 204 900 54.2 201 500 53.0 406 400 53.6
Rural 173 200 45.8 179 000 47.0 352 100 46.4
Total 378 100 100.0 380 500 100.0 758 500 100.0
Always lived in this area
Yes 293 700 77.7 313 000 82.3 606 800 80.0
No 84 300 22.3 67 200 17.7 151 500 20.0
Total 378 100 100.0 380 200 100.0 758 300 100.0
Area previously resided in
Kingston metropolitan area 13 600 16.1 15 700 23.4 29 300 19.3
Other urban centres 25 800 30.6 18 300 27.3 44 200 29.2
Rural area 43 900 52.1 31 600 47.1 75 500 49.8
Another country 1 000 1.2 1 500 2.2 2 500 1.7
Total 84 300 100.0 67 200 100.0 151 500 100.0
Main reason for moving to current residence
To accompany family 46 400 56.0 36 500 55.3 83 000 55.7
For education/training 6 100 7.3 10 300 15.6 16 400 11.0
To work/for employment-related reasons 8 900 10.7 7 600 11.4 16 500 11.0
Other 21 500 25.9 11 700 17.7 33 200 22.3
Total 82 900 100.00 66 100 100.0 149 100 100.0
Source: STATIN, SWTS Jamaica 2013.
Urban 53.6
Rural 46.4
14
With regard to the reason for relocating, youth primarily moved to accompany family
members (55.7 per cent); in addition, 22.3 per cent moved for “other” reasons, 11.0 per
cent “to work/for employment-related reasons” and 11.0 per cent “for education/training”.
When disaggregated by sex, a greater proportion of females than males (25.9 and 17.4 per
cent, respectively) indicated they moved for “other” reasons, while a greater proportion of
males moved because of “education/training” (15.3 per cent, compared to 7.2 per cent of
females).
3.1.3 The household
More than one-half of youth (52.8 per cent) reported they were the children of the
head of the household, while 24.1 per cent were “other relative” and 10.7 per cent were the
head of their household (figure 3.2). Of the latter, most (62.0 per cent) were male. Youth in
the 25–29 age group made up the majority of heads of households (69.0 per cent), followed
by the 20–24 age group (27.1 per cent).
Figure 3.2 Youth’s relationship to the head of household
Source: STATIN, SWTS Jamaica 2013.
For this survey, “union status” was divided into six categories: single/never married;
engaged to be married; married; divorced or legally separated; widowed; and common-law
relationship. Most youth (89.9 per cent) were single or had never been married, while 6.8
per cent were living in common-law relationships (figure 3.3). A mere 2.3 per cent were
married. The proportion of males who were single was slightly higher (91.8 per cent) than
females (88.1 per cent). On the other hand, proportionally more females were living in
common-law relationships than males (8.4 per cent and 5.3 per cent, respectively).
Among cohabiting youth, most had their first such relationship between the age of 20
and 24 (44.8 per cent), and 43 per cent between the age of 14 and 19. Moreover, 12.2 per
cent started living with a spouse when they were between the age of 25 and 29.
8.2 7.8
51.8
2.7 1.5
23.9
4.2
13.2
1.0
54.1
3.2 1.3
24.4
2.9
10.7
4.4
53.0
2.9 1.4
24.1
3.5
0
10
20
30
40
50
60
Head Spouse /Partner
Son /Daughter
Brother /Sister
Parent OtherRelative
Not Related
%
Female Male Total
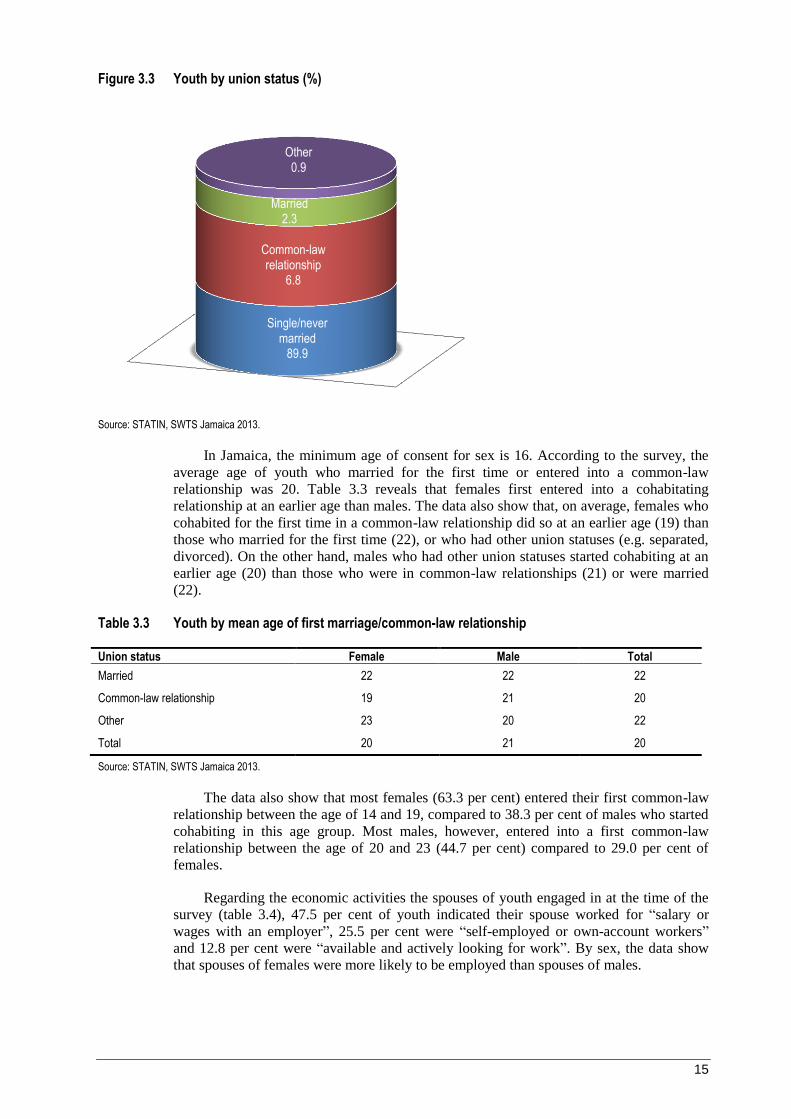
15
Figure 3.3 Youth by union status (%)
Source: STATIN, SWTS Jamaica 2013.
In Jamaica, the minimum age of consent for sex is 16. According to the survey, the
average age of youth who married for the first time or entered into a common-law
relationship was 20. Table 3.3 reveals that females first entered into a cohabitating
relationship at an earlier age than males. The data also show that, on average, females who
cohabited for the first time in a common-law relationship did so at an earlier age (19) than
those who married for the first time (22), or who had other union statuses (e.g. separated,
divorced). On the other hand, males who had other union statuses started cohabiting at an
earlier age (20) than those who were in common-law relationships (21) or were married
(22).
Table 3.3 Youth by mean age of first marriage/common-law relationship
Union status Female Male Total
Married 22 22 22
Common-law relationship 19 21 20
Other 23 20 22
Total 20 21 20
Source: STATIN, SWTS Jamaica 2013.
The data also show that most females (63.3 per cent) entered their first common-law
relationship between the age of 14 and 19, compared to 38.3 per cent of males who started
cohabiting in this age group. Most males, however, entered into a first common-law
relationship between the age of 20 and 23 (44.7 per cent) compared to 29.0 per cent of
females.
Regarding the economic activities the spouses of youth engaged in at the time of the
survey (table 3.4), 47.5 per cent of youth indicated their spouse worked for “salary or
wages with an employer”, 25.5 per cent were “self-employed or own-account workers”
and 12.8 per cent were “available and actively looking for work”. By sex, the data show
that spouses of females were more likely to be employed than spouses of males.
Single/never married
89.9
Common-law relationship
6.8
Married 2.3
Other 0.9
16
Table 3.4 Spouses of youth by economic activity and sex
Economic activity Spouse of female youth Spouse of male youth Total
Number % Number % Number %
Work for salary/wage with an employer
22 300 53.8 10 100 37.9 32 500 47.5
Work as self-employed/own-account worker
14 800 35.7 2 600 9.7 17 400 25.5
Available & actively looking for work 2 600 6.2 6 200 23.0 8 700 12.8
Engage in home duties 800 1.9 4 900 18.4 5 700 8.3
Attend education/training 1 000 2.5 2 300 8.6 3 300 4.9
Unable to work owing to sickness & disability
0 0.0 700 2.5 700 1.0
Total 41 500 100.0 26 800 100.0 68 300 100.0
Source: STATIN, SWTS Jamaica 2013.
Of the 89.5 per cent of the spouses of females who were employed, 53.8 per cent
were working for a salary or wage with an employer, and 35.7 per cent were self-employed
or working as own-account workers. On the other hand, only 47.6 per cent of the spouses
of males were employed, of which 37.9 per cent were working for a salary or wage with an
employer, and 9.7 per cent were self-employed or working as own-account workers. As to
those “available and actively looking for work”, 23.0 per cent of the males’ spouses and
6.2 per cent of the females’ spouses fell into this category.
Table 3.5 Youth with children by number of children and sex
Children Female Male Total
Number % Number % Number %
Have children (currently living)
Yes 159 900 42.3 66 800 17.6 226 700 29.9
No 218 100 57.7 313 700 82.4 531 800 70.1
Total 378 000 100.0 380 500 100.0 758 500 100.0
Number of children (currently living)
1 98 700 61.7 46 400 69.5 145 200 64.0
2 37 900 23.7 13 300 19.8 51 100 22.6
3 16 300 10.2 5 100 7.6 21 300 9.4
4 or more 4 400 2.8 800 1.1 5 200 2.3
Not stated 2 600 1.7 1 300 1.9 3 900 1.7
Total 159 900 100.0 66 900 100.0 226 700 100.0
Source: STATIN, SWTS Jamaica 2013.
The majority of youth (70.1 per cent) had no children (table 3.5). Of the 29.9 per cent
of youth having children, 70.5 per cent were female and 29.5 per cent male. As to the
number of children, 64.0 per cent of youth who had children had one, 22.6 per cent had
two, 9.4 per cent had three, 2.3 per cent had 4 or more and the remaining 1.7 per cent
refused to state how many children they had.

17
3.1.4 Financial situation
This section of the survey assessed both how the young respondents perceived their
socio-economic status, and their interaction with financial institutions. The respondents
were asked to describe their households’ overall financial situation; the greatest proportion
(46.2 per cent) described it as “around the national average”, 20.7 per cent stated they were
“poor” and 19.2 per cent “fairly poor”. The remaining 13.8 per cent said they were “well
off” or “fairly well off” (figure 3.4).
Figure 3.4 Youth’s perception of household financial situation (%)
Source: STATIN, SWTS Jamaica 2013.
A wealth index constructed from data collected on household assets and housing
quality was used as a proxy for youth’s socio-economic status and broken out into quintiles
(table 3.6). A marginally higher proportion of males (21.2 per cent) than females (19.6 per
cent) were in the wealthiest quintile, while a higher proportion of females (19.5 per cent)
than males (17.9 per cent) were in the poorest quintile. Segmented by age group, the data
indicate those younger were more likely to be in the poorest quintile than older youth. The
greatest disparity in the distribution across wealth quintiles was in the area of residence.
More than one-quarter (25.5 per cent) of youth living in rural areas were from the poorest
quintile, compared to 12.8 per cent in urban areas. On the other hand, youth from urban
areas were primarily from the wealthiest quintile (29.4 per cent), compared to only 10.1
per cent of youth from rural areas.
Table 3.6 Youth by socio-economic status, sex, age group and area of residence
Wealth index quintile
Sex Age group Area of
residence Total
Male Female 15-19 20-24 25-29 Urban Rural Number %
Poorest 17.9 19.5 20.4 18.9 16.4 12.8 25.5 142 000 18.7
Second 20.1 20.4 19.5 20.6 20.8 15.0 26.3 153 500 20.2
Middle 20.0 20.5 20.6 18.4 22.0 19.9 20.7 153 600 20.3
Fourth 20.7 20.0 18.9 22.2 20.1 22.9 17.4 154 400 20.4
Wealthiest 21.2 19.6 20.7 19.9 20.8 29.4 10.1 155 100 20.4
Total 100.0 100.0 100.0 100.0 100.0 100.0 100.0 758 500 100.0
Source: STATIN, SWTS Jamaica 2013.
A comparison between the wealth index and youth’s perception of their household
financial situation was done to determine the relationship between their perception and the
wealth index category to which they were assigned. Of those who thought they were “well
off”, 33.3 per cent were in the wealthiest quintile while 6.7 per cent were in the poorest
Well off 2.1
Fairly well off 11.7
Around the national average
46.2
Fairly poor 19.2
Poor 20.7

18
(figure 3.5). Among youth who thought they were “fairly well off”, the greatest proportion
(36.9 per cent) were in the wealthiest quintile. Those who thought their household financial
situation was “around the national average” were primarily in the wealthiest quintile (28.1
per cent), while 18.5 per cent fell in the middle and 9.5 per cent in the poorest quintile.
However, the greatest proportion of youth who saw their household financial situation as
“fairly poor” were in the poorest quintile (31.2 per cent), and those who considered
themselves as poor were also mostly in the poorest quintile (34.6 per cent).
Figure 3.5 Youth by socio-economic status and perception of their household financial situation (%)
Source: STATIN, SWTS Jamaica 2013.
Youth were also asked about financial services they used when needing money, the
main sources of these financial services as well as how they covered unforeseen expenses.
(As these questions allowed for multiple responses, the respondents were able to select
more than one option.) As shown in figure 3.6, more than one-half (56.0 per cent) of the
respondents indicated they did not use any financial services apart from their income when
they needed money. Fewer than one-third (28.8 per cent) of youth relied on their savings to
supplement their income when they needed money, while 11.2 per cent relied on
remittances/money transfer services. As to the sources of financial services used by youth
(figure 3.7), the bank was the most popular (28.0 per cent); friends and relatives (11.7 per
cent) were the next most popular source, followed by money transfer operators (9.2 per
cent) and informal financial operators (2.3 per cent).
0.05.0
10.015.020.025.030.035.040.0
Poorest
Second
MiddleFourth
Wealthiest
Well Off
Fairly Well Off
National Average
Fairly Poor
Poor

19
Figure 3.6 Youth by financial services used Figure 3.7 Youth by sources of financial services
Source: STATIN, SWTS Jamaica 2013.
Respondents were asked to state how they would cover unforeseen expenses. The
primary method indicated was “other service” (42.1 per cent) (figure 3.8). Further
investigation revealed that within this group, the vast majority indicated they would rely on
friends and family to assist them in covering unforeseen expenses. Less than one-third of
youth (28.4 per cent) claimed they would rely on their savings, while 17.9 per cent
indicated there would be no need for them to cover unforeseen expenses. Otherwise, 9.3
per cent of youth would take a loan, while 7.1 per cent would sacrifice on their expenses
and 6.3 per cent would work extra.
Figure 3.8 Youth by methods used to cover unforeseen expenses
Source: STATIN, SWTS Jamaica 2013.
.8
1.7
1.7
1.8
5.4
11.2
28.8
56.0
0 20 40 60
Insurance
Consumption loans
Emergency loans
Business loans
Other service
Remittances etc
Savings
None
%
1.0
1.0
1.2
2.3
9.2
11.7
28.0
0 5 10 15 20 25 30
Microfinance institution
Insurance company
Other service
Informal financial operators
Money transfer operators
Friends and relatives
Bank
%
.3
.9
2.7
6.3
7.1
9.3
17.9
28.4
42.1
0 5 10 15 20 25 30 35 40 45
Unemployment benefits etc
(Micro) Insurance
Sell my assets
Work extra
Sacrifice on expenses
Take a loan
No need to cover them
Savings
Other service
%

20
3.1.5 Health problems
As shown in table 3.7, the majority of youth (over 90 per cent) reported no difficulty
in doing the selected activities (seeing, hearing, walking or climbing steps, remembering or
concentrating, self-care and communicating). For respondents who reported some or a lot
of difficulty, eyesight, even if wearing glasses, was the area with the highest percentage of
respondents (8.1 per cent), followed by 5.6 per cent who had difficulty remembering or
concentrating. For the other activities, approximately 2 per cent each had difficulty hearing
(even if wearing hearing aids), walking or climbing steps, and communicating, while 0.9
per cent had difficulty with self-care.
Table 3.7 Youth by level of difficulty in selected activities
Health area No difficulty Some difficulty A lot of difficulty Cannot do it at all
Number % Number % Number % Number %
Seeing 696 800 91.9 58 400 7.7 3 300 0.4 0 0.0
Hearing 741 000 97.8 15 700 2.1 1 000 0.1 0 0.0
Walking or climbing steps
740 000 97.6 14 700 1.9 3 200 0.4 0 0.0
Remembering or concentrating
715 000 94.4 39 000 5.1 3 700 0.5 0 0.0
Self-care 751 000 99.1 6 100 0.8 1 000 0.1 0 0.0
Communicating 741 300 97.8 14 700 1.9 2 100 0.3 0 0.0
Source: STATIN, SWTS Jamaica 2013.
3.1.6 Primary caregivers/parents
Parenting plays a significant role in youth development. According to the 1989
United Nations Convention on the Rights of the Child (UNCRC), the family is the
“fundamental group of society and natural environment for the optimal growth and
development of children”. In the survey, youth were asked whether or not they had
primary male/female caregivers in their lives as a child. In other words, the survey sought
to ascertain whether youth had a father- or mother figure during their formative years.
Those who had a father- and a mother figure were asked to state their relationship to each
individual. Questions were also asked about the level of education and occupation of both
the male and female caregivers to determine whether a relationship existed between
parents’ or caregivers’ educational attainment and occupation and youth’s labour market
transition.
Figure 3.9 shows that over 60 per cent of youth had their biological fathers as their
primary male caregiver while growing up. Another 8.7 per cent of youth had a stepfather,
7.4 per cent had other relatives and 0.8 per cent had a non-relative. The data suggest that
77 per cent of youth had a father figure in their lives as a child.
On the other hand, 23.0 per cent of youth reported that they did not have a father
figure during their childhood. This was more the case for females (24.1 per cent) than for
males (21.9 per cent). Male youth were more likely to have their biological fathers in their
lives (63.0 per cent) than female youth (57.1 per cent). However, female youth were more
likely to have had a stepfather (10.8 per cent) than male youth (6.7 per cent).
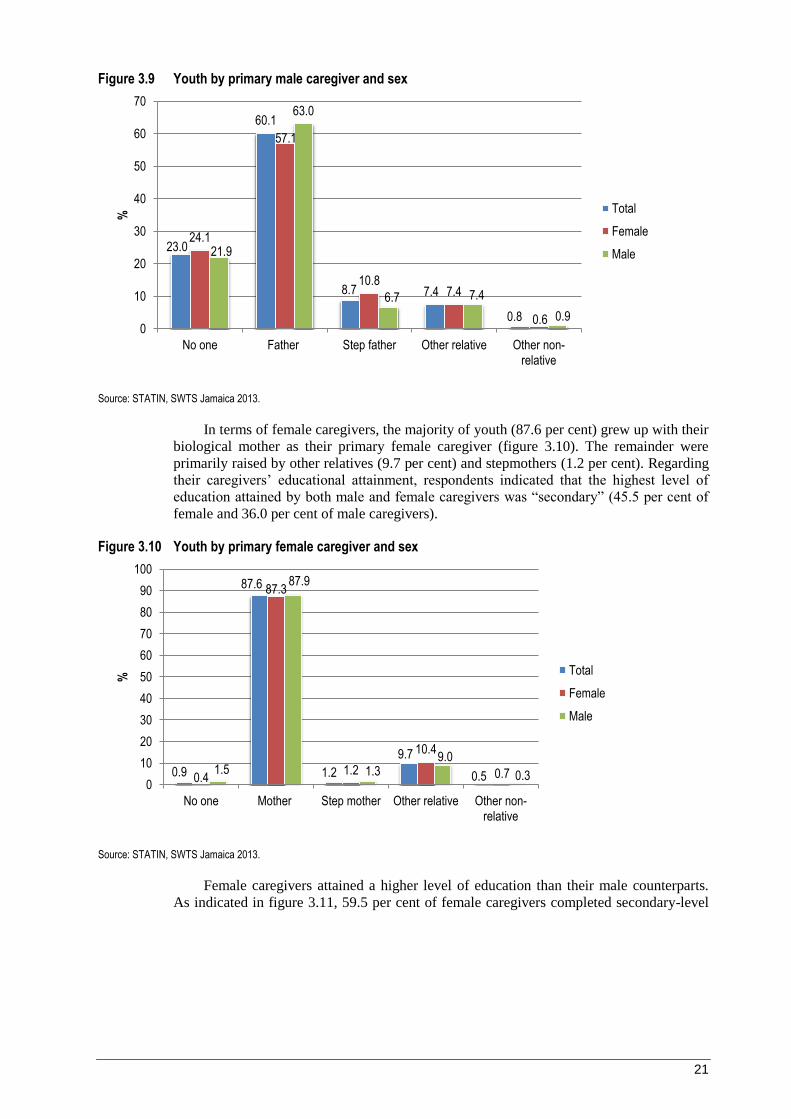
21
Figure 3.9 Youth by primary male caregiver and sex
Source: STATIN, SWTS Jamaica 2013.
In terms of female caregivers, the majority of youth (87.6 per cent) grew up with their
biological mother as their primary female caregiver (figure 3.10). The remainder were
primarily raised by other relatives (9.7 per cent) and stepmothers (1.2 per cent). Regarding
their caregivers’ educational attainment, respondents indicated that the highest level of
education attained by both male and female caregivers was “secondary” (45.5 per cent of
female and 36.0 per cent of male caregivers).
Figure 3.10 Youth by primary female caregiver and sex
Source: STATIN, SWTS Jamaica 2013.
Female caregivers attained a higher level of education than their male counterparts.
As indicated in figure 3.11, 59.5 per cent of female caregivers completed secondary-level
23.0
60.1
8.7 7.4
0.8
24.1
57.1
10.8 7.4
0.6
21.9
63.0
6.7 7.4
0.9 0
10
20
30
40
50
60
70
No one Father Step father Other relative Other non-relative
% Total
Female
Male
0.9
87.6
1.2
9.7
0.5 0.4
87.3
1.2
10.4
0.7 1.5
87.9
1.3 9.0
0.3 0
10
20
30
40
50
60
70
80
90
100
No one Mother Step mother Other relative Other non-relative
% Total
Female
Male

22
education or higher,5 compared to 47.0 per cent of male caregivers. However, a larger
percentage of respondents were unaware of their male caregivers’ educational attainment
than that of their female caregivers.
Figure 3.11 Male and female caregivers by highest level of completed education as attested by youth
Source: STATIN, SWTS Jamaica 2013.
Youth’s educational attainment was compared to that of their caregivers. This
comparison revealed that 50.1 per cent of youth were better educated than their primary
male caregivers, and 43.9 per cent were better educated than their primary female
caregivers (figure 3.12).
Figure 3.12 Youth by educational attainment compared to their primary male and female caregivers
Source: STATIN, SWTS Jamaica 2013.
5 This includes vocational school (technical high); secondary school; vocational school (e.g. Human
Employment and Resource Training [HEART]); university/tertiary education; and postgraduate
studies.
0 5 10 15 20 25 30 35 40 45 50
None
Elementary School (Primary)
Vocational School (Technical High)
Secondary School
Vocational School ( Eg Heart)
University / Tertiary
Post - Graduate Studies
Do Not Know
Other
%
Male Female
50.1
39.2
10.7
43.9 41.5
14.5
0
10
20
30
40
50
60
Higher Same Lower
%
Male
Female

23
With respect to occupations, the majority (45.1 per cent) of female caregivers were in
“elementary occupations” while the majority (26.2 per cent) of male caregivers were “craft
and related trades workers” (figure 3.13). Almost one-quarter (23.6 per cent) of male
caregivers were “skilled agricultural and fishery workers” compared to 6.3 per cent of
females, while 23.6 per cent of female caregivers were “service workers, shop and market
sales workers” compared to 11.1 per cent of males.
Figure 3.13 Male and female primary caregivers by occupation
Source: STATIN, SWTS Jamaica 2013.
3.1.7 Education and training
Education and training play a critical role in school-to-work transition; they can
influence youth’s preparedness for work and their employment opportunities in securing
decent and stable employment. The survey results showed that all respondents had
participated in the formal education system by attending either school or a training
programme.
At the time of the survey, 35.2 per cent of youth, an estimated 267,300, were enrolled
in school or a training programme. The remaining 64.8 per cent were not enrolled because
they either had completed their education/training (47.8 per cent) or had left the
programme prematurely (17.0 per cent).
Among youth enrolled in school/training, the majority (63.7 per cent) were in
secondary school, 18.7 per cent were at the university or tertiary level and 11.9 per cent
were in vocational school (such as Human Employment and Resource Training [HEART])
(table 3.8). The proportion of males studying at the secondary level was slightly higher
than that of females (66.1 and 61.5 per cent, respectively). However, proportionally more
females (20.7 per cent) were studying at the university or tertiary level than males (16.5
per cent) (table A.7).
0 5 10 15 20 25 30 35 40 45 50
Legislators, Senior Officials and Managers
Professionals
Technicians and Associate Professionals
Clerks
Service Workers and Shop and Market Sales Workers
Skilled Agricultural and Fishery Workers
Craft and Related Trades Workers
Plant and Machine Operators and Assemblers
Elementary Occupations
%
Female Male
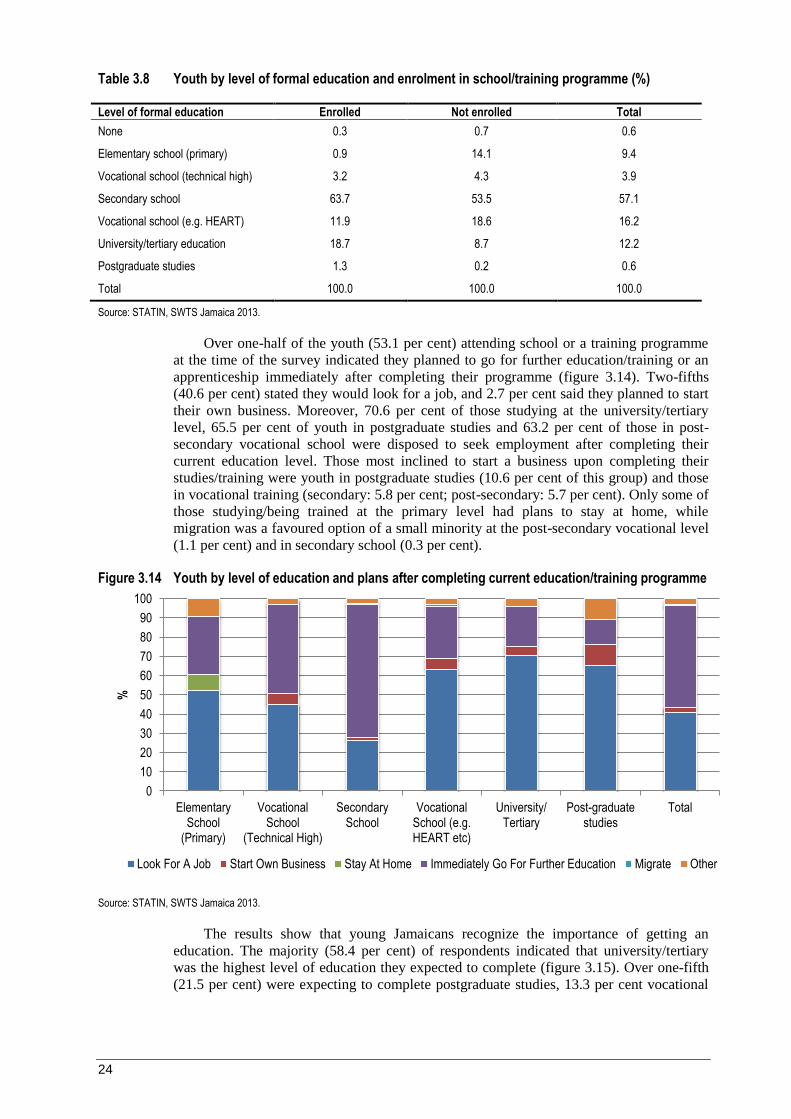
24
Table 3.8 Youth by level of formal education and enrolment in school/training programme (%)
Level of formal education Enrolled Not enrolled Total
None 0.3 0.7 0.6
Elementary school (primary) 0.9 14.1 9.4
Vocational school (technical high) 3.2 4.3 3.9
Secondary school 63.7 53.5 57.1
Vocational school (e.g. HEART) 11.9 18.6 16.2
University/tertiary education 18.7 8.7 12.2
Postgraduate studies 1.3 0.2 0.6
Total 100.0 100.0 100.0
Source: STATIN, SWTS Jamaica 2013.
Over one-half of the youth (53.1 per cent) attending school or a training programme
at the time of the survey indicated they planned to go for further education/training or an
apprenticeship immediately after completing their programme (figure 3.14). Two-fifths
(40.6 per cent) stated they would look for a job, and 2.7 per cent said they planned to start
their own business. Moreover, 70.6 per cent of those studying at the university/tertiary
level, 65.5 per cent of youth in postgraduate studies and 63.2 per cent of those in post-
secondary vocational school were disposed to seek employment after completing their
current education level. Those most inclined to start a business upon completing their
studies/training were youth in postgraduate studies (10.6 per cent of this group) and those
in vocational training (secondary: 5.8 per cent; post-secondary: 5.7 per cent). Only some of
those studying/being trained at the primary level had plans to stay at home, while
migration was a favoured option of a small minority at the post-secondary vocational level
(1.1 per cent) and in secondary school (0.3 per cent).
Figure 3.14 Youth by level of education and plans after completing current education/training programme
Source: STATIN, SWTS Jamaica 2013.
The results show that young Jamaicans recognize the importance of getting an
education. The majority (58.4 per cent) of respondents indicated that university/tertiary
was the highest level of education they expected to complete (figure 3.15). Over one-fifth
(21.5 per cent) were expecting to complete postgraduate studies, 13.3 per cent vocational
0
10
20
30
40
50
60
70
80
90
100
ElementarySchool
(Primary)
VocationalSchool
(Technical High)
SecondarySchool
VocationalSchool (e.g.HEART etc)
University/Tertiary
Post-graduatestudies
Total
%
Look For A Job Start Own Business Stay At Home Immediately Go For Further Education Migrate Other

25
education (e.g. HEART) and 5.5 per cent expected to end their education at the secondary
level.
Figure 3.15 Youth by highest level of education they expect to complete
Source: STATIN, SWTS Jamaica 2013.
Disaggregation by sex reveals a disparity in the highest level of education that youth
expect to complete. Females had a greater expectation of completing higher levels of
education than males. Proportionally more females than males expect to complete
university/tertiary education (61.9 per cent compared to 58.4 per cent) and postgraduate
studies (24.5 per cent compared to 18.2 per cent). On the other hand, a higher percentage
of males (17.6 per cent) than females (9.2 per cent) expect to complete post-secondary
vocational education.
As shown in table 3.9, 41.8 per cent of the respondents were studying/being trained in
“general programmes”, 15.8 per cent in “social sciences, business and law” and 9.4 per
cent each in “science, mathematics and computing” and “engineering, manufacturing and
construction”. When asked in what field they would like to study/be trained, the largest
proportion of youth (22.2 per cent) indicated “social sciences, business and law”, 15.6 per
cent stated “engineering, manufacturing and construction” and 14.3 per cent responded
“health and welfare”.
Table 3.9 Youth by field currently studying, field would like to study and sex (%)
Field Currently studying Would like to study
Female Male Total Female Male Total
General programmes 40.5 43.3 41.8 4.7 6.1 5.4
Education 8.1 2.4 5.3 14.9 3.7 9.5
Humanities & arts 3.5 3.8 3.6 4.5 5.0 4.7
Social sciences, business & law 18.8 12.7 15.8 24.1 20.1 22.2
Science, mathematics & computing 8.1 10.8 9.4 11.1 13.7 12.3
Engineering, manufacturing & construction
1.8 17.5 9.4 2.2 29.9 15.6
Agriculture & veterinary 1.6 0.9 1.2 1.7 2.6 2.1
Health & welfare 8.2 1.4 4.9 23.6 4.4 14.3
Services 6.3 1.8 4.1 9.5 7.3 8.4
Other 3.3 5.4 4.3 3.8 7.1 5.4
Total 100.0 100.0 100.0 100.0 100.0 100.0
Source: STATIN, SWTS Jamaica 2013.
0 20 40 60 80
Elementary School (Primary)
Vocational School (Technical High)
Secondary School
Vocational School (Eg Heart)
University / Tertiary
Post - Graduate Studies
Other
%
Total
Male
Female
26
The young students were asked to state their ideal job and whom they would like to
work for. The top four occupational groups chosen were “professional” (54.3 per cent),
“service worker, and shop and market sales worker” (13.0 per cent), “technicians and
associate professional” (10.3 per cent) and “legislator, senior official and manager” (9.6
per cent) (table A.8). Most respondents (51.2 per cent) indicated they would like to work
for the government, 26.5 per cent for themselves and 17.7 per cent for a private company
(table A.9). While the desire for public-sector employment is understandable on the part of
young students (given its perception as a sector with good pay, status and job security), it
is unrealistic to think that the public sector will be able to absorb a large share of young
graduates over the coming years. Interestingly, whereas more females (59.0 per cent) than
males (43.1 per cent) wanted to work for the government, more males than females (30.7
per cent and 22.6 per cent, respectively) desired to work for themselves. Similarly more
males than females (21.4 per cent and 14.1 per cent, respectively) indicated wanting to
work for a private company.
Youth not enrolled in school/training
Of the estimated 491,200 youth not enrolled in school during the survey, 73.8 per cent
completed their education or training programme, while 26.2 per cent left before
completing their programme.
More than one-half (53.5 per cent) of the youth who already finished their
school/training completed secondary school (table 3.10); 18.6 per cent finished post-
secondary vocational school (e.g. HEART), 14.1 per cent completed elementary school
and 8.7 per cent completed university/tertiary education. While a slightly higher
percentage of males than females (56.9 per cent and 50.0 per cent, respectively) gave
“secondary school” as their highest level of completed education, a larger proportion of
females (11.2 per cent) than males (6.2 per cent) indicated “university/tertiary” education
as the highest level completed.
Table 3.10 Out-of-school youth by level of formal education completed (%)
Level of education completed Female Male Total
None 0.5 0.9 0.7
Elementary school (primary) 13.1 15.1 14.1
Vocational school (technical high) 3.5 5.0 4.3
Secondary school 50.0 56.9 53.5
Vocational school (e.g. HEART) 21.3 15.9 18.6
University/tertiary education 11.2 6.2 8.7
Postgraduate, postdoctoral 0.3 0.0 0.2
Total 100.0 100.0 100.0
Source: STATIN, SWTS Jamaica 2013.
In total, 17.0 per cent of young Jamaicans or 26.2 per cent of those not enrolled in
school or training left before completion. “Economic reasons” was the main answer given
by respondents (45.1 per cent) when asked to identify why they did not complete their
education (figure 3.16); they either could not afford it or were too poor or needed money to
support their family. Just over one-fifth (21.7 per cent) cited “other” reasons and 19.3 per
cent gave “pregnancy” as the reason.

27
Figure 3.16 Early school leavers by reasons for leaving school
Source: STATIN, SWTS Jamaica 2013.
3.1.8 Main goal in life
The main goal in life cited by the largest proportion of young respondents (39.4 per
cent) was to be successful in work (table 3.11). “Having a good family” was the second
most-cited goal (21.3 per cent), followed by “making a contribution to society” (14.0 per
cent). The distribution of results was similar for both females and males.
Most of the surveyed youth (91.4 per cent) never had serious thoughts of committing
suicide, regardless of age, sex or geographical location. A larger share of females (11.7 per
cent) than males (5.5 per cent), however, indicated that they had serious thoughts of ending
their own lives.
Table 3.11 Youth by main goal in life and suicidal tendency
Life goal/suicidal tendency Female Male Total
Number % Number % Number %
Most important goal in life
Being successful in work 153 600 40.7 145 300 38.3 298 900 39.5
Making a contribution to society 56 100 14.9 49 700 13.1 105 800 14.0
Having lots of money 25 800 6.8 49 700 13.1 75 600 10.0
Having a good family life 78 900 20.9 82 600 21.8 161 500 21.4
Being a good Christian 28 900 7.7 19 400 5.1 48 300 6.4
Other 33 900 9.0 32 300 8.5 66 200 8.8
Total 377 200 100.0 379 000 100.0 756 300 100.0
Serious thoughts of ending own life
Yes 44 000 11.7 20 800 5.5 64 700 8.6
No 331 100 88.3 354 100 94.5 685 200 91.4
Total 375 100 100.0 374 900 100.0 749 900 100.0
Source: STATIN, SWTS Jamaica 2013.
0.0
0.0
1.1
1.7
5.5
5.7
19.3
21.7
45.1
0 10 20 30 40 50
To Get Married
No School Nearby
Failed Examinations
Parents Did Not Want Me To Continue / Start…
Wanted To Start Working
Not Interested In Education / Training
Pregnancy
Other
Economic Reasons
%

28
3.2 Economic activity of youth
3.2.1 Work study combination
The survey revealed that 21.1 per cent of youth who completed their education were
economically active while attending school or in training. Of those who worked, 7.5 per
cent did so during the school term, 7.9 per cent worked outside the term (e.g. summer
breaks and holidays), while 5.7 per cent worked both during and outside the term (figure
3.17). At the time of the survey, 15.4 per cent of students (41,100) were also employed.
Figure 3.17 Youth who completed their education by work–study combination
Source: STATIN, SWTS Jamaica 2013.
Youth were asked to state the reasons why they worked during their studies. Over
three-quarters (77.0 per cent) indicated that earning money was their primary motivation to
work while studying, followed by “to gain work experience” (36.2 per cent) and “to help
the family” (22.2 per cent) (figure 3.18).
Figure 3.18 Youth by reasons for working while studying
Source: STATIN, SWTS Jamaica 2013.
78.9
7.5 7.9 5.7
0
10
20
30
40
50
60
70
80
90
%
No
During The School Term
Outside The SchoolSeason
During And Outside TheSchool Season
0 10 20 30 40 50 60 70 80 90
Other
Build up a curriculum vitae/ resume
To make connections that could lead to futureemployment
To help the family
To gain work experience
To earn money
% Total Male Female

29
3.2.2 Status of economic activity
The measures associated with the economically active population are guided by
international standards for the tabulation of labour statistics, as defined by the International
Conference of Labour Statisticians (ICLS). For the purpose of this survey, a person is
considered to be employed if they “worked for pay, profit or family gain for at least 1 hour
during the reference week, plus the number of persons who are temporarily absent from
their jobs” (Elder, 2009). The ILO has two approaches for defining unemployment.
According to the strict definition of unemployment, a person is considered to be
unemployed if “without work”, “currently available for work” and “actively seeking work”
during the reference period. On the other hand, according to the relaxed definition of
unemployment, a person is considered to be unemployed if “without work” and “currently
available for work”. Using the relaxed definition, a person does not have to be actively
seeking work to be considered as unemployed. Together, both the employed and the
unemployed make up the labour force or the economically active population.
According to the SWTS, approximately 302,300 or 39.9 per cent of youth were
employed at the time of the survey (table 3.12). Of this number, 41,100 indicated they
were also enrolled in either a school or training programme. Using the strict definition of
unemployment, 149,000 or 19.6 per cent were estimated to be unemployed, of which
18,400 were students. Using the strict definition, 307,200 were outside the labour force,
meaning they were neither working nor available or actively seeking work. Using the
relaxed definition of unemployment makes a significant difference in the Jamaican results:
246,300 or almost one-third (32.5 per cent) of the youth population was considered to be
unemployed, while the remaining 209,800 (27.7 per cent) were outside the labour force.
Table 3.12 Youth and economically active students by economic activity status
Economic activity Female Male Total
Number % Number % Number %
Status of economic activity
Employed 126 300 33.4 176 000 46.3 302 300 39.9
Unemployed 84 300 22.3 64 700 17.0 149 000 19.6
Outside the labour force 167 400 44.3 139 800 36.7 307 200 40.5
Total 378 000 100.0 380 500 100.0 758 500 100.0
Status of economic activity, with relaxed unemployment definition
Employed 126 300 33.4 176 000 46.3 302 300 39.9
Unemployed (relaxed) 139 600 36.9 106 800 28.1 246 300 32.5
Outside the labour force 112 200 29.7 97 700 25.7 209 800 27.7
Total 378 100 100.0 380 500 100.0 758 400 100.0
Economically active students
Employed students 21 700 66.0 19 400 72.8 41 100 69.0
Unemployed students 11 200 34.0 7 300 27.2 18 400 31.0
Total 32 900 100.0 26 700 100.0 59 500 100.0
Economically active students, with relaxed unemployment definition
Employed students 21 700 44.7 19 400 44.8 41 100 44.7
Unemployed students (relaxed) 26 800 55.3 24 000 55.2 50 800 55.3
Total 48 500 100.0 43 400 100.0 91 900 100.0
Source: STATIN, SWTS Jamaica 2013.
30
3.3 Employed youth
As stated earlier, at the time of the survey 302,300 youth were employed, of which
176,000 (58.2 per cent) were male and 126,300 were female (table 3.13). As expected, a
greater proportion of those aged 25–29, the oldest age group, were employed (46.6 per
cent) than those aged 15–19, the youngest age group (14.0 per cent).
Table 3.13 Employed youth by age group, geographical area, level of completed formal education and sex
Characteristic Female Male Total
Number % Number % Number %
Age group
15-19 18 000 14.2 24 400 13.8 42 300 14.0
20-24 47 400 37.5 71 600 40.7 119 000 39.4
25-29 61 000 48.2 80 000 45.5 141 000 46.6
Total 126 400 100.0 176 000 100.0 302 300 100.0
Geographic area
Urban 77 200 61.1 97 800 55.6 175 000 57.9
Rural 49 200 38.9 78 200 44.4 127 300 42.1
Total 126 400 100.0 176 000 100.0 302 300 100.0
Level of completed formal education6
None 600 0.5 800 0.5 1 300 0.5
Elementary school (primary) 8 400 8.1 23 700 15.3 32 200 12.4
Vocational school (technical high)
3 700 3.5 5 900 3.8 9 600 3.7
Secondary school 47 200 45.1 85 300 55.1 132 400 51.0
Vocational school (e.g. HEART etc.)
26 300 25.2 26 800 17.3 53 100 20.5
University/tertiary 18 400 17.6 12 400 8.0 30 800 11.9
Postgraduate studies 0 0.0 0 0.0 0 0.0
Total 104 600 100.0 154 900 100.0 259 400 100.0
Source: STATIN, SWTS Jamaica 2013.
Youth residing in urban areas accounted for the majority of those employed (57.9 per
cent). The data show some disparity across sex; while more males than females were
employed in urban areas (97,800 compared to 77,200), a higher proportion of employed
females were from urban areas (61.1 per cent) than employed males (55.6 per cent).
Females from rural areas who did not complete any formal education were among the least
likely to be employed.
Concerning occupations, 28.1 per cent of employed youth were working as service
workers, shop and market sales workers (figure 3.19). This was followed by elementary
occupations (15.4 per cent), clerks (14.9 per cent) and craft and related trade workers (11.9
per cent). Analysis by sex shows that craft and related trade workers was the occupation
held by the greatest proportion of males (19.9 per cent), followed by service workers (18.9
per cent) and elementary occupations (18.6 per cent). Young women were primarily
engaged as service workers, shop and market sales workers (41.0 per cent), clerks (23.6
per cent) and in elementary occupations (11.0 per cent). Interestingly, very few females
6 Does not include those currently enrolled in school or training.

31
were engaged as craft and related trade workers (0.7 per cent) or as plant and machine
operators and assemblers (0.5 per cent). However, a greater proportion of females than
males were professionals (10.8 per cent and 3.9 per cent, respectively).
Figure 3.19 Employed youth by occupation
Source: STATIN, SWTS Jamaica 2013.
Industrial activity in Jamaica is classified according to the Jamaica Industrial
Classification (JIC).7 The JIC has three broad sectors, namely agriculture, industry and
services, which together contain 16 major groups.8 A majority of employed youth were
engaged in wholesale and retail trade; repair of motor vehicles, etc. (27.3 per cent),
followed by hotels and restaurants (12.4 per cent) and agriculture, hunting and forestry (9.9
per cent) (figure 3.20).
7 Based on the International Standard Industrial Classification (ISIC).
8 Agriculture includes agriculture, hunting and forestry; and fishing. Industry includes mining and
quarrying; manufacturing; and construction. Services includes electricity, gas and water supply;
wholesale and retail trade; repair of motor vehicles, motorcycles and personal and household goods;
hotels and restaurants; transport, storage and communications; financial intermediation; real estate,
renting and business activities; public administration and defence; compulsory social security;
education; health and social work; other community, social and personal service activities; and
private households with employed persons.
0 5 10 15 20 25 30 35 40 45
Plant and Machine Operators and Assemblers
Legislators, Senior Officials and Managers
Technicians and Associate Professionals
Professionals
Skilled Agricultural and Fishery Workers
Craft and Related Trades Workers
Clerks
Elementary Occupations
Service Workers and Shop and Market Sales Workers
%
Total Male Female
32
Figure 3.20 Employed youth by 1-digit sector
Source: STATIN, SWTS Jamaica 2013.
Analysis by sex shows that the “wholesale and retail trade” group was the largest
employer of both females and males (29.7 and 25.5 per cent, respectively). However,
significantly more males than females were employed in agriculture, hunting and forestry,
and in construction, and more females were working in hotels and restaurants as well as in
other community, social and personal service activities.
As shown in figure 3.21, 10.3 per cent of employed youth worked in the agriculture
sector, 14.6 per cent in industry and 75.1 per cent in services. Females were more likely to
have worked in the services sector than their male counterparts (92.3 and 62.8 per cent,
respectively).
Figure 3.21 Employed youth by aggregated sector and sex
Source: STATIN, SWTS Jamaica 2013.
0 5 10 15 20 25 30 35
Fishing
Mining and Quarrying
Electricity, Gas and Wtaer Supply
Financial Intermediation
Private Households with Employed Persons
Health and Social Work
Public Administration etc
Transport, Storage and Communications
Education
Real Estate, renting and Business Activities
Manufacturing
Construction
Other Community, Social and personal Service Activities
Agiculture, Hunting and Forestry
Hotels and Restaurants
Wholesale and Retail Trade; Repair of Motor Vehicles etc
% Total Male Female
2.6 15.8 10.3 5.1
21.5 14.6
92.3
62.8 75.1
0%
20%
40%
60%
80%
100%
Female Male Total
Agriculture, Hunting, Forestry and Fishing Industry Services

33
Regarding their status when employed, 68.2 per cent of youth were in paid work, 23.1
per cent were own-account workers and 6.9 per cent were working without pay.
Disaggregated by age group, a similar distribution existed of employed youth in the 20–24
and 25–29 age groups regarding their status in employment (figure 3.22). The youngest
(15–19) age group, however, had a noticeably different distribution. Whereas over 70 per
cent of employed older youth reported they were in paid work, the share was 54.3 per cent
among employed youth aged 15–19. Additionally, a noticeably higher proportion of youth
in this age group (24.3 per cent) were working without pay compared to 5.0 per cent in the
20–24 age group and 3.3 per cent in the 25–29 age group. The results are not surprising,
given that many youth in the youngest age group will be studying full time and less able to
engage in employment outside the family establishment
Figure 3.22 Employed youth by status of employment and age group
Source: STATIN, SWTS Jamaica 2013.
3.3.1 Informal employment and employment in the informal sector
Less than one-quarter of employed youth (24.7 per cent) were engaged in formal
employment (figure 3.23). In other words, the survey showed that of the 302,300 employed
youth, approximately 74,800 were employed formally, working for pay at a legally
registered enterprise in the formal sector, and entitled to social protection and certain
employment benefits. The remaining 227,500 youth (75.3 per cent) were in informal
employment,9 either employed in the informal sector (127,000 or 42.0 per cent) or
informally employed in the formal sector (100,500 or 33.3 per cent).
9 Informal employment is measured according to the guidelines recommended by the 17th International
Conference of Labour Statisticians. It includes the following sub-categories of workers: (a) paid employees in
“informal jobs”, i.e. jobs without either a social security settlement, paid annual leave or paid sick leave; (b)
paid employees in an unregistered enterprise with size classification below five employees; (c) own-account
workers in an unregistered enterprise with size classification below five employees; (d) employers in an
unregistered enterprise with size classification below five employees; and (e) contributing family workers.
54.3
70.3 70.6 68.2
0.0
2.0 2.0 1.7 21.4
22.7 24.1 23.1
24.3
5.0 3.3 6.9
0
10
20
30
40
50
60
70
80
90
100
15-19 20-24 25-29 Total
%
Employee Employer Own Account Worker Helping Without Pay

34
Figure 3.23 Employed youth by informal employment (%)
Source: STATIN, SWTS Jamaica 2013.
3.3.2 Wage and salaried workers (employees)
An estimated 206,300 youth were classified as wage and salaried workers. Within this
group, 50.7 per cent or 104,700 youth were employed on the basis of a written contract,
while the remainder worked by oral agreement (table 3.14). More than three-quarters of
wage and salaried youth (75.1 per cent) had employment contracts of unlimited duration,
and 24.9 per cent had limited-duration contracts. Similarly, the majority of wage and
salaried youth (67.9 per cent) were satisfied with their contract, while less than one-third
were not.
Table 3.14 Young wage and salaried workers by contract type, tenure and satisfaction with contract
Contract Number %
Type of contract
Written 104 700 50.7
Oral agreement 101 600 49.3
Total 206 300 100.0
Contract tenure
Unlimited duration 154 600 75.1
Limited duration 51 200 24.9
Total 205 800 100.0
Satisfaction with contract
Satisfied 140 100 67.9
Not satisfied 66 200 32.1
Total 206 300 100.0
Source: STATIN, SWTS Jamaica 2013.
Youth expressing satisfaction with their contracts were mainly so because their jobs
provided opportunities for personal/career development (25.6 per cent) (figure 3.24).
Flexibility proved to be another key source of satisfaction (18.7 per cent), as did the feeling
of job security (16.1 per cent). Interestingly, lack of job security (11.0 per cent) was the
Formal employment
24.7
Informal employment in the formal
sector 33.3
Informal sector 42.0
35
primary reason for dissatisfaction, followed by lack of personal/career development (6.0
per cent) and not getting the same benefits as other employees (5.9 per cent).
Figure 3.24 Wage and salaried workers by reason for satisfaction and dissatisfaction with contract
Source: STATIN, SWTS Jamaica 2013.
The survey found that, on average, wage and salaried youth worked for 39 hours per
week, and that those with a written contract worked more hours than those with an oral
agreement (41 and 36 hours, respectively) (figure 3.25).
Figure 3.25 Young wage and salaried workers by number of hours worked per week and type of contract
Source: STATIN, SWTS Jamaica 2013.
Wage and salaried youth were asked about their access to benefits/entitlements in the
workplace. Figure 3.26 shows that 51.1 per cent said they were able to benefit from social
security contributions, 44.8 per cent received paid sick leave, 41.8 per cent received annual
paid leave and 38.2 per cent benefited from overtime pay. While this access to benefits is
encouraging, a concern is that fewer than one-half of young employees benefited from
standard entitlements such as paid sick and annual leave. Only a small share of employed
youth received benefits for childcare facilities and transport/transport allowance.
Importantly, a large portion of salaried youth did not have or did not know of access to a
pension scheme (77.8 per cent) or medical insurance (69.5 per cent) at their place of
employment.
16.1
18.7
3.9
25.6
3.7
11.0
1.8
5.9
6.0
7.3
0 5 10 15 20 25 30
It Gives Me The Job Security I Need
It Gives Me The Flexibility That I Need
The Wage Is High Enough That I Dont Care About Terms…
Provides Opportunity For Personal / Career Development
Other Reason For Satisfaction
Does Not Give Me The Job Security I Need
Does Not Give Me The Flexibility I Need
Do Not Get Same Benefits As Other Employees
Does Not Lead To Personal / Career Development
Other Reason For Dissatisfaction
Sat
isfie
dN
ot S
atis
fied
%
41.3
36.0
32
34
36
38
40
42
Ave
rag
e n
o. o
f h
ou
rs w
ork
ed p
er
wee
k
Written Contract An Oral Agreement

36
Figure 3.26 Young wage and salaried workers by benefits received
Source: STATIN, SWTS Jamaica 2013.
Youth in paid work were asked about perceived gender bias in the workplace –
whether, in their current job, they felt that a woman had the same opportunities as a man to
be promoted or to be successful. Overall, in their current jobs, less than two-thirds (65.4
per cent) responded that gender bias did not exist in their workplace (figure 3.27).
However, among those perceiving a gender bias, a larger proportion saw greater
opportunities for men (23.2per cent) than for women (11.4 per cent).
Figure 3.27 Youth’s perceived gender bias in the workplace by sex
Source: STATIN, SWTS Jamaica 2013.
Interestingly, youth’s perception of gender bias in the workplace was affected by their
sex. A larger proportion of females than males (18.7 per cent versus 6.2 per cent,
respectively) saw greater opportunities for women, while a larger proportion of males than
females (33.4 per cent versus 8.9 per cent, respectively) saw greater opportunities for men.
0% 10% 20% 30% 40% 50% 60% 70% 80% 90% 100%
Childcare Facilities
Transport/ Transport Allowance
Educational/ Training Courses
Pension
Severance/ End Of Service Payment
Bonus/ Reward For Good Performance
Medical Insurance
Occupational Safety/ Protective Equipment Or Clothing
Meals/ Meal Allowance
Maternity/ Paternity Leave
Overtime Pay
Annual Paid Leave
Paid Sick Leave
Social Security Contribution
Yes No/ Don't Know
8.9
33.4 23.2
72.4
60.3 65.4
18.7 6.2 11.4
0
20
40
60
80
100
Female Male Total
%
Greater Opportunities For Women
Equal Opportunities For Men And Women
Greater Opportunities For Men
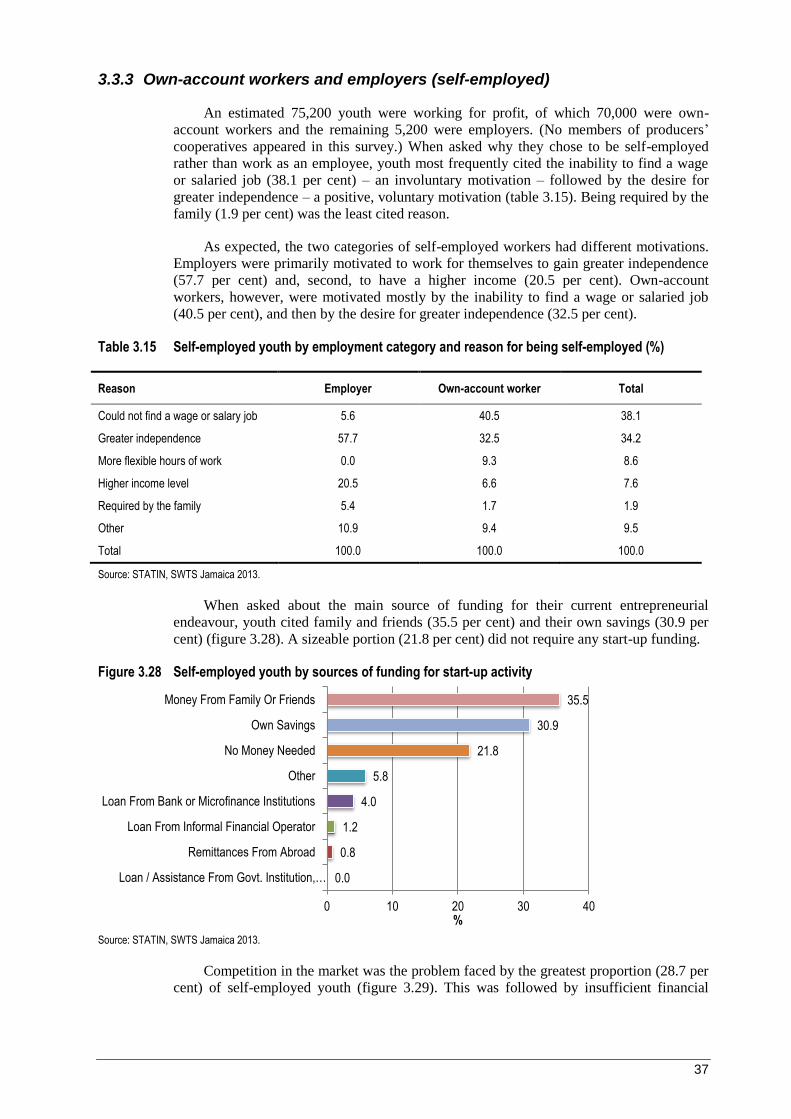
37
3.3.3 Own-account workers and employers (self-employed)
An estimated 75,200 youth were working for profit, of which 70,000 were own-
account workers and the remaining 5,200 were employers. (No members of producers’
cooperatives appeared in this survey.) When asked why they chose to be self-employed
rather than work as an employee, youth most frequently cited the inability to find a wage
or salaried job (38.1 per cent) – an involuntary motivation – followed by the desire for
greater independence – a positive, voluntary motivation (table 3.15). Being required by the
family (1.9 per cent) was the least cited reason.
As expected, the two categories of self-employed workers had different motivations.
Employers were primarily motivated to work for themselves to gain greater independence
(57.7 per cent) and, second, to have a higher income (20.5 per cent). Own-account
workers, however, were motivated mostly by the inability to find a wage or salaried job
(40.5 per cent), and then by the desire for greater independence (32.5 per cent).
Table 3.15 Self-employed youth by employment category and reason for being self-employed (%)
Reason Employer Own-account worker Total
Could not find a wage or salary job 5.6 40.5 38.1
Greater independence 57.7 32.5 34.2
More flexible hours of work 0.0 9.3 8.6
Higher income level 20.5 6.6 7.6
Required by the family 5.4 1.7 1.9
Other 10.9 9.4 9.5
Total 100.0 100.0 100.0
Source: STATIN, SWTS Jamaica 2013.
When asked about the main source of funding for their current entrepreneurial
endeavour, youth cited family and friends (35.5 per cent) and their own savings (30.9 per
cent) (figure 3.28). A sizeable portion (21.8 per cent) did not require any start-up funding.
Figure 3.28 Self-employed youth by sources of funding for start-up activity
Source: STATIN, SWTS Jamaica 2013.
Competition in the market was the problem faced by the greatest proportion (28.7 per
cent) of self-employed youth (figure 3.29). This was followed by insufficient financial
0.0
0.8
1.2
4.0
5.8
21.8
30.9
35.5
Loan / Assistance From Govt. Institution,…
Remittances From Abroad
Loan From Informal Financial Operator
Loan From Bank or Microfinance Institutions
Other
No Money Needed
Own Savings
Money From Family Or Friends
0 10 20 30 40%

38
resources (19.5 per cent) and issues associated with the current economic climate (11.3 per
cent), such as the high rate of bad debt.
Figure 3.29 Self-employed youth by most important problem faced and area of residence
Source: STATIN, SWTS Jamaica 2013.
3.3.4 Contributing family workers
Youth working without pay in their family businesses were primarily engaged as
contributing family workers because they could not find a wage or salaried job (33.6 per
cent) (figure 3.30). A large proportion was required by the family to work in the family
business (30.7 per cent). Over 13 per cent wanted to learn the family business, while 22.5
per cent had other reasons (e.g. working without pay in the family business by choice or to
keep busy while seeking paid employment).
Figure 3.30 Contributing family workers by reason for engagement (%)
Source: STATIN, SWTS Jamaica 2013.
0 5 10 15 20 25 30 35
Political Uncertainties
Access To Technology
Insufficient Quality Of Staff
Product Development
Labour Shortage
Shortages In Raw Materials
Insufficient (Personal) Business Experience
Crime
Environmental Challenges
Legal Regulations
No Problems
Other
Economic Uncertainties
Economic Climate
Insufficient Financial Resources
Competition In The Market
%
Total
Rural
Urban
Could not find a wage or
salaried job 33.6
Required by family 30.7
Learning the family
business 13.2
Other 22.5

39
3.3.5 Perceived adequacy of education/training and education mismatch
Employed youth were asked whether or not they thought their current education or
training qualification was relevant in performing their job. An overwhelming majority
(70.3 per cent) indicated that their education/training qualifications were relevant to
performing their current job (figure 3.31). Another 17.8 per cent believed that they were
overqualified for the job they were engaged in, while 9.9 per cent identified gaps in their
knowledge and skills that would merit additional training. A small proportion (2.0 per
cent) thought the question was irrelevant as they were still studying/being trained to
improve their skill set.
Figure 3.31 Employed youth by perceived adequacy of education/training (%)
Source: STATIN, SWTS Jamaica 2013.
Disaggregated by education level, the data show that youth with lower levels of
education were more inclined to see gaps in their education and skill sets than those with
higher levels (table 3.16). Those with university/tertiary education tended to think they
were overqualified for their jobs. Interestingly, a high proportion of those whose highest
education was secondary-level vocational school felt they were overqualified for their job
(27.2 per cent). By sex, a greater proportion of females than males (20.6 per cent compared
to 16.4 per cent) believed they were overqualified, while a larger proportion of males than
females (11.9 per cent compared to 7.5 per cent) saw gaps in their knowledge or skills.
Youth from urban areas were more likely to feel their education/skills were relevant
to their jobs held at the time (73.7 per cent) than youth from rural areas (69.1 per cent). A
noticeably larger proportion of youth from the poorest quintile (20.1 per cent) believed
gaps existed in their education/skills compared to youth from the wealthiest quintile (7.9
per cent).
Relevant 70.3
Overqualified 17.8
Gaps in knowledge and
skills 9.9
Still studying 2.0

40
Table 3.16 Youth by perceived appropriateness of education/training, level of education, sex, age group, area of residence and wealth index quintile
Characteristic Relevant Overqualified
Gaps in knowledge and
skills Total
% % % Number %
Level of completed formal education10
None 80.1 0.0 19.9 1 300 100.0
Elementary school (primary) 61.2 10.4 28.5 32 200 100.0
Vocational school (technical high) 62.9 27.2 9.9 9 400 100.0
Secondary school 73.3 17.9 8.9 132 400 100.0
Vocational school (e.g. HEART) 68.6 20.9 10.5 52 600 100.0
University/tertiary education 79.2 19.7 1.1 30 600 100.0
Postgraduate studies 0.0 0.0 0.0 0 100.0
Total 71.2 18.0 10.8 258 500 100.0
Sex
Female 71.9 20.6 7.5 121 300 100.0
Male 71.6 16.4 11.9 174 500 100.0
Total 71.8 18.1 10.1 295 800 100.0
Age group
15–19 63.2 22.3 14.5 39 000 100.0
20–24 69.5 20.7 9.8 117 700 100.0
25–29 76.1 14.8 9.1 139 000 100.0
Total 71.8 18.1 10.1 295 700 100.0
Area of residence
Urban 73.7 17.4 8.9 171 000 100.0
Rural 69.1 19.2 11.8 124 800 100.0
Total 71.8 18.1 10.1 295 800 100.0
Wealth index quintile
Poorest 62.4 17.5 20.1 51 400 100.0
Second 73.5 16.3 10.2 54 100 100.0
Middle 73.3 17.5 9.1 57 500 100.0
Fourth 71.2 23.5 5.3 64 800 100.0
Wealthiest 76.7 15.4 7.9 67 900 100.0
Total 71.8 18.1 10.1 295 700 100.0
Source: STATIN, SWTS Jamaica 2013.
An alternative means of generating information on the skills mismatch is to look at a
person’s educational attainment against the level of qualifications typically expected of the
job. Objectively, the skills mismatch between the job executed and the educational
qualification is measured by applying the normative measure of occupational skills
categories from the International Standard Classification of Occupations (ISCO) (ILO,
2013, p. 44). ISCO-08 includes the categorization of major occupational groups (first-digit
ISCO levels) by level of education in accordance with the International Standard
Classification of Education (ISCED). Table 3.17 summarizes the ISCO-based educational
classification.
10 Does not include those who are enrolled in school or training.

41
Table 3.17 ISCO major groups and education levels
ISCO major group Broad occupation group Education level
Managers
High-skilled non-manual Tertiary (ISCED 5–6) Professionals
Technicians & associate professionals
Clerical support workers Low-skilled non-manual
Service & sales workers
Skilled agricultural & fishery workers Secondary (ISCED 3–4)
Craft & related trades workers Skilled manual
Plant & machine operators & assemblers
Elementary occupations Unskilled Primary (ISCED 1–2)
Workers in a particular group who have the assigned level of education are
considered well-matched. Those who have a higher (lower) level of education are
considered overeducated (undereducated). For example, a university graduate working as a
clerk (a low-skilled non-manual occupation) is overeducated, while someone whose
highest education level is secondary school but who is working as an engineer (a high-
skilled non-manual occupation) is undereducated.
The results in Jamaica show there were many more young surveyed workers in
occupations that match their level of education (67.4 per cent) than in occupations for
which they were overeducated or undereducated. Table 3.18 provides the breakdown: 17.5
per cent of young workers were overeducated and 18.3 per cent were undereducated.
Interestingly, the share of overeducated youth matches quite closely the share of young
workers who stated they felt overqualified for their job (17.8 per cent, figure 3.31).
The phenomenon of overeducation tends to take place when an insufficient number of
jobs match a certain level of education, which forces some of the degree holders to take up
available work for which they are overqualified. One consequence is that overeducated
youth are likely to earn less than they otherwise could have and are not making the most of
their productive potential. Another consequence is the crowding out of youth at the bottom
of the educational pyramid. The less-educated youth find themselves at the back of the
queue even for those jobs for which they are best qualified.
Table 3.18 presents the indicators by major occupational category of young Jamaican
workers. The data support the premise that some highly educated young people must
“settle” for jobs for which they are overqualified, with a particularly high proportion of
overeducated youth engaged as elementary labourers (80.5 per cent). On the other hand,
young people also hold positions that do not perfectly match their education level.
Legislators, senior officials and managers (major category 1) as well as technicians and
associate professionals (major category 3) included the greatest proportion of
undereducated (71.6 per cent and 74.0 per cent, respectively). In addition, 38.1 per cent of
young professionals were undereducated as were 23.1 per cent of youth working in skilled
agriculture and fishery.

42
Table 3.18 Shares of overeducated and undereducated young workers by major occupational category (ISCO-08, %)
Major occupational category (ISCO-08) Overeducated Undereducated
1: Legislators, senior officials & managers 0.0 71.6
2: Professionals 0.0 38.1
3: Technicians & associate professionals 0.0 74.0
4: Clerks 20.4 0.0
5: Service workers, shop & market sales workers 4.7 15.3
6: Skilled agricultural & fishery workers 2.6 23.1
7: Craft & related trade workers 3.9 17.1
8: Plant & machine operators & assemblers 3.2 10.8
9: Elementary occupations 80.5 0.7
Total 17.5 18.3
Source: STATIN, SWTS Jamaica 2013.
3.3.6 Time related underemployment and other inadequate employment situations
Underemployment reflects underutilization of the labour force, and is broadly
interpreted as any sort of employment deemed “inadequate” from the worker’s perspective.
Time-related underemployment relates to “all persons in employment who, during the
reference period used to define employment, were willing to work additional hours, were
available to work additional hours, and whose hours actually worked in all jobs during the
reference period were below a threshold to be determined according to national
circumstances” (Elder, 2009). For the purposes of this survey, the threshold for time-
related underemployment is defined according to two criteria: 35 hours per week and 40
hours per week. Using the 35-hour criteria, approximately 48,800 youth (16.1 per cent of
employed youth) were estimated to be underemployed (figure 3.32). Increasing the
minimum number of hours worked to 40 hours per week yielded an estimated 52,200
underemployed youth (17.3 per cent of employed youth).
Figure 3.32 Employed youth who are underemployed by hours-per-week criteria
Source: STATIN, SWTS Jamaica 2013.
Table 3.19 provides indicators relating to job satisfaction and the desire to change
jobs. Job satisfaction was high among employed youth: 73.7 per cent indicated they were
satisfied or very satisfied with their main job. Of the remaining 26.3 per cent, only 7.2 per
cent were very unsatisfied with their main job.
17.3 16.1
0
2
4
6
8
10
12
14
16
18
20
Underemployed (using 40 Hours) Underemployed (using 35 Hours)
%
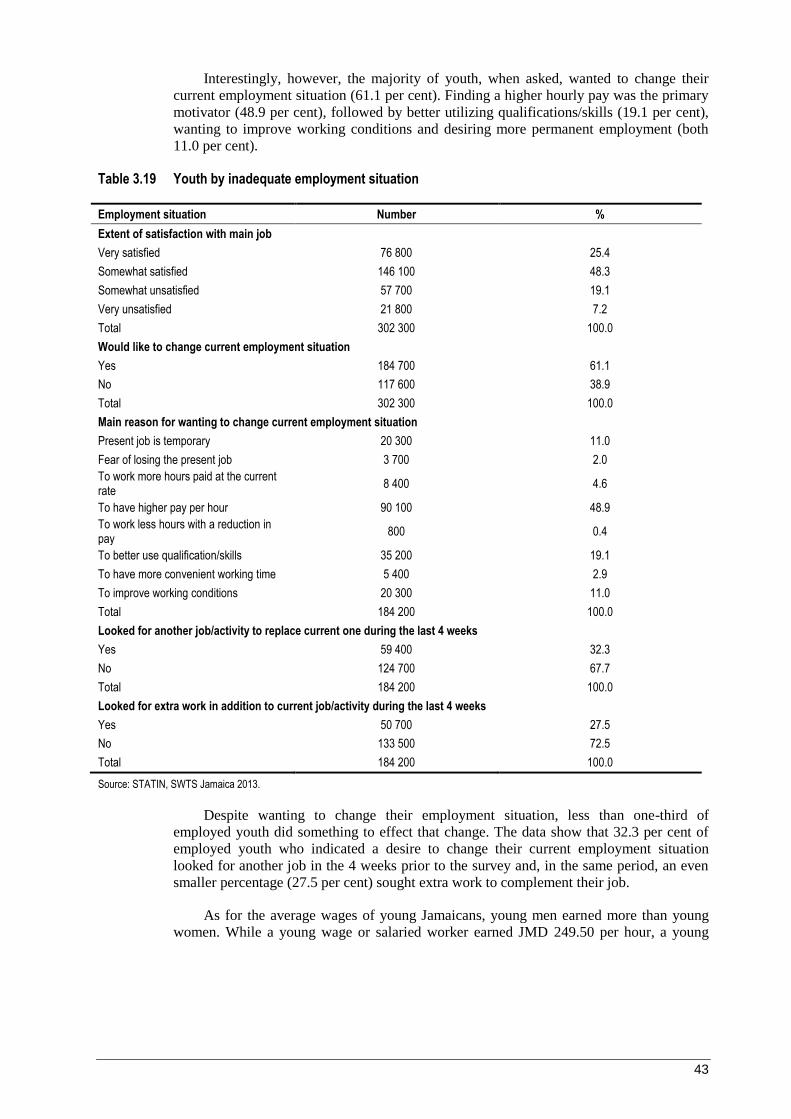
43
Interestingly, however, the majority of youth, when asked, wanted to change their
current employment situation (61.1 per cent). Finding a higher hourly pay was the primary
motivator (48.9 per cent), followed by better utilizing qualifications/skills (19.1 per cent),
wanting to improve working conditions and desiring more permanent employment (both
11.0 per cent).
Table 3.19 Youth by inadequate employment situation
Employment situation Number %
Extent of satisfaction with main job
Very satisfied 76 800 25.4
Somewhat satisfied 146 100 48.3
Somewhat unsatisfied 57 700 19.1
Very unsatisfied 21 800 7.2
Total 302 300 100.0
Would like to change current employment situation
Yes 184 700 61.1
No 117 600 38.9
Total 302 300 100.0
Main reason for wanting to change current employment situation
Present job is temporary 20 300 11.0
Fear of losing the present job 3 700 2.0
To work more hours paid at the current rate
8 400 4.6
To have higher pay per hour 90 100 48.9
To work less hours with a reduction in pay
800 0.4
To better use qualification/skills 35 200 19.1
To have more convenient working time 5 400 2.9
To improve working conditions 20 300 11.0
Total 184 200 100.0
Looked for another job/activity to replace current one during the last 4 weeks
Yes 59 400 32.3
No 124 700 67.7
Total 184 200 100.0
Looked for extra work in addition to current job/activity during the last 4 weeks
Yes 50 700 27.5
No 133 500 72.5
Total 184 200 100.0
Source: STATIN, SWTS Jamaica 2013.
Despite wanting to change their employment situation, less than one-third of
employed youth did something to effect that change. The data show that 32.3 per cent of
employed youth who indicated a desire to change their current employment situation
looked for another job in the 4 weeks prior to the survey and, in the same period, an even
smaller percentage (27.5 per cent) sought extra work to complement their job.
As for the average wages of young Jamaicans, young men earned more than young
women. While a young wage or salaried worker earned JMD 249.50 per hour, a young

44
man earned JMD 279.10 and a young woman JMD 206.00 (table 3.20). Another important
finding concerns the wage premium that comes with increased education.11
For example,
the average wage of a young employee with a university education was double that of a
young employee with primary education. At the aggregate level, the young self-employed
worker (own-account worker or employer) earned less than the paid employee. However, a
clear divergence exists between the sexes. While young female self-employed workers
earned well below (nearly one-sixth) what was paid to female employees, self-employed
males earned more than their paid counterparts. In addition, the wage advantage of
education does not hold for self-employed youth; for them, having vocational training or
less than secondary education appears to be an advantage.
Table 3.20 Mean hourly wages of young wage and salaried workers and self-employed workers by sex and level of completed education (Jamaican dollars)
Characteristic
Wage and salaried workers Self-employed workers All
Mean hourly wage
Std dev. Mean hourly
wage Std dev.
Mean hourly wage
Std dev.
Sex
Female 206.00 0.6 36.80 0.4 167.60 0.6
Male 279.10 1.1 321.50 6.7 289.00 2.4
Level of education
Primary 198.60 1.3 348.50 14.2 260.70 6.6
Secondary 208.00 0.7 134.30 3.3 191.00 1.3
University 407.20 2.4 77.00 2.1 381.50 2.4
Vocational 281.70 2.3 432.20 15.9 309.90 4.9
Total 249.50 0.7 208.60 4.1 240.10 1.5
Std dev = Standard deviation.
Source: STATIN, SWTS Jamaica 2013.
3.3.7 Future prospects
The youth were asked questions aimed at assessing their outlook as it relates to job
stability. Whereas 75.1 per cent of youth indicated that their employment contract was of
an unlimited duration (table 3.14), only 62.7 per cent believed that in the next 12 months
they would be able to keep their main job if they wanted to (figure 3.33). Another 21.5 per
cent were uncertain but positive, while the remaining 15.8 per cent either had a negative
outlook or did not know about their future employment.
11 The UN operational rate of exchange on 1 March 2013 (the period of the survey's field work) was JMD
95.05 per US dollar. The average hourly wage of a young Jamaican employee was therefore the equivalent of
US$2.53. The university graduate in paid employment earned the equivalent of US$4.28 per hour.

45
Figure 3.33 Youth’s perceived ability to keep current job (%)
Source: STATIN, SWTS Jamaica 2013.
3.3.8 The job search
The distribution of the length of job search of youth currently employed implies that
those who did not find employment relatively quickly were likely to have had an extended
job search lasting 6 months or more (figure 3.34). A high percentage of youth (42.9 per
cent) found their current job in less than 3 months after becoming available and actively
seeking employment. Almost 11 per cent found their job within 3 to just under 6 months,
while the remaining 46.2 per cent were available and actively seeking employment for at
least 6 months before finding their current job.
Figure 3.34 Currently employed youth by length of job search
Source: STATIN, SWTS Jamaica 2013.
When seeking employment, youth applied for an average of five jobs in the 12
months prior to starting their current job. On average, females applied for more jobs (7)
than males (3) (table 3.21); 95 per cent of females applied for 26 or fewer jobs, whereas
the same percentage of males applied for 15 or fewer jobs.
Very likely 62.7
Likely, but not certain 21.5
Not likely 10.4
Do not know 5.4
20.1
11.3
11.5
10.9
15.1
15.4
15.7
Less Than A Week
1 Week To Less Than 1 Month
1 Month To Less Than 3 Months
3 Months To Less Than 6 Months
6 Months To Less Than 1 Year
1 Year To Less Than 2 Years
2 Years Or More
0 5 10 15 20 25
%
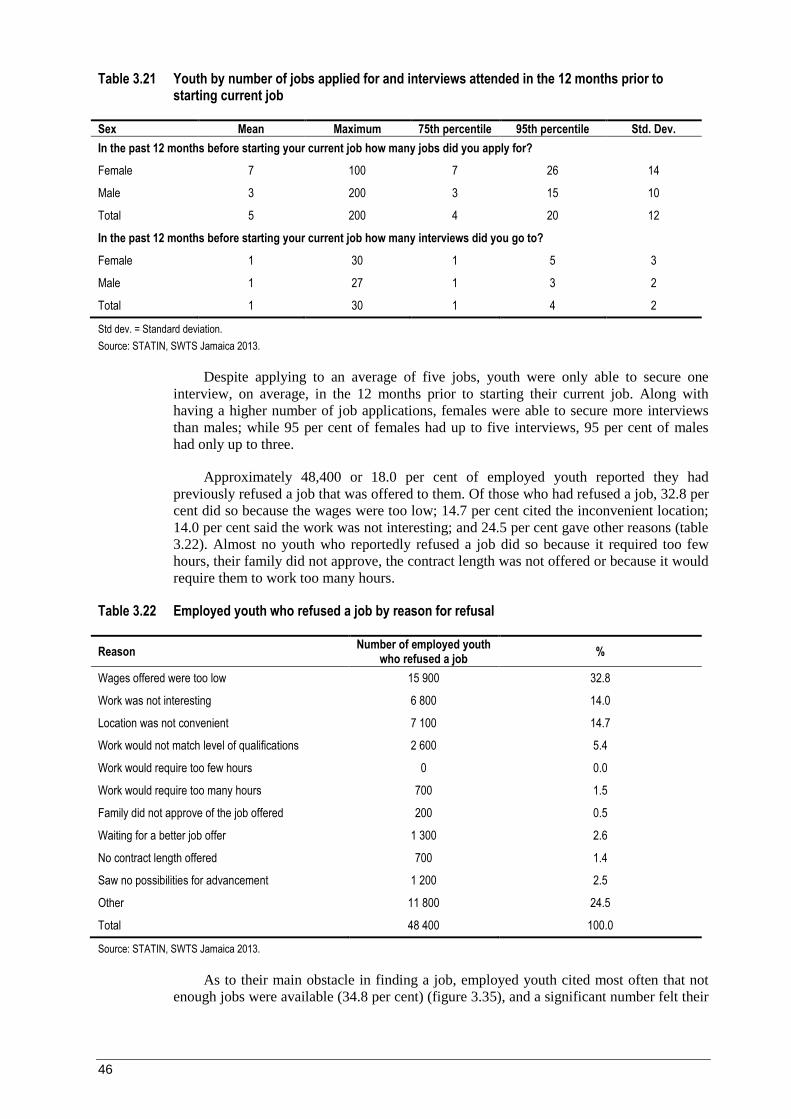
46
Table 3.21 Youth by number of jobs applied for and interviews attended in the 12 months prior to starting current job
Sex Mean Maximum 75th percentile 95th percentile Std. Dev.
In the past 12 months before starting your current job how many jobs did you apply for?
Female 7 100 7 26 14
Male 3 200 3 15 10
Total 5 200 4 20 12
In the past 12 months before starting your current job how many interviews did you go to?
Female 1 30 1 5 3
Male 1 27 1 3 2
Total 1 30 1 4 2
Std dev. = Standard deviation.
Source: STATIN, SWTS Jamaica 2013.
Despite applying to an average of five jobs, youth were only able to secure one
interview, on average, in the 12 months prior to starting their current job. Along with
having a higher number of job applications, females were able to secure more interviews
than males; while 95 per cent of females had up to five interviews, 95 per cent of males
had only up to three.
Approximately 48,400 or 18.0 per cent of employed youth reported they had
previously refused a job that was offered to them. Of those who had refused a job, 32.8 per
cent did so because the wages were too low; 14.7 per cent cited the inconvenient location;
14.0 per cent said the work was not interesting; and 24.5 per cent gave other reasons (table
3.22). Almost no youth who reportedly refused a job did so because it required too few
hours, their family did not approve, the contract length was not offered or because it would
require them to work too many hours.
Table 3.22 Employed youth who refused a job by reason for refusal
Reason Number of employed youth
who refused a job %
Wages offered were too low 15 900 32.8
Work was not interesting 6 800 14.0
Location was not convenient 7 100 14.7
Work would not match level of qualifications 2 600 5.4
Work would require too few hours 0 0.0
Work would require too many hours 700 1.5
Family did not approve of the job offered 200 0.5
Waiting for a better job offer 1 300 2.6
No contract length offered 700 1.4
Saw no possibilities for advancement 1 200 2.5
Other 11 800 24.5
Total 48 400 100.0
Source: STATIN, SWTS Jamaica 2013.
As to their main obstacle in finding a job, employed youth cited most often that not
enough jobs were available (34.8 per cent) (figure 3.35), and a significant number felt their

47
level of education was inadequate given job requirements (15.8 per cent). However, a large
proportion (22.6 per cent) saw no obstacle in finding a job.
Figure 3.35 Employed youth by main obstacle to finding a job
Source: STATIN, SWTS Jamaica 2013.
As previously stated, the unemployed are those not engaged in any kind of work or
economic activity, be it paid employment, self-employment or working for family gain, but
are available for work and actively seeking work. The relaxed definition of unemployment
includes those available for work but not actively seeking it. This section focuses on
unemployed youth, their characteristics and their perceptions.
The survey estimates there are about 149,000 unemployed Jamaican youth, using the
strict definition, or 246,300 using the relaxed definition (table 3.12). The strict and relaxed
youth unemployment rates are very high, at 33.0 per cent and 44.9 per cent, respectively.
The survey found that a majority of unemployed youth were female (56.8 per cent,
with 43.2 per cent male). By age, 47.0 per cent were 20–24, 29.6 per cent were 25–29 and
the remaining 23.4 per cent were 15–19 (table 3.23). With the relaxed definition of
unemployment, those aged 20–24 were still the largest group (41.0 per cent); in this
category, however, the 15–19 age group made up a higher percentage of unemployed
youth, most likely because this group included young people engaged in educational
pursuits and thus not actively seeking employment, although they would have taken up
work if a job had become available. The mean age of unemployed youth was 22.5 years.
Using the relaxed definition, the average age declines to 21.8 years.
3.4 Unemployed youth
As previously stated, the unemployed are those not engaged in any kind of work or
economic activity, be it paid employment, self-employment or working for family gain, but
are available for work and actively seeking work. The relaxed definition of unemployment
includes those available for work but not actively seeking it. This section focuses on
unemployed youth, their characteristics and their perceptions.
0 5 10 15 20 25 30 35 40
Being Male/Female
Poor Working Conditions In Available Jobs
Did Not Know How Or Where To Seek Work
Considered Too Young
Discriminatory Prejudices
Where I Live / Address
Other
Low Wages In Available Jobs
Not Enough Work Experience
Requirements For Job Were Higher Than Education /…
Saw No Obstacle
Not Enough Jobs Available
%
Total Male Female

48
The survey estimates there are about 149,000 unemployed Jamaican youth, using the
strict definition, or 246,300 using the relaxed definition (table 3.12). The strict and relaxed
youth unemployment rates are very high, at 33.0 per cent and 44.9 per cent, respectively.
The survey found that a majority of unemployed youth were female (56.8 per cent,
with 43.2 per cent male). By age, 47.0 per cent were 20–24, 29.6 per cent were 25–29 and
the remaining 23.4 per cent were 15–19 (table 3.23). With the relaxed definition of
unemployment, those aged 20–24 were still the largest group (41.0 per cent); in this
category, however, the 15–19 age group made up a higher percentage of unemployed
youth, most likely because this group included young people engaged in educational
pursuits and thus not actively seeking employment, although they would have taken up
work if a job had become available. The mean age of unemployed youth was 22.5 years.
Using the relaxed definition, the average age declines to 21.8 years.
Table 3.23 Unemployed youth by age group (%)
Age group Strict unemployed Relaxed unemployed
15–19 23.4 32.1
20–24 47.0 41.0
25–29 29.6 26.9
Total 100.0 100.0
Source: STATIN, SWTS Jamaica 2013.
A majority of unemployed youth, using either the strict (53.5 per cent) or relaxed
(52.6 per cent) definition of unemployment, were located in Jamaica’s urban areas.
Unemployed youth who completed their education were asked to state the highest
level of formal education or training they received, which for the majority was the
secondary level (figure 3.36).
Figure 3.36 Unemployed youth by highest educational attainment
Source: STATIN, SWTS Jamaica 2013.
Using the strict definition, 12.4 per cent of unemployed youth were enrolled in an
educational institution at the time of the SWTS. Of these, 33.7 per cent were at the
university/tertiary level, 32.1 per cent at the post-secondary vocational level and 30.8 per
0.3
13.4
3.9
55.2
18.7
6.3
0.3 0.6
15.7
4.5
56.4
15.9
5.0
0.4 0
10
20
30
40
50
60
NONE Primary School Vocational/Technical High
SecondarySchool
Vocational (e.g.HEART)
University/Tertiary
Post Graduate
%
Unemployed (Strict) Unemployed (Relaxed)

49
cent at the secondary level. Using the relaxed definition of unemployment, 20.6 per cent
were attending school. Of these, 51.9 per cent were in secondary school while 21.7 per
cent were in university/tertiary-level education (table A.13).
The youth unemployment rate showed a tendency to decrease as the level of
education increased (table 3.24). The (strict) unemployment rate among young people who
completed primary-level education was 35.3 per cent compared to 21.8 per cent among
those who completed tertiary-level education or higher. The gap between the two levels is
even greater when the relaxed definition is used. The evidence thus demonstrates that the
lesser skilled have a harder time finding work, and that investing in higher education leads
to better labour market returns.
Table 3.24 Youth unemployment rate and level of formal education completed (%)
Formal education completed Strict Relaxed
Elementary school (primary) 35.3 48.9
Vocational school (technical high) 34.6 47.7
Secondary school 35.1 45.4
Vocational school (e.g. HEART) 31.5 37.0
University/tertiary, postgraduate education 21.8 25.4
Source: STATIN, SWTS Jamaica 2013.
Concerning caregivers, over 50 per cent of unemployed youth had a father as the
primary male caregiver (53.8 per cent – strict-definition – and 56.3 per cent –relaxed
definition) (table 3.25). In contrast, a higher proportion of employed youth (58.8 per cent)
had a father as primary male caregiver. The disparity is less significant in the percentages
of youth who had no one playing the role of father in their lives as children.
Figure 3.37 shows the greatest percentage of unemployed youth had male caregivers
who worked as craft and related trade workers (24.1 per cent), skilled agricultural and
fishery workers (23.2 per cent) and in elementary occupations (17.4 per cent). Notably,
fathers of unemployed youth were generally not engaged as legislators, senior officials and
managers; professionals; technicians and associate professionals; or clerks.
Table 3.25 Unemployed youth by type of father-figure caregiver (%)
Male caregiver Strict unemployed Relaxed unemployed
No one 26.6 24.7
Father 53.8 56.3
Stepfather 11.7 10.9
Other relative 7.2 7.4
Other non-relative 0.6 0.7
Total 100.0 100.0
Source: STATIN, SWTS Jamaica 2013.

50
Figure 3 37 Unemployed youth by male caregiver’s occupation
Source: STATIN, SWTS Jamaica 2013.
The vast majority of unemployed youth (87.4 per cent) had a mother as their primary
female caregiver (table 3.26). A very small proportion (0.8 per cent) had no one. Over 10
per cent reported that another relative played the role of female caregiver; those
respondents listed grandmothers, aunts, sisters and cousins.
Table 3.26 Unemployed youth by type of mother-figure caregiver (%)
Female caregiver Strict unemployed Relaxed unemployed
No one 0.8 0.8
Mother 87.4 87.9
Stepmother 1.2 1.0
Other relative 10.4 10.1
Other non-relative 0.2 0.2
Total 100.0 100.0
Source: STATIN, SWTS Jamaica 2013.
Of note is the fact that the largest proportion of female caregivers of unemployed
youth were elementary workers (49.7 per cent), the lowest occupational group with
generally very low-paying, low skilled jobs (figure 3.38). A significant proportion of
female caregivers were engaged as service workers, shop and market sales workers (23.2
per cent). As with the male caregivers, very few mothers were employed in the usually
high-paying occupational groups such as legislators, senior officials and managers, or
professionals.
4.8 2.6
3.4 2.8
12.4
23.2 24.1
9.4
17.4
0
5
10
15
20
25
30%

51
Figure 3.38 Unemployed youth by female caregiver’s occupation
Source: STATIN, SWTS Jamaica 2013.
Regarding the perception of their household’s income, 40.2 per cent of unemployed
youth thought it was “around the national average”, while 24.9 per cent felt their
household was “poor” and 22.8 per cent “fairly poor”. Interestingly, a small proportion
(1.4 per cent) thought their household was “well off” and 10.3 per cent felt it was “fairly
well off” (table A.15).
Analysis by socio-economic status shows that 18.7 per cent of youth listed as
unemployed fell into the poorest quintile. It also found that 23.6 per cent of unemployed
youth were in the second, 22.6 per cent were part of the middle, and 22.1 per cent were in
the fourth quintile (table 3.27). The smallest proportion of unemployed youth (13.0 per
cent) were from the wealthiest quintile, thus negating the hypothesis that unemployment is
a “luxury” for those supported by wealthy families while they search for a good job, while
the poor must take up whatever work is available to them.
Table 3.27 Youth by labour market and socio-economic status
Socio-economic status Employed Strict unemployed Relaxed unemployed
Number % Number % Number %
Poorest 52 000 17.2 27 900 18.7 49 100 19.9
Second 54 800 18.1 35 200 23.6 56 200 22.8
Middle 58 000 19.2 33 700 22.6 57 800 23.5
Fourth 67 200 22.2 32 900 22.1 52 100 21.2
Wealthiest 70 300 23.2 19 300 13.0 31 200 12.6
Total 302 300 100.0 149 000 100.0 246 400 100.0
Source: STATIN, SWTS Jamaica 2013.
Despite being out of work, 43.1 per cent of unemployed youth thought that “being
successful in work” was the most important goal in life. “Having a good family life” was
the most important goal for 22.4 per cent. Other goals indicated as most important to
unemployed youth included “having lots of money” (10.4 per cent) and “making a
contribution to society” (10.5 per cent) (table A.15).
5.4 4.0 2.6 4.2
23.2
6.7 3.3
.7
49.7
0
10
20
30
40
50
60
%
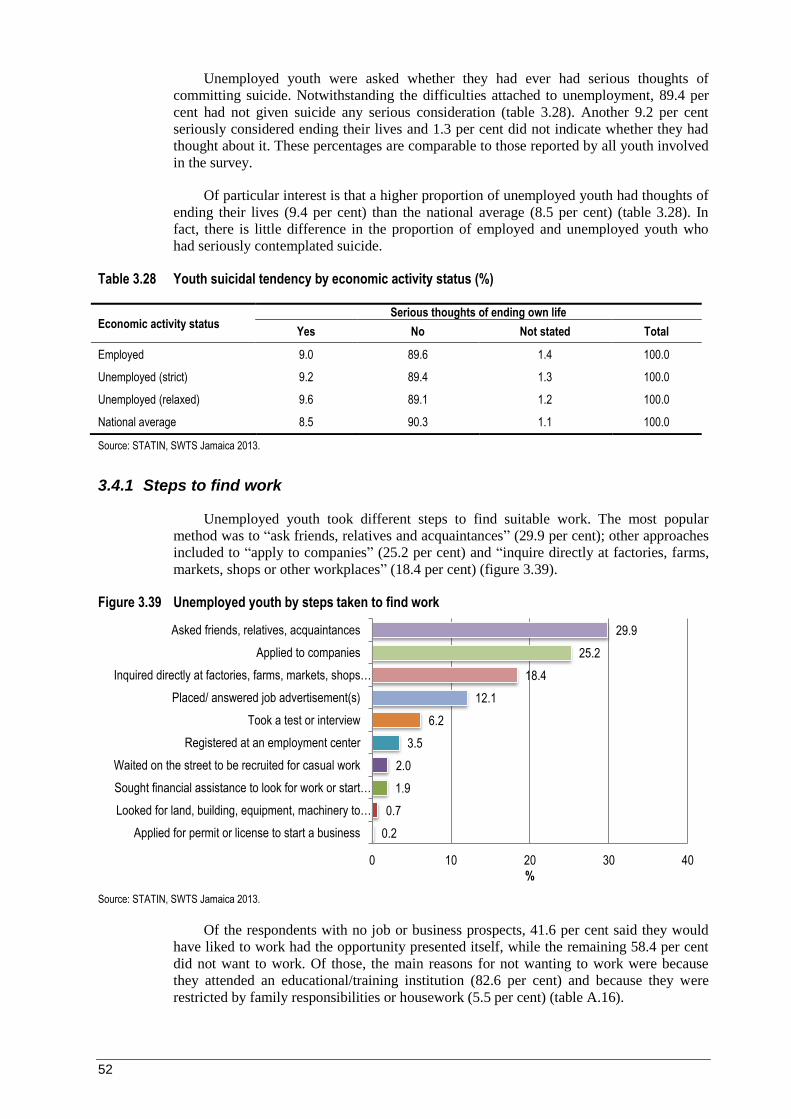
52
Unemployed youth were asked whether they had ever had serious thoughts of
committing suicide. Notwithstanding the difficulties attached to unemployment, 89.4 per
cent had not given suicide any serious consideration (table 3.28). Another 9.2 per cent
seriously considered ending their lives and 1.3 per cent did not indicate whether they had
thought about it. These percentages are comparable to those reported by all youth involved
in the survey.
Of particular interest is that a higher proportion of unemployed youth had thoughts of
ending their lives (9.4 per cent) than the national average (8.5 per cent) (table 3.28). In
fact, there is little difference in the proportion of employed and unemployed youth who
had seriously contemplated suicide.
Table 3.28 Youth suicidal tendency by economic activity status (%)
Economic activity status Serious thoughts of ending own life
Yes No Not stated Total
Employed 9.0 89.6 1.4 100.0
Unemployed (strict) 9.2 89.4 1.3 100.0
Unemployed (relaxed) 9.6 89.1 1.2 100.0
National average 8.5 90.3 1.1 100.0
Source: STATIN, SWTS Jamaica 2013.
3.4.1 Steps to find work
Unemployed youth took different steps to find suitable work. The most popular
method was to “ask friends, relatives and acquaintances” (29.9 per cent); other approaches
included to “apply to companies” (25.2 per cent) and “inquire directly at factories, farms,
markets, shops or other workplaces” (18.4 per cent) (figure 3.39).
Figure 3.39 Unemployed youth by steps taken to find work
Source: STATIN, SWTS Jamaica 2013.
Of the respondents with no job or business prospects, 41.6 per cent said they would
have liked to work had the opportunity presented itself, while the remaining 58.4 per cent
did not want to work. Of those, the main reasons for not wanting to work were because
they attended an educational/training institution (82.6 per cent) and because they were
restricted by family responsibilities or housework (5.5 per cent) (table A.16).
0.2
0.7
1.9
2.0
3.5
6.2
12.1
18.4
25.2
29.9
Applied for permit or license to start a business
Looked for land, building, equipment, machinery to…
Sought financial assistance to look for work or start…
Waited on the street to be recruited for casual work
Registered at an employment center
Took a test or interview
Placed/ answered job advertisement(s)
Inquired directly at factories, farms, markets, shops…
Applied to companies
Asked friends, relatives, acquaintances
0 10 20 30 40
%
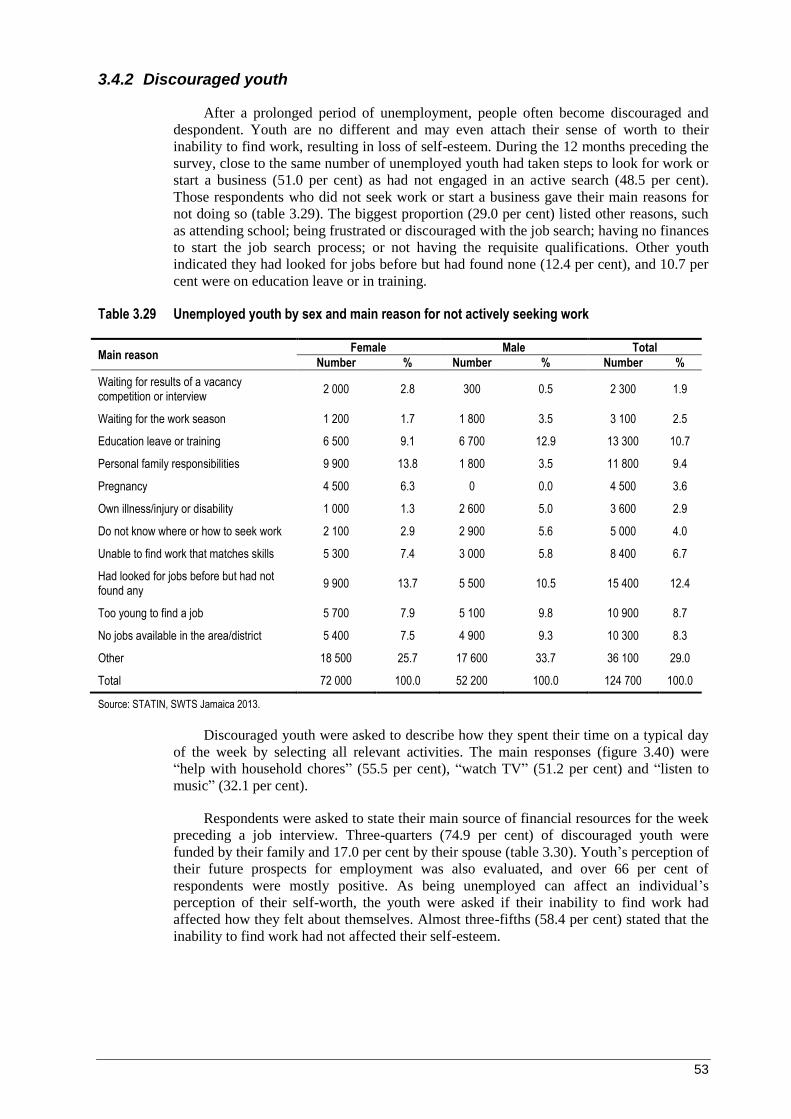
53
3.4.2 Discouraged youth
After a prolonged period of unemployment, people often become discouraged and
despondent. Youth are no different and may even attach their sense of worth to their
inability to find work, resulting in loss of self-esteem. During the 12 months preceding the
survey, close to the same number of unemployed youth had taken steps to look for work or
start a business (51.0 per cent) as had not engaged in an active search (48.5 per cent).
Those respondents who did not seek work or start a business gave their main reasons for
not doing so (table 3.29). The biggest proportion (29.0 per cent) listed other reasons, such
as attending school; being frustrated or discouraged with the job search; having no finances
to start the job search process; or not having the requisite qualifications. Other youth
indicated they had looked for jobs before but had found none (12.4 per cent), and 10.7 per
cent were on education leave or in training.
Table 3.29 Unemployed youth by sex and main reason for not actively seeking work
Main reason Female Male Total
Number % Number % Number %
Waiting for results of a vacancy competition or interview
2 000 2.8 300 0.5 2 300 1.9
Waiting for the work season 1 200 1.7 1 800 3.5 3 100 2.5
Education leave or training 6 500 9.1 6 700 12.9 13 300 10.7
Personal family responsibilities 9 900 13.8 1 800 3.5 11 800 9.4
Pregnancy 4 500 6.3 0 0.0 4 500 3.6
Own illness/injury or disability 1 000 1.3 2 600 5.0 3 600 2.9
Do not know where or how to seek work 2 100 2.9 2 900 5.6 5 000 4.0
Unable to find work that matches skills 5 300 7.4 3 000 5.8 8 400 6.7
Had looked for jobs before but had not found any
9 900 13.7 5 500 10.5 15 400 12.4
Too young to find a job 5 700 7.9 5 100 9.8 10 900 8.7
No jobs available in the area/district 5 400 7.5 4 900 9.3 10 300 8.3
Other 18 500 25.7 17 600 33.7 36 100 29.0
Total 72 000 100.0 52 200 100.0 124 700 100.0
Source: STATIN, SWTS Jamaica 2013.
Discouraged youth were asked to describe how they spent their time on a typical day
of the week by selecting all relevant activities. The main responses (figure 3.40) were
“help with household chores” (55.5 per cent), “watch TV” (51.2 per cent) and “listen to
music” (32.1 per cent).
Respondents were asked to state their main source of financial resources for the week
preceding a job interview. Three-quarters (74.9 per cent) of discouraged youth were
funded by their family and 17.0 per cent by their spouse (table 3.30). Youth’s perception of
their future prospects for employment was also evaluated, and over 66 per cent of
respondents were mostly positive. As being unemployed can affect an individual’s
perception of their self-worth, the youth were asked if their inability to find work had
affected how they felt about themselves. Almost three-fifths (58.4 per cent) stated that the
inability to find work had not affected their self-esteem.

54
Figure 3.40 Discouraged unemployed youth by how they spent their time
Source: STATIN, SWTS Jamaica 2013.
Table 3.30 Discouraged unemployed youth by financial resources, outlook and perceived role of the government (%)
Characteristic Female Male Total
Main source of financial resources in week prior to job interview
My own family 66.0 87.0 74.9
My spouse 26.5 4.1 17.0
Own savings 1.0 5.9 3.1
Remittances 0.0 1.7 0.7
Other 6.5 1.3 4.3
Total 100.0 100.0 100.0
How do you feel about future prospects for employment in general terms?
Mostly positive 63.1 71.9 66.8
Mostly negative 36.9 28.1 33.2
Total 100.0 100.0 100.0
Has the inability to find work affected how you feel about yourself?
Yes 46.7 34.8 41.6
No 53.3 65.2 58.4
Total 100.0 100.0 100.0
Do you think the government can do more to help your chances of finding future employment?
Yes 88.9 91.9 90.2
No 11.1 8.1 9.8
Total 100.0 100.0 100.0
Source: STATIN, SWTS Jamaica 2013.
The vast majority (90.2 per cent) of the unemployed youth surveyed thought that the
Government of Jamaica could do more to help increase their chances of finding
employment in the future. Respondents gave several actions that the government could
take, including creating more job opportunities by building more factories and hotels,
investing more in the country, creating more affordable training programmes and
providing more accessible business loans to the poor.
2.5
3.1
13.1
18.8
19.3
23.4
25.5
32.1
51.2
55.5
0 10 20 30 40 50 60
Go to the cinema, theatre or concerts/ street…
Go shopping
Play on computer (computer games, surfing…
Other
Read
Meet friends, go dancing, go out to drink, to…
Go for a walk, a bike ride, sport
Listen to music
Watch TV
Help with household chores
%

55
3.4.3 Details of the job search
Long periods without work can have serious negative consequences, including
financial losses, discouragement, loss of self-esteem and frustration. Unemployed youth
were asked to state the length of time they were without work and actively looking for a
job. Over one-third (38.2 per cent) had been unemployed and seeking work for over 2
years. Another 22.8 per cent had been without work and actively seeking it for more than 1
year but less than 2 years, while 18.5 per cent were unemployed and had been seeking
work for between 6 months and less the 1 year. It should be noted that nearly 80 per cent
of all unemployed youth had been unemployed for more than 6 months (figure 3.41).
Figure 3.41 Unemployed youth by duration of unemployment and active job search
Source: STATIN, SWTS Jamaica 2013.
Table 3.31 Unemployed youth by occupation sought, preferred employer and sex
Occupation & employer Female Male Total
Number % Number % Number %
Desired occupation
Legislator, senior official & manager 1 100 0.8 1 600 1.5 2 700 1.1
Professional 7 700 5.5 7 000 6.6 14 700 6.0
Technician & associate professional 7 100 5.1 4 800 4.5 11 900 4.8
Clerk 40 300 28.9 6 900 6.5 47 200 19.2
Service worker, shop & market sales worker 56 400 40.4 24 400 22.9 80 800 32.8
Skilled agricultural & fishery worker 200 0.1 1 600 1.5 1 800 0.7
Craft & related trade worker 1 400 1.0 28 800 27.0 30 200 12.3
Plant & machine operator & assembler 0 0.0 1 400 1.3 1 400 0.6
Elementary occupations 25 400 18.2 30 200 28.2 55 500 22.5
Total 139 600 100.0 106 700 100.0 246 300 100.0
Preferred employer
Myself 19 900 14.2 17 700 16.6 37 600 15.3
Government/public sector 57 400 41.1 36 200 33.9 93 600 38.0
Private company 49 200 35.3 46 300 43.4 95 500 38.8
International or non-profit organization 5 200 3.8 2 200 2.1 7 500 3.0
Family business/farm 1 200 0.9 600 0.6 1 800 0.7
Other 6 600 4.8 3 700 3.5 10 300 4.2
Total 139 600 100.0 106 700 100.0 246 300 100.0
Source: STATIN, SWTS Jamaica 2013.
0 10 20 30 40 50
Less Than A Week
1 Week To Less Than 1 Month
1 Month To Less Than 3 Months
3 Months To Less Than 6 Months
6 Months To Less Than 1 Year
1 Year To Less Than 2 Years
2 Years Of More
%
Unemployed
Relaxed Unemployed

56
When asked whom they would like to work for, 38.8 per cent of unemployed youth
wished to work for a private company, while 38.0 per cent hoped to work for the
government or public sector (table 3.31). Another 15.3 per cent preferred to work for
themselves, owning their own business or farm.
Very few unemployed youth (9.2 per cent; 6.3 per cent using the relaxed definition)
had ever refused a job (table 3.32). The most popular reason for refusing a job was that the
“wages offered were too low” (43.8 per cent), followed by an inconvenient location (23.8
per cent). Other reasons were that the position offered was not what was originally applied
for, poor working conditions, and sexual harassment.
Over 76 per cent of both unemployed and relaxed unemployed youth had a minimum
monthly income below which they would not accept a job (table 3.32). This minimum
monthly income was estimated at JMD 25,820 for unemployed youth, and JMD 25,073.
for relaxed unemployed youth.
Table 3.32 Unemployed youth by details of refusing a job
Job refusal Unemployed Relaxed unemployed
Number % Number %
Ever refused a job offer?
Yes 12 800 9.2 6 700 6.3
No 126 800 90.8 100 000 93.7
Total 139 600 100.0 106 800 100.0
Reason for refusing job?
Wages offered were too low 3 200 24.9 3 000 43.8
Work was not interesting 1 500 11.6 100 2.2
Location was not convenient 1 500 11.5 1 600 23.8
Work would not match my qualifications
200 1.6 400 5.7
Work would require too many hours 600 4.6 0 0.0
Family did not approve of the job offered
900 7.4 500 6.9
Waiting for a better job offer 400 3.0 0 0.0
Saw no possibilities for advancement
0 0.0 300 4.1
Other 4 500 35.4 900 13.4
Total 12 800 100.0 6 700 100.0
Do you have a minimum monthly income below which you would not accept a job?
Yes 115 900 77.6 187 800 76.2
No 33 500 22.4 58 500 23.8
Total 149 400 100.0 246 300 100.0
Source: STATIN, SWTS Jamaica 2013.
The social services operated by many governments around the world provide
financial assistance to their unemployed citizens. Unemployment benefits for young people
in Jamaica are rare. According to the SWTS, 94 per cent of unemployed youth received no
financial assistance from the government. With the relaxed definition of unemployment,
92.6 per cent of these youth had not received any government assistance. Among those
who did receive government assistance, PATH was the most popular form; others received
a stipend from the National Youth Service or other forms of assistance for education or
training.
In the 12 months prior to the survey, unemployed youth applied for an average of
eight jobs, and those not actively seeking work (relaxed definition of unemployment)

57
applied for an average of five. Despite applying for several jobs, the vast majority of
unemployed youth had no interviews. Just under two-thirds (64.5 per cent) of the
unemployed did not have a single interview (figure 3.42), 17.1 per cent secured one and
8.5 per cent had two interviews in the prior 12 months. When using the relaxed definition
of unemployment, 74.0 per cent of these unemployed youth had no interviews, 12.9 per
cent had one and 6.3 per cent had two interviews.
Figure 3.42 Unemployed youth by number of interviews in the last 12 months
Source: STATIN, SWTS Jamaica 2013.
It is purported that one of the key factors influencing rural-to-urban migration is the
lack of employment opportunities in rural areas. Consequently, the survey sought to find
out whether unemployed youth would consider moving to another location to find work.
Over 33 per cent reported they would consider “moving to Kingston/St Andrew”, while
fewer than 30 per cent stated they would not consider moving for work purposes (table
3.33). Moving to “a town/city (other than the capital)” was an option for 22.1 per cent of
respondents, who listed among the possible towns or cities Montego Bay, Mandeville,
Spanish Town, May Pen, Savanna-la-mar, Morant Bay, Negril, Ocho Rios, Portmore, Port
Maria and Yallahs. Those indicating they would consider moving to “a rural area” to find
work (11.6 per cent) cited Old Harbour, Linstead and Bog Walk in St Catherine, Martha
Brae in Trelawny, Lincoln in Manchester, and Brown’s Town and Runaway Bay in St Ann
as possible options. Unemployed youth also considered moving to “another country” to
find work (32.2 per cent) and listed their countries of choice, which included the United
States, Canada, England, the Cayman Islands and the Bahamas.
As to the education level of those who would consider moving to another country
(figure 3.43), the highest percentage had secondary schooling (44.5 per cent), 22.8 per cent
had post-secondary vocational schooling and 14.9 per cent had university/tertiary-level
education. These levels combined account for more than 80 per cent of unemployed youth
who considered migration.
0
10
20
30
40
50
60
70
80
0 1 2 3 4 5 6 8 10 15
%
No. of interviews
Unemployed Relaxed Unemployed
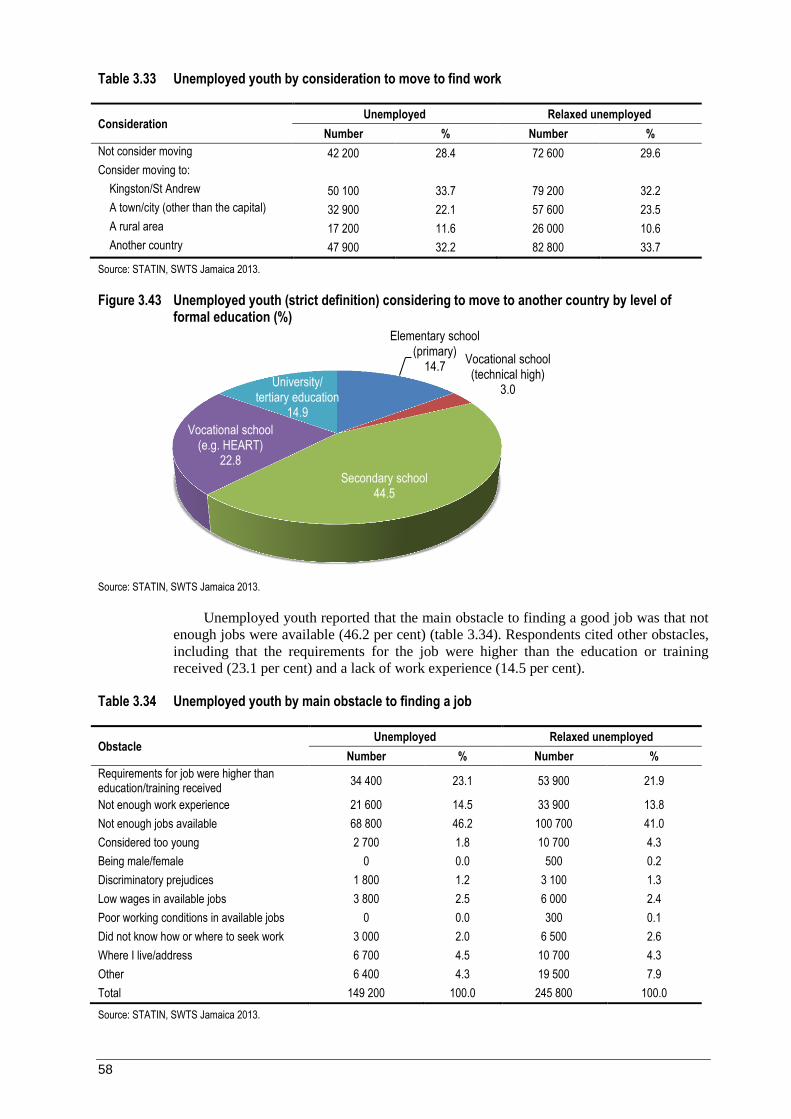
58
Table 3.33 Unemployed youth by consideration to move to find work
Consideration Unemployed Relaxed unemployed
Number % Number %
Not consider moving 42 200 28.4 72 600 29.6
Consider moving to:
Kingston/St Andrew 50 100 33.7 79 200 32.2
A town/city (other than the capital) 32 900 22.1 57 600 23.5
A rural area 17 200 11.6 26 000 10.6
Another country 47 900 32.2 82 800 33.7
Source: STATIN, SWTS Jamaica 2013.
Figure 3.43 Unemployed youth (strict definition) considering to move to another country by level of formal education (%)
Source: STATIN, SWTS Jamaica 2013.
Unemployed youth reported that the main obstacle to finding a good job was that not
enough jobs were available (46.2 per cent) (table 3.34). Respondents cited other obstacles,
including that the requirements for the job were higher than the education or training
received (23.1 per cent) and a lack of work experience (14.5 per cent).
Table 3.34 Unemployed youth by main obstacle to finding a job
Obstacle Unemployed Relaxed unemployed
Number % Number %
Requirements for job were higher than education/training received
34 400 23.1 53 900 21.9
Not enough work experience 21 600 14.5 33 900 13.8
Not enough jobs available 68 800 46.2 100 700 41.0
Considered too young 2 700 1.8 10 700 4.3
Being male/female 0 0.0 500 0.2
Discriminatory prejudices 1 800 1.2 3 100 1.3
Low wages in available jobs 3 800 2.5 6 000 2.4
Poor working conditions in available jobs 0 0.0 300 0.1
Did not know how or where to seek work 3 000 2.0 6 500 2.6
Where I live/address 6 700 4.5 10 700 4.3
Other 6 400 4.3 19 500 7.9
Total 149 200 100.0 245 800 100.0
Source: STATIN, SWTS Jamaica 2013.
Elementary school (primary)
14.7 Vocational school (technical high)
3.0
Secondary school 44.5
Vocational school (e.g. HEART)
22.8
University/ tertiary education
14.9
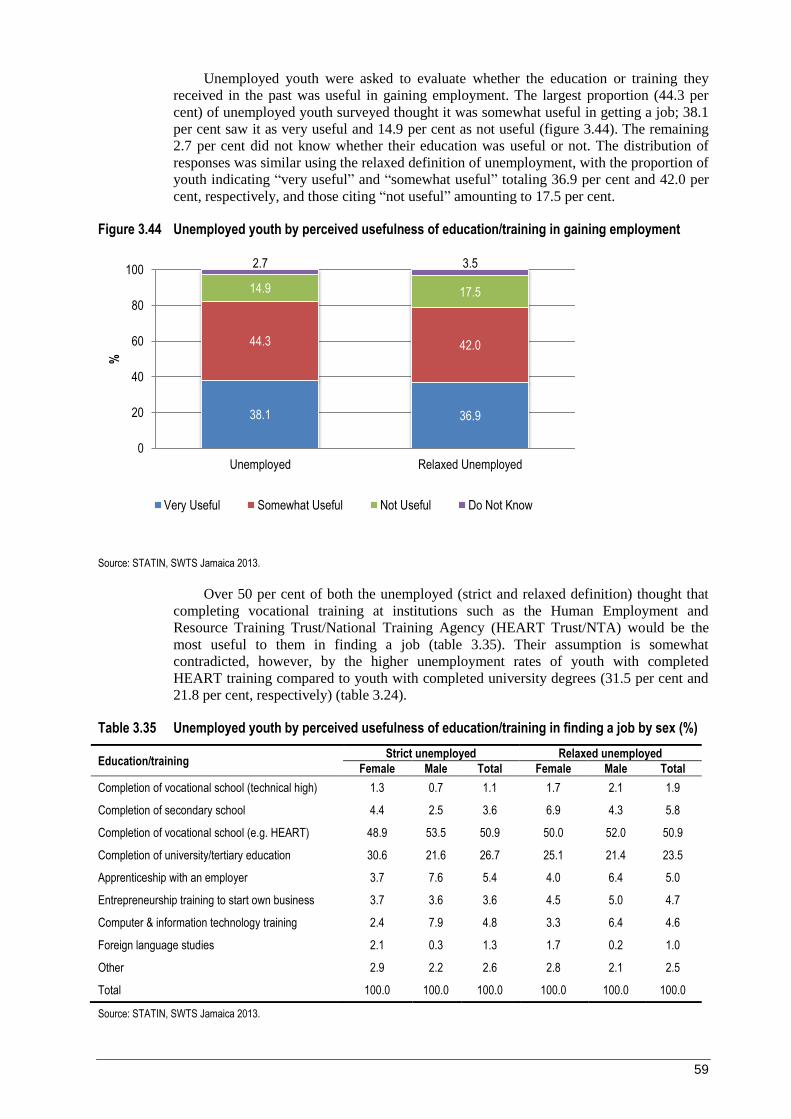
59
Unemployed youth were asked to evaluate whether the education or training they
received in the past was useful in gaining employment. The largest proportion (44.3 per
cent) of unemployed youth surveyed thought it was somewhat useful in getting a job; 38.1
per cent saw it as very useful and 14.9 per cent as not useful (figure 3.44). The remaining
2.7 per cent did not know whether their education was useful or not. The distribution of
responses was similar using the relaxed definition of unemployment, with the proportion of
youth indicating “very useful” and “somewhat useful” totaling 36.9 per cent and 42.0 per
cent, respectively, and those citing “not useful” amounting to 17.5 per cent.
Figure 3.44 Unemployed youth by perceived usefulness of education/training in gaining employment
Source: STATIN, SWTS Jamaica 2013.
Over 50 per cent of both the unemployed (strict and relaxed definition) thought that
completing vocational training at institutions such as the Human Employment and
Resource Training Trust/National Training Agency (HEART Trust/NTA) would be the
most useful to them in finding a job (table 3.35). Their assumption is somewhat
contradicted, however, by the higher unemployment rates of youth with completed
HEART training compared to youth with completed university degrees (31.5 per cent and
21.8 per cent, respectively) (table 3.24).
Table 3.35 Unemployed youth by perceived usefulness of education/training in finding a job by sex (%)
Education/training Strict unemployed Relaxed unemployed
Female Male Total Female Male Total
Completion of vocational school (technical high) 1.3 0.7 1.1 1.7 2.1 1.9
Completion of secondary school 4.4 2.5 3.6 6.9 4.3 5.8
Completion of vocational school (e.g. HEART) 48.9 53.5 50.9 50.0 52.0 50.9
Completion of university/tertiary education 30.6 21.6 26.7 25.1 21.4 23.5
Apprenticeship with an employer 3.7 7.6 5.4 4.0 6.4 5.0
Entrepreneurship training to start own business 3.7 3.6 3.6 4.5 5.0 4.7
Computer & information technology training 2.4 7.9 4.8 3.3 6.4 4.6
Foreign language studies 2.1 0.3 1.3 1.7 0.2 1.0
Other 2.9 2.2 2.6 2.8 2.1 2.5
Total 100.0 100.0 100.0 100.0 100.0 100.0
Source: STATIN, SWTS Jamaica 2013.
38.1 36.9
44.3 42.0
14.9 17.5
2.7 3.5
0
20
40
60
80
100
Unemployed Relaxed Unemployed
%
Very Useful Somewhat Useful Not Useful Do Not Know

60
Still, a significant share of unemployed youth also stated that completion of
university-level education would be most useful in finding a job. The completion of
secondary education, an apprenticeship with an employer, and computer and information
technology training were also considered to help with finding a job (although to a lesser
extent). The proportion of unemployed youth (strict definition) who planned to continue
their education/training in the future was not significantly different from that of
unemployed youth by relaxed definition (88.0 per cent and 89.4 per cent, respectively).
Over one-half (50.3 per cent) of unemployed youth (strict definition) hoped to complete
university or tertiary education, 30.2 per cent vocational education and 17.9 per cent
postgraduate studies. The percentages were similar for unemployed youth using the
relaxed definition.
3.5 Youth not in the labour force (inactive youth)
People outside the labour force are those who are unwilling or unable to work. They
are usually referred to as “inactive”. Of youth outside the Jamaican labour force and not in
school/training, more were females (63.4 per cent) than males (36.6 per cent) (table 3.36).
However, the 207,800 or 67.6 per cent of youth outside the labour force and enrolled in an
educational institution were split basically equally between females (50.1 per cent) and
males (49.9 per cent).
Table 3.36 Youth not in the labour force by enrolment in school/training and sex
Sex
Neither in labour force nor in school/training
Not in labour force but in school/training
Total Not in labour force
Number % Number % Number
Female 63 200 63.4 104 200 50.1 167 400
Male 36 500 36.6 103 600 49.9 140 100
Total 99 700 100.0 207 800 100.0 307 500
Source: STATIN, SWTS Jamaica 2013.
As anticipated, youth aged 15–19 were more likely to be outside the labour force and
enrolled in an educational institution they accounted for .5 per cent of all youth inactive
due to educational pursuits (figure 3.45). Respondents aged 20–24 had the highest
proportion (36.5 per cent) of those inactive and not enrolled in an educational institution
than the other age groups.
Figure 3.45 Youth outside the labour force by age and enrolment in school/training
28.7
36.5
34.8
83.5
13.4
3.1
0 20 40 60 80 100
15-19
20-24
25-29
%
Ag
e
Not in Labour Force & in School Not in Labour Force & Not in School
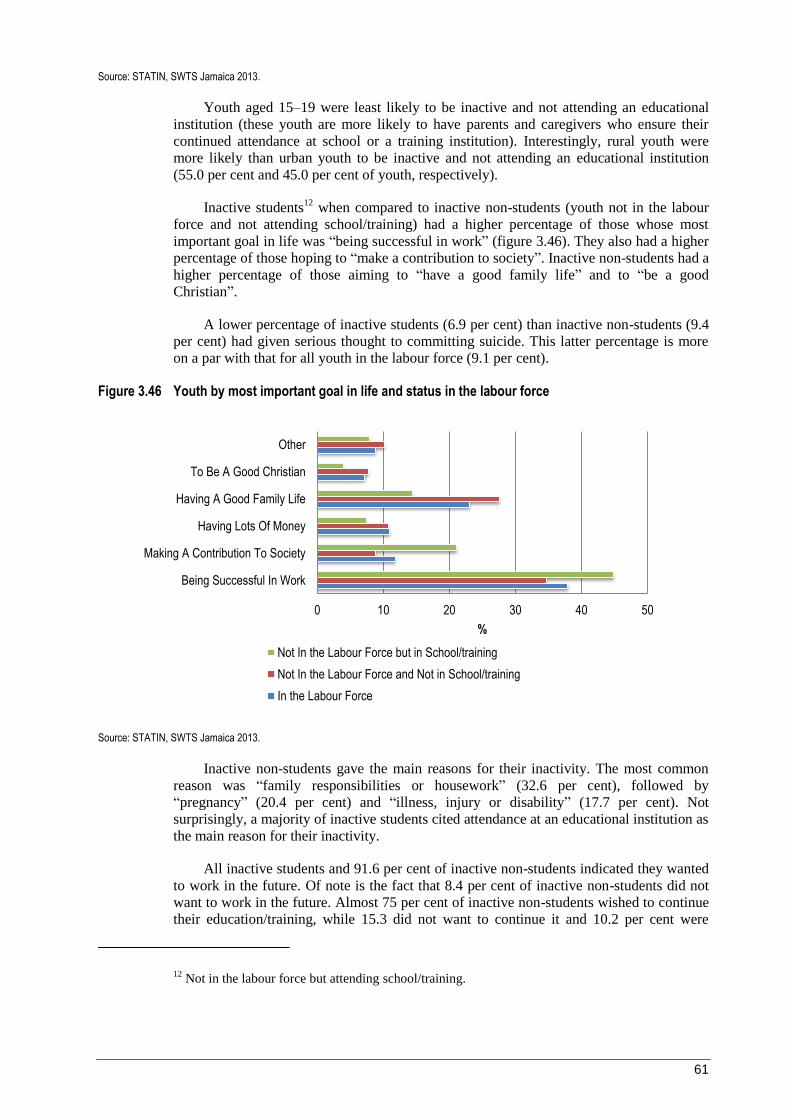
61
Source: STATIN, SWTS Jamaica 2013.
Youth aged 15–19 were least likely to be inactive and not attending an educational
institution (these youth are more likely to have parents and caregivers who ensure their
continued attendance at school or a training institution). Interestingly, rural youth were
more likely than urban youth to be inactive and not attending an educational institution
(55.0 per cent and 45.0 per cent of youth, respectively).
Inactive students12
when compared to inactive non-students (youth not in the labour
force and not attending school/training) had a higher percentage of those whose most
important goal in life was “being successful in work” (figure 3.46). They also had a higher
percentage of those hoping to “make a contribution to society”. Inactive non-students had a
higher percentage of those aiming to “have a good family life” and to “be a good
Christian”.
A lower percentage of inactive students (6.9 per cent) than inactive non-students (9.4
per cent) had given serious thought to committing suicide. This latter percentage is more
on a par with that for all youth in the labour force (9.1 per cent).
Figure 3.46 Youth by most important goal in life and status in the labour force
Source: STATIN, SWTS Jamaica 2013.
Inactive non-students gave the main reasons for their inactivity. The most common
reason was “family responsibilities or housework” (32.6 per cent), followed by
“pregnancy” (20.4 per cent) and “illness, injury or disability” (17.7 per cent). Not
surprisingly, a majority of inactive students cited attendance at an educational institution as
the main reason for their inactivity.
All inactive students and 91.6 per cent of inactive non-students indicated they wanted
to work in the future. Of note is the fact that 8.4 per cent of inactive non-students did not
want to work in the future. Almost 75 per cent of inactive non-students wished to continue
their education/training, while 15.3 did not want to continue it and 10.2 per cent were
12 Not in the labour force but attending school/training.
0 10 20 30 40 50
Being Successful In Work
Making A Contribution To Society
Having Lots Of Money
Having A Good Family Life
To Be A Good Christian
Other
%
Not In the Labour Force but in School/training
Not In the Labour Force and Not in School/training
In the Labour Force

62
unsure. University/tertiary education (47.5 per cent) and vocational education (43.3 per
cent) were the highest levels that inactive non-students hoped to attain in the future.
4. The stages of transition
A successful transition from school to work is paramount to an individual’s success
during adult life. Towards the end of their school life, and during the transition to work,
youth acquire and consolidate the competencies, attitudes, values and social capital
necessary to make a successful transition. This period is particularly important for setting
the stage of continued development, as individuals begin to make choices and engage in a
variety of activities that impact the rest of their lives. This section critically assesses the
stages of transition among Jamaicans aged 15–29.
To adequately assess the stages, it is important to have a clear understanding of what
transition exactly means and how it is measured. Different studies measure transition
differently. For some, the transition from school to work is the length of time between
exiting education and making the first entry into regular employment. Others, however,
apply qualitative measures which not only consider that the individual is employed, but
also assess the conditions of employment.
4.1 Defining school-to-work transition
The ILO’s framework for measuring the school-to-work transition is guided by its
Decent Work Agenda.13
The framework allows a person to be considered as having
transited even if they do not meet the specified criteria, as long as they are satisfied with
the conditions of their employment. Having satisfactory employment is a subjective
concept, based on a jobholder’s self-assessment. Individuals are considered to have
satisfactory employment if they explicitly state satisfaction with their job. This implies that
respondents consider their current jobs as a “fit” for their desired employment paths at that
moment in time.
The ILO’s framework speaks to the attainment of a regular/stable or satisfactory
job. It uses permanency as a proxy measure of decency, and is built on the premise that a
person has not “transited” until settled in a job that can provide a sense of security.
4.1.1 Concepts
According to the ILO, “the school-to-work transition is defined as the passage of a
young person (aged 15–29) from the end of schooling to the first regular or satisfactory
job” (ILO, 2009). According to the literature on labour market transition, young people
may be classified as being at one of three transition stages: transited, in transition or
transition not yet started.
Young people are considered to have successfully transited if they have attained a
stable or satisfactory job. They are considered to have a stable job if their employment
contract is of unlimited duration, or if they are contracted for a period exceeding 12
months. Introducing the issue of a contract automatically excludes the employment status
13 The ILO’s Decent Work Agenda aims to promote opportunities for women and men to obtain
productive work, in conditions of freedom, equity, security and human dignity. See
http://www.ilo.org/global/about-the-ilo/decent-work-agenda/lang--en/index.htm.
63
of self-employed, where the employment relationship is not defined by a contract. The
opposite of stable employment is temporary employment, or wage and salaried
employment of limited duration. A job is considered to be satisfactory if the individual is
either very satisfied or somewhat satisfied with their employment arrangement.
Young people are considered to have completed the transition (“transited”) if they
are currently employed in a stable job (whether satisfactory or not satisfactory); in a
satisfactory but temporary job; or in satisfactory self-employment.
Young people are considered to be in transition if they are unemployed; employed in
a temporary and non-satisfactory job; self-employed and not satisfied with the work; or
currently inactive and not in school, with future job aspirations.
Additionally, some young people are considered as not yet having started their
transition if they are still in school or if they are currently inactive, with no intention of
seeking work in the future.
4.2 Stages of transition
The data reveal that 35.5 per cent of young Jamaicans aged 15–29 successfully made
the transition from school to work (figure 4.1). This represents approximately 269,000
young people who attained a stable or satisfactory job.
The survey estimates that 41.3 per cent or 313,300 were still in transition, having
failed to obtain a stable or satisfactory job. They were either currently unemployed,
temporarily employed in non-satisfactory jobs, or inactive non-students hoping to gain
future employment. The remaining 23.2 per cent had not yet started the transition because
they were either students (currently engaged in school or training), or inactive students
with no plans to work in the future.
Figure 4.1 Youth by stage of school-to-work transition (%)
Source: STATIN, SWTS Jamaica 2013.
Figure 4.2 shows that a higher proportion of males (41.6 per cent) than females (29.3
per cent) had successfully transited, a finding consistent with the higher proportion of
males in this age group who were heads of households and likely to be the primary
breadwinners. The survey estimates that approximately 158,100 males had transited,
compared to 110,900 females.
Transited 35.5
In transition 41.3
Transition not started
23.2

64
Figure 4.2 Youth by stage of transition and sex
Source: STATIN, SWTS Jamaica 2013.
However, proportionally more young females (47.1 per cent) were still in transition
than their male counterparts (35.5 per cent). While more females aged 15–19 were
unemployed and engaged in temporary non-satisfactory jobs, similar proportions of this
age group’s females and males (23.5 per cent and 22.9 per cent, respectively) had not yet
started the transition, as they were more likely to be in school or training.
According to the data, the likelihood of transiting increases with age. A majority of
youth aged 25–29 (55.4 per cent) had transited as opposed to 12.6 per cent of those aged
15–19 (figure 4.3). Conversely, only 2.9 per cent of 25–29 year-olds had not started the
transition compared to 53.2 per cent of those aged 15–19, reinforcing that more of the
latter age group are still in school and have not yet started the quest for decent
employment.
Figure 4.3 Youth by stage of transition and age group
Source: STATIN, SWTS Jamaica 2013.
Geographically, more urban than rural youth (38.6 per cent and 31.9 per cent,
respectively) were able to make the transition (table 4.1), while a greater proportion of
rural were either still in transition (42.5 per cent) or had not started it (25.6 per cent) when
29.3 41.6
47.1 35.5
23.5 22.9
0%
20%
40%
60%
80%
100%
Female Male
Transited In Transition Not Started Transition
12.6
42.8 55.4 34.2
48.9
41.6 53.2
8.3 2.9
0%
20%
40%
60%
80%
100%
15-19 20-24 25-29
Transited In Transition Not Started Transition
65
compared to their urban counterparts. In absolute terms, however, more urban youth were
estimated to be in transition, while more rural youth had not started it.
Table 4.1 Youth by stage of transition and area of residence (%)
Stage of transition Urban Rural Total
Number % Number % Number %
Transited 156 800 38.6 112 100 31.9 269 000 35.5
In transition 161 200 39.7 149 600 42.5 310 800 41.3
Transition not started 88 200 21.7 90 100 25.6 178 300 23.2
Total 406 200 100.0 351 800 100.0 757 100 100.0
Source: STATIN, SWTS Jamaica 2013.
According to the Organisation for Economic Co-operation and Development
(OECD), education has a substantial impact on employment prospects. “In general, people
with higher levels of education have better job prospects”, and in OECD countries, “the
difference is particularly marked between those who have attained upper secondary
education and those who have not” (OECD, 2012).
In Jamaica, education impacts on the ability of young people to complete the
transition. The survey revealed that a larger proportion of those with higher levels of
education transited than those with lower levels. Among those who started the transition,
the proportion that transited successfully increased from 40.1 per cent with primary-level
to 64.5 per cent with university/tertiary-level education (figure 4.4).
Figure 4.4 Youth who have started the transition by level of formal education
Source: STATIN, SWTS Jamaica 2013.
On the other hand, lower levels of education were associated with higher proportions
of youth still in transition. Among those who completed primary-level education, 59.9 per
cent were still in transition, compared to only 35.5 per cent of those with university-level
education (although it is important to bear in mind that another 25.2 per cent – those in
postgraduate studies – had also not yet started their transition).
Interestingly, a higher proportion of those with post-secondary vocational schooling
(49.1 per cent) had transitioned from school to work than those with only secondary
education (43.2 per cent). However, those whose highest education was secondary-level
34.1
40.1
39.3
43.2
49.1
64.5
74.8
65.9
59.9
60.7
56.8
50.9
35.5
25.2
0 20 40 60 80 100
None
Elementary School (Primary)
Vocational School (Technical High)
Secondary School
Vocational School (e.g. HEART etc)
University/ Tertiary
Post-graduate studies
%
Transited
In Transition

66
vocational school (39.3 per cent) were more likely to still be in transition than those whose
highest level of education was secondary school.
Figure 4.5 reveals an association between household wealth and stage of transition.
Wealthier quintiles had a higher proportion of transited youth than poorer quintiles, while
poorer quintiles had a higher proportion of youth still in transition than wealthier ones.
Figure 4.5 Youth by stage of transition and wealth quintile
Source: STATIN, SWTS Jamaica 2013.
A higher proportion of youth who had not started the transition were in the poorer
quintiles (that proportion decreases as wealth increases in the middle and fourth quintiles).
However, the wealthiest quintile had a large proportion of youth who had not started the
transition (32.2 per cent), which may be attributed to enrolment at the university/tertiary-
education level.
The data also show that among the youth who had started the transition, the
proportion of transited youth increased with wealth. Whereas 41.4 per cent of youth in the
poorest quintile had transited, this percentage increased to 63.7 per cent in the wealthiest
quintile (table 4.2). Conversely, a higher proportion of youth in the poorest quintile (58.6
per cent) was still in transition when compared to the wealthiest quintile (36.3 per cent).
Table 4.2 Youth by rate of transition and wealth index quintile (%)
Transition Poorest Second Middle Fourth Wealthiest
Transited 41.4 38.4 41.0 49.1 63.7
In transition 58.6 61.6 59.0 50.9 36.3
Total 100.0 100.0 100.0 100.0 100.0
Source: STATIN, SWTS Jamaica 2013.
4.3 History of economic activity
As stated by the ILO, a young person’s school-to-work transition is the passage from
the end of schooling to “decent” and “stable” employment. Therefore, one of the survey’s
objectives was to capture the economic activities engaged in by young men and women
after completing school.
32.2 29.7 32.2 39.7 43.1
46.0 47.6 47.1 41.6
24.7
21.8 22.6 20.7 18.7 32.2
0%
10%
20%
30%
40%
50%
60%
70%
80%
90%
100%
Poorest Second Middle Fourth Wealthiest
Transited In Transition Not Started Transition
67
This section examines the history of economic activity of out-of-school youth.14
It
provides detailed information on the activities youth were engaged in immediately after
completing or stopping school/training until their activity at the time of the survey. The
activities were classified as “working for wage/salary”, “self-employed”, “worked as
unpaid family worker”, “engaged in an apprenticeship”, “available and actively looking for
work”, “engaged in training”, “engaged in home duties”, and “did not work or seek work
for other reasons than home duties”. For this report, an in-depth analysis was done only for
the first activity out-of-school youth engaged in after leaving school. Additionally, given
the small proportion of youth who did not complete any formal education (0.7 per cent),
this group’s history of economic activity was not assessed in this report.
History of economic activity of out-of-school youth who completed at least primary-
level education
The data show that within the first 3 months after completing school or a training
programme, the greatest proportion of youth (36.7 per cent) were “available and actively
looking for work” (i.e. unemployed) (figure 4.6). Nearly 30 per cent were “working for
wage/salary”, 10.3 per cent were “not working or seeking work” and 8.2 per cent were
“engaged in home duties”. Disaggregated by sex, a slightly higher percentage of females
(38.4 per cent) than males (35.1 per cent) were “available and actively looking for work”;
however, more males (35.9 per cent) than females (23.2 per cent) were “working for
wage/salary”.
Figure 4.6 Youth by sex and first labour market activity after completing school/training
Source: STATIN, SWTS Jamaica 2013.
14 Youth who completed their education/training, youth who left before completion and youth who
never started education/training or did not complete primary education.
0 10 20 30 40 50
Work As Unpaid Family Worker
Engaged In Apprenticeship
Self Employed
Engaged In Training
Engaged In Home Duties
Did Not Work Or Seek Work
Work For Wage
Available And Actively Looking For Work
%
Total Male Female
68
Table 4.3 Youth by contractual arrangement in first activity, job satisfaction, reasons for leaving first job and sex
Characteristic Female Male Total
Number % Number % Number %
Were you employed on the basis of…?
A written agreement 14 200 31.4 17 200 27.0 31 400 28.8
An oral agreement 27 600 60.9 41 300 64.7 68 900 63.1
No contract (self-employed) 3 500 7.7 5 300 8.3 8 800 8.1
Total 45 300 100.0 63 800 100.0 109 100 100.0
Was your contract or agreement of unlimited/limited duration?
Unlimited duration 23 100 55.8 37 000 63.3 60 200 60.2
Limited duration 18 300 44.2 21 500 36.7 39 800 39.8
Total 41 400 100.0 58 500 100.0 99 900 100.0
Reason for contract/agreement of limited duration
On-the-job training 4 000 21.8 6 700 31.4 10 700 26.9
Probation period 1 500 8.4 1 100 5.1 2 600 6.7
Seasonal worker 2 600 14.1 4 000 18.8 6 600 16.6
Occasional/daily work 2 300 12.6 2 100 9.8 4 400 11.1
Work as replacement/substitute 5 100 27.9 2 800 13.2 7 900 20.0
Public employment programme 500 3.0 0 0.0 500 1.4
Specific service or task 1 300 7.3 4 000 18.6 5 300 13.4
Other 900 4.8 600 3.0 1 500 3.8
Total 18 300 100.0 21 200 100.0 39 500 100.0
Duration of contract/agreement
Less than 12 months 12 500 68.4 13 700 64.3 26 200 66.2
12 months to 36 months 4 800 26.2 6 500 30.8 11 400 28.7
36 months or more 1 000 5.3 1 000 4.8 2 000 5.1
Total 18 300 100.0 21 200 100.0 39 500 100.0
Extent of satisfaction with first job
Very satisfied 10 800 23.9 18 800 29.5 29 600 27.2
Somewhat satisfied 20 400 45.0 29 900 46.8 50 300 46.1
Somewhat unsatisfied 9 700 21.4 10 000 15.7 19 700 18.0
Very unsatisfied 4 400 9.8 5 100 8.0 9 500 8.7
Total 45 300 100.0 63 800 100.0 109 100 100.0
Reason for leaving first job
For better job 5 400 12.0 12 900 20.5 18 300 17.0
Dismissed/let go 6 400 14.3 5 900 9.4 12 300 11.4
Unhappy with workplace 9 100 20.4 10 600 16.9 19 800 18.4
Temporary job ended 12 800 28.6 17 400 27.6 30 100 28.0
Health reasons 700 1.5 1 400 2.2 2 000 1.9
To have a baby 3 100 6.9 0 0.0 3 100 2.9
To look after family 2 000 4.5 800 1.3 2 800 2.6
Moved from area 0 0.0 900 1.5 900 0.9
To start education/training 500 1.1 2 600 4.1 3 100 2.9
Migrated 300 0.7 0 0.0 300 0.3
Other 4 500 10.0 10 400 16.6 14 900 13.9
Total 44 700 100.0 62 900 100.0 107 600 100.0
Source: STATIN, SWTS Jamaica 2013.
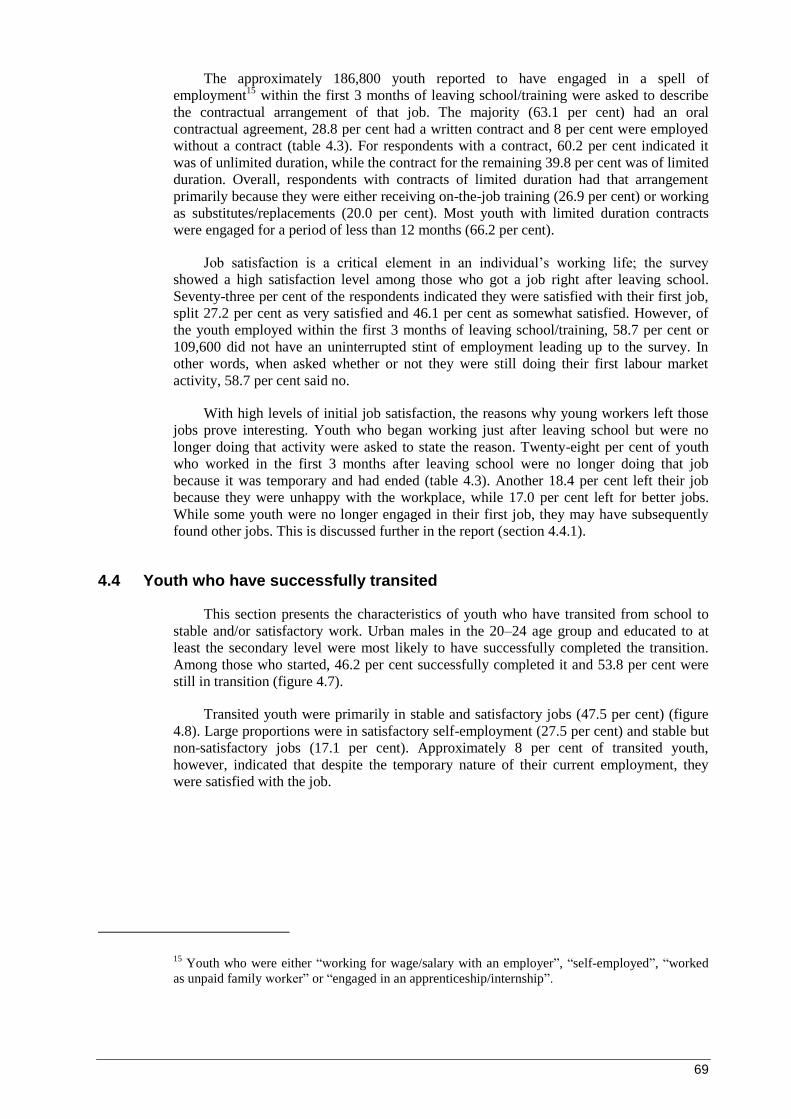
69
The approximately 186,800 youth reported to have engaged in a spell of
employment15
within the first 3 months of leaving school/training were asked to describe
the contractual arrangement of that job. The majority (63.1 per cent) had an oral
contractual agreement, 28.8 per cent had a written contract and 8 per cent were employed
without a contract (table 4.3). For respondents with a contract, 60.2 per cent indicated it
was of unlimited duration, while the contract for the remaining 39.8 per cent was of limited
duration. Overall, respondents with contracts of limited duration had that arrangement
primarily because they were either receiving on-the-job training (26.9 per cent) or working
as substitutes/replacements (20.0 per cent). Most youth with limited duration contracts
were engaged for a period of less than 12 months (66.2 per cent).
Job satisfaction is a critical element in an individual’s working life the survey
showed a high satisfaction level among those who got a job right after leaving school.
Seventy-three per cent of the respondents indicated they were satisfied with their first job,
split 27.2 per cent as very satisfied and 46.1 per cent as somewhat satisfied. However, of
the youth employed within the first 3 months of leaving school/training, 58.7 per cent or
109,600 did not have an uninterrupted stint of employment leading up to the survey. In
other words, when asked whether or not they were still doing their first labour market
activity, 58.7 per cent said no.
With high levels of initial job satisfaction, the reasons why young workers left those
jobs prove interesting. Youth who began working just after leaving school but were no
longer doing that activity were asked to state the reason. Twenty-eight per cent of youth
who worked in the first 3 months after leaving school were no longer doing that job
because it was temporary and had ended (table 4.3). Another 18.4 per cent left their job
because they were unhappy with the workplace, while 17.0 per cent left for better jobs.
While some youth were no longer engaged in their first job, they may have subsequently
found other jobs. This is discussed further in the report (section 4.4.1).
4.4 Youth who have successfully transited
This section presents the characteristics of youth who have transited from school to
stable and/or satisfactory work. Urban males in the 20–24 age group and educated to at
least the secondary level were most likely to have successfully completed the transition.
Among those who started, 46.2 per cent successfully completed it and 53.8 per cent were
still in transition (figure 4.7).
Transited youth were primarily in stable and satisfactory jobs (47.5 per cent) (figure
4.8). Large proportions were in satisfactory self-employment (27.5 per cent) and stable but
non-satisfactory jobs (17.1 per cent). Approximately 8 per cent of transited youth,
however, indicated that despite the temporary nature of their current employment, they
were satisfied with the job.
15 Youth who were either “working for wage/salary with an employer”, “self-employed”, “worked
as unpaid family worker” or “engaged in an apprenticeship/internship”.

70
Figure 4.7 Youth who have started their transition by transition stage (%)
Source: STATIN, SWTS Jamaica 2013.
Figure 4.8 Transited youth by category (%)
Source: STATIN, SWTS Jamaica 2013.
Transited youth in satisfactory self-employment were predominantly male (61.9 per
cent) (figure 4.9). Similarly, those engaged in satisfactory but temporary jobs were also
largely male (70.0 per cent). The other categories of transited youth were more equitably
distributed across both genders. The highest proportion of females was found in stable but
non-satisfactory jobs (47.6 per cent) and stable and satisfactory jobs (42.5 per cent).
The youngest transited youth (aged 15–19) were most likely to be satisfactorily self-
employed (40.7 per cent) and 35.3 per cent of this age group were engaged in a stable and
satisfactory job (table 4.4). Those aged 20–24 were primarily in stable and satisfactory jobs
(48.1 per cent), followed by satisfactory self-employment (26.1 per cent). The oldest group
of transited youth were primarily engaged in stable and satisfactory jobs (50.4 per cent)
and satisfactory self-employment (25.0 per cent).
Transited 46.2 In transition
53.8
Stable & satisfactory job
47.5
Stable but non-satisfactory job
17.1
Satisfactory but temporary
job 7.8
Satisfactory self-
employment 27.5
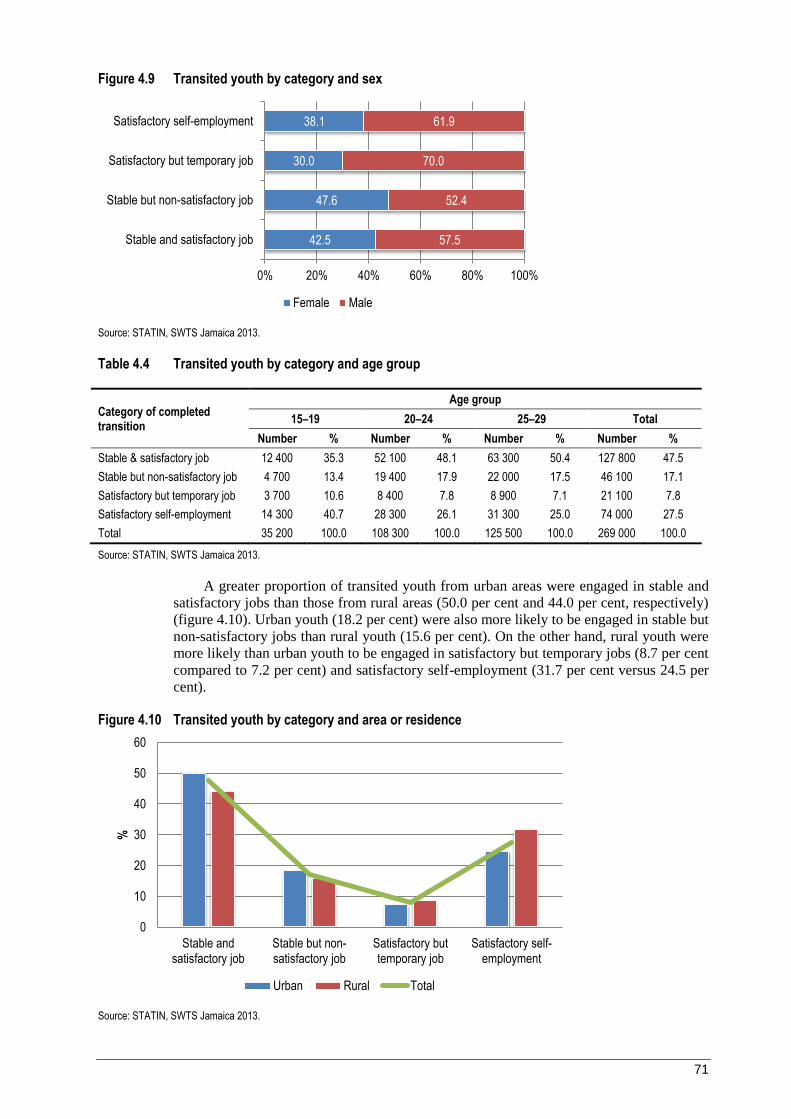
71
Figure 4.9 Transited youth by category and sex
Source: STATIN, SWTS Jamaica 2013.
Table 4.4 Transited youth by category and age group
Category of completed transition
Age group
15–19 20–24 25–29 Total
Number % Number % Number % Number %
Stable & satisfactory job 12 400 35.3 52 100 48.1 63 300 50.4 127 800 47.5
Stable but non-satisfactory job 4 700 13.4 19 400 17.9 22 000 17.5 46 100 17.1
Satisfactory but temporary job 3 700 10.6 8 400 7.8 8 900 7.1 21 100 7.8
Satisfactory self-employment 14 300 40.7 28 300 26.1 31 300 25.0 74 000 27.5
Total 35 200 100.0 108 300 100.0 125 500 100.0 269 000 100.0
Source: STATIN, SWTS Jamaica 2013.
A greater proportion of transited youth from urban areas were engaged in stable and
satisfactory jobs than those from rural areas (50.0 per cent and 44.0 per cent, respectively)
(figure 4.10). Urban youth (18.2 per cent) were also more likely to be engaged in stable but
non-satisfactory jobs than rural youth (15.6 per cent). On the other hand, rural youth were
more likely than urban youth to be engaged in satisfactory but temporary jobs (8.7 per cent
compared to 7.2 per cent) and satisfactory self-employment (31.7 per cent versus 24.5 per
cent).
Figure 4.10 Transited youth by category and area or residence
Source: STATIN, SWTS Jamaica 2013.
42.5
47.6
30.0
38.1
57.5
52.4
70.0
61.9
0% 20% 40% 60% 80% 100%
Stable and satisfactory job
Stable but non-satisfactory job
Satisfactory but temporary job
Satisfactory self-employment
Female Male
0
10
20
30
40
50
60
Stable andsatisfactory job
Stable but non-satisfactory job
Satisfactory buttemporary job
Satisfactory self-employment
%
Urban Rural Total
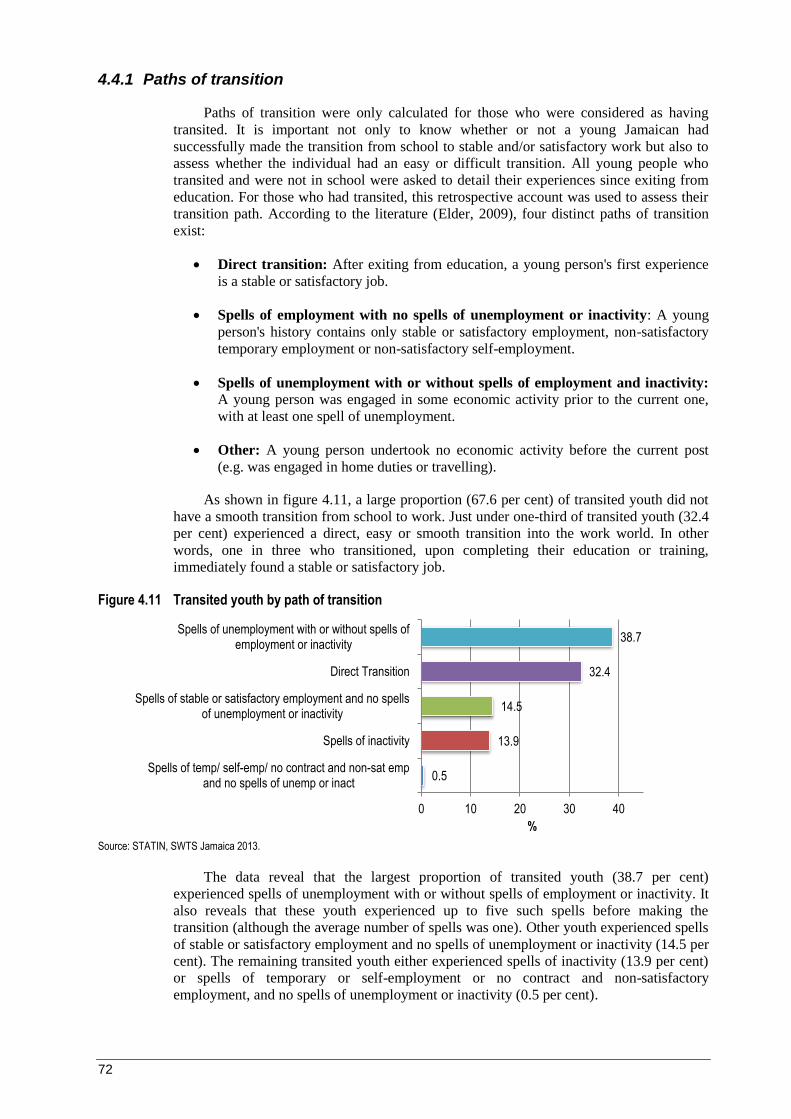
72
4.4.1 Paths of transition
Paths of transition were only calculated for those who were considered as having
transited. It is important not only to know whether or not a young Jamaican had
successfully made the transition from school to stable and/or satisfactory work but also to
assess whether the individual had an easy or difficult transition. All young people who
transited and were not in school were asked to detail their experiences since exiting from
education. For those who had transited, this retrospective account was used to assess their
transition path. According to the literature (Elder, 2009), four distinct paths of transition
exist:
Direct transition: After exiting from education, a young person's first experience
is a stable or satisfactory job.
Spells of employment with no spells of unemployment or inactivity: A young
person's history contains only stable or satisfactory employment, non-satisfactory
temporary employment or non-satisfactory self-employment.
Spells of unemployment with or without spells of employment and inactivity: A young person was engaged in some economic activity prior to the current one,
with at least one spell of unemployment.
Other: A young person undertook no economic activity before the current post
(e.g. was engaged in home duties or travelling).
As shown in figure 4.11, a large proportion (67.6 per cent) of transited youth did not
have a smooth transition from school to work. Just under one-third of transited youth (32.4
per cent) experienced a direct, easy or smooth transition into the work world. In other
words, one in three who transitioned, upon completing their education or training,
immediately found a stable or satisfactory job.
Figure 4.11 Transited youth by path of transition
Source: STATIN, SWTS Jamaica 2013.
The data reveal that the largest proportion of transited youth (38.7 per cent)
experienced spells of unemployment with or without spells of employment or inactivity. It
also reveals that these youth experienced up to five such spells before making the
transition (although the average number of spells was one). Other youth experienced spells
of stable or satisfactory employment and no spells of unemployment or inactivity (14.5 per
cent). The remaining transited youth either experienced spells of inactivity (13.9 per cent)
or spells of temporary or self-employment or no contract and non-satisfactory
employment, and no spells of unemployment or inactivity (0.5 per cent).
0.5
13.9
14.5
32.4
38.7
0 10 20 30 40
Spells of temp/ self-emp/ no contract and non-sat empand no spells of unemp or inact
Spells of inactivity
Spells of stable or satisfactory employment and no spellsof unemployment or inactivity
Direct Transition
Spells of unemployment with or without spells ofemployment or inactivity
%
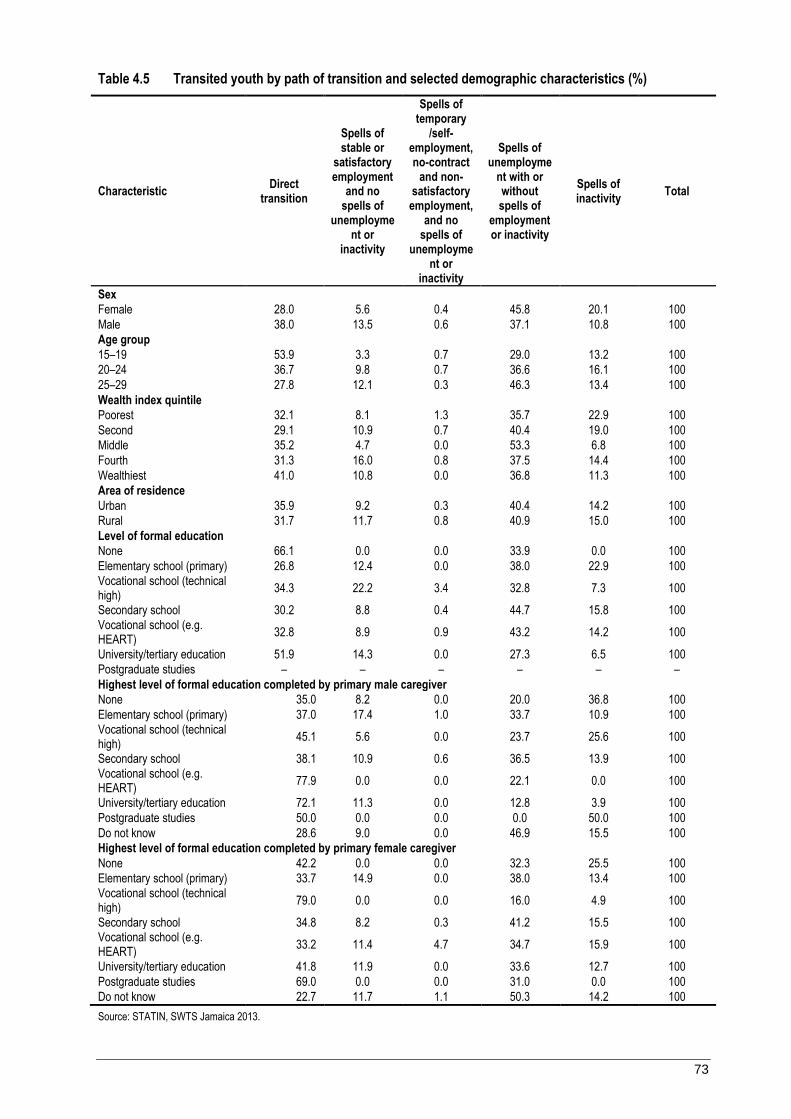
73
Table 4.5 Transited youth by path of transition and selected demographic characteristics (%)
Characteristic Direct
transition
Spells of stable or
satisfactory employment
and no spells of
unemployment or
inactivity
Spells of temporary
/self-employment, no-contract
and non-satisfactory employment,
and no spells of
unemployment or
inactivity
Spells of unemployme
nt with or without spells of
employment or inactivity
Spells of inactivity
Total
Sex
Female 28.0 5.6 0.4 45.8 20.1 100
Male 38.0 13.5 0.6 37.1 10.8 100
Age group
15–19 53.9 3.3 0.7 29.0 13.2 100
20–24 36.7 9.8 0.7 36.6 16.1 100
25–29 27.8 12.1 0.3 46.3 13.4 100
Wealth index quintile
Poorest 32.1 8.1 1.3 35.7 22.9 100
Second 29.1 10.9 0.7 40.4 19.0 100
Middle 35.2 4.7 0.0 53.3 6.8 100
Fourth 31.3 16.0 0.8 37.5 14.4 100
Wealthiest 41.0 10.8 0.0 36.8 11.3 100
Area of residence
Urban 35.9 9.2 0.3 40.4 14.2 100
Rural 31.7 11.7 0.8 40.9 15.0 100
Level of formal education
None 66.1 0.0 0.0 33.9 0.0 100
Elementary school (primary) 26.8 12.4 0.0 38.0 22.9 100
Vocational school (technical high)
34.3 22.2 3.4 32.8 7.3 100
Secondary school 30.2 8.8 0.4 44.7 15.8 100
Vocational school (e.g. HEART)
32.8 8.9 0.9 43.2 14.2 100
University/tertiary education 51.9 14.3 0.0 27.3 6.5 100
Postgraduate studies – – – – – –
Highest level of formal education completed by primary male caregiver
None 35.0 8.2 0.0 20.0 36.8 100
Elementary school (primary) 37.0 17.4 1.0 33.7 10.9 100
Vocational school (technical high)
45.1 5.6 0.0 23.7 25.6 100
Secondary school 38.1 10.9 0.6 36.5 13.9 100
Vocational school (e.g. HEART)
77.9 0.0 0.0 22.1 0.0 100
University/tertiary education 72.1 11.3 0.0 12.8 3.9 100
Postgraduate studies 50.0 0.0 0.0 0.0 50.0 100
Do not know 28.6 9.0 0.0 46.9 15.5 100
Highest level of formal education completed by primary female caregiver
None 42.2 0.0 0.0 32.3 25.5 100
Elementary school (primary) 33.7 14.9 0.0 38.0 13.4 100
Vocational school (technical high)
79.0 0.0 0.0 16.0 4.9 100
Secondary school 34.8 8.2 0.3 41.2 15.5 100 Vocational school (e.g. HEART)
33.2 11.4 4.7 34.7 15.9 100
University/tertiary education 41.8 11.9 0.0 33.6 12.7 100
Postgraduate studies 69.0 0.0 0.0 31.0 0.0 100
Do not know 22.7 11.7 1.1 50.3 14.2 100
Source: STATIN, SWTS Jamaica 2013.
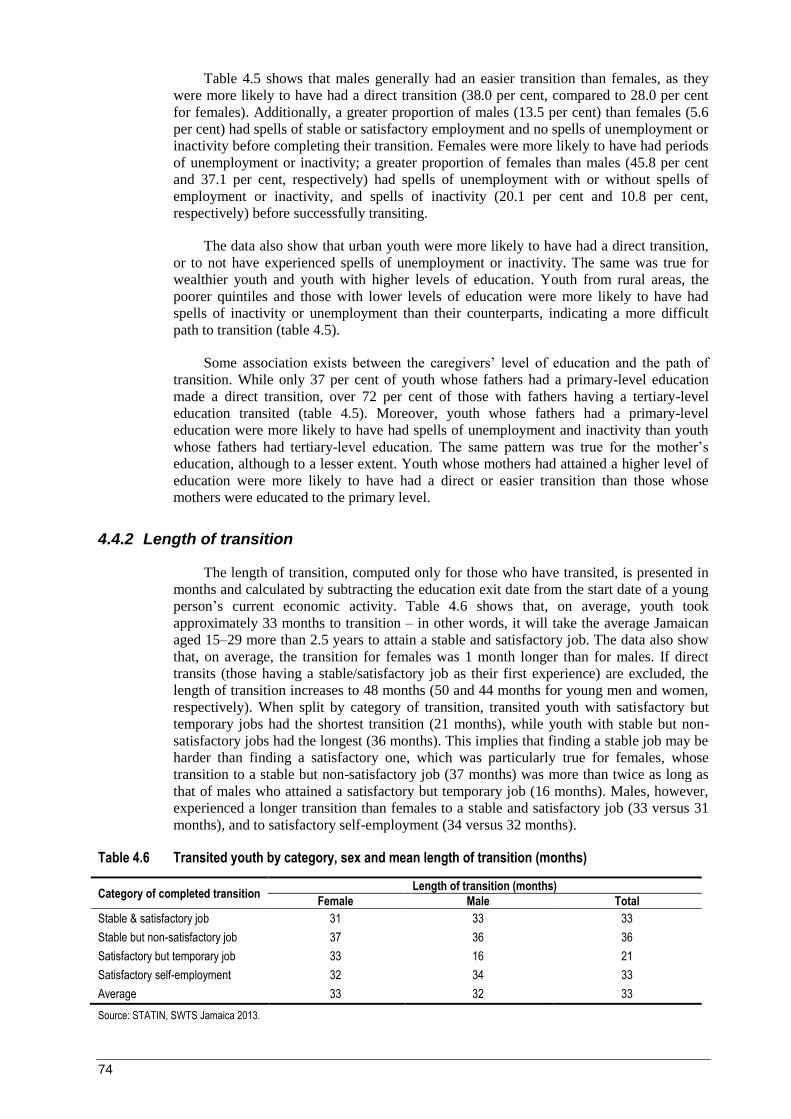
74
Table 4.5 shows that males generally had an easier transition than females, as they
were more likely to have had a direct transition (38.0 per cent, compared to 28.0 per cent
for females). Additionally, a greater proportion of males (13.5 per cent) than females (5.6
per cent) had spells of stable or satisfactory employment and no spells of unemployment or
inactivity before completing their transition. Females were more likely to have had periods
of unemployment or inactivity; a greater proportion of females than males (45.8 per cent
and 37.1 per cent, respectively) had spells of unemployment with or without spells of
employment or inactivity, and spells of inactivity (20.1 per cent and 10.8 per cent,
respectively) before successfully transiting.
The data also show that urban youth were more likely to have had a direct transition,
or to not have experienced spells of unemployment or inactivity. The same was true for
wealthier youth and youth with higher levels of education. Youth from rural areas, the
poorer quintiles and those with lower levels of education were more likely to have had
spells of inactivity or unemployment than their counterparts, indicating a more difficult
path to transition (table 4.5).
Some association exists between the caregivers’ level of education and the path of
transition. While only 37 per cent of youth whose fathers had a primary-level education
made a direct transition, over 72 per cent of those with fathers having a tertiary-level
education transited (table 4.5). Moreover, youth whose fathers had a primary-level
education were more likely to have had spells of unemployment and inactivity than youth
whose fathers had tertiary-level education. The same pattern was true for the mother’s
education, although to a lesser extent. Youth whose mothers had attained a higher level of
education were more likely to have had a direct or easier transition than those whose
mothers were educated to the primary level.
4.4.2 Length of transition
The length of transition, computed only for those who have transited, is presented in
months and calculated by subtracting the education exit date from the start date of a young
person’s current economic activity. Table 4.6 shows that, on average, youth took
approximately 33 months to transition – in other words, it will take the average Jamaican
aged 15–29 more than 2.5 years to attain a stable and satisfactory job. The data also show
that, on average, the transition for females was 1 month longer than for males. If direct
transits (those having a stable/satisfactory job as their first experience) are excluded, the
length of transition increases to 48 months (50 and 44 months for young men and women,
respectively). When split by category of transition, transited youth with satisfactory but
temporary jobs had the shortest transition (21 months), while youth with stable but non-
satisfactory jobs had the longest (36 months). This implies that finding a stable job may be
harder than finding a satisfactory one, which was particularly true for females, whose
transition to a stable but non-satisfactory job (37 months) was more than twice as long as
that of males who attained a satisfactory but temporary job (16 months). Males, however,
experienced a longer transition than females to a stable and satisfactory job (33 versus 31
months), and to satisfactory self-employment (34 versus 32 months).
Table 4.6 Transited youth by category, sex and mean length of transition (months)
Category of completed transition Length of transition (months)
Female Male Total
Stable & satisfactory job 31 33 33
Stable but non-satisfactory job 37 36 36
Satisfactory but temporary job 33 16 21
Satisfactory self-employment 32 34 33
Average 33 32 33
Source: STATIN, SWTS Jamaica 2013.
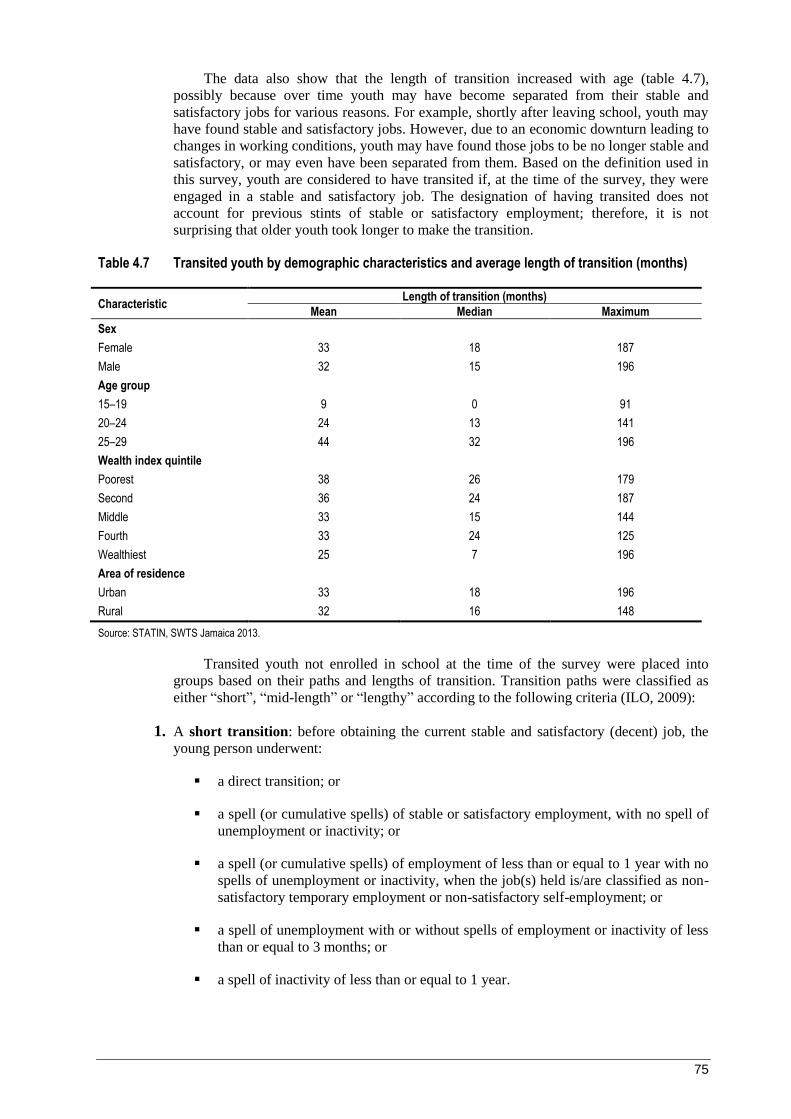
75
The data also show that the length of transition increased with age (table 4.7),
possibly because over time youth may have become separated from their stable and
satisfactory jobs for various reasons. For example, shortly after leaving school, youth may
have found stable and satisfactory jobs. However, due to an economic downturn leading to
changes in working conditions, youth may have found those jobs to be no longer stable and
satisfactory, or may even have been separated from them. Based on the definition used in
this survey, youth are considered to have transited if, at the time of the survey, they were
engaged in a stable and satisfactory job. The designation of having transited does not
account for previous stints of stable or satisfactory employment; therefore, it is not
surprising that older youth took longer to make the transition.
Table 4.7 Transited youth by demographic characteristics and average length of transition (months)
Characteristic Length of transition (months)
Mean Median Maximum
Sex
Female 33 18 187
Male 32 15 196
Age group
15–19 9 0 91
20–24 24 13 141
25–29 44 32 196
Wealth index quintile
Poorest 38 26 179
Second 36 24 187
Middle 33 15 144
Fourth 33 24 125
Wealthiest 25 7 196
Area of residence
Urban 33 18 196
Rural 32 16 148
Source: STATIN, SWTS Jamaica 2013.
Transited youth not enrolled in school at the time of the survey were placed into
groups based on their paths and lengths of transition. Transition paths were classified as
either “short”, “mid-length” or “lengthy” according to the following criteria (ILO, 2009):
1. A short transition: before obtaining the current stable and satisfactory (decent) job, the
young person underwent:
a direct transition; or
a spell (or cumulative spells) of stable or satisfactory employment, with no spell of
unemployment or inactivity; or
a spell (or cumulative spells) of employment of less than or equal to 1 year with no
spells of unemployment or inactivity, when the job(s) held is/are classified as non-
satisfactory temporary employment or non-satisfactory self-employment; or
a spell of unemployment with or without spells of employment or inactivity of less
than or equal to 3 months; or
a spell of inactivity of less than or equal to 1 year.
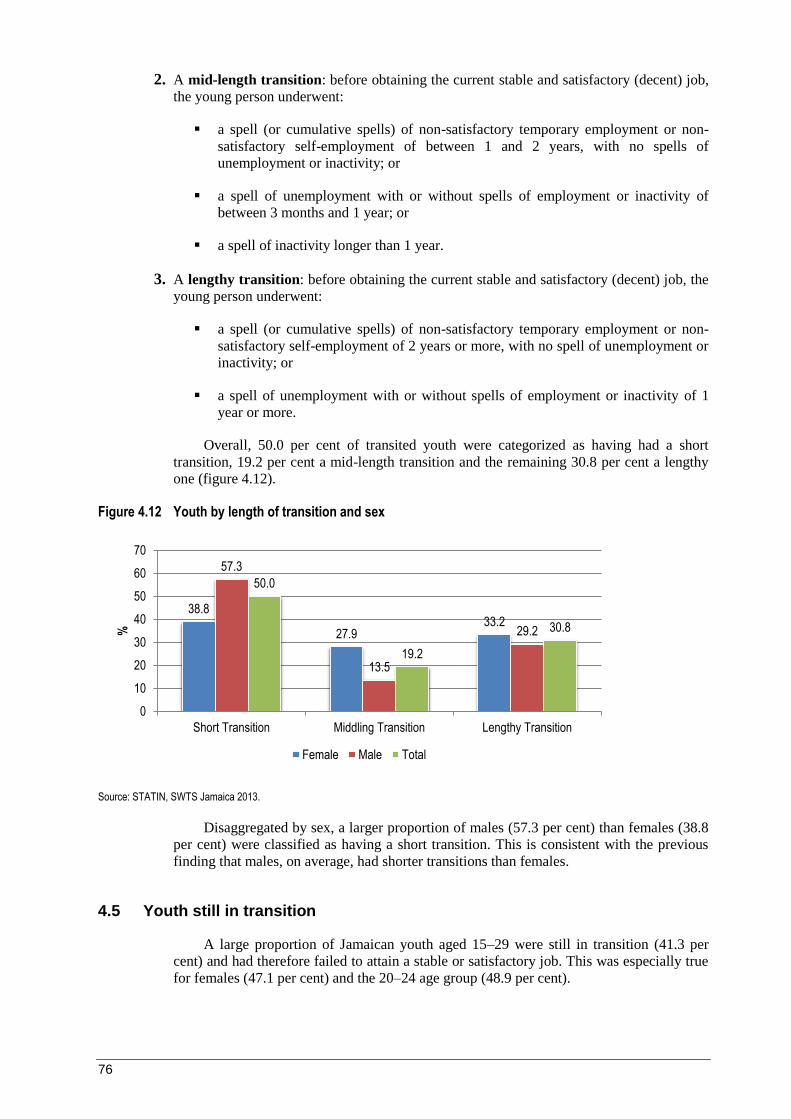
76
2. A mid-length transition: before obtaining the current stable and satisfactory (decent) job,
the young person underwent:
a spell (or cumulative spells) of non-satisfactory temporary employment or non-
satisfactory self-employment of between 1 and 2 years, with no spells of
unemployment or inactivity; or
a spell of unemployment with or without spells of employment or inactivity of
between 3 months and 1 year; or
a spell of inactivity longer than 1 year.
3. A lengthy transition: before obtaining the current stable and satisfactory (decent) job, the
young person underwent:
a spell (or cumulative spells) of non-satisfactory temporary employment or non-
satisfactory self-employment of 2 years or more, with no spell of unemployment or
inactivity; or
a spell of unemployment with or without spells of employment or inactivity of 1
year or more.
Overall, 50.0 per cent of transited youth were categorized as having had a short
transition, 19.2 per cent a mid-length transition and the remaining 30.8 per cent a lengthy
one (figure 4.12).
Figure 4.12 Youth by length of transition and sex
Source: STATIN, SWTS Jamaica 2013.
Disaggregated by sex, a larger proportion of males (57.3 per cent) than females (38.8
per cent) were classified as having a short transition. This is consistent with the previous
finding that males, on average, had shorter transitions than females.
4.5 Youth still in transition
A large proportion of Jamaican youth aged 15–29 were still in transition (41.3 per
cent) and had therefore failed to attain a stable or satisfactory job. This was especially true
for females (47.1 per cent) and the 20–24 age group (48.9 per cent).
38.8
27.9 33.2
57.3
13.5
29.2
50.0
19.2
30.8
0
10
20
30
40
50
60
70
Short Transition Middling Transition Lengthy Transition
%
Female Male Total

77
Having a lower level of education was associated with the probability of being in
transition. More than one-half (57.4 per cent) of those with primary-level education or
lower were still in transition, and the proportion declined as the education level increased,
to a low of 18.0 per cent of youth with postgraduate education. Interestingly, a greater
proportion of those with post-secondary vocational training (45.8 per cent) were still in
transition compared to those with only a secondary-level education (39.6 per cent).
Youth still in transition were divided into four sub-categories: unemployed,16
employed in a temporary and non-satisfactory job; self-employed and unsatisfied; and
inactive non-student with future work aspirations.
During the survey, the vast majority (78.6 per cent) of youth in transition were
unemployed (figure 4.13), meaning 246,300 were available for employment but found
none. Of these, approximately 43,300 were considered as discouraged workers who had
simply given up their job search. Another 10.7 per cent, or 33,600 youth in transition, were
neither in the labour force nor in education/training (inactive non-students) with a desire to
work in the future. The remaining ,400 youth in transition were either “self-employed
and unsatisfied” (7.1 per cent) or “employed in a temporary and non-satisfactory job” ( .6
per cent).
Figure 4.13 Youth still in transition by category
Source: STATIN, SWTS Jamaica 2013.
Of the employed youth in transition who wished to change their current employment
situation, 45.7 per cent of those in a temporary and non-satisfactory job wanted to obtain
higher pay per hour (table 4.8). Those self-employed and unsatisfied primarily wanted to
change to better use their qualification or skills (30.8 per cent); another 26.6 per cent of
this group wanted higher pay per hour, and 20.3 per cent wanted to improve their working
conditions.
16 Relaxed unemployed, i.e. available for work, whether or not actively seeking employment.
3.6
7.1
10.7
78.6
0 20 40 60 80 100
Employed in a temporary and non-satisfactory job
Self-employed and unsatisfied
Inactive, non-student with future workaspirations
Unemployed
%

78
Table 4.8 Youth in transition by reason for wanting to change their work situation (%)
Reason Employed in a temporary and non-
satisfactory job Self-employed and unsatisfied
Present job is temporary 29.9 11.5
To work more hours paid at current rate 3.7 10.8
To have higher pay per hour 45.7 26.6
To better use qualification/skills 9.8 30.8
To have more convenient working time 7.2 0.0
To improve working conditions 3.7 20.3
Total 100.0 100.0
Source: STATIN, SWTS Jamaica 2013.
4.5.1 Length of transition
For those still in transition, the length is calculated by subtracting the date of exit
from education from the date of the survey. Importantly, the length of transition for those
remaining in transition will continue until they find a job deemed stable and/or
satisfactory. In other words, the data report only the current duration of transition. On
average, youth still in transition had been at this stage for 68 months (figure 4.14) or 5
years and 8 months, which was almost 3 years or 35 months longer than transited youth
(who averaged 33 months; table 4.7). In effect, more than 5 years after leaving school, 41.3
per cent of youth failed to obtain stable or satisfactory employment.
Figure 4.14 Youth in transition by average length of transition (months)
Source: STATIN, SWTS Jamaica 2013.
Among youth still in transition, those employed in a temporary and non-satisfactory
job had the shortest average length of transition (61 months). Those self-employed and
unsatisfied had the longest average length (85 months, or 7 years and 1 month), implying
that they had a higher probability of remaining in transition than other categories of youth.
In fact, the self-employed and unsatisfied were in transition longer than those economically
inactive with future work aspirations.
However, when split into wealth quintiles, the data show that youth from the poorest
two quintiles who were still transiting had the longest current duration of transition (figure
4.15). By quintile, the average current duration in months was: poorest (73), second (76),
middle (68), fourth (61) and wealthiest (50). In other words, on average, youth from the
poorest quintile who were still transitioning had spent 23 months longer in transition than
those from the wealthiest quintile
60.8
65.4
75.0
85.1
0 10 20 30 40 50 60 70 80 90
Employed in a temporary and non-satisfactoryjob
Unemployed
Inactive, non-student with future workaspirations
Self-employed and unsatisfied
Months
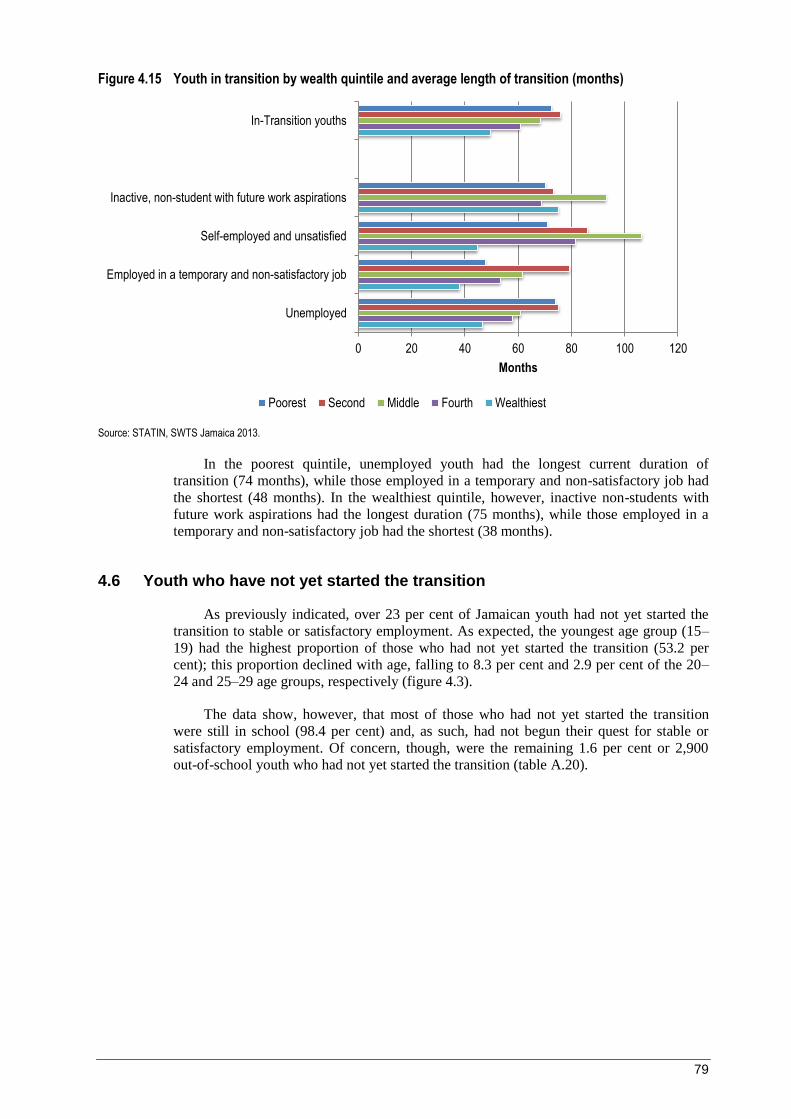
79
Figure 4.15 Youth in transition by wealth quintile and average length of transition (months)
Source: STATIN, SWTS Jamaica 2013.
In the poorest quintile, unemployed youth had the longest current duration of
transition (74 months), while those employed in a temporary and non-satisfactory job had
the shortest (48 months). In the wealthiest quintile, however, inactive non-students with
future work aspirations had the longest duration (75 months), while those employed in a
temporary and non-satisfactory job had the shortest (38 months).
4.6 Youth who have not yet started the transition
As previously indicated, over 23 per cent of Jamaican youth had not yet started the
transition to stable or satisfactory employment. As expected, the youngest age group (15–
19) had the highest proportion of those who had not yet started the transition (53.2 per
cent); this proportion declined with age, falling to 8.3 per cent and 2.9 per cent of the 20–
24 and 25–29 age groups, respectively (figure 4.3).
The data show, however, that most of those who had not yet started the transition
were still in school (98.4 per cent) and, as such, had not begun their quest for stable or
satisfactory employment. Of concern, though, were the remaining 1.6 per cent or 2,900
out-of-school youth who had not yet started the transition (table A.20).
0 20 40 60 80 100 120
Unemployed
Employed in a temporary and non-satisfactory job
Self-employed and unsatisfied
Inactive, non-student with future work aspirations
In-Transition youths
Months
Poorest Second Middle Fourth Wealthiest
80
5. Relevant institutional and policy frameworks
Issues affecting youth transition in the Jamaican labour market have been of concern
to the government and the international community for some time. This section focuses on
the existing policy and institutional framework that impacts youth empowerment in
Jamaica.
5.1 Institutional framework
Institutionally, the regulation of employment in Jamaica fits within the purview of the
Ministry of Labour & Social Security, which acts as the central point for the tripartite
configuration of government, trade unions and employers, a fundamental principle of the
ILO. Trade union activity in Jamaica has a long and storied history, with the Jamaica
Confederation of Trade Unions (JCTU) serving as the main union federation. The
employers are represented by the Jamaica Employers’ Federation and other private-sector
groupings such as the Private Sector Organisation of Jamaica.
Over 20 labour legislations (acts and regulations) exist in Jamaica, including the
Labour Relations and Industrial Disputes Act & Regulations (1975); the Employment
Termination and Redundancy Payment Act & Regulation (1974); the Holidays with Pay
Act & Regulations (1973); the Minimum Wage Act & Regulation (1938); the Workmen’s
Compensation Act & Regulation (1938); and the Foreign National and Commonwealth
Citizens Employment Act (1964).
The Labour Relations and Industrial Disputes Act (LRIDA) and Regulation of 1975
are explicitly expressed in the Labour Relations Code of 1976. The Code, outlined in
section 3 of the LRIDA, sets out “the guidelines which in the opinion of the Minister will
be helpful for the purpose of promoting good labour relations” in relation to the principle
of collective bargaining, to developing and maintaining orderly procedures, and to
developing and maintaining good personnel management techniques.17
As its name suggests, the Employment Termination and Redundancy Payment Act
(ETRPA) of 1974 relates to paying workers upon termination of their employment. The
ETRPA stipulates the minimum period of notice required to terminate an employment
contract.
Congruent with the ILO Minimum Wage Fixing Convention, 1970 (No. 131), the
Minimum Wage Act of 1938 establishes the national minimum wage payable to a worker.
This legislation also makes provision for the establishment of a Minimum Wage Advisory
Commission that considers and advises the Minister on all matters related to national
minimum wages.
5.2 Policy framework
The Jamaican youth population (758,600 in 2012, or 28.0 per cent of the total
population) is estimated to increase to around 794,600 by 2030. This situation calls for
interventions to enhance the capacity of young people through programmes aimed at
increasing their access to decent work, education and health services. The Population
17 The Labour Relations Code, 1976.

81
Sector Plan of Jamaica’s Vision 2030 outlines the need for “empowerment and protection
of adolescents and youth to enable them to fully realize their social, cultural and human
rights and fulfil their physical, economic and social aspirations”.18
5.3 Relevant policies
5.3.1 National Youth Policy
The National Youth Policy of 2004 was the second comprehensive policy for the
youth population. The purpose, as outlined in the existing policy, is to “facilitate the
development of an environment that optimizes the potential of each young Jamaican”. The
policy’s objectives are spread across six focal areas, namely:
1. Education and training
2. Employment and entrepreneurship
3. Health
4. Participation and empowerment
5. Care and protection
6. Living environment
The objectives19
include but are not limited to:
1. Promoting universal access to quality secondary education;
2. Advocating for an education system that is relevant to the needs of youth and
their potential employers;
3. Increasing youth employability;
4. Increasing the number of youth employment opportunities.
A comprehensive policy revision has begun with the drafting of a concept paper that
has been submitted to the Jamaican Cabinet as part of a Cabinet Note. While the revised
policy will determine the key areas of focus, the policy will be guided by the following
principles:
• Leadership and commitment
• Youth mainstreaming
• Meaningful involvement and participation of stakeholders
• Positive youth development
18 Population Sector Plan 2009–2030, Final draft, June 2010.
19 National Youth Policy 2004.

82
• Recognition and fulfilment of rights
• Multi-sectoral approach, partnership and collaboration
• Gender, equality, non-discrimination and equity
The revision of the policy is complemented by the development of several
instruments that will support the youth sector – the National Youth Survey, the Situation
Analysis of Jamaican Youth, the Analysis of Gaps in Youth Programmes and the National
Youth Mainstreaming Strategy, all of which have been completed.
5.3.2 National Employment Policy
The proposed National Employment Policy seeks to facilitate the development of the
Jamaican economy and aims to support efforts to reduce poverty by providing the
framework for increased employment, an efficient labour market and decent work. A
concept paper has been drafted.
5.4 Development framework
5.4.1 Vision 2030 – National Development Plan (NDP)20
The NDP, Jamaica’s first long-term planning framework for development, seeks to
place the country on a sustainable development path by 2030 and is based on the
comprehensive vision, “Jamaica, the place of choice to live, work, raise families and do
business”.
For Jamaica, this foresees a major transformation from a middle-income developing
country to a developed country status, one which affords its citizens a high quality of life
and world-class standards in critical areas including education, health care, nutrition, basic
amenities, civility, social order and access to environmental goods and services. Buttressed
by seven guiding principles, the vision is built on the accomplishment of four national
goals, which together address key social, economic and sustainable development policy
challenges faced by Jamaica. Achieving these goals will invariably impact positively on
Jamaican youth.
The goals of Vision 2030 are:
Goal 1: Jamaicans are empowered to achieve their fullest potential. It is anticipated
that this will be accomplished through improving access to quality health care and
education, and providing the population with adequate social protection. One objective for
Goal 1 is to implement skills training programmes targeted at unattached and at-risk youth.
Goal 2: Jamaican society is secure, cohesive and just. Designed to tackle one of
Jamaica’s most urgent priorities, this goal and its accompanying outcomes set targets for
reduction in crime, violence and corruption. A targeted intervention within the goal is the
implementation of holistic and targeted community development interventions.
Goal 3: Jamaica’s economy is prosperous. Correction of structural and policy barriers
to growth, and the development of new areas of economic activity, are the basis of
20 Tabled in Parliament in 2009.
83
strategies to achieve prosperity. The model advocated by the NDP focuses on
diversification of economic activity and a more holistic view of prosperity built around the
development and efficient utilization of institutional, human and cultural capital. Vision
2030 identifies nine areas of industry as the pillars of Jamaica’s economic development:
agriculture, construction, creative industries, sports, information and communications
technology (ICT), manufacturing, mining and quarrying, services, and tourism. Included
are plans to implement catalytic capital investment projects, namely:
Agriculture – agro-parks and national food security
Logistics hub – development of regional logistics facilities
Development of economic zones
Privatization of container terminals
Privatization of the Norman Manley International Airport
ICT and science parks
Increases in financing of and support for micro-, small and medium-sized
enterprises (MSMEs) – mobile money initiatives and training for MSMEs
Tourism projects – new market segments, megaresorts and attractions
Infrastructure – completion of the island-wide highway network, broadband and
digital broadcasting network, and water and sewage systems
Urban renewal, and low- and middle-income housing
Energy sector reform, fuel source diversification, energy conservation,
liberalization of the electricity market and construction of a new 360-megawatt
plant
Training – establishment of new workforce colleges, as well as technical and
vocational education and training institutes (HEART Trust/NTA)
Under Goal 3, an enabling business environment is listed as the eighth National
Outcome of Vision 2030; part of achieving this entails comprehensive Jamaican labour
market reform as an aspect of long-term economic development. The national strategy
addresses the various factors inhibiting growth. As a consequence, labour market reform
will focus on improving competitiveness, increasing productivity, increasing flexibility
through revision of labour legislation and regulations, and ultimately, increasing
employment and reducing youth unemployment. The efficacy of training, aligned with
labour market demand, is another aspect of an enabling business environment that is
addressed by Goal 1’s second National Outcome of world-class education and training,
which is fundamental to the development of human capital in an ever-changing business
environment.
Goal 4: Jamaica has a healthy natural environment. The effective and sustainable use
and management of the country’s natural resources are premised on the understanding that
84
“successful environmental management is increasingly becoming the basis for the success
or failure of economies and social systems”.21
5.4.2 The Growth Inducement Strategy (2011)
Through proactive partnership between the government and the private sector, the
Growth Inducement Strategy seeks to build and sustain an enabling environment for
creative and enterprising stakeholders. The strategy establishes a framework for robust
economic growth, aligned with Vision 2030.
The main features are to:
• Undertake a systematic programme of tax reform as the linchpin of unlocking
latent wealth tied up in potentially productive assets, and promote
entrepreneurial dynamism;
• Build international competitiveness by addressing the costs of production:
continued ongoing efforts to lower the cost of capital and improve transmission
to the productive sector; improve productivity of the workforce by ramping up
training and labour certification; promote technical innovation (e.g. greenhouse
agriculture) through research and development;
• Exploit the full potential of the business network model to promote synergies
within and among targeted clusters of economic activity, reduce transaction
costs and realize economies of scale: build and strengthen value-chain linkages,
backward and forward, among firms (e.g. business incubator network; linkages
between tourism, agriculture, agro-processing and local services [health, sports,
food, crafts, entertainment]); promote the emergence of new clusters of activity
(logistics hub) and increased employment and export earnings from expanded
ICT sites;
• Protect and strengthen the built environment. Severe and costly damage is
perennially inflicted on Jamaica by hazards arising from natural and man-made
causes. Opportunities exist to simultaneously reduce such costs and create jobs,
by redirecting resources within existing fiscal constraints, through public works
(e.g. infrastructure maintenance and improvement, housing construction);
• Spearhead the drive for economic growth by expanding community renewal
programmes to unlock creativity and entrepreneurship in targeted communities
throughout Jamaica, as a foundation for organic and sustained development of
such communities and as a positive alternative to illegal options;
• Adopt a new role for government, for a leaner and more effective partnership
with the private sector.
5.5 International Monetary Fund (IMF)
Most of the abovementioned strategies have been incorporated under a new four-year
Extended Fund Facility (2013–17) with the IMF of US$944.0 million. The main aim is to
21 Vision 2030 (2010), p.31.

85
reduce the national debt, the major constraint to Jamaica’s growth; the financing of these
strategic investments should facilitate sustainable long-term growth.
5.6 Skills development framework
The Human Employment and Resource Training Trust/National Training Agency
(HEART Trust/NTA) was established in 1982 under the HEART Act to finance and
coordinate training programmes aimed primarily at creating a competent and competitive
workforce. Driven by its vision of “a Jamaican workforce trained and certified to
international standards stimulating employment-creating investment, contributing to
improved productivity of individuals, enterprises and the nation”, HEART Trust/NTA
plays a critical role in the training and certification of the Jamaican workforce.
The Trust is financed by a 3.0 per cent levy on payrolls that exceed JMD14,444 per
month. The organization has established or supported over 130 residential and non-
residential training programmes for specific sectors, targeting individuals aged 17 and
over.22
Participants are predominantly youth aged 17–24; the 2009–10 data show that, in
the two major programme areas of community- and institutional-based training, about 74.0
per cent of the participants fall within this age group. The Trust also facilitates the delivery
of training throughout the island in partnership with donor agencies, government and non-
governmental organizations. In recent years, the NTA has concentrated on increasing the
offerings of higher-level skills training while expanding the array of competency-based
training programmes in a number of broad sectoral areas, such as agriculture, building
construction, hospitality/tourism, information technology, automotive services, beauty care
services and commercial services. In 2012, some 79,000 trainees were enrolled, and about
39,000 graduated.
The National Education Strategic Plan 2011–2012 (NESP) identifies as its main
objective “to present the objectives and strategies to be pursued by the Ministry of
Education and its Agencies in a comprehensive way in ensuring an efficient, relevant and
effective education system” (NESP, p. 27). It also identifies the following five critical
challenges confronting the Ministry of Education in improving Jamaica’s education
system: access, quality, accountability, qualified teacher supply, and safety and security
(NESP, p.19). The NESP is designed to produce a high-quality education product to all
Jamaicans aged 3–18, which will equip them to become productive, contributing citizens.
Four relevant strategic objectives are:
• 50 per cent of unattached youth accessing education and training by 2020;
• 90 per cent of secondary school graduates accessing further education and
training by 2016;
• an increase in the tertiary cohort to 50 per cent by 2016;
• 90 per cent of the adult population literate by 2020.
Compulsory Education Policy (CEP)
This policy is designed to support the mandatory engagement of all children aged 3–
18 in a meaningful learning process and in a structured and regulated setting. It addresses
22 HEART Trust/NTA-operated entities are currently being transformed into Work Force College
and Technical Vocational Education and Training Institutes.

86
regular attendance at learning institutions for all children, as well as exposure to both
academic and vocational programmes at the secondary level.
The Special Education Policy is in draft stage and is waiting to be tabled. It will guide
the implementation of the special education mandate, which ensures adequate and
appropriate provisions that will guarantee access and equity in the planning and delivery of
special education services.
The Career Advancement Programme (CAP) is an initiative of the Ministry of
Education aimed at improving access to quality education in Jamaica for all new students.
Launched in 2010, it was facilitated under the CEP, which is aimed at ensuring that all
children aged 13–18 are attached to and attending structured learning/education and
training programmes, appropriate to their age and development. The CAP provides youth
aged 16–18 with free education and training that helps them to get a career for life, and to
earn vocational certification.
The Programme of Advancement Through Health and Education (PATH) is a
conditional cash transfer programme funded by the Government of Jamaica and the World
Bank, and is aimed at delivering benefits by way of cash grants to the most needy and
vulnerable in the society. PATH was introduced island-wide in 2002 and, under it, the
Steps to Work Programme was introduced in 2008 as a “welfare-to-work” initiative. This
initiative seeks to further build human capital in poor families by empowering household
members through remedial education, skills training and competency building, and
business development.
The Jamaica Social Investment Fund (JSIF) provides infrastructural and social
investments in underserved Jamaican communities. In 2012, JSIF disbursed approximately
JMD 1.4billion for community development activities. Education/training-related socio-
economic projects included:
• Education training programmes: social investments in this area support the
mandate of poverty reduction through education and marketable skills training
for 3,718 children and youth.
• Mediation and conflict resolution: mediation and conflict resolution training
programmes were provided to 693 people in vulnerable inner-city communities
as a means of preventing crime and violence.
• Scholarships for vocational and tertiary institutions: 63 scholarships were
provided to vocational and tertiary institutions for youth in targeted
communities.
• Employment internships: work experience internships with companies were
provided to 63 young people from targeted communities.
• Youth education and recreation: some JMD 24.2 million was disbursed by JSIF
for home work centres, Grade Six Achievement Test (GSAT) and Grade Four
Literacy and Numeracy classes, and cultural and guidance programmes.
Additionally, 2,833 low-performing students aged 6–18 were enrolled in
summer camps.
• Alternative livelihood and skills development: 97 youth participated. The skill
areas offered included building construction, food preparation, plumbing,
electrical and welding.
Under the Social Safety Net Reform Programme (2000), the Social Protection Project
2008-15 was developed. Aiming to strengthen Jamaica’s social insurance and social

87
assistance system, this project supports the following activities: improving the
effectiveness of PATH; building capacity to implement the Steps to Work programme;
enabling the formulation of a reform programme for the public-sector pension schemes;
and developing a holistic social protection strategy. The strategy draft includes a proposal
to “prepare young persons for adulthood by equipping them for employment and the
attainment of income security, and the knowledge and attitudes necessary to lead
responsible independent lives”.
The Community Renewal Programme (CRP) is aimed at addressing poor housing,
poor infrastructure, weak community governance and the lack of coordination of social
intervention programmes. Launched in 2011, the CRP has the broad remit of supporting
the development of communities in a holistic way, and targeting six specific areas of
vulnerability: governance, social transformation, safety and justice, youth development,
socio-economic development and sustainable physical transformation.
The Rural Youth Poverty Reduction Project (2007-13) aimed to reduce rural youth
unemployment by increasing the ability of youth to access sustainable livelihood options.
The project provided rural youth with skills training and increased access to postharvest
production facilities to improve agricultural value added.
The Inner City Renewal Programme is an initiative of the Government of Jamaica.
The programme, launched in March 2001, promotes sustainable development in the inner-
city communities of the Kingston metropolitan area through improvement of physical and
social infrastructure, the creation of economic and employment opportunities, and a
general improvement in the quality of life for citizens in these communities.


89
References
Central Intelligence Agency (CIA). 2012. “Country Comparison : Public debt” [Retrieved
October 2013, from CIA World FactBook: https://www.cia.gov/library/publications/the-
world-factbook/rankorder/2186rank.html].
Elder, S. 2009. ILO School-to-Work Transition Survey: A Methodological Guide (Geneva:
ILO).
International Labour Organization (ILO). 2013. Global Employment Trends for Youth
2013: A Generation at Risk (Geneva, ILO).
Organisation for Economic Co-operation and Development (OECD). 2012. Education at a
Glance (Paris); [Retrieved 09 2013, from OECD iLibrary: http://www.oecd-
ilibrary.org/sites/eag_highlights-2012-
en/02/02/index.html?contentType=&itemId=/content/chapter/eag_highlights-2012-11-
en&containerItemId=/content/serial/2076264x&accessItemIds=/content/book/eag_highligh
ts-2012-en&mimeType=text/html].
Planning Institute of Jamaica (PIOJ). 2009. Medium Term Socio-economic Policy
Framework 2009-2012. Kingston.
─. 2012. Medium Term Socio-economic Policy Framework 2012-2015. Kingston
Schwab, K. 2012. The Global Competitiveness Report 2012–2013 (Geneva, World
Economic Forum).
Secretariat of the Pacific Community (SOPAC). n.d. “Environmental Vulnerability Index”
[Retrieved 2014, from http://www.sopac.org/index.php/environmental-vulnerability-
index].
United Nations Development Programme (UNDP). 2012. “Human Development Data
API” [Retrieved from Human Development Reports: http://hdr.undp.org/en/data/api].


91
Annex I. Key indicators of the Jamaican youth labour market
Total Male Female
Distribution of youth population by economic activity
Employed 39.9 46.3 33.4
Unemployed 19.6 16.9 22.3
Inactive (strict) 40.5 36.8 44.3
Unemployment rate 33.0 26.8 40.0
Inactivity rate 40.5 36.8 44.3
Labour force participation rate 59.5 63.2 55.7
Distribution of youth population by economic activity
Regular employed 23.6 26.8 20.4
Irregular employed 16.2 19.4 13.0
Relaxed unemployed 32.5 28.1 36.9
Inactive (relaxed) 27.7 25.7 29.7
Relaxed unemployment rate 44.9 37.8 52.5
Labour underutilization rate (relaxed unemployed + irregular employed + share neither in labour force nor in education/training)
53.3 50.3 56.2
Informal employment share in total employment 75.2 76.4 73.6
Share of informal jobs in total wage employment 48.7 50.1 46.8
Share of employment in informal sector 42.0 42.2 41.8
Satisfactory employment rate 73.7 76.1 70.4
Non-satisfactory employment rate 26.3 23.9 29.6
Share of long-term unemployed in total unemployment (strict) 60.8 58.6 62.4
NEETs rate (strict) 30.3 24.6 36.1
Share neither in labour force nor in education/training (relaxed) 13.1 9.6 16.7
Share of stable wage employment 84.3 81.1 88.9
Share of temporary wage employment 15.7 18.9 11.1
Distribution of employment
Employees 68.2 68.4 68.0
Employers 1.7 2.6 0.5
Own-account workers 22.8 22.7 23.0
Contributing family workers 6.9 6.0 8.2
Others 0.4 0.4 0.3
Share of vulnerable employment 30.1 29.1 31.5
Share of own-account workers with below-average earnings 58.6 58.0 59.5
Share of employees with below-average wages 52.9 51.0 55.6
Share of youth by transition stage
Transited (total) 35.5 41.6 29.3
To stable employment 22.9 25.6 20.2
To satisfactory self- or temporary employment 12.5 15.9 9.1
In transition (total) 41.0 35.1 46.9
Relaxed unemployed 32.5 28.1 36.9
Non-satisfactory self- or temporary employment 4.4 4.7 4.1
Inactive non-students with plans to work 4.1 2.3 5.9
Transition not yet started 23.5 23.3 23.7
Temporary employment share in total employment 10.7 12.9 7.6
Regular employment rate 59.2 58.0 61.0
Irregular employment rate 40.8 42.0 39.0

92
Share in satisfactory employment 73.7 76.1 70.4
Share in non-satisfactory employment 26.3 23.9 29.6
Informal employment rate 75.2 76.4 73.6
Involuntary part-time employment rate 13.9 13.5 14.4
Share of overeducated workers (in those with completed education) 17.5 18.8 15.7
Share of undereducated workers (in those with completed education) 18.3 19.5 16.7
Temporary employment rate 10.7 12.9 7.6
Share earning below-average wages (in own-account + employees) 54.3 52.7 56.5
Share earning above-average wages (in own-account + employees) 45.7 47.3 43.5
Flows (for transited, non-students)
Direct transition 31.4 35.3 25.6
From unemployment 28.6 26.8 31.3
From own-account work 1.6 1.2 2.3
From unpaid family work 1.3 1.4 1.1
From other employment 24.5 26.4 21.6
From inactivity 12.6 8.9 18.1

93
Annex II. Definitions of labour market statistics
1. The following units are defined according to the standards of the International Conference
of Labour Statisticians:
a. The employed include all persons of 15 years of age or more who during a week of
reference:
- worked for wage or profit (in cash or in kind) for at least one hour;
- were temporarily absent from work (because of illness, leave, studies, a break
of the activity of the firm, for example), but had a formal attachment to their
job;
- performed some work without pay for family gain.
b. The unemployed (strictly defined) include all persons of 15 years of age or more who
meet the following three conditions during the week of reference:
- They did not work (according to the abovementioned definition);
- They were actively searching for a job or took concrete action to start their own
business;
- They were available to start work within the two weeks following the reference
week.
c. Persons neither included in the employed nor in the unemployed category are
classified as not in the labour force (also known as inactive).
2. The International Classification of Status in Employment (ICSE) categorizes the employed
population on the basis of their explicit or implicit contract of employment, as follows:
a. Employees (also wage and salaried workers) are all those workers who hold the type
of jobs defined as “paid employment jobs”, where the incumbents hold explicit
(written or oral) or implicit employment contracts that give them a basic remuneration
that is not directly dependent upon the revenue of the unit for which they work.
b. Employers are those workers who, working on their own account or with one or a few
partners, hold the type of jobs defined as “self-employment jobs” (i.e. jobs where the
remuneration is directly dependent upon the profits derived from the goods and
services produced) and, in this capacity, have engaged, on a continuous basis, one or
more persons to work for them as employee(s).
c. Own-account workers are those who, working on their own account or with one or
more partners, hold the type of jobs defined as “self-employment jobs” and have not
engaged, on a continuous basis, any employees to work for them.
d. Contributing (unpaid) family workers are those who hold “self-employment jobs”
as own-account workers in a market-oriented establishment operated by a related
person living in the same household.
3. The employed are also classified by their main occupation, in accordance with the
International Standard Classification of Occupations (ISCO-08).
4. A household is a family or other community of persons living together and jointly
spending their income to satisfy the basic necessities of life. The concept of household
includes members present in the place where the household resides, as well as individuals
who are temporarily absent and living elsewhere, including abroad, for business, education
or other, as long as their residence in the foreign country does not exceed 1 year. A person
living alone can also qualify as a household (“single household”) if s/he does not already
94
belong to another unit. The single household can reside in a separate or shared apartment,
considered as an independent unit as long as the household’s income is not shared with
other residents. Collective households, such as prisons and institutions, and their members
are not observed in the Labour Force Survey.
5. The reporting period, to which the questions for the economic activity are related, is the
week before the week of interview (52 reporting weeks throughout the year).
6. The following units are also defined within the SWTS analysis but are outside the scope of
those defined within the international framework of labour market statistics mentioned in
item 1 above:
a. Relaxed unemployment – a person without work and available to work (relaxing the
jobseeking criteria of item 1b above).
b. Labour underutilization rate – the sum of shares of youth in irregular employment,
unemployed (relaxed definition) and youth neither in the labour force nor in
education/training (inactive non-students) as a percentage of the youth population.
c. Regular employment – the sum of employees with a contract (oral or written) of 12
months or more in duration and employers; the indicators are therefore a mix of
information on status in employment and contract situations.
d. Satisfactory employment – based on self-assessment of the jobholder; implies a job
that respondents consider to “fit” to their desired employment path at that moment in
time.
e. Stable employment – employees with a contract (oral or written) of 12 months or
more in duration.
f. Temporary employment – employees with a contract (oral or written) of less than 12
months in duration.

95
Annex III. Additional tables
The source of all tables is STATIN, SWTS Jamaica 2013.
Table A.1 Youth by relationship to head of household and sex
Relationship Female Male Total
Number % Number % Number %
Head 30 700 38.0 50 100 62.0 80 800 100.0
Spouse/partner 29 400 88.7 3 700 11.3 33 100 100.0
Son/daughter 195 200 48.8 205 200 51.2 400 400 100.0
Brother/sister 10 000 45.5 12 000 54.5 22 100 100.0
Parent 5 600 54.0 4 800 46.0 10 400 100.0
Other relative 89 800 49.2 92 700 50.8 182 500 100.0
Not related 15 800 59.3 10 900 40.7 26 700 100.0
Total 376 500 49.8 379 400 50.2 756 000 100.0
Table A.2 Youth by relationship to head of household and age group
Relationship
Age group
15–19 20–24 25–29 Total
Number % Number % Number % Number %
Head 3 100 3.9 21 900 27.1 55 700 69.0 80 800 100.0
Spouse/partner 1 400 4.1 13 400 40.5 18 300 55.3 33 100 100.0
Son/daughter 163 100 40.7 140 400 35.1 96 800 24.2 400 400 100.0
Brother/sister 6 400 28.8 9 000 40.9 6 700 30.4 22 100 100.0
Parent 5 600 54.0 4 100 39.4 700 6.6 10 400 100.0
Other relative 89 800 49.2 53 200 29.2 39 500 21.6 182 500 100.0
Not related 8 800 33.1 10 200 38.2 7 700 28.7 26 700 100.0
Total 278 200 36.8 252 200 33.4 225 400 29.8 756 000 100.0
Table A.3 Youth by marital status and sex
Female Male Total
Marital status Number % Number % Number %
Single/never married
332 900 88.1 349 200 91.8 682 000 89.9
Married 10 700 2.8 7 100 1.9 17 800 2.3
Common-law relationship
31 600 8.4 20 300 5.3 51 900 6.8
Other 2 900 0.8 3 600 1.0 6 600 0.9
Total 378 100 100.0 380 200 100.0 758 300 100.0
Table A.4 Youth by union status and age of first cohabitation
Marital status 15–19 20–24 25–29 Total
Number % Number % Number % Number %
Married 2 900 16.5 12 400 69.7 2 400 13.7 17 800 100.0
Common-law relationship
26 600 53.5 17 400 35.1 5 600 11.4 49 700 100.0
Other 0 0.0 900 75.6 300 24.4 1 200 100.0
Total 29 500 43.0 30 700 44.8 8 300 12.2 68 700 100.0
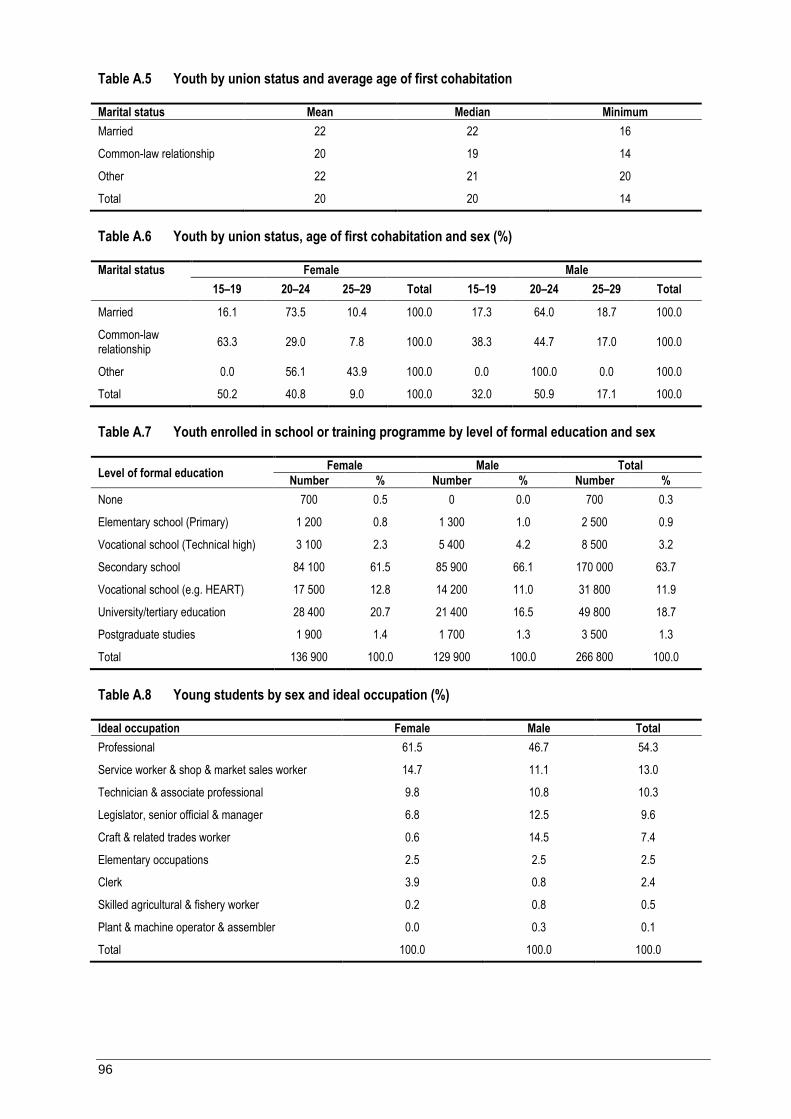
96
Table A.5 Youth by union status and average age of first cohabitation
Marital status Mean Median Minimum
Married 22 22 16
Common-law relationship 20 19 14
Other 22 21 20
Total 20 20 14
Table A.6 Youth by union status, age of first cohabitation and sex (%)
Marital status Female Male
15–19 20–24 25–29 Total 15–19 20–24 25–29 Total
Married 16.1 73.5 10.4 100.0 17.3 64.0 18.7 100.0
Common-law relationship
63.3 29.0 7.8 100.0 38.3 44.7 17.0 100.0
Other 0.0 56.1 43.9 100.0 0.0 100.0 0.0 100.0
Total 50.2 40.8 9.0 100.0 32.0 50.9 17.1 100.0
Table A.7 Youth enrolled in school or training programme by level of formal education and sex
Level of formal education Female Male Total
Number % Number % Number %
None 700 0.5 0 0.0 700 0.3
Elementary school (Primary) 1 200 0.8 1 300 1.0 2 500 0.9
Vocational school (Technical high) 3 100 2.3 5 400 4.2 8 500 3.2
Secondary school 84 100 61.5 85 900 66.1 170 000 63.7
Vocational school (e.g. HEART) 17 500 12.8 14 200 11.0 31 800 11.9
University/tertiary education 28 400 20.7 21 400 16.5 49 800 18.7
Postgraduate studies 1 900 1.4 1 700 1.3 3 500 1.3
Total 136 900 100.0 129 900 100.0 266 800 100.0
Table A.8 Young students by sex and ideal occupation (%)
Ideal occupation Female Male Total
Professional 61.5 46.7 54.3
Service worker & shop & market sales worker 14.7 11.1 13.0
Technician & associate professional 9.8 10.8 10.3
Legislator, senior official & manager 6.8 12.5 9.6
Craft & related trades worker 0.6 14.5 7.4
Elementary occupations 2.5 2.5 2.5
Clerk 3.9 0.8 2.4
Skilled agricultural & fishery worker 0.2 0.8 0.5
Plant & machine operator & assembler 0.0 0.3 0.1
Total 100.0 100.0 100.0

97
Table A.9 Young students by sex and desired employer (%)
Desired employer Female Male Total
Myself 22.6 30.7 26.5
Government 59.0 43.1 51.2
Private company 14.1 21.4 17.7
International or non-profit organization 4.3 4.3 4.3
Family business/farm 0.0 0.6 0.3
Do not wish to work 0.0 0.0 0.0
Total 100.0 100.0 100.0
Table A.10 Out-of-school youth by highest level of education completed
Level of education completed Number %
None 3 600 0.7
Elementary school (primary) 68 500 14.1
Vocational school (technical high) 20 800 4.3
Secondary school 260 000 53.5
Vocational school (e.g. Heart) 90 200 18.6
University/tertiary education 42 100 8.7
Postgraduate, postdoctoral studies 800 0.2
Total 486 000 100.0
Table A.11 Early school leavers by reason for ending education
Reason Number %
Failed examinations 1 400 1.1
Not interested in education/training 7 100 5.7
To start working 6 900 5.5
To get married 0 0.0
Parents against continuing/starting schooling 2 100 1.7
Economic reasons 56 900 45.1
No school nearby 0 0.0
Pregnancy 24 300 19.3
Other 27 400 21.7
Total 126 100 100.0
Table A.12 Youth by educational enrolment status and economic activity status
Economic activity status Enrolled Not enrolled Total
Number % Number % Number %
Economic activity status
Employed 41 100 15.4 261 200 53.2 302 300 39.9
Unemployed 18 400 6.9 130 600 26.6 149 000 19.6
Outside the labour force 207 800 77.7 99 400 20.2 307 200 40.5
Total 267 300 100.0 491 200 100.0 758 500 100.0
Economic activity status (relaxed)
Employed 41 100 15.4 261 200 53.2 302 300 39.9
Unemployed (relaxed) 50 800 19.0 195 600 39.8 246 300 32.5
Outside the labour force 175 400 65.6 34 400 7.0 209 800 27.7
Total 267 300 100.0 491 200 100.0 758 400 100.0
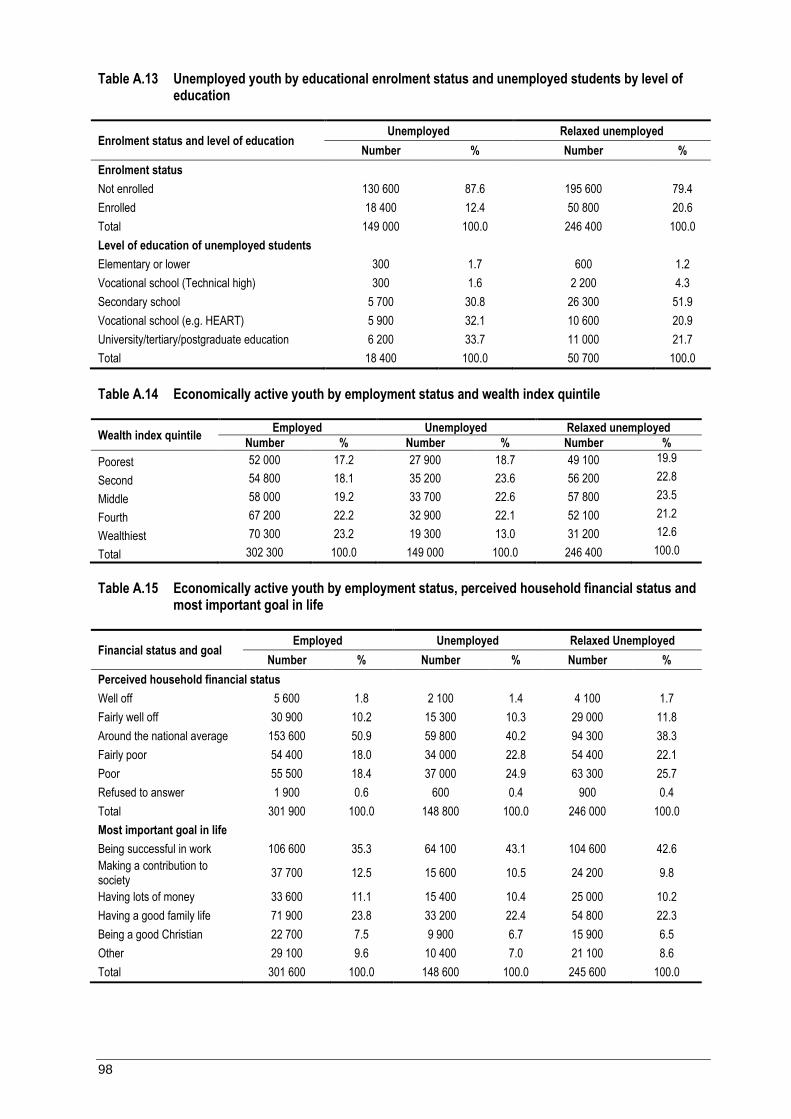
98
Table A.13 Unemployed youth by educational enrolment status and unemployed students by level of education
Enrolment status and level of education Unemployed Relaxed unemployed
Number % Number %
Enrolment status
Not enrolled 130 600 87.6 195 600 79.4
Enrolled 18 400 12.4 50 800 20.6
Total 149 000 100.0 246 400 100.0
Level of education of unemployed students
Elementary or lower 300 1.7 600 1.2
Vocational school (Technical high) 300 1.6 2 200 4.3
Secondary school 5 700 30.8 26 300 51.9
Vocational school (e.g. HEART) 5 900 32.1 10 600 20.9
University/tertiary/postgraduate education 6 200 33.7 11 000 21.7
Total 18 400 100.0 50 700 100.0
Table A.14 Economically active youth by employment status and wealth index quintile
Wealth index quintile Employed Unemployed Relaxed unemployed
Number % Number % Number %
Poorest 52 000 17.2 27 900 18.7 49 100 19.9
Second 54 800 18.1 35 200 23.6 56 200 22.8
Middle 58 000 19.2 33 700 22.6 57 800 23.5
Fourth 67 200 22.2 32 900 22.1 52 100 21.2
Wealthiest 70 300 23.2 19 300 13.0 31 200 12.6
Total 302 300 100.0 149 000 100.0 246 400 100.0
Table A.15 Economically active youth by employment status, perceived household financial status and most important goal in life
Financial status and goal Employed Unemployed Relaxed Unemployed
Number % Number % Number %
Perceived household financial status
Well off 5 600 1.8 2 100 1.4 4 100 1.7
Fairly well off 30 900 10.2 15 300 10.3 29 000 11.8
Around the national average 153 600 50.9 59 800 40.2 94 300 38.3
Fairly poor 54 400 18.0 34 000 22.8 54 400 22.1
Poor 55 500 18.4 37 000 24.9 63 300 25.7
Refused to answer 1 900 0.6 600 0.4 900 0.4
Total 301 900 100.0 148 800 100.0 246 000 100.0
Most important goal in life
Being successful in work 106 600 35.3 64 100 43.1 104 600 42.6
Making a contribution to society
37 700 12.5 15 600 10.5 24 200 9.8
Having lots of money 33 600 11.1 15 400 10.4 25 000 10.2
Having a good family life 71 900 23.8 33 200 22.4 54 800 22.3
Being a good Christian 22 700 7.5 9 900 6.7 15 900 6.5
Other 29 100 9.6 10 400 7.0 21 100 8.6
Total 301 600 100.0 148 600 100.0 245 600 100.0

99
Table A.16 Unemployed youth by sex, desire to work and main reason for not being available for work (%)
Desire to work and reason Female Male Total
Would have liked to work if there had been an opportunity to work last week
Yes 44.0 38.7 41.6
No 56.0 61.3 58.4
Total 100.0 100.0 100.0
Main reason for not being available/not wanting to work last week
Attending education/training 78.3 87.6 82.6
Family responsibilities or housework 8.6 1.9 5.5
Pregnancy 6.6 0.0 3.5
Illness, injury or disability 2.5 4.7 3.5
Too young to work 1.3 0.4 0.9
No desire to work 1.1 2.4 1.7
Off-season 0.3 0.7 0.5
Other 1.3 2.3 1.7
Total 100.0 100.0 100.0
Table A.17 Discouraged youth by sex and main reason for not seeking work or trying to start a business during the last 30 days
Reason Female Male Total
Number % Number % Number %
Awaiting the results of a vacancy competition or interview
2 000 2.8 300 0.5 2 300 1.9
Awaiting the season for work 1 200 1.7 1 800 3.5 3 100 2.5
Education leave or training 6 500 9.1 6 700 12.9 13 300 10.7
Personal family responsibilities 9 900 13.8 1 800 3.5 11 800 9.4
Pregnancy 4 500 6.3 0 0.0 4 500 3.6
Own illness/injury or disability 1 000 1.3 2 600 5.0 3 600 2.9
Do not know where or how to seek work 2 100 2.9 2 900 5.6 5 000 4.0
Unable to find work matching skills 5 300 7.4 3 000 5.8 8 400 6.7
Had looked for jobs before but had not found any 9 900 13.7 5 500 10.5 15 400 12.4
Too young to find a job 5 700 7.9 5 100 9.8 10 900 8.7
No jobs available in the area/district 5 400 7.5 4 900 9.3 10 300 8.3
Other 18 500 25.7 17 600 33.7 36 100 29.0
Total 72 000 100.0 52 200 100.0 124 700 100.0
Table A.18 Transited youth by reason for leaving first job and sex
Reason Female Male Total
Number % Number % Number %
For better job 5 400 11.9 12 900 20.1 18 300 16.7
Dismissed/let go 6 400 14.0 5 900 9.2 12 300 11.2
Unhappy with workplace 9 100 20.1 10 600 16.6 19 800 18.0
Temporary job ended 12 800 28.2 17 400 27.0 30 100 27.5
Health reasons 700 1.5 1 400 2.1 2 000 1.9
To have baby 3 100 6.8 0 0.0 3 100 2.8
To look after family 2 000 4.5 800 1.2 2 800 2.6
Moved from area 0 0.0 900 1.4 900 0.8
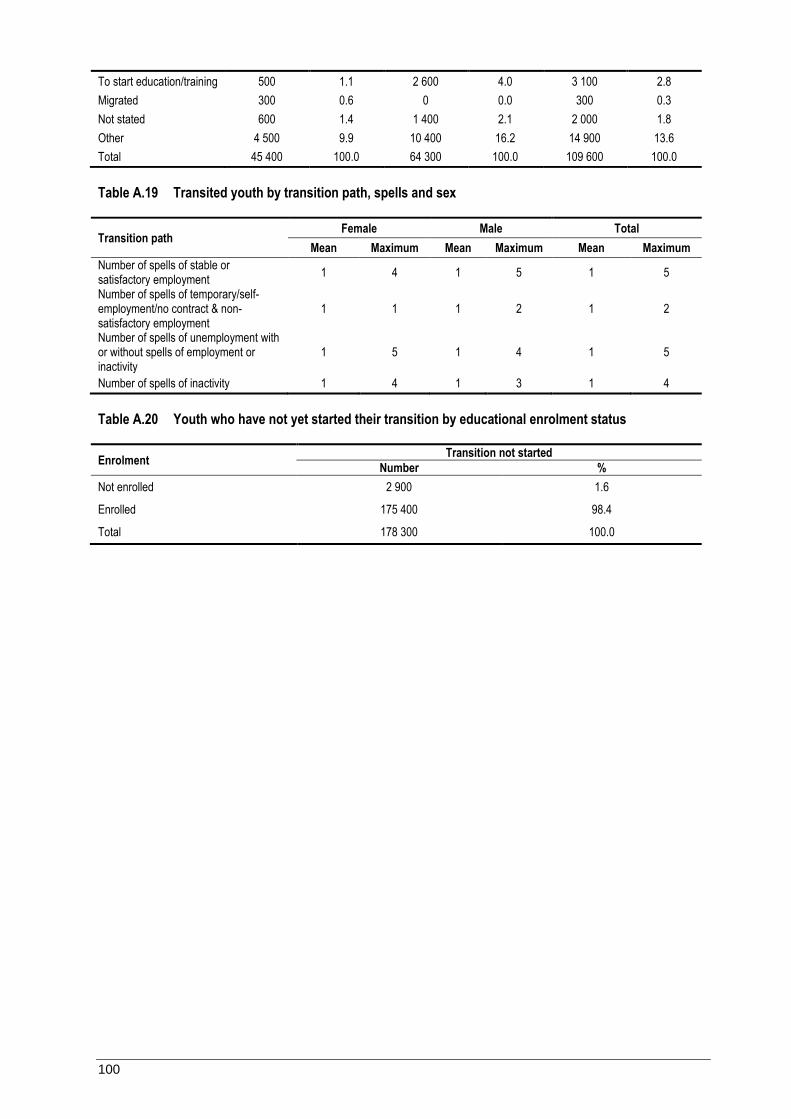
100
To start education/training 500 1.1 2 600 4.0 3 100 2.8
Migrated 300 0.6 0 0.0 300 0.3
Not stated 600 1.4 1 400 2.1 2 000 1.8
Other 4 500 9.9 10 400 16.2 14 900 13.6
Total 45 400 100.0 64 300 100.0 109 600 100.0
Table A.19 Transited youth by transition path, spells and sex
Transition path Female Male Total
Mean Maximum Mean Maximum Mean Maximum
Number of spells of stable or satisfactory employment
1 4 1 5 1 5
Number of spells of temporary/self-employment/no contract & non-satisfactory employment
1 1 1 2 1 2
Number of spells of unemployment with or without spells of employment or inactivity
1 5 1 4 1 5
Number of spells of inactivity 1 4 1 3 1 4
Table A.20 Youth who have not yet started their transition by educational enrolment status
Enrolment Transition not started
Number %
Not enrolled 2 900 1.6
Enrolled 175 400 98.4
Total 178 300 100.0
101
Annex IV. Persons involved in the survey
The Statistical Institute of Jamaica was the implementing agency for this survey. The successful
completion of the project was due to the dedication of the following persons:
PROJECT MANAGER:
Douglas Forbes
PROJECT COORDINATOR:
Leesha Delatie-Budair
DATA COLLECTION MANAGER :
Merville Anderson
DATA PROCESSING MANAGER:
Howard Hamilton
REPORT WRITERS:
Leesha Delatie-Budair, Kadi-Ann Hinds, Ophelia Moffatt, Hope Perkins, PIOJ
STEERING COMMITTEE:
Faith Innerarity (MLSS), Errol Miller (MLSS), Dawn Ellis-Francis (MLSS), Marva Ximinnies
(MLSS), Dorine Brooks (MLSS/ILO Country office), Steven Kerr (PIOJ), Kacia Hanson
(HEART Trust/NTA), Kevon Campbell (NCYD, Ministry of Youth), Dr. Michelle Meredith
(MOE), Alicia Knight (A.G.I.), Leesha Delatie-Budair (STATIN), Douglas Forbes (STATIN),
Ray Howell (JCTU)
FIELD SUPERVISORS:
Michael Dobson, Marion Porter, Elaine McLean, Christine Reid, Marie Chin, Howard Bennett, Dorret
Allen, Adeisha Gaye-Welsh, Wayne Small, Coral Maturah-Brown
INTERVIEWERS:
Carrifa Henry, Shenay Salmon, Cecelia Deer, Sidion Lewis, Icilda Campbell, Juleen Morrison,
Kenneth Rodney, Kerry-Ann Johnson, Millicent Bennett, Divena Findlay, Norma Surgeon,
Maxine Johnson, Tomeisha Litchmore, Andrea Myrie, Angella Morsby, Christine Gayle,
Diana Henry, Shannamar Chambers, Nicole Thomas, Andrea Stewart, Queen-Ann Smith,
Claudeth Francis-Morgan, Odeen Stewart, Petrina Williams-Hanna, Tarasha Kerr, Jillian
Burton, Albertina Lyons, Kayreida Hamilton, Venasa Walker, Natasha Squire, Brenda Reid,
Nordan Gilbert, Sashana Nephew, Sandra Johnson, Amoy Maragh, Shanique Tulloch, Lisa
Williams-James, Oliver McIntyre
TRAINERS:
Hope Perkins, Phyllis Wilks, Samuel Indalmanie, Ieesha Graham-MsIntosh, Julian Walters,
Donovan Davis, Kadi-Ann Hinds, Cary Renford
DATA PROCESSING SUPERVISOR:
Avery Gaynor
DATA ENTRY OPERATORS/EDITOR/CODERS:
Shameir Wahrman, Denise Barnett, Janice DaCosta, Alexia Francis, Latoya Hutchinson,
Marlon McPherson, Donna Salmon

This report presents the highlights of the 2013 School-to-work Transition Survey (SWTS) run together with the Statistical Institute of Jamaica (STATIN) within the framework of the ILO Work4Youth Project. This Project is a five-year partnership between the ILO and The MasterCard Foundation that aims to promote decent work opportunities for young men and women through knowledge and action. The W4Y Publication Series is designed to disseminate data and analyses from the SWTS administered by the ILO in 28 countries covering five regions of the world. The SWTS is a unique survey instrument that generates relevant labour market information on young people aged 15 to 29 years. The survey captures longitudinal information on transitions within the labour market, thus providing evidence of the increasingly tentative and indirect paths to decent and productive employment that today’s young men and women face.
The W4Y Publications Series covers national reports, with main survey findings and details on current national policy interventions in the area of youth employment, and regional synthesis reports that highlight regional patterns in youth labour market transitions and distinctions in national policy frameworks.
For more information, visit our website: www.ilo.org/w4yYouth Employment Programme4 route des MorillonsCH-1211 Genève 22Switzerland [email protected] ISSN 2309-6780
Lab
ou
r ma
rket tra
nsitio
ns o
f you
ng w
om
en a
nd m
en in
Jam
aica
iLo