labour productivity in auckland firms · labour productivity in auckland firms david c. maré...
TRANSCRIPT

Labour Productivity in Auckland Firms
David C. Maré
Ministry of Economic Development Occasional Paper 08/09
ISBN: 978-0-478-31696-4 (HTML) ISBN: 978-0-478-31697-1 (PDF)
August 2008

Ministry of Economic Development Occasional Paper 08/09
Labour Productivity in Auckland Firms
Date: August 2008
Author: David C. Maré (Motu Economic & Public Policy Research)
Acknowledgements
Funding from the Ministry of Economic Development is gratefully acknowledged.
This paper also contributes to Motu’s Infrastructure programme funded by the
Foundation for Research Science and Technology (FRST grant MOTU0601). We
thank FRST for their funding. Thanks to the IBULDD team at Statistics New Zealand,
and to the staff at the Data Laboratory. Thanks especially to Richard Fabling for his
constructive comments throughout this project, on a wide range of conceptual and
technical issues, and in particular for helping me understand the Prototype
Longitudinal Business Database. Thanks also to Andrew Coleman, Arthur Grimes,
Geoff Lewis, Phil McCann, Bettina Schaer and seminar participants at MED and at
the Cross-government productivity workshop for useful and stimulating comments.
Contact: [email protected]

Disclaimer
Access to the data used in this study was provided by Statistics NZ in accordance
with security and confidentiality provisions of the Statistics Act 1975. Only people
authorised by the Statistics Act 1975 are allowed to see data about a particular,
business or organisation. The results in this paper have been confidentialised to
protect individual businesses from identification. The results are based in part on tax
data supplied by Inland Revenue to Statistics NZ under the Tax Administration Act
1994. This tax data must be used only for statistical purposes, and no individual
information is published or disclosed in any other form, or provided back to Inland
Revenue for administrative or regulatory purposes. Any person who had access to
the unit-record data has certified that they have been shown, have read and have
understood section 81 of the Tax Administration Act 1994, which relates to privacy
and confidentiality. Any discussion of data limitations or weaknesses is not related to
the data's ability to support Inland Revenue's core operational requirements. Any
table or other material in this report may be reproduced and published without further
licence, provided that it does not purport to be published under government authority
and that acknowledgement is made of this source.
The views, opinions, findings, and conclusions or recommendations expressed in this
Occasional Paper are strictly those of the author(s). They do not necessarily reflect
the views of the Ministry of Economic Development, Statistics New Zealand, or any
other agencies to which the authors are affiliated. The Ministry takes no responsibility
for any errors or omissions in, or for the correctness of, the information contained in
these occasional papers. The paper is presented not as policy, but with a view to
inform and stimulate wider debate.

Abstract
This paper examines labour productivity in Auckland, New Zealand’s largest city,
using microdata from Statistics New Zealand’s Prototype Longitudinal Business
Database. It documents a sizeable productivity premium in Auckland, around half of
which is due to industry composition. There is a cross sectional correlation between
productivity and employment density, reflecting differences in both physical
productivity and prices. This correlation is evident both within Auckland, and
comparing Auckland with other areas. The relationship between changes in density
and changes in productivity is less strong. The relationship between productivity and
overall or own-industry employment density varies across industries, suggesting that
the nature and extent of agglomeration benefits varies. Overall, localisation effects
appear stronger than urbanisation, with productivity being more strongly related to
own-industry density than to overall density.
JEL Classification: L25; R12; R3
Keywords: Labour productivity; urban premium; agglomeration

Executive Summary
This paper examines the average labour productivity of firms in Auckland, using firm-
level microdata from Statistics New Zealand’s prototype Longitudinal Business
Database. It analyses Auckland’s performance relative to other areas of New
Zealand, and the relative performance of different areas within Auckland. It assesses
the potential influence of industry composition and patterns of employment density in
accounting for the observed patterns.
Auckland’s productivity premium
Labour productivity is measured as value added per worker, which is 30 to 50 percent
higher in Auckland region than in regions outside Auckland. The premium is even
higher for Auckland CBD (120 to 150 percent higher). Industry composition
differences account for about half of Auckland’s higher labour productivity. The
remaining premium reflects a combination of technical efficiency (producing more with
the same inputs), allocative efficiency (receiving higher output prices or paying lower
input prices), and unmeasured inputs (e.g.: capital intensity, labour quality).
Density and productivity
Areas where employment density is higher have higher labour productivity (elasticity
of 0.06 to 0.09). This is true when comparing Auckland with other areas, and when
comparing areas within Auckland. However, changes in employment density over
time do not appear to be associated with changes in labour productivity, weakening
the case for a causal relationship.
Localisation and urbanisation
The paper examines whether the positive correlation between labour productivity and
employment density is stronger when firms are surrounded by other firms in their own
industry (localisation), or reflect more generalised benefits of density (urbanisation).
Both appear important, with localisation effects being on average stronger.
Industries that are most concentrated within Auckland and most over-represented in
Auckland have the highest productivity premium from operating in Auckland (33%).
However, even firms in industries that are neither over-represented in Auckland nor

atypically concentrated within Auckland have productivity that is 23% higher than their
non-Auckland counterparts.

Table of Contents
Abstract ...................................................................................................................... i Executive Summary ................................................................................................. ii
Auckland’s productivity premium.............................................................................. ii Density and productivity ........................................................................................... ii Localisation and urbanisation................................................................................... ii
Table of Contents .................................................................................................... iv
List of Figures........................................................................................................... v
List of Tables ............................................................................................................ v
1 Introduction ....................................................................................................... 1
2 Auckland’s Economic Performance ................................................................ 2
3 Cities and Labour Productivity ........................................................................ 5
3.1 Price effects ................................................................................................. 7
4 Data..................................................................................................................... 8
4.1 Firm performance by location..................................................................... 11 4.2 Adjusting for differences in industry composition ....................................... 12
5 Results ............................................................................................................. 13
5.1 Auckland’s relative productivity .................................................................. 13 5.2 The geography of Auckland productivity .................................................... 18
5.2.1 Productivity and density ....................................................................... 20 5.3 Localisation and urbanisation..................................................................... 27
6 Summary and Future Directions .................................................................... 35
References .............................................................................................................. 38
Appendix A Auckland Urban Area in Context...................................................... 43
Appendix B The Allocation of Value-added Within Enterprise-groups.............. 45
Appendix C Map of Auckland Urban Area............................................................ 48
Appendix D 2000 v 2006 Maps............................................................................... 49
Appendix E Comparison with Statistics New Zealand’s regional GDP Figures 51
Appendix F Industry Tables (grouped 2-digit)................................................. 54

List of Figures
Figure 1 Productivity of Auckland TAs, compared with other Regional Council Areas (2006)........................................................................................................ 16
Figure 2 Changes in (adjusted) relative productivity of Auckland TAs 2000-2006.... 18 Figure 3 Geographic Variation in Productivity within Auckland (2006) ..................... 19 Figure 4 Productivity and Density across Regions and Auckland TAs (2006).......... 22 Figure 5 Relationship between Effective Density and Labour productivity ............... 24 Figure 6 Geographic Variation in Productivity Change within Auckland (2000 - 2006)
.................................................................................................................. 26 Figure 7 Relative Auckland Productivity and Presence in Auckland - within industries
(2006)........................................................................................................ 28 Figure 8 Presence in Auckland and Concentration within Auckland - by 2-digit
industry (2006) .......................................................................................... 29
List of Tables
Table 1 The Auckland Productivity Premium 2000-2006.......................................... 15 Table 2 Employment Density within Auckland 2000-2006 (jobs per square kilometre)
.................................................................................................................. 20 Table 3 Density and Labour Productivity - Regression estimates across Regional
Councils and Auckland Territorial Authorities............................................ 23 Table 4 Effective Density and Labour Productivity - Regression estimates within
Auckland ................................................................................................... 25 Table 5 Grouped industries – descriptive statistics ................................................. 30 Table 6 Grouped industries – Auckland Premium and Density elasticities (2006) .. 32

1
Labour Productivity in Auckland Firms
1 Introduction
Auckland is New Zealand’s largest and most densely populated city. Auckland
region accounts for 33% of national employment, 40% of value added in the
economy, and occupies only 2% of New Zealand’s land area. Labour productivity
and wages in Auckland region are also higher than in other areas of the country.
Wages are around 7% higher,1 average personal income is around 15% higher2 and
average labour productivity is around 45% higher.
At the aggregate level, labour productivity measures combine two different concepts:
technical efficiency, a measure of how many goods or services a person can produce,
and allocative efficiency, a measure of the value of the goods and services that are
produced. Auckland’s average labour productivity may be higher for various reasons.
First, Auckland firms may produce a larger amount of goods and services per worker,
either because they use more non-labour inputs (e.g. capital or urban infrastructure)
or because they are more efficient at transforming inputs into outputs. A second
potential reason for Auckland’s labour productivity advantage is that firms may be
able to obtain a higher price for the outputs that they produce. Third, Auckland may
have a disproportionately high share of its employment involved in industries or
activities for which labour productivity would be high in any location (composition
effect). The current paper does not fully distinguish between these sources of labour
productivity differentials. It does, however, analyse the contribution of differing
industry composition, and presents industry-specific analyses that suggest a diversity
of causes of Auckland’s productivity premium.
1 Statistics New Zealand (2007a) reports a 4.6% hourly earnings premium for Auckland relative to the national average (including Auckland). Auckland accounts for around 33% of employment, which implies a 7% premium relative to areas outside Auckland. 2 Author’s calculations, using 2006 Census data and assigning income bands to midpoints.

2
The main objective of this paper is to document the extent and nature of Auckland’s
productivity premium, using a unique firm-level dataset, Statistics New Zealand’s
prototype Longitudinal Business Database (LBD). In particular, we examine labour
productivity differences between the seven territorial authorities within greater
Auckland and between the 370 census area units, gauging the extent to which
productivity differences can be accounted for by differences in industry composition.
We examine the relationship between labour productivity and employment density as
one broad indicator of possible agglomeration effects, and examine productivity
premia for industries with differing spatial distributions to provide evidence on the
presence of both localisation and urbanisation advantages.3 Finally, we present
maps of productivity across Auckland, as a first step towards investigating spatial
(agglomeration, networks, and infrastructure) explanations of Auckland’s
performance.
2 Auckland’s Economic Performance
It is unsurprising that Auckland’s productivity and economic performance is higher
than elsewhere in New Zealand. There is a clear positive relationship between urban
density and good economic performance the world over – a relationship that is
captured in the phrase ‘agglomeration effects’. The causes of these effects are,
however, still the subject of much research and debate. Recent reviews of the
theoretical foundations of agglomeration effects (Duranton and Puga (2004)) and
empirical evidence (Rosenthal and Strange (2004)) draw attention to the wide range
of potential mechanisms through which agglomeration effects can operate, and the
many different dimensions of economic performance that are subject to
agglomeration economies.
As New Zealand’s largest and densest city, Auckland should be expected to perform
well. In addition, recent public discussions have emphasised the role that Auckland
is expected to play in raising New Zealand’s overall economic performance. There is
a widely accepted perception that Auckland is not reaping the benefits that it should
from agglomeration, and that it is consequently not delivering the economy-wide
3 Localisation advantages describe advantages that accrue to a firm from locating in areas where there is a high density of same-industry employment. Urbanisation advantages refer to the advantages of locating in large dense and diverse areas.

3
dividends that are expected of it, as illustrated in the following text from the Ministry
of Economic Development’s Strategy and Priorities for economic development:
“International evidence highlights the importance of having at least one outward facing, global city to lead a nation's economic development. A globally competitive city attracts world-class firms and highly skilled workers, which have significant flow-on effects throughout the economy. The concentration of activity will allow both employers and employees to benefit from specialised labour markets, allow for greater tacit knowledge flows between and within firms and research organisations, and provide the right platform for growing off a critical mass of innovation. Auckland doesn't yet play this role to the extent that major cities do in other economies.”
Ministry of Economic Development (2008)
The evidence for Auckland’s underperformance as a city is mixed. On many
indicators, Auckland is performing well relative to other regions of New Zealand, and
even relative to other cities internationally. Lewis and Stillman (2005) compare
Auckland’s labour market performance with that of other regions and conclude that
“. . . Auckland appears to be a relatively good performer and this is consistent with
agglomeration economies being at work in New Zealand’s largest urban
concentration.” For international comparisons, Ministry of Economic Development
(2007) presents a range of indicators, showing Auckland’s relatively good
performance in areas such as quality of living, employment rate, population growth,
and broadband penetration. Two prominent exceptions are Auckland’s relatively
poor productivity (GDP per capita) level, and low proportion of population with tertiary
qualifications.
A challenge for any comparison of Auckland with international cities is the choice of
comparators. Ideally, comparison should be made with cities that are of similar size
and density, and that fill a similar position in the national or larger regional urban
settlement system. Auckland’s size and employment density are similar to a mid-
sized US city4, although comparable cities are part of a denser network of similar
sized and larger cities.
4 The most similar US Urbanized areas are San Antonio TX, Riverside-San Bernadino CA, Columbus OH, Jacksonville FL, Orlando FL, Providence RI-MA and Memphis TN-MS-AR, all of which have employment in the 430,000 – 580,000 range and land area in the 1,030 to 1,300 square km range, compared with Auckland Urban Area’s employment and area of 556,000 and 1,074 square km. See Appendix A.

4
New Zealand has a relatively high degree of urbanisation, with 86 percent of the
population living in urban areas, compared with 74 percent (in 2005) in ‘more
developed’ countries.5 The proportion of New Zealand’s urban population that is
located in the Auckland urban area (“urban primacy”), at around 34 percent, is
somewhat high for a developed country, although Henderson (2000) classifies New
Zealand as having “satisfactory urban concentration”.6 Auckland’s place within the
New Zealand or Australasian city-size distribution roughly fits the rank-size rule
(Zipf’s Law) found in most urban systems (Soo (2005) Gabaix (1999a)), or is slightly
larger than predicted by this relationship.7
A priori, there appears to be little evidence that Auckland is significantly under-sized,
or that agglomeration effects are abnormally weak in Auckland, given the structure of
the urban settlement system of which it is a part. Nevertheless, as suggested by the
quotation above, national and regional economic development policies have
emphasised the need to promote the concentration of economic activity in Auckland,
and the operation of agglomeration economies. It is clearly envisaged that there will
be productivity gains through thicker labour markets, innovation and knowledge flows
that will raise not only Auckland’s economic performance but also that of New
Zealand as a whole.
The argument that raising concentration in Auckland could plausibly raise New
Zealand’s economic performance has been eloquently asserted in a range of policy
and discussion documents (e.g.: Skilling (2006), Auckland Regional Council (2007),
Metro Project (2007) Committee for Auckland (2006)), although the presentation is
often more aspirational and motivational than it is evidence-based, which may reflect
the severe challenges of getting clear evidence on the future potential for Auckland.
5 “More developed regions” comprise all regions of Europe plus Northern America, Australia/New Zealand and Japan. This is the definition used in United Nations (2008). 6 Data are from United Nations (2008) and Statistics New Zealand (2005). The NZ urban population includes all “cities, boroughs, town districts, townships and country towns with population of 1,000 or more”. Definitions for other countries vary but are broadly consistent. Urban primacy is based on urban agglomerations of 750,000 or more. For an international comparison of primacy, see also Appendix Table 1 in Junius (1997), which uses data from a previous edition of United Nations (2008). 7 The slope of the rank-size relationship is flatter for Australasian cities than it is in many other countries, suggesting that Australasian cities are unusually highly concentrated. The two largest Australasian cities (Sydney and Melbourne) are of similar size, whereas Zipf’s Law would predict that one of them would be considerably larger – about twice its current size (see Appendix A). Gabaix (1999b) discusses a range of factors that influence the slope, and notes that the slope “allows us to get information about the archaeology of the growth processes [across cities]”. Including New Zealand and Australian cities in the same ranking does not necessarily imply integration of the two economies but serves merely to indicate the relative size of Auckland and other New Zealand cities.

5
Much progress has been made in developing a region-wide strategy and action plan
for promoting Auckland’s economic development (Metro Project (2007), Auckland
Regional Council (2008))8.
Against this background of a broad acceptance of the potential for stronger
agglomeration economies in Auckland, and a practical commitment to actively
promoting Auckland’s growth, the objective of the current paper is to contribute to the
evidence base on the strength and nature of agglomeration effects in Auckland and
on patterns within Auckland.
Existing studies have analysed proximate indicators of productivity in Auckland, such
as land prices (Grimes and Liang (2007)) and wages (Lewis and Stillman (2005),
Paling et al (2007)). Few studies have looked directly at firm productivity measures
as is done in the current paper. An exception is Maré and Timmins (2006), which
looked at the overall relationship between concentration and firm productivity within
New Zealand using a related data source, without a particular focus on Auckland.
3 Cities and Labour Productivity
It is well established that average productivity is higher in cities than in non-urban
areas although there is still debate on the reasons for this advantage. Rosenthal and
Strange (2004) summarise empirical evidence on the nature and sources of
agglomeration effects that may give rise to urban productivity premia and Duranton
and Puga (2004) survey the range of theories that have been used to provide
microfoundations for agglomeration effects.
Duranton and Puga (2004) identify three sets of agglomeration mechanisms - sharing,
matching, and learning. Sharing includes the use of indivisible inputs such as
infrastructure, the advantages of greater variety and specialisation, and risk-sharing.
Matching covers improved matching between firms, between inputs and outputs,
including the advantages of better matching through thick labour markets, and
between suppliers and customers. Finally, learning includes a range of mechanisms
that enhance knowledge generation, diffusion and accumulation.
8 The action plan is organised around the 5 objectives of “Take effective and efficient action to transform Auckland’s economy; Develop world-class infrastructure and world-class urban centres; Transform Auckland into a world-class destination; Develop a skilled and responsive labour force; and Increase Auckland’s business innovation and export strength” Metro Project (2007).

6
The strength and scope of each of these mechanisms will vary across industries.
Rosenthal and Strange (2004) document three dimensions along which the strength
of agglomeration effects can vary – industry ‘closeness’, geographic proximity, and
time lags. The term ‘localisation’ is commonly used to capture agglomeration effects
that result from interactions between firms in the same industry, whereas
‘urbanisation’ refers to the broader set of effects that result from urban scale and
diversity.
A commonly used summary indicator of the presence and strength of agglomeration
effects is the positive relationship between employment density and productivity.
While many theories of agglomeration suggest that density can lead to higher
productivity, it is also possible that density is a consequence of productivity
advantages. Cross-sectionally, such a relationship may arise due to the presence of
local productive inputs (e.g., a harbour).
This distinction is important for the analysis of policies that seek to increase density
as a means of improving productivity, since such policies depend on density being a
driver of productivity change. It is difficult to distinguish the differing sources of the
density-productivity relationship from cross-sectional data alone. For instance,
Ellison and Glaeser (1999)’s finding that “there remain a number of highly
geographically concentrated industries in which interfirm spillovers seem important”
is based on the low explanatory power of measurable ‘natural advantages’ in
accounting for the concentration of industry employment across US states. Patterns
of change over time are able to provide further insights into the potential for changes
in density to raise productivity – do new firms choose to locate disproportionately in
already dense areas? Are closures more likely in less dense areas? Are changes in
density in an area associated with changes in productivity? Examining the dynamics
of the density-productivity relationship for different industries can also provide
guidance on the plausibility of different agglomeration explanations of productivity
performance.
In the current paper, we document the cross-sectional (2006) relationship between
density and productivity at two spatial scales – first between regions and Territorial
Authorities, and second between area units within Auckland. We also investigate the
covariation of density and productivity within areas across time by means of fixed
effects and change regressions. A positive relationship over time is consistent with

7
either agglomeration effects or the response of employment density to product
demand shocks. A negative relationship may arise due to congestion effects, or due
to labour supply shocks that lower average labour productivity.
In order to shed light on the relative importance of localisation and urbanisation
effects, we estimate, for selected groups of industries, the elasticity of productivity
with respect to overall employment density and own-industry density.
3.1 Price effects
Our measure of labour productivity is ‘value added per worker’, where value added is
the value of a firm’s output less the value of non-durable intermediate inputs used in
production. Excluded from intermediate inputs are compensation of employees,
consumption of fixed capital (depreciation), and net indirect taxes. For a firm to be
indifferent between locating in Auckland and elsewhere, value added would have to
be higher in Auckland to cover the higher cost of labour and of property capital.9 The
firm is able to achieve the necessary higher value added if agglomeration effects lead
to higher output for the same level of inputs, due to any of the agglomeration
mechanisms outlined above. Alternatively, value added may be higher in Auckland if
firms are able to charge a higher price for their output or if they can secure
intermediate inputs at lower prices. A higher value added per worker may also arise
if Auckland firms use more capital per worker than non-Auckland firms.
A measured labour productivity premium in Auckland is likely to reflect a combination
of these factors – higher physical or technical productivity, higher output prices, and
possibly lower input prices or unit costs, and higher capital to labour ratios. Average
labour productivity measures will also be influenced by the composition of
employment. Average labour productivity in Auckland will be higher if Auckland has
a higher proportion of firms in industries or performing functions (e.g.: head office
functions) that would be more productive wherever they are located.
It is not the purpose of this paper to distinguish fully between these sources of
productivity differentials. It does, however, analyse the contribution of industry
composition, and presents industry-specific analyses that suggest a diversity of
9 At the firm level, property rental is included as intermediate consumption but the return to property capital for owners of property is not, and so will lead to higher measured Value Added.

8
causes of Auckland’s productivity premium. Analysis of the impact of differing capital
intensity and of local prices remain as priorities for future research.
4 Data
The primary dataset for this study is Statistics New Zealand’s prototype Longitudinal
Business Database (LBD). The data were accessed in the Statistics New Zealand
Data Laboratory under conditions designed to give effect to the security and
confidentiality provisions of the Statistics Act 1975. The core of the LBD dataset is
the Longitudinal Business Frame (LBF), which provides longitudinal information on all
businesses in the Statistics New Zealand Business Frame since 1999, combined with
information from the tax administration system. The LBF population includes all
economically significant businesses.10
The LBF contains information at both the enterprise level and the plant level. At any
point in time, an enterprise will contain one or more plants, and each plant will belong
to only one enterprise. Plants are assigned a ‘permanent business number’ (PBN)
that identifies them longitudinally. The longitudinal links are established through the
application of a number of continuity rules that allow PBNs to be linked even if they
change enterprises or tax identifier (Seyb (2003), Statistics New Zealand (2006)).
The LBF provides monthly snapshots of an enterprise’s industry, institutional sector,
business type, geographic location, and employee count. 11 For PBNs, there is
monthly information on industry, location, and employee count. We apply an
enterprise’s industry to all plants within the enterprise, which will lead to some
imprecision in the estimation of and adjustment for industry productivity differentials.
The LBD is a research database that includes the LBF as well as a range of
administrative and survey data that can be linked to the LBF. The primary unit of
observation in the LBD is an enterprise observed in a particular year. The current
study uses business demographic information from the LBF, linked with financial
performance measures (from the Annual Enterprise Survey, and various tax returns,
including IR10s and the GST-sourced Business Activity Indicator data), and
10 A business is economically significant if it a) has annual Goods and Services Tax (GST) turnover of greater than $30,000; or b) has paid employees; or c) is part of an enterprise group; or d) is part of a GST group; or e) has more than $40,000 income reported on tax form IR10; or f) has a positive annual GST turnover and has a geographic unit classified to agriculture or forestry. 11 Institutional sector distinguishes Producer Enterprise; Financial Intermediaries; General Government; Private not-for-profit serving households; households; and rest of the world.

9
measures of labour input (working proprietor counts from IR10 forms, and employee
counts for PBNs from PAYE (pay-as-you-earn income tax) returns as included in the
Linked Employer-Employee Dataset (LEED).
Labour productivity is measured as current-price value added per worker.12 The
primary source used to obtain a value added measure is the Annual Enterprise
Survey (AES). The AES is a postal sample survey, supplemented with administrative
data from tax sources. We use postal returns from AES to provide annual value
added for the firm-specified financial year. This information is available for around
10% of enterprises, which are disproportionately larger firms, accounting for around
50% of total employment in New Zealand.
Where AES information is not available, we use a proxy for value added, based on
net sales as reported in GST returns, adjusted for changes in stocks. A measure of
stock adjustment is taken from IR10 tax forms, and where this is unavailable, the
change in stocks is imputed from the ratio of stock change to sales within each 3-digit
ANZSIC industry.
The GST information comes from Statistics New Zealand’s Business Activity
Indicator data. In some cases, GST returns are provided for groups of enterprises, or
at lower than monthly frequency. In the BAI data, GST return information is allocated
to enterprises within groups, and if necessary across time to derive a monthly track.
In the current study, we aggregate BAI-sourced value added to group level, to reduce
possible measurement error in value added per worker estimates arising from the
allocation of group returns to enterprises operating in different locations. Within each
group, we deduct value added as measured in AES postal returns from the group’s
aggregate BAI value added, and allocate this residual value added to non-AES-
reporting enterprises in proportion to enterprise labour input, which has the effect of
masking some labour productivity differences across enterprises.13
12 Changes over time in current price value added will reflect both quantity and price changes. The use of double deflation to isolate quantity adjustment over time at the industry level is possible using the Statistics New Zealand PPI input and output indices but only for a selection of 1-digit and 2-digit industries. Measures of productivity premia for Auckland firms within the same industry will reflect both quantity and relative price differences. Spatial price indices are not available for the separate identification of quantity differences. 13 This aggregation is currently applied to all enterprises belonging to a group. It may be possible to identify groups for which BAI has allocated group returns, and restrict aggregation to those groups only. This would reduce the extent to which productivity differences within groups are masked.

10
A measure of monthly labour input is calculated for each PBN as the sum of rolling
mean employment (RME) and a share of working proprietor input in the enterprises
to which the PBN belongs. RME is the average number of employees on the PBN’s
monthly PAYE return in the 12 months of the enterprise’s financial year, as recorded
in the LEED data. PAYE information is not always provided at the PBN level, and in
LEED, there is some allocation of PAYE information to PBNs as outlined in Seyb
(2003). The annual number of working proprietors in each enterprise is available in
the LEED data, based on tax return information. Labour input from working
proprietors is allocated to the PBNs within each enterprise in proportion to the PBN’s
RME. Where an enterprise has only working proprietors, the working proprietor input
is allocated equally across all component PBNs. There is a large number of PBNs in
each year for which RME is zero. Labour productivity is undefined for these PBNs
unless working proprietor information is also incorporated in labour input. Using
working proprietor information increases the number of plants with usable labour
productivity information by 80 to 100 percent, and increases labour input by 13 to 20
percent.14
For each year from 1999/2000 to 2005/06 (referred to as 2000 to 2006 respectively
for the remainder of the paper), we select plants that belong to an enterprise that: a)
is always private-for-profit ; b) is never a household or located overseas; c) has non-
missing industry information; and d) is not in the ‘Government Administration and
Defence’ industry.15
We exclude plants for which location (area unit, territorial authority, or regional
council) information is missing, and plants in area units outside territorial authorities
(island and inlets). In order to maintain a consistent population that can support
geographic tabulations and maps later in the paper while protecting confidentiality,
14 The increases due to working proprietor inclusion decrease monotonically over time. The contribution to the number of plants (to labour input) are 103% (20%) in 2000, and 79% (13%) in 2006. The impacts are particularly pronounced in single-PBN enterprises that do not belong to an enterprise group. In 2006, the impacts were 101% (24%) and in 2000 they were 142% (37%). There will be some double counting of working proprietors if they also draw PAYE earnings, as they will also appear in the rme employee count. 15 Formally, these restrictions refer to a) business type 1-6 (individual proprietorship, partnership, limited liability company, co-operative company, joint venture and consortia, branches of companies incorporated overseas); b) Institutional Sector is never ‘household’ or ‘located overseas’ and ANZSIC industry is not Q97 (Households employing staff); c) ANZSIC division M.

11
some additional exclusions16 are applied. Finally, we drop observations where labour
input is zero, and about half of one percent of plant observations where the absolute
value of value added per worker is greater than $1m.
4.1 Firm performance by location
The geographic location of economic activity is better captured by the location of
PBNs than by the location of enterprises. However, value added is available only for
enterprises. An estimate of firm performance by geographic location is obtained by
allocating enterprise value added to PBNs in proportion to the PBNs labour input.
This approach constrains value added per worker to be constant within enterprises,
reducing measured geographic differences in productivity. Where enterprise value
added is obtained from BAI group returns, the averaging is more severe, constraining
labour productivity to be constant for all PBNs in non-AES-reporting enterprises.
The allocation of enterprise or group value added to PBNs is complicated by the fact
that, within a financial year, a PBN may belong to more than one enterprise, and an
enterprise may belong to more than one group. Appendix B summarises the
treatment of such cases.
To control for the impact of averaging, mean productivity by location is derived from
an employment-weighted regression of labour productivity on a set of location share
covariates. Average value added per worker (VAPW) within a group (s) is the
employment-weighted average of location-specific value added per worker. Because
we know the employment share of each group that is in each location, we can
statistically recover the underlying location-specific VAPW, using the following
regression specification.
(1) stareasj st
sjtjst e
rmerme
VAPW +⎥⎦
⎤⎢⎣
⎡= ∑
=
γ
The subscript s here refers to a set of plants over which value added per worker has
been averaged. The term in brackets captures, for each area j, the proportion of
employment in s that is located in area j. If each group operated in only one location,
16 Specifically, we exclude Area Units in the Chatham Islands, the Middlemore Area Unit in Auckland (521902), and six Auckland Area Units that are tidal, inlets or islands (615900, 616001, 617102, 617702, 617903, 617604). Tidal areas of Waiheke Island (AU 520804) are grouped with Waiheke Island itself.

12
this would be equivalent to including a dummy variable for each location. The
resulting estimated coefficients γj are estimates of the underlying mean productivities
in each location. The term est captures idiosyncratic productivity in the set of plants s
beyond what can be explained by average productivities in the locations in which the
plants operate. Equation (1) is estimated separately by year.
4.2 Adjusting for differences in industry composition
Some of the differences in productivity across areas may be due to the different mix
of industries in different areas. To gauge the significance of such industry
composition differences, we also calculate an alternative set of estimated locational
premia based on a regression similar to that shown in equation (1), but including a
set of 3-digit industry dummies.
(2) sjtst j k st
j areas k industryst
rmeVAPW e
rmeγ δ
= =
⎡ ⎤= + +⎢ ⎥
⎣ ⎦∑ ∑%
The equation again contains a full set of share covariates. The added industry
intercepts (δk) are estimated relative to national means and thus have zero mean,
allowing the estimated jγ% coefficients to capture the level of local productivity that
would be observed if each location had the national industry mix. The adjustment
removes the influence of cross-industry differences such as capital or energy
intensity and identifies geographic productivity premia solely from within-industry
variation across locations. Equation (2) is estimated separately by year.
Having obtained estimates of average labour productivity within each area, we
calculate the relative performance of Auckland or of areas within Auckland by
dividing the area’s average labour productivity ( jγ% ) by labour productivity averaged
over all areas outside the Auckland region.
This approach can be extended to adjust for other plant-level differences that may
influence productivity, although in the current paper, industry composition is the only
adjustment made.

13
5 Results
The results in this section shed light on four main questions about the labour
productivity of Auckland firms:
• How much higher is the productivity of Auckland firms compared with non-
Auckland firms?
• How much of the productivity premium is accounted for by the mix of
industries in Auckland?
• How does labour productivity vary within Auckland?
• What is the relationship between labour productivity and the density of overall
and own-industry employment?
In addressing each of these questions, we focus primarily on the patterns for the
most recent year for which we have data – 2006. In addition, we report on patterns
of change over the 2000-2006 period.
5.1 Auckland’s relative productivity
Average labour productivity in the Auckland central business district (CBD17) is more
than twice as high as average labour productivity outside the Auckland Region.
Auckland City as a whole, which accounts for around one sixth of New Zealand’s
labour input, has a premium of 50 to 80 percent. The broader Auckland Region has
a productivity premium of roughly 30 to 50 percent, and accounts for a third of
national labour input.18 The Auckland Urban Area19 contains the densest areas of
the Auckland Region and accounts for most of the Auckland Region’s employment
and output, showing a productivity premium 5 to 10 percentage points above that of
the region as a whole.
For each of the four definitions of Auckland, Table 1 presents the average labour
productivity, in nominal dollars, and as a proportion of average labour productivity in
the rest of New Zealand (excluding Auckland region). The table shows that the 17 The Auckland CBD is here defined as the area contained in the following six (2006) Area Units: 514100-Freemans Bay; 514101-Auckland Harbourside; 514102-Auckland Central West; 514103-Auckland Central East; 514200-Newton; and 514301-Grafton West. This is also the definition used in the Auckland City Council’s Growth Strategy (Auckland City Council (2003)). 18 These productivity premia are significantly larger than premia estimated from regional GDP estimates and business demography statistics. See Appendix E. 19 For a map of the Auckland Urban Area, see Appendix C.

14
relative size of the productivity premia for the different definitions of Auckland has
been maintained throughout the 2000 – 2006 period of the study, despite fluctuation
from year to year, and a peak in 2004. In general, productivity in the four areas
moves together, suggesting that the fluctuations are due either to changes in areas
outside Auckland, or to Auckland-wide movements. The year-to-year changes in the
level of value added per worker should be interpreted with caution as they reflect
both price and quantity movements. Movements in the relative measures, however,
are unaffected by aggregate price changes, although they will incorporate location-
specific price and quantity variation.
Similar patterns of relative productivity are evident at various quantiles of the
productivity distribution. Median productivity is generally between 70 and 80 percent
of average productivity and quantile ratios (e.g.: P90/P50 or P50/P10) are similar
across cities, Territorial Authorities (TA) and regions.20
20 Waitakere and North Shore are slight exceptions. The ratio of area median to non-Auckland median for these cities is slightly higher than the ratio of averages, due to slightly less skewed productivity distributions – these cities have a slightly less pronounced upper tail of very high productivity firms.

15
Table 1 The Auckland Productivity Premium 2000-2006 2000 2001 2002 2003 2004 2005 2006
New Zealand (area= 268,680,km2)New Zealand Average VAPW $42,516 $43,212 $45,865 $45,818 $47,389 $49,675 $52,037Non-Auckland VAPW $37,596 $38,731 $41,523 $39,890 $40,452 $43,009 $45,440Ind-adjusted Non-Akld VAPW $39,665 $40,312 $43,339 $42,486 $43,313 $45,546 $48,126Aggregate labour input 1,554,910 1,618,970 1,642,140 1,672,480 1,717,560 1,762,650 1,782,920 Employment Density (per km2) 5.8 6.1 6.2 6.3 6.4 6.6 6.7 Observations (plants) 344,718 346,683 339,331 362,267 363,267 363,286 353,385
Auckland Region (area=4,993 km2)Average VAPW $52,685 $52,438 $54,932 $58,127 $61,551 $63,193 $65,375 - relative to non-Akld 140% 135% 132% 146% 152% 147% 144%Ind-adjusted VAPW $48,408 $49,182 $51,139 $52,736 $55,711 $58,049 $59,944 - relative to non-Akld 122% 122% 118% 124% 129% 127% 125%Labour Input 507,060 529,280 531,710 543,640 564,710 582,120 589,990 Share of labour input 33% 33% 32% 33% 33% 33% 33%Employment Density (per km2) 102 106 106 109 113 117 118
Auckland Urban Area (area=1,074 km2)Average VAPW $55,520 $55,016 $57,776 $61,111 $64,488 $66,057 $68,435 - relative to non-Akld 148% 142% 139% 153% 159% 154% 151%Ind-adjusted VAPW $50,449 $51,223 $53,161 $54,598 $57,744 $60,046 $61,943 - relative to non-Akld 134% 132% 128% 137% 143% 140% 136%Labour Input 476,880 498,214 499,812 511,192 531,173 548,122 556,286 Share of labour input 31% 31% 30% 31% 31% 31% 31%Employment Density (per km2) 444 464 465 476 495 510 518
Auckland City (area=620 km2)Average VAPW $61,456 $58,864 $63,744 $67,854 $72,666 $74,624 $76,930 - relative to non-Akld 163% 152% 154% 170% 180% 174% 169%Ind-adjusted VAPW $53,861 $53,175 $56,529 $58,825 $62,733 $65,228 $66,836 - relative to non-Akld 136% 132% 130% 138% 145% 143% 139%Labour Input 245,180 260,500 258,050 264,630 272,330 279,680 283,610 Share of labour input 16% 16% 16% 16% 16% 16% 16%Employment Density (per km2) 395 420 416 427 439 451 457
Auckland CBD (area=5.8 km2)Average VAPW $90,966 $82,603 $92,272 $94,178 $101,951 $105,002 $106,873 - relative to non-Akld 246% 217% 226% 240% 256% 248% 239%Ind-adjusted VAPW $67,363 $65,332 $72,308 $72,026 $78,468 $80,025 $81,638 - relative to non-Akld 172% 165% 169% 171% 183% 178% 172%Labour Input 66,050 73,670 72,850 73,420 73,920 76,010 78,650 Share of labour input 4% 5% 4% 4% 4% 4% 4%Employment Density (per km2) 11,408 12,724 12,582 12,680 12,767 13,128 13,584
Notes: VAPW is current-price Value Added Per Worker, as defined in the text. Relative VAPW is the area's VAPW relative to the average VAPW for areas outside the Auckland region.
As suggested by the difference between the Auckland CBD and Auckland Region
productivity premia, there is productivity variation between different areas within
Auckland. Figure 1 shows, for 2006, the relative performance of the seven different
TA areas within Auckland, together with Regional Council Areas including Auckland.

16
Two of the Auckland TAs (Papakura and Franklin) are pooled together, as are some
of the RC areas.21
Of the areas within Auckland, Auckland and Manukau Cities have the highest relative
productivity, of 169% and 139% respectively. In contrast, both Waitakere (88%) and
Rodney (84%) have lower average productivity than the non-Auckland average.
Auckland region overall is the region with the highest average productivity (144%),
followed by Taranaki (134%) and Wellington (134%).
Figure 1 Productivity of Auckland TAs, compared with other Regional Council Areas (2006)
0%20%40%60%80%
100%120%140%160%180%
Gis
born
e
Haw
kes
Bay
Nel
son/
Mar
l/Tas
man
/Wes
tCoa
st
Nor
thla
nd
RO
DN
EY D
ISTR
ICT
Man
awat
u-W
anga
nui R
egio
n
WA
ITA
KER
E C
ITY
Ota
go R
egio
n
Bay
of P
lent
y
Sout
hlan
d R
egio
n
Can
terb
ury
Reg
ion
Wai
kato
NO
RTH
SH
OR
E C
ITY
PAPA
KU
RA
&FR
AN
KLI
N
Wel
lingt
on R
egio
n
Tara
naki
Reg
ion
Auc
klan
d R
EGIO
N
MA
NU
KA
U C
ITY
AU
CK
LAN
D C
ITY
Labo
ur P
rodu
ctiv
ity(r
elat
ive
to n
on-A
uckl
and
)
Unadjusted premium
Adjusted for Industry Composition
An alternative measure of productivity and the productivity premia is also presented
in Figure 1 and Table 1, adjusting for differences in industry composition, as
discussed in section 4.2. The flatter line in Figure 1 shows the relative productivity
profile for 2006, adjusted for differences in industry composition. Part of the reason
that Auckland’s productivity is high is that Auckland has a relatively high share of
21 These groupings were chosen to allow the release of industry by area tables while still meeting the requirement to protect confidentiality.

17
industries that have high average productivity nationally. Industry composition is a
significant contributor to Taranaki’s high average productivity. Taranaki’s unadjusted
relative productivity of 134 percent is reduced to just 106 percent once adjustment is
made for the over-representation of high productivity industries – mainly in the
combined Mining and Quarrying / Electricity, Gas and Water groups.
The adjusted figures in Table 1 show that differences in industry composition account
for about 45 percent of Auckland’s unadjusted productivity premium, although even
the adjusted premia are substantial. The 2006 Auckland CBD premium is reduced
from 139 percent to 72 percent, and the premium for the Auckland Region is reduced
from 44 percent to 25 percent. Auckland Region accounts for 33 percent of national
labour input, but has disproportionately large shares of employment in Wholesale
Trade (49%), Communication Services (48%), Finance and Insurance (46%),
Education (46%), Property and Business Services (42%), and Cultural and
Recreational Services (42%). Auckland shares of Agriculture (6%) and
Mining/Electricity, Gas and Water (9%) are low. The productivity premium that
remains after controlling for industry composition must result from the fact that there
is an Auckland productivity premium within at least some industries. An analysis of
productivity premia by 2-digit industry is presented in section 5.3.
Table 1 showed the time pattern of relative productivity for Auckland City from 2000
to 2006. In Figure 2, we show the trends for each of the Auckland TAs. The ranking
remains stable with the exception of Papakura/ Franklin, which overtook North Shore
in 2003. Auckland also appears to have experienced particularly strong growth in
relative productivity between 2002 and 2004.

18
Figure 2 Changes in (adjusted) relative productivity of Auckland TAs 2000-2006
70%
80%
90%
100%
110%
120%
130%
140%
150%
2000 2001 2002 2003 2004 2005 2006
Labo
ur P
rodu
ctiv
ity
(Rel
ativ
e to
non
-Auc
klan
d)
Auckland
Manukau
North Shore
Papakura/Franklin
Rodney
Waitakere
Note: Relative productivity has been adjusted for differences in industry composition.
5.2 The geography of Auckland productivity
This section provides a more detailed account of productivity variation within
Auckland than is shown in Figure 2. Within each of the TAs shown in Figure 2 there
are distinct zones of high and low productivity. The upper panel of Figure 3 is a
shaded map (choropleth) of selected area units within the Auckland region, shaded
to reflect relative labour productivity levels in 2006.22
22 Labour productivity has been spatially smoothed using Euclidean distance and an Epanechnikov kernel with a bandwidth of 2km. For purely presentational reasons, the map excludes some Northern Area Units within Rodney District, including Warkworth. The broad spatial patterns are persistent over time – Appendix D compares maps for 2000 and 2006.

19
Figure 3 Geographic Variation in Productivity within Auckland (2006)
$58.2 - $141$49.0 - $58.2$43.3 - $49.0$6.7 - $43.3
(thousands of dollars)
2006 - Adj VAPW
1,476 - 18,675762 - 1,476358 - 7620.2 - 358
(Employment per sq.km)
2006 - Density
Rodney
Waitakere
Franklin
Manukau
Papakura
North Shore
Auckland City
Rodney
Waitakere
Franklin
Manukau
Papakura
North Shore
Auckland City

20
Auckland City’s high labour productivity reflects three high productivity zones –
Auckland Central, extending southwest through to Mt Roskill; southern suburbs
including Ellerslie, Panmure and Onehunga; and also Avondale. Manukau City’s
high productivity zones are broadly spread through the central and western parts of
the city, including Otahuhu in the north, through Mangere, Wiri and Manurewa.
Whitford (Turanga area unit) also shows up on the map as a high-productivity zone,
although it has low employment density and only around 500 jobs in any year. The
highest productivity areas in North Shore City are in Northcote and Birkenhead –
across the Harbour Bridge from Auckland Central, around Albany, and in the low
density area of Okura and Long Bay in the north of North Shore City. The remaining
TAs within Auckland Region have relatively small zones of high productivity – around
central Papakura in Papakura District, around Glenbrook in Franklin District, and
around Silverdale in Rodney District.
5.2.1 Productivity and density
One of the key differences between Auckland and the rest of New Zealand, and one
that is frequently cited as a likely factor in Auckland’s productivity premium is the
density of employment. Overall in 2006, New Zealand had 6.7 jobs per square
kilometre. Auckland Region had 119 jobs per square kilometre (See Table 2).
Table 2 Employment Density within Auckland 2000-2006 (jobs per square kilometre)
year 2000 2001 2002 2003 2004 2005 2006
Auckland City 424 450 446 457 471 483 490 (excluding islands) 1586 1686 1668 1711 1759 1806 1832 Auckland City Islands 5 5 5 6 6 6 6 North Shore City 546 557 566 594 628 651 658 Manukau City 168 176 181 178 187 195 201 Papakura District 128 128 130 138 143 148 146 Waitakere City 119 120 120 124 128 132 132 Franklin District 18 18 18 18 19 19 19 Rodney District 11 11 11 12 12 13 13 Auckland Region 102 107 107 110 114 118 119

21
Surprisingly, the TA with the highest employment density is not Auckland City, but
North Shore City. This is, however, due to the inclusion of low-employment-density
offshore islands in Auckland City. Table 2 presents separate employment density
measures for Auckland City including and excluding the offshore islands. If the
offshore islands are excluded, Auckland City has the highest employment density, of
1832 jobs. Manukau City had the second highest labour productivity but ranked only
third on employment density – partly because over half of Manukau’s land area lies in
two large low-density area units (Clevedon and Kawakawa-Orere). The exclusion of
offshore islands from Auckland City has virtually no impact on average labour
productivity, as less than 1 percent of Auckland’s employment is offshore.
Productivity and Density variation between Regions
Figure 4 shows a positive cross-sectional relationship between employment density
and labour productivity for the Regional Council groupings used in Figure 1, where
labour productivity is measured as the log of average labour productivity for the
geographic area. The positive relationship is quantified in the first column of Table 3.
The coefficient of 0.062 implies that an area with density twice as high as the
average will have productivity that is 6.2% higher than average.23 The relationship is
statistically significant and similar in size to the range of estimates summarised by
Graham (2005b).
23 If offshore Islands are excluded from Auckland City, the estimated slope in the first column drops to 0.055.

22
Figure 4 Productivity and Density across Regions and Auckland TAs (2006)
Akld City
Waitakere
North Shore
Rodney
Papakura/Franklin
ManukauAUCKLAND REGION
WELLINGTON REGION
10.6
10.7
10.8
10.9
1111
.1lo
g V
AP
W -
%in
d3 c
ontro
ls
0 2 4 6log Density
Note: The size of symbols is proportional to average employment levels within each area. Shaded symbols are for Auckland TAs. Other symbols are for Regional Council groupings.
The fixed effects estimate in the second column of Table 3 reflects the relationship
between density and labour productivity for a given area over time. The relationship
is no longer significant and the coefficient estimate is negative, suggesting a weak
tendency of increased density to be associated with lowered productivity. The strong
cross-sectional relationship is more closely related to regional differences that were
relatively stable over the seven years of our sample, and not to changes over time
within areas. It may also be that random fluctuations within the seven years of our
sample period mask agglomeration dynamics that operate over longer timeframes.

23
Table 3 Density and Labour Productivity - Regression estimates across Regional Councils and Auckland Territorial Authorities
Dependent Var: ln(VAPW)
Least Squares Area Fixed Effects
First Difference
Six-year Difference
ln(empl density) 0.062 -0.049 -0.262 -0.299 (0.004)** (0.184) (0.270) (0.320) Year intercepts Yes Yes Yes Yes Observations 126 126 108 18 R-squared 0.72 0.82 0.27 0.05 Notes: All regressions are weighted by mean area employment. Each observation is for a combination of year and geographic area (Auckland TAs and non-Auckland RCs). Standard errors in parentheses. * significant at 5%; ** significant at 1%.
Productivity and Density variation within Auckland
The relationship between density and labour productivity is somewhat different when
we look across different areas within Auckland. Within the denser central areas of
Auckland City and Manukau, there is a noticeable correspondence between area
units with high relative productivity and those with high employment density. The
visual similarity is evident by comparing the two panels of Figure 3. The relationship
is shown graphically in Figure 5, which plots the log of area average productivity
against the log of area ‘effective employment density’. Effective density is a
geographically smoothed measure of density. Smoothing is desirable when
examining employment density for area units as it accounts for the influence of
nearby dense area units. Specifically, we use the Graham (2005b) effective density
measure which is calculated using the following formula:
(3) .i j
ji
j iji
EEEff DensdA π
≠
= +∑
where Ei is the employment in area unit i; Ai is the land area of area unit i; and dij is
the distance in km between area units i and j. Panel (a) of Figure 5 shows a clear
positive relationship.
To quantify the elasticity of productivity with respect to density across area units, we
estimate the relationship between the log of average labour productivity and log
effective density, using the same approach as used in Table 3 for cross-regional
analysis. The results are reported in Table 4. The first column reports the estimate

24
from weighted least squares estimation (weighting area units by their mean
employment level), controlling for year effects. The coefficient of 0.086 implies that
an area with employment density that is twice as high as that of another area has
value added per worker that is 8.6% higher.
Figure 5 Relationship between Effective Density and Labour productivity (a) Level of Density and Level of Labour Productivity
910
1112
13lo
g V
AP
W -
%in
d3 c
ontro
ls
10 15 20log Eff.Density
(b) Area Fixed Effects relationship (Partial Regression Plot)
-1.5
-1-.5
0.5
1lo
g V
APW
- %
ind3
con
trols
-1 -.5 0 .5 1log Eff.Dens
(c) Changes in Density and Changes in Labour Productivity
-2-1
01
26-
yr c
h lo
g V
AP
W -
%in
d3 c
ontro
ls
-1 0 1 2 36-yr change in log Eff.Density
Notes: Each circle represents an area unit within Auckland. The size of the circles is proportional to the level of employment in each area unit.
The relationship is identified both from cross sectional variation (areas with higher
productivity also have higher density) and from within-area time variation (when
productivity increases in an area, so does density). As noted above, the cross
sectional relationship reflects a spatial equilibrium pattern, as well as a possible
functional relationship between density and productivity. A tighter test of the link
between density and productivity is obtained by examining within-area time variation
alone. The second column of Table 4 presents such an estimate, obtained from fixed
effects estimation. For a given area unit, productivity and density increase together,
with a doubling of density associated with productivity that is 5.4% higher – still a

25
sizeable positive relationship, although the precision of the estimate is considerable
smaller, as reflected in the tenfold increase in the standard error. A graphical
representation of this fixed effect relationship is shown in panel (b) of Figure 5.
Table 4 Effective Density and Labour Productivity - Regression estimates within Auckland
Dependent Var: ln(VAPW)
Least Squares Area Fixed Effects
First Difference
Six-year Difference
ln(Eff. density) 0.086 0.054 0.024 -0.008 (0.002)** (0.019)** (0.033) (0.034) Year intercepts Yes Yes Yes Yes Observations 2579 2579 2206 368 R-squared 0.45 0.27 0.01 0.00 Notes: All regressions are weighted by mean area employment. Each observation is for a combination of year and Area Unit within Auckland. Standard errors in parentheses. * significant at 5%; ** significant at 1%.
The third column of Table 4 reports estimates of the relationship between year-to-
year changes in productivity and year-to-year changes in density. The relationship
becomes statistically insignificant, with a coefficient of 0.024. Similarly, changes in
density and productivity between the first and last periods of the sample period are
not strongly related as shown in the final column of the table. Maps of the six-year
changes are shown in Figure 6 and a corresponding graph is shown in panel (c) of
Figure 5.
The implication of these patterns is that, within Auckland, firms in denser areas are
on average more productive, but that increasing density is not necessarily associated
with an increase in productivity. The significant fixed effect estimate is consistent
with a positive association between density and productivity, although the lack of a
significant relationship in the first difference and six-year difference specifications
lessens the support for this inference, and suggests the need for a fuller examination
of the dynamics of this relationship.

26
Figure 6 Geographic Variation in Productivity Change within Auckland (2000 - 2006)
0.33 - 0.920.24 - 0.330.17 - 0.24-2.37 - 0.17
Change in ln(Adj VAPW): 2000 - 2006
Rodney
Waitakere
Franklin
Manukau
Papakura
North Shore
Auckland City
0.42 - 2.300.28 - 0.420.16 - 0.28-0.65 - 0.16
Change in log Eff.Density: 2000-2006
Rodney
Waitakere
Franklin
Manukau
Papakura
North Shore
Auckland City

27
5.3 Localisation and urbanisation
The relationship between density and labour productivity is a coarse summary
measure that may mask variation in the importance of density across different
industries, and in the nature of agglomeration mechanisms that operate in different
industries. To shed light on the size and nature of agglomeration effects for different
industries, this section provides a more detailed industry-level examination of the
relationship between labour productivity and employment density, distinguishing the
relative importance of own-industry employment density (localisation).
Figure 7 plots, for Auckland Region, each industry’s relative productivity against an
index of the industry’s prevalence in Auckland. 24 Relative productivity within
industries is measured as the difference between the log of average industry
productivity in Auckland and that in areas outside Auckland Region. The data are for
2006 although the patterns for other years are very similar.
Relative productivity is highest for the Motion Picture Radio and TV Services industry
(P91). This industry in Auckland is more than 3 times as productive as the same
industry outside Auckland. Furthermore, Auckland has a disproportionate share of
this industry. Other industries that are over-represented in Auckland also tend to
have high relative productivity, albeit to a more modest extent. Overall, the upward
sloping regression line shows the generally positive relationship between industries’
prevalence in Auckland and the size of their Auckland productivity premium,
consistent with positive selection of industries – the industries that benefit most from
being in Auckland disproportionately locate there.
24 The Auckland productivity premium is measured as a log-difference – mean productivity is calculated for each industry both within and outside Auckland. Each mean is logged and the Auckland/non-Auckland difference calculated. The ‘prevalence’ index used is the locational quotient (LQ), which expresses the proportion of the industry’s employment that is in Auckland as a ratio to the proportion of all employment that is in Auckland. A value of 1 indicates that the industry is as prevalent in Auckland as it is nationally.

28
Figure 7 Relative Auckland Productivity and Presence in Auckland - within industries (2006)
Film, Radio, TV
Pers&HH gds W/saleTransp Serv
Food&Bev Mfrg
Wood & Paper
Forest&Log
Serv to Agric
Comm Fish
Agric
Mining&Quarry
Petrochem
01
23
Rel
ativ
e La
bour
Pro
duct
ivity
0 .5 1 1.5 2Presence in Auckland (LQ)
Note: The size of the plotting symbols is proportional to the level of Auckland employment in each industry. The fitted regression line is based on an employment-weighted regression.
Industry prevalence in Auckland is one dimension of industry location patterns but
industries also vary in their location patterns within Auckland. We summarise the
degree of geographic concentration within Auckland for each industry using a
Maurel-Sedillot index (MS) (Maurel and Sedillot (1999)). The MS index is an
estimator of the degree of correlation in firms’ location decisions and is defined as:
(4)
2 2
21
1
i ii i
ii
s xH
xMS
H
−−
−=
−
∑ ∑∑
where si is the proportion of an industry’s employment in area unit i; xi is the
proportion of total employment that is in area unit i; and H is a Herfindahl index of
industrial concentration across plants.25 A high value of the index indicates that
25 For the derivation and interpretation of this index, see Maurel and Sedillot (1999) and Maré (2005).

29
industry employment is concentrated in particular area units, consistent with
localisation.
Figure 8 arranges industries according to their presence in Auckland (LQ) and their
concentration within Auckland (MS). Industries have been divided into five groups,
reflecting different spatial configurations.26 About 40 percent of employment is in
industries that are neither significantly over- nor under-represented in Auckland (LQ
of around 1), and are distributed within Auckland roughly in proportion to total
employment (MS of around 0). This group of industries is labelled ‘Dispersed’ and
comprises mainly industries providing local goods and services. There is a ‘non-
Auckland’ group of industries that are less prevalent in Auckland than elsewhere,
which account for 6% of Auckland’s employment. These are industries that are
linked to the primary sector.
Figure 8 Presence in Auckland and Concentration within Auckland - by 2-digit industry (2006)
Non-Akld (6%)
Very Localised (8%)
Dispersed
Urbanised (6%)
Localised (40%)
Food
Wood&Paper
Agr ic
ForestFishing
AgrServ
Mining/EGW
Sport&Rec
Storage
ServToTransport
Air&RailWater Transport
Serv to FinIns
Fin & Insurance
Pers W/s
FilmRadioTVMach&MV mfrg
PetroChem
Mach&Equip mfrg
Metal mfrgNon-Metal
Mat w/s Communic ServBusServOthMfrg
EducPublish
LibrariesOthServ
Textile
AccomCafeMV ServRoad Transp
Pers Good retailPers ServFood retail
CommunityServHealthServConstructionConstrServ
(40%)
0.0
5.1
.15
Con
cent
ratio
n w
ithin
Auc
klan
d (M
S)
0 .5 1 1.5 2Presence in Auckland (LQ)
Notes: The size of plotting symbols is proportional to employment in each industry. The numbers in brackets show the percent of Auckland’s employment accounted for by each group.
26 A full list of industries in each group is shown in Appendix F with a range of descriptive statistics for each industry.

30
Industries that are disproportionately located in Auckland are divided into three
groups, reflecting high, medium, and low levels of geographic concentration within
Auckland. The first of these groups, labelled ‘Urbanised’ is dispersed throughout
Auckland in proportion to overall employment, with a value of MS in the same range
as for the ‘dispersed’ group. This group accounts for 6 percent of Auckland
employment. The second group, labelled ‘Localised’, accounts for 40 percent of
employment and is moderately concentrated within Auckland. The remaining 8
percent of employment is in the ‘Very Localised’ group, for which employment is
highly concentrated within Auckland. Transport and storage industries and Finance
and Insurance are represented in this group, as is the ‘Sport and recreation’ industry.
Table 5 contains group-level summary statistics on group employment, number of
enterprises, group employment, average labour productivity, and the employment
weighted averages for the MS and LQ indices. The grouping of industries based on
prevalence and concentration is somewhat arbitrary, but serves to separate
industries into groups that are potentially affected by different forms of agglomeration
effects.
Table 5 Grouped industries – descriptive statistics
# Plants
Employment (rme)
Mean ln(VAPW)
Mean Concentration
within Auckland (MS)
Mean Presence
in Auckland
(LQ)
Mean ln(Effective
density)
Mean ln(Own-industry Effective density)
Non-Akld 5,770 36,540 $75,530 0.022 0.50 10.79 7.14 Dispersed 52,180 236,500 $39,908 -0.002 0.93 11.11 7.93 Urbanised 4,700 33,640 $43,439 0.006 1.29 11.30 7.18 Localised 39,500 239,160 $74,274 0.018 1.38 11.29 8.65 V. Localised 4,860 44,200 $128,754 0.085 1.38 11.48 7.77
Notes: Appendix F contains a version of Table 5 and Table 6 for 2-digit industries. Enterprise and Employment counts have been rounded. Variables are described in the text.
It is plausible, for instance, that the geographic concentration of the ‘very localised’
industries is related to possible within-industry benefits of sharing, matching or
learning. In contrast, the ‘dispersed’ industries are located in proportion to overall
employment, suggesting no particular advantage to being in Auckland or to being
localised.

31
To investigate how the differing spatial configurations are related to productivity
performance, we examine within-industry variation in productivity for each of the
groups, comparing Auckland firms to those outside Auckland, and comparing firms in
different parts of Auckland. Table 6 presents evidence on the Auckland productivity
premium accruing to industries in each group. It also shows the relationship between
labour productivity and overall employment density, and between labour productivity
and own-industry employment density.
The first column of Table 6 reports the average relative labour productivity premium
for industries in each group. These estimates are obtained from a regression as
shown in equation (2), where j takes on only two values – Auckland Region, and all
other areas. The inclusion of industry dummies absorbs the productivity differences
between industries, so the reported estimates show the employment-weighted within-
industry premium.
The highest premium (33.3%) is observed for the ‘Very Localised’ group, which
contains industries that are highly concentrated within Auckland and also over-
represented in Auckland. Industries in the ‘Localised’ group, which are also
concentrated in Auckland, also have a relatively high Auckland premium (28.0%).
Urbanised and Dispersed industries have somewhat lower premia of 18% to 23%.
The non-Auckland industries, which are relatively highly concentrated within
Auckland, have an average premium of 26.5%, although there is a lot of variation
across industries, from a low of –61% to a high of 125%.
Almost all industries are more productive in Auckland than elsewhere. Only 3
industries are more productive outside Auckland – ‘Agriculture’, ‘Mining and
Quarrying’, and ‘Petrol Coal Chemical & Assoc Prod Mfg’. Almost 80 percent of
Auckland employment is in industries with a premium greater than 15 percent, with
40 percent in the 15% to 25% range. The widespread nature of productivity premia
within Auckland is consistent both with urbanisation and with Auckland-wide price
effects. It is not clear from the observed patterns the extent to which an industry’s
presence in Auckland raises technical efficiency, or to which the productivity
advantage reflects allocative efficiency.

32
Table 6 Grouped industries – Auckland Premium and Density elasticities (2006)
(1) (2) (3)
Auckland Premium (log
difference)
Effective density
Elasticity
Effective density
Elasticity
Own-industry Effective Density
Elasticity Non-Akld 1.265 ** 0.287 ** 0.656 ** 0.825 ** (0.03) (0.08) (0.10) (0.13) Dispersed 1.225 ** 0.236 ** 0.276 ** 0.570 ** (0.01) (0.02) (0.02) (0.06) Urbanised 1.185 ** 0.160 ** 0.132 ** 0.194 * (0.03) (0.04) (0.04) (0.11) Localised 1.280 ** 0.514 ** 0.337 ** 0.804 ** (0.01) (0.02) (0.02) (0.05) V. Localised 1.333 ** 0.663 ** 0.106 1.115 ** (0.03) (0.05) (0.07) (0.10) Notes: **: 5% significance. *: 10% significance. Each row contains estimates from three separate regressions. The dependent variable in each is the log of VAPW. Appendix F contains a version of Table 5 and Table 6 for 2-digit industries.
To gauge the evidence for density-related explanations of the high relative
productivity of Auckland firms, we examine whether labour productivity is higher for
firms in denser parts of Auckland, compared with less dense parts of Auckland.
Specifically, we run the following regression
(5)
( ) ( )( )
1
2
ln ln
ln
gk g
gk
k gkk industry
VAPW Effective Density
Own-industry Effective Density
e
β
β
δ=
=
+
+ +∑
where VAPWgk is the average labour productivity of workers in industry k working in
area unit g. Effective density is as defined in equation (3). Own-industry effective
density is calculated using the same method but using only own-industry employment.
The log specification means that β1 and β2 can be interpreted as the elasticities of
average local productivity for an industry with respect to effective density and own-
industry effective density respectively. The inclusion of industry intercepts ensures
that these elasticities are identified from spatial variation within industries, and do not
reflect between-industry differences.
The means of the density measures are shown in Table 5. Firms in ‘Very localised’
industries have the highest average effective employment density. Urbanised and

33
Localised industries have similar effective densities, implying that they are exposed
to a similar degree of urbanisation. The higher MS measure for the Localised
industries indicates that they tend to be more concentrated within Auckland and are
thus exposed to a greater degree of localisation. Differences in own-industry
effective densities are more difficult to interpret, as they reflect relative industry size
as well as different patterns of localisation. The MS measure provides a more
interpretable indication of localisation. However, variation in own-industry effective
density measures across firms in the same industry provides an indication of
exposure to potential localisation effects.
The second column of Table 6 shows estimates of equation (5), estimated separately
for each group of industries, and with β2 constrained to be zero. The relationship
between effective density and labour productivity differs markedly across the five
industry groups. The Very Localised industries have the highest effective density
elasticity of 0.66, followed by the Localised industries with an elasticity of 0.51. The
elasticity for the Urbanised industries is lower, at 0.16. The dispersed industries,
although not geographically concentrated within Auckland, nevertheless have higher
productivity in more dense areas, with an elasticity of 0.24.
The two columns labelled (3) in Table 6 contain estimates of β1 and β2 from equation
(5), allowing for overall effective density and own-industry effective density to have
different relationships with productivity. Consistent with the effects of localisation, the
productivity of Localised and Very Localised industries has a particularly strong link
with own-industry density. In contrast, for Dispersed and Urbanised industries,
overall effective density has a stronger link with productivity, consistent with these
industries benefiting from urbanisation effects. Productivity in the non-Auckland
industries is positively related to both overall and own-industry density.
It is significant that the elasticity of productivity with respect to own-industry density is
stronger than the overall-density elasticity. This suggests that localisation effects are
generally more pronounced than the urbanisation effects of density per se. The
exception is the ‘urbanised’ group, for which the two elasticities are relatively close.
Even the dispersed industries, which tend to provide local services, benefit most from
localisation, despite the effects of competition that would favour dispersion.

34
These patterns are certainly suggestive of different types of agglomeration effects
operating in different industries. They are, however, consistent with a range of
explanations. Clearly, any explanation of the Auckland productivity premium must
include a link with employment density, given the prevalence of positive density
elasticities across a range of industries. Density-related productivity advantages
could, however, include technical and/or allocative efficiency benefits. As outlined
earlier, technical efficiency benefits may include advantages of matching, sharing,
and learning, all of which are arguably greater in dense areas. Allocative efficiency
may arise if output prices are higher in dense areas, as may occur in higher land rent
areas.
The existence of positive own-industry density elasticities suggests that interactions
with other firms in the same industry are advantageous. It is not possible, however,
to distinguish the contributions of shared inputs (such as transport infrastructure for
the highly concentrated Transport and Storage industries) from the possible
contributions of intra-industry knowledge transfers or matching with a common set of
suppliers or customers. Finally, the patterns in Table 6 are based on cross-sectional
variation. The analysis of the link between area density and average area labour
productivity that was presented in Table 4 and Figure 5 demonstrated that cross-
sectional patterns are not necessarily reflected in time series variation.

35
6 Summary and Future Directions
Value added per worker in Auckland region is 30 to 50 percent higher than that of
regions outside Auckland. The premium is even higher in Auckland CBD (120 to 150
percent higher). While these magnitudes seem large, they are similar to the premia
documented by ONS (2007) for London’s GDP per capita. London has GDP per
capita that is 50 percent above the rest of the UK, and Inner London has a premium
of 140 percent.27
Industry composition differences account for about half of Auckland’s higher labour
productivity. This finding is similar in magnitude to that of Rice and Venables (2004),
who attribute around 40% of London’s income per capita premium to job composition,
as captured by occupational mix. We find that industries are positively selected into
Auckland – the industries that are most concentrated in Auckland are the ones that
show the highest Auckland premium.
Our analysis of productivity patterns within Auckland reveals considerable
geographical variation, and a strong correlation between productivity and
employment density. A significant fixed effect estimate of the relationship between
density and productivity suggests that the cross-sectional pattern is not solely
reflecting patterns of spatial equilibrium. However, the finding of a positive
correlation of density and productivity over time within areas is not robust to
alternative approaches of estimation such as first differencing or using differences
across six-years. More detailed econometric analysis, taking into account spatial
autocorrelation and lags may provide a fuller understanding of the links.
The cross-sectional estimates imply that having density that is twice as high is
associated with productivity that is 8.6% higher. This is at the upper end of the 3% to
8% range from the studies summarised in Rosenthal and Strange (2004), and the 1%
to 10% range reported by Graham (2005a) and Graham (2006a). The current
paper’s estimates differ from many of those reported in the literature in 2 key
respects. First, the current estimates do not adjust for within-industry differences in
capital intensity or labour quality, both of which are likely to be higher in dense areas.
Some international studies use more sophisticated production-function approaches to 27 ONS (2007) reports a 40% London premia relative to the national average. We use the fact that London accounts for 12% of the UK population to express these figures relative to areas outside London (a 49% premium).

36
control for such factors. Our estimates may therefore overstate true productivity
differences. Second, our estimates cover all industries, whereas many of the studies
in the literature look only at manufacturing. Graham (2006b) shows that the elasticity
is lower for manufacturing than for the economy as a whole, and reports an
economy-wide elasticity of 12.5% but only 5% for manufacturing.
We examine industry variation in effective employment density, both of overall
employment and of industry employment. The industries that are most concentrated
within Auckland, and also over-represented in Auckland, have the highest
productivity premium from operating in Auckland (33%). The size of this premium is
higher in areas of Auckland where employment density is high, and especially where
own-industry density is high. We identify two groups of industries that show this
pattern, together accounting for 48% of Auckland’s employment. These groups
include mainly Transport and Storage industries, Finance and Insurance, and a
range of Wholesaling and Manufacturing industries.
There is a sizeable group of industries (40% of Auckland’s employment) that are
neither over-represented in Auckland nor particularly concentrated within Auckland.
These industries mostly provide local goods and services. They do, however, appear
to benefit from locating in denser areas of Auckland and from locating in areas of
high own-employment density. Overall, localisation effects appear to be stronger
than the effects of density per se. Own-industry density is more strongly related to
productivity than is density, even for the most dispersed industries.
While the focus of this paper has been on documenting Auckland’s productivity
performance and providing an initial view into the links between density and
productivity, a fuller picture of Auckland’s productivity could be advanced by using
more detailed firm-level information that is available from the LBD. It is possible to
estimate industry-level production functions and obtain estimates of the contribution
of agglomeration to multi-factor productivity (See Graham (2006b) Henderson (1986)
Eberts and McMillen (1999) Rosenthal and Strange (2004) for examples of this
approach). This approach would support a decomposition of Auckland’s productivity
premium, gauging the relative contributions of factors such as higher capital intensity,
higher labour quality, proximity to local productive inputs, local industry and market
scale, head-office concentration, and residual advantages. Obtaining additional
information on local output price and quantity variation separately would allow a

37
clearer analysis of the contributions of technical productivity and allocative
productivity.
This paper helps to focus ongoing policy debates on the strength of agglomeration
effects in Auckland. First, it provides estimates of the size of the Auckland
productivity premium, with sub-analyses by territorial authority, by smaller area units,
and by industry. Second, it confirms a cross-sectional link between productivity and
density, but shows that this link is not evident over time within industries. Finally, it
shows the diversity of agglomeration patterns across different groups of industries,
suggesting that localisation and urbanisation effects operate differently for different
industries. This delineation of patterns provides a foundation for more targeted
analysis to identify which agglomeration mechanisms operate in specific sets of
industries. It also emphasises that policies that aim to improve Auckland’s
productivity performance by increasing employment density are likely to have an
uneven impact across industries.

38
References
Auckland City Council. 2003. "Auckland City: Growth Management Strategy,"
Auckland City Council, Auckland. Available online at
http://www.aucklandcity.govt.nz/council/documents/growthstrategy/default.a
sp.
Auckland Regional Council. 2007. "Business and Economy: The Auckland Region -
07," Auckland Regional Council, Auckland. Available online at
www.arc.govt.nz.
Auckland Regional Council. 2008. "Auckland Plus Website," . Available online at
http://www.aucklandplus.com/.
Brakman, Steven; Harry Garretsen and Charles van Marrewijk. 2008. "An
Introduction to Geographical Economics (Website)," . Available online at
http://people.few.eur.nl/vanmarrewijk/geography/zipf/index.htm.
Committee for Auckland. 2006. "The Case for Auckland," Committee for Auckland,
Auckland. Available online at
http://www.competitiveauckland.co.nz/content/images/committee/Case%20f
or%20AKL.pdf.
Duranton, Gilles and Diego Puga. 2004. "Microfoundations of Urban Agglomeration
Economies" in Handbook of Regional and Urban Economics, J. V.
Henderson and Jacques-Francois Thisse, Eds. Amsterdam and New York:
North-Holland.
Eberts, Randall and Daniel McMillen. 1999. "Agglomeration Economies and Urban
Public Infrastructure" in Handbook of Regional and Urban Economics,
Volume III, New York: North-Holland, pp. 1455-95.
Ellison, Glenn and Edward L. Glaeser. 1999. "The Geographic Concentration of
Industry: Does Natural Advantage Explain Agglomeration?," American
Economic Review, 89:2, pp. 311-6.
Gabaix, Xavier. 1999a. "Zipf's Law and the Growth of Cities," American Economic
Review, 89:2, pp. 129-32.

39
Gabaix, Xavier. 1999b. "Zipf's Law for Cities: An Explanation," Quarterly Journal of
Economics, 114:3, pp. 739-67.
Graham, Daniel J. 2005a. "Transport Investment, Agglomeration and Urban
Productivity," Paper presented to World Bank Symposium, March 2005,
Imperial College, London. Available online at
http://www.worldbank.org/urban/symposium2005/papers/graham.pdf.
Graham, Daniel J. 2005b. "Wider Economic Benefits of Transport Improvements:
Link Between Agglomeration and Productivity Stage 1 Report," Report
prepared for UK Department for Transport, Imperial College, London.
Available online at
http://www.dft.gov.uk/pgr/economics/rdg/webia/webtheory/.
Graham, Daniel J. 2006a. "Investigating the Link Between Productivity and
Agglomeration for UK Industries," Report prepared for the UK Department
for Transport, Imperial College, London. Available online at
http://www.dft.gov.uk/pgr/economics/rdg/webia/webtheory/.
Graham, Daniel J. 2006b. "Wider Economic Benefits of Transport Improvements:
Link Between Agglomeration and Productivity Stage 2 Report," Report
prepared for UK Department for Transport, Imperial College, London.
Available online at
http://www.dft.gov.uk/pgr/economics/rdg/webia/webtheory/.
Grimes, Arthur and Yun Liang. 2007. "Spatial Determinants of Land Prices in
Auckland: Does the Metropolitan Urban Limit Have an Effect," Motu Working
Paper 2007-09, Motu Economic and Public Policy Research, Wellington.
Henderson, Vernon J. 1986. "Efficiency of Resource Usage and City Size," Journal
of Urban Economics, 19, pp. 47-70.
Henderson, Vernon J. 2000. "The Effects of Urban Concentration on Economic
Growth," NBER Working Paper 7503. Available online at www.nber.org.
Junius, Karsten. 1997. "The Determinants of Urban Concentration," Kiel Institute of
World Economics. Available online at SSRN: http://ssrn.com/abstract=42640.

40
Lewis, Geoff and Steven Stillman. 2005. "Regional Economic Performance in New
Zealand: How Does Auckland Compare?," Treasury Working Paper Series
05/08, New Zealand Treasury, Wellington.
Maré, David C. 2005. "Concentration, Specialisation and Agglomeration of Firms in
New Zealand," Motu Working Paper 05-12, Motu Economic and Public
Policy Research, Wellington, NZ. Available online at
http://www.motu.org.nz/motu_wp_series.htm.
Maré, David C. and Jason Timmins. 2006. "Geographic Concentration and Firm
Productivity," Motu Working Paper 06-08, Motu Economic and Public Policy
Research, Wellington, New Zealand. Available online at
http://www.motu.org.nz/motu_wp_series.htm.
Maurel, Françoise and Beatrice Sedillot. 1999. "A Measure of the Geographic
Concentration in French Manufacturing Industries.," Regional Science and
Urban Economics, 29:5, pp. 575-604.
Metro Project. 2007. "Metro Project Action Plan: Implementing the Auckland
Regional Economic Development Strategy," Auckland Regional Council,
Auckland. Available online at www.arc.govt.nz/metroproject.
Ministry of Economic Development. 2007. "Economic Development Indicators,"
MED, Wellington. Available online at www.med.govt.nz/indicators.
Ministry of Economic Development. 2008. "Strategy and Priorities: Auckland," MED
website. Available online at
http://www.med.govt.nz/templates/Page____27007.aspx.
ONS. 2007. "Regional, Sub-Regional and Local Gross Value Added," Office of
National Statistics, London. Available online at
http://www.statistics.gov.uk/pdfdir/gva1207.pdf.
Paling, Richard; John Williamson and David Waite. 2007. "Assessing
Agglomeration Impacts in Auckland: Linkages With Regional Strategies,"
Ascari Partners & Richard Paling Consulting, Auckland. Available online at
www.arc.govt.nz.

41
Rice, Patricia and Anthony J. Venables. 2004. "Productivity: Understanding
Regional Differences," Centrepiece, Winter 2004, pp. 2-7,32. Available
online at http://cep.lse.ac.uk/centrepiece/v09i3/rice_venables.pdf .
Rosenthal, Stuart S. and William C. Strange. 2004. "Evidence on the Nature and
Sources of Agglomeration Economies" in Handbook of Regional and Urban
Economics, J. V. Henderson and Jacques-Francois Thisse, Eds.
Amsterdam and New York: North-Holland.
Seyb, Allyson. 2003. "The Longitudinal Business Frame," Unpublished paper,
Statistics New Zealand, Christchurch. Available online at
http://www.stats.govt.nz/NR/rdonlyres/1C948CE4-BCE4-40E1-B08C-
EFE5B05F927D/0/LongitudinalBusinessFrame.pdf. Last accessed 4
November 2005.
Skilling, David. 2006. "The Role of Auckland in Meeting New Zealand's Productivity
Challenge," New Zealand Institute, Auckland.
Soo, Kwok T. 2005. "Zipf's Law for Cities: A Cross Country Investigation," Regional
Science and Urban Economics, 35:3, pp. 239-63.
Statistics New Zealand. 2005. "New Zealand: An Urban/ Rural Profile," Statistics
New Zealand, Wellington. Available online at http://www.stats.govt.nz/urban-
rural-profiles/default.htm.
Statistics New Zealand. 2006. "Business Demographic Statistics Review Report
Based on Statistics New Zealand's Longitudinal Business Frame," Statistics
New Zealand, Wellington. Available online at
http://www.stats.govt.nz/NR/rdonlyres/BD19EB7B-C528-4454-9E7A-
9D0D73AA7574/0/BusinessDemographicStatisticsReport.pdf.
Statistics New Zealand. 2007a. "Auckland Quarterly Review: June 2007," Statistics
New Zealand, Wellington.
Statistics New Zealand. 2007b. "Regional GDP Concepts, Sources and Methods,"
Statistics New Zealand, Wellington. Available online at
http://www.stats.govt.nz/statistics-by-area/regional-statistics/regional-gdp-
feasibility-study.htm.

42
Statistics New Zealand. 2007c. "Research Report on Regional Gross Domestic
Product," Statistics New Zealand, Wellington. Available online at
http://www.stats.govt.nz/statistics-by-area/regional-statistics/regional-gdp-
feasibility-study.htm.
United Nations. 2008. "World Urbanization Prospects: The 2007 Revision
Population Database," UN Population Division, New York. Available online
at http://esa.un.org/unup/index.asp.

43
Appendix A Auckland Urban Area in Context
Australasian rank-size rule
Appendix Figure 1 shows the structure of the Australasian urban settlement system,
and Auckland’s position within it, as summarised by the rank-size rule that
generally characterises systems of cities (Gabaix (1999a) Soo (2005)). The
formula for the fitted regression line is:
ln(rank) = -0.6964 ln(population) + 11.047 (R2 = 0.97).
The slope of –0.6964 is flatter than in most other developed countries (Soo (2005),
and Brakman et al (2008)), indicating that the Australasian urban settlement
system is highly concentrated.
An unusual feature of the graph is that the two largest urban areas (Sydney and
Melbourne) are similarly sized, whereas the rank-size relationship suggests that
one of them should be twice as large.
Appendix Figure 1 Zipf’s Law for Australasian Urban Areas
0
0.5
1
1.5
2
2.5
3
3.5
4
10 11 12 13 14 15 16ln(Population)
ln(R
ank)
New ZealandAustralia
Sydney
Melbourne
Perth
Brisbane
AucklandAdelaideGold Coast
WellingtonChristchurch
Source: World Population Rankings, available from http://www.demographia.com/db-worldua.pdf (NZ data verified against Statistics New Zealand (2005)).

44
Comparison with US Urbanized Areas
Appendix Figure 2 shows the Auckland Urban Area’s size in comparison with
urbanised areas in the United States. Size is captured by geographic area and
employment (both on log scales). The dotted diagonal lines are lines of constant
employment density. There is a tendency for density to increase with size.
Auckland ranks as a mid-sized US city, with around the expected density.
Appendix Table 1 shows some US cities with similar employment, and land area.
Appendix Figure 2 Auckland Urban Area – compared with US Urbanized
Areas by Area and Employment
10,000
100,000
1,000,000
10,000,000
10 100 1,000 10,000Area (square kilometres) - log scale
Em
ploy
men
t - lo
g sc
ale
Density = 1,000
Density = 500
Density = 250
Auckland
Source: http://www.demographia.com/db-usaua-employ.htm
Appendix Table 1 Comparable US Urbanized Areas
Urban Area Employment Square km dens/sqkm
San Antonio, TX Urbanized Area 581,045 1,056 550 Riverside--San Bernardino, CA Urbanized Area 572,083 1,136 503 Columbus, OH Urbanized Area 583,756 1,030 567 Jacksonville, FL Urbanized Area 426,425 1,063 401 Orlando, FL Urbanized Area 574,861 1,174 490 Providence, RI--MA Urbanized Area 547,048 1,304 419 Memphis, TN--MS--AR Urbanized Area 436,006 1,035 421 Sacramento, CA Urbanized Area 614,550 956 643 Nashville-Davidson, TN Urbanized Area 377,497 1,116 338
Source: http://www.demographia.com/db-usaua-employ.htm

45
Appendix B The Allocation of Value-added Within Enterprise-groups
In any month, each PBN can belong to only one enterprise and only one group.
Allocating PBN labour input to different enterprises is straightforward, by
aggregating across those months in which the PBN belongs to the enterprise. In
addition, we wish to analyse productivity patterns by industry and location, so we
group monthly PBN observations into distinct subsets for which enterprise-number,
industry, and location (area unit) are constant. By construction, each plant belongs
to only one enterprise during the year, and is allocated a proportion of that
enterprise’s value added and working proprietor input. Where enterprises belong
to more than one group, it is not possible to tell how much of the enterprise’s value
added is associated with each group. The groups are therefore pooled for the
purposes of aggregation of BAI value added, as described above.
Appendix Table 2 shows the distribution of activity across different group structures.
Single plant enterprises that do not belong to an enterprise-group, in which there is
no ambiguity in the link between reported value added and annual labour input,
account for 76 percent of plant-year observations. Being relatively small, however,
they account for only 55 percent of labour input and 37 percent of value added.
Productivity is relatively low for these plants. In multi-plant enterprises not
belonging to a group, labour productivity is close to the national average of
$52,000, and plant size is also roughly average. These plants account for about
one sixth of plants, labour, and value added.
Groups containing more than one enterprise are divided into two subsets in
Appendix Table 2 – hierarchical and complex. Hierarchical groups are groups in
which each enterprise in the group belongs to only one group during the year. For
enterprises not having an AES postal record, productivity is constant within the
group. Although these groups contain only 5 percent of plants, the plants contain,
on average, 17.7 workers and account for 41 percent of value added and 23
percent of labour input. Productivity is thus high in these groups – just under
$100,000 per worker. Complex groups are groups within which at least one
enterprise belongs to more than one group. Such enterprises serve to connect two
or more groups. Aggregation of BAI value added takes place within sets of

46
connected groups. Complex groups are relatively large and productive, but
account for only 2 percent of plants and 6 percent of value added.
Appendix Table 2: Group Structures (2006)
% of plant obs
% of Labour input
% of value added
Average labour input
per plant Value added per worker
Single-plant Enterprise 76% 55% 37% 2.5 $38,255 Multi-plant Enterprise 17% 18% 16% 3.6 $52,359 Hierarchical Group 5% 23% 41% 17.7 $98,662 Complex Group 2% 4% 6% 9.2 $82,901 Total 100% 100% 100% 3.5 $52,037
Appendix Table 3 shows summary statistics for three groups of firms that are less
affected by the within-enterprise allocation algorithm. Single plant enterprises are
not subject to any allocation of value added. They account for 55% of employment
nationally, and Auckland’s share of single-plant enterprises (30%) is only slightly
lower than its share of total employment, reflecting the over-representation of multi-
plant enterprises in Auckland. The Auckland labour productivity premium for
single-plant enterprises (39%) is similar to the premium estimated for all
enterprises (44%). Similarly, adjusting for industry composition, the Auckland
premium for single-plant enterprises is 22% compared with 25% overall. The
allocation algorithm appears to give a similar Auckland premium estimate to that
based on single-plant enterprises for which there is no allocation.
Enterprises for which only AES postal returns are used (i.e.: no data from BAI is
allocated within enterprise groups) account for 40% of Auckland employment. The
AES contains a disproportionately large share of larger firms. A relatively high
39% of employment in AES-only enterprises is in Auckland. The Auckland
premium is slightly lower for this group (27% raw, or 17% when adjusted for
industry composition), possibly because AES also contains a relatively high share
of multi-plant enterprises, so the advantage of being in Auckland may accrue in
part to enterprises and plants affiliated with Auckland-based firms. It may also be
that agglomeration is of particular value to smaller firms.

47
The third group of firms, which is least affected by the method of value added
allocation contains single-enterprise firms for which data are sourced from AES.
This group accounts for only 8 percent of employment, and has employment
located in Auckland to the same degree as other AES-only firms (40%). The
Auckland premium for this group is similar to that for AES-only enterprises
generally (28% unadjusted and 15% adjusted for industry composition).
It would appear that the method of value added allocation is not driving the overall
premium estimates. The overall estimates may, however, be masking some
variation in agglomeration benefits by firm size, as suggested by the lower
premium for the AES sample.
Appendix Table 3: Auckland Shares and premia (2006)
% of Total employment
Auckland share of group
employment
Raw Auckland
VAPW premium
ind3% adj
premium
Single-plant enterprises 55% 30% 39% 22% AES-only enterprises 40% 39% 27% 17% AES-only single-plant enterprises 8% 40% 28% 15%
Total 100% 33% 44% 25%

48
Appendix C Map of Auckland Urban Area
The Auckland urban area is the darker-shaded area in the map.
Appendix Figure 3 Map of Auckland Urban Area

49
Appendix D 2000 v 2006 Maps
This appendix compares 2000 and 2006 patterns of value-added per worker and
density, showing similarity across the two the periods.
Appendix Figure 4 Map of Auckland VAPW and density
(45610.23,102619.8](38136.32,45610.23](33519.86,38136.32][22713.22,33519.86]
2000 - Adj VAPW
(58211.91,141297.3](48988.13,58211.91](43338.26,48988.13][6749.056,43338.26]
2006 - Adj VAPW

50
(1309.607,16402.12](671.1633,1309.607](305.3741,671.1633][.5734156,305.3741]
2000 - Density
(1476.158,18675.49](761.5798,1476.158](357.9805,761.5798][.2457496,357.9805]
2006 - Density
Note: Data have been spatially smoothed using Euclidean distance and an Epanechnikov kernel with a bandwidth of 2km.

51
Appendix E Comparison with Statistics New Zealand’s regional GDP Figures
Appendix Table 5 contains a comparison of regional GDP per worker estimates
derived from Statistics New Zealand’s Regional GDP Feasibility Study (Statistics
New Zealand (2007c)) and Business Demography data downloaded from
http://www.stats.govt.nz/products-and-services/table-builder/table-builder-business.htm.
The comparison is for the 2003 year.
The LBD data used in the current paper captures Value Added of $76.6bn, which is
about 60% of the $130.7bn in the more complete regional GDP measure. The
LBD employment measure (rolling mean employment, including working
proprietors) is larger than the employee count measure obtained from Business
Demography data. A consequence of the lower value added and higher
employment figures is that value added per worker, as used in this paper, is
significantly lower than GDP per worker ($39,900 compared with $78,900).
Regional variation in productivity is similar across the two series, with the
exceptions of Wellington and Auckland. The reasons for the Wellington difference
include the omission of public sector firms in the current study. The reasons for the
Auckland difference have not been fully explained. The sources and methods for
the regional GDP estimates are documented in Statistics New Zealand (2007b).
Some of the methods used differ from that used in the current paper and these
differences may account for some of the discrepancy. One potentially influential
difference is in the way that value added is allocated across plants within multi-
plant enterprises. The method is similar to the allocation outlined in Appendix B,
with the difference that instead of setting value added per worker to be constant
within an enterprise, the Regional GDP figures are based on setting value added
per dollar of payroll to be equal. This has the effect of generating an estimated
VAPW premium that is equal to the Auckland wage premium
In the current paper, the spreading of value added in proportion to employment
yields a zero VAPW premium. However, the recovery of the underlying premia is
achieved by regression methods, as outlined in sections 4.1 and 4.2. A similar
approach could be applied in the creation of the Regional GDP estimates to
generate estimates of the relative productivity rather than average wage rates.

52
Appendix Table 4 shows a hypothetical example of two enterprises to illustrate the
impact of the different methods. Assumptions are made about the wage level
(20% Auckland premium) and VAPW level (100% Auckland premium) and about
the proportion of each enterprise’s employment that is in Auckland. The first 3
columns of the Enterprise A case show the assumed Employment spread, and the
wage bill and Value added amount implied by the assumptions.
If only total value added of $30,000 were observed, it needs to be allocated to
Auckland and non-Auckland plants. The 4th and 5th columns show the split of total
value added in proportion to employment, the implied value added, and the
recovered premium of 0%. The 6th and 7th column show a similar calculation
based on splitting value added in proportion to wage bill. The recovered premium
is 20% - equal to the assumed wage premium.
The two simultaneous equations at the bottom of the table show how information is
used from two enterprises (that differ in the proportion of their employment that is
in Auckland) to identify the underlying VAPW premium. Our regression-based
adjustment performs the same role, although with more enterprises than locations,
so that the identification is not exact.
Appendix Table 4 Regional GDP v Value added per worker Assume: Wage VAPW
Auckland 120 300Non-Auckland 100 150premium 20% 100%
split by Emp split by WagebillEnterprise A Emp Wagebill VA VA VAPW VA VAPW
Auckland 50 33% 6000 38% $15,000 $10,000 $200 $11,250 $225Non-Auckland 100 67% 10000 63% $15,000 $20,000 $200 $18,750 $188
$30,000Premium 0% 20%
split by Emp split by WagebillEnterprise B Emp Wagebill VA VA VAPW VA VAPW
Auckland 20 67% 2400 71% $6,000 $5,000 $250 $5,294 $265Non-Auckland 10 33% 1000 29% $1,500 $2,500 $250 $2,206 $221
$7,500Premium 0% 20%
A 200 = 33% * VAPW(akld) + 67% * VAPW(non)B 250 = 67% * VAPW(akld) + 33% * VAPW(non)
=> VAPW(Akld) = 300 Premium = 100%VAPW(Non) = 150

53
Appendix Table 5 Regional GDP v Value added per worker
Regional GDP Estimates (2003) Current paper’s estimates (2003) GDP GDP Emp Emp GDP/EmpAuckland Value Added VA Emp Emp VA/EmpAuckland
Region $(million) share of
total employee
count share of
total $(000) Premium $(million) share oftotal
rme (000)
share oftotal $(000) Premium
Northland 3,243 2% 42,870 3% 75.65 96% 1,516 2% 53,650 3% 28.50 71% Auckland 47,689 36% 534,550 34% 89.21 113% 31,600 41% 543,630 33% 58.13 146% Waikato 10,598 8% 131,060 8% 80.86 103% 5,999 8% 157,320 9% 38.13 96% Bay of Plenty 6,689 5% 88,540 6% 75.55 96% 3,896 5% 103,750 6% 37.55 94% Gisborne 1,031 1% 15,430 1% 66.82 85% 544 1% 17,480 1% 31.14 78% Hawke's Bay 4,318 3% 56,530 4% 76.38 97% 2,149 3% 63,370 4% 33.92 85% Taranaki 4,414 3% 38,360 2% 115.07 146% 2,129 3% 45,590 3% 46.69 117% Manawatu-Wanganui 5,594 4% 83,630 5% 66.89 85% 2,810 4% 86,580 5% 32.46 81% Wellington 19,286 15% 202,370 13% 95.30 121% 10,146 13% 175,010 10% 57.97 145%
Total North Island 102,863 79% 1,193,340 75% 86.20 109% 60,788 79% 1,246,38075% 48.77 122% Tasman / Nelson 2,343 2% 34,040 2% 68.83 87% Marlborough 1,193 1% 16,540 1% 72.13 91% 2,391 3% 75,300 5% 31.75 80% West Coast 779 1% 11,550 1% 67.45 86% Canterbury 15,074 12% 212,480 13% 70.94 90% 8,829 12% 223,060 13% 39.58 99% Otago 5,411 4% 80,150 5% 67.51 86% 2,953 4% 81,620 5% 36.18 91% Southland 3,023 2% 38,990 2% 77.53 98% 1,669 2% 46,140 3% 36.17 91%
Total South Island 27,824 21% 393,750 25% 70.66 90% 15,842 21% 426,120 25% 37.18 93% Gross domestic product130,687 100% 1,587,090 100% 82.34 104% 76,631 100% 1,672,500100% 45.82 115% Total Excluding Auckland 82,998 64% 1,052,540 66% 78.85 100% 45,031 59% 1,128,87067% 39.89 100%
Sources: Regional GDP panel: (Statistics New Zealand (2007c)) and Business Demography data downloaded from http://www.stats.govt.nz/products-and-services/table-builder/table-builder-business.htm. The Auckland premium expresses “Auckland Premium” columns express GDP/Emp and VA/Emp as a proportion of non-Auckland levels.

54
Appendix F Industry Tables (grouped 2-digit)
Appendix Table 6 Two-digit industries – descriptive statistics
# Plants Employment (rme) Mean VAPW
Concentration within Auckland
(MS) Presence in
Auckland (LQ)Mean
ln(Effective density)
Mean ln(Own-industry Effective density)
Non-Akld A03: Forestry and Logging 200 600 $55,619 0.010 0.13 10.32 4.44 C21: Food Beverage and Tobacco Manufacturing 650 17,830 $108,321 0.022 0.68 11.10 7.84 C23: Wood & Paper Product Manufacturing 610 6,110 $41,402 0.031 0.62 10.97 6.64 A02: Services to Agric Hunting and Trapping 470 1,490 $31,509 0.008 0.13 10.42 5.35 A04: Commercial Fishing 140 250 $72,299 0.017 0.23 10.35 3.27 A01: Agriculture 3,620 9,750 $20,599 0.018 0.22 10.21 6.84 BD: MinQuarr / EG&W 80 510 $186,761 0.000 0.26 10.59 4.16
Dispersed L77: Property Services 7,730 17,630 $63,662 -0.005 1.00 11.15 7.63 O86: Health Services 4,380 15,400 $24,077 -0.005 0.82 11.17 7.64 G51: Food Retailing 4,200 29,920 $28,841 -0.007 0.92 11.07 8.10 O87: Community Services 700 9,670 $53,550 -0.006 0.87 11.01 7.04 H57: Accommodation Cafes & Restaurants 3,570 32,290 $46,879 0.008 0.86 11.32 8.55 G52: Personal & Household Good Retailing 7,310 40,670 $22,176 0.002 1.03 11.17 8.52 E42: Construction Trade Services 9,180 29,880 $62,619 -0.007 0.96 10.95 7.94 E41: General Construction 5,160 19,160 $36,846 0.000 0.86 10.96 7.53 G53: Motor Vehicle Retailing and Services 3,620 18,170 $36,379 0.000 0.90 11.08 7.63 I61: Road Transport 2,850 12,970 $27,796 0.002 0.92 10.99 7.20 Q95: Personal Services 3,480 10,740 $47,865 -0.008 1.03 11.13 7.14
Urbanised P92: Libraries Museums and the Arts 1,230 2,110 $35,212 0.005 1.28 11.31 5.93 Q96: Other Services 260 1,900 $19,475 0.005 1.27 11.13 5.58
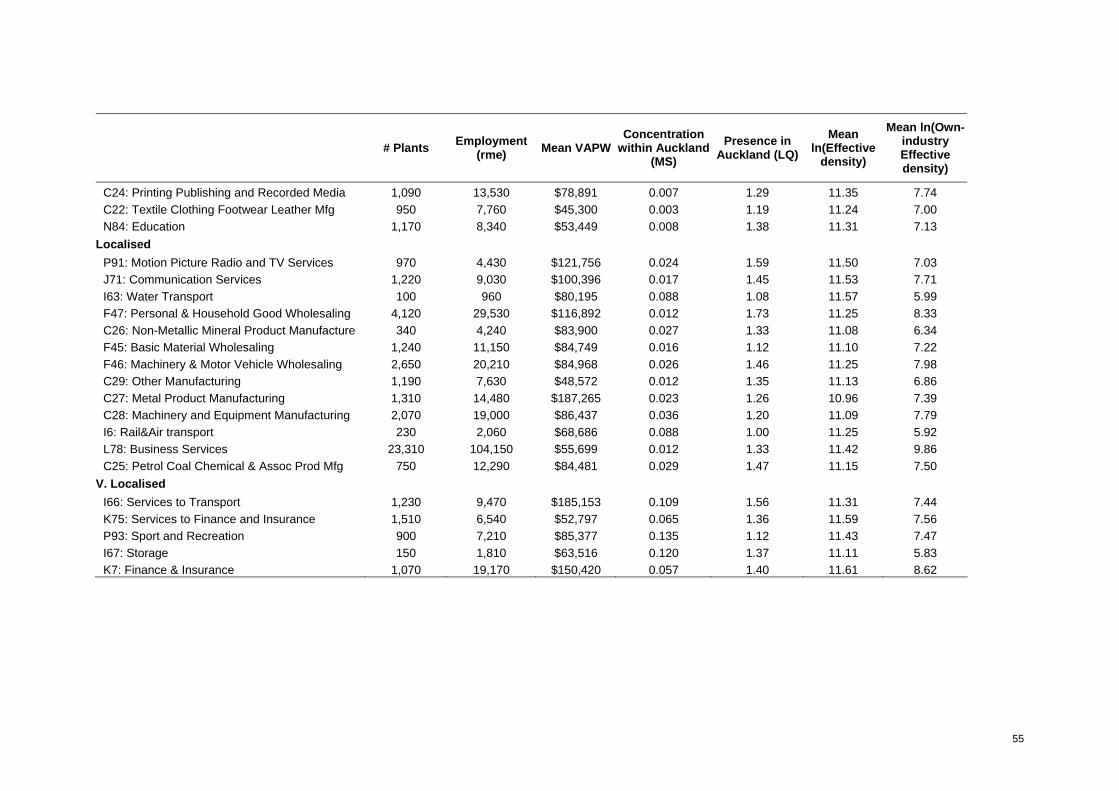
55
# Plants Employment (rme) Mean VAPW
Concentration within Auckland
(MS) Presence in
Auckland (LQ)Mean
ln(Effective density)
Mean ln(Own-industry Effective density)
C24: Printing Publishing and Recorded Media 1,090 13,530 $78,891 0.007 1.29 11.35 7.74 C22: Textile Clothing Footwear Leather Mfg 950 7,760 $45,300 0.003 1.19 11.24 7.00 N84: Education 1,170 8,340 $53,449 0.008 1.38 11.31 7.13
Localised P91: Motion Picture Radio and TV Services 970 4,430 $121,756 0.024 1.59 11.50 7.03 J71: Communication Services 1,220 9,030 $100,396 0.017 1.45 11.53 7.71 I63: Water Transport 100 960 $80,195 0.088 1.08 11.57 5.99 F47: Personal & Household Good Wholesaling 4,120 29,530 $116,892 0.012 1.73 11.25 8.33 C26: Non-Metallic Mineral Product Manufacture 340 4,240 $83,900 0.027 1.33 11.08 6.34 F45: Basic Material Wholesaling 1,240 11,150 $84,749 0.016 1.12 11.10 7.22 F46: Machinery & Motor Vehicle Wholesaling 2,650 20,210 $84,968 0.026 1.46 11.25 7.98 C29: Other Manufacturing 1,190 7,630 $48,572 0.012 1.35 11.13 6.86 C27: Metal Product Manufacturing 1,310 14,480 $187,265 0.023 1.26 10.96 7.39 C28: Machinery and Equipment Manufacturing 2,070 19,000 $86,437 0.036 1.20 11.09 7.79 I6: Rail&Air transport 230 2,060 $68,686 0.088 1.00 11.25 5.92 L78: Business Services 23,310 104,150 $55,699 0.012 1.33 11.42 9.86 C25: Petrol Coal Chemical & Assoc Prod Mfg 750 12,290 $84,481 0.029 1.47 11.15 7.50
V. Localised I66: Services to Transport 1,230 9,470 $185,153 0.109 1.56 11.31 7.44 K75: Services to Finance and Insurance 1,510 6,540 $52,797 0.065 1.36 11.59 7.56 P93: Sport and Recreation 900 7,210 $85,377 0.135 1.12 11.43 7.47 I67: Storage 150 1,810 $63,516 0.120 1.37 11.11 5.83 K7: Finance & Insurance 1,070 19,170 $150,420 0.057 1.40 11.61 8.62

56
Appendix Table 7 Two-digit industries – Auckland Premium and Density Elasticities (1) (2) (3)
Auckland Premium
Effective density Elasticity
Effective density Elasticity
Own-industry Effective Density
Elasticity
Non-Akld A03: Forestry and Logging 2.267 ** 0.760 ** 1.645 ** 1.263 (0.21) (0.20) (0.68) (0.93) C21: Food Beverage and Tobacco Manufacturing 1.550 ** 0.445 ** 0.690 ** 0.789 ** (0.07) (0.18) (0.19) (0.25) C23: Wood & Paper Product Manufacturing 1.523 ** 0.226 0.510 0.411 (0.31) (0.16) (0.39) (0.52) A02: Services to Agric Hunting and Trapping 1.228 ** -0.115 -0.249 -0.200 (0.10) (0.14) (0.35) (0.47) A04: Commercial Fishing 1.072 ** 0.365 ** 0.638 ** 1.616 ** (0.04) (0.12) (0.11) (0.20) A01: Agriculture 0.823 ** -0.017 0.340 0.489 (0.07) (0.22) (0.46) (0.56) BD: MinQuarr / EG&W 0.389 ** 0.586 ** 0.794 ** 0.400 (0.14) (0.24) (0.33) (0.45) Dispersed L77: Property Services 1.514 ** 0.313 ** 0.298 ** -2.841 ** (0.05) (0.08) (0.08) (0.60) O86: Health Services 1.499 ** 0.182 * 0.140 -0.557 ** (0.11) (0.10) (0.10) (0.17) G51: Food Retailing 1.319 ** -0.090 0.315 ** 1.623 ** (0.03) (0.08) (0.12) (0.35) O87: Community Services 1.290 ** 0.235 ** 0.202 ** 0.697 ** (0.02) (0.05) (0.04) (0.12) H57: Accommodation Cafes & Restaurants 1.210 ** 0.215 ** 0.331 ** 0.529 ** (0.01) (0.04) (0.05) (0.16) G52: Personal & Household Good Retailing 1.199 ** 0.401 ** 0.205 ** 0.833 ** (0.04) (0.06) (0.09) (0.28) E42: Construction Trade Services 1.197 ** 0.353 ** 0.631 ** 1.215 ** (0.02) (0.07) (0.08) (0.22)

57
(1) (2) (3)
Auckland Premium
Effective density Elasticity
Effective density Elasticity
Own-industry Effective Density
Elasticity E41: General Construction 1.144 ** 0.173 ** 0.223 ** 0.606 ** (0.02) (0.05) (0.06) (0.27) G53: Motor Vehicle Retailing and Services 1.076 ** 0.199 ** 0.264 ** 0.424 * (0.02) (0.05) (0.06) (0.22) I61: Road Transport 1.070 ** 0.360 ** 0.437 ** 0.980 ** (0.02) (0.06) (0.06) (0.24) Q95: Personal Services 1.047 ** 0.247 ** 0.453 ** 0.816 ** (0.02) (0.08) (0.09) (0.20) Urbanised P92: Libraries Museums and the Arts 1.521 ** 0.233 ** 0.108 0.477 ** (0.09) (0.07) (0.08) (0.16) Q96: Other Services 1.470 ** 0.324 ** 0.237 * 0.415 (0.10) (0.08) (0.12) (0.43) C24: Printing Publishing and Recorded Media 1.259 ** -0.275 -0.405 ** 0.951 ** (0.11) (0.20) (0.21) (0.40) C22: Textile Clothing Footwear Leather Mfg 1.162 ** 0.046 0.069 0.243 (0.04) (0.10) (0.10) (0.20) N84: Education 1.112 ** 0.116 0.175 ** -0.352 (0.05) (0.08) (0.09) (0.23) Localised P91: Motion Picture Radio and TV Services 3.186 ** 0.463 ** -0.107 1.061 ** (0.34) (0.15) (0.24) (0.35) J71: Communication Services 1.754 ** 0.303 * 0.737 ** -0.900 ** (0.20) (0.18) (0.26) (0.40) I63: Water Transport 1.720 ** 0.501 ** 0.561 ** 0.963 ** (0.06) (0.08) (0.08) (0.20) F47: Personal & Household Good Wholesaling 1.518 ** 0.645 ** 0.688 ** 0.923 ** (0.11) (0.15) (0.13) (0.18) C26: Non-Metallic Mineral Product Manufacture 1.446 ** 0.649 ** 0.674 ** 0.207 (0.05) (0.10) (0.10) (0.19) F45: Basic Material Wholesaling 1.434 ** -0.280 ** -0.144 ** 1.116 ** (0.04) (0.07) (0.06) (0.13) F46: Machinery & Motor Vehicle Wholesaling 1.381 ** 0.497 ** 0.535 ** 0.323 ** (0.05) (0.08) (0.08) (0.16)

58
(1) (2) (3)
Auckland Premium
Effective density Elasticity
Effective density Elasticity
Own-industry Effective Density
Elasticity C29: Other Manufacturing 1.337 ** 0.333 ** 0.360 ** 0.487 ** (0.04) (0.08) (0.08) (0.15) C27: Metal Product Manufacturing 1.317 ** 1.749 ** 0.127 2.708 ** (0.06) (0.11) (0.20) (0.30) C28: Machinery and Equipment Manufacturing 1.305 ** 0.482 ** 0.425 ** 0.849 ** (0.11) (0.15) (0.14) (0.33) I6: Rail&Air transport 1.200 ** 0.419 ** 0.463 ** 0.718 ** (0.03) (0.07) (0.07) (0.08) L78: Business Services 1.175 ** 0.513 ** 0.018 1.292 ** (0.01) (0.04) (0.08) (0.18) C25: Petrol Coal Chemical & Assoc Prod Mfg 0.834 ** 0.628 ** 0.697 ** 0.359 * (0.04) (0.15) (0.16) (0.20) V. Localised I66: Services to Transport 1.678 ** -0.082 -0.199 * 1.595 ** (0.11) (0.12) (0.11) (0.21) K75: Services to Finance and Insurance 1.524 ** 1.167 ** 0.160 1.637 ** (0.09) (0.08) (0.11) (0.15) P93: Sport and Recreation 1.223 ** 1.097 ** 0.484 ** 0.915 ** (0.05) (0.08) (0.16) (0.21) I67: Storage 1.187 ** 0.802 * 0.800 * -0.015 (0.15) (0.43) (0.43) (0.33) K7: Finance & Insurance 1.160 ** 0.634 ** 0.415 0.297 (0.04) (0.16) (0.38) (0.46) Notes: Industries are ordered within each group in descending order of Auckland premium.