lagoons of sri lanka
TRANSCRIPT

Lagoons of Sri Lanka:From the Origins to the Present
E. I. L. Silva, J. Katupotha, O. Amarasinghe, H. Manthrithilake and Ranjith Ariyaratna


Lagoons of Sri Lanka:
From the Origins to the Present
E. I. L. Silva, J. Katupotha, O. Amarasinghe, H. Manthrithilake and Ranjith Ariyaratna

ii
The authors: Professor E.I.L. Silva is a Visiting Professor at the Limnology/Zoology Department of the University of Sri Jayawardenapura, Sri Lanka, and at the University of Ruhuna, Sri Lanka; Professor J. Katupotha is at the Department of Geography, University of Sri Jayawardenapura, Sri Lanka; Professor O. Amarasinghe is at the Sociology Department, University of Ruhuna, Sri Lanka; Dr. H. Manthrithilake is Head, Sri Lanka Development Initiative at the International Water Management Institute (IWMI), Colombo, Sri Lanka; and Mr. Ranjith Ariyaratna is a Consultant with IWMI, Colombo, Sri Lanka, and was Benchmark Basin Coordinator with the Institute at the time this report was prepared.
Silva, E. I. L.; Katupotha, J.; Amarasinghe, O.; Manthrithilake, H.; Ariyaratna, R. 2013. Lagoons of Sri Lanka: from the origins to the present. Colombo, Sri Lanka: International Water Management Institute (IWMI). 122p. doi: 10.5337/2013.215
/ coastal lagoons / hydrology / hydrography / ecosystems / biodiversity / fauna / mangroves / marshes / salinity / geomorphology / species / poverty / fisheries / governance / institutions / legislation / Sri Lanka /
ISBN 978-92-9090-778-7
Copyright © 2013, by IWMI. All rights reserved. IWMI encourages the use of its material provided that the organization is acknowledged and kept informed in all such instances.
Photos: Cover photo by Prof. J. Katupotha showing fishermen engaged in fishing in the Negombo Lagoon. All photos in the text are by Prof. O. Amarasinghe.
Please send inquiries and comments to: [email protected]

iii
Acknowledgements
This study was conducted with the financial support of the International Water Management Institute (IWMI), Colombo, Sri Lanka. The authors acknowledge the contribution and support of the staff of the Department of Fisheries and Aquatic Resources, Sri Lanka, other local officials around the country, fishermen, the army personnel during the field visits for the data collection, the reviewers who helped improve the report by providing constructive comments and Samanmalee Thanuja Fernando of Central Environmental Authority, Sri Lanka for painstakingly doing line drawings of maps and the calculations therein under the supervision of Prof. J. Katupotha. They also thank the IWMI personnel, Pavithra Amunugama, Manager, Publications, for the prompt liaising with the authors and those who contributed to the publication of this paper, Sumith Fernando, Layout Specialist, for the excellent layout work and Kingsley Kurukulasuriya, Senior Consultant Editor for the outstanding editing of this paper.


v
Contents
Executive Summary ................................................................................................................................1
Chapter 1. Introduction ...........................................................................................................................3
Chapter 2. State of Knowledge ..............................................................................................................5
Present Knowledge ...........................................................................................................................5Benchmark Study .............................................................................................................................6
Chapter 3. Origin, Formation and Evolution .......................................................................................12
Introduction ....................................................................................................................................12Distribution of Lagoons .................................................................................................................18
Geomorphology ..............................................................................................................................28
Chapter 4. Hydrology and Hydrography ..............................................................................................30
Hydrology ....................................................................................................................................30 Hydrography ...................................................................................................................................33
Chapter 5. Ecosystems and Biodiversity ..............................................................................................41
Lagoon Flora and Fauna ................................................................................................................41Lagoon Fauna .................................................................................................................................45Ecological Significance ..................................................................................................................50
Natural and Anthropogenic Pressures ............................................................................................51
Chapter 6. Socioeconomic Relevance ..................................................................................................55
Social and Economic Values of Lagoons ......................................................................................55Current State of Utilization of Lagoons ........................................................................................58Misuse of Lagoon Ecosystems and the Threats ............................................................................63Present Status of Resources ...........................................................................................................73
Chapter 7. Governance and Management ............................................................................................75
Evolution of Fisheries Governance and Management in Sri Lanka .............................................75Institutions and Legislation ............................................................................................................77
The Present Lagoon Management Regimes ..................................................................................79 Lagoon Resources and Human Well-Being ...................................................................................81 Way Forward ..................................................................................................................................85
Chapter 8. Conclusions .........................................................................................................................86
Definition and Classification .........................................................................................................86 Development and Consequences ...................................................................................................92 Values ....................................................................................................................................92
References ....................................................................................................................................93
Annexes ..................................................................................................................................103


1
Exe cutive Summary
Sri Lanka, an island in the Indian Ocean, has lagoons along 1,338 km of its coastline. They experience low-energy oceanic waves and semidiurnal microtidal currents. The Sri Lankan coastal lagoons are not numerous but they are diverse in size, shape, configuration, ecohydrology, and ecosystem values and services. The heterogeneous nature, in general, and specific complexities, to a certain extent, exhibited by coastal lagoons in Sri Lanka are fundamentally determined by coastal and adjoining hinterland geomorphology, tidal fluxes and fluvial inputs, monsoonal-driven climate and weather, morphoedaphic attributes, and cohesive interactions with human interventions.
Most coastal lagoons in Sri Lanka are an outcome of mid-Holocene marine transgression and subsequent barrier formation and spit development enclosing the water body between the land and the sea. This process has varied from one coastal stretch to another due to wave-derived littoral drift, sediment transport by tidal fluxes, fluvial inputs and wave action or, in other words, sea-level history, shore-face dynamics and tidal range as the three major factors that control the origin and maintenance of the sandy barrier, the most important features for the formation and evolution of coastal lagoons with their landward water mass. In certain stretches of Sri Lanka’s coastline, formation of the barrier spit was very active due to shore-face dynamics that resulted in chains of shore parallel, elongated lagoons. They are among the most productive in terms of ecosystem yield and show some similarities to large tropical lagoons with respect to sea entrance, zonation, biodiversity and ecosystem services. However, some of them become seasonally hypersaline due to lack of freshwater input and high evaporation. Functions and processes of some of these water bodies are fairly known.
There are a fair number of small back-barrier lagoons of different shapes and sizes whose origin goes back to sea-level history. They are located on low-energy coasts with prominent beach ridges and restricted hinterland geomorphology. Mixing processes of these landward indentations are hindered by elevated sand dunes, and their salinity increases due to poor freshwater input and high evaporation leading to seasonally hypersaline conditions. These sedimented lagoons, primarily confined to the southeastern coast of the island, are biologically the least productive, with limited ecosystem values and services. Another group of moderately elongated semicircular, slightly large lagoons in the same coast, formed exclusively by submergence due to mid-Holocene sea-level rises, do not receive sufficient freshwater input leading to seasonally hypersaline conditions. They are also biologically unproductive but some are ecologically important since they provide habitats conducive to migratory birds. In contrast, some lagoons on the southern coast receive sufficient freshwater via streams draining the wet zone, maintain more estuarine salinities, exhibit rich biodiversity and serve as functional resource units. Lagoons formed by mid-Holocene submergence and recession of water level with simultaneous chain barrier formation on the high energy southwest coast, which includes cliffs, small bays and headlands, show peculiar configurations and link channel characteristics. Some of these irregular water bodies have clusters of small isles and luxuriant mangrove swamps with high biodiversity but not very rich in catadromous finfish and shellfish species due to the restricted nature of the entrance channel and nondistinct salinity gradients.
The barrier-built, seasonally hypersaline lagoon complex in the Jaffna Peninsula, the largest lagoon system in the country with multiple perennial entrances show extremely narrow salinity ranges towards the upper limit of salinity. The main lagoon is elongated and the shore parallel to eastward and southward extensions is connected by narrow channels. The other lagoon in the Jaffna Peninsula is elongated, shore parallel and ribbon-shaped and receives tidal water throughout the year but freshwater is received only from precipitation and surface runoff. Even though the lagoons in the peninsula are extremely rich in ecosystem heterogeneity their hydrology and hydrodynamics have been severely disturbed by infrastructural development for transportation and by attempts to create a freshwater river for Jaffna. There are a few virgin lagoons of moderate size also on the northern coast, south of the Jaffna Peninsula on both the east and west sides. They look very typical tropical lagoons rich in biodiversity and biological production but their structure, functions and values are virtually unknown in scientific or socioeconomic terms. The lagoons located on the east coast are not numerous but

2
relatively large in extent. They are also an outcome not only of mid-Holocene sea-level rises but of submerged multi-delta valleys or abandoned paleo estuaries. When inundated, the multi-delta valley configuration became elongated and is shore parallel with a smooth seaward shoreline; both shorelines become irregular when coastal waves are weak, and internal waves are created by the action of local winds. Configuration of a lagoon formed by inundation of an abandoned river valley is irregular with a long entrance channel extended landward. These lagoons are highly productive with a variety of associated ecosystems, large open water areas and wide perennial sea entrances. When the lagoon is too much elongated, zonation is prominent due to fewer entrance effects.
Lagoons form a particular type of natural capital which generates use values (fish, shrimp, fuelwood, salt, fodder, ecotourism, anchorage, recreation, etc.) and nonuse values (habitat preservation, biodiversity, ecosystem linkages, etc.) contributing positively towards improving the human well-being. Of many values of lagoons in Sri Lanka, only the extractive values are generally utilized at present, by way of fish and shrimp catches, salt production and use of mangrove for various purposes. Besides, coastal lagoons generate a range of nonextractive use values and nonuse values, which could add towards the total economic value. Misuse has taken place at several instances when “use” adversely affects the status of the resources or the health of the ecosystem due to vulnerability and poverty, population pressure, urbanization, development activities and multi-stakeholder issues. The status of lagoon resources shows that the resources in the majority of Sri Lankan lagoons still remain satisfactory, somewhat good or very good. Nevertheless, concerns for management of lagoons in Sri Lanka exist only where “use values” (extractive values, such as fish and shrimp) exist. There is no evidence of resources management in lagoons for inspirational, scholarly values or tacit knowledge of the same. Management for use values exhibits several stages from zero management to comanagement via community management and state intervention. Most of Sri Lanka’s lagoons have the potential for generating high extractive and nonextractive use values which could improve the human well-being, while maintaining resources sustainability. Unfortunately, these potentials have not been understood or “seen” yet by the relevant authorities, although a few instances of exploring this potential were noticed.

3
Chapter 1 Introduction
Coastal lagoons, found all around ocean coasts of the world are shallow water bodies of variable size ranging from less than 0.01 km2 to 10,000 km2, and less than 5 m deep, separated partly or wholly from the ocean by the deposition of spits or barriers, usually of sand or shingle, built up above high tide level by wave action (Emery and Stevenson 1957; Colombo 1977; Cooper 1994; Kjerfve 1994a). There are lagoons enclosed by coral reefs, either within atolls or between fringing or barrier reefs and the mainland (Bird 2010). Most of these coastal water bodies are very dynamic and productive but ephemeral in a geological time scale. They support a range of natural services including finfish and shellfish production, storm surge protection, tourism, anchorage, salt production and many others that are highly valued by society (Anthony et al. 2009). They are diverse in origin and evolution, trophic status and scenic beauty whereas some are rich in rare, endemic and migratory species and, in turn, with ecosystem biodiversity and productivity. Unlike Lagoa dos Patos (10,000 km2) in Brazil, the largest lagoon in the world, Chilka Lake (1,165 km2) in India, the largest in Asia or Lake Songkhla (1,017 km2) in Thailand, lagoons in Sri Lanka are not very large in their extent but fairly numerous in occurrence on a 1,338 km long coastline. These natural coastal resources are national assets which play a vital role in the island’s ecology and the nation’s economy. In Sri Lanka, the heterogeneous nature in general and the complexities of some coastal lagoons in particular are primarily determined by coastal and immediate hinterland geomorphology, El-Niño-driven monsoonal climate and weather, wave energy of different magnitudes, tidal fluxes, fluvial inputs and human interventions with short-sighted development goals.
Late Quaternary marine transgression and Holocene sea-level rise have resulted in the formation of coastal lagoons (Barnes 1980; Kjerfve 1994b) including in Sri Lanka (Katupotha 1988a, d; Katupotha and Fujiwara 1988; Weerakkody 1988); they are relatively young water bodies whose ages are about 6,000-7,000 years. In Sri Lanka, not all lagoons are necessarily related to drowning or Holocene submergence and emergence (Swan 1983). Coastal lagoons located in different regions experience diverse climatic regimes, oceanic influence and fluvial inputs. Hence, some features of coastal lagoons, such as their morphology, hydrography, ecohydrology, biological productivity, ecosystem services, etc., in the tropics, subject to intense solar radiation, trade winds, monsoonal rainfall, profound fluvial sediment load and low tidal amplitude may be quite different from those of temperate lagoons. Unlike tropical continental lagoons in South America, Africa and Australia, coastal lagoons located in a small tropical island may be unique owing to their specific insular characteristics. They contribute to the overall productivity in terms of total ecosystem yield of coastal waters by harboring a variety of habitats including benthic seagrasses, extensive mudflats, salt marshes, and fringe mangroves facilitating thriving of several organisms ranging from unicellular protozoans to dugongs, green turtles, roosting birds, etc. Although catadromous and anadromous finfish and sedentary and sessile shellfish species are the mainstay of pragmatic importance of lagoons, some of the lagoons are excellent habitats for migratory birds. The migratory avifauna in some coastal lagoons in Sri Lanka rank the best in the region and their numbers are far above those reported for Pulicat Lake, the second largest brackish lagoon (461 km2)in the Indian subcontinent. Because of their rich habitat-diversity and importance of endemicity, some of the lagoon sites in Sri Lanka have been designated as Ramsar sites or Wetlands of International Importance (viz., Bundala, Kumana National Park and Panama-Kudumbigala Sanctuary, Madu Ganga[River] and Vankalai Sanctuary). Because of their cohesive ecosystem linkage, their conservation is of utmost importance to both inland and inshore fisheries.
Of late, coastal lagoons have been considered as complex socioecological entities of national importance because of their economic values associated with biological production of aquatic and semiaquatic habitats and fringe mangrove vegetation. They are also important with respect to cultural perspectives and human-centered settlements around many of them. Nevertheless, due to the location of their interface between land and the ocean, and shallow depth, they are strongly subjected to natural

4
constraints; direct wind, oceanic waves and tides and rainfall-driven river fluxes, resulting in large differences and sudden changes in the physical and chemical environment and, in turn, in the ecosystem linkages. On the other hand, lagoon environments are increasingly and indiscriminately exploited for commercial, agricultural, residential and industrial development, and as dumping grounds for domestic, agricultural and industrial waste. The conversion of coastal wetlands into agricultural, aquacultural, urban and other uses in Sri Lanka has profound ecological, social and economic consequences on lagoon ecosystems, their associated natural resources, and the livelihood opportunities of those living on their margins. Further, their setting within the coastal landscape leaves them especially vulnerable to profound physical, ecological and associated societal disturbance from global climate change. Expected shifts in physical and ecological characteristics by the lagoons being impinged on by global climate change may range from changes in the flushing regime, freshwater inputs, and water chemistry to complete inundation and loss, and the concomitant loss of natural and human communities. Therefore, managing coastal lagoons in the context of global climate change is also critical. Hence, wise and sustainable use of coastal lagoons is essential because of their wonderful biodiversity, and fundamental social and economic importance, in contrast to natural and anthropogenic pressures and threats they face at different settings.

5
Chapter 2 State of Knowledge
Present Knowledge
A comprehensive knowledge on structure, functions and processes of coastal lagoons is a prerequisite for their wise and sustainable use for the human well-being while conserving their naturalness. This includes knowledge on the origin and evolution of lagoons, to some extent, and the present state of oceanic and land-based influences, on physical, chemical and biological interactions, ecosystem linkages, and human interventions to a greater extent. In other words, there should be a set of accurate baseline information on the relevant physics, chemistry and biology or ecology of lagoons. In regard to coastal lagoons in Sri Lanka, the present knowledge on their origin and evolution, ecohydrology, ecosystem processes and dynamics, goods and services provided by them and their values is scanty and incomplete. With respect to the origin, formation, evolution and distribution of lagoons in Sri Lanka, only a very few studies have been conducted (Katupotha 1988d; Katupotha and Fujiwara 1988; Weerakkody 1985, 1992). Besides, attempts have been made to show some evolutionary process of the Jaffna Complex and several northwestern coastal lagoons (Puttalam, Chilaw and Negombo) of Sri Lanka (Cooray 1968; Cooray 1984; Katupotha 1988a; Cooray and Katupotha 1991). But none of these studies have emphasized or analyzed the actual processes to identify the origin, formation, evolution and distribution of lagoons in Sri Lanka. Further, over several decades of civil war, the lagoons on the north and east coasts of Sri Lanka, which have the highest lagoon density in the island and the largest brackish water mass of the country, were inaccessible to scholars and were limited only to their mere names and atlas locations.
The number of lagoons on the entire coast of Sri Lanka has been estimated at 45 according to most scientific literature and administrative reports. Yet it is a controversial issue that coastal lagoons which are significantly different from estuaries are discriminately named as basin estuaries by many authors. An estuary, in essence, is a seaward end or the widened funnel-shaped tidal mouth of a river valley where freshwater comes into contact with seawater and where tidal effects are evident (Kjerfve and Magill 1989; Cooper 1994; Kjerfve 1994a; Bird 2008). Nevertheless, some efforts have been made to study certain aspects of some of these open-access water bodies (Negombo, Puttalam and Rekawa lagoons), but implementation of nonsystematic approaches and ad hoc methods with a tag of “management” have led to them becoming unsuccessful endeavors in most cases. Scientific studies on lagoons are essentially scattered and limited, mostly reductionist and of academic interest, leading to graduate dissertations or peer-reviewed publications. The origin and evolution of Sri Lankan lagoons are not well defined as yet and lagoons are not classified or recognized, based on their formation, ecohydrology, ecosystem productivity or services which facilitate their use in a sustainable manner within an appropriate conservation framework.
On the other hand, the present knowledge on social and economic values of lagoons in Sri Lanka is meager. Knowledge gaps in respect of social and economic values of lagoons are wide and pervasive. Only extractive values of lagoons, such as fish and shrimp, mangroves as fish-breeding habitats and for construction work, brush-pile fisheries, salt production, etc., are recognized but the importance of lagoons in generating nonextractive values, such as recreation, ecotourism, scholarly and tacit values, which could greatly contribute to improving human well-being and strengthening the national economy, has been ignored or has failed to receive the attention of researchers, planners, policymakers, and managers alike. While the Department of Fisheries and Aquatic Resources is involved in the collection of statistical information and in the management of lagoons, such activities are not carried out on a regular basis and concern for management remains low, except for a few lagoons. Nevertheless, regular data collection was observed in the coastal districts of Gampaha, Chilaw, Puttalam, Mannar, Jaffna and Batticaloa, while very little or no data on extractive values were available in some coastal districts in

6
the northeast and the south. Although the importance of state-community partnership in management (or comanagement) has been well recognized, the concept is not adequately understood and only a few attempts at establishing comanagement bodies are found. While this study attempted to understand the potential that lagoons possess in generating nonextractive values, information obtained permitted us to make only wider generalizations, because such information was strongly based on subjective judgments of fisheries officials and also because of the small sample sizes. However, field visits and discussions provided a large body of information on a range of threats facing lagoon ecosystems, showing the urgent need for intervention by the relevant authorities. Research related to social and economic values of lagoons is very much limited. Information is scarce with respect to diverse nonextractive values that exist in lagoons, although they form important sources of income to local populations. Vulnerability and poverty of local populations are two important phenomena, which have serious implications on the rate of exploitation of lagoons. Yet, the present knowledge of these phenomena is quite limited. Therefore, both incentives and funds should be made available for research activities in the above areas.
Benchmark StudyA benchmark study which includes a diagnostic analysis of scholarly literature coupled with a few field investigations on microtidal lagoons in Sri Lanka was carried out by the International Water Management Institute (IWMI) from November 2011 to March 2012 with a view to filling some of these long-standing lacunae on basic information as an addendum for present knowledge. The results of the study seem to be able to provide the foundation of knowledge required for building consensus for ecosystem-based socioecological resource management that would maintain the integrity of ecosystem services, food security and livelihood of related communities. In the process, the solution emerged for controversial definitions, determinants of variable ecosystems production, and existing causes for the problems associated with geomorphology, hydraulics, hydrology, salinograph, ecological processes and dynamics, ecosystem services, livelihood, etc., resulting from inherent characteristics and human interventions. Therefore, a number of items of information available in this report may help recipient government institutes to facilitate establishment of regulatory measures and to implement development plans and subsequent management interventions while empowering the knowledge base of the communities, highlighting coastal lagoons as functional resource units of national importance. During the study on anthropogenic interventions, special emphasis was laid on lagoons which have resulted in significant consequences on their hydrology and shoreline and, in turn, on overall lagoon characteristics.
The coastline of the island was divided into eight sectors, establishing cardinal and intercardinal or ordinal directions taking Pidurutalagala as the midpoint of the island (Survey Department of Sri Lanka 2007). Angles between each cardinal and intercardinal direction were bisected establishing eight secondary intercardinal directions (Figure 1). The coastal boundary between two corresponding points intercepted by the secondary intercardinal directions was considered as a coastal sector for respective cardinal or intercardinal directions within 45° (Figure 1). Morphological features such as perimeter fetch with heading, width of the entrance and dimensions of various artificial structures (causeways, bridges, barrages, groynes, dikes, etc.) of each lagoon were measured using Google Earth path and line ruler. Readings taken in situ, for the latitude and the longitude using GPS (GARMIN Etrex) were compared with Google readings for accuracy. The area of the lagoon was calculated using Arc GIS 9 (ArcMap Version 9.3) package whereas shoreline development (DL) was computed by Microsoft Excel using the formula DL o); where L and Ao are perimeter and surface area, respectively. Already available information on river discharges and basin dimensions were used to estimate the freshwater input per unit area, and river basin characteristics were examined to understand the magnitude of flow regulation. Further, lagoon communities were consulted to understand their dependency on lagoons whereas the state sector officials responsible for fisheries management of respective areas were invited to informal discussions and relevant information was compiled using a semi-structured questionnaire. The information provided in this report on lagoon ecosystem, flora and fauna and on their productivity essentially constitutes secondary data collated from various sources.

7
Figure 1. Eight coastal segments of Sri Lanka based on Pidurutalagala as the midpoint of the island.
The lengths of the coastline and lagoon shoreline of Sri Lanka are 1,338 and 2,791 km, respectively, and the latter skirts 1,520 km2 of a brackish water mass (Table 1). The lagoon shoreline is more than twofold compared to its Indian Ocean intact coastline. The northern coast, the longest coastline (403 km) lies between south of Tirukketiswaram and north of Ullackalie Lagoon near Pallalipuram Village and harbors 17 lagoons including the Jaffna Complex, the largest brackish water system in the island (Table 1 and Annex I).

8
The northeastern coast, the second longest coastal sector (294 km), extends up to the south of Periyakallar where the southern entrance of the Batticaloa Lagoon joins the sea skirting four lagoons whereas the east coastal sector (89 km), from Periyakallar point to the south of the Kirigalla Bay near the Bagura Lagoon, harbors 14 lagoons of 44 km2 in extent (Table 1 and Annex I). The southeastern coastal sector of the island demarcates 105 km between the Kirigalla Bay and Maha Lewaya (Saltern) skirting 16 lagoons including Malala-Embilikala twin lagoon whereas the 117 km long coastline from Maha Lewaya to the south of Kathaluwa Village where the Koggala Lagoon is connected to the sea occupies the southern coast which contains nine lagoons including another twin lagoon (Lunam-Kalametiya) of total area of 23 km2, the lowest lagoon area per unit coastline. A more or less similar lagoon area exists for the 101 km long southwest coast from Koggala to the Wadduwa beach whereas the west coast harbors three lagoons which spread over 46 km2 within a 98 km long coastline from Wadduwa to the Wennappuwa beach (Table 1 and Figure 1). The northwest coast lies between Wennappuwa beach and Tirukketiswaram for 131 km and harbors the second largest brackish water mass of the island (Table 1).
Table 1. Length of coastline, lagoon area, perimeter and number of lagoons on each coastal sector.
Coast Coastline (km) Lagoon area (km2) Lagoon perimeter (km) Number of lagoons
North 403 804 1,221 17Northeast 294 182 411 04East 89 44 174 14Southeast 105 29 149 16South 117 23 109 10Southwest 101 20 166 09West 98 46 151 03Northwest 131 372 410 09
Total 1,338 1,520 2,791 82
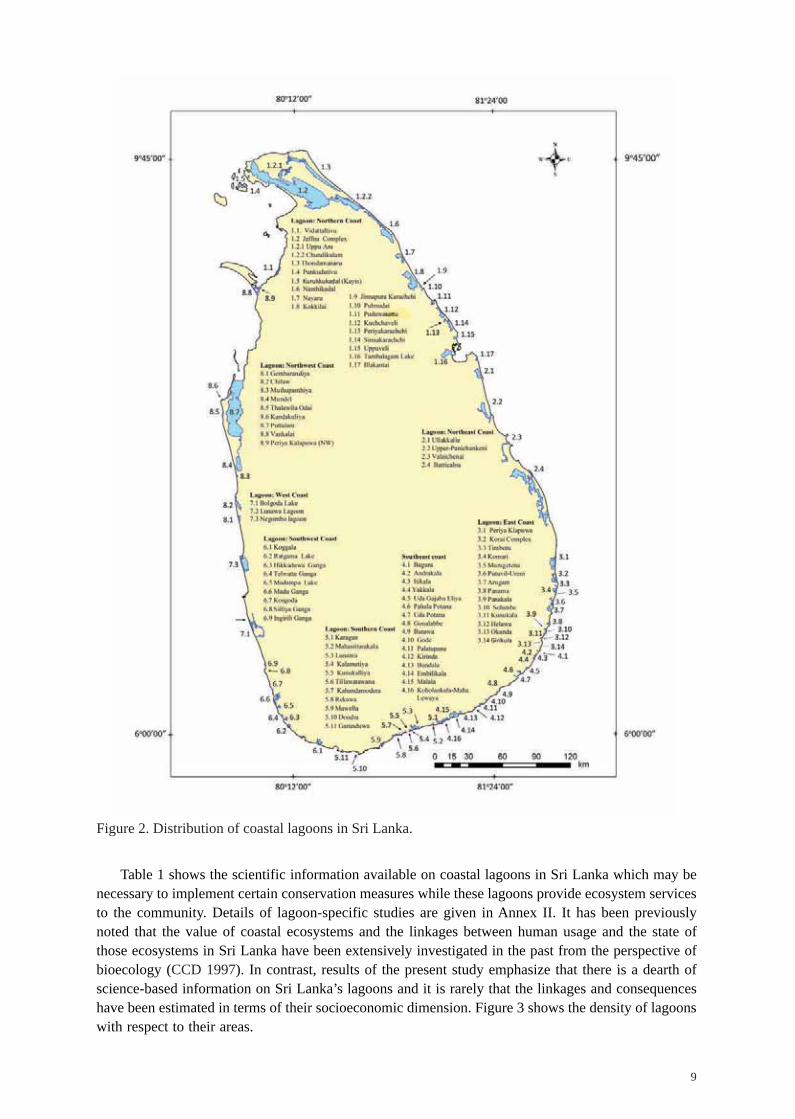
Physical features of coastal lagoons in Sri Lanka (area, perimeter, shoreline development, width of marine entrance and geographical position of its midpoint and the location of respective agroecological zones) are given in Annex I. Distribution of lagoons on the eight coastal zones is shown in Figure 2. The area of a lagoon ranges from 0.016 km2 (Kirinda Lagoon) to 441 km2 (Jaffna Lagoon) whereas the areas of 23 and 34% of the island’s lagoons range from 0-1 km2 to 1-10 km2, respectively, and only four lagoons have an area above 100 km2 (Figure 2). Of the 82 lagoons identified during the present study, 62 are located in the dry zone with different agroecological characteristics (soil, rainfall probability, etc.) while 15 and four lagoons are on the wet and intermediate zones, respectively (Annex I). A science-based knowledge of coastal lagoons is a prerequisite for their wise and sustainable use while preserving their ecological integrity.
9
Figure 2. Distribution of coastal lagoons in Sri Lanka.
Table 1 shows the scientific information available on coastal lagoons in Sri Lanka which may be necessary to implement certain conservation measures while these lagoons provide ecosystem services to the community. Details of lagoon-specific studies are given in Annex II. It has been previously noted that the value of coastal ecosystems and the linkages between human usage and the state of those ecosystems in Sri Lanka have been extensively investigated in the past from the perspective of bioecology (CCD 1997). In contrast, results of the present study emphasize that there is a dearth of science-based information on Sri Lanka’s lagoons and it is rarely that the linkages and consequences have been estimated in terms of their socioeconomic dimension. Figure 3 shows the density of lagoons with respect to their areas.

10
Figure 3. Density of lagoons with respect to their areas.
When lagoons coexist with other ecosystems with least human interference, under certain circumstances they undergo natural evolution. Mathematical models can be derived to predict physical, chemical and biological attributes in such cases. Apparently, most of the scientific studies on coastal lagoons in Sri Lanka have been focused on fringe mangroves whereas least emphasis has been laid on salt-marsh vegetation (Table 2). Bathymetry and hydrography are known for 14 lagoons while fish fauna or fish productions of nine lagoons have been studied. It is only the Negombo Lagoon on the west coast, Rekawa Lagoon on the south coast and Chilaw and Puttalam lagoons and Mundel Lake located on the northwest coast that have been subjected to a fair number of studies leaving huge lacunae of science-based knowledge on the entire lagoon ecosystem of the island (Table 2 and Annex II). Besides, attempts have been made to highlight mid-Holocene sea-level rises and formation of back-barrier lagoons on the southwest coast (Weerakkody 1985). Following the 2004 December Indian Ocean tsunami, some studies were launched to identify the tsunami chronology by analyzing sediment cores of several lagoons located south and southeast coasts that reveal exciting information (Jackson 2008; Matsumoto et al. 2010; Ranasinghage 2010).
0
5
10
15
20
25
30
35
40
45
0-1 1-10 10-20 20-30 30-40 40-50 50-60 60-70 70-80 80-90 90-100 <100
Num
ber o
f lag
oons
Area (km2)

11
Number of studies on: BM HG NT PL PP BT FS SF SG MG SM AF
North coastal lagoons 3 1 0 0 0 0 1 1 0 9 0 1Northeast coastal lagoons 1 1 0 0 0 0 0 0 0 4 0 0East coastal lagoons 0 1 1 1 1 0 1 1 0 1 0 0Southeast coastal lagoons 1 1 0 0 0 0 1 0 0 9 0 0South coastal lagoons 2 2 1 1 1 0 1 1 1 1 0 2Southwest coastal lagoons 2 2 1 0 0 0 0 0 0 2 0 1West coastal lagoons 2 3 1 2 1 1 2 2 1 2 0 2Northwest costal lagoons 3 3 1 2 2 1 3 3 1 3 1 1
Total 14 14 5 6 5 2 9 8 3 31 1 7
Notes:SG=seagrasses; MG=mangroves; SM=salt marshes; AF=avifauna.

12
Chapter 3 Origin, F ormation and Evol ution
Introduction
Coastal lagoons in Sri Lanka are relatively shallow and some are actually ephemeral, with extensive dry beds during the dry season and retaining water in the lagoon basin only during the wet season. With respect to their origin, all lagoons in Sri Lanka clearly show that they are outcomes of either submerged or emerged events, or a combination of both during the mid-Holocene sea-level rises. This is related to eustatic sea-level fluctuations and local geology and geomorphology. The inherent shapes and configurations of lagoons are influenced by monsoonal and intermonsoonal climates such as rainfall, extended dry spells, etc., and resulting sediment transport by seasonal and perennial river inputs and tidal flows and wave actions.
The degree of water circulation of a lagoon in Sri Lanka depends on the width of the marine inlets, the tidal range, the amount of runoff from adjacent land areas and the fetch of the lagoon. Maximum velocities are attained at the points where the water passes through the barriers. Accordingly, the water circulation has been shown to be dependent on the geometry of the lagoon, the geometry of the passes, the wind field, the amplitude of the tide and, to a lesser extent, on the freshwater inflow. The overall influence of the tide and wind-driven variations in the shelf sea level of the lagoon circulation depends on pass geometry, and some lagoons may be relatively insensitive to external influences due to narrow and shallow passes. Wind forcing, on the other hand, will be important in nearly all lagoons, especially large and narrow lagoons with their long axes oriented with the wind direction. Nevertheless, the fetch of most of the lagoons in Sri Lanka is not oriented along the southwest or northeast wind directions. The magnitude of the wave height and current velocity is proportional to wind speed, while fluctuations of water level are proportional to the square of the wind speed and inversely proportional to depth. Overall salinity variations are dependent on tidal exchanges, freshwater influx and local evaporation rate, while overall temperature variations depend primarily on solar input and evaporative heat loss. The above hydrodynamic parameters are useful to a greater extent to understand the behavior of coastal lagoons in Sri Lanka. Figure 4 shows the sea-level oscillations in Sri Lanka since the last glacial maximum.
Evidently, origins of coastal lagoons in Sri Lanka are related to mid-Holocene and late Holocene fluctuations. These fluctuations have been summarized by Katupotha (1995) who recognized five stages in the late Pleistocene and Holocene events. All these events are evidently related to origin, formation and evolution of lagoons in Sri Lanka.
Stage 1: From late Pleistocene to early Holocene: According to Wayland (1919), a desert-like condition occurred in much of the low country. Archaeological sites of coastal lowlands show that human artifacts of early stone-age (Paleolithic) man were overlain by these windblown brick-red colored red beds and brown earth beds. Based on 14C dating, Spath (1985) observed fossil humans’ horizons at Weuda off Kurunegala, formed about 24,300-22,100 years before the present era (BPE), and this period probably corresponded with a dry climatic phase and lower sea-level during the Last Glacial Maximum (LGM) period of Sri Lanka. It can be speculated that low-lying ridges, well-marked troughs and different levels of marine terraces between the continental slope and the present coastline have been formed due to the rapid rise of sea-level from ca 17,000 years BPE. Recent oceanographic investigations revealed that the coralline algae, limestone and calcareous sandstone had developed gradually on those features. It is suggested that the desert-like conditions of the low country during the LGM is very similar to the Pleistocene aridity in tropical Africa, Australia and Asia described by Kolla and Biscave (1977), Prell et al. (1980), Williams (1985) and Giresse (1987). Thus, the climatic, sea-level and ecological changes as well as cultural phases between the late Pleistocene and early Holocene epochs in Sri Lanka followed dry climatic conditions. By the end of this stage, the sea level

13
was -10 m to -20 m below the present level and there were no signs related to the present lagoons in Sri Lanka (Figure 4).
Stage 2: Mid-Holocene period (first episode of high sea-level rise; 6,240-5,130 years BPE):Recently obtained dates of coral samples emerging from the west, south and east coasts indicate that the mid-Holocene sea level was at least 2.5 m higher than the present level (Figure 5) in the abovementioned region (Katupotha 1988b, c, d; Wijayananda and Katupotha 1990). The sea-level variation during this period can be correlated with the Indian subcontinent and other islands in the Indian Ocean. Due to this transgression, the former drainage basins were submerged and headland-bay-beaches were formed. As a result, corals (presently buried between Akurala and Matara) thrived in former lagoons where factors were suitable for growth, forming coral reefs in many places along the southwest coast; and early Holocene coastal forests were drowned by the Post-Glacial Transgression. By this time, initial water bodies of all the large and medium-sized lagoons had been formed.
Figure 4. Sea-level oscillations in Sri Lanka since the last glacial maximum; a) about 60 m rise of sea-
6,000 years; c) the sea level reached from -20 m to the present level between 11,500 and 7,000 years
the sea-level changes at Stages 2, 3 and 4, respectively (see text). (Layout Specialist: On the X axis, please alter B.P. to BPE)

14
Stage 3: The first phase of the late Holocene period (4,390 - 3,930 years BPE, second episode of high sea level): Between Stages 2 and 3, the sea level around 4,700 years BPE was slightly below the present mean sea level. The living coral colonies and shells of the lagoons and estuaries were buried in sediment, alluvium and other debris which were washed down into the embayment by terrestrial waters. Furthermore, the shell beds were intermittently covered by vast quantities of coral sand and coral debris moved by sudden storm surges and severe monsoonal waves. This information reveals that beaches, barrier beaches and chains of barriers developed forming lagoons around the country. Figure 5 shows the mid-Holocene and late-Holocene high sea-level episodes in Sri Lanka.
Figure 5. Mid-Holocene and late Holocene high sea-level episodes in Sri Lanka.
Stage 4: The second phase of the late Holocene period (3,280 - 2,270 years BPE, third episode of high sea level): Between Stages 3 and 4, the sea level around 3,600 years BPE was also at or below the present mean sea level. It is suggested that the beach rock, slightly above the supratidal level zone along the coast was formed during this stage. 14C dating of shells embedded in emerged reef patches, buried and emerged corals, shell beds and beach rock prove that climatic changes occurred after the mid-Holocene high sea-level rise. Further, 14C dating of shell deposits along the southern coast of the Hambantota District also proves that such changes had occurred during the late Holocene period. These fluctuations were responsible for the formation of circular, semicircular and oval or rectangular shapes of the lagoons in Sri Lanka.
Stage 5: Recent beaches and sand spits, etc.: Bryant (1987) explains that there has been a relationship between CO2 warming, rising sea level and retreat of coasts in both hemispheres since around 1850. Fairbridge’s (1961) studies also indicate the rise of sea level and glacial retreat since 100 years BPE. As a result of these global changes, the secular and seasonal changes of land and sea have occurred along the present coastline of Sri Lanka. This indicates
15
that natural sources as well as human interference have caused the present configuration of the lagoon system of Sri Lanka.
Owing to the development of barrier beaches and spits during Stages 3 and 4, many coastal lagoons from the western to the eastern coastal zone (clockwise) were formed and evolved. Some examples are given below:
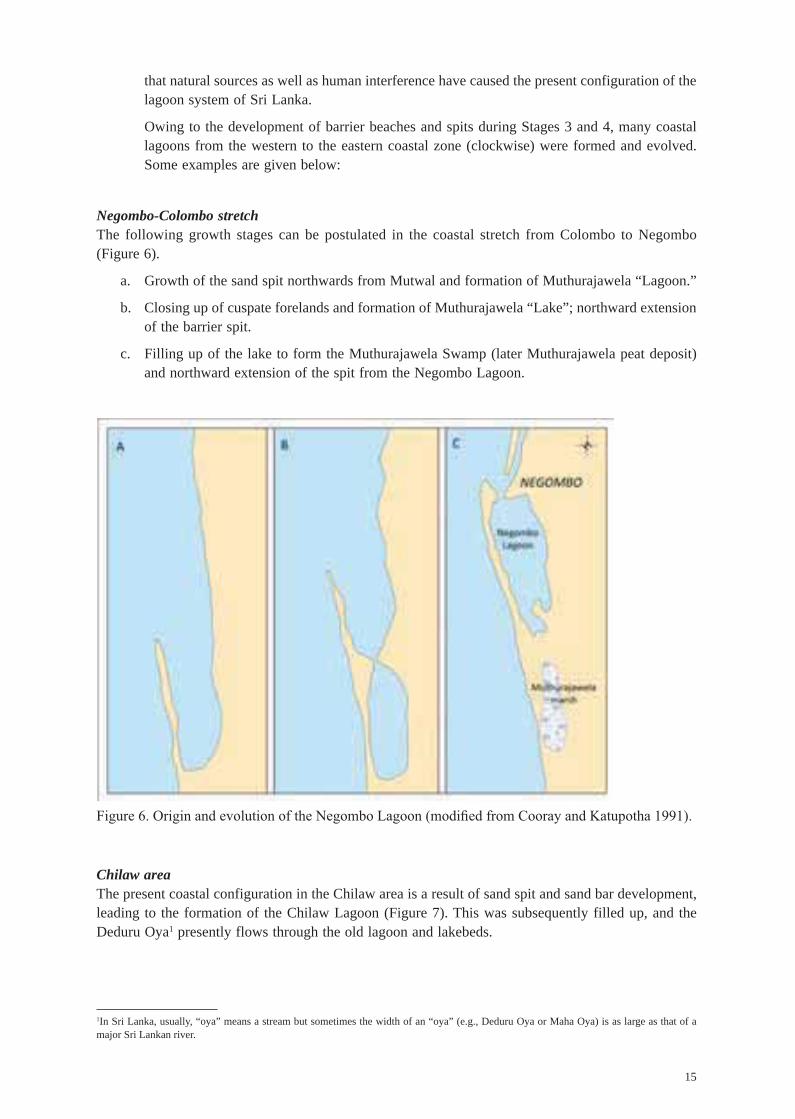
Negombo-Colombo stretchThe following growth stages can be postulated in the coastal stretch from Colombo to Negombo (Figure 6).
a. Growth of the sand spit northwards from Mutwal and formation of Muthurajawela “Lagoon.”
b. Closing up of cuspate forelands and formation of Muthurajawela “Lake”; northward extension of the barrier spit.
c. Filling up of the lake to form the Muthurajawela Swamp (later Muthurajawela peat deposit) and northward extension of the spit from the Negombo Lagoon.
Chilaw areaThe present coastal configuration in the Chilaw area is a result of sand spit and sand bar development, leading to the formation of the Chilaw Lagoon (Figure 7). This was subsequently filled up, and the Deduru Oya1 presently flows through the old lagoon and lakebeds.
1In Sri Lanka, usually, “oya” means a stream but sometimes the width of an “oya” (e.g., Deduru Oya or Maha Oya) is as large as that of a major Sri Lankan river.

16
Chilaw-Puttalam stretchTentative stages of coastal growth and evolution of this coastal zone have been identified (Figure 8): the formation of offshore sand bars and spits along the early coast line, the formation of the Mundel “Lagoon”, transformation of the Mundel Lagoon to the Mundel Lake while being separated from the Puttalam Lagoon and the growth of the Kalpitiya Peninsula. Figure 8 also shows the formation of sand spits and sand bars and the islands of Kirimundel, Karaitivu, Ippantivu and Periya Arichchal.
Figure 8. Growth stages in the coastal region between Chilaw and Puttalam lagoons.
Taking this as a guide to the future, it is possible to postulate some of the changes that might take place along the northwestern and northern coastal regions in the next few thousand years.
Puttalam areaThe predicted transformation of the Puttalam Lagoon and the Mundel Lake has taken place according to the following sequence (Figure 9):
A. Closing of the cuspate lowlands at Kalmunai point in the Kalpitiya Peninsula and the lowland opposite the mainland.
B. Formation of the Puttalam “Lake” and Kalpitiya “Lagoon” north of the lake.
C. Closing up of cuspate lowlands at Kalpitiya and opposite it in the mainland, and formation of the Kalpitiya “Lake.”

17
D. Formation of barrier islands south of Karaitivu, resulting in the formation of two lagoons, extension of Kirume, and extension of Kirumundel spit to form a third “lake,” silting up of the Puttalam Lake, transformation of the Mundel Lake into marshy land, and finally, the formation of a peat deposit similar to that of Muthurajawela are quite possible.
Figure 9. The sequence of formation of the Puttalam “Lake” and Kalpitiya “Lagoon.”
Northern regionIt is possible to trace the evolution of the Jaffna Peninsula in broad terms from available geological and geomorphological evidence. The growth stages are depicted in Figure 10.
A. Formation of islands off the northern coastline in Miocene times.
B. Attachment of these islands to the mainland by sand spits during the late Holocene period.
Figure 10. Growth stages in the coastal lagoon system in the Jaffna Peninsula.
Likewise, following the development of barrier beaches and spits in Stages 3 and 4, many lagoons in the northeastern and eastern coastal zones were formed and evolved (e.g., Nayaru, Kokkilai and Batticaloa lagoons). The origin and formation of the Vankalai Lagoon and the Periya Kalapuwa (Lagoon) at the end of the northwestern coastal zone and Jaffna Lagoon complex in the northern coastal zone were formed by drowning of the flat continental shelf and the Miocene rocky islands due to sea-level rise in the mid-Holocene period. Since the continental shelf is also wide and shallow to

18
the south of Mannar Island, currents are very strong in the narrow channels of the Adam’s Bridge and Palk Strait, particularly during the northeast monsoon. These conditions have provided the formation of northern coastal lagoons and the area has shallow coastal habitats with a unique setting which is not found elsewhere in the island. The continental shelf towards the north widens out and emerges with the platform that surrounds India. On this northern part of the shelf, there are three elevated portions, namely, (l) Pedro Bank, stretching northwards from the Jaffna Peninsula to the coast of India, (2) the Pearl Bank and Adam’s Bridge, the latter, a narrow but long sandbank between Mannar and Danushkodi, which makes the Palk Strait impassable for ships, and (3) Wadge Bank, around the southern extremity of India (Cooray 1984). This continental shelf area and the Miocene limestone mass of the Jaffna Peninsula are the submerged portion of the northern Sri Lanka; and several coral islands of the archipelago, off the mainland, became individual islands (atolls) due to the lowering of the sea level since the late Holocene period.
Distribution of LagoonsThe formation, evolution and configuration together with distribution of lagoons in Sri Lanka have a close relationship with the geology, geomorphology, monsoonal seasons and major climatic factors (rainfall rhythm, evaporation, wind velocity and direction, etc.). The climatic conditions are governed by the climatic behavior of the Arabian Sea and Bay of Bengal, and all climatic factors in Sri Lanka, which act on geological and landform formations from the central highlands to the coastal lowlands. Hence, lagoons of Sri Lanka, located around the edge of the island have evolved due to the coastal submergence during the mid-Holocene period and due to coastal emergence since the late Holocene period (Figure 2).
The distribution of lagoons in Sri Lanka is uneven and they show distinct features in extent, size and configuration. Lagoons are not found on the coastline rich in cliffs and headlands from Kala Oya estuary to Modaragam Aru estuary (limestone cliffs at Karuwalakuda and Kudremali Point), between the outfalls of Modaragam Aru and Aruvi Aru (due to location of delta-type coastal area) and Parangi Aru to Mandekadal Aru where the long-shore littoral drift is obstructed by Mannar Island and Adam’s Bridge. Besides, the inland rivers do not supply a large amount of sand for beach nourishment. These factors have caused nondevelopment of lagoons in the abovementioned coastal sectors.
Lagoons on the northern coastal zone
alluvial and lagoonal deposits, silt and clay. Some places of the barrier beaches and barrier ridges of the coastal belt are covered by red and reddish-brown earth, and red and brown sand. In recently formed beaches (early Holocene period), they are covered by beach sand and dune sand as well as by red and brown sand. Miocene limestone (from Vedditalativu Lagoon to Chundikkulam Lagoon) and granitic gneiss and undifferentiated charnockite and proterrozoic gneissic rocks are found (mainly between the north and north-north east coastal sector) as the basement rock.
The continental shelf area and Miocene limestone mass of the Jaffna Peninsula are the submerged portion of the northern Sri Lanka, and several coral islands of the archipelago off the mainland became individual islands (atolls) due to the lowering of the sea level since the late Holocene period. A similar situation had occurred within the Jaffna Peninsula forming the present lagoons, e.g., Puduvakkattu and Kurukkudal (Kayts) lagoons; the irregular shapes in several places (Jaffna and Uppu Aru lagoons) were a result of the lowering of sea level (Figure 10). Beside the elongated shore parallel, lagoons have developed along the eastern coast owing to the littoral drift, which followed the Miocene rocks (e.g., Thondamanaru) and granitic gneiss as a basement (e.g., Chundikkulam and Nanthikadal lagoons).

19
Figure 11. Distribution of lagoons in the northern coastal zone (western part).
Figures 11and 12 show the unequal sizes and distribution in the northern coastal zone (Annex I). The Jaffna Lagoon shows the submergible and emergent features (barrier development) which created its large size. Also, lagoon sizes are small due to location of leeward (Kalpitiya Island chain, Mannar Island and islands of Palk Bay) and submerged small river courses in the area. Accordingly, the size of each of the 29.41% of lagoons is less than 1.0 km2 while the corresponding size of each of the 35.29% is between 1.0 and 8.0 km2. Also, the corresponding size of each of the 41.18% is in the range of 10-80 km2. These are somewhat large and directly face the northeast monsoonal wind and rainfall. Configuration of the main landmass, somewhat flat and wide continental shelf, development of sand barriers with dunes and location of wide flat terrain between the low cliffs of the floodplain and coast have caused such distribution of lagoons.

20
Figure 12. Distribution of lagoons in the northern coastal zone (eastern part).
Lagoons in the northeastern coastal zoneThe northeastern coast extends from the Illankantai Lagoon ( Periyakallar
zone, an even distribution pattern is obvious, but sizes and shapes are different due to local geology, landforms of the floodplain and strong winds during the northeast monsoonal period (Figure 13 and Annex I). Batticaloa is the largest and longest among the four lagoons, formed due to the submergence of multi-delta stream outlets in flat terrain. The height of the lagoon is at mean sea level.
This coastal area directly faces the monsoonal winds and the littoral drift is oriented from the southeastern to the northwestern directions due to the configuration of the mainland and the continental shelf, which is about 8.0 km wide (from Karaitivu to seaward), and it reaches nearly 20 km (to the east of the Uppar Lagoon). The continental shelf area slopes with small canyons, which have been responsible for maintaining the shore face dynamics of the lagoons in this zone.
The morphology of the continental shelf and the coastline as well as shore face dynamics are maintained by underlying geology. Near the shore, these characteristics help onshore waves to set up the movement of water as a whole towards the coastline. At this stage, the coastal currents also act as a major component of transporting the sand parallel to the coastline (Swan 1983; Ranasinghege 2010). The lagoons of this coastal stretch are not completely typical in form as those of the west and southwest coasts. They are equally extensive, though in large part silted up. The rivers of this side of the island are subject to rapid flooding and bring down a heavy load of detritus to the sea.

21
Figure 13. Distribution of lagoons in the northeastern coastal zone.
Lagoons in the eastern coastal zoneThe eastern coastal zone stretches from Periyakallar
Geologically, this coastal zone has been formed by biotite gneiss, hornblende-biotite gneiss, migmatitic, and granitic in parts (metagabbro, metadiorite, metatonalite, etc.) and granitic rocks. Weathering of these basement rock and rock outcrops in the area formed the configuration of the island during the Holocene submergence.
The lagoons in this stretch are not equal in size (Periya Kalapuwa and Girikula Lagoon) and the size of the lagoon decreases southward. These uneven sizes (Annex I) are the results of the crescent plan shape of the country (Figure 14). This plan shape has decreased the direct influence of the northeast monsoons and strong winds. Each of about 57.12% of the lagoons is less than 1.0 km2 in size (Annex I). Shapes of the lagoons are also variable to a great extent: circular, semicircular and oval, and irregular on the landward, all due to coastal submergence and existing geology and landforms in the area. In this coastal zone lagoons are small, as a result of reduction of the direct influence of wind direction and ocean waves and swells. The Korai Complex shows a peculiar bulbous shape with four distinct semicircular parts (Tandiadi, Omari, Mulladi and Korai) whereas Solambe, Kunukala, Helwa, Okanda and Girikula lagoons have extremely small sac-like configurations.
According to the age models for Okanda and Panama, higher sea level has affected the estuary until about 4,950 years BPE. The age model for the most landward site of Okanda suggests that the area had been influenced by the higher sea level until around 4,900 years BPE (Ranasinghege 2010) suggesting that recession of the sea level had started around 4,900 years BPE. These sea-level fluctuations clearly coincide with the 14C data related to episodes of coastal evolution along the west, southwest and southern coasts since the mid-Holocene period (Weerakkody 1992; Katupotha 1995).

22
Figure14. Distribution of lagoons on the eastern coastal zone.
Lagoons in the southeastern coastal zone
Coastal geology in the area comprises biotite gneiss, hornblende-biotite gneiss, migmatitic and granitic in parts (metagabbro, metadiorite, metatonalite, etc.) and granitic gneiss. Weathering of these basement rock and rock outcrops in the area formed the configuration during the Holocene submergence. Minihagalkanda beds, which are significant, had been formed during the late Miocene period, and are located to the southwest of the Udapothana Lagoon. The lagoons along the southeastern coastal zone are irregular basins bounded on the landside by low bluff of decomposed gneissic rocks, and on the seaside in part by elevated bands of decomposed rock, but mainly by wide beach-bars capped by blown sand (Coates 1935). The shape of the lagoons in the Kumana National Park is marsupial while Bundala, Malala, Koholankala and Maha Lewaya are oblong in shape.
The crescent shape of the landmass of Sri Lanka, enclosing the area from both strong winds (southwest and northeast monsoons) and low wave energy due to the location of the Great and Little Basses, reducing the inland sand load for beach nourishment have been accountable for the distribution of lagoons and the maintenance of their sizes and peculiar shapes (Figure 15 and Annex I). It is evident that the lagoons have become larger from the Bagura Lagoon to Malala, and each of 62.5% of the lagoons is less than 1.0 km2 in size. There are others each of which is less than 6.5 km2 in size. Evolution, formation, sizes and distribution patterns are similar to those of the southeastern lagoons. The crescent shape of the country, narrow beach strips, plan shape, i.e., of the continental shelf from Dondra Head eastward, waves and wind directions, and low sand budget have been responsible for this distribution. In ordinary seasons, salt separates from the concentrated brine in the lagoons of the southeastern coastal zone at the end of the southwest monsoon. The gypsum separated from the sea brine during evaporation, however, is partly left behind as rosette-shaped groups of crystals which are fairly plentiful in the upper layers of the lagoon clay (Coates 1935).

23
Figure 15. Distribution of lagoons in the southeastern coastal zone.
Patches of shell-bearing clayey beds are found at intervals along the rim of the southeastern lagoons. The shells all belong to existing species, which have been dated to the mid- and late Holocene times (Katupotha 1988a, b; Weerakkody 1988). After regression started around 4,900 years BPE, dune fields have developed towards the east from Kirinda, changing the courses of rivers and small streams and being responsible for initiating infilling of the former estuaries with terrestrial deposits. During the high sea-level period, the wave action was so strong that estuaries and lands of other coastal water bodies have become eroded. With the recession of sea level, estuaries and other water bodies were encompassed by a chain of barriers, with barrier spits forming estuarine lagoons and back-barrier lagoons. By this time, the wind and wave actions were not so strong and lagoons shaped as circular and semicircular and several lagoons were shore parallel.
Lagoons in the southern coastal zone
The geological background of the southern coastal zone is somewhat complicated. Accordingly, from Karagan Lewaya (presently this lagoon has been converted to the Hambantota Harbor) to Rekawa Lagoon, the area is underlain by granitic rocks and biotite gneiss, hornblende-biotite gneiss, migmatitic and granitic in parts (metagabbro, metadiorite, metatonalite, etc.). Weathered in situ soils and gravels, laterite and lateritic soils are closer to the coast, and become visible as ridge and valley topography. These are the extensions mainly of the Wanni, Ranna and Highland complexes. The ridge and valley topography formed due to local geology and sloped towards the sea has been clearly responsible for the present formation and distribution of lagoons in the area.
The southern swells of the Indian Ocean impact directly on the ridge and valley topography in the southern coastal zone. Accordingly, geological structures represented as low cliffs and rocky outcrops in the area are responsible for the nondevelopment of the coastline. Similarly, the very narrow continental

24
shelf has caused the increase in the depth of the deep sea. These facts and very low volumes of sand from inland have been responsible for the reduction in the size of the lagoons in this coastal zone (Figure 16 and Annex I). In addition to the above, locations of geological and climatological boundaries (to the west and east from Tangalle) are also accountable for the distribution and sizes of the lagoons.
The wet zone of the island shows typical drowned valley systems cut off from the open water by sand bars and characteristics of a submerged coastline, while in the dry zone, the lagoon channels connected to the sea have turned parallel to that of the spit (Coates 1935). Such sandspits and lagoons are characteristics of emerging shorelines. But morphological characteristics are almost similar, which show small headland-bay beaches formed accordingly. Following the recession of the sea level since the late Holocene times, sand barriers were formed in front of each water body. Weerakkody (1988) discussed the paleo bay and lagoon development of the Kalametiya-Lunama twin lagoon. The area is characterized by former headland-bay beaches with shell beds commonly known as the Hatagala-Hungama beds. Oyster shells with marine sediments have been observed around the Kalametiya Lagoon and beaches close-by. Similar distributional trends of paleo bay and lagoon development due to Holocene sea-level fluctuations are found in Madihe (Matara), Karagan Lewaya and Udamalala areas (Katupotha and Fujiwara 1988; Katupotha 1988a, b; 1995).
Figure 16. Distribution of lagoons in the southern coastal zone.
Lagoons in the southwestern coastal zone
of sizes and shapes of the lagoons, which are shown in Figure 17 and Annex I. The main rock types in this coastal zone are undifferentiated, tectonically intercalated meta-sediment and meta-igneous rocks, charnockite and chamockite gneiss. Weathering of these meta-sedimentary rocks formed the ridge and valley topography in the area representing the initial shape of the lagoons, and they supply fine sands and clay minerals to the lagoons. Besides the above, coral has thrived in these paleo lagoons, which were formed in headland-bay beaches during the high sea level rise

25
in the mid-Holocene period (Katupotha, 1988a,b; Weerakkody, 1988, 1992), now designated as buried coral deposits.
Although the hills and rises are closer to the sea, the irregular lagoons are distributed from the Koggala Lagoon to Madu Ganga, and also up to the Bolgoda Lake Complex (west coast). It is clear that in the case of the lagoons in this area, except for small lagoons such as at Kosgoda, Silliya and Ingirili rivers, low distances between headland and somewhat high relief have influenced this distribution. Besides the above, high rainfall, influence of the wind, waves and swells to the coast, and formation of chains of marshy and sand barriers are the salient characteristics as compared with western, southern and southeastern coasts.
Figure 17. Distribution of lagoons on the southwestern coastal zone.
Lagoons in the western coastal zoneThe paleo sand ridges (parallel to the lagoons) are located on the eastern margin of lagoons in this coastal
garnet), charnockite gneiss (including hypersthene-bearing metagabbro and metadiorite), hornblende gneiss, hornblende-biotite gneiss, biotite gneiss (metagabbro, metadiorite, and metatonalite) and cordierite gneiss are the main rock types in the area, and occur as basement rocks. Rock promontories and rock outcrops in the area have helped configure lagoons and their surroundings. Accordingly, the irregular shape on the landward has resulted from the drowning dendritic drainage pattern of low ridge and valley topography. Also, the Lunawa Lagoon emerges as an elongated shore parallel ribbon.
Coates (1935) concluded that the change in character of the coast that occurred near Colombo was due to the gradual weakening of the bottom current, and that in the north of Colombo the rapid accumulation of detritus has overcome the effect of submergence of the coast and allowed the formation of sand-spits and lagoons of the Negombo type. Accordingly, the distribution pattern of the lagoons in this coastal zone has been governed by the location of the Panadura Canyon, the flat continental shelf but rocky basement of Mt. Lavinia and its surroundings and the littoral drift northward from the Kelani Ganga outfall. The distribution pattern shows that the sizes of lagoons are larger towards the north from this area (Figure 18 and Annex I). The development of shore parallel long barrier beaches and dry climatic conditions has been responsible for this distribution.

26
Figure 18. Distribution of lagoons in the western coastal zone.
Lagoons in the northwestern coastal zone
It is possible to recognize a cycle with several stages in its development of the coastal landforms. The first stage is the formation of a barrier beach or, attached to the land at one end, a barrier spit, which grows in length as more sand is added to its seaward end forming “Zeta form” beaches.
The unconsolidated geological materials of this coastal zone are created due to the formation of beach and dune sand, brown, gray sand, red brown earth, red and brown sand, alluvial and lagoonal deposits, clay, silt and sand. All these have been entirely underlain on biotite gneiss, hornblende-biotite gneiss, and migmatitic and granitic in parts. Also, granitic gneiss and Miocene limestone deposits mainly in the Mannar area are the main basement rocks. Following these rock types and climate, red-yellow latosols, regosols on raised beaches, spits, dune sands and alluvial soils have been supplied as sediments to the Negombo-Puttalam Lagoon complex representing its evolutionary stages (Figures 6 to 9), while around Mannar area, especially from Vankalai Lagoon to Periya Lagoon, the soil types have been derived as solodized, solonetz and solonchak as well as grumusol soils supply as inland sediments.
Lagoons such as Vankalai and Periya at the end of the northwestern coastal zone were formed by drowning of flat continental shelf and the Miocene rocky islands due to sea-level rise in the mid-Holocene period. Barrier spit systems have formed a straight shoreline encompassing the sandy islands. But the formation of the Periya Lagoon is the result of drowning the Miocene low rocky outcrops and coral reefs of the continental shelf and inland floodplain. This submergence caused the seawater to enter the inland although, along the coast, the irregular shape of the lagoon can be seen in the landward side (Figure 19 and Annex I).

27
Figure 19. Distribution of lagoons on the northwestern coast.
Thus all the lagoons in the eight coastal zones have shown similarities as well as disparities during their formation and evolution. This indicates that, in Sri Lanka, lagoons show drowning and coral development; barrier spit beach formation; drowning and barrier development and barrier spit destruction. Again, all these are related to coastal submergence and emergence with mid-Holocene and late Holocene sea-level fluctuations. Similarly, continental shelf and coastal geology, landforms, climate (mainly rainfall rhythm, wind and wind directions, duration of wet and dry conditions around the coast, etc.), and littoral drift have also contributed to the configurations of these lagoons.
There is no lagoon development from the mouth of the Kala Oya up to Vankalai Lagoon in this coastal stretch (Figure 19). Development of floodplains enclosing the area from Puttalam Lagoon and near-shore bar system, and the location of Kudiramalai Point and highland closer to the coast have been responsible for this distribution. Sizes of the lagoons in this zone are very similar to those of the lagoons of the northern coastal zone, especially in the western part (Annex I).
When we look at the distribution pattern of the lagoons in Sri Lanka one salient feature can be identified. If we look counterclockwise from Colombo to Sangamankanda Point the lagoons are small, headland bay beaches are developed and back barriers and barrier chains are small. But geology, geomorphology, soil development, rainfall and monsoon in the whole area are different. Consequently, if we look clockwise from Colombo to Sangamankanda Point the lagoons are large, elongated, shore parallel, and covered by long barrier chains with emergent characteristics.

28
GeomorphologyVery little is known about the geomorphology of coastal lagoons in Sri Lanka. The physical dimensions of lagoons (variability of area, length, volume and average width) which can be explained by the variability of stream slope, upstream of the lagoon and total annual catchment precipitation need to be studied. Statistical relationships between these dependent and independent variables are significant in explaining the variations in geomorphology of lagoons related to geological, hydrological, climatic and ecological factors as mentioned by Bird (2000). Lagoons vary in size and shape in relation to antecedent morphology, the form of the enclosing barrier, and the extent of erosion and deposition since their initial formation.
From initial formation up to now, we gather that lagoons in Sri Lanka have been subjected to form and die due to erosion as well as accretion. These processes are mainly a result of minor sea-level fluctuations, climate change and anthropogenic impacts since Stages 3, 4 and 5. Sullivan et al. (1995) indicate that there are three principal forces of coastal erosion in Sri Lanka:
a) Natural processes such as monsoon-generated waves or tidal inlet migration.
b) Human-induced changes such as:
c) Biological activity such as reef destruction caused by starfish or natural death.
Both erosion and accretion are a result of monsoonal winds. During the southwest monsoonal period (May to September) coastal erosion is rather high. From 1930 to 1995, the Negombo coastal area had eroded 59 m while the Mt. Lavinia coastal area had eroded 18 m. During these 50 years (up to 1995), the southwest coast had declined by 304 m. Littoral transport (drift) is mainly to the north throughout the southwest monsoon and also moderately to the south and southeast. Likewise, during the northeast monsoonal period, severe coastal erosion continues around the Mullativu coastal area. Throughout the relevant 50 years the coast had receded 67 m, and the littoral drift had occurred to the north and east. Due to the littoral drift in the same 50-year period, the coastal deposition had been about 110 m (Sullivan et al. 1995). These data can be correlated with global climatic changes as mentioned by Fairbridge (1961) and Bryant (1987). As a result, the width of a barrier chain (barrier beaches and spits) of the southwest coast was reduced intermittently and changed the lagoon inlets accordingly.
Due to construction of large bridges for rehabilitation of main roads, construction and renovation of fishery harbors, coastal engineering works (revetments, construction of groynes and parallel rocky ridges to the coast), and housing schemes and urban development, many channel inlets of former lagoons had changed, e.g., Vankalai Lagoon and Periya Kalapuwa, between the Jaffna and Thondamaru lagoons in the northwestern coastal zone; and Koggala, Rathgama, Hikkaduwa, Madampe, Madu Ganga and Bolgoda Lake systems in the southern, southwestern and western coastal zones. As a result, some lagoons were separated into two parts obstructing the seawater and tidal water movement and tidal sediments. They also caused the changes in salinity levels, water temperature and mixing of nutrients, inflow of water from inland streams and terrestrial floods. Like these anthropogenic activities some lagoon inlets were dying, e.g., Telwatta Ganga now appears as a dying lagoon.
Although different coastal construction activities (harbor development, housing schemes and settlement projects; coastal protection works) continued along the western and northwestern coastal zones, the littoral drift supplies a considerable amount of sand. Owing to the formation of high berms in front of inlets of the lagoons and lagoon channels, some lagoons have become ephemeral or dying, e.g., Gembarandiya Lagoon, Toduwawa channel to the Chilaw Lagoon, Muthupantiya, Udappuwa (southern mouth of the Mundel Lake) and Thalawila Odai (in Kalpitiya Peninsula). Similarly, Kandakuliya Lagoon has been recently formed (during the past 25-year period) with transporting of sand by littoral drift. This lagoon is underlain on lagoonal mud, silt and clay as well as on windblown sand.

29
Besides the coastal changes, as mentioned by Sullivan et al. (1995), the high rate of deposition is a result of climatic changes, littoral drift, wind patterns and low humidity. Accordingly, many small lagoons along the coast, completely covered by beach ridges and sand dunes, are becoming salt pans and waterholes (tanks) and, presently, most of them can be identified as dying lagoons. Thus, the waterhole between Bagura and Andarakala lagoons complex and other back-barrier waterholes, Wilapala tank, Palugaswala salt pan, Kudadiyabana wewa (tank), Mahadiyabana wewa, and Pathirajawela and Atulla water bodies in the southeastern coastal zone can be categorized as dying lagoons.
The lagoon ecosystem consists of bodies closely linked by reciprocal exchanges, in particular, by the stream catchments, the lagoon and the sea. The area from which all the freshwater flows from the land to the sea is heavily affected by human activity (agricultural, industrial and urban areas). This factor, changes to the ratio of land to the sea, and changes to the winds and the tides, have resulted in a modification to the morphology of the lagoons.
As mentioned earlier, initial formation of lagoons in Sri Lanka is a result of coastal submergence during the mid-Holocene rise of sea levels. The mid-Holocene coastline of Sri Lanka created a low cliff coastline surrounding the country, and from the mouth of the Kelani Ganga to Kumbukkan Oya (counterclockwise), mainly of the southwest, southern and southeastern coastal zones, the hills and ridges of low cliff coastline were very close to the sea. On the other hand, the hills and ridges of the low cliff coastline from the Kelani Ganga to Kumbukkan Oya (clockwise) mainly in the western to eastern coastal zones were extended in a wider area. Both areas were located in different climatic zones: streams with different drainage networks and catchment areas, flow rates and volumes, rainfall rhythms, flood periods and flood levels and sedimentation loads. Together with all these, salinity regimes related primarily to the interaction of freshwater from rain and rivers with saltwater from the sea, to the dimensions and variability of marine entrances; and micromorphology of the entrance surroundings, condition their ecology, and determine the extent of mangroves, salt marsh and transitions to freshwater vegetation, which in turn influence swamp development and encroachment; tidal flow patterns as well as human activities have obviously been responsible for the development and change of the geomorphology of lagoons in Sri Lanka.

30
Chapter 4 Hyd rology an d Hyd rography
Hyd rology
Sri Lanka’s 1,338 km long coastline which excludes shorelines of lagoons is characterized by a variety of other coastal features; bays and headlands, long sandy beaches devoid of bedrock outcrops, raised barrier and ilmenite beaches, cliffs, rocky foreshores, promontories, reefs, delta channels with fluvial sediment, dunes, and corallian limestone belts (Swan 1983). A sickle shape spit which armored the entrance of the Puduwakattu Lagoon at the mouth of Kunchikumban Aru is a fascinating coastal feature. A unique feature of the northeast coast is Trincomalee and Koddiyar bays with many coves and inlets and the Tambalagam Lake, a cutoff from the sea by barrier beaches and ridges. Although the island has a well-knitted radial drainage pattern some parts of the southeast coast do not receive sufficient river inputs and the coastline is sheltered by elevated dunes and narrow beaches created by wavelets driven by strong southwest monsoonal winds (Swan 1983). The lagoons on this coast are small, silted to a great extent and show a significant drawdown under dry and wet weather. The coastal stretch between Magama (Dorawa Point) and Ambalntota, with extensive sand dunes, is associated with vegetation backed by rather semicircular or oblong lagoons, locally named as lewayas (salterns) because of natural crystallization of salts during the dry season. In the southwest and west coastal sea major rivers are discharged into lagoons backed by barrier beaches, which are irregular and relatively small except the Negombo Lagoon. The coastline from Balapitiya to Galle is characterized by numerous pocket beaches backed by weathered rises of country rocks whereas from Balapitiya to Bentota barrier beaches predominate. The west coast from the south of Negombo up to Kalpitiya on the northwest coast of the island is characterized by a series of elongated shore parallel lagoons shielded by northwardly extended spits and barriers.
Lagoons located on different coastal sectors of the island with diverse geomorphology experience different climatic regimes, marine influences and direct fluvial inputs, in some cases, resulting in variable shapes, configurations and different ecosystem assemblages so that Sri Lankan lagoons are diverse as a result of the diverse nature of the island. This has also resulted from the watershed characteristics of the hinterland. Of the 82 lagoons identified during this study, only 36 receive freshwater directly through seasonal or perennial rivers/streams but a majority of them are seasonal whose watersheds are confined to the dry zone (Table 3). Of the 103 rivers draining the entire landscape of the island, 69 discharge into 36 coastal lagoons (Table 3). The sources of freshwater for the rest of the lagoons are essentially precipitation and surface runoff from limited drainage or, otherwise, floodwater from adjoining drainage basins. For example, the Chilaw Lagoon receives floodwater from the Demure Oya and surface runoff via Lunu Ela. Since the annual evaporation loss from surface water bodies in the dry zone is greater than the precipitation, it is extremely important to receive additional freshwater for lagoons to maintain the salinity ranges of their brackish water. Failure to receive sufficient freshwater results in natural crystallization of salt during the dry season as occurring in many lagoons in the dry zone, which are categorized as hypersaline such as in Jaffna, Thondamanaru, Periyakarachchi, Sinnakarachchi and Puttalam lagoons, Mundel Lake and operational and abandoned salterns in the south and southeast coasts.
Of the 82 lagoons in Sri Lanka identified during this study, only 36 receive freshwater through seasonal or perennial rivers/streams but a majority of them are seasonal whose watersheds are confined to the dry zone (Table 3). The sources of freshwater for the lagoons in Sri Lanka are primarily precipitation and surface runoff or floodwater from adjoining drainage basins.
Annual freshwater inputs per unit area (i.e., million cubic meters per hectare per year [Mm3ha-1yr-1]) were calculated for the 35 lagoons as an Index of Freshwater Influx (IFF) (Table 3). These values are extremely low for hypersaline lagoons, such as Puttalam, Mundel, etc. The highest

31
index of freshwater influx was computed for the Valaichchenai Lagoon (0.665 Mm3ha-1yr-1) although it was located in the dry zone, followed by Madampa Lake (0.662 Mm3ha-1yr-1) and Rekawa Lagoon (0.581 Mm3ha-1yr-1). The high IFF value of the Valaichchenai Lagoon may be attributed to the large amount of freshwater carried by the Maduru Oya and the relatively small size of the lagoon (Table 3). Although the Batticaloa Lagoon receives the largest volume of freshwater (1,460 Mm3ha-1yr-1) via eight seasonal streams, the IFF was 0.115 Mm3ha-1yr-1, primarily due to its large surface area. Eight lagoons located in the wet zone and fed by perennial rivers, from Koggala to Negombo, have a high drainage index (drainage per unit area) and high IFF values (Table 3). IFF values were relatively high for Kalametiya, Kahandamodara and Rekawa lagoons, although they are located in the dry (DL1) and intermediate (L1-L2) zones. These lagoons are fed by the rivers whose headwaters are confined to the wet zone; but they also receive irrigation drainage diverted from the Walawe irrigation scheme. Coastal lagoons with small watersheds and little discharge volumes such as the Bolgoda Lake, Madu Ganga, Hikkaduwa, Madampa and Koggala lagoons in the wet zone, most of the lagoons in the dry zone of the island and shores which are affected by the action of surf and long-shore drifting, tend to disappear gradually (Swan 1983). This situation is further aggravated by upstream flow regulation for irrigation, flood control, etc. Most of the rivers/streams discharging into lagoons in the dry zone have been regulated by constructing irrigation reservoirs, weirs or other types of partial diversions. Colonization of mangrove associates outcompeting true mangrove species in Rekawa, Kalametiya and Kahandamodara is a classic example resulting from the implementation of the Walawe irrigation scheme that, in turn, resulted in changes in the hydrology of Kichigal Aru, Urubokka Oya and Kirama Oya (Dahdouh-Guebas et al. 2005). The impact of Kirindi Oya Irrigation and Settlement Project (KOISP) on Malala Oya-Embilikala and Bundala lagoons in the Bundala Sanctuary (Bakker and Matsuno 2001; Renault et al. 2001; Nguyen-Khoa and Smith 2004; Piyankarage et al. 2004) will be highlighted under hydrography and land-based interventions. Arulananthan (2004) attributed the elevated salinity in the Puttalam Lagoon over the last several decades to regulations of Kala Oya and Mee Oya, the major inflows to the lagoon. Cooray (1984) stated that the Mundel Lake will become salt marshes in the future due to hydrological changes that have taken place over several decades. The importance of inflows-related hydrodynamics for effective management of biodiversity conservation of the Negombo Lagoon and Muthurajawela Marsh has been explicitly demonstrated by Devendra (2002).

32
Table 3. Watershed and hydrological characteristics of lagoons receiving stream inputs.
Lagoon Area AEZ WS FWI DRI IFF (km2) (km2) (Mm3yr-1) (Mm3km-2) (Mm3ha-1yr-1)
1.2 Jaffna Complex 441.00 DL3-4 494 109 0.221 0.0021.2.2 Chundikkulam 72.28 DL4 1,203 329 0.273 0.0461.6 Nanthikadal 46.792 DL3 579 182 0.314 0.0391.7 Nayaru 17.60 DL3 251 87 0.347 0.0491.8 Kokkilai 53.491 DL1, DL3 1,233 358 0.290 0.0671.11 Puduwakattu 1.94 DL1 207 72 0.348 0.3711.14 Sinnakarachchi 7.936 DL1 145 59 0.407 0.0741.16 Tampalakamam Lake 20.84 DL1 521 178 0.342 0.0852.2 Uppar-Panichchankeni 29.50 DL2 295 146 0.495 0.0492.3 Valaichchenai 13.21 DL2 1,840 878 0.477 0.6652.4 Batticaloa 126.58 DL2 2,422 1,460 0.603 0.1153.1 Periya Kalapuwa 18.37 DL2 304 139 0.457 0.0763.2 Korai Complex 9.96 DL2 114 45 0.395 0.0453.6 Pottuvil-Ureni 24.49 DL2 479 213 0.445 0.0873.7 Arugam 11.50 DL2 611 394 0.645 0.3433.8 Panama 14.76 DL2 480 218 0.454 0.1483.12 Helawa 1.59 DL5 52 18 0.346 0.1134.1 Girikula 0.24 DL5 16 3 0.188 0.1254.2 Bagura 1.77 DL5 93 16 0.172 0.0904.10 Butawa 0.95 DL5 39 5 0.128 0.0534.16 Embilikala 2.91 DL5 60 7 0.117 0.0244.14 Malala-Embilikala 9.17 DL5 464 81 0.183 0.1185.6 Lunama-Kalametiya 2.00 DL1 223 71 0.318 0.3555.9 Kahandamodara 6.04 DL1 352 198 0.563 0.3285.10 Rekawa 2.58 I (L1-L3) 301 150 0.498 0.5816.1 Koggala 6.15 WL4 65 65 1.000 0.1066.2 Rathgama Lake 2.18 WL4 10 18 1.800 0.0836.3 Hikkaduwa Ganga 1.79 WL4 55 89 1.618 0.4976.4 Telwatte Ganga 0.36 WL4 55 89 1.618 0.4796.4 Madampa Lake 1.80 WL4 91 112 1.231 0.6226.5 Madu Ganga 7.35 WL4 60 119 1.983 0.1627.1 Bolgoda Lake 12.14 WL4 378 495 1.310 0.4087.4 Negombo Lagoon 33.34 WL3-WL4 736 845 1.148 0.2538.4 Mundel Lake 31.50 DL3 444 116 0.261 0.0378.7 Puttalam Lagoon 357.69 DL3 4,384 1,061 0.242 0.030
Note: AEZ - Agroecological zones; DL - Dry zone, Low country; WL - Wet zone, Low country; WS - Watershed; FWI - Freshwater input; DRI -Drainage Index; IFF - Index of Freshwater Flux.

33
Hyd rography
Hydrographic parameters such as depth, contours, temperature, salinity, pH, visibility, and stratification of a lagoon are determined by morphometric, climatic, hydrological, and watershed characteristics of the lagoon, and tidal fluxes and wave actions of the adjacent ocean. Of the climatic parameters, the direction and the magnitude of wind play an important role with respect to mixing, stratification, currents, water movement and littoral erosion and, in turn, nutrient dynamics and primary productivity. Therefore, the configuration of the lagoon and the alignment of its fetch with monsoonal wind direction are also important in tropical countries experiencing monsoonal wind. The importance of hydrographs on water chemistry and nutrient dynamics is well understood (Mandelli 1998). Hydrographic features such as salinity and water transparency of thermally stratified waters appear to influence seabird distribution of lagoons in the sea north of Jaffna and it was correlated to the availability of their major prey (Pérez-Rusafa et al. 2007a, b). Chandana et al. (2008) derived a correlation between salinity and the abundance of migratory birds in Malala-Embilikala and Bundala lagoons in the Bundala National Park (a Ramsar Wetland) and attributed high abundance of migratory birds in Embilikala Lagoon to food availability and transparency under low saline conditions (Gunawickrama et al. 2008). Richness of fish species increases with the volume of the lagoon and the openness parameter, both of which characterize the potential influence of the sea on general lagoon hydrography; richness of fish species is also related to the total transversal area of the inlet. In general, the fishery yield increases with chlorophyll-a concentration in the water and exponentially with shoreline development which has direct bearings to the light climate and lateral transport of nutrients. With respect to total fish assemblage composition, geomorphologic features coupled with hydrographic variables explain the trophic characteristics of the lagoon. Human engineering interventions modify shoreline development, sedimentation rate and depth via land reclamation or building dikes or marinas. This may affect the influence of the open sea, modifying the configuration of natural inlets. Some of these activities could be intentionally directed at improving biological productivity but results may be adverse in many instances.
A few lagoons in Sri Lanka are known for their bathymetry; Jaffna Lagoon (Sachithananthan and Perera 1970), Nanthikadal and Nayaru lagoons (Perera and Sachithananthan 1977), Puttalam Lagoon (Perera and Siriwardena 1982), Bolgoda Lake (Siriwardena and Perera 1986), and Batticaloa Lagoon (NECCDEP 2010d); bathymetric maps are also available at the National Aquatic Resources Research and Development Agency (NARA) for Rekawa, Koggala, Negombo and Chilaw lagoons and Mundel Lake. Most of these lagoons are shallow with mean depth less than 2 m but Koggala and Batticaloa lagoons have areas more than 3 m deep whereas Mundel Lake is very shallow and the maximum depth does not exceed 1.2 m. No information is available on density-temperature stratification, but prominent salinity layers develop in deep areas of Puttalam Lagoon under calm conditions (Arulananthan 2004). Light climate is reported as Secchi depth values for several lagoons but temperature and pH values have been reported in most hydrobiological studies conducted in Sri Lankan lagoons (see Silva 2005). However, light penetrates down to the bottom in lagoon sites where seagrasses are well distributed (Jayasuriya 1991a; Johnson and Johnstone 1995; Singappuli 2004; Ariyananda 2008). Studies conducted on physicochemical characteristics of lagoons have never attempted to explain the patterns of temperature and pH distribution to relevant biotic and abiotic variables. However, mixing patterns, circulations and freshwater and tidal fluxes of the Puttalam Lagoon (Arulananthan et al. 1995; Ekanayake et al. 1995;Wijeratne et al. 1995, 2000; Wijeratne and Rydberg 2007); Mundel Lake (Arulananthan 2004); Negombo Lagoon (Rajapaksha 1997; Rajapaksha and Jayasiri 2000; Wijeratne et al. 2004a), and Chilaw Lagoon (Wijeratne et al. 2004b) have been studied. Spatiotemporal distributions of salinity of several lagoons in Sri Lanka are fairly known (Table 4).

34
Table 4. Salinity ranges of lagoons where studies have been carried out (*before construction of groyne). Relevant references are quoted in the text.
Lagoon/Lake Entrance Middle Inflow area
Min Max Min Max Min Max
Jaffna Complex 28 37 23 34 - -Batticaloa 4.8 30.2 0 12 0 3Arugam 0 56 0 50 0 42Embilikala - - 0.4 28 - -Malala - - 0.71 48.3 - -Rekawa 0 38.3 3.9 27.7 0 35.1Koggala* 0.4 19.6 0.6 13.6 0 8Madu Ganga 4.2 28.3 4 10 0 4Bolgoda Lake - - 0 15 - -Negombo 4.5 33.8 0 30.2 0 6.5Chilaw - - 0 35.4 - - Mundel Lake 20 55 9 109 22 34Puttalam 22 36 22 34 4 40
Note: Min = Minimum; Max = Maximum.
Jaffna LagoonAnnual salinity range in the Jaffna Lagoon was relatively narrow towards the upper limit (28-37 ppt) but there were seasonal patterns, the lower values coinciding with the northeast monsoons while the peak salinities occurred in June (Sachithananthan 1969; Arudpragasam 1974). There were also spatial and diurnal patterns in salinity distribution in the Jaffna Lagoon being linked to oceanic currents of the Indian Ocean and freshwater flux from the north central part of the island (Arudpragasam 1974). Seasonal patterns in salinity were more or less similar to the studies conducted lately although lower or upper boundaries may change according to prevailing local weather and climate as reported by Chithravadivelu (1994) (Figure 20). Apparently, the Jaffna Lagoon, which has the lowest IFF of 0.002 Mm3ha-1yr-1 (Table 3), does not receive a sufficient amount of freshwater either from precipitation-runoff or from seasonal streams to maintain its brackish nature throughout the year thus becoming seasonally hypersaline (Table 4). The huge water mass of this rather leaky lagoon (Arulananthan 2004) is subjected to good tidal mixing through multiple and wide entrances but the amount of freshwater reaching the main lagoon via Kalawalappu Aru and Akkarayan Aru is insignificant for proper mixing and dilution. Further, the Elephant Pass causeway may barricade the freshwater movement from Chundikkulam to the main lagoon. Chundikkulam is expected to have less saline water than the Jaffna Lagoon since it is fed by three seasonal streams including Kanakarayan Aru draining the southern portion of the peninsula. Nevertheless, implementation of the proposed “River for Jaffna” project will have unwarranted consequences in abiotic and biotic environments in the lagoon complex.
Batticaloa LagoonBatticaloa Lagoon, the longest elongated shore parallel brackish water body in Sri Lanka is a vertically homogeneous water mass with a marked horizontal salinity gradient, a typical characteristic of elongated shallow tropical lagoons (NECCDEP 2010c). With respect to the salinity gradient, the lagoon is segregated into three zones: northern, middle and southern zones. The monthly salinity fluctuation of the lagoon is significant, as the tide is choked; the salinography is primarily determined by the freshwater discharge, river discharge, precipitation, evaporation and surface runoff into the lagoon (NECCDEP 2010e). Salinity gradient along the north-south axis is stronger in the narrow southern zone than that

35
Figure 20. Salinity variation in Jaffna Lagoon in 1991-92.
of the wider northern zone and a stronger salinity gradient implies sturdy gravitational circulation (NECCDEP 2010e). Annual salinity ranges in the Batticaloa Lagoon were quite variable and the annual range for the northern zone was 4.8-30.2 ppt while it was 0-12 ppt and 0-3 ppt for the middle zone and the southern zone of the lagoon, respectively (NECCDEP 2010c). Figure 21 depicts the fluctuations of salinity in three zones of the lagoon as reported by NECCDEP (2010c). This can be attributed to an elongated and irregular configuration of the lagoon and the discharge of eight seasonal streams to the lagoon from its various landward points and extreme narrowness of the lagoon at the southern sector and seasonally tidal nature of the southern marine entrance at Periyakallar. Distinct zonation of salinity gradient in the Batticaloa Lagoon has resulted in establishing three salinity-dependent zones as tidal, brackish water and freshwater in the lagoon. Consequently, the lagoons have been successfully colonized by flora and fauna characteristics in both brackish and freshwater environments (Vinobaba and Vinobaba 2003; NECCDEP 2010e).

36
Arugam LagoonIn contrast, Arugam Lagoon located on the southeast coast showed a bimodal annual salinity variation resulting from a large amount of freshwater brought into the lagoon via Heda Oya twice a year. Heda Oya drains an extent of 661 km2 of the DL2 agroecological zone and discharges 398 Mm3yr-2 to a 1,150 ha lagoon (Table 4 and Figure 22). Nevertheless, salinity in Arugam Bay was extremely high in October and ranged from 42 to 56 ppt indicating hypersaline conditions (Table 4) (NECCDEP 2010a). The small size of the lagoon and extremely high wind-driven evaporation may lead to hypersaline conditions in October. But it is necessary to reinvestigate the salinography of Arugam Lagoon which shows an unusual pattern of salinity for a lagoon located in the dry zone. Apparently, the lagoon has been highly affected by urban development.
Hydrography or salinography of most of the lagoons located along the southeast coastal stretch is unknown due to their location in restricted national parks. Nevertheless, because of their very location in the Bundala National Park, bordering the Kirindi Oya Basin, some attention has been paid to Malala-Embilikala and Bundala lagoons. Marked changes in salinity and other physicochemical parameters including micronutrients have been reported for Malala-Embilikala and Bundala systems after the implementation of KOISP (Renault et al. 2001; Smakhtin and Piyankarage 2003; Nguyen-Khoa and Smith 2004; Piyankarage et al. 2004). Chandana et al. (2008) also reported wide ranges of salinity for Malala (0.8 - 48 ppt) and Embilikala (4-28 ppt) twin lagoons during their studies on migratory birds (Table 4).
Rekawa LagoonOf the 11 lagoons in the southern coast only the Rekawa Lagoon has been subjected to detailed hydrographic studies (Priyadarshana and De Silva 1996; Singappuli 2004). Rekawa Lagoon, an elongated and shore parallel, bean-shaped water body located on the southern coast is also a barrier-built coastal lagoon. The lagoon is connected to the open ocean by a narrow deeper inflow-outflow channel which receives a perennial freshwater flow from the Kirama Oya whose watershed (223 km2)is confined to the wet zone of the island and discharges 357 Mm3 annually to the Rekawa outflow tidal channel. Merging Kirama Oya, with the tidal channel of the lagoon has resulted in unique hydrodynamic and hydrographic consequences (Singappuli 2004). This is clearly depicted by seasonal and spatial distribution patterns of salinity or salinography. The open water salinity hardly exceeds 15 ppt and never becomes zero due to the peculiar hydrodynamics of the lagoon determined by the position of freshwater inflow. The tidal channel showed the highest salinity which did not reach the level of seawater, perhaps
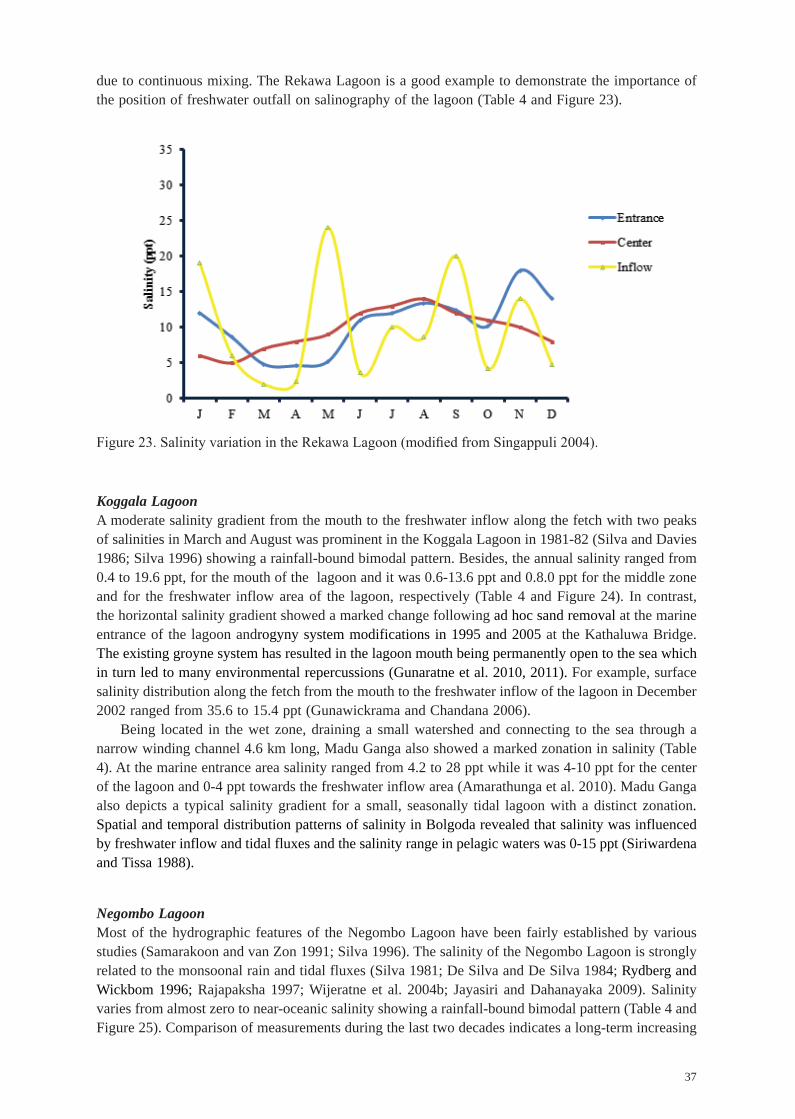
37
due to continuous mixing. The Rekawa Lagoon is a good example to demonstrate the importance of the position of freshwater outfall on salinography of the lagoon (Table 4 and Figure 23).
Koggala LagoonA moderate salinity gradient from the mouth to the freshwater inflow along the fetch with two peaks of salinities in March and August was prominent in the Koggala Lagoon in 1981-82 (Silva and Davies 1986; Silva 1996) showing a rainfall-bound bimodal pattern. Besides, the annual salinity ranged from 0.4 to 19.6 ppt, for the mouth of the lagoon and it was 0.6-13.6 ppt and 0.8.0 ppt for the middle zone and for the freshwater inflow area of the lagoon, respectively (Table 4 and Figure 24). In contrast, the horizontal salinity gradient showed a marked change following ad hoc sand removal at the marine entrance of the lagoon androgyny system modifications in 1995 and 2005 at the Kathaluwa Bridge. The existing groyne system has resulted in the lagoon mouth being permanently open to the sea which in turn led to many environmental repercussions (Gunaratne et al. 2010, 2011). For example, surface salinity distribution along the fetch from the mouth to the freshwater inflow of the lagoon in December 2002 ranged from 35.6 to 15.4 ppt (Gunawickrama and Chandana 2006).
Being located in the wet zone, draining a small watershed and connecting to the sea through a narrow winding channel 4.6 km long, Madu Ganga also showed a marked zonation in salinity (Table 4). At the marine entrance area salinity ranged from 4.2 to 28 ppt while it was 4-10 ppt for the center of the lagoon and 0-4 ppt towards the freshwater inflow area (Amarathunga et al. 2010). Madu Ganga also depicts a typical salinity gradient for a small, seasonally tidal lagoon with a distinct zonation.Spatial and temporal distribution patterns of salinity in Bolgoda revealed that salinity was influenced by freshwater inflow and tidal fluxes and the salinity range in pelagic waters was 0-15 ppt (Siriwardena and Tissa 1988).
Negombo LagoonMost of the hydrographic features of the Negombo Lagoon have been fairly established by various studies (Samarakoon and van Zon 1991; Silva 1996). The salinity of the Negombo Lagoon is strongly related to the monsoonal rain and tidal fluxes (Silva 1981; De Silva and De Silva 1984; Rydberg and Wickbom 1996; Rajapaksha 1997; Wijeratne et al. 2004b; Jayasiri and Dahanayaka 2009). Salinity varies from almost zero to near-oceanic salinity showing a rainfall-bound bimodal pattern (Table 4 and Figure 25). Comparison of measurements during the last two decades indicates a long-term increasing

38
trend in salinity in the Negombo Lagoon, but its causative factors have not been identified as yet. Water at the bottom of the lagoon was more saline than surface water towards the marine entrance, especially during the dry weather (Silva 1981) indicating vertical stratification (Rajapaksha 1997). The surface salinity ranged from 4.5 to 34.8 ppt at the sea entrance whereas it was 1.4-24 ppt and 0-15.2 ppt for the mid-lagoon and at the freshwater outfall, respectively (Table 4). During high freshwater discharge, the lagoon shows a marked horizontal salinity gradient but becomes well mixed with decreasing freshwater input.

39
Mundel LakeThe Chilaw Lagoon, which has no direct river inflow except from Lunu Oya shows a wide salinity range (0-35 ppt) and it has been attributed to oceanic influence and flood flow of Deduru Oya (Wijeratne et al. 2004a).
High salinity coincides with extremely high evaporation during dry spells since there is no perennial freshwater flow. Low salinity is maintained during the rainy season as floodwater from Deduru Oya reaches the lagoon via outflow channel and surface runoff and drainage via Lunu Ela (Table 4). The Mundel Lake is extremely hypersaline as reported by Ariyananda (2008) and the salinity ranged from 10 to 109 ppt in 1998 (Figure 26). The highest salinities reported for the Lake in 1987 was 65 ppt and it was the same value in 1993 (Jayasiri et al. 1998; Jayasiri and Rajapaksha 2000). At present, Mundel Lake receives floodwater only via Baththulu Oya Marsh and precipitation, and surface runoff as the three seasonal inflow streams to the lagoon (Madurankuli Aru, Kalugamuwa Oya and Rathambala Oya) have been regulated upstream of them. Extremely high salinity values reported by Ariyananda (2008) for 1998 may be attributed to the dry spell of the year. The highest salinity occurred in February-March and it decreased in April and increased gradually towards August-September. The lowest salinity coincides with the onset of the northeast monsoon during October-November. Although the pattern was similar, salinity range was 5-45.6 ppt in 1993-1994 as reported by NARA and the highest salinity was 65 ppt in 1987 for the Mundel Lake (Jayasiri et al. 1998; Jayasiri and Rajapaksha 2000).
Puttalam LagoonIn the case of the Puttalam Lagoon, a significant decline in salinity over the last 50 years has been reported, which has been attributed to the regulation of freshwater input via Kala Oya and Mee Oya (Durairathnam 1963; Arulananthan et al. 1995). Computed index for freshwater influx for the Puttalam Lagoon was 0.030 Mm3ha-1yr-1 and this may be an overestimate since correct river input data to the Puttalam Lagoon are not available after water diversion from Kalawewa to the Malwathu Oya Basin and the construction of Inginimitiya and other reservoirs on the Mee Oya Basin. Further, the position of the Kala Oya outfall to the Puttalam Lagoon, at Dutch Bay, also hinders the mixing power of freshwater with lagoon water. The outfall of Kala Oya to the Puttalam Lagoon is located 38 km north of the southern boundary of the lagoon. Surface salinity at the marine entrance is higher than that in the middle and southern parts of the lagoon although Kala Oya discharges into the lagoon near its marine entrance (Table 4 and Figure 27). Lower salinities have been reported in the southern part of the

40
lagoon at some instances, perhaps during the rainy season where Mee Oya discharges into the lagoon. But, the prevalence of high salinities in the southern part of the lagoon is evident from year-round salt production and the occurrence of extensive salt marshes. Further, Kala Oya outfall near the marine entrance of the lagoon does not make any significant salinity distribution as noticed at the Rekawa Lagoon. This is mainly due to reduced inflow of Kala Oya after diversion and streamflow regulation coupled with unusual hydrodynamics at the river outfall near the marine entrance of the lagoon.
Apparently, lagoons located in the southwest and west coasts and the Batticaloa Lagoon in the northeast coast have typical estuarine salinity regimes, saltwater inflow from the sea being diluted by rainfall and freshwater brought into the lagoon through runoff. Lagoons on the dry zone coasts lose more water by evaporation and are susceptible to crystallization of salt. Many such lagoons are in operation exclusively as salterns (e.g., Palatupana, Bundala, Koholankala, Maha Lewaya) and some are left abandoned for unknown reasons (e.g., Uda Gajaba Eliya, Pahala Potana, Uda Potana, Gonalebbe, Kirinda, Malala, Mahasittarakala, Kunukalliya). The Mundel Lake is being used for salt production as a domestic industry on a subsistence scale, but the southeast part of the Puttalam Lagoon is used for commercial-scale salt production. Former salterns in the Jaffna Lagoon complex (e.g., Elephant Pass, Uppu Aru) and Thondamanaru are now being rehabilitated for salt production. Apparently, some large lagoons located in the dry zone coasts have never been reported to become hypersaline leading to crystallization of salts (e.g., Nanthikadal, Nayaru, Kokkilai, Thambalagam Lake, Ullackalie, Uppar-Panichchankeni, Valaichchenai, Batticaloa, Periya Kalapuwa, Korai Complex, Komari, Ureni-Potuwil, Arugam, Panama, Lunama-Kalametiya and Kahandamodara), perhaps because they receive sizable amounts of freshwater during rainy seasons.

41
Chapter 5 Ecosys tems and Biodive rsity
Lagoon Flora and Fauna
Coastal lagoons are highly productive ecosystems because of their wide range of genetic, species, habitat and ecosystems diversity. They contribute to the overall productivity in terms of total ecosystem yield of coastal waters by harboring a variety of habitats, including pelagic phytoplankton, benthic macro-fauna, seagrasses and seaweeds, intertidal salt marshes, and fringe mangroves. Lagoons are transition habitats for catadromous and anadromous finfish and shrimp species while providing lodgings for sedentary and sessile shellfish species. Epiphytic algae attached to seagrass provide excellent feeding and nursery grounds for a variety of organisms including catadromous fish larvae while enhancing the biodiversity of a lagoon by providing a physical refuge from predation (Heck and Thoman 1984; Harris et al. 2004). Salt marshes which are mostly predominant habitats in semiarid zones constitute one of the most productive natural vascular plant communities in the world (Whittaker 1975).
The abundance of dugongs and green turtles in the Dutch Bay of Puttalam Lagoon several decades back was attributed to the dominance of seagrass meadows (Durairathnam 1963). Extremelyrich biodiversity has been reported from several coastal lagoons in Sri Lanka, and some of them are designated as protected areas, or Ramsar sites, Wetlands of International Importance (Madu Ganga, Kumana National Park and Panama-Kudumbigala Sanctuary, Bundala and Vankalai). Lunama-Kalametiya has been declared as a wetland sanctuary and the biodiversity of this site has been extensively studied (IUCN 2005). Madu Ganga supports tracts of pristine mangrove forest, and harbors nationally important IUCN red-listed mangrove species, which are rich in habitat and ecosystem diversity (IUCN 2002b). The Vankalai Sanctuary adjoining the Vankalai Lagoon, the fourth wetland of international importance, covers an area of 4,839 ha and consists of a variety of ecosystems which range from arid-zone thorn scrubland, arid-zone pastures and maritime grasslands, sand dunes, mangroves, salt marshes, lagoons, tidal flats, seagrass beds and shallow marine areas. Due to the integrated nature of shallow wetland and terrestrial coastal habitats, this sanctuary is highly productive, supporting high ecosystem and species diversity. Besides, such habitats provide excellent feeding and living habitats for a large number of water birds, including migratory species, which also use this area on arrival and during their exit from Sri Lanka. The Ceylon Birds Club reported a shorebird population of 1.2 million from Viddattaltivu Lagoon in 2010, while the highest recorded number from the entire country was 304,000 in a previous year.
PhytoplanktonPhytoplankton, the base of the pelagic food web, determined by nutrient availability, light climate and grazing pressure of zooplankton and phytoplanktivorous fish is extremely important in ecosystem balance in coastal lagoons. The density of the phytoplankton population is determined in terms of chlorophyll-a biomass. Phytoplankton composition and diversity of coastal lagoons in Sri Lanka are hardly known. Durairathnam (1963) recorded 75 species of phytoplankton from the Puttalam Lagoon and reported Dinophyceae and Cyanophyceae as two major groups with high densities during the southwest monsoon, while De Silva and Wijeyaratne (1977) identified 23 taxa of phytoplankton in the gut contents of gray mullet (Mugil cephalus) collected from the Negombo Lagoon. A survey conducted by NARA in 1993 on the Mundel Lake reported the presence of Chrysophytes whereas Ariyananda (2008) recorded Diatomophytes, Chlorophytes and Dianophytes in moderate numbers in the Mundel Lake.

42
SeagrassesSeagrasses, the marine angiosperms, are considered to be among the most productive submerged systems. They serve as a source of energy for complex food webs, provide habitats for aquatic organisms including epiphytes to consolidate sediment (Fonseca, 1989), produce detritus (Walker and McComb 1992; Alphonse and Winemiller 1997) and area source of dissolved and particulate organic carbon for the aquatic food webs (Romero et al. 2006). They also serve as nursery functions for a large number of fish, crustaceans and bivalves that use these habitats as a refuge, particularly in the larval stages of their life cycles that are vulnerable to sudden environmental changes and also susceptible to predation (Johnson and Johnston 1995; Al-Rousan et al. 2005). Although temperature, light and nutrients are crucial, the sheltered zone with a substrate consisting of sand, mud and dead corals seems to be ideal for dense growth of seagrasses, rich in species diversity (De Silva and Amarasinghe 2007). So far, altogether 16 species belonging to 10 genera have been reported from four lagoons (Puttalam, Mundel, Negombo and Rekawa) by various authors (Durairathnam 1966; Abeywickrema and Arulgnanam 1991; Jayasuriya 1991a; Dayaratne et al. 1997; Singappuli 2004; De Silva and Amarasinghe 2007). Of the 16 seagrass species reported from four lagoons, five belong to the genus Halophila (Table 5). In addition to species composition and their distribution in the four lagoons in Sri Lanka (Negombo, Puttalam, Mundel and Rekawa), the importance of the production of seagrass is compared to the primary production of pelagic phytoplankton in Puttalam (Johnson and Johnston 1995) and Rekawa lagoons (Singappuli 2004). A recent resource survey conducted by NARA recorded several species of seagrasses from limited sites of the Northern Province including most of the lagoons (NARA 2010). The distribution of seagrasses along the coast from northeast to southeast is virtually unknown. No records are available from the lagoons located from Thondamanaru up to Rekawa. Hence, it is difficult to get a clear picture of seagrass distribution in coastal lagoons in Sri Lanka.
Seagrass beds cover 22% of the Negombo Lagoon area and are highly productive, providing habitats for a variety of brackish water organisms including many commercially important shrimps, crabs, etc. The seagrass beds in the Negombo Lagoon constitute the single most important habitat type supporting the exceptionally high fish production of 150 kgha-1yr-1 which is an extremely high value for coastal lagoons (Jayakody and Dahanayaka 2005). Besides, seagrass meadows have been subjected to various threats due to human activities. (e.g., destructive fishing practices, collection of invertebrates or shellfish harvesting, construction of physical structures, altering oceanic tidal fluxes, influx of agrochemicals, emergence of macroalgal stands, regulation of inflows, effluent discharge from shrimp farms and solid waste disposal. Pahalawattaarachchi et al. (2005) have shown the effects of macroalgae on the productivity of two major seagrass species of the genera Halophila and Halodule in the Negombo Lagoon; similar observations have been made in other parts of the world (McGlathery 2001). Changes in seagrass ecosystems in the Negombo Lagoon, especially in relation to past development activities, have also been studied (Pahalawattaarachchi et al. 2005). Once seagrass beds are damaged, restoration cost may be extremely high since lateral hydrodynamics of a particular area is crucial. Hence, it is very difficult to plan restoration of seagrass, and there are few success stories related to recovery at least at the initial stage. Decline of the standing crop of seagrass ecosystem in northern, eastern and western parts of the Negombo Lagoon is estimated at 96% from 1997 to 2004 (De Silva and Amarasinghe 2007).
MangrovesMangroves are also highly productive but extremely vulnerable ecosystems confined to intertidal zones of coastal environments including lagoons. They have special adaptations to harsh environmental conditions, and mangrove habitats are considered as biodiversity hot spots (Kumara et al. 2010). Besides, mangroves support the depending communities by providing finfish and shellfish, fuelwood and building materials, dyes for coloration of fishing nets and fruit juice which have pragmatic values (Amarasinghe 1988; Costa and Wijeyaratne 1994; Jayatissa et al. 2002a; Gunawardena and Rowan 2005). In addition to their cultural values, and importance of recreation and tourism, they also show an array of mitigations and adaptations for climate change. Mangroves are also excellent environs for

43
Table 5. Reported seagrass species from different coastal sectors in Sri Lanka.
Species North NE East SE South SW West NW
Cymodocea rotundata x xCymodocea serrulata x xEnhalus acoroides x xHalodule pinifolia x Halodule uninervis x xHalophila beccarii xHalophila decipien x xHalophila minor xHalophila ovalis x x xHalophila ovata x x Potamogeton pectinatus x xNaja marina x Ruppia maritima x x xSyringodium isoetifolium x x xThalassia hemprichii x xZostrea sp x
Total 8 7 7 8
Note: NE, SE, SW, NW = Northeast, Southeast, Southwest, Northwest, respectively.Sources: Abeywickrema and Arulgnanam 1991; Jayasuriya 1991a; Dayaratne et al. 1997; Singappuli 2004; De Silva and Amarasinghe 2007; NARA
2010.
aesthetic enjoyment and creative productions such as films, telecinema, paintings and songs which have tacit values. Today, protection of mangroves worldwide is based almost entirely on their purported importance to fisheries and a number of rare and endangered species (Alongi 2002). Because the intertidal swath is narrower in Sri Lanka than in other parts of the Indo-Malay Region, on account of the small tidal amplitude, mangroves show a ribbon or patchy development instead of occurring in extensive swampy forests (Swan 1983). Distribution patterns of mangroves and their diversity in Sri Lanka are fairly understood (Aruchelvam 1968; De Silva 1986; Pinto 1986; Jayasuriya 1991b; Amarasinghe and Balasubramaniam 1992a, b; Amarasinghe 1997a, b; Pinto and Swarnamali 1997; Jayewardena et al. 1999; Jayatissa et al. 2002a, b; Dahdouh-Guebas et al. 2005; Jayakody et al. 2008; NECCDEP 2010c).
Of the 29 species of mangroves reported from Sri Lanka (Pinto 1986) Aegiceras corniculatum, Bruguiera gymnorrhiza, Cerebera manghas, Lumnitzera racemosa and Rhizophora apiculata are the most widely distributed species. The distribution of mangroves in the Sri Lankan coast is summarized in Table 6. Cerebera manghas has now changed as a mangrove associate.
A moderate density of mangrove has been reported from most of the northern lagoons with a small number of species. For example, mangroves are discontinuously distributed along the coastline, and are absent along exposed shorelines of most lagoons in the north. The largest patch of nearly a 100 m wide mangrove belt dominated by Sonneratia caseolaris and Avicennia marina has been recorded in the Achchankulam area of Mannar (NARA 2010). Most of the fringing mangroves in the north coast are scrub mangroves mainly comprising Avicennia marina. The reason for the shorter stature could be the prevailing long-term droughts, high saline conditions and frequent cutting by humans for security reasons. Compared to mainland fringing mangroves from Achchankulam to Vankalai the island fringing mangrove in Mannar has low productivity. A luxuriant growth of beach mangrove stand occurs between the beach and the coastal shoreline of Vidattaltivu Lagoon located immediately north of Periya Kalapuwa (Mannar). The occurrence of beach mangrove stands is closely related to littoral drift, restricted wave action and fluvial inputs from the hinterland. The mangrove distribution in the northeast and east coasts
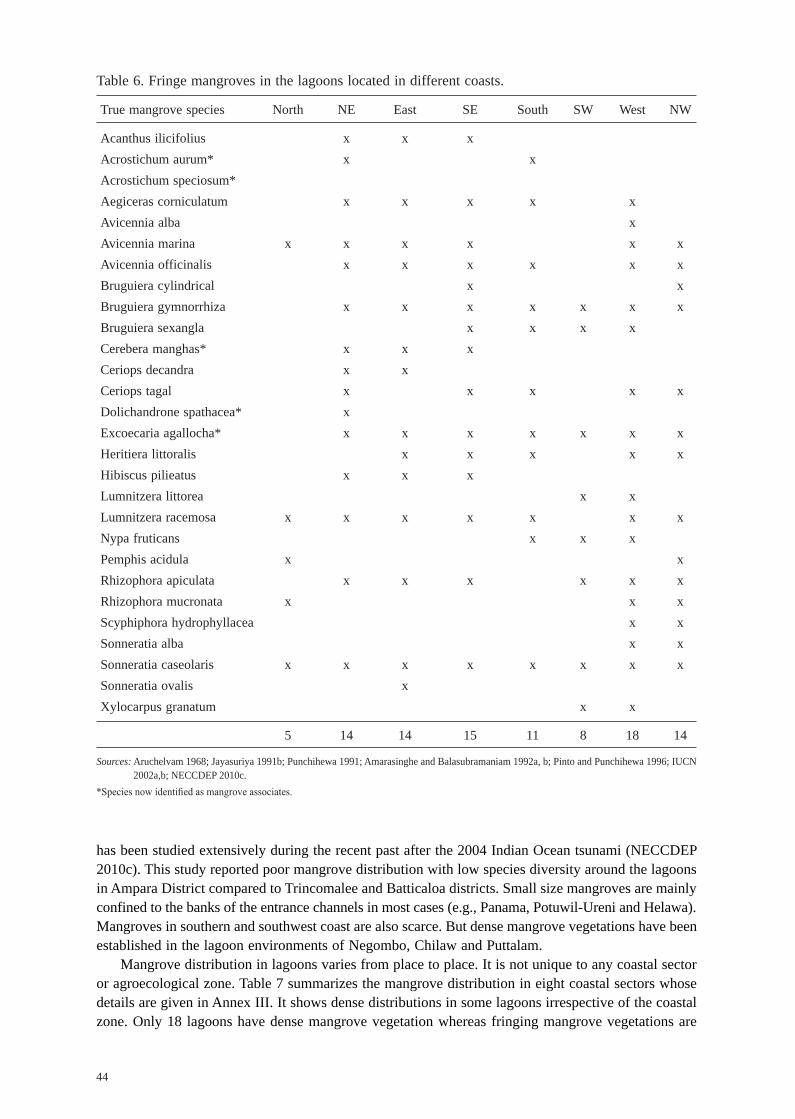
44
Table 6. Fringe mangroves in the lagoons located in different coasts.
True mangrove species North NE East SE South SW West NW
Acanthus ilicifolius x x x Acrostichum aurum* x x Acrostichum speciosum* Aegiceras corniculatum x x x x xAvicennia alba xAvicennia marina x x x x x xAvicennia officinalis x x x x x xBruguiera cylindrical x xBruguiera gymnorrhiza x x x x x x xBruguiera sexangla x x x x Cerebera manghas* x x x Ceriops decandra x x Ceriops tagal x x x x xDolichandrone spathacea* x Excoecaria agallocha* x x x x x x xHeritiera littoralis x x x x xHibiscus pilieatus x x x Lumnitzera littorea x x Lumnitzera racemosa x x x x x x xNypa fruticans x x x Pemphis acidula x xRhizophora apiculata x x x x x xRhizophora mucronata x x xScyphiphora hydrophyllacea x xSonneratia alba x xSonneratia caseolaris x x x x x x x xSonneratia ovalis x Xylocarpus granatum x x
5 14 14 15 11 8 18 14
Sources: Aruchelvam 1968; Jayasuriya 1991b; Punchihewa 1991; Amarasinghe and Balasubramaniam 1992a, b; Pinto and Punchihewa 1996; IUCN 2002a,b; NECCDEP 2010c.
has been studied extensively during the recent past after the 2004 Indian Ocean tsunami (NECCDEP 2010c). This study reported poor mangrove distribution with low species diversity around the lagoons in Ampara District compared to Trincomalee and Batticaloa districts. Small size mangroves are mainly confined to the banks of the entrance channels in most cases (e.g., Panama, Potuwil-Ureni and Helawa). Mangroves in southern and southwest coast are also scarce. But dense mangrove vegetations have been established in the lagoon environments of Negombo, Chilaw and Puttalam.
Mangrove distribution in lagoons varies from place to place. It is not unique to any coastal sector or agroecological zone. Table 7 summarizes the mangrove distribution in eight coastal sectors whose details are given in Annex III. It shows dense distributions in some lagoons irrespective of the coastal zone. Only 18 lagoons have dense mangrove vegetation whereas fringing mangrove vegetations are

45
characteristics of 13 lagoons (Table 7). Most lagoons in the north and east coasts show a patchy distribution of mangroves whereas it is somewhat swampy in Chundikkulam, Thondamanaru and Kokkali lagoons. A similar mangrove vegetation was observed in the Korai Complex in the east coast where some lagoons showed a scattered or patchy mangrove distribution. Mangroves are very few in the lagoons located on the southeast coast and several back-barrier lagoons of the south (Mahasittarakala, Kunukalliya and Dondra lagoons) and southwest coast (Hikkaduwa, Silliya and Ingirili rivers).
Table 7. Number of lagoons with different mangrove types (see Annex III for details).
Coastal sector Mangrove type and number of lagoons
Dense Fringe Patchy Swamps Scattered Few None
Northern 2 5 5 3 4Northeastern 4 Eastern 1 2 4 1 4 2Southeastern 1 1 6 8Southern 2 2 2 2 2Southwestern 3 2 1 3Western 1 1 1Northwestern 4 2 1 1 1
Total 18 13 14
Salt marshesSalt marshes are vegetated areas with halophytic (salt-tolerant) grasses, herbs, shrubs and algae in the upper part of the intertidal zone on the shore’s inlets, lagoons, estuaries and embayments sheltered from strong wave action (Allen and Pye 1991). They can exist where wave action is sufficient to wash sediments to them, but with accessional storm wave cliffs in their seaward margin (Bird 2010). They are extensive in microtidal shores and their ecology is fairly known (Ranwell 1972; Adam 1990). Salt marshes are found in the dry zone of Sri Lanka and most extensive where the dry season is long and coasts experience low-energy waves (Swan 1983; Abeywickrema and Arulgnanam 1993). Common halophytic species found in Sri Lanka’s salt marshes are Suaedamonoica, S. nudiflora,Salicornia brachiata, Eleocharis setacia and Arthrocnemum indicum. In addition, there are salt-tolerant grasses such as Zoysia matrella, Z. pungens, Fimbristylis littoralis and Cynodon dactylon. In watery depressions, rushes such as Cyperus haspans and Scirpus littoralis are found. Seagrass species, namely Halophila beccarii and Thalassia hemprichii could occur where tidal currents are strong (Swan 1983; Abeywickrema and Arulgnanam 1993). Algal mats within the salt marshes comprise species belonging to genera Lyngbya, Oscillatoria, Schizothrix, Porphyridium and Microcoleuschthonoplastes (Abeywickrema 1960; Kugathasan 1969; Gunatilaka 1975; Pemadasa et al. 1979). Salt-marsh vegetations in Sri Lanka are well established in the deltaic lands of the north and northwest dry zone and in silted lagoons in the southeast whereas most of them have disappeared from these lagoons after they were converted to salterns. The vegetation characterized by xeromorphic features is considerably influenced by an arid environment and edaphic conditions, the latter being the major factor determining the well-marked zonation of different communities within the salt marshes (Pemadasa et al. 1979).
Lagoon FaunaLagoons and estuaries are interfaces of marine and freshwater animals but benthic organisms are more sedentary than free swimming pelagic ones. Lagoons and estuaries are believed to retain mostly immature stages of organisms than other habitats (Barnes 1980). Not surprisingly, faunistic studies of
46
lagoons and estuaries throughout the world have been biased towards the pelagic fauna, with special emphasis on fish and shrimp (De Silva and De Silva 1984). However, benthic fauna including protozoa, pelagic zooplankton, and littoral macroinvertebrates are equally important in the eco-balance of coastal lagoons. Evidently, the Dutch Bay of the Puttalam Lagoon was a feeding ground for dugongs and green turtles a few decades ago. Now they have disappeared, perhaps due to lack of seagrasses indicating that the lagoon has been threatened. Likewise, resident or migratory fauna indicate the ecosystem health of the lagoon or, in other words, they are good indicator organisms. Therefore, knowledge of the fauna of the lagoon cannot be restricted to a handful of potentially extractive animals.
ZooplanktonNo studies were available on brackish water zooplankton of Sri Lanka up to 1987 when NARA conducted a survey in Negombo, Chilaw and Puttalam lagoons and Mundel Lake. This survey records major groups such as Cladocerans, Calanoids Harpecticoids, Copepods and Gammerids. In the Negombo Lagoon Copepods were the most dominant while Harpecticoids were the least abundant. Calanoid Copepods were most dominant followed by Cladocerans and Harpecticoids in the Chilaw Lagoon and the same trend was reported for Mundel Lake and the Puttalam Lagoon except for the occurrence of Cyclopoids in between Copepods and Harpecticoids. However, Copepods were the most dominant zooplankton with a few rotifers in Mundel Lake in lesser densities (Ariyananda 2008). Zooplankton, one of the most important links of the aquatic food chain, regulates the phytoplankton population and when they are abundant, the population of zooplanktivorous fish could be increased in the lagoon. Therefore, the lagoon fauna play a vital role in trophic linkages and ultimately in biomass production.
MacroinvertebratesBenthic macroinvertebrates, primary and secondary consumers in aquatic systems, play an important role as sources of food for higher trophic levels and are also active drivers of material transport between sediment water interfaces (Bouguenec and Gaini 1989). High biodiversity of benthic invertebrates is a good indicator of high diversity and biomass of fish. Annelids, arthropods, crustaceans and mollusks are among the most common macroinvertebrate groups found in benthic environments of estuaries and lagoons. They show a great diversity and adaptations to thrive in these dynamic and fluctuating environments. Among them shrimps, crabs, gastropods, annelids and barnacles are predominant. In an estuarine or lagoon environment, mangroves and seagrass beds provide shelter to young and juvenile forms of benthic fauna as well as food via litterfall to a large number of juveniles of aquatic organisms, some of which are commercially important to man. It is only the Negombo Lagoon that has been subjected to detailed studies on benthic invertebrates in Sri Lanka (De Silva 1964; Pinto 1978; Dahanayaka and Wijeyaratne 2006; Dahanayaka et al. 2008).
Altogether 89 species of benthic invertebrates belonging to 58 families consisting of 36 species of polychaetes, 13 species of crustaceans, 24 species of gastropods and 16 species of bivalves have been reported from the Negombo Lagoon (Dahanayaka et al. 2008). This study is the most comprehensive and updated faunal list for benthic invertebrates in a coastal lagoon in Sri Lanka. Invertebrate species recorded from the lagoon are annelids, arthropods and mollusks and, in particular, polychaetes, crustaceans, gastropods and bivalves. There were 36 species of polychaetes belonging to 16 families. Of the crustaceans, commercially important shrimp species, Penaeus monodon, P. Semisulcatus, P. Indicus, Metapenaeus dobsoni and M. Elegans were reported from the lagoon. Ingle and Fernando (1963) described some fresh and brackish water crustaceans from islets of the Negombo Lagoon. New genera and species of apseudomorph Tanaidacea (Crustacea) were described from benthic samples collected from the Mundel Lake (Bamber et al. 1996, 2002).

47
Bivalve mollusksClams, cockles and bivalve mollusks, which are good sources of protein, are reported to be abundant in the coastal waters of Sri Lanka including microtidal lagoons (Pinto 1980). Although bivalves are not particularly popular among Sri Lankans, an increasing number of fishing families who are involved in deep sea fisheries are engaged in bivalve harvesting during monsoonal seasons and peak tourism seasons. Most of the bivalves of Sri Lanka are collected for lime production. It has been reported that bivalve distribiution is determined by water temperature, salinity, texture of the substrate, organic matter content and seagrass meadows (Kithsiri et al. 2000). In the Puttalam Lagoon and the Dutch Bay six species of edible bivalves have been recorded, of which only three are commercially important (Kithsiri 1996). Jinadasa et al. (1994) recorded five species of bivalve of which Meretrix casta was the most abundant species with a potential harvest of 10,000 metric tons per annum. Gafrarium tumidum,a species common throughout Asia-Pacific is widely distributed in Sri Lanka and is found in the Puttalam Lagoon, Tambalagam Bay and the Viddattaltivu Lagoon while Marcia optima is abundant in the Puttalam Lagoon, Tambalagam Bay and Kokkilai Lagoon (Kithsiri et al. 2000). M. casta is a very important test organism which had been widely used to study bioaccumulation of toxic heavy metals (Kumaraswamy et al. 2006). Attempts have been made by both NARA and National Aquaculture Development Authority (NAQDA) to establish bivalve cultures in certain sites in the northwest coast and the Trincomalee Bay.
Fish and shellfishThe most important aquatic animals in lagoons in terms of biomass and commercial importance are finfish and shellfish. In general, estuaries and lagoons and near-shore areas are excellent nurseries for certain species of fish where they get both food for growth and protection from predators. With respect to lagoon ecosystems, richness or biomass of fish species increases with the lagoon volume and openness parameters that characterize the potential inflow of the sea that, in turn, facilitates movement of catadromous species due to increased total transversal area of the inlet (Péréz-Rufsafa et al. 2007a). Fish yield increases with increasing phytoplankton biomass of the water which has some links to shoreline development. In addition, benthic diversity and biomass, seagrass meadows and fringe mangroves also play vital roles with respect to the diversity and biomass of fish and shellfish species. Human association with lagoons in Sri Lanka is determined by the availability of fish and shrimp.
Apparently, most of the small seasonally tidal lagoons in Sri Lanka are not productive in terms of fish and shellfish production. But, many large lagoons are rich in finfish and shellfish, representing marine, estuarine and freshwater species. However, the structure and biomass or yields of the fish population of Sri Lankan lagoons have not been studied as yet in relation to physical, chemical and other biological variables in relative terms. Fish fauna and species composition in certain lagoons (e.g., Batticaloa, Periya Kalapuwa, Rekawa, Bolgoda Lake, Negombo, Chilaw, Mundel, Puttalam) have been reported in scholarly publications and annual yields have also been predicted for the Puttalam Lagoon (Dayaratne et al. 1995a, b), Chilaw lagoon (Jayawickrema 1992) and Negombo (Wijeyaratne and Costa 1986, 1987a, b). However, many of the studies on lagoon fish have been devoted to life-histories, physiology, reproductive biology or ecophysiology of certain fish species of either commercial or ecological interest (Samarakoon 1983; Sivashanthini and Ajmalkhan 2004; Silva 2005; Sivashanthini 2008, 2009). Pillai (1965) recorded 125 species of fish from brackish water of Sri Lanka of which 80 species were immigrants and marine ones. De Silva and Silva (1979) reported 62 species belonging to 36 families from the Negombo Lagoon of which 33 were marine and two were freshwater species. Similar results have been shown on the distribution of fish species in the Negombo Lagoon by Pinto and Punchihewa (1996). A study carried out by NARA on the Puttalam Lagoon – Mundel Lake-Dutch Canal system reported 60 species belonging to 32 families (Dayaratne et al. 1995a). While 59 species were recorded from the Puttalam Lagoon itself there were about 30 species in the Mundel Lake. Table 8 shows the number of fish species from a few lagoons in Sri Lanka as reported by different sources. Extremely large numbers of fish species have been reported from Madu Ganga by IUCN (2002b) but

48
Lagoon Number of species Source Remarks
Puttalam 59 Dayaratne et al. 1995a, 1997 Balance faunal distribution, marine, brackish and freshwater species
Negombo 62 De Silva and Silva 1979 More marine and brackish water species than typical freshwater
60 Pinto and Punchihewa 1996 species 59
Mundel Lake 30 Dayaratne et al. 1997 Mainly marine and brackish water species
Madu Ganga 70 IUCN 2002b Mainly freshwater, moderately marine and a few marine species
Batticaloa 20 NECCDEP 2010b Mainly freshwater, moderately marine and a few marine species
Periya 14 IUCN 2011a Mainly freshwater, moderatelyKalapuwa marine and a few marine species
a majority of them were freshwater species. Only 20 species have been reported from the Batticaloa Lagoon (NECCDEP 2010b) and 14 species from the Periya Kalapuwa (IUCN 2011a, b). The low numbers of species reported from both the Batticaloa Lagoon and the Periya Kalapuwa may be attributed to incomplete resources surveys. Interestingly, more freshwater species have been recorded from both lagoons indicating the less brackish nature in these coastal water bodies.
Many fish species found in the lagoons are commercially important and exist in substantial populations that support subsistence fisheries. The available information reveals that the knowledge on fish fauna in Sri Lankan lagoons is scarce although species occurrences in number and their type are good indicators of the present status of the lagoon ecosystem. Almost no information is available on the structure and population densities of fish fauna of northern coastal lagoons. The status in regard to shrimps and crabs is also very similar. Eleven species of penaeid prawns have been reported from Sri Lankan coastal water (de Bruin 1965) and the majority of them are found in coastal lagoons (Table 9). Of the 11 species of penaeid shrimps reported, four are of high economic value (i.e., Penaeus indicus, P. monodon, P. semisculcatus and Metapenaeus dobsoni). Species like P. indicus, P. semisulcatus and M.dobsoni breed in the sea and their post-larvae migrate to the lagoon and stay in the lagoon till sexually mature, and then return to the sea for subsequent breeding and spawning (Jayawickrema 1987; Sanders et al. 2000). The abundance and seasonal variations of the juvenile shrimps in the lagoon will have a great influence on the fishery for shrimps since the magnitude of the fishery for adults is primarily determined by the success of the larval recruitment in the previous seasons (Jayawickrema 1987, 1990; Jayawardane and Gunawardane 2003).
All four economically important shrimp species have been reported from the Negombo Lagoon and its shrimp production may be the highest in the country.
Investigations on shrimp fishery in the Rekawa Lagoon during 1993-1995 by Jayakody and Jayawardena (1997) and Nissanka (1997) showed that this extremely artisanal fishery is mainly confined to the lagoon proper and that the peak season occurred from September to April. The estimated annual shrimp production for the periods July 1993 to June 1994 and July 1994 to June 1995 were 6.2 and 5.2 metric tons, respectively, and P. indicus and P. Semisulcatus are dominant in the Puttalam Lagoon while P. indicus is the most dominant in the Batticaloa Lagoon. There are no reliable records on shrimp production from lagoons in the country to date, especially from the north and east. Even now the data are collected as marine production and this makes it difficult to assess the trends in lagoon production. Hence, the trends in lagoon fishery are based totally on the information given by the fishermen. The data collected from the Ureni, Batticaloa and Panama lagoons and Thambalagam Lake have been used to

49
analyze the trends in lagoon fishery in the Eastern Province (e.g., Trincomalee, Batticaloa and Ampara districts). The report submitted to the Ministry of Economic Development by NECCDEP (2010f) states that before the tsunami, the fishermen in these lagoons used wooden catamarans for fishing and most of them were damaged by the tsunami and then they were replaced with fiberglass ones. There is an increasing trend in engagement of people in fishing while there is a decline in catch per unit effort.
Of the three crab species reported from Sri Lanka (Table 9), mud crab Scylla serrata, a member of the group of swimming crabs, is widely distributed in all Sri Lankan lagoons, especially in estuaries. But its populations are high in northern (Thondamanaru, Nanthikadal, Nayaru, Kokkilai), eastern (Batticaloa, Uppar and Valaichchenai) and northwestern (Puttalam) lagoons (Jayamanne 1992; NECCDEP 2010f). Although it inhabits the southern lagoons (e.g., Malala-Embilikala, Lunama-Kalametiya, Kahandamodara, and Rekawa) densities of Scylla serrata populations are unknown. Only two preliminary investigations have been carried out on Scylla serrata in Sri Lanka, on aquaculture potential of mud crab, and host-parasite relationships of Scylla serrata (Arudpragasam 1967). However, crab fattening is a domestic fishery industry in the Batticaloa Lagoon. Jayamanne and Jinadasa (1993) studied the biology and economics of the mud crab fishery in the Negombo Lagoon and later Priyadarshani et al. (2008) conducted an intensive study in the Kadolkelle area. Some important edible fish species such as sea bass (Lates calcarifer), rabbit fishes (Siganus spp.), milk fishes (Chanos chanos)and estuarine catfishes (Tachysurus spp.) are also harvested in large numbers from the Negombo and Puttalam lagoons. Wijeyaratne et al. (1996) studied population dynamics of vermiculated rabbit fish (Siganus vermiculatus) in the Negombo Lagoon. Bolgoda Lake is famous for angling of sea bass. Mud crab (Scylla serrata) and sea crab (Portunus pelagiucs) are of high economic value.
Table 9. Shrimp and crab species recorded from Sri Lanka.
Shrimps Species English name Environment
Macrobrachium rosenbergii Giant river prawn Freshwater/Brackish Family: Macrobrachium equidens Rough river prawn Brackish/Freshwater Palaemonidae Macrobrachium rude Hairy river prawn Brackish/Frershwater
Exopalaemon stylifera Rushna prawn Marine/Brackish Metapenaeus affinis Jina shrimp Marine/Brackish Family: Metapenaeus dobsoni Kadal shrimp BrackishPenaeidae Metapenaeus elegans Fine shrimp Brackish (high salinity)
Metapenaeus ensisMetapenaeus monoceros Speckled shrimp Marine/Brackish Metapenaeus moyebi Moyebi shrimp Marine/Brackish Parapenaeopsis cornuta Coral shrimp Marine/Brackish Parapenaeopsis stylifera Kiddi shrimp Marine/Brackish Penaeus canaliculatus Witch prawn Brackish Penaeus latisulcatus Western king prawn Marine/Brackish Penaeus indicus White shrimp Marine/Brackish Penaeus merguiensis Banana prawn Marine/brackish Penaeus monodon Green tiger prawn Brackish (high salinity)Penaeus semisulcatus Green tiger prawn Marine/Brackish
Family: Portunus pelagicus Blue swimming crabPortunidae Portunus sanguinolentus Blood spotted crab
Scylla serrata Indo-Pacific swamp crab

50
Ecological SignificanceThe heterogeneous nature and complexities of lagoons and estuaries are primarily determined by geomorphology, climate and weather, tidal fluxes and fluvial inputs, and cohesive interactions with land-based human interventions. Lagoons and estuaries are transitional ecosystems of diverse trophic statuses, scenic beauties, rich, rare and endemic species and, in turn, aquatic biodiversity and ecosystem productivity. They are now considered as complex socioecological systems because of their utmost economic values associated with biological production of aquatic and semiaquatic habitats and fringe mangrove vegetation. These brackish water bodies are also important with respect to cultural perspectives since human settlements have been centered on many of them for over hundreds of years. However, for the last few years, a majority of the estuaries and lagoons found worldwide are also considered as sinks for wastes and pollutants resulting from land-based and in situ human activities.
Coastal lagoons in Sri Lanka are also excellent examples of complex socioecological systems that provide a range of ecosystems services which are often misunderstood and undervalued, and whose multiple uses and benefits are not in the scope of the policy planners and decision makers. Other than basic characteristics such as topography, hydrography, finfish and shellfish fauna, seagrass and mangrove flora, the ecological significance of Sri Lankan lagoons is hardly known. The knowledge on autochthonous and allochthonous nutrient loading into estuarine and lagoon ecosystems and biogeochemical cycles is a prerequisite to understand ecosystem processes and their dynamics. Tidal fluxes and fluvial inputs are equally important to understand processes and functions but the degree of significance of each process may vary in different systems. The importance of river inputs to tropical coastal water has been recognized during the recent past because of increasing alterations in catchment-coastal sea interactions and human dimensions. Further, dissolved silicon (DSi) is also recognized as an essential element together with N and P in the nutrient cocktail, especially at the land-ocean interface because of human intervention on nutrient cycling. It is not merely the load of N and P but also the relative proportion of the nutrient mix including DSi that affects food-webs and elemental cycles of the coastal sea.
Through their high productivity, seagrasses build up large carbon reserves which are utilized in the tropics by herbivores such as turtles, birds and marine mammals. Many species of prawns and fish use the seagrass meadows as nurseries and even as adults they are dependent on seagrasses for their food via the epiphytic community. Further, seagrass provides nurseries for bivalves. Hence, seagrass ecosystems are very high in diversity and a larger number of individuals of different taxa are found within the community, compared to the ecosystems where seagrasses are not present (Coles et al. 1993). Light, temperature and nutrients are crucial among the factors that regulate the distribution of seagrasses (Romero et al. 2006). Besides, substrate characteristics are also important with respect to their structure and functions. Some species have been observed to grow best in certain substrata; for example, Enhalus acoroides and Thalassia hemprichii have shown better morphological features when they grow in muddy substrate (de Iongh 1996). Further, the ability of sediment stabilization by Halophila spp in comparison to other seagrasses has been demonstrated (Fonseca 1989).
Seagrasses are highly abundant in the northern part of the Negombo Lagoon where a thick mangrove cover is present compared to the other areas of the lagoon (De Silva and Amarasinghe 2007). Seagrassdistribution in lagoons in different coastal segments of the island is shown in Table 5. The studies are limited only to four lagoons (Puttalam, Mundel, Negombo and Rekawa). A recent resource survey conducted by NARA recorded several species of seagrasses from limited sites of the Northern Province including most of the lagoons (NARA 2010). The distribution of seagrasses along the coast from the northeast to southeast is virtually unknown. No records are available from the lagoons located from Thondamanaru up to Rekawa. Hence, it is difficult to get a clear picture of seagrass distribution in coastal lagoons in Sri Lanka.
The salt marshes are associated with several ecological factors of which topography, textural variation of the soil, and exposure to floods, tides and wind appear to be of particular importance (Pemadasa et al. 1979). But the salt-marsh vegetation associated with coastal lagoons has not received any attention as against mangroves, probably because the protective function of salt marshes was

51
unknown until the 2004 devastating Indian Ocean tsunami. On the Atlantic coast, salt marshes constitute not only one of the most prevalent habitats in lagoons (Bertness 2007) but one of the most productive natural vascular plant communities in the world (Whittaker 1975). The Government of Sri Lanka has designated the Vankalai Sanctuary located adjoining the Vankalai Lagoon as its fourth wetland of international importance (Ramsar site). This sanctuary covers an area of 4,839 ha and consists of a variety of ecosystems such as arid-zone thorn scrubland, arid-zone pastures and maritime grasslands, sand dunes, mangroves, salt marshes, lagoons, tidal flats, seagrass beds and shallow marine areas. Due to the integrated nature of shallow wetland and terrestrial coastal habitats, this sanctuary is highly productive, supporting high ecosystem and species diversity. The site provides excellent feeding and living habitats for a large number of water bird species, including annual migrants, which also use this area on arrival and during their exit from Sri Lanka. Mussels are ecologically important as they form large biogenic reefs that can enhance local community diversity and they provide critical links of benthic and pelagic systems through their filter-feeding activities. In natural systems, mussels are limited by competition, predation and physical forcing.
Natural and Anthropogenic PressuresNumerous natural and human-induced forces influence lagoon ecosystems. These forces have direct and indirect effects on lagoon ecosystems concomitantly and, subsequently, their allied ecosystems modify various aspects of societal interests including ecosystem health and living resources. Coastal resources are diverse but interrelated through common functional processes and hence lagoons are also subject to the same natural and anthropogenic impacts. The response of different ecosystems to one or more phenomena within a lagoon ecosystem may not be the same, because some are more resilient than others. Therefore, management of lagoon ecosystems needs an integrated, holistic philosophy and practice as opposed to a piecemeal approach. The drivers and pressures on the coastal system including lagoons are predominantly the results of societal function and human behavior and may be amenable to management and policy decisions. It is increasingly apparent that forces on the coastal ecosystem by most natural drivers and pressures are greatly modified by human activities to a greater extent.
Natural forcesSea-level rise resulting from global climate change is one of the major issues concerning the coastal zone, particularly for ecosystems and residents in river deltas and lagoon margins, especially in small island states like Sri Lanka. The dominant driver of sea-level change is sea and air temperature. The responses may vary locally, and with climate, lagoons may survive and expand, and the engineering infrastructure of the coastal zone may be a barrier to landward dynamics of ecosystems. Potential impacts already highlighted are shoreline erosion, severe storm surge and flooding, changes in salinography and altered tidal regimes. A tsunami is a series of tremendous waves generated by a massive underwater disturbance. Seismic activity is the most common cause of tsunamis. Submarine landslides and cosmic impacts can also cause tsunamis. The 2004 December Indian Ocean tsunami is a classic example in modern history to show the destructive power of tsunamis. Studies launched on sediments of some southeastern lagoon beds in Sri Lanka following this tsunami revealed the tsunami chronology in the region as well as the composition of the sludge brought to the lagoons (Jackson 2008; Matsumoto et al. 2010; Ranasinghage 2010).
Although physical damage to coastal lagoons was relatively limited and patchy changes in ecological characteristics, biogeochemical cycles and sedimentation processes were hitherto unknown many lagoons were inundated and became more saline than before but recovered after two to three rainfall flushings. The Karagan Lagoon showed an increase in surface area, shifts in salinity concentrations and suffered the short-term effects of high debris loads. In this lagoon, as in others, there was evidence of inputs of marine organisms, while mortalities of brackish and freshwater fish and plants, due to elevated salinities or loss to the sea, were recorded in other cases. Rekawa and Kalametiya lagoons, a Special Area Management (SAM) site and a protected mangrove site were markedly affected but

52
long-term ecological consequences are unknown. However, as the lagoons remained as important fishing grounds there were serious livelihood repercussions for some time. Mangrove ecosystems have been slightly or moderately affected in many lagoons where broad, multistory mixed stands of Avicennia, Ceriops and other species acted as frontline buffers to the waves demonstrating ecological significance of mangrove stands. The International Tsunami Survey Team (ITST) reported that the Indian Ocean tsunami exploded on 26 December, 2004, eroded sand from the shore-face and beaches and deposited it inland as sheets and pockets including in lagoons along the coastlines of Sri Lanka. Localized microtopography played a strong role in influencing the shape and thickness of the 2004 tsunami deposit (Richmond et al. 2006).
Anthropogenic forcesShrimp farming: Alienation of coastal wetlands (mangroves, salt marshes, dune vegetation) continues as sugarcane, rice and shrimp aquaculture are expanded regionally throughout the world. Shrimp aquaculture has become one of the most lucrative businesses in South and Southeast Asia over the last three decades. The expansion of shrimp farms along the shorelines of a chain of lagoons on the west coast from Gembarandiya to Puttalam including Chilaw, Muthupanathiya, Mundel and Talawila Odai, over the last two decades mainly at the expense of mangrove forests, has created adverse effects on lagoon ecosystems of the northwest coast (Corea et al. 1998; Dahdouh-Guebas et al. 2002; Ariyananda 2008). Some authors reported political patronage as the main cause of this adverse situation. Since the shrimp industry depends on various ecological services provided by the mangrove ecosystem in order,to maintain its production (cf. ecological footprint concept) mangrove destruction is counterproductive and negative impacts are therefore alarming for the aquaculture industry as well (Dahdouh-Guebas et al. 2002). Decline of mangrove to an unacceptably low level has been predicted to have severe repercussions on the industry as noticeable today. Changes in mangrove assemblage in Kalametiya, Kahandamodara and Rekawa lagoons as a result of interbasin diversion under the Walawe River Irrigation Scheme will also be highlighted in this report under land-based human interventions. Besides, mangrove vegetations are now being further endangered by encroachment (Negombo Lagoon), garbage dumping (Chilaw Lagoon) and urban waste disposal (Puttalam and Batticaloa lagoons).
Some of the negative impacts of shrimp farming on lagoons have been the depletion of natural fish resources; reduction in nursery grounds, feeding grounds, spawning grounds, and in migratory bird populations, and obstruction to navigational paths and to natural water movements, etc. The shrimp industry has been affected by a variety of production problems including an acute shortage of post-larvae, floods, continuous curtailment of power and outbreak of diseases. Consequently, many shrimp farmers are now burdened with financial problems. Lack of proper planning, failure to adhere to laws governing shrimp farming and illegal practices have made shrimp farming an environmentally unfriendly activity. Proper enforcement of laws guiding shrimp farming, research into health management, effluent treatment, etc., have been suggested to improve the profitability of shrimp farming and its impact on the environment. Hydrographical changes in lagoon environments by shrimp farming have affected the mangrove propagule predation behavior by crabs and, in turn, vegetation structure of mangrove forest patches in Sri Lanka (Dahdouh-Guebas et al. 2011).
Streamflow regulation: Lagoon salinity regime may also change by streamflow regulation by constructing dams, trans-basin diversions and interlinking rivers. This is one of the most common land-based human interventions in Sri Lanka. A very few running water systems remain in the island without being regulated. One of the classic examples is damming and diversion of the Walawe River upstream and its impact on downstream brackish water lagoons. Stanzel et al. (2002) first highlighted the impact of Walawe River irrigation on the hydrology of the Karagan Lagoon in Sri Lanka. The objective of the massive Udawalawe Scheme was to provide irrigation water for 32,000 ha of newly developed land, particularly paddy fields, and to generate hydroelectricity. Consequently, additional freshwater was diverted into the river basins of the nearby Kuchchigal Ara, Urubokka Oya and Kirama Oya. Variations in river hydrology have caused changes in the areas suitable as mangrove habitats and,

53
thus, have resulted in an altered distribution. Hydrological changes, such as interbasin transfers, have resulted in a qualitative ecological and socioeconomic degradation in Kalametiya, Kahandamodara and Rekawa lagoons in the southern coast. Remote sensing, ground-truthing data, and information obtained from native informants have revealed major transitions in spatial extent, structure, and species composition of mangrove vegetation, in faunal elements, and in subsistence livelihoods in three southern Sri Lanka lagoons (Dahdouh-Guebas et al. 2005).
Similar impacts have been observed in Malala-Embilikala and Bundala lagoons and the brackish water coastal wetland in the Bundala National Park, the only Ramsar site of southern Sri Lanka, following the completion of Kirindi Oya Irrigation and Settlement Project (KOISP) with the construction of Lunugamvehera Reservoir and the associated irrigation network. The purpose of KOISP was to provide irrigation water for 10,000 acres and settlement of farmer families on the Right and Left Banks of newly developed lands, particularly paddy fields. This has affected the lagoon ecology including Bundala Bird Sanctuary as a result of altered hydrology in Malala and Kirindi Oya basins.
The western portion of the Bundala Lagoon has been converted to a saltern which is exploited by the State Salt Corporation. The natural entrance to the sea has been blocked by a sand barrier while the saltern and a large part of the lagoon are separated from the natural entrance by an earthen bund. An artificial sea outfall has been cut through the sedimentary sandstone barrier (the dune ridge) from the lagoon towards the sea to discharge excess water from the lagoon. This sea outlet gets closed too by the development of a sand bar within a few weeks due to wave action. This is breached manually during the rainy season (October-November) when water level rises and it is assumed that recruitment of shrimp larvae and fish occur sufficiently. But fishery in the lagoon has declined tremendously after these interventions according to state reports and native fishermen. Although the saltern provides certain benefits to the livelihoods, its presence provides no benefits to the fish and wildlife species. Further, the January-February salt production period coincides with the invasion of a large number of migratory bird species that depend on the lagoon for their food and refuge. Salterns may also have significant effects on the salinity regime of the lagoon which has not been investigated.
In the case of Embilikala and Malala lagoons, which receive a large amount of drainage water from Right Bank Tracks of KOISP and Badagiriya Irrigation System, respectively, in addition to their own runoff, marked fluctuations are shown in their water levels resulting in dilution. Their salinities drop to 7-15 ppt during the rainy months (November-December) which is not suitable for the breeding of shrimp. In addition, lagoons have been successfully colonized by introduced cichlids (eurihaline Oreochromis mossambicus) and other freshwater species and invaded by invasive aquatic macrophytes. Recent studies conducted on water quality of these brackish water lagoons in Bundala wetlands showed marked enrichment with respect to nitrogen and phosphorus (Bakker and Matsuno 2001; Renault et al. 2001; Nguyen-Khoa and Smith 2004; Piyankarage et al. 2004). Higher levels of phosphorus in Embilikala-Malala Lagoon were attributed to agricultural drainage, livestock additions, and breaching of the sand bar between the Malala Lagoon and the sea. Beira Lake is a classic example of blooming of toxigenic harmful algae in a Sri Lankan lagoon due to anthropogenic activities. Beira Lake, a back-barrier lagoon, located in the heart of the capital city, Colombo, has been dramatically changed by human activities diminishing its lagoon characteristics.
Apparently, irrigation practices may have adverse impacts on lagoon ecosystems. Irrigation drainage can certainly lead lagoons into hypereutrophic conditions promoting the growth of macroalgae or harmful algal blooms (Nixon 1995). Quantification of such impacts is possible only if pristine conditions of an aquatic ecosystem are known before the implementation of such projects. Studies conducted on the bird populations in Bundala wetland systems recorded the highest aquatic bird diversity in Embilikala, partly attributed to its moderate salinity, water depth and abundance of aquatic macrophytes (Chandana et al. 2008). The lowest aquatic bird diversity was recorded in Bundala Lewaya which has been heavily affected by the construction of a saltern and subsequent hydrological modifications. Although these lagoons are located in the same landscape within one agroecological zone, they vary from one to another in the ecohydrology and ecosystem production so that different bird communities might be supported.

54
Human interventions modify shoreline development, sedimentation rate and depth via land reclamation or building dikes or marina as well as affecting the influence of the open sea, modifying the structures of natural inlets. Some of these activities could be intentionally directed at improving colonization of fish and, in turn, productivity. However, the effects on species richness can be directly opposite to those on the fishing yield or species composition, and when designing management strategies and evaluating the impact of human activities, it would be necessary to consider the importance of maintaining the naturalness of these exclusive ecosystems and not the improvement of one particular characteristic alone. Today, by application of geophysical tools or other GIS methods it is possible to estimate the physical changes in lagoon systems accurately or even predict the trends in changes for the purpose of management planning (Nagabhatla et al. 2008).
Attempts have been made to prevent seawater influx to Thondamanaru and Uppuaru lagoons by constructing barrages across the lagoons with a view to convert them to freshwater bodies. Negative impacts of human interventions of this nature on lagoon ecosystems have to be investigated in detail. Conversion of brackish water bodies into freshwater in the peninsula must be undertaken after careful feasibility studies and rigorous environmental impact assessments without bias on the mere engineering advice since most likely negative impacts are irreparable. By contrast, cutting or enlarging the entrance to a lagoon that was previously brackish may result in salinity increase that can have geomorphologic and ecological consequences. For example, because of the removal of sand bars, widening of the marine entrance of the Koggala Lagoon in 1991 and subsequent modification of the groyne system at the marine entrance, what was once seasonally tidal, now experiences completely different hydrodynamics.
Road causeways: The extent of the conversion of natural ecosystems such as estuaries, lagoons, etc., by land reclamation and engineering structures (breakwaters, revetments, groynes) generally reflect the population pressures and attempts to protect coastal infrastructure from storms and other high-energy events (Arthrurton 1998; Burke et al. 2001). Construction of road causeways and shoreline ribbon development for transport and tourism facilities, respectively, often destroy the natural habitats serving as natural fisheries and bird nurseries. If appropriate designs are not adopted such interventions would interfere with water exchange (seawater and freshwater exchange) and would negatively affect the productivity, especially of shrimp. Although one of the most known examples is the Kapuhenwala Bridge across the Rekawa Lagoon which has seriously affected shrimp production, other lagoons have come under the same impact (Jaffna, Thondamanaru and Nanthikadal lagoons). The total length of the three road causeways across the Jaffna Complex is about 12 km while there are two causeways of more or less equal lengths (about 1.86 km) across the Thondamanaru Lagoon, and the causeway across the Nanthikadal Lagoon near the marine entrance is 440 m long. Construction of causeways across lagoons certainly alters salinity regimes and sediment transport resulting in increased local and displaced erosion.

55
Chapter 6 Socioeconomic Relevan ce
The concern for the environment is twofold, the economic and the ecological dimensions. The environment is considered as a resource that provides various goods and services (use values) for the satisfaction of human well-being goals of the present generation. This is the economic dimension of the environment. There is also an ecological dimension, where the environment is protected/preserved because it generates certain values from “use” or “nonuse.” The willingness to preserve or protect the environment reveals the ecological dimension of our concern for the environment. There is also an equity dimension to environmental concern – the concern for future generations; equitable distribution of resources between present and future generations. All these concerns are captured in the concept of Total Economic Value (TEV) of environmental goods and services. TEV focuses on monetizing a set of human preferences towards a natural system (Wattage and Mardle 2007).
Social and Economic Values of LagoonsLagoons form a particular type of natural capital which generates a number of values, contributing positively towards improving human well-being. Such values can be broadly divided into use values and nonuse values. Use values consist of present use as well as future use, of which present use values form the highest values generated by lagoons as they relate to the present use of lagoon resources. Present use values consist of direct use values and indirect use values. The major direct use value components are those emerging from extractive use of lagoons (Figure 28), such as fish, shrimp, fuelwood, timber, stakes (mangrove stakes for vegetable plots and construction), fruits (e.g., kirala), wild game, medicine (medicinal plants), fodder, salt, etc. (It was noticed that, lagoons provide fodder to large numbers of cattle during dry seasons, contributing positively towards “cattle feeding cycles” (e.g., lagoons found within the Kumana Bird Sanctuary).
Lagoons also generate nonextractive direct use values (Figure 29), such as ecotourism (or nature tourism), provision of anchorage for marine fishing crafts, recreation (fishing, boating, bird watching, etc.), research and studies (scholarly values) (Figure 30), education, location for films and cultural events, photography, scenic beauty, cultural inspiration, etc.

56
Figure 29. Very high nonextractive direct use values of the Kokillai Lagoon in the Mullativu District (e.g., bird watching possibilities).
Figure 30. Salt marshes at the Vankalai Lagoon, Mannar (with potentially high scholarly values).
There are a number of more “invisible” indirect use values of lagoons which may be generated “on-site” or “off-site.” On-site indirect use values are diverse and consist of natural habitat (for flora and fauna) and a number of environmental services, such as shoreline protection, flood protection, nutrient cycling, water regulation, erosion regulation, natural-hazard regulation, sediment retention and sinks for waste absorption. The off-site values are generated due to the “inspirational” effects of lagoons in the creation of poems, songs and books.
In general, all people place some value on the future. Lagoon resources generate values by leaving their use for the future; either for the present or for the future generation. Studies carried out in the Muthurajawela Marsh and the Negombo Lagoon have shown that nonuse values are a significant component of people’s willingness to pay (WTP) for both development and conservation of wetlands (Wattage and Mardle 2007). These nonuse values can be further categorized into option values, bequest values and existence values. Option values arise from leaving the option of either direct or indirect use of lagoons for the future; for the present and new uses, for the present and new users, or from nonuse, such as habitat preservation and biodiversity. Bequest values arise from leaving resources exclusively for the future generation for their direct use, indirect use, habitats and biodiversity, etc.

57
People sometimes place a value to the knowledge that certain resources “are there” (habitats, wildlife, biodiversity, etc.), which give them satisfaction although they may not use it. Values attached to such knowledge/understanding are called existence values.
Figure 31 gives a model of total social and economic value of lagoons as discussed in detail above. This model is based on values identified in an array of ecological, biological and economic studies of wetlands (Munasinghe 1992; Freeman 1993; Costanza 2000; FAO 2002, 2010; Francesca 2008; Anthony et al. 2009; Dziegielewska et al. 2009; Boateng 2010), and information collected and observations made on the field by the authors engaged in the present field studies. The proposed model is an attempt to incorporate all values of wetlands identified so far, which include social and economic values both at present and in the future. Moreover, the model also attempts at identifying development values and conservation values separately. The tangibility or the extent of quantification of values increases when one moves from right to left in the model (moving from nonuse values to use values).
Figure 31. Total social and economic values of lagoons.
PRESENT-USEVALUES
FUTURE-USEVALUES
USEVALUES
NONUSEVALUES
OPTIONVALUES
BEQUESTVALUES
EXISTENCEVALUES
DIRECT-USEVALUES
INDIRECT-USEVALUES
Extractive valuesFish and shrimp Shrimp Fuelwood Timber Stakes Fruits Wild game Medicine Fodder Salt
Nonextractive valuesAnchorage for marine craft Ecotourism Recreation (fishing, boating, bird watching, mangroves, etc.) Research and studies Education Location for films and cultural events Scenic beauty Spiritual and cultural inspirational Photography and painting
On-site valuesNatural habitat Shoreline protection Flood protection Nutrient cycling Water regulation Erosion regulation Natural hazard regulation Sediment retention Sinks for waste absorption
O -site values Songs Poems Books
Leaving the option of either direct or indirect use of lagoon for the future -present and new uses -present and new users
Values could also arise from nonuse options -habitat preservation -biodiversity
Leaving the lagoons for the future generation -direct use -indirect use -habitats -biodiversity
Development Values Conservation Values
Tangibility of goods and services and ease in quantification and valuation
Value derived from the knowledge of the existence of lagoons -habitats -wild life -biodiversity

58
Current State of Utilization of LagoonsOf the many values of lagoons, only the extractive values are generally utilized at present, by way of fish and shrimp catches and salt production and use of mangroves for various purposes, although a few attempts at utilizing some of the nonextractive direct use values like recreational values, were also noted.
Extractive values: Fish and shrimp production and fishing incomesLiving or nonliving resources extracted from lagoons generate use values which add to the human well-being in the form of cash income. Although cash income is not the only well-being goal of people, it is an important one. Among the many values generated by lagoons, extractive values predominate, which generally consist of the value of fish and shrimp catches. Although the existence of a fishery is closely related to lagoon productivity, fisheries do not exist at all in lagoons located in wildlife sanctuaries, such as Panama, Kudumbigala and Kumana bird sanctuaries. In fact, human intervention, by way of resource extraction, is prohibited by law in the case of natural reserves and wildlife sanctuaries. Of the 82 lagoons in the country (as revealed in this study), fisheries exist only in about half of them. Information obtained from the Department of Fisheries and Aquatic Resources on the status of fisheries in lagoons in Sri Lanka (where fisheries exist) is given in Annex IV. Productivity is expressed in terms of production per km2 for all lagoons. Note also that data on production are not available for lagoons in the Mullativu District - a district which was seriously affected by the civil war. Moreover, data on lagoons in the Trincomalee District were not made available to this study, probably for lack of information. Field studies also revealed that information on fisheries is only available in lagoons where proper landing centers are found (from which data are collected by fisheries officials) and/or where commercial fisheries exist. Therefore, there may exist lagoons which might have some scattered fishing activities, but information on them is not available.
Total annual fish landings are highest in the Jaffna Lagoon (5,754,990 kg), followed by Puttalam Lagoon (4,724,900 kg), Batticaloa Lagoon (1,391,884 kg), Periya Kalapuwa (Batticaloa) (1,293,050 kg), Venkalai Kalapuwa (870,816 kg), Punkudutivu Lagoon (830,000 kg), Periya Kalapuwa (Mannar) (437,750 kg), Thandiyadi Kalapuwa (Korai Complex) (427,405 kg), etc. In respect of shrimp, the highest annual landings are recorded in the Puttalam Lagoon (2,710,300 kg), followed by the Jaffna Lagoon (2,629,400 kg), Chundukkulam Lagoon (600,000 kg), Batticaloa Lagoon (553,800 kg), Negombo Lagoon (200,000 kg), etc.
However, productivity (fish production per km2) is lowest in Thondamanaru (429 kg.km-2) and highest in Venkalai Kalapuwa (296,802 kg.km-2). Other lagoons recording high productivities are Muthupanthiya Lagoon (246,197 kg.km-2), Punkudutivu Lagoon (200,921 kg.km-2), Periya Kalapuwa (both Mannar and Batticaloa: 134,983 and 69,808 kg.km-2, respectively), Chilaw Lagoon (55,609 kg.km-2), etc. Higher production per square kilometer and higher catch per boat have been reported in lagoons in the north and the east, showing the potential that exists in these lagoons to further develop fisheries.
Production of fish and shrimp and the number of fishers per unit area are highly correlated (Table 10), indicating that the productivity of lagoons is a function of the extent of extractive uses (extent of fishing) of a lagoon. However, one should note that, productivity is measured as fish and shrimp landings per unit area, which is thus a function of the extent of fishing activities. Therefore, the productivity of lagoons (in respect of resource availability) is underestimated when they are less exploited (less human intervention). This may be true with a number of lagoons in the north and the east of the country where human intervention has remained low during the last few decades due to the persistence of the civil war.

59
Production/ Fishers/ Catch/ Monthly km2 (kg) km2 boat (kg) income of a
Production/km2 (kg) Pearson Correlation 1.000 0.651** 0.534* -0.043Sig. (2-tailed) - 0.002 0.015 0.858Sig. (2-tailed) 0.083 0.970 0.021 0.765
Fishers/km2 PearsonCorrelation 0.651** 1.000 -0.111 -0.107Sig. (2-tailed) 0.002 - 0.641 0.654
Catch/boat (kg) Pearson Correlation 0.534* -0.111 1.000 0.192Sig. (2-tailed) 0.015 0.641 - 0.418
Monthly income Pearson
Sig. (2-tailed) 0.858 0.654 0.418 -
Note:
Catch per boatCatch per boat is significantly positively correlated with the productivity. Naturally, when each individual fisher within a given area is landing more fish, the total landings of that area should increase. A decrease in the landings of individual fishers with increasing fishing pressure is evident from the negative relationship observed between catch per boat and fisher density (fishers per unit area). These relationships show that with increased number of fishers, the catch per boat has declined but the total productivity, measured in terms of fish and shrimp production per unit area, has increased because of more total landings by a larger number of fishers (but each boat landing less fish).
Catch per boat is also positively correlated with monthly incomes of fishers, although the degree of relationship is quite weak. However, lagoon productivity shows a negative relation with the monthly income of a fisher, which is surprising, but the relationship is weak. This could be because higher productivity is related to higher fisher density, lowering the catch per individual. It is to be noted that, although lagoon users have been able to avoid Hardin’s “tragedy of the commons” issue, through various forms of communal management of resources by way exclusion and subtractability (regulating resource use among members) (see Smith and Berks 1991; Berks 1994, 2006; Amarasinghe et al. 1997, 2002), such effective forms of regulation are not quite pervasive in Sri Lanka’s lagoons, thus leaving room for expansion of fishing pressure. Moreover, since community laws are based on principles of the peasantry, such as “equity” (Amarasinghe 2009), some room for expansion of fishing pressure above the socially optimal levels is inevitable. Under such conditions, one may expect the share of each resource user to decline when the number of resource users increases.
Average monthly income of a fisher varies from Rs10,000 to Rs34,000, with a mean income of Rs14,411. This can be compared with “income receivers’ mean monthly income” in Sri Lanka, which is Rs20,427 (it is assumed that a household contains 1.8 income receivers), higher than the monthly income of a fisher (Department of Census and Statistics 2010). Thus a lagoon fisher appears to receive an income, which is below the income received by an average Sri Lankan income receiver. However, in certain lagoons in certain districts, reporting higher catch per boat (e.g., Bolgoda Lake) is reported when the monthly income of a lagoon fisher is higher than that of an average income earner in Sri Lanka.

60
Evidently, attention on lagoons has often been focused on the use values, either to improve use values or to resolve conflicts in resource use, thereby failing to exploit the potential that exists for the generation of other values. It is to be emphasized that a vast potential for the development of fisheries exists in an array of lagoons, especially those located in the northern and eastern provinces of Sri Lanka. While civil war must have had a depressing effect on new entrants to fisheries (e.g., Mullativu District) it has also led to a very low rate of acquisition of new crafts and gear. In fact, many people refrained from fishing during the civil war. Now that the war is over, people have commenced fishing in lagoons, but are constrained by lack of crafts and gear and probably by limited access to micro-credit. Given the livelihood issues of the people in those areas, it is necessary to provide the present and would-be fishers with assistance to acquire the required fishing equipment: crafts and gear. Marketing is another matter which should receive attention because fishers are likely to fall prey to unscrupulous traders, who are limited in number and thus wield oligopsonistic powers in buying fish.
Other direct and indirect use values of lagoons: The potentialWe have already discussed the more important extractive values of lagoons. As shown earlier, lagoons generate a range of nonextractive use values and nonuse values, which add towards the total economic value. A number of techniques are now available to measure these values, consisting of Revealed Preference methods and Stated Preference methods.
The present study did not involve any in-depth field studies to measure nonextractive and nonuse values. Rather than recording the underutilized potential of lagoons, the potential that exists for ecotourism, recreation, research and aquaculture had been noted by the officials of the Department of Fisheries and Aquatic Resources, which reveals the potential for development that exists in the lagoons, in respect of the variables concerned. In this exercise, the potential to generate diverse values was marked on a five-point scale: Very High, High, Moderate, Low and Very Low. These were assigned scores (ranks), from 5 to 1, respectively. The results of this exercise are summarized in Table 11. It is to be emphasized that this exercise only provides approximate values in ranking lagoons because of the smaller size of the sample and, thus gives a very broad view of the extent of diverse values generated by lagoons.
Table 11. Potential of lagoons for contributing to ecotourism, recreation, research and aquaculture.
Coastal zone Lagoon Ecotourism Recreation Research Aquaculture Average rank
Northern Jaffna 3.0 2.0 2.0 2.0 2.3Thondamanaru 1.0 2.0 2.0 1.0 1.5Chundikkulam 1.0 2.0 2.0 2.0 1.8Punkudutivu 1.0 2.0 2.0 3.0 2.0Nanthikadal 4.0 4.0 4.0 - 4.0Nayaru 2.0 3.0 3.0 - 2.7Kokkilai 5.0 5.0 4.0 - 4.7Chalai 2.0 3.0 3.0 - 2.7Average 2.4 2.9 2.8 2.7
Northeastern Uppar Lagoon 1.0 1.0 2.0 4.0 2.0Valachchenai 1.0 1.0 5.0 4.0 2.8Batticaloa 3.0 4.0 5.0 4.0 4.0Average 1.7 2.0 4.0 4.0 2.9
Eastern Periya Kalapuwa 1.0 1.0 2.0 2.0 1.5Thandiadi 3.0 3.0 2.0 1.0 2.3
Timbutu 1.0 2.0 2.0 - 1.7Komari 3.0 3.0 1.0 - 2.3Arugam 1.0 3.0 2.0 - 2.0

61
Coastal zone Lagoon Ecotourism Recreation Research Aquaculture Average rank
Pottuvil 4.0 5.0 4.0 - 4.3Murugatena 1.0 3.0 2.0 - 2.0Ureni 4.0 2.0 2.0 - 2.7Panama 4.0 5.0 2.0 - 3.7Average rank 2.4 3.0 2.1 1.5 2.3
Southeastern Embilikala 1.0 4.0 3.0 1.0 2.3Malala 1.0 4.0 3.0 1.0 2.3Average rank 1.0 4.0 3.0 1.0 2.3
Southern Lunama 3.0 4.0 4.0 4.0 3.8Kalametiya 5.0 4.0 4.0 5.0 4.5Kahandamodera 5.0 5.0 3.0 4.0 4.3Rekawa 5.0 5.0 5.0 2.0 4.3Mawella 5.0 4.0 4.0 5.0 4.5Average rank 4.5 4.5 4.0 3.8 4.2
Southwestern Koggala Lake 4.0 4.0 2.0 2.0 3.0Rathgama Lake 2.0 2.0 2.0 2.0 2.0Madu Ganga 4.0 4.0 2.0 3.0 3.3Average rank 3.3 3.3 2.0 2.3 2.7
Western Negombo 3.0 3.0 3.0 2.0 2.8Bolgoda Lake 4.0 5.0 2.0 4.0 3.8Average rank 3.5 4.0 3.5 3.0 3.3
Northwestern Chilaw Lagoon 2.0 3.0 2.0 3.0 2.5Muthupanthiya 2.0 4.0 2.0 4.0 3.0Periya Kalapuwa 4.0 4.0 5.0 4.0 4.3Venkalai 4.0 4.0 4.0 4.0 4.0Average rank 3.0 3.8 3.3 3.8 3.5
Key to ranking: Very High = 5; High = 4; Moderate = 3; Low = 2; Very Low = 1.Note: Data not available for lagoons in the Puttalam and Trincomalee districts.
It is to be noted that the potential for both ecotourism and recreation is closely linked. In both respects, the lagoons that show Very High to High values are Kahandamodera, Rekawa, Kokkilai, Pottuvil, Panama, Mawella, Kalametiya, Bolgoda, Periya Kalapuwa (eastern coastal zone), Venkalai Kalapuwa, Koggala Lake, Madu Ganga and Nanthikadal Lagoon (see table 12); with regard to aquaculture potential, Mawella, Kalametiya, Kahandamodera, Bolgoda, Periya Kalapuwa (northwestern coastal zone), Lunama, Batticaloa, Muthupanthiya, Uppar and Valachchenai show Very High to High potential for aquacultural development. In respect of all values, it is evident that lagoons such Kokkilai, Mawella, Kalametiya, Kahandamodera, Pottuvil, Panama, Bolgoda, Periya Kalapuwa, Venkalai Kalapuwa, Rekawa and Nanthikadal lagoons report High to Very High potential. Although low recreational values have been recorded for the Jaffna Lagoon (Jaffna Complex) in general, very high potential for generating such values was noted in certain areas of the Jaffna Lagoon (such as those along the causeway between Jaffna and Punkudutivu Island). The same is true with the Batticaloa Lagoon (e.g., area around the Batticaloa Light House). Figure 32 shows the Batticaloa Lagoon Light House Sports Club, promoting Ecotourism. A number of initiatives to promote nature/ecotourism were noted in the Batticaloa Lagoon, in the vicinity of the light house, including the establishment of an environmental learning center. Figure 33 shows the Batticaloa Lagoon Environmental Learning Centre.
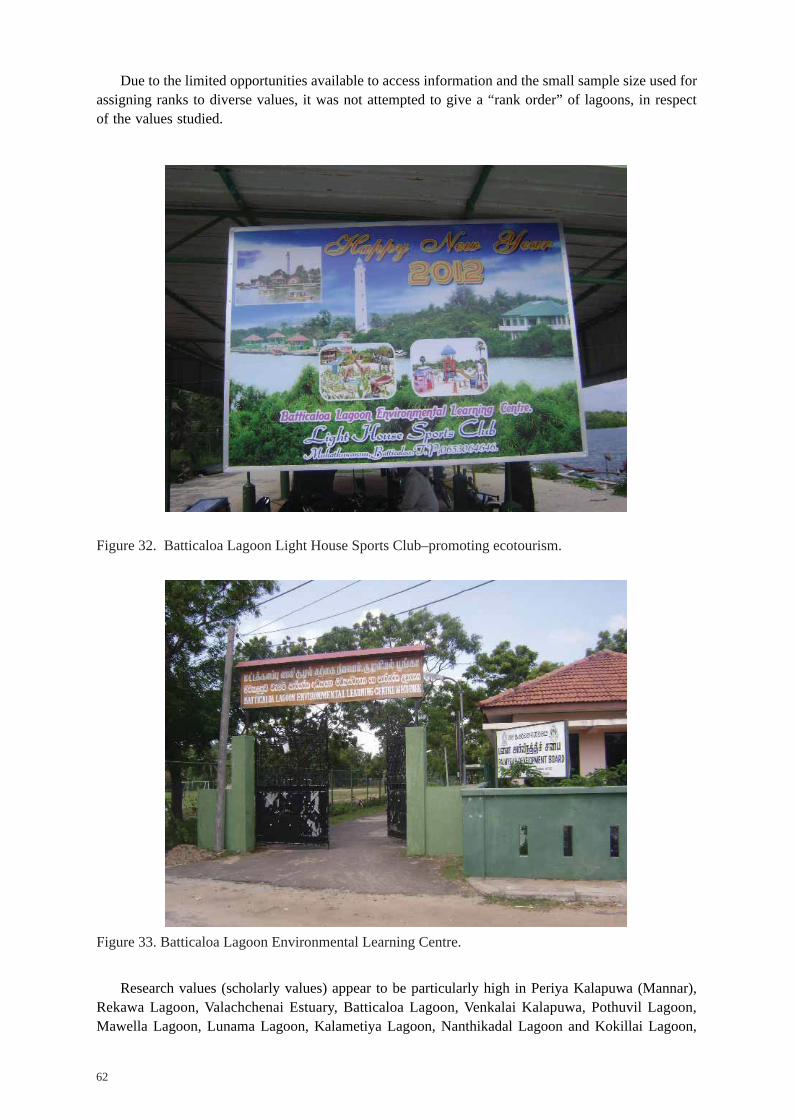
62
Due to the limited opportunities available to access information and the small sample size used for assigning ranks to diverse values, it was not attempted to give a “rank order” of lagoons, in respect of the values studied.
Figure 32. Batticaloa Lagoon Light House Sports Club–promoting ecotourism.
Figure 33. Batticaloa Lagoon Environmental Learning Centre.
Research values (scholarly values) appear to be particularly high in Periya Kalapuwa (Mannar), Rekawa Lagoon, Valachchenai Estuary, Batticaloa Lagoon, Venkalai Kalapuwa, Pothuvil Lagoon, Mawella Lagoon, Lunama Lagoon, Kalametiya Lagoon, Nanthikadal Lagoon and Kokillai Lagoon,

63
whereas high aquacultural potential has been reported for Maella, Kalametiya, Periya Kalapuwa, Valachchenai, Batticaloa Lagoon, Venkalai, Lunama, Kahandamodera, etc.
Table 12. Potential for the development of nonextractive use values in lagoons.
Potential for the Lagoons recording Very High to High values development of
Ecotourism and Kahandamodera, Rekawa, Kokkilai, Pottuvil, Panama, Mawella, Recreation* Kalametiya, Bolgoda, Periya Kalapuwa (Ampara), Venkalai Kalapuwa,
Koggala, Madu Ganga and Nanthikadal
Aquaculture Mawella, Kalametiya, Kahandamodera, Bolgoda, Periya Kalapuwa (Mannar), Lunama, Batticaloa, Muthupanthiya, Uppar and Valachchenai
Research Didattaltivu,, Periya Kalapuwa (Mannar), Rekawa, Valachchenai, Batticalo, (Scholarly values) Venkalai, Pothuvil Lagoon, Mawella, Lunama Lagoon, Kalametiya Lagoon,
Nanthikadal and Kokillai*Further evidence of high recreational and ecotourism values in lagoons of the Southeastern Coast are found in IUCN 2010.
With regard to the potential of lagoons to generate all of nonextractive values studied, lagoons in the Mannar District have been ranked first, followed by those in Colombo (Bolgoda Lake), Hambantota, Mullativu, Batticaloa, Gampaha (Negombo Lagoon), Galle, Ampara, Chilaw and Jaffna districts (Table 13).
Table 13. Potential for development of ecotourism, recreational facilities and aquaculture in lagoons, by coastal district.
Potential that exists in lagoons, for the development of
Coastal Ecotourism Recreation Research Aquaculture Average District (Rank) (Rank) (Rank) (Rank) Rank
Mannar 4 4 4.5 4 4.1Colombo 4 5 2 4 3.8Hambantota 3.6 4.3 3.7 3.1 3.7Mullativu 3.3 3.8 3.5 - 3.5Batticaloa 1.7 2 4 4 2.9Gampaha 3 3 3 2 2.8Galle 3.3 3.3 2 2.3 2.7Ampara 2.4 3 2.1 1.5 2.7Chilaw 1.5 3.5 2 3.5 2.6Jaffna 1.5 2 2 2 1.9
Based on information furnished in Table 11.
Misuse of Lagoon Ecosys tems and the ThreatsUse and misuse of natural resources, including lagoons, are phenomena that have strong links to human development. It is well known that by using natural resources to improve their well-being, humans have often degraded their ecosystems, which finally results in the “ill-being of humanity.” It appears that people “use” and “misuse” resources in order to meet their livelihood goals. “Misuse” takes place when “use” adversely affects the status of the resources or the health of the ecosystem. Further, diverse impacts on the lagoon ecosystem cause threats to its sustainability (Figure 34).

64
Figure 34. Diverse impacts on the lagoon ecosystem causing threats to its sustainability.
Field studies revealed that, misuse of lagoons is often caused by factors such as vulnerability, poverty, urbanization, development activities, population pressure, fishing pressure, multi-stakeholder issues, invasive species, sedimentation/land filling, security issues, etc.
Vulnerability and povertyWhile all human societies are linked to ecological processes and healthy ecosystems that produce the requirements for life, poor rural people depend significantly more on natural capital than the rest of the population. Vulnerability is a factor that exposes people to various risks and shocks leading to destitution (Dhanani and Islam 2002; Parker and Kozel 2005; Bird and Prowse 2008). Given that rural poor are more vulnerable to risks and uncertainties, such as the vagaries of climate, seasonality, landlessness, etc., and that they have limited access to livelihood capitals, especially physical capital and financial capital, there is a tendency for them to fall back on natural resources (natural capital) and to use them more intensively in order to meet their livelihood goals.
In fact, one can identify two vicious circles. Vicious circle (1) suggests that poor people do not have access to adequate livelihood capital, and thus are unable to adopt appropriate coping strategies to deal with vulnerability. This is the “vicious circle of poverty and vulnerability.” From vicious circle (1) follows vicious circle (2): if people are unable to secure livelihood capitals to effectively deal with vulnerability, the only way to survive may be to extract natural resources - such as fish stocks - more intensively (Amarasinghe and Bavinck 2011). Figure 35 shows the vicious circles of poverty, vulnerability and ecosystem health. “If you don’t fish you starve. If you fish you will degrade the resources and then starve” (Jentoft 2008). As aptly described by Lowry et al. (1999), poverty forces people to opportunistically search for employment, employ unsustainable methods of farming and fishing, and resist management from fear of income loss. This exerts a negative effect on future returns and may thereby reinforce the state of poverty. Conservationists and state officials often see the poor as part of the natural resources problem. A poor person’s inability to accumulate wealth from natural resources may lead to overexploitation and resource degradation. Use of destructive gear types, felling of mangroves, etc., are some examples of manifestation of this phenomenon (e.g., Rekawa, Negombo and Jaffna lagoons).
DevelopmentSedimentation/
Land filling
PopulationUrbanization
Lagoon EcosystemVulnerability Fishing
PovertyInvasive species
SecurityMulti-stakeholders

65
Figure 35.Vicious circles of poverty, vulnerability and ecosystem health (Source: Amarasinghe and Bavinck 2011).
Population pressure and urbanizationUrbanization and population pressure often have similar impacts on natural resources used by such populations. One of the oft-noted impacts of population growth is the increased pressure it exerts on natural resources, which are used by people as “natural capital” in developing diverse livelihood strategies. The issue is particularly serious when increased population pressure is coupled with poverty because the poor and vulnerable often fall back on natural resources, under the conditions of pervasive unemployment. Urbanization may also have similar impacts, if it is accompanied by lack of alternative employment opportunities and a high rate of unemployment, forcing people to fall back on natural resources. Fishing pressure is strongly linked to population pressure. The higher the population pressure, the higher the fishing pressure, in terms of the entry of new fishers and the number of crafts and gear.
Development activitiesIt is generally believed that development and environmental sustainability move in opposite directions; in other words that, development always leads to some form of “environmental degradation” (a win-lose situation). In respect of lagoons, the impact of development activities is felt in the form of industrial pollution, garbage disposal, salt production (converting lagoons into salterns), loss of productivity of lagoon resources due to increased human intervention (e.g., use of sea planes for tourism development), etc. While recognizing the need to attain development goals, it should be emphasized that, what is required is to develop policies and strategies that would facilitate in reaching the development goals, while at the same time, minimizing the impact of development on the natural resources base, on which both present and future generations depend for their livelihoods and paving the way for win-win situations.
Land-based human activities – Agriculture and livestock. Agriculture is one of the major land-based activities around lagoons. While paddy and vegetables play an important role in the livelihoods of coastal dwellers in the South, paddy and cash crops, such as onions, are important for their eastern counterparts. Much of the water received by the lagoon from the rivers and other watercourses feeding into lagoons contains runoff from agricultural fields containing agrochemicals, fertilizer, etc. Although the levels of chemicals and their impacts have not been studied yet, a change in the biodiversity has been noted (Jayakody and Jayasinghe 1992). Instances of fish kills due to chemical pollution have been noted in the past.
While cattle are fed on lagoon areas, which dry out during the non-monsoonal times and are converted into grasslands (e.g., lagoons in the Kumana bird sanctuary area), negative impacts of livestock on lagoons have not been reported.
Land-based human activities – Shrimp farming: Unplanned and illegal aquaculture. Shrimp farming has been a major threat to lagoons in the Northwestern Province. Shrimp farming provided
Vulnerability
Ecosystem Health
1
Poverty
2

66
direct employment to about 40,000 people and has improved infrastructural facilities in villages and living standards of communities. However, the majority of investors in shrimp farming in Sri Lanka are entrepreneurs rather than farmers, outsiders rather than people from the community. There have also been a large number of small-scale shrimp farmers, many of whom remained unregistered (illegal). Shrimp farming has often resulted in conflicts between shrimp farmers and other users of coastal resources. Udappuwa has been one of the areas where intensive shrimp farming has been practiced. All lagoons in the region – Muthupanthiya, Chilaw and Puttalam – have been seriously affected by shrimp farming. There are also some abandoned shrimp farms at Muthupanthiya Lagoon, Udappuwa, and Chilaw (Figure 36).
Nonetheless, some studies have also indicated the existence of community-based shrimp farming practices which are eco-friendly (Galappaththi 2013).
Figure 36. Abandoned shrimp farms at Muthupanthiya Lagoon, Udappuwa, and Chilaw.
Tourism development. In respect of tourism development, sea planes transport tourists using the lagoons for landing and this activity appears to gather momentum. Figure 37 shows a platform for sea plane transport of tourists at the Mawella Lagoon. Although this activity was curtailed in Negombo in December 2010 by strong public protests, it is spreading into other areas, such as the Mawella Lagoon. In Negombo, a channel to facilitate movements of sea planes was dredged along a highly productive area for shrimp, the reason for such strong protests by the people. The Negombo example shows the importance of having strong social networks (social capital) which could safeguard the interests of lagoon resource users against those who tend to misuse lagoon resources to attain other goals. However, no such protest has been reported from Mawella. On the one hand, Mawella does not have a flourishing fishery and, on the other, there is no strong community organization to safeguard the interests of fishers.

67
Figure 37. Platform for sea plane transport of tourists - Mawella Lagoon.
Urbanization and waste disposal. It is well known that wetlands have been used by people as “sinks” to release their waste. Many instances of using lagoons for dumping of household waste in urbanized areas have been noticed. Garbage dumping was found to be very extensive in the Chilaw Lagoon, particularly at the northern end. Figure 38 shows garbage dumping near the northern end of the Chilaw Lagoon; the lagoon and dense mangrove are in the background.
Figure 38. Garbage dumping near the northern end of the Chilaw Lagoon – the lagoon and dense mangrove are in the background.
The other lagoons where it was noticed include the Vankalai Kalapuwa in the Mannar District, Mundel Lake in the Puttalam District and Bolgoda Lake in the Colombo District. Issues such as fecal pollution, oil pollution and heavy metal pollution have been reported from the Negombo Lagoon.

68
Field studies revealed that political will to safeguard lagoons from diverse threats was low and lagoons provided the political authorities with a panacea to human congestion and waste disposal issues in their electorates.
Land filling and construction of houses. In urbanized areas, such as Negombo, high rates of growth of population (approximately 2.3%)2 have been reported. The area of the Negombo Lagoon is thickly populated and has become the arena of activities for a large array of dwellers. Land-filling is taking place extensively to pave way for the construction of houses and other structures resulting in loss of the lagoon area and sedimentation. The same was found in the Bolgoda Lake in Colombo.
Road building. Another human intervention has been road building, especially the construction of causeways (Figure 39 shows the long causeway across Nanthikadal Lagoon in Mullativu) and bridges across lagoons.
Figure 39. Long causeway across Nanthikadal Lagoon in Mullativu.
It was noticed that such constructions have caused landsides of the lagoons to be “fresher” than “brine,” leading to a decline in shrimp production.
Meeting the demand for freshwater. Other than causeways, barrages (Figure 40 shows the barrage across Uppu Aru Lagoon at Navanth Kuli Bridge in the Jaffna District) have also been constructed, especially in the Northern Province to convert lagoons into freshwater bodies to meet the consumer demand for freshwater. However, many such efforts have failed to achieve the expected goals because of the intrusion of saltwater due to water seepage under the barrages (Thondaman Aru Lagoon and Uppu Aru Lagoon in the Jaffna District). Society has been the net loser, due to the potential losses of extractive value from lagoons and people’s inability to access freshwater. Unless properly planned and designed these constructions will threaten the livelihoods of both the fishers and the consumers of freshwater.
2 Information obtained from the Assistant Director of Fisheries, Negombo.

69
Figure 40. Barrage across Uppu Aru Lagoon at Navanth Kuli Bridge in the Jaffna District.
Saltern development. Sri Lanka’s salt demand now exceeds its supply, leading to salt imports. Today, there exists a high pressure towards salt production using internal sources. Therefore, recently the government has taken a number of steps to increase local production of salt, among which, converting of lagoons into salterns is an important one. However, converting a lagoon into a saltern (e.g., Raigam Saltern at Periyakarachchi Lagoon at Trincomalee shown in Figure 41) may completely destroy all values generated by the lagoon ecosystem, other than the “extractive-use value” generated by the production of salt. Of course, there is little argument against the fact that the needs of the current generation (human development goals) have to be met. However, such goals should not result in “netlosses” to the society. For example, if fish catch is lost due to high salinity of lagoons (converted to salterns), alternative livelihoods should be provided to all affected fishers.
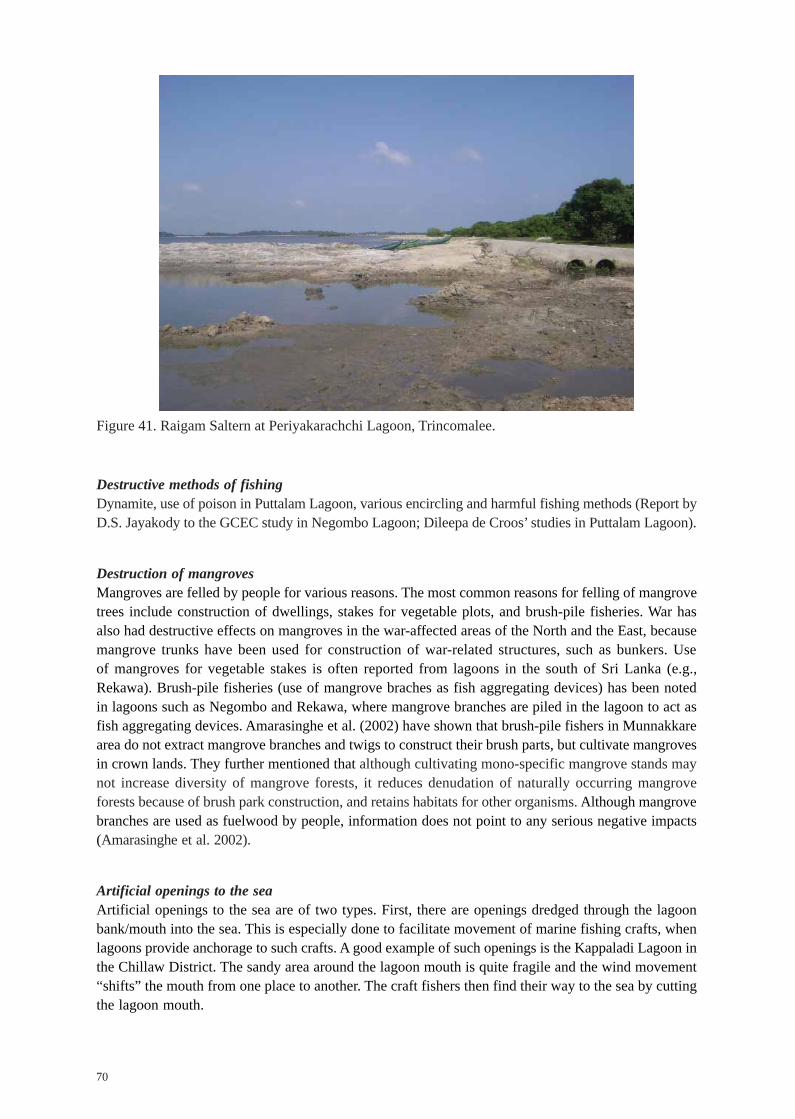
70
Figure 41. Raigam Saltern at Periyakarachchi Lagoon, Trincomalee.
Destructive methods of fishingDynamite, use of poison in Puttalam Lagoon, various encircling and harmful fishing methods (Report by D.S. Jayakody to the GCEC study in Negombo Lagoon; Dileepa de Croos’ studies in Puttalam Lagoon).
Destruction of mangrovesMangroves are felled by people for various reasons. The most common reasons for felling of mangrove trees include construction of dwellings, stakes for vegetable plots, and brush-pile fisheries. War has also had destructive effects on mangroves in the war-affected areas of the North and the East, because mangrove trunks have been used for construction of war-related structures, such as bunkers. Use of mangroves for vegetable stakes is often reported from lagoons in the south of Sri Lanka (e.g., Rekawa). Brush-pile fisheries (use of mangrove braches as fish aggregating devices) has been noted in lagoons such as Negombo and Rekawa, where mangrove branches are piled in the lagoon to act as fish aggregating devices. Amarasinghe et al. (2002) have shown that brush-pile fishers in Munnakkare area do not extract mangrove branches and twigs to construct their brush parts, but cultivate mangroves in crown lands. They further mentioned that although cultivating mono-specific mangrove stands may not increase diversity of mangrove forests, it reduces denudation of naturally occurring mangrove forests because of brush park construction, and retains habitats for other organisms. Although mangrove branches are used as fuelwood by people, information does not point to any serious negative impacts (Amarasinghe et al. 2002).
Artificial openings to the seaArtificial openings to the sea are of two types. First, there are openings dredged through the lagoon bank/mouth into the sea. This is especially done to facilitate movement of marine fishing crafts, when lagoons provide anchorage to such crafts. A good example of such openings is the Kappaladi Lagoon in the Chillaw District. The sandy area around the lagoon mouth is quite fragile and the wind movement “shifts” the mouth from one place to another. The craft fishers then find their way to the sea by cutting the lagoon mouth.

71
The other is the forced breaching of the sand bar at the lagoon mouth. Generally, by nature, there is sand bar formation at the mouth of lagoons, which are called “seasonal lagoons” in contrast to “perennial lagoons” whose mouths remain open throughout the year. In seasonal lagoons, the sand bar is breached at regular intervals by the force of lagoon waters, especially after monsoonal rains. This natural process allows optimal conditions for lagoon productivity by facilitating seawater-freshwater exchange. However, there are instances where different stakeholders artificially break the sand bar to achieve diverse goals. For example, there have been many instances where farmers having their rice, cash crops or vegetable plots around lagoons, exerting pressure on authorities to breach the lagoon mouth, when their fields have been flooded. Such artificial breaching of lagoons has serious negative impacts on lagoon resources (e.g., Rekawa Lagoon of Hambantota District). For example, the life cycle of shrimp is completed both in the lagoon and the sea and, therefore, timely breaching of the lagoon is required for shrimp larvae to move into the sea and complete their life cycle. Artificial breaching of the sand bar will completely disturb the shrimp life cycle and cause losses in terms of shrimp catches. Figure 42 shows an artificial opening of the lagoon to allow for movement of marine fishing crafts - Kappaladi Lagoon, Chilaw.
Lagoon, Chilaw.
Evidently, whenever a lagoon is used for anchorage of marine crafts, marine fisheries take priority over lagoon fisheries. This is also true with farmer-fisher conflicts. Farmers often command more power over fishers and fisher interests are taken less care of, when there is a conflict between the two groups. This is quite evident at instances of breaching of the lagoon mouth in response to farmer demands. The mouths of certain lagoons sometimes do not open under normal conditions and may remain closed for long periods of time or may even get closed due to the formation of sand dunes. Under such circumstances, people may artificially breach the lagoon mouth to facilitate water exchange. A good example of such activity is the Gembaradiya Kalapuwa in Chilaw. Figure 43 shows the Gembaradiya Kalapuwa in Negombo, showing the closed mouth (which is artificially breached by people at regular intervals).

72
by people at regular intervals).
More than anything else, political power appears to have played an important role in artificial opening of lagoon mouths – completely disturbing the natural process. It is quite clear that unnecessary breaching of lagoons has adverse impacts on lagoon productivity. Decisions regarding artificial opening of lagoons should be made with the consultation of all stakeholders concerned, and such decisions should result in positive net benefits to the society, rather than providing benefits to the more-privileged stakeholder groups at the expense of the less-privileged groups.
Multi-stakeholder issuesMulti-stakeholder issue is another source of resource use conflicts that could add significantly towards the fragility of a natural resources system. Diverse groups whose conduct is guided by different normative orders are brought into one place. Their decisions concerning resource use could be in conflict with those of others, mainly due to technological externalities. For example, in the Rekawa Lagoon of southern Sri Lanka, people who mine corals impose serious negative externalities on coastal fish landings. There are conflicts among farmers and lagoon fishers over the breaching of the sand bar at the lagoon mouth. Hoteliers dump garbage into the lagoon, affecting lagoon productivity, leading to conflicts between lagoon fishers and hoteliers. Multi-stakeholder conflicts are also evident in the Negombo Lagoon, where the lagoon and adjacent coastal area are used by lagoon fishers, marine fishers, households, industries, tourism industry, etc.
Special Area Management (SAM) was an important step taken by the Coastal Conservation Department (CCD) in resolving such conflicts. The most important characteristic of the SAM process is that it is community-based and collaborative. Resource use decisions are made by residents living in a designated SAM planning area in collaboration with local and national governmental officials. The overall planning process is planned to be coordinated by a Special Area Management Coordinating Committee (SAMCC). While the process produced fruitful results, the SAMCCs have failed to perform their function mainly because they did not have a legal status – one of the serious setbacks in the SAM process (e.g., collapse of the Rekawa SAMCC).
Invasive speciesSome of the lagoons are seriously affected by certain plant species, which invade the lagoons. These include Water Hyacinth (Eichhornia crassipes), Salvinia (Salvinia molesta) and Hambu (Typha

73
angustifolia). Extensive growth of certain fish species, such as Tilapia, has also been reported (Nanthikadal, Uppar Panichankerni, Batticaloa, Lunama, Kalametiya, Embilikala-Malala, Mawella lagoons, etc.).
Security reasonsSome of the lagoons in the northern and eastern districts are situated within high security zones. Access to certain areas of the lagoons within such security zones is either limited or prohibited, such as the Nanthikadal Lagoon (including Chalai extension) and the Nayaru Lagoon in the Mullativu District. This prevents the application of appropriate management strategies to such lagoons. Information furnished above is summarized in Annex V.
Present Status of ResourcesAssessment of the status of lagoon resources by the officials of the Department of Fisheries and Aquatic Resources and National Aquaculture Development Authority, based on their experience, shows that the resources in the majority of Sri Lanka’s lagoons still remain either satisfactory, somewhat good or very good. Lagoon resources in the Mannar District appear to be in a better condition than those in other coastal districts (Table 14). However, some of the lagoons in the Hambantota, Colombo and Galle districts where fishing is carried out have been categorized as “bad” or “very bad.” Lagoon resources in the western and northwestern provinces are categorized as “satisfactory” to “bad.” Resources of two lagoons in the Jaffna District and one third of the lagoons in the Ampara Coastal District appear to suffer from resource degradation (which are categorized as “bad”), which should receive the attention of the authorities, to prevent them from further degradation. However, more detailed studies are required to understand the nature and causes of resource degradation in these lagoons.
Table 14. Present statuses of resources in lagoons.
Coastal Zone Lagoon Very Somewhat Satisfactory Bad Very good good bad

74
Coastal Zone Lagoon Very Somewhat Satisfactory Bad Very good Good bad

75
Chapter 7 Gove rnance and Management
Governance is not simply “what governors do,” but is defined as “the whole of public as well as private interactions that are initiated to solve societal problems and create societal opportunities. It includes the formulation and application of principles guiding those interactions and care for institutions that enable them” (Bavinck et al. 2005). The governors try to achieve such objectives through the establishment of rules and regulations that shape the behavior of people. In its simplest form, governance is the process of decision making. Management concerns the day-to-day operation of strategies, policies, processes, and procedures that have been established by the governing body (World Bank n.d.).Whereas governance is concerned with “doing the right thing,” management is concerned with “doing things right” (Tricker 1999).
Evol ution of Fisheries Gove rnance and Management in Sri LankaAn introductory note
The need to govern fisheries has been seriously felt in Sri Lanka and elsewhere, arising mainly from resource overexploitation and failure to enforce the required management options (Pauly and Christensen 1998; Amarasinghe 2006). If left unattended, this situation might lead to a collapse of the ecosystem and serious threats to the livelihoods of the fishers and their families. Lagoons and people depending on lagoon resources are no exception to this crisis, which arises from the fact that many policies which promote environmental sustainability often conflict with human development considerations.
From time immemorial, fishers have devised various norms and laws to guide the behavior of community members. It appears that such community laws are based on the principles of equality (equal opportunities of access to resources and earning incomes to all), well-being (that object of fishers is “well-being”, which is defined as a state of being with others, where human needs are met, where one can act meaningfully to pursue one’s goals, and where one enjoys a satisfactory quality of life (McGregor 2007) and social harmony. Amarasinghe et al. (1997) reported a hundreds of years old community-based fisheries management system in the stake-net fishery of Negombo Lagoon, where three communities of fishers share fishing days and members of each community share fishing sites using a lottery system. However, community laws do not remain static and often come under the pressures of modernization. Market expansion and technological change could have serious impacts on community laws, while causing heavy pressure on fish resources (Amarasinghe 2006). The state intervention in fisheries management coincides with evidence of overexploitation and degradation of resources. State rules (which are generally “written” laws) generally aim at resource conservation to achieve sustainability. But, they are often formulated without much concern for human development needs. One exception is that in the stake-net fishery of Negombo lagoon, the traditional community-based management system has been reinforced by the regulations published in Gazette No. 11, 579 of 7th November 1958. These regulations are called the Negombo (Kattudel) Fishing Regulations of 1958.
The evolution of fisheries governance and managementToday, diverse management regimes and governance patterns exist in lagoons. A closer look at the formation of management regimes reveals a certain evolutionary pattern which is historically linked both to the status of resources and the growth of population. During the pre-independent era, the state only paid a regulatory role in fisheries, and fishing was mainly carried out according to community laws. The 1950s to the 1970s marked the dawn of a new era, which began with the expansion and development of fish marketing, the change in the role of the state from “regulation” to “reformism” and the introduction of mechanized crafts, nylon nets and new fishing techniques. The emerging market opportunities and the forces of national integration, technological change and state intervention, along

76
with high post-independent rates of growth of population all led to increased fishing pressure. Moreover, new economic opportunities outside the sphere of fisheries and monetization of some of the elements of the consumption basket demanded “cash” from the people. In fact, the modern forces discussed above enhanced economic, social and geographical mobility of the people, gradually detaching them from their traditional settings. People no longer believed that their own future and that of their children depended on the natural resources surrounding their native village. Since their traditional rights and obligations were not tradable on a perfect market, they were led to neglect or overexploit the resource. Here we witness the emergence of, what we call “fishing problems.” Use of destructive gear such as seine nets and monofilament nets in lagoons was on the rise. Along with a Malthusian crisis in small-scale fisheries of developing countries, slow economic progress causing very low rates of employment generation outside fisheries has made fisheries a last-resort employment, causing heavy pressure on resources. All these changes led to the application of very high fishing pressure on fisheries resources: both marine and inland. The traditional community norms and laws could not address the newly emerging fishing problems successfully and the state had to intervene to protect the common property fisheries from further degradation (see Amarasinghe 1989). Rather than regulating fisheries and implementing purely production-oriented policies, the state felt the need to design fisheries management measures aiming at sustainable exploitation of fisheries resources.
The intervention of the state meant more forceful implementation of state laws. A state fisheries official, the Fisheries Inspector (FI), was stationed in the Fisheries Inspector Division, with the responsibility of strictly enforcing state law. The Fisheries and Aquatic Resources Act of 1996 (FARA) and subsequent amendments further introduced new state laws in fisheries.
The historical pattern of population growth and human intervention in lagoons and the status of resources point to a clear pattern of state intervention in regulating activities in lagoons and the emergence of public-private (state-community) partnerships (Figure 44). The difference between the regions C and D, is that, in the former region, although the state is involved in regulating fisheries
Extent of Involvement in Management (%)
100 Co-Management
C B D A a
50 b State Interven on
Community Involvement
0
Comanagement State Interven on in Management
Community Management Zero Management
Time
Pressure on Resource (and resource depletion & degradation
Population Increase (Extractive Pressure)
Figure 44. Evolution of management regimes in lagoons.
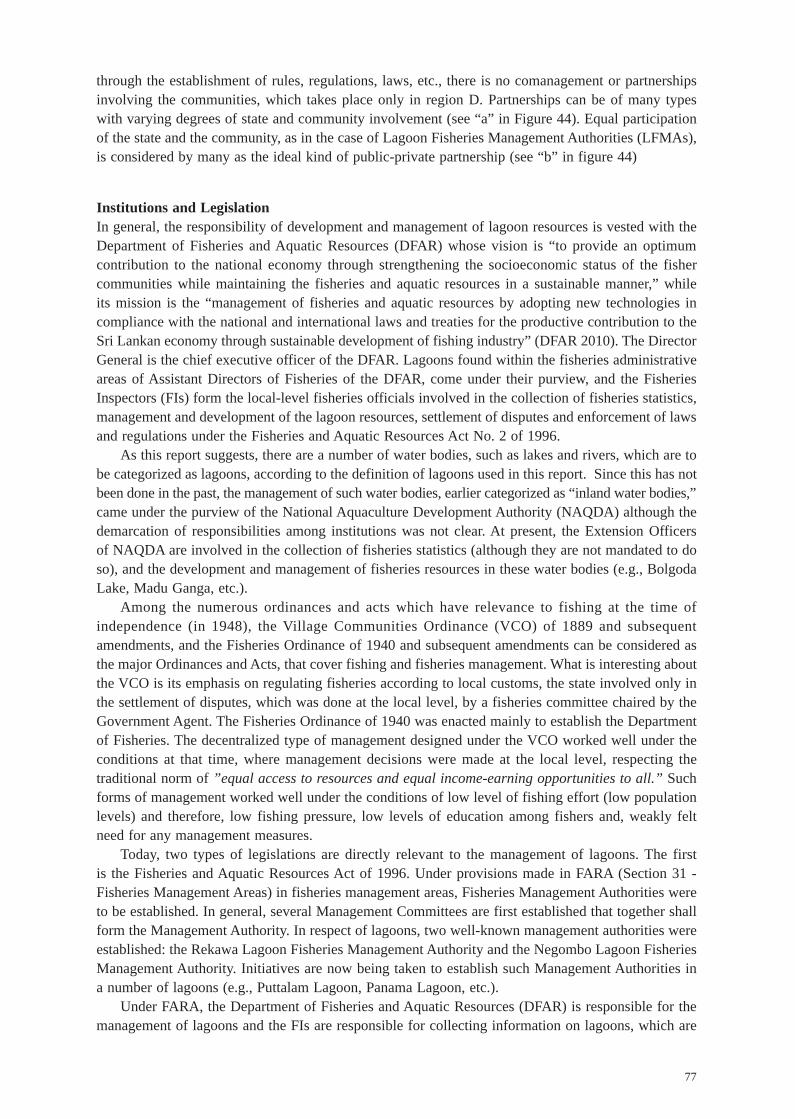
77
through the establishment of rules, regulations, laws, etc., there is no comanagement or partnerships involving the communities, which takes place only in region D. Partnerships can be of many types with varying degrees of state and community involvement (see “a” in Figure 44). Equal participation of the state and the community, as in the case of Lagoon Fisheries Management Authorities (LFMAs), is considered by many as the ideal kind of public-private partnership (see “b” in figure 44)
Institutions and LegislationIn general, the responsibility of development and management of lagoon resources is vested with the Department of Fisheries and Aquatic Resources (DFAR) whose vision is “to provide an optimum contribution to the national economy through strengthening the socioeconomic status of the fisher communities while maintaining the fisheries and aquatic resources in a sustainable manner,” while its mission is the “management of fisheries and aquatic resources by adopting new technologies in compliance with the national and international laws and treaties for the productive contribution to the Sri Lankan economy through sustainable development of fishing industry” (DFAR 2010). The Director General is the chief executive officer of the DFAR. Lagoons found within the fisheries administrative areas of Assistant Directors of Fisheries of the DFAR, come under their purview, and the Fisheries Inspectors (FIs) form the local-level fisheries officials involved in the collection of fisheries statistics, management and development of the lagoon resources, settlement of disputes and enforcement of laws and regulations under the Fisheries and Aquatic Resources Act No. 2 of 1996.
As this report suggests, there are a number of water bodies, such as lakes and rivers, which are to be categorized as lagoons, according to the definition of lagoons used in this report. Since this has not been done in the past, the management of such water bodies, earlier categorized as “inland water bodies,” came under the purview of the National Aquaculture Development Authority (NAQDA) although the demarcation of responsibilities among institutions was not clear. At present, the Extension Officers of NAQDA are involved in the collection of fisheries statistics (although they are not mandated to do so), and the development and management of fisheries resources in these water bodies (e.g., Bolgoda Lake, Madu Ganga, etc.).
Among the numerous ordinances and acts which have relevance to fishing at the time of independence (in 1948), the Village Communities Ordinance (VCO) of 1889 and subsequent amendments, and the Fisheries Ordinance of 1940 and subsequent amendments can be considered as the major Ordinances and Acts, that cover fishing and fisheries management. What is interesting about the VCO is its emphasis on regulating fisheries according to local customs, the state involved only in the settlement of disputes, which was done at the local level, by a fisheries committee chaired by the Government Agent. The Fisheries Ordinance of 1940 was enacted mainly to establish the Department of Fisheries. The decentralized type of management designed under the VCO worked well under the conditions at that time, where management decisions were made at the local level, respecting the traditional norm of ”equal access to resources and equal income-earning opportunities to all.” Such forms of management worked well under the conditions of low level of fishing effort (low population levels) and therefore, low fishing pressure, low levels of education among fishers and, weakly felt need for any management measures.
Today, two types of legislations are directly relevant to the management of lagoons. The first is the Fisheries and Aquatic Resources Act of 1996. Under provisions made in FARA (Section 31 - Fisheries Management Areas) in fisheries management areas, Fisheries Management Authorities were to be established. In general, several Management Committees are first established that together shall form the Management Authority. In respect of lagoons, two well-known management authorities were established: the Rekawa Lagoon Fisheries Management Authority and the Negombo Lagoon Fisheries Management Authority. Initiatives are now being taken to establish such Management Authorities in a number of lagoons (e.g., Puttalam Lagoon, Panama Lagoon, etc.).
Under FARA, the Department of Fisheries and Aquatic Resources (DFAR) is responsible for the management of lagoons and the FIs are responsible for collecting information on lagoons, which are

78
compiled by the Assistant Directors of Fisheries. However, compilation of data on a regular basis by the DFAR and such items of information are not furnished in the statistical guide of the website of the Ministry of Fisheries and Aquatic Resources. This also reveals the poor status of research in lagoons and the low demand for statistical information by researchers, planners and policymakers.
The second type of relevant legislation is the National Aquaculture Development Authority of Sri Lanka Act No. 53 of 1988, which led to the establishment of the National Aquaculture Development Authority. Section 11 indicates the functions of the authority, among which “to develop aquatic resource and the aquaculture industry, with a view to increasing fish production in the country, to manage, conserve, and develop, aquatic resources and the aquaculture industry, to prepare and implement plans and programs for the management and development of aquaculture and aquatic resources, to conserve biodiversity,” etc., are of more relevance to the development and management of lagoons. Under Section 12 (powers of the authority), NAQDA is supposed to undertake collection and dissemination of information on aquatic resources and aquaculture. A subsequent amendment to the act (Act No. 23 of 2006), replaced Section 11.1 of the 1988 Act, which emphasizes NAQDA’s specific role in the development of aquatic resources and aquaculture in perennial and seasonal reservoirs.
The Special Area Management Planning (SAMP), established and implemented by the Coast Conservation Department (CCD), too provides for the management of lagoons, through its involvement in the management of environmentally sensitive coastal zones, which may include lagoons. The Coastal Conservation Act (1981) required, among other things, the CCD to develop a Coastal Zone Management Plan (CZMP) to regulate and control development activities within the coastal zone, and design and implement coastal conservation projects. The Coastal 2000 (CCD 1992) strongly advocated a policy of achieving “effective and participatory resource management by governmental and non-governmental agencies.” The Revised Coastal Zone Management Plan, Sri Lanka (CCD 1997) states that “a comprehensive strategy was needed to cope with the impacts of these individual resource use decisions and conflicts over an area that might include resources not in the legally designated coastal zone. That strategy is Special Area Management (SAM).” The most important characteristic of the SAM process is that it is community-based and collaborative. Resource use decisions are made by residents living in a designated SAM planning area in collaboration with local and national governmental officials (Lowry et al. 1999). The overall planning process is coordinated by a Special Area Management Coordinating Committee. SAM process contributed positively towards both the development and management of lagoons which came under SAM areas (identified by the CCD). First, SAM dealt effectively with multi-stakeholder conflicts (arising from negative externalities generated by resource user groups) at SAM Coordinating Committee meetings, thereby facilitating the development activities. Second, SAM process ensured sustainable use of resources in SAM areas and conservation of biodiversity, through sound environmental management. Two of the well-known lagoons that had come under the SAM process are the Rekawa and the Negombo lagoons.
Apart from the above, there are a number agencies and institutions established under Acts of Parliament, which have either research interests or regulating power over the resources and activities of lagoons. NARA, CEA, the Department of Wild Life Conservation and the Department of Forest Conservation form the most important institutions in this respect.
Established under the NARA Act of No. 54 of 1981, the National Aquatic Resources Research and Development Agency (NARA), is the apex national institute vested with the responsibility of carrying out and coordinating research, development and management activities on the subject of aquatic resources in Sri Lanka. Under the Forest Act 34 of 1951 amended in 1954, 1966 and 1979, the large extents of mangrove forests and some of the inland water bodies within the forests fall within the control of this Act executed by the Forest Conservator. The Department of Wildlife Conservation is a non-ministerial government department in Sri Lanka. It is the government department responsible for maintaining national parks, nature reserves and wildlife in wilderness areas in Sir Lanka. The Fauna and Flora Protection (Amendments) Act 1949 (No. 38), Act 1964 (No. 44), Act 1970 (No.1) and Act 1993 (No.49) indicate the protected fish species and provisions for the establishment of a nature reserves and sanctuaries within which no person shall take fish or other aquatic animals without

79
a permit issued by the Director of the Department of Wildlife Conservation. The Wilderness and Wildlife Conservation Trust aims at preserving, protecting and creating wilderness areas specifically on the island of Sri Lanka and to protect and conserve its wildlife populations. It fully believes in the ecosystem approach to conservation.
The National Environmental Act No. 47 of 1980, amended by No. 56 of 1988, deals with provisions for the protection, management and enhancement of the environment and for the regulation, maintenance and control of the quality of the environment; and for the prevention, abatement and control of the pollution. CEA was established in August 1981 under the National Environmental Act. The Ministry of Environment and Natural Resources (ME&NR) established in December 2001 has the overall responsibility in the affairs of the CEA with the objective of integrating environmental considerations in the development process of the country. The CEA was given wider regulatory powers under the National Environment (Amendment) Acts No. 56 of 1988 and No. 53 of 2000. Part II, Section 10 of this Act gives the functions of the authority. One function that has relevance to lagoons is “to recommend to the Minister, national environmental policy and criteria for the protection of any portion of the environment with respect to the uses and values, whether tangible or intangible, to be protected, the quality to be maintained, the extent to which the discharge of wastes may be permitted without detriment to the quality of the environment and long range development used and planning and any other factors relating to the protection and management of the environment.” Section 23H of the 1988 amendment (No. 56 of 1988) of the National Environmental Act, states: no person shall pollute any inland waters of Sri Lanka or cause or permit to cause pollution in the inland waters of Sri Lanka so that the physical, chemical or biological condition of the waters is so changed as to make or reasonably expected to make those waters or any part of those waters unclean, noxious, poisonous, impure, detrimental to the health, welfare, safety or property of human beings, poisonous or harmful to animals, birds, wildlife, fish, plants or other forms of life or detrimental to any beneficial use made of those waters. Evidently, this has direct relevance to garbage dumping in lagoons. It is to be noted that, coordination among different institutions responsible for enforcing regulations under the above acts, remains very weak at present.
The Present Lagoon Management RegimesIt is to be noted at the outset that, concerns for management of lagoons exist only where “use values” (extractive values, such as fish and shrimp) exist. No evidence of concern for managing resources for other types of values, recreational values, bequest values, etc., was found. Concerns for these values have been secondary, and the existence of “use values” was a prerequisite for such concerns.
Based on the status of resource exploitation, which is an outcome of the fishing pressure (people’s intervention) and the status of resources, a number of management regimes exist today, ranging from “zero management” to “comanagement.” As shown in Table 15, zero management is found in lagoons where human intervention remains minimal, such as in the case of lagoons found within natural reserves and protected areas, where humans are not supposed to extract resources (or to exploit “usevalues”), e.g., Girikula, Bagura, Andarakala, Itikala, Yakkala lagoons, etc., in the southeastern coastal zone. The resources remain untouched in such lagoons and, in fact, there is no need to introduce management measures in such lagoons. The sole management of lagoons by the community is found where humans intervene in extracting use values. In fact, these are the community organizations (e.g., fisheries cooperatives) which are involved in some form of management of lagoon resources, such as the prevention of the use of destructive gear. However, most of these organizations are welfare-centric rather than resource-centric. This is the case with lagoons such as Embilikka-Malala, Velakalai, Thandiadi, Komari, Mawella, Kalametiya lagoons, etc. High human interventions (and high fishing pressure) bring about more state concern and intervention, where the officials of the Department of Fisheries and Aquatic Resources are often involved to a significant extent, in monitoring catches, stocking with larvae (e.g., shrimp) and enforcing state laws strongly in craft registration, preventing the use of destructive gear, etc., as in Potuvil-Ureni twin Lagoon, Uppar Panichankerni Lagoon, Valachchenai Estuary, Jaffna

80
Lagoon, etc. Finally, there are lagoons where human intervention remains quite high, characterized by high fishing pressure, multi-stakeholder issues, etc., and where the resources have come under severe pressure and are degrading. Negombo and Rekawa are typical examples of such lagoons, which are managed by Lagoon Fisheries Management Authorities: a kind of comanagement structures by both the public sector (state) and the private sector (fishers).
Table 15. Relation between resource status, human interference and management.
Status of Status of Rules to Management Examples resources population regulate system(extractive fishersuse values)
Abundant Sparse Nonexistent Almost no Girikula, Bagura, (Yakkala),management Itikala, Andarakala lagoons
Becoming Growing Some access Community Mawella, Embilikala-Malala, limited but low rules by management Kalametiya lagoons in the
community Hambantota District, Thandiadi, Komari lagoons in the Ampara District
Nanthikadal and Kokkilai lagoons in the Mullativu District, Koggala Lake, Madu Ganga, etc.
Limited High Access and Strong state Jaffna Complex, Pottuvil-Ureniconservation rules involvement Uppar Valachchenai Chilaw
and Puttalam lagoons. Bolgoda Lake, Madu Ganga
Degrading Very high Hybrids of state Comanagement Negombo Lagoon (LFMA)and community (Comanagement Rekawa Lagoon (LFMA)laws committees [CC] Panama Lagoon (LFMA)
and Lagoon Rathgama Lake (CC) Fisheries Management
Authority [LFMA])
The following few paragraphs discuss the emergence of comanagement and the public-private partnerships: In the past, fishers have been organized into fisher cooperatives, which were the most dominant type of fisher communities, regulating fishers according to community laws, with very little state intervention. In the last two to three decades, there have been many changes in the management of fisheries, arising from changes in policy, especially those dealing with fishing regulations, fishing methods, community organizations, resources management, safety, technology, infrastructure, fisheries management, etc. Recently, a new form of fisheries community organization has been established: theRural Fisheries Organization and the Councils. The most important change in the recent past is higher productivity resulting from technological changes, deeper concern for resource conservation and a radical change in fisheries management from a purely community management or “comanagement.” This recent interest in comanagement stems from the high transaction and enforcement costs associated with state regulation of fisheries and therefore there is a need to join hands with communities. Although the new changes in fisheries management, is called “comanagement” by the state officials it is questionable whether the recent changes as “comanagement” deserve such qualifications.
Field studies carried out recently (2010-2011) in the districts of Negombo, Chilaw and Puttalam by the Regional Fisheries Livelihood Programme of the FAO revealed that the concept of comanagement

81
is very poorly understood by the people in the study area (FAO 2011). For all management types of stakeholders, “comanagement” generally meant only the participation of state officials in organizing the activities of the fisher community. The issuance of fishing licences and taking action against those using banned gear (destructive gear), appear to be the major role of state officials (Department of Fisheries), which is considered to be an effective public input into the system of comanagement. But the question is whether this is a “true” form of comanagement.
If comanagement is to be understood only as a conglomeration of state and community actors – a partnership of any form which discusses fisheries issues, then fisheries cooperatives, rural fisheries organizations and lagoon fisheries management authorities are all comanagement bodies. But if management means “doing things right,” then comanagement involves understanding the management needs and issues well, the preparation of proper “comanagement plans,” effective dialogue between the resource users (fishers) and public partners to implement comanagement plans, which would ensure both the fisher well-being and resource sustainability. Such comanagement initiatives will also help minimize the free-riding problem and enforce rules and conflict resolution (Lowry et al. 1999). What is required is effective interaction among all relevant actors: by forming appropriate “interactive platforms,” where actors can deliberate upon their knowledge and experience and come out with solutions and plans, acceptable to all, ensuring both resource sustainability and human well-being.
Generally, people have understood the importance of formal involvement in management and feel that management should be a combined responsibility of both the community and the state. Nevertheless, it is important to conduct public awareness programs for the benefit of fisher stakeholders (both men and women) on “comanagement” at the very beginning of introducing such management measures. Resource management measures are more easily adopted, and are more effective, when resource areas are clearly demarcated (clearly visible boundaries, such as in Fisheries Management Areas) and when the fishers have a sense of ownership of that designated area (such as, by the Lagoon Fisheries Management Authority [LFMA]). This shows the relative ease with which management measures could be introduced to lagoons than to coastal fisheries and the importance of establishing LFMAs.
Lagoon Resources and Human Well-beingExploiting diverse valuesIt is to be understood that the major human development goal is the improvement of human “well-being,” from various sources. Lagoon fishing alone does not generate sufficient incomes as we have seen earlier. Low incomes coupled with seasonality in fisheries could make lagoon fishers quite vulnerable to poverty. In improving their resilient capacity (to risks and uncertainties) lagoon fishers and their household members often get involved in diverse income-generation activities (alternative livelihoods). While it is true that, marine fishers are “socially and geographically” less mobile than their inland counterparts, and that many derive their sole income from fishing, the lagoon fishers are different. The latter, along with their household members, may undertake some marine fishing, fish drying, ornamental fisheries, agriculture, animal husbandry, handicraft, tourism, etc. Therefore, the well-being improvements of lagoon resource users might come from diverse sources, not only from fisheries. Some of these activities are strongly or weakly linked. For example, lagoon fisheries and agriculture (e.g., vegetable growing) can be strongly linked, because people extract fish from the lagoon, while taking mangrove stakes for vegetable growing both of which are use values generated by lagoons. Farmers cultivating paddy in the margins of lagoons may breach the lagoon sand bar to protect their paddy from inundation. This brings in another dimension to the sustainability of the lagoon ecosystem – the multi-stakeholder and multi-sector issues.
It is thus evident that management has to take into consideration certain important facts, as given below.
(a) The system to be managed (the lagoon ecosystem) is “complex” because it is linked with other systems.

82
(b) People using lagoons depend on a number of resources for their livelihoods, with lagoon fish and shrimp forming only one of them.
(c) There are a number of stakeholders who influence the activities of one another thereby forming “cross-cutting” influences across sectors.
(d) There are both multi-stakeholder and multi-sector issues.
What is quite evident from field studies is the fact that extractive values generated by a lagoon decide to what exact use the resources are put into, and the need for their management. Therefore, when the extractive values are low (low productivity) there is a tendency to lose interest in lagoons and also in management. It is also evident that whenever a lagoon is used for extensive anchorage of marine crafts, marine interests take priority over lagoon interests, probably because the use values generated by marine resource exploitation are higher than those generated by lagoons. This could lead to misuse and neglect of lagoons. However, as revealed by field studies, many of Sri Lanka’s lagoons have the potential for generating high nonextractive use values. Salt marshes in the Venkalai Lagoon and beach mangrove of the Vidattlativu Lagoon may be of scholarly interest. Although less studied, they have the potential of generating new knowledge. Rather than in large lagoons with high open areas, such values are often present in small irregularly shaped lagoons. An example is where thick mangrove stands and winding canals that run through irregularly shaped lagoons such as the Pottuvil-Ureni twin Lagoon generate recreational values. Figure 45 shows the high potential for generation of recreational values in the irregularly shaped Pottuvil Lagoon. Unfortunately, these potentials have not been understood or “seen” by the relevant authorities, although a few instances of exploiting this potential were noticed in the Rekawa, Batticaloa, Pottuvil-Ureni, Panama and Komari lagoons in the east coast.
Figure 45. High potential for generation of recreational values in the irregularly shaped Pottuvil Lagoon.
Recreational values generated by lagoons could be enhanced if they can be combined with such values that could be generated by other resources or activities in the vicinity of lagoons. Examples of such possibilities are stunning rock formations near the Pottuvil Lagoon (Figure 46), the Ussangoda landscape with its unique iron-rich soils and the Kalametiya Reserve near the Rekawa Lagoon, Kumana Bird Sanctuary near Girikula, Bagura, Andaragala, Itikala and Yakkala lagoons in the Panama-Kudumbigala Reserve and Kumana Bird Sanctuary, and potential for “war tourism” at the LTTE-blasted Railway Bridge near the Mannar Lagoon and the bombed (by government troops) Bridge over the

83
Lanka Patuna Lagoon. Figure 47 shows the potential for development of “war tourism” at the Lanka Patuna Lagoon.
Figure 46. Stunning rock formations near the Pottuvil Lagoon.
Figure 47. Potential for development of “war tourism” at the Lanka Patuna Lagoon.
The potential for integrated sustainable tourismNegative impacts of tourism on the ecosystem and on people’s culture are widely known in Sri Lanka. Therefore, tourism initiatives which tap values generated by natural resources, such as lagoons, will have to be undertaken with care and with sufficient planning. Tourism could be considered as an act of recreation. High recreational potential of a natural resource area, such as a lagoon, is therefore a high ecotourism resource. “Ecotourism” (also known as ecological tourism) is a responsible journey to natural areas, such as lagoons, that conserve the environment and improve the well-being of local people (TIES 1990). It purports to educate the traveler; provide funds for conservation; directly benefit

84
the economic development and political empowerment of local communities; and foster respect for different cultures and for human rights. Ideally, ecotourism is expected to conserve biological diversity and cultural diversity, promote sustainable use of biodiversity by providing jobs to the local populations, and share socioeconomic benefits with local communities through participatory management of ecotourism enterprises.
Tourism, associated with nature, will not generate net benefits to the country, in respect of economic, social and ecological benefits, unless the local potential is properly utilized and local people are involved. Outsiders having no interest in the local environment may severely damage it to earn huge incomes, under the name of “nature tourism,” which would be taken away to large urban centers to meet the goals of urban populations. The local area will suffer both in respect of low incomes and a damaged environment.
Recently, the focus of tourism has shifted from sun-and-sea type of mass tourism, to nature tourism involving natural resource activities; fisheries, agriculture, Ayurveda (an ancient Indian and Sri Lankan system of herbal medicine), culture, etc. Experience has shown that these activities could be easily integrated with the involvement of local people. In short, agrotourism encourages visitors to experience agricultural life at first hand, for example, when a native person or a local of the area offers tours to their agriculture farms to allow visitors to view them growing, harvesting, and processing locally grown foods, such as coconuts, pineapple, sugarcane, corn, or any produce that the visitors would not encounter in their home country. Often, the farmers would provide a “home-stay” opportunity and education (HoboTraveler 1997-2012). The essential benefit is for the local people, not for tour operators or hotels. Such farms are often found along the margins of lagoons and tourism-related activities in lagoons, such as boating, bird watching, boat rides through mangrove stands, fishing, etc., which could be easily combined with agricultural activities in the vicinity.
Nature-tourism cannot be separated from cultural tourism because it focuses on local cultures, wilderness adventures and learning new ways of living in different parts of the planet, where the flora, fauna, and cultural heritage are the primary attractions. Responsible ecotourism includes programs that minimize the adverse effects of traditional tourism on the natural environment, and enhance the cultural integrity of local people. True nature tourism or ecotourism protects local cultures and empowers indigenous peoples while providing visitors with unique opportunities to learn about the native community they visit as they contribute to its success (Native Planet 2004).
Clearly, sustainable tourism implies an approach to development aimed at balancing social and economic objectives with environmentally sound management. What is proposed here is a sustainable tourism initiative which integrates people involved in different activities with values generated by lagoons being only one benefit. It is “a tourism initiative developed with the participation of the people in the area, providing the tourist with the opportunity to learn from, and enjoy, the natural, cultural and social resources of the local area, and opportunities for the people in the area to improve their well-being by offering diverse tourism services, while maintaining the sustainability of the ecosystem and protecting people’s cultural and social traditions.” Wattage and Mardle (2005) call this the “populistapproach” among different conservation paradigms (participation and empowerment of local people), the security of economic benefits providing incentives for conservation.
Thus the proposed tourism initiative should contribute positively towards preserving the natural environment and improving the well-being of the people: a win-win situation indeed. Such an initiative requires the active participation of public-private-community actors, and investment programs based on appropriate incentives and environmental safeguards against the downward spiral that is usually associated with global markets (IUCN 2009).

85
Way ForwardMinimizing threatsHuman interventions, especially due to development activities, and the process of urbanization and population growth cause a number of threats to lagoons, of which, garbage dumping, use of destructive gear, water pollution by agricultural and industrial runoff, building causeways across lagoons and artificial breaching of lagoon mouths form the major threats. This should receive the immediate attention of the relevant authorities, especially the DFAR and the Coast Conservation Department. Immediate steps will have to be taken before any long-term management strategies are devised to cope with them.
Assistance to fisheriesThis study shows that lagoons could still generate further extractive values, without causing resource degradation. This is particularly true with lagoons in the North and the East. However, this may require, among other things, assistance extended to fishers to acquire the required fishing equipment and the establishment of landing facilities.
Exploiting diverse valuesEvidently, lagoons have the potential of generating many values, other than extractive values, which if properly exploited, could improve human well-being, while maintaining resource sustainability. These potentials are particularly high in lagoons in the North, the East and Hambantota in the South. Integrated Sustainable Tourism could be a good alternative to improve the well-being of the people and to strengthen local economies, which could also be an important strategy to help the people in the war-affected areas who strive towards building up their livelihoods.
Public-private-community partnershipsIn combining diverse values and planning strategies to meet human development goals while sustainably maintaining the ecosystem, partnership building is of paramount importance. While comanagement is definitely a state-community partnership aimed at the well-being of people and the ecosystem, private actors of the area could also be brought in to increase investment. For example, the private actors in the lagoon areas could invest in IST initiatives that will benefit all stakeholders in the area. However, such initiatives should be undertaken with care, to ensure that the ecosystem is maintained in a sustainable manner and that the major beneficiaries are the local populations. In this respect, it is necessary to ensure that all IST plans are approved and implemented by a “steering committee” consisting of the community-state-private partners of the local area.
Governance and managementManagement should not wait until degradation sets in. Proper management authorities should be established in lagoons, not only to manage extractive uses of lagoons, but also to design strategies to exploit other nonextractive values of lagoons and to manage multi-stakeholder conflicts. This could be achieved effectively under comanagement regimes, such as the LFMAs and the SAM processes. Comanagement is a good strategy, but the concept has to be well understood and appropriate management strategies planned out through an interactive process. Although comanagement also appears as a way of achieving a development-conservation balance, some authors argue that local access regulation mechanisms are often established more in response to people’s struggle for control of, and access to, the resources, than as a manifestation of collective concerns for the sustainability of resources (see FAO 2003). Nevertheless, the importance of combining diverse values of lagoons and other alternative production activities (such as agriculture and rural crafts) (e.g., IST initiatives) could be better planned and organized by comanagement bodies, because management encompasses meeting the needs of the ecosystem as well as those of the human system.

86
Chapter 8 Conclusions
Lagoons on Sri Lanka’s wave-dominant microtidal coastline are diverse in their configuration and size and they have been determined by the island’s coastal and hinterland geomorphology, oceanic waves, littoral drift and monsoonal climate. The origin of a majority of coastal lagoons of Sri Lanka was set off with the mid-Holocene transgression and subsequent submergence enclosing barrier/spit development which resulted from various processes depending on foreshore dynamics, hinterland geomorphology and local climate. But the origin of all lagoons is not necessarily related to drowning or Holocene submergence and emergence (Swan 1983). Further, barrier formation of the same lagoon could be explained by more than one processes leading to complexities. As elsewhere, lagoons are not elongated and shore parallel in all cases because formation could be related to site-specific processes such as the following:
(a) High energy coasts with substantial littoral drift.(b) Development of narrow barriers and spits.(c) Inundation of abandoned river valleys and multi-delta coastal plains.(d) Development of back barriers.(e) Subsidence of upward-growing coral reefs.(f) Wavelet action of low energy coasts on fluvial sediment.
Accordingly, Sri Lanka’s coastal lagoons can be described as “shallow coastal water bodies, diverse in shape and size, either shore parallel or not, separated from the ocean by barriers or barrier spits, but connected to the ocean permanently or intermittently through one or more restricted inlets, originated mainly during the mid-Holocene sea-level rises by submergence and emergence.” Nevertheless, in Sri Lanka, lagoons are not found on the coastal sectors which are rich in cliffs and headland areas and where long-shore littoral drift is obstructed.
Kjerfve (1986) subdivided coastal lagoons into three geomorphic types; choked lagoons, restricted lagoons and leaky lagoons, based on water exchange with the open ocean. The rate and magnitude of oceanic exchange reflect both the dominant forcing function(s) and the time scale of hydrologic variability. Choked lagoons are characterized by one or more long and narrow entrance channels which restrict water exchange with the ocean and long residence times, where circulation within this type of lagoon is dominated by wind patterns. They usually occur along high energy coastlines with significant littoral drift. Intermittent microstratification could occur in relatively deep choked lagoons under calm conditions with intense solar radiation coupled with inflow events. Restricted lagoons have multiple channels, well-defined tidal exchange with the ocean, and tend to show a net seaward transport of water. Wind patterns in restricted lagoons can also cause surface currents to develop, thus helping to transport large volumes of water downwind, but vertically mixed with no stratification (Kjerfve 1986). Leaky lagoons have wide tidal inlets, fast currents, sharp salinity and turbidity fronts, and unimpaired exchange of water with the ocean. They are typically found along coasts where tidal currents are more significant in sediment transport than wind-driven waves. Leaky lagoons often stretch along coastlines for more than 100 km, but exhibit widths of no more than a few kilometers. The shallow nature of coastal lagoons, combined with the constricting effects of inlets aid in decreasing tidal transport as distance from the inlet increases. Thus, wind becomes the primary transport process in the interior of the elongated long lagoons. Many definitions, processes and functions may be used to classify lagoons, but they may not be applicable globally. To reiterate, coastal lagoons were formed by mid-Holocene transgression and subsequent barrier formation, which may be determined by various factors which vary from place to place. Apparently, it is hard to identify typical chocked, restricted, and leaky lagoons in a small crescent shape island experiencing El-Niño-driven monsoonal winds and microtidal waves.

87
The Water Framework Directive (WFD) of the European Union came into force in December 2000, and introduced a new system of monitoring and assessing the aquatic environment including coastal lagoons.
There is a requirement to develop type-based classification tools for discrete water bodies to help assess their ecological status. Nevertheless, developing suitable generic tools to classify coastal lagoons poses a considerable challenge, as they are unlike other “types” of transitional and coastal waters. Member states are now required to report on the ecological status (or potential) for each “water body” (defined as a significant and discrete unit of water). Several coastal saline lagoons have been identified as WFD water bodies in the UK. This means that there is a requirement to develop type-based classification tools to help assess their ecological status.
Attempts have been made to classify coastal lagoons in Sri Lanka according to their origin, coastal geomorphology and evolution (Coates 1935; Swan 1983; Weerakkody 1985). The number of lagoons on Sri Lanka’s coast has varied according to different sources; most of the lagoons were named as basin estuaries and the number of coastal lagoons in Sri Lanka was 45 according to CCD (1997). Of the 103 rivers/streams, 70 empty into lagoons before they mix with seawater, and some seasonal rivers discharge into the ocean through lagoon inlets (e.g., Pankulam Aru at Periyakarachchi, Kuchchaveli inlet; Maduru Oya empties into the Vandaloos Bay via Valaichchenai entrance; Chilaw Lagoon empties into the Deduru Oya Estuary). They have had their estuarine outlets before the formation of lagoons. For example, the Batticaloa Lagoon has been formed by inundating estuarine delta entrances of eight seasonal streams. Further, inflows of Kala Oya and Kirama Oya do not directly discharge into the main water mass of the Puttalam and Rekawa lagoons, respectively, forming basin estuaries. Coastal lagoons are also complex in their origin and evolution and, as a result, they show heterogeneous morphometric features in size, shape, shoreline, link channel, and sea entrance, etc. A scheme of simple classification is proposed for Sri Lanka’s coastal lagoons in Tables 16 a, b and 17 based on the origin and development of sand, shingle barrier or reef during the late Holocene sea-level drop as a result of ocean-land interface processes coupled with climate as explained by previous authors (Coates 1935; Swan 1983; Weerakkody 1985, 1992; Katupotha and Fujiwara 1988; Kjerfve and Magill 1989; Cooper 1994; Kjerfve 1994a; Katupotha 1995; Bird 2010).

88
Form
atio
n of
hin
terla
nd c
oast
al la
ndfo
rms
(lago
ons)
Geo
logy
Geo
mor
phol
ogy
Bio
logy
M
arin
e in
unda
tion
Clim
ate
Litto
ral d
rift
Shap
e of
lago
ons
Roc
ky (l
ow c
liff)
Con
tinen
tal f
lat
Subm
erge
d co
ral
Mul
ti-sm
all
Clim
ate
chan
geM
onso
onal
win
d Ir
regu
lar/p
artly
shel
fre
ef/p
atch
esriv
er c
ours
esirr
egul
ar la
goon
sh
orel
ines
Rid
ge a
nd v
alle
ys
Coa
stlin
e A
band
oned
W
ind
Terr
estri
al fl
oods
O
val/
river
cou
rse
sem
icirc
ular
Roc
ky o
utcr
ops
Floo
dpla
in
Cor
al a
tolls
Fl
oodp
lain
D
ry a
nd w
et
Tide
s El
onga
ted/
sho
re
cond
ition
spa
ralle
lEv
apor
atio
nC
ircul
ar/
se
mic
ircul
ar
Hill
s an
d ris
es
Hill
s an
d ris
esC
oral
isla
ndLo
w c
liff
Eros
ion
clos
er to
the
coas
tcl
oser
to th
e co
ast
Dro
wni
ngSm
all
Acc
retio
n (s
ea-le
vel r
ise)
depr
essi
ons
Hea
dlan
d an
d ba
ysH
eadl
and
and
bays
Bre
achi
ng in
lets
Smal
l dep
ress
ions
Smal
l dep
ress
ions
Form
atio
n of
m
udfla
tsSp
it/ba
rrie
r bea
ch,
Spit/
barr
ier b
each
Spits
/san
d ba
rs
Spit/
barr
ier
Bac
k ba
rrie
re.
g.,
beac
h, e
.g.,
lago
ons
in th
e Sa
lt m
arsh
es/
Chu
ndik
kula
m,
East
and
sou
thea
st
Reg
ular
ly
sout
hwes
t coa
stB
rack
ish
smal
l lag
oons
, e.g
.,
open
m
arsh
es, e
.g.,
Bat
tical
oa
And
alak
ala,
Itik
ala,
Jaffn
a La
goon
Punk
udut
hiv
Yakk
ala,
But
awa,
In
term
itten
tly
Upp
uaru
Kur
ukku
dal
(c)
God
e K
alap
uwa,
etc
.
(K
ayts
)
D
ying
(a)
(b)
(d)
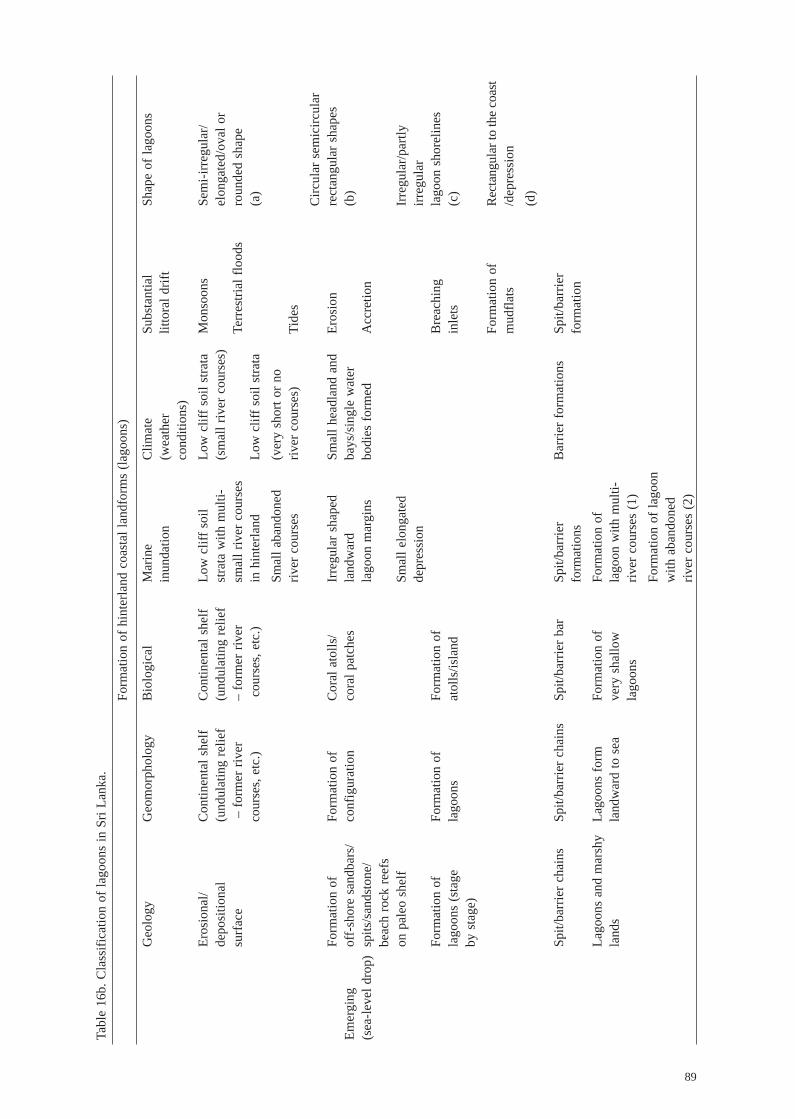
89
Tabl
e 16
b. C
lass
ifica
tion
of la
goon
s in
Sri
Lank
a.Fo
rmat
ion
of h
inte
rland
coa
stal
land
form
s (la
goon
s)
Geo
logy
Geo
mor
phol
ogy
Bio
logi
cal
Mar
ine
Clim
ate
Subs
tant
ial
Shap
e of
lago
ons
inun
datio
n (w
eath
er
litto
ral d
rift
cond
ition
s)Er
osio
nal/
Con
tinen
tal s
helf
Con
tinen
tal s
helf
Low
clif
f soi
lLo
w c
liff s
oil s
trata
M
onso
ons
Sem
i-irr
egul
ar/
depo
sitio
nal
(und
ulat
ing
relie
f(u
ndul
atin
g re
lief
stra
ta w
ith m
ulti-
(sm
all r
iver
cou
rses
)el
onga
ted/
oval
or
surf
ace
– fo
rmer
rive
r –
form
er ri
ver
smal
l riv
er c
ours
esTe
rres
trial
floo
dsro
unde
d sh
ape
cour
ses,
etc.
) c
ours
es, e
tc.)
in h
inte
rland
Low
clif
f soi
l stra
ta(a
)Sm
all a
band
oned
(v
ery
shor
t or n
oriv
er c
ours
esriv
er c
ours
es)
Tide
s C
ircul
ar s
emic
ircul
arFo
rmat
ion
of
Form
atio
n of
Cor
al a
tolls
/Ir
regu
lar s
hape
dSm
all h
eadl
and
and
Eros
ion
rect
angu
lar s
hape
sEm
ergi
ng
off-
shor
e sa
ndba
rs/
conf
igur
atio
n co
ral p
atch
es
land
war
d ba
ys/s
ingl
e w
ater
(b)
(sea
-leve
l dro
p) s
pits
/san
dsto
ne/
lago
on m
argi
nsbo
dies
form
ed
Acc
retio
n be
ach
rock
reef
s on
pal
eo s
helf
Sm
all e
long
ated
Irre
gula
r/par
tly
depr
essi
onirr
egul
ar
Fo
rmat
ion
ofFo
rmat
ion
ofFo
rmat
ion
of
B
reac
hing
lago
on s
hore
lines
lago
ons
(sta
ge
lago
ons
atol
ls/is
land
inle
ts(c
)by
sta
ge)
Form
atio
n of
Rect
angu
lar t
o th
e co
ast
mud
flats
/dep
ress
ion
(d
)
Spit/
barr
ier c
hain
sSp
it/ba
rrie
r cha
ins
Spit/
barr
ier b
ar
Spit/
barr
ier
Bar
rier f
orm
atio
ns
Spit/
barr
ier
form
atio
nsfo
rmat
ion
Lago
ons
and
mar
shy
Lago
ons
form
Form
atio
n of
Form
atio
n of
land
sla
ndw
ard
to s
eave
ry s
hallo
w
lago
on w
ith m
ulti-
lago
ons
river
cou
rses
(1)
Form
atio
n of
lago
on
with
aba
ndon
edriv
er c
ours
es (2
)

90
Dep
ositi
on/s
hrin
king
,A
cha
in o
r clu
ster
C
oral
isla
ndof
isla
nds/
sand
Sa
lt m
arsh
es/
dune
s on
bar
riers
,br
acki
sh m
arsh
es,
e.g.
, Neg
ombo
e.g.
, Lag
oons
in
e.g.
, Pun
kudu
thiv
(1) e
.g.,
e.g.
,R
egul
arly
ope
nC
hila
w, M
unde
l M
anna
r and
Pal
k K
uruk
kuda
l C
hund
ikku
lam
1.
Pal
atup
ana
toan
d Pu
ttala
m
Bay
isla
nds
(Kyt
es)
Kok
kila
iM
aha
Lew
aya
Inte
rmitt
ently
la
goon
s,
(a)
(b)
Bat
tical
oa
Tala
wila
Oda
i(c
)Ea
st a
nd s
outh
east
D
ying
(a
)
smal
l lag
oons
(2) e
.g.,
e.g.
, And
alak
ala,
Jinn
apur
a
Itika
la, Y
akka
la,
kara
chch
i,B
utaw
a, G
ode
Pulm
udai
,K
alap
uwa,
etc
.U
da G
ajab
a El
a,
(e)
Uda
Pot
hana
,Pa
hala
Pot
hana
(d)

91
Tabl
e 17
. Lag
oon
type
s an
d sh
apes
.
Orig
inTy
pe A
Type
BTy
pe C
Type
DTy
pe E
Due
to c
oast
al s
ubm
erge
nce
Form
atio
n of
cor
alLi
ttora
l drif
t and
the
Dev
elop
men
t of n
arro
wIn
unda
tion
of a
band
oned
Due
to b
ack-
barri
er fo
rmat
ions
,an
d/or
em
erge
nce
atol
ls a
nd re
efs:
e.g
., de
velo
pmen
t of
barr
iers
and
spi
ts:
e.g.
, riv
er v
alle
ys (e
.g.,
e.g.
, lag
oons
loca
ted
on th
ela
goon
s on
isla
nds
barr
ier b
each
/spi
ts,
Jaffn
a C
ompl
ex a
ndVa
lach
chen
ai),
coas
tal
sout
heas
t, so
uthe
rn a
nd s
outh
wes
tof
Pal
k B
ay a
nd
e.g.
, Neg
ombo
,Th
onda
man
aru
Lago
on,
plan
es w
ith m
ultip
leco
asts
- K
omar
i, Pa
naka
la,
Gul
f of M
anna
r, C
hila
w, P
utta
lam
from
Cha
lai t
o Va
kara
ist
ream
del
tas
(e.g
., K
unuk
ala,
And
arak
ala,
Itik
ala,
e.g.
, Pun
kudu
thiv
ula
goon
s an
d(N
anth
ikad
al, N
ayar
u,B
attic
aloa
and
Yakk
ala,
Pal
atup
ana,
Bun
dala
,K
uruk
kuda
l (K
ayts
)M
unde
l Lak
eK
okki
lai,
Periy
akar
achc
hi,
Chu
ndik
kula
m) a
ndR
atga
ma,
Mad
u G
anga
, etc
.Si
nnak
arac
hchi
, Ulla
ckal
ie
subs
eque
nt b
arrie
ran
d U
ppar
) de
velo
pmen
t
Shap
eTy
pe A
Type
BTy
pe C
Type
DTy
pe E
Due
to s
and
barr
ier;
spit
Circ
ular
or
Elon
gate
d, s
hore
Ova
l, el
onga
ted,
ribb
on,
Elon
gate
d, s
hore
par
alle
l, C
ircul
ar, b
ulbo
us c
lust
erfo
rmat
ion
and
hint
erla
nd
sem
icirc
ular
, pa
ralle
l sh
ore
para
llel
irreg
ular
land
war
d m
argi
nsm
arsu
pial
(sac
), ob
long
, ova
l,ge
omor
phol
ogy
land
war
d ex
tens
ions
irr
egul
ar e
xten
ded
land
war
d

92
Deve lopment and ConsequencesAlmost all the rivers/streams in Sri Lanka have been markedly altered by human activities, and resultant drivers/pressures on the coastal zone may be more pronounced than in the other areas of the region. Consequently, changes in land use, pollution and water diversion and retention have altered the horizontal mass transport of materials and are likely to cause comparatively large changes. Fortunately, some of the watersheds are not densely populated and human interferences are not extensive. The patterns of climate including monsoons and population distribution underpin the differences between the type and the intensity of drivers and pressure around the coast of the island. In the dry zone lowland, damming and water diversion, usually in association with paddy cultivation, are principal drivers of changes in coastal ecosystems including lagoons. Ad hoc aquaculture ventures are not confined to dry zone coasts except in the northwestern coastal sector but industrial development and urbanization of populated coastal cities in the north and east may add further pressure on coastal lagoons.
Despite the building of dikes and groynes for coastal protection over the last several decades the intensity of coastal erosion and changes in salinity regimes have increased markedly during the recent past due to combined effects of land-based human activities and changes in hydrodynamics associated with coastal areas. Eutrophication is apparent in lagoons located in urban localities where wastewater is received from domestic activities and aquaculture and agricultural drainage. The most significant impact in certain lagoons is the growth of macroalgae rather than the emergence of dinoflagellate blooms due to nutrient depletion. Persistent organic pollutants may have contaminated sediments of certain lagoons which receive direct discharge of urban-industrial waste. Bioaccumulation of contaminants in fish and organic pollution are evident from the Bolgoda Lake and the Negombo Lagoon, respectively.
Recent, natural and man-made coastal land changes have led to loss of tidal flats, mangroves and seagrass beds in Sri Lanka to a greater extent in the northwestern coastal stretches, primarily due to conversion of mangrove groves into shrimp farms. The fast economic development of Sri Lanka frequently outpaces the necessary urban and industrial infrastructure. Hence, eutrophication and nutrient depletion and pollution in the coastal water bodies including lagoons are major consequences from catchment-based human activities linked to urbanization and rapidly increasing demand for water and energy. Streamflow regulation is associated with erosion/sedimentation problems at the coastal landscape. All human activities discussed in this report result in variable degrees of changes in the trophic state and food webs of coastal ecosystems including lagoons and loss of living resources, the bread and butter of the riparian communities.
ValuesLagoons generate many values: both use values and nonuse values. However, only extractive-use values have been so far exploited on a sizeable scale, while providing space for anchorage of marine craft was found to be the most dominant nonextractive use value extensively exploited in some lagoons. Scanty evidence is also present on the use of other values such as recreational values. A number of indirect use values, especially those related to environmental services, provided by lagoons were noted, although they were invisible. In general, the total economic value of lagoons could be much higher than presently recognized by planners, policymakers and researchers alike.
Fish and shrimp dominate extractive values, followed by some use of mangroves for timber and fuelwood, and fodder for cattle. Commercial fisheries exist only in about half of the lagoons. A number of lagoons in the northern and eastern districts of the country have been poorly exploited for fish and shrimp due to the nearly 30 years of civil war. The aggregate picture reveals that there is room for further development of fisheries in the lagoons, not forgetting their high individual variations. The status of resources in many lagoons in the country can be rated as “satisfactory,” with a few exceptions. Lack of proper landing centers and inadequate assistance to fishers to acquire crafts and gear are some of the constraints to the development of lagoon fisheries, especially in the northern and the eastern districts of the country.

93
A large number of lagoons, particularly those in the northern, eastern and southern provinces, possess a high potential for the development of recreational, ecotourism and research (scholarly) values, and many lagoons have the potential for the development of aquaculture as well. Attention to exploiting these potentials has been quite low in the past, except for a few efforts made in some lagoons.
A number of threats to lagoons are evident. They include vulnerability and poverty of the people, urbanization, development activities, population pressure, fishing pressure, multi-stakeholder issues, invasive species, sedimentation, landfilling, high security zones, etc. A number of development activities, such as landfilling and house construction, agricultural and industrial pollution, saltern development, conversion of lagoons into freshwater bodies, etc., were found to have caused serious negative impacts on lagoons. Garbage dumping is also causing threats to fish and shrimp production and mangroves, and damage to other nonextractive values of lagoons in more urbanized areas.
Governance of natural resources, including lagoons, has been the responsibility of the community and the state. Management is the process of doing the “things,” prescribed by the governors “right.” The latter regimes are strongly related to the state of the resources and the population. Nonmanagement or zero management is found where resources are abundant, while the community involvement in management is observed when resources come under population pressure when the community may introduce diverse access and conservation rules. State involvement in management is evident under the conditions of resource degradation and fishing pressure. The emergence of comanagement, which is considered to be the “ideal” way of managing natural resources, is evident under the condition of declining resource health and high population and fishing pressure. Lagoon Fisheries Management Authorities and Special Area Management Coordinating Committees (SAMCC) are examples of such comanagement bodies. Sufficient provisions have been made in the Fisheries and Aquatic Resources Act of 1996, to establish Fisheries Management Areas and Fisheries Management Committees. This study also highlights poorly developed links and lack of coordination of activities, among a number of institutions that have a mandate to manage natural resources, including lagoons.
Taking into consideration the fact that “well-being” is the prime human development goal, which is achieved through people’s engagement in diverse activities, and that there exist a number of values that people in and around lagoons can exploit to increase their well-being, it is suggested to integrate all these activities into an Integrated Sustainable Tourism initiative, that will ensure both the sustainability of the human system and the ecosystem: a win-win situation indeed. However, it is necessary to ensure that the whole initiative is managed/steered by a partnership of public-private-community actors, with the local populations playing a leading role.
References
Abeywickrema, B.A. 1960. Estuarine vegetation of Ceylon. Proceedings Abidjan Symposium on the Humid Tropics. Paris: UNESCO, pp.207-210.
Abeywickrema, B.A.; Arulgnanam, P. 1991. The marine angiosperms in Sri Lanka. MAB Publications No. 18. Colombo, Sri Lanka: Natural Resources, Energy and Science Authority, Sri Lanka.
Abeywickrema, B.A.; Arulgnanam, P. 1993. The coastal plants of Sri Lanka – Part I (Salt marsh plants). MAB Publications No. 20. Colombo, Sri Lanka: Natural Resources, Energy and Science Authority, Sri Lanka.
Adam, P. 1990. Salt marsh ecology. Cambridge: Cambridge University Press.
Allen, J.R.T.; Pye, K., eds. 1991. Saltmarshes: Morpho-dynamics, conservation and engineering problems. Cambridge: Cambridge University Press.
Alongi, D.M. 2002. Present state and future of the world’s mangrove forests. Environment Conservation 29:331-349.
Alphonse, A.; Winemiller, K.O. 1997. Trophic ecology and ecomorphology of fish assemblages in a coastal lake in Benin, West Africa. Ecoscience 4:6-23.
Al-Rousan, S.; Rasheed, M.; Khalaf, M.; Badran, M. 2005. Ecological and geochemical characteristics of bottom habitats at the northern Jordanian coast of the Gulf of Aqaba. Chemistry and Ecology 21 (4): 227-239.
Amarasinghe, M.D. 1997a. Ecological functions of mangrove and related ecosystems and their contribution to economic sustainability of Sri Lanka. Sri Lanka Journal of Aquatic Sciences 2: 1-20.

94
Amarasinghe, M.D. 1997b. Leaf litter decomposition in the mangrove ecosystems of Dutch bay. Sri Lanka Journal of Aquatic Sciences 2: 21-27.
Amarasinghe M.D. 1988. Socio-economic status of the human communities of selected mangrove areas on the west coast of Sri Lanka. Mangrove Ecosystems Occasional Paper no. 3, UNDP/ UNESCO Regional Mangrove Project RAS/86/120. 19p.
Amarasinghe, M.D.; Balasubramaniam, S. 1992a. Structural properties of two types of mangrove stands on the northwestern coast of Sri Lanka. Hydrobiologia 247 (1-3): 17-27.
Amarasinghe, M.D.; Balasubramaniam, S. 1992b. Net primary productivity of two mangrove forest stands of the northwestern coast of Sri Lanka. Hydrobiologia 247 (1-3): 37-47.
Amarasinghe, O. 1989. Technological change, transformation of risks and patronage relations in a fishing community of South Sri Lanka. Development and Change 20(4): 684-734.
Amarasinghe, O. 2006. Cooperation in a context of crisis: Public private management of marine fisheries in South Asia.IDPAD Working Papers Series, 5. The Netherlands: Indo-Dutch Programme on Alternatives in Development (DPAD).
Amarasinghe, O. 2009. Rule breaking and conflicts in marine small-scale fisheries of south Sri Lanka-The need for interactive governance, Paper presented at the People and the Sea V Conference, MARE, held from 9-12 July 2009, Amsterdam, the Netherlands.
Amarasinghe, O.; Bavinck, J.M. 2011. Social capital and the reduction of vulnerability: The role of fisheries cooperatives in southern Sri Lanka. In: Poverty mosaics, realities and prospects in small scale fisheries, ed., Jentoft, S. Arne, Aide. Dordrecht: Springer.
Amarasinghe, U.S.; Amarasinghe, M.D.; Nissanka, C. 2002. Investigation of the Negombo estuary (Sri Lanka) brush park fishery, with an emphasis on community-based management. Fisheries Management and Ecology 9: 41-56.
Amarasinghe, U.S.; Chandrasekara, W.U.; Kithsiri, H.M.P. 1997. Traditional practices for resource sharing in an artisanal fishery of a Sri Lankan estuary. Asian Fisheries Science 9: 311-323.
Amarathunga, A.A.D.; Sureshkumar, N.; Weerasekara, K.A.W.S.; Wickramarachchi, W.D.N.; Azmy, S.A.M. 2010. Study of the effects of salinity and nutrients for the growth of Najas marina and its impacts to biodiversity in Madu Ganga Ramsar Wetland in Sri Lanka. In: The Proceedings of the 15th International Forestry and Environment Symposium, 26-27, November 2010, Sri Lanka, Department of Forestry and Environment, University of Sri Jayawardenapura, Sri Lanka, pp. 155-162.
Anthony, A.; Atwood, Joshua; August, Peter; Byron, Carrie; Stanley, Cobb et al. 2009. Coastal lagoons and climate change: Ecological and social ramifications in U.S. Atlantic and Gulf coast ecosystems. Ecology and Society 14(1): 8.
Ariyananda, T.N. 2008. Temporal and spatial variations in hydrography, plankton, benthic organisms and trophic status of Dutch Canal and Mundel Lake, Ph.D. thesis, University of Kelaniya, 184p.
Arthrurton, R.S. 1998. Marine related physical natural hazards affecting coastal megacities of the Asia-Pacific region, awareness and mitigation. Ocean & Coastal Management 40:65-85.
Aruchelvam, K. 1968. The mangroves. The Ceylon Forester 8(3 & 4): 59-92.
Arudpragasam, K.D. 1974. Seasonal and diurnal variation in salinity and water movements in Jaffna Lagoon, Ceylon. Estuarine and Coastal Marine Science 2 (3): 251-259.
Arulananthan, K. 2004. Hydrography, coastal water circulation and classification of Sri Lankan lagoons. PhD thesis. Earth Sciences Centre, Göteborg University.
Arulananthan, K.; Wijyeratne, E.M.S.; Rydberg, L.; Cederloef, U. 1995. Water exchange in a hypersaline tropical estuary, the Puttalam Lagoon, Sri Lanka. Ambio 24(7-8): 438-443.
Bakker, M.; Matsuno, Y. 2001. A framework for valuing ecological services of irrigation water – A case of an irrigation-wetland system in Sri Lanka. Irrigation and Drainage Systems 15 (2): 99-115.
Bamber, R.N.; Ariyananda, T.; Silva, E.I.L. 1996. A new genius and species of Apseudomorph Tanaidacean from Sri Lanka. Asian Marine Biology 13:133-14.
Bamber, R.N.; Ariyananda, T.; Silva, E.I.L. 2002. The male of Halmyrapseudes Sri Lankensis (B Cescu, 1981) COMB. NOV. and an analysis of the Genus Halmyrapseudes B. Cescu and Gutu. 1974. (Pericardia, Tanaidacea). Journal of Crustacean Biology 22 (2): 287- 297.
Barnes, R.S.K. 1980. Coastal lagoons, the natural history of a neglected habitat. Cambridge: Cambridge University Press.
Bavinck, M.; Chuenpagdee, R.; Diallo, M.; van der Heijden, P.; Kooiman, J.; Mahon, R.; Williams, S. 2005. Interactive governance in fisheries: A guide to better practice. Amsterdam: Centre for Maritime Research (MARE).
Berks, F. 1994. Property rights and coastal fisheries. In: Community management and common property of coastal fisheries in Asia and the Pacific: Concepts, methods and experiences. INCLARM Conference Proceedings 45: 51-62.
Berks, F. 2006. From community-based management to complex systems. Ecology and Society 11(1): 45.

95
Bertness, M.D. 2007. Atlantic shorelines: Natural history and ecology. USA: Princeton University Press.
Bird, E. 2010. Coastal geomorphology – An introduction. Chichester: John Wiley and Sons.
Bird, Kate; Prowse, Martin. 2008. Vulnerability, poverty and coping in Zimbabwe. Research Paper No. 2008/41. World Institute for Development Economics Research, United Nations University. Helsinki: UNU-Wider, 12p.
Boateng Issac, ed. 2010. Spatial planning in coastal regions facing the impact of climate change. FIG Publication No. 55. Copenhagen, Denmark: International Federation of Surveyors (FIG).
Bouguenec, V.; Gaini, N. 1989. Aquatic oiligochaeta as prey for invertebrates and vertebrates: A review. Acta. Oecologica 10: 177-196.
Bryant, E. 1987. CO2-warming, rising sea level and retreating coasts: Review and critique. Australian Geographer 18(2): 101-113.
Burke, L.K.; Umiko, K.; Kassem, K.; Revenga, C.; Spalding, M.; McAlister, D. 2001. Pilot analysis of global ecosystem.Washington, DC: World Resources Institute.
CCD (Coast Conservation Department). 1992. Coastal 2000: Recommendations for e resource management strategy for Sri Lanka’s coastal region, Vol. I & II. Colombo: CCD.
CCD. 1997. Revised coastal zone management plans, Sri Lanka. Colombo: CCD.
Chandana, E.P.; Amarasinghe, S.; Amarasinghe, N.J. de S.; Samayawardena, L.A. 2008. Factors effecting the avifaunal distribution in three lagoons (Malala, Embilikala and Bundala Lewaya) of Bundala National Park (A Ramsar Wetland) in Sri Lanka. Ruhuna Journal of Science 3: 34-43.
Chitravadivelu, K. 1994. Aspects of fishery and species composition of edible crabs in the Jaffna lagoon. Journal of the National Science Foundation of Sri Lanka 22(1):43-5520(1).
Coates, J.S. 1935. The geology of Ceylon. Spolia Zeylanica 19(2): 101-187.
Coles, R.G.; Long, Lee, W.J.; Watson, R.A.; Derbyshire, K.J. 1993. Distribution of seagrasses, and their fish and penaeid prawn communities. In: Cairns Harbour, a tropical estuary, northern Queensland, Australia. Australian Journal of Marine & Freshwater Research 44: 193-210.
Colombo, G. 1977. Lagoons. In: The Coastline, ed., Barnes, R.S.K. New York: John Wiley& Sons, pp. 63-81.
Cooper, J.A.G. 1994. Lagoons and microtidal coasts, In: Coastal evolution, late quaternary shoreline morphodynamics, ed., Carter, R.W.G. and Woodroffe, C.D. Cambridge: Cambridge University Press, pp. 219- 265.
Cooray, P.G. 1968. The geomorphology of part of the north-western coastal plain of Ceylon. Zeitcrift für Geomorphologie.(Annals of geomorphology) NF Supp. 7: 95-113.
Cooray, P.G. 1984. An introduction to the geology of Sri Lanka. Colombo, Sri Lanka: Ceylon National Museum Publication, second revised edition, pp. 140-14 2.
Cooray, P.G.; Katupotha, J. 1991. Geological evolution of the coastal zone of Sri Lanka. Proceedings of the Symposium on “Causes of Coastal Erosion in Sri Lanka.” Colombo, Sri Lanka: CCD/GTZ, 9-11, Feb. 1991, pp. 5-26.
Corea, A.S.L.E.; Johnstone, R.; Jayasinghe, J.M.P.K.; Ekaratne, S.U.K.; Jayawardene, K. 1998. Self-pollution: A major threat to the prawn farming industry in Sri Lanka. Ambio 27 (8): 662-668.
Costa, H.H.; Wijeyaratne, M.J.S. 1994. Utilization of mangrove species in brush park construction and their effects on Negombo estuary fishery (Sri Lanka). Journal of Applied Ichthyology 10(2-3): 96-103.
Costanza, R. 2000. Social goals and the valuation of ecosystem services. Ecosystems 3: 4-10.
Dahanayaka, D.D.G.L.; Wijeyaratne M.J.S. 2006. Diversity of macrobenthic community in the Negombo estuary, Sri Lanka with special reference to environmental conditions. Sri Lanka Journal of Aquatic Sciences 11: 43-62.
Dahanayaka, D.D.G.L.; Jayamanne, S.C.; Wijeyaratne M.J.S. 2008. Benthic invertebrates of a tropical estuary in the western coast of Sri Lanka, Proceedings of International Conference on Environmental Research & Technology, 28-30 May 2008, Parkroyal Penang, Malaysia, 476-481.
Dahdouh-Guebas, F.; Hettiarachchi, S.; Seen, D.L.; Batelaan, O.; Sooriyarachchi, S.; Jayatissa, L.P.; Koedam, N. 2005. Transitions in ancient inland freshwater resource management in Sri Lanka affect biota and human populations in and around coastal lagoons. Current Biology 15: 579-586.
Dahdouh-Guebas, F.; Kairo, J.; Jayatissa, L.; Cannicci, S.; Koedam, N. 2002. An ordination study to view vegetation structure dynamics in disturbed and undisturbed mangrove forests in Kenya and Sri Lanka. Plant Ecology 161 (1): 123-135.
Dahdouh-Guebas, F.; Koedam, N.; Satyanarayana, B.; Cannicci, S. 2011. Human hydrographical changes interact with propagule predation behaviour in Sri Lankan mangrove forests. Journal of Experimental Marine Biology and Ecology399(2): 188-200.
Dayaratne, P.; Gunaratne, A.B.A.K.; Alwis, M.M. 1995b. Fish resources and fisheries in a tropical lagoon system in Sri Lanka. Ambo 24(7-8): 402-410.

96
Dayaratne, P.; Linden, O.; Ranjith, M.W.; De Silva, N. 1995a. Puttalam lagoon and Mundel lake, Sri Lanka: A study of coastal resources, their utilization, environmental issues and management options. Ambio 24 (7-8): 391-401.
Dayaratne, P.; Linden, O.; Ranjith, M.W.; De Silva, N., eds. 1997. The Puttalam/Mundel estuarine system and associated coastal waters. Colombo: NARA, 98p.
de Bruin, G.H.P. 1965. Penaeid prawns of Ceylon (Crustacea Decapoda, Penaeidae) Zoologische Mededelingen. Deel 41(4).
de Iongh, H.H. 1996. Plant behaviour interactions between seagrass and Dugongs in a tropical small island ecosystem. Ph.D Dissertation. Leiden: LEI Universiteit; Wageningen. P.H: Nienhuis & H.H.T. Prins.
Department of Census and Statistics. 2010. Household income and expenditure survey 2009/2010. Colombo, Sri Lanka.
De Silva, K.H.G.M. 1986. Mangroves in the west coast of Sri Lanka with special reference to their macrofauna. New perspectives in research and management of mangrove ecosystems. Colombo: Natural Resources, Energy & Science Authority of Sri Lanka, 22p.
De Silva, K.H.W.L.; Amarasinghe, M.D. 2007. Substrate characteristics and species diversity of marine angiosperms in a micro-tidal basin estuary on the west coast of Sri Lanka. Sri Lanka Journal of Aquatic Sciences 12 (2007): 103-114.
De Silva, P.H.D.H. 1964. New species and records of polychaeta from Ceylon. Colombo, Ceylon: National Museums, pp. 537-563.
De Silva, S.S.; De Silva, C. 1984. Coastal lagoons. In: Ecology and biogeography in Sri Lanka, ed., Fernando, C.H. pp. 297-320. Hague: Dr. W. Junk Publishers.
De Silva, S.S.; Silva, E.I.L. 1979. Fish fauna of a coastal lagoon in Sri Lanka: Distribution and seasonal variation. Bulletin of Fisheries Research Station, Sri Lanka 29: 1-9.
De Silva, S.S.; Wijeyaratne, M.J.S. 1977. Studies on the young grey mullet, Mugil cephalus L. II. Food and feeding. Aquaculture12:157-1678.
Devendra, A. 2002. Hydrodynamics of Muthurajawela marsh & Negombo lagoon coastal wetland ecosystem. Effective Management for Biodiversity Conservation in Sri Lankan Coastal Wetlands, Final report A-VII, 27p.
DFAR (Department of Fisheries and Aquatic Resource). 2010. (http://www.fisheriesdept.gov.lk/vision english.html) (accessed in December 2011).
Dhanani, S.; Islam, I. 2002. Poverty, vulnerability and social protection in a period of crisis: The case of Indonesia. World Development 30 (7): 1211-1231.
Durairathnam, M. 1963. Studies on the seasonal cycle of sea surface temperatures, salinities and phytoplankton in Puttalam Lagoon, Dutch Bay and Portugal Bay along the West Coast of Ceylon. Bulletin of Fisheries Research Station, Ceylon16:9-24.
Durairathnam, M. 1966. Quantitative survey of sea grasses along the southwest coast of Ceylon. Bulletin of Fisheries Research Station, Ceylon 19: 11-12.
Dziegielewska, D.; Tietenberg, Tom; Niggol, Seo. 2009. Total economic value, http://surfeconomics.blogspot.com/2009/05/total-economic-value.html (accessed in January 2012).
Ekanayake, M.; Wijeratne, S.; Cederlof, U.; Rydberg, L.; Arulananthan, K. 1995. The tidal response of Puttalam Lagoon, Sri Lanka: A large shallow tropical lagoon. Ambio 24 (7-8): 444-447.
Emery, K.O.; Stevenson, R.E. 1957. Estuaries and lagoons. Memoirs Geological Survey, America 67: 673-750.
Fairbridge, R.W. 1961. Eustatic changes in sea-level. Physics and Chemistry of the Earth 4: 99-185.
FAO (Food and Agriculture Organization of the United Nations). 2002. Corporate Document Repository, Forestry Department (http://www.fao.org/docrep/007/ae212e/ae212e04.htm) (Accessed in December 2011)
FAO. 2003. Management, co-management or no management? Major dilemmas in southern African freshwater fisheries. 2. Case studies, ed., Jul-Larsen, E.; Kolding, J.; Overå, R.; Raakjær Nielsen, J.; Zwieten, P.A.M. van. FAO Fisheries Technical Paper. No. 426/2. Rome: FAO. 2003. 271p.
FAO. 2010. Payments for environmental services (PES). Rome: Agricultural Development Economics Division, FAO.
FAO. 2011. Regional Fisheries Livelihood Programme (RFLP) GCP/RAS/237/SPA: Baseline Survey - Sri Lanka – Final Report. Prepared by Management Frontiers, Colombo, Sri Lanka.
Fonseca, M.S. 1989. Sediment stabilization by Halophila desipiens in comparison to other seagrasses. Estuarine, Coastal and Shelf Science 29:501-507.
Francesca, C. 2008. Economic value. (http://www.coastalwiki.org/coastalwiki/Economic_Value) (accessed in December 2011)
Freeman, M. 1993. The measurement of environmental and resource values: Theory and methods. Washington, DC: Resources for the future.

97
Galappaththi, E.K. 2013. Community-based shrimp aquaculture in northwestern Sri Lanka. A Thesis submitted to the Faculty of Graduate Studies of The University of Manitoba in Partial Fulfillment of the Requirements of the Degree of Master of Natural Resources Management, Clayton, H. Riddell Faculty of Environment, Earth, and Resources, Natural Resources Institute, University of Manitoba, Winnipeg, Manitoba R3T 2N2, March 03, 2013.
Giresse, P. 1987. Quaternary sea-level changes of the Atlantic coast of Africa. In: Sea-level changes, ed., Tooley, M.J.; Shennan, I. The Institute of British Geographers Special Publications Series 20. Oxford: Basil Blakwell Ltd., pp. 249-275.
Gunaratne, G.L.; Norio, Tanaka; Amarasekara, P.; Priyadarshana, T.; Manatunge, J. 2010. Restoration of Koggala lagoon: Modeling approach in evaluating lagoon water budget and flow characteristics. Journal of Environmental Sciences (China) 22(6):813-819.
Gunaratne, G.L.; Tanaka, N.; Amarasekara, P.; Priyadarshana, T.; Manatunge, J. 2011. Impact of rubble mound groyne structural interventions in restoration of Koggala lagoon, SriLanka. Numerical modeling approach. Journal of Coastal Conservation 15 (1): 113-121.
Gunatilaka, A. 1975. Some aspects of biology and sedimentology of laminated algal mats from Mannar lagoon, northwest Ceylon. Sedimentary Geology 14: 275-300.
Gunawardena, M.; Rowan, J.S. 2005. Economic valuation of a mangrove ecosystem threatened by shrimp aquaculture in Sri Lanka. Environmental Management 36(4): 535-550.
Gunawickrama, K.B.S.; Chandana, E.P.S. 2006. Some hydrographic aspects of Koggala Lagoon with preliminary results on distribution of the marine bivalve Saccostrea forskalli: Pre-tsunami status. Ruhuna Journal of Science 1: 16-23.
Gunawickrama, K.B.S.; Damayanthi, H.G.B.N.; Chandana1, E.P.S.; Amarasinghe, N.J. de S.; Samayawardhena, L.A. 2008. Factors affecting the avi-faunal distribution in the three lagoons (Malala, Embillakala and Bundala Lewayas) of Bundala National Park (A Ramsar Wetland) in Sri Lanka. Ruhuna Journal of Science 3: 34-43.
Harris, L.A.; Buckley, B.; Nixon, S.W.; Allen, B.T. 2004. Experimental studies of predation by bluefish Pomatomus saltatrix in varying densities of seagrass and macroalgae. Marine Ecology Progress Series 281:233-239.
Heck, Jr., K.L.; Thoman, T.A. 1984. The nursery role of seagrass meadows in the upper and lower reaches of Chesapeake Bay. Estuaries 7:70-92.
HoboTraveler.Com. 1997-2012. Agrotourism (http://www.hobotraveler.com/agrotourism.php) (Accessed in January 2012).
Ingle, R.W.; Fernando, C.H. 1963. On some fresh and brackish water crustaceans from islets of Negombo Lagoon, Sri Lanka, Proceedings of the First Asian Symposium on Mangrove Environment.
Isla, Federico Ignacio. 1991. Coastal lagoons. In: Coastal zone and estuaries (vol. 1). In: Encyclopedia of Life Support Systems (EOLSS), Chapter 2.2., ed., Isla, Federico Ignacio. Paris: UNESCO.
IUCN (International Union for Conservation of Nature). 2002a. A biodiversity status profile of Bundala National Park, a Ramsar Wetland in Sri Lanka. Occasional Paper 2. Colombo, Sri Lanka: IUCN.
IUCN. 2002b. An assessment of the status of biodiversity in the Madu Ganga mangrove estuary. Occasional Paper. Colombo, Sri Lanka: IUCN, iv + 49p.
IUCN. 2005. A biodiversity status profile of Lunama - Kalametiya wetland sanctuary. Occasional Paper 8. Colombo, Sri Lanka: IUCN, iv+43p.
IUCN. 2009. Mangroves for the future national strategy and action plan. An ecosystem-based integrated coastal management in Sri Lanka. Colombo, Sri Lanka: IUCN.
IUCN. 2010. Tourism and coastal development on the southeast coast of Sri Lanka. Report of the workshop held on 23rd
December 2010 in Pottuvil. Colombo, Sri Lanka: IUCN, 44p.
IUCN. 2011a. Fisheries management strategy for Periya Kalapuwa - A plan to address the issues and threats of the biggest lagoon in Ampara district. Colombo, Sri Lanka: IUCN.
IUCN. 2011b. Biodiversity and socio-economic information of selected areas of Sri Lankan side of the Gulf of Mannar. Colombo, Sri Lanka: IUCN, January 2011.
Jackson, K.L. 2008. Paleo-tsunami history recorded in Holocene coastal lagoon sediments, southeastern Sri Lanka, MSc thesis, University of Miami, USA, 234p.
Jayakody, D.S.; Dahanayaka, D.D.G.L. 2005. Diversity of fishing practices and resource conservation in Negombo lagoon. Sri Lanka Naturalist 7: 29-31.
Jayakody, D.S.; Jayasinghe, J.M.P.K. 1992. Report on the development potential of Rekawa lagoon. Colombo: National Aquatic Resources Research and Development Agency (NARA), 26p.
Jayakody, D.S.; Jayawardena, P.A.A.T. 1997. The relationship between availability of life-cycle stages of Penaeus indicus in Rekawa lagoon, its adjacent water bodies and sand bar formation. J. Nat. Aquatic Resources Agency Sri Lanka 35:79-85.

98
Jayakody, J.M.A.L.; Amarasinghe, M.D.; Pahalawattaarachchi, V.; De Silva, K.H.W.L. 2008. Vegetation structure and potential gross primary productivity of mangroves at Kadolkele in Meegamuwa (Negombo) estuary, Sri Lanka. Sri Lanka Journal of Aquatic Sciences 13: 95-108.
Jayamanne, S.C. 1992. Mud crab fishery of Sri Lanka. In: Report of the seminar on mud crab culture and trade, ed., Angell, C.A. Bay of Bengal Programme, Madras, BOBP/REP. 51:41-48.
Jayamanne, S.C.; Jinadasa, J. 1993. Size at maturity and spawning periodicity of the mud crab. Scylla serrata (Froskal) in the Negombo estuary. Journal of Natural Sciences Council of Sri Lanka 21: 141-152.
Jayasiri, H.B.; Dahanayaka, D.D.G.L. 2009. Use of chlorophyll- a to determine the trophic status of coastal lagoons in Sri Lanka, Water Resources Research in Sri Lanka, Symposium Proceedings of The Water Professionals’ Day, Geo-Informatics Society of Sri Lanka (GISSL), 45-52.
Jayasiri, H.B.; Rajapaksha, J.K. 2000. Salt and water balance in the Mundel Lake. A strongly choked lagoon, Sri Lanka. Journal of National Aquatic Resources Research & Development Agency 36:35-46.
Jayasiri, H.B.; Rajapaksha J.K.; Rydberg, L.; Cederlof, U. 1998.The Mundel lake estuarine system, Sri Lanka; Possible measures to avoid extreme salinity and sea level. Ambio 27 (8): 745-75.
Jayasuriya, P.M.A. 1991a. The species composition, abundance and the distribution of seagrass communities in Puttalam lagoon. Vidyodaya Journal of Science 3: 93-102.
Jayasuriya, P.M.A. 1991b. Distribution and species composition of the existing mangrove vegetation around Chilaw lagoon. Vidyodaya Journal of Science 3(2): 103-113.
Sri Lanka. Botanical Journal of the Linnaean Society (2002) 138: 29-43.
Jayatissa, L.P.; Guero, M.C.; Hettiarachchi, S.; Koedam, N. 2002b. Changes in vegetation cover and socio-economic transitions in a coastal lagoon (Kalametiya, Sri Lanka), as observed by tele-detection and ground truthing can be attributed to an upstream irrigation scheme. Environment Development and Sustainability 4(2): 167-183.
Jayawardena, J.W.K.K.; Amararasinghe, M.D.; Ranawana, K.B. 1999. Mangrove vegetation structure and the abundance of shrimps in Chilaw lagoon, Sri Lanka. Journal of Aquatic Sciences 4: 69-81.
Jayawardena, P.A.A.T.; Gunawardane, M.G.K. 2003. Factors influencing migration of Metapenaeusdobsoni (Miers 1878) in the Negombo Lagoon. Indian Journal of Fisheries 50(4): 439-453.
Jayawickrema, S.J.C. 1987. Study of the population dynamics of Indian white shrimp Penaeusindicus (H. Milne Edward) in Negombo and Chilaw, Sri Lanka during the period September 1982 to June 1986. Diploma thesis. Norway: University Bergen.
Jayawickrema, S.J.C. 1990. Status of Penaeusindicus (H. Milne Edward) stocks from Negombo and Chilaw. Journal of the Natural Science Council of Sri Lanka 18: 159-166.
Jayawickrema, S.J.C. 1992. Status of fishery in the Chilaw estuary. Journal of the National Science Council of Sri Lanka20(2):199-207.
Jentoft, S. 2008. Unravelling the vicious circle: Poverty alleviation and sustainable livelihoods in small-scale fisheries.Research Hand Book, Povefish Project. Norway: MAREMA Institute, University of Tromso.
Jinadasa, J.; Ekanayake, W.E.M.K.; Furtst, M. 1994. Prelimenery observations on clam distribution and on maturity size and fishing of Meretric casta in the Negombo lagoon. In: Proceedings of the 50th Annual Scientfic Sessions of Sri Lanka Association of Advancement of Science. Part I.
Johnson, P.; Johnstone, R. 1995. Productivity and nutrient dynamics of tropical sea-grass communities in Puttalam Lagoon, Sri Lanka. Ambio 24 (7-8) 411-417.
Katupotha, J. 1988a. Evolution of coastal land form in the western part of Sri Lanka. Geographical Science (Hiroshima Univ.), v 43(1), 1988, 18- 36 (with Abstract in Japanese).
Katupotha, J. 1988b. Hiroshima University radiocarbon dates - II, west and south coasts of Sri Lanka. Radiocarbon v 30 (3): 341-346.
Katupotha, J. 1988c. Hiroshima University radiocarbon dates - II, west and south coasts of Sri Lanka. Radiocarbon v 30 (3): 341-346.
Katupotha, J. 1988d. Evidence of high sea-level during the mid-Holocene on the southwest coast of Sri Lanka. Boreas v 17(2) (1988): 209-213.
Katupotha, J. 1990. Sea-level variations: Evidence from Sri Lanka and South India. In: Sea level variation and its impact on coastal environment (ed.), Rajamanickam, Victor G. Thanjavur-613001, India: Tamil University Offset Press, pp. 53-81.
Katupotha, J. 1994. Quaternary research in Sri Lanka. In Recent advances in the earth sciences of Sri Lanka - P.W. Vitanage, Felicitation Volume. Journal of the Geological Society of Sri Lanka v 5: 141-152.
99
Katupotha, J. 1995. Evolution and the geological significance of Holocene emerged shell beds on the southern coastal zone of Sri Lanka. Journal of Coastal Research 11 (4): 1042-1061.
Katupotha, J.; Fujiwara, K. 1988. Holocene sea-level change on the southwest and south coasts of Sri Lanka. Palaeogeography, Palaeoclimate, Palaeoecology Journal v 68(2-4): 189-203.
Kithsiri, H.M.P. 1996. Distribution, population dynamics and fishery of three species of bivalves (Family: Veneridae), in the Puttalam lagoon and Dutch bay, Sri Lanka, MPhil. thesis. University of Kelaniya, Sri Lanka, 121p.
Kithsiri, H.M.P.; Wijeyaratne, M.J.S.; Amarasinghe, U.S. 2000. Influence of some environmental factors on the abundance of three commercially important bivalve species (Family: Veneridae) in the Puttalam lagoon and Dutch bay, Sri Lanka. SriLanka Journal of Aquatic Sciences 5: 27-38.
Kjerfve, B. 1986. Comparative oceanography of coastal lagoons. In: Estuarine variability, ed., Wolfe, D.A. New York: Academic Press, pp. 63-81.
Kjerfve, B. (ed.). 1994a. Coastal lagoon processes. Amsterdam: Elsevier.
Kjerfve, Bjorn. 1994b. Coastal lagoons. In: Coastal lagoon processes, ed. Kjerfve, B. Elsevier Oceanography Series, 60, (1994). Amsterdam: Elsevier Science Publishers B.V, Chapter 1, 1-8.
Kjerfve, Bjorn; Magill, K.E. 1989. Geographic and hydrodynamic characteristics of shallow coastal lagoons. Marine Geology 88 (1989): 187-199.
Kolla, N.; Biscave, P.V. 1977. Distribution and origin of quartz in the sediments of the Indian Ocean. Journal of Sedimentary Petrology 47(2): 642-649.
Kugathasan, K.S. 1969. Mangrove vegetation of the lagoon. Hydrobiological Research Council, Northern Province Science Teachers’ Association, Jaffna. Bulletin 7.
Kumara, M.P.; Jayatissa, L.P.; Krauss, K.W.; Phillips, D.H.; Huxham, M. 2010. High density mangrove plantation enhances surface accretion, surface elevation change, and tree survival in coastal areas susceptible to sea-level rise. Oecologia164: 545-553.
Kumaraswamy, P.; Muthukumaravel, K.; Hameed, S.W.S.A.; Rajendran, R. 2006. Effects of some heavy metals on the filtration rate of an estuarine calm, Meretrix casta (Chemnitz). Indian Journal of Environmental Science 10: 79-80.
Lowry, K.; Pallewatte, N.; Dainis, A.P. 1999. Policy-relevant assessment of community-level coastal management projects in Sri Lanka. Ocean and Coastal Management 42 (8):717-745.
Mandelli, F.E. 1998. On the hydrography and chemistry of some coastal lagoons on the Pacific Coast of Mexico. In: CoastalLagoon Research, Present and Future, Proceedings of UNESCO/IABO Seminar, UNESCO Technical Papers in Marine Science No. 33, pp.81-95.
Matsumoto, D.; Shimamoto, T.; Hirose, T.; Gunatilake, J.; Wickramasooriya, A.; DeLile, J.; Young, S.; Rathnayake, C.; Ranasooriya, J.; Murayama, M. 2010. Thickness and grain-size distribution of the 2004 Indian Ocean tsunami deposits in Periya Kalapuwa Lagoon, eastern Sri Lanka. Sedimentary Geology 230 (3-4): 95-104.
McGlathery, K.J. 2001. Macroalgal blooms contribute to the decline of seagrass in nutrient rich coastal waters. Journal of Phycology 37 (4):453-456.
McGregor, J. 2007. A wellbeing perspective for understanding development in Thailand. International Conference of Happiness and Public Policy, 18-19 July 2007. Bangkok, Thailand: United Nations Conference Centre.
Munasinghe, M. 1992. Environmental economics and sustainable development. Rio Earth Summit. Washington, DC: World Bank.
Nagabhatla, N.; Finlayson, C.M.; Senaratne Sellamuttu, S.; Gunawardena, A. 2008. Application of geophysical tools to monitor changes in a micro-tidal estuary for the purpose of management planning. Ceylon Journal of Science (Bio Sci.) 37:73-86.
NARA (National Aquatic Resources Research and Development Agency). 2010. Preliminary report on coastal and marine ecosystems, fisheries and aquaculture (phase I). Colombo, Sri Lanla: NARA.
Native Planet. 2004. Cultural tourism (http://www.native planet.org/travel/travel ecotourism.shtml) (Accessed in June 2010).
NECCDEP (North East Coastal Community Development Project). 2010a. Study 2. Seasonal variations in water quality in Arugam Lagoon, including the identification of most likely sources of pollutants assessed and recommendations to improve the future water quality in the lagoon. Colombo, Sri Lanka: Ministry of Nation Building and Estate Infrastructure Development.
NECCDEP. 2010b. Study 4: A participatory assessment of the dynamics, seasonal variation and current status of fishery in Batticaloa Lagoon. Colombo, Sri Lanka: Ministry of Economic Development.
NECCDEP. 2010c. Study 5. Seasonal variations in water quality in Batticaloa Lagoon, including the identification of most likely sources of pollutants assessed and recommendations to improve the future water quality in the lagoon. Colombo, Sri Lanka: Ministry of Nation Building and Estate Infrastructure Development.

100
NECCDEP. 2010d. Study 9. An assessment of the past and current extent of mangrove coverage in Eastern Province in Sri Lanka using remote sensing technology. Colombo, Sri Lanka: Ministry of Nation Building and Estate Infrastructure Development.
NECCDEP. 2010e. Study 12.A bathymetric survey of Batticaloa lagoon. Colombo, Sri Lanka: Ministry of Nation Building and Estate Infrastructure Development.
NECCDEP. 2010f. Study 19.A review of the historical and current status of the fisheries sector along the eastern coast of Sri Lanka. Colombo, Sri Lanka: Ministry of Nation Building and Estate Infrastructure Development.
Nguyen-Khoa, S.; Smith, L.E.D. 2004. Irrigation and fisheries: Irreconcilable conflicts or potential synergies? Irrigation and Drainage 53 (4): 415-427. 2004.
Nissanka, C. 1997. Population dynamics of Penaeus indicus (Crustacea: Penaeidae) in Rekawa lagoon, Sri Lanka. Sri Lanka Journal of Aquatic Sciences 2: 43-53.
Nixon, S.W. 1995. Coastal marine eutrophication: A definition, social causes, and future concerns. Ophelia 41:199-219.
Pahalawattaarachchi, V.; Jayamanne S.C.; Amarasinghe, M.D. 2005. Changes in seagrass ecosystems in Negombo lagoon with special reference to past development activities. Proceeding of the international conference on Fisheries and Aquatic Resources.
Parker, B.; Kozel, V. 2005. Understanding poverty and vulnerability in India’s Uttar Pradesh and Bihar: A Q-Squared Approach, Centre for International Studies, University of Toronto. http://www.q-squared.ca/pdf/Q2_WP9_Parker_Kozel.pdf. (Accessed September 2010).
Pauly, D.; Christensen, V. 1998. Fishing down marine food webs. Science 279 (5352): 860-863.
Pemadasa, M.A.; Balasubramaniam, S.; Wijewansa, H.G.; Amarasinghe, L. 1979. The ecology of a saltmarsh in Sri Lanka. Journal of Ecology 67 (1): 41-63.
Perera, W.K.T.; Sachithananthan, K. 1977. Topography of Nanthikadal and nayaru lagoons. Bulletin of the Fisheries Research Station, Sri Lanka 27: 9-15.
Perera, W.K.T.; Siriwardena, P.P.G.S.N. 1982. Topography of Puttalam lagoon [Sri Lanka]. Journal of Inland Fisheries 1: 97-104.
Péréz-Rufsafa, A.; Carmen Mernpan, M.; Marcos, C. 2007a. Hydrographic, geomorphologic and fish assemblages relationships in coastal lagoons. Hydrobiologia 577: 107-125.
Péréz-Rufsafa, A.; Marcos, C.; Pérez-Ruzafa, I.M.; Barcala, E.; Hegazi, M.I.; Quispe, J. 2007b. The problem of detecting changes under human pressure in a naturally quick-changing and heterogeneous environment: Spatial and temporal scales of variability in coastal lagoons. Estuarine, Coastal and Shelf Science 75: 175-188.
Pillai, T.G. 1965. Brackish water fishery resources. Bulletin of the Fisheries Research Station, Ceylon 18: 75-85.
Pinto, L. 1978. Some ecological aspects of selected mangrove islets in the Negombo Lagoon (Sri Lanka). MPhil thesis, University of Colombo.
Pinto, L. 1980. Some ecological aspects of the edible oyster Crassostrea cucullata (Born) occurring in association with mangroves in Negombo Lagoon, Sri Lanka. Hydrobiologia 69:11-20.
Pinto, L.; Punchihewa, N.N. 1996. Utilisation of mangroves and seagrasses by fishes the Negombo estuary, Sri Lanka. Berlin, Heidelberg. Marine Biology 126 (2): 333-345.
Pinto, L.; Swarnamali, P.A, 1997. Decomposition and nutrient release by Avicennia marina (Forsk.) Vierh.in a mangrove islet and a brush pile in Negombo estuary. Journal of the National Science Council of Sri Lanka 25(4): 211-224.
Pinto, M.L. 1986. Mangroves of Sri Lanka. Sri Lanka: Natural Resources, Energy and Science Authority, 57p.
Piyankarage, S.; Mallawatantri, A.; Matsuno, Y.; Pathiratne, K. 2004. Human impacts and the status of water quality in the Bundala Ramsar wetland lagoon system in southern Sri Lanka. Wetlands Ecology and Management 12 (5): 473-482.
Prell, W.L.; Huston, H.M.; Williams, D.F.; Be, A.H.W.; Getize-Nauer, K.; Molfino, B. 1980. Surface circulation of the Indian Ocean during the Last Glacial Maximum, approximately 18,000 years B.P. Quaternary Research 14: 309-336.
Priyadarshana, T.; De Silva, M.P. 1996. An investigation of the anthropogenic effects on the Rekawa lagoon with special reference to its water quality studies. Proceedings of the 52nd Annual Session SLAAS, Colombo, Sri Lanka, November 25, pp. 124-126.
Priyadarshani, S.H.R.; Jayamanna, S.C.; Hirimuthugoda, Y.N. 2008. Diversity of mangrove crabs in Kadolkele, Negombo estuary, Sri Lanka. Sri Lanka Journal of Aquatic Sciences 13: 109-121.
Punchihewa, N.N. 1991. Seasonality in the utilization of mangrove and seagrass by the fish and crustacean communities in Negombo estuary. MPhil thesis. Open University of Sri Lanka.
Rajapaksha, J.K. 1997. Low frequency tidal response and water exchange in a restricted lagoon: The Negombo Lagoon, Sri Lanka. MSc thesis. Sweden: University of Gothenburg.
101
Rajapaksha, J.K.; Jayasiri, H.B. 2000. Restricted water exchange in tropical lagoon. The Negombo Lagoon on the west coast of Sri Lanka. Journal of National Aquatic Resources Research & Development Agency 36:12-25.
Ranasinghage, P.N. 2010. Holocene coastal development in southeastern-eastern Sri Lanka: Paleo-depositional environments and paleo-coastal hazards. PhD thesis. USA: Kent University.
Ranwell, D.S. 1972. Ecology of saltmarshes and sand dunes. London: Chapman & Hall.
Renault, D.; Hemakumara, M.; Molden, D. 2001. Importance of water consumption by perennial vegetation in irrigated areas of the humid tropics: Evidence from Sri Lanka. Agricultural Water Management 46 (3): 215-230.
Richmond, B.M.; Jaffe, B.E.; Gelfenbaum, G.; Morton, R.A. 2006. Geologic impacts of the 2004 Indian Ocean tsunami on Indonesia, Sri Lanka, and the Maldives. In: Tsunamis, hurricanes, and neotectonics as driving mechanisms in coastal evolution: Proceedings of the Bonaire field symposium, March 2-6, 2006, ed., Scheffers, A.; Kelletat, D. Zeitschrift für Geomorphologie, Berlin. Gebrüder Borntraeger. F. suppl. v. 146: 235-251.
Romero, J.; Lee, K.-S.; Pérez, M.; Mateo, M.A.; Alcoverro, T. 2006. Nutrients dynamics in seagrass ecosystems. In: Seagrasses: Biology, ecology and conservation, ed., Larkum, A.W.D. et al. Springer: The Nethewrlands 227-254.
Rydberg, L.; Wickbom, L. 1996. Tidal choking and bed friction in Negombo Lagoon, Sri Lanka. Estuaries 19: 540-547.
Sachithananthan, K. 1969. Salinity and temperature of the surface waters in the Jaffna lagoon. Bulletin of the Fisheries Research Station, Ceylon 20: 87-99.
Sachithananthan, K.; Perera, W.K.T. 1970. Topography and substratum of the Jaffna lagoon. Bulletin of the Fisheries Research Station, Ceylon 21: 75-85.
Samarakoon, J.I. 1983. Breeding patterns of the indigenous cichlids Etroplus suratensis and Etroplus maculatus in an estuary in Sri Lanka. Mahasagar, Dona Paula 16 (3): 357-362.
Samarakoon, J.I.; van Zon J.C.J., eds. 1991. Environmental profile of Muthurajawela and Negombo lagoon. Colombo: Euro Consult/Greater Colombo Economic Commission.
Sanders, M.; Jayawardane, A.; Ediriweera, S. 2000. Preliminary assessment for the shrimp fisheries of the Negombo lagoon (Sri Lanka). FAO Fisheries Circular 958. Rome: FAO, 98p.
Silva, E.I.L. 1981. Contribution to the Biology and Fishery of Grey Mullet, Mugil cephalus L. in the Negombo lagoon with notes on hydrography. MPhil thesis, Sri Lanka: University of Kelaniya.
Silva, E.I.L. 1996. Water quality of Sri Lanka - A review of twelve water bodies. Kandy: Institute of Fundamental Studies.
Silva, E.I.L. 2005. Bibliography of scientific research on fisheries and aquatic sciences in Sri Lanka, 1900-2004, Sri Lanka.Colombo, Sri Lanka: Sri Lanka Association for Fisheries and Aquatic Resources, First Edition, 117p.
Silva, E.I.L.; Davies, R.W. 1986. Primary productivity and related parameters in three different types of inland waters in Sri Lanka. Hydrobiologia 137(3):239-249.
Singappuli, M. 2004. Status of some water quality parameters and primary productivity of Rekawa lagoon, southern coast of Sri Lanka. MPhil thesis. Sri Lanka: University of Ruhuna, 156 p.
Siriwardena, P.P.G.S.N.; Perera, W.K.T. 1986. Topography and substratum of Bolgoda lake. [Sri Lanka] Journal of Inland Fisheries 3: 15-23.
Siriwardena, P.P.G.S.N.; Tissa, R.P.K. 1988. Seasonal and diurnal changes in some physicochemical parameters of Bolgoda Lake. [Sri Lanka] Journal of Inland Fisheries 11: 255-268.
Sivashanthini, K. 2008. Length-weight relationships and condition of gerreids (Pisces: Gerreidae from the Parangipettai waters (SE coast of India). Asian Fisheries Sciences 21: 405-419. Sivashanthini, K. 2009. Population dynamics of a whip fin silver biddy Gerres filamentosus Cuvier, 1829 from the Parangipettai waters, southeast coast of India. Asian Fisheries Sciences 22: 1149-1162.Sivashanthini, K.; Ajmalkhan, S. 2004. Population dynamics of Gerres setifer (Hamilton, 1822) in the Parangipettai waters, southeast coast of India. Indian Journal of Marine Sciences 33: 352-357.
Smakhtin, V.U.; Piyankarage, S.C. 2003. Simulating hydrologic reference condition of coastal lagoons affected by irrigation flows in southern Sri Lanka. Wetlands 23(4): 827-834.
Smith, A. H. and F. Berkes. 1991. Solutions to the “tragedy of the commons”: Sea-urchin management in St Lucia, West Indies. Environmental Conservation 18(2): 131-135.
Stanzel, P.; Oze, A.; Smakhtin, V.; Boelee, E.; Droogers, P. 2002. Simulating impacts of irrigation on the hydrology of the Karagan lagoon in Sri Lanka. Working Paper 44. Colombo, Sri Lanka: International Water Management Institute.
Sullivan, Kate; Silva de Lalith; White T. Alan; Wijeratne, Mervyn, eds. 1995. Environmental guidelines for coastal tourism development in Sri Lanka. Printed in Colombo Coast Conservation Department, Ceylon Tourist Board Coastal Resources Management Project of The University of Rhode Island and United States Agency for International Development.
Survey Department of Sri Lanka. 2007. The submerged plateau surrounding Ceylon. The National Atlas of Sri Lanka, 2007. Colombo, Sri Lanka.

102
Swan, B. 1983. An introduction to the coastal geomorphology of Sri Lanka. National Museum in Sri Lanka. Colombo, Sri Lanka: Government Press.
TIES (The International Eco-Tourism Society). 1990. What is ecotourism (http://www.ecotourism.org/about-ties) (Accessed in May 2010).
Tricker, Bob, 1999. Pocket director: The essentials of corporate governance from A to Z (3rd edition). London: Turnbull, Shann.
Vinobaba, P.; Vinobaba, M. 2003. Sudden mortalities among fin fish, shell fish and other fauna from the Batticaloa lagoon, east coast of Sri Lanka. International conference on disease management for sustainable fisheries (ICONS-DMS, 2003), pp. 83-84.
Walker, D.I.; McComb, A.J. 1992. Seagrass degradation in Australian coastal waters. Marine Pollution Bulletin 25:191-195.
Wattage, Premachandra; Simon, Mardle. 2005. Stakeholder preferences towards conservation versus development for a wetland in Sri Lanka. Journal of Environmental Management 77 (2005): 122-132
Wattage, Premachandra; Simon, Mardle. 2007. Total economic value of wetland conservation in Sri Lanka identifying use and non-use values. Paper sent to Journal of Wetlands Ecology Management. doi 10.1007/s11273-007-9073-3. (Accessed in June 2011).
Wayland, E.J. 1919. Outline of the stone age of Ceylon. Spolia Zeylanica 11:85-125.
Weerakkody, U. 1985. Geomorphological evolution of the southwest coast of Sri Lanka, An aerospace survey approach. MSc thesis. The Netherlands: ITS.
Weerakkody, U. 1988. Mid-Holocene sea level changes in Sri Lanka. Journal of Natural Science Council, Sri Lanka 16(1): 23-37.
Weerakkody, U. 1992. The Holocene coasts of Sri Lanka. The Geographical Journal 158(3): 300-306.
Whittaker, R.H. 1975. Communities and ecosystems. Second edition. New York: MacMillan.
Wijayananda, N.P.; Katupota, J. 1990. Geology and chronology of the inland coral deposits around Akurala. Journal of the Geological Society of Sri Lanka 2: 44-48.
Wijeratne, E.M.S.; Cederloef, U.; Rydberg, L.; Arulananthan, K. 1995. The tidal response of Puttalam lagoon, Sri Lanka: A large shallow tropical lagoon. Ambio 24 (7-8): 444-447.
Wijeratne, E.M.S.; Rydberg, L. 2007. Modelling and observations of tidal wave propagation, circulation and residence times in Puttalam lagoon, Sri Lanka. Estuarine, Coastal and Shelf Science 74(4): 697-708.
Wijeratne, E.M.S.; Rydberg, L.; Cederlöf, U.; Pathirana, K.P.P. 2000, One and two-dimensional modelling of tidal wave propagation in Puttalam lagoon, Sri Lanka. Proceedings of the Engineering Jubilee Congress “Engineering beyond 2000” 1: 173-187.
Wijeratne, E.M.S.; Rydberg, L.; Pathirana, K.P.P. 2004a. Comparison of 1-D and 2-D Tidal Models applied to a shallow restricted tidal inlet: Negombo lagoon, Sri Lanka. Proceedings of the Tenth Asian Congress of Fluid Mechanics, pp. 583-599.
Wijeratne, E.M.S.; Rydberg, L.; Pathirana, K.P.P. 2004b. Modelling of sea levels, water exchange and dispersion in an intermittently closed tidal estuary: Chilaw lagoon, west coast of Sri Lanka. Proceedings of the Tenth Asian Congress of Fluid Mechanics, pp. 618-625.
Wijeyaratne, M.J.S.; Costa, H.H. 1986. Application of “yield per recruit” and “surplus yield” models to the grey mullet fishery in Negombo lagoon, Sri Lanka, Journal of Inland Fisheries 3: 3-14.
Wijeyaratne, M.J.S.; Costa, H.H. 1987a. Fishery, seasonal abundance and mortality of grey mullets (Pisces - Mugilidae) in Negombo lagoon, Sri Lanka. Journal of Applied Ichthyology 3: 115-118.
Wijeyaratne, M.J.S.; Costa, H.H. 1987b. On the management of fin fish fishery of Negombo lagoon. Indian Journal of Fisheries 34(1): 41-47.
Wijeyaratne, M.J.S., Weliange, W.S.; Amarasinghe, U.S. 1996. Population dynamics of vermiculated rabbit fish Siganus vermiculatus (Valenciennes) in the Negombo estuary, Sri Lanka. Sri Lanka Journal of Aquatic Sciences 1: 59-69.
Williams, M.A.J. 1985. Pleistocene aridity in tropical Africa, Australia and Asia. In: Environmental change and tropical geomorphology, ed., Douglas, I. and Spencer, T., 219-233. British Geomorphological Research Group. London: Allen & Unwin.
World Bank (undated). Good Practice Standards for MDB supported Public Sector Operations. (http://siteresources.worldbank.org/EXTGLOREGPARPROG). (Accessed in December 2011).

103
Ann
exes
Ann
ex I
. Det
ails
of l
agoo
ns.
Lago
on: N
orth
Coa
stLo
ngitu
deLa
ttitu
deA
rea
(km
2 )Pe
rimet
er (k
m)
SLD
A
groe
cono
mic
. W
ME
(km
)
1.2.
1 U
ppu
Aru
(Jaf
fna)
3050
.68.
18
DL3
-4
Lago
on: N
orth
east
Coa
st

104
Lago
on: E
ast C
oast
Long
itude
Latti
tude
Are
a (k
m2 )
Perim
eter
(km
) SL
D
Agr
oeco
nom
ic.
WM
E (k
m)
Lago
on: S
outh
east
Coa
st

105
1.16
Mah
a Le
way
a**
(Ham
bant
ota)
1.
96
7 4.
43
DL5
Lago
on: S
outh
ern
Coa
st
Lago
on: S
outh
wes
t Coa
st

106
Lago
on: W
este
rn C
oast
Long
itude
Latti
tude
Are
a (k
m2 )
Perim
eter
(km
) SL
D
Agr
oeco
nom
ic.
WM
E (k
m)
Lago
on: N
orth
wes
t Coa
st
* A
band
oned
lew
ayas
. **
Salte
rn in
ope
ratio
n.§Su
bmer
ged
in 2
011
crea
ting
Ham
bant
ota
harb
or.
Not
e:SL
D=
Shor
elin
e D
evel
opm
ent;
WM
E= W
idth
of M
arin
e En
tranc
e.

107
Annex II. Availability of information. Lagoon: Northern Coast BM HG NT PP PL BT FS SF SG MG SM AF
1.1 Vidattaltivu x1.2 Jaffna Complex x x x x x 1.2.1 Uppu Aru 1.2.2 Chundikkulam 1.3 Thondamanaru 1.4 Punkudutivu 1.5 Kayts 1.6 Nanthikadal x 1.7 Nayaru x 1.8 Kokkilai x 1.9 Jinnapura Karachchi x 1.10 Pulmudai x 1.11 Puduwa-kattu x 1.12 Kuchchaveli x 1.13 Periyakarachchi x 1.14 Sinnakarachchi x 1.15 Uppuveli x 1.16 Tambalagam Bay x 1.17 Illakkantai Lagoon: Northeast Coast
2.1 Ullakkalie x 2.2 Uppar-Panichankeni x 2.3 Valaichchenai x 2.4 Batticaloa x x x x x x x Lagoon: Eastern Coast
3.1 Periya Klapuwa x x 3.2 Korai Complex x 3.4 Thimbutu x 3.3 Komari x 3.5 Murugetena x 3.6 Putuvil-Ureni x 3.7 Arugam x x x 3.8 Panama x 3.9 Panakala x 3.10 Solambe 3.11 Kunukala 3.12 Helawa 3.13 Okanda 3.14 Girikula
Lagoon: Southeastern Coast
4.1 Bagura 4.2 Andrakala 4.3 Itikala 4.4 Yakkala 4.5 Uda Gajaba Eliya 4.6 Pahala Potana* 4.7 Uda Potana* 4.8 Gonalebbe* 4.9 Butawa 4.10 Gode 4.11 Palatupana** 4.12 Kirinda* 4.13 Bundala** x x x x4.14 Malala-Embilikala x x x4.15 Koholankala**

108
4.16 Maha Lewaya**
Lagoon: Southern Coast
5.1 Karagan§ x x x5.2 Mahasittarakala* 5.3 Lunama-Kalametiya x x5.4 Kunukalliya* 5.5 Tillawatawana 5.6 Kahandamodara 5.7 Rekawa x x x x x x x x 5.8 Mawella x 5.9 Dondra 5.10 Garanduwa x Lagoon: Southwestern Coast
6.1 Koggala x x x x x x x 6.2 Ratgama Lake 6.3 Hikkaduwa Ganga 6.4 Telwatte Ganga 6.4 Madampa 6.5 Madu Ganga x x x x x x6.6 Kosgoda 6.7 Silliya Ganga 6.8 Ingirili Ganga
Lagoon: Western Coast
7.1 Bolgoda Lake x x x x x x7.2 Lunawa Lagoon x x 7.3 Negombo Lagoon x x x x x x x x x x
Lagoon: Northwestern Coast
8.1 Gembarandiya Lagoon 8.2 Chilaw Lagoon x x x x x 8.3 Muthupanthiya Lagoon 8.4 Mundel Lake x x x x x x x x x x x8.5 Thalawila Odai 8.6 Kandakuliya 8.7 Puttalam Lagoon x x x x x x x x x 8.8 Vankalai Kalapuwa 8.9 Periya Kalapuwa (NW) *Abandoned lewayas.**Salterns in operation.Note:
seagrasses; MG - mangroves; SM - salt marshes; AF- avifauna.

109
Ann
ex II
I. C
urre
nt st
atus
.
Nor
ther
n C
oast
Man
grov
esSa
lt
Mud
flats
R
ice-
O
ther
Sa
lt U
rban
mar
shpa
ddy
crop
s pa
ns
dev.
Se
ttlem
ents
A
ncho
rage
A
quac
ultu
re
1.1
Vid
atta
ltivu
Lag
oon
Den
se
M
arin
e cr
aft
1.
2 Ja
ffna
Com
plex
Fr
inge
Lo
caliz
ed
Exte
nsiv
e M
oder
ate
Mod
erat
e D
evel
opin
g In
tens
ive
M
arin
e cr
aft
1.
2.1
Upp
u A
ruFr
inge
Ex
tens
ive
Exte
nsiv
e
Den
se
In
tens
ive
1.2.
2 C
hund
ikku
lam
Sw
amps
St
ocki
ng1.
3 Th
onda
man
aru
Sw
amps
Exte
nsiv
e M
oder
ate
Den
se
Den
se
1.
4 Pu
nkud
utiv
u
Non
e
1.
5 K
ayts
N
one
1.6
Nan
thik
adal
D
ense
M
oder
ate
1.
7 N
ayar
u Pa
tchy
Den
se
1.8
Kok
kila
i
Swam
ps
M
oder
ate
M
oder
ate
M
arin
e cr
aft
1.
9 Ji
nnap
ura-
kara
chch
i Pa
tchy
A
band
oned
Mod
erat
e
1.10
Pul
mud
ai
Non
e
1.
11 P
uduw
a-ka
ttu
Frin
ge
M
oder
ate
Mod
erat
eM
arin
e cr
aft
1.
12 K
uchc
have
li
Frin
ge
Ex
tens
ive
Aba
ndon
ed
1.
13 P
eriy
akar
achc
hi
Non
e
Mod
erat
e M
oder
ate
Mod
erat
e D
evel
opin
g
1.14
Sin
naka
rach
chi
Patc
hy
Mod
erat
e M
oder
ate
Aba
ndon
ed
1.15
Upp
uvel
iPa
tchy
Inte
nsiv
e
Mar
ine
craf
t
1.16
Tam
bala
gam
b La
ke
Fr
inge
Mod
-era
te
C
age
1.17
Illa
kkan
tai
Pa
tchy
A
band
oned
Nor
thea
ster
n C
oast
M
angr
oves
Sa
lt m
arsh
M
udfla
ts
Ric
e pa
ddy
Oth
er c
rops
Salt
pans
Urb
an d
ev.
Settl
emen
ts
Anc
hora
ge
Aqu
acul
ture
2.1
Ulla
kkal
ieFr
inge
Exte
nsiv
e
2.
2 U
ppar
-Pan
icha
nken
i Fr
inge
2.
3 Va
laic
hena
iFr
inge
Mar
ine
craf
t
2.4
Bat
tical
oa L
agoo
n Fr
inge
In
tens
ive
Inte
nsiv
e
Inte
nsiv
e H
igh
Mar
ine
craf
t Po
nd

110
East
ern
Coa
stM
angr
oves
Salt
mar
sh
Mud
flats
R
ice
padd
yO
ther
cro
psSa
lt pa
nsU
rban
dev
. Se
ttlem
ents
A
ncho
rage
A
quac
ultu
re
3.1
Per
iya
Kal
apuw
a Pa
tchy
In
tens
ive
Inte
nsiv
e
Inte
n-si
ve
Inte
nsiv
e
3.2
Kor
ai C
ompl
ex
Swam
p
In
tens
ive
Mod
erat
e
3.4
Thim
butu
D
ense
Mod
erat
e
3.
3 K
omar
i Sc
atte
red
Inte
nsiv
e
Mod
erat
e
3.5
Mur
uget
ena
Scat
tere
d
3.
6 Pu
tuvi
l-Ure
ni
Frin
ge
Inte
nse
Mod
erat
e
M
oder
ate
3.
7 A
ruga
mSc
atte
red
Mod
erat
e
Inte
n-si
ve
Mod
erat
e
3.8
Pana
ma
Frin
ge
M
od-e
rate
3.
9 Pa
naka
la
Non
e
3.
10 S
olam
bePa
tchy
3.
11 K
unuk
ala
Non
e
3.
12 H
elaw
a Pa
tchy
Ex
tens
ive
3.
13 O
kand
a K
alap
uwa
Patc
hy
3.14
Giri
kula
Fe
w
Sout
heas
tern
Coa
st
Man
grov
es
Salt
mar
sh
Mud
flats
R
ice
padd
yO
ther
cro
psSa
lt pa
nsU
rban
dev
. Se
ttlem
ents
A
ncho
rage
A
quac
ultu
re
4.1
Bag
ura
Patc
hy
4.2
And
raka
la
Non
e
4.
3 Iti
kala
Non
e
4.
4 Ya
kkal
a N
one
4.5
Uda
Gaj
aba
Eliy
a
Few
4.
6 Pa
hala
Pot
ana
Lew
aya
Few
A
band
oned
4.7
Uda
Pot
ana
Lew
ayaa
Fe
w
Aba
ndon
ed
4.
8 G
onal
ebbe
Lew
aya
Non
e
A
band
oned
4.9
But
awa
Few
4.
10 G
ode
Kal
apuw
aN
one

111
4.11
Pal
atup
ana
Lew
aya
Few
In
dust
rial
4.
12 K
irind
a N
one
Aba
ndon
ed
4.
13 B
unda
laFe
w
Indu
stria
l
4.14
Mal
ala-
Embi
likal
a
Frin
ge
Aba
ndon
ed
4.
15 K
ohol
anka
la L
eway
a N
one
Indu
stria
l In
tens
ive
4.16
Mah
a Le
way
a
Non
e
In
dust
rial
Inte
nsiv
e
Sout
hern
Coa
stM
angr
oves
Salt
mar
sh
Mud
flats
R
ice
padd
yO
ther
cro
psSa
lt pa
nsU
rban
dev
. Se
ttlem
ents
A
ncho
rge
Aqu
acul
ture
5.1
Kar
agan
In
unda
ted
to c
onst
ruct
Ham
bant
ota
Har
bor i
n 20
11
5.
2 M
ahas
ittar
akal
a
Few
A
band
oned
In
tens
ive
5.3
Luna
ma-
Kal
amet
iya
Den
se
Mod
erat
e M
oder
ate
Mod
erat
e
5.4
Kun
ukal
liya
lago
on
Non
e
In
dust
rial
5.
5 Ti
llaw
ataw
ana
N
one
5.6
Kah
anda
mod
ara
Den
se
5.7
Rek
awa
Frin
ge
Mod
erat
e M
oder
ate
M
oder
ate
Mod
erat
e
5.8
Maw
ella
Pa
tchy
Mod
erat
e D
ense
5.9
Don
dra
Few
M
oder
ate
5.
10 G
aran
duw
a
Frin
ge
Mod
erat
e M
oder
ate
Mod
erat
e
Sout
hwes
tern
Coa
st
Man
grov
es
Salt
mar
sh
Mud
flats
R
ice
padd
yO
ther
cro
psSa
lt pa
nsU
rban
dev
. Se
ttlem
ents
A
ncho
rage
A
quac
ultu
re
6.1
Kog
gala
D
ense
Ex
tens
ive
Ex
tens
ive
6.2
Rat
gam
a L
ake
Frin
ge
M
oder
ate
Mod
erat
e
6.3
Hik
kadu
wa
Gan
ga
Few
Mod
erat
e
M
oder
ate
6.
4 Te
lwat
te G
anga
Pa
tchy
Mod
erat
e
M
oder
ate
6.
4 M
adam
pa L
ake
Den
se
M
oder
ate
Mod
erat
e
6.5
Mad
u G
anga
D
ense
Exte
nsiv
e
M
oder
ate
6.
6 K
osgo
da
Frin
ge
6.7
Silli
ya G
anga
Fe
w
6.8
Ingi
rili G
anga
Fe
w

112
Wes
tern
Coa
stM
angr
oves
Salt
mar
sh
Mud
flats
R
ice
padd
yO
ther
cro
psSa
lt pa
nsU
rban
dev
. Se
ttlem
ents
A
ncho
rage
A
quac
ultu
re
7.1
Bol
goda
Lak
e Sc
atte
red
In
tens
ive
Den
se
7.
2 Lu
naw
a La
goon
N
one
In
tens
ive
Den
se
7.
3 N
egom
bo L
agoo
n D
ense
Inte
nsiv
e D
ense
M
arin
e cr
aft
Cag
eN
orth
wes
tern
Coa
st
Man
grov
es
Salt
mar
sh
Mud
flats
R
ice
padd
yO
ther
cro
psSa
lt pa
nsU
rban
dev
. Se
ttlem
ents
A
ncho
rage
A
quac
ultu
re
8.1
Gem
bara
ndiy
a
Den
se
In
tens
ive
Mod
erat
e
Pond
8.2
Chi
law
D
ense
Mar
ine
craf
t Po
nd8.
3 M
uthu
pant
hiya
D
ense
Po
nd8.
4 M
unde
l Lak
e
Patc
hy
Mod
erat
e
Exte
nsiv
e Ex
tens
ive
Dom
estic
Pond
8.5
Thal
awila
Oda
i Fi
ve
Pond
8.6
Kan
daku
liya
N
one
M
arin
e cr
aft
8.
7 Pu
ttala
m
Den
se
Exte
nsiv
e Ex
tens
ive
Mod
erat
e Ex
tens
ive
Indu
stria
l In
tens
ive
Po
nd8.
8 Va
nkal
ai K
alap
uwa
Fr
inge
Ex
tens
ive
Exte
nsiv
e
8.9
Periy
a K
alap
uwa
(NW
) Fr
inge
Ex
tens
ive
Exte
nsiv
e
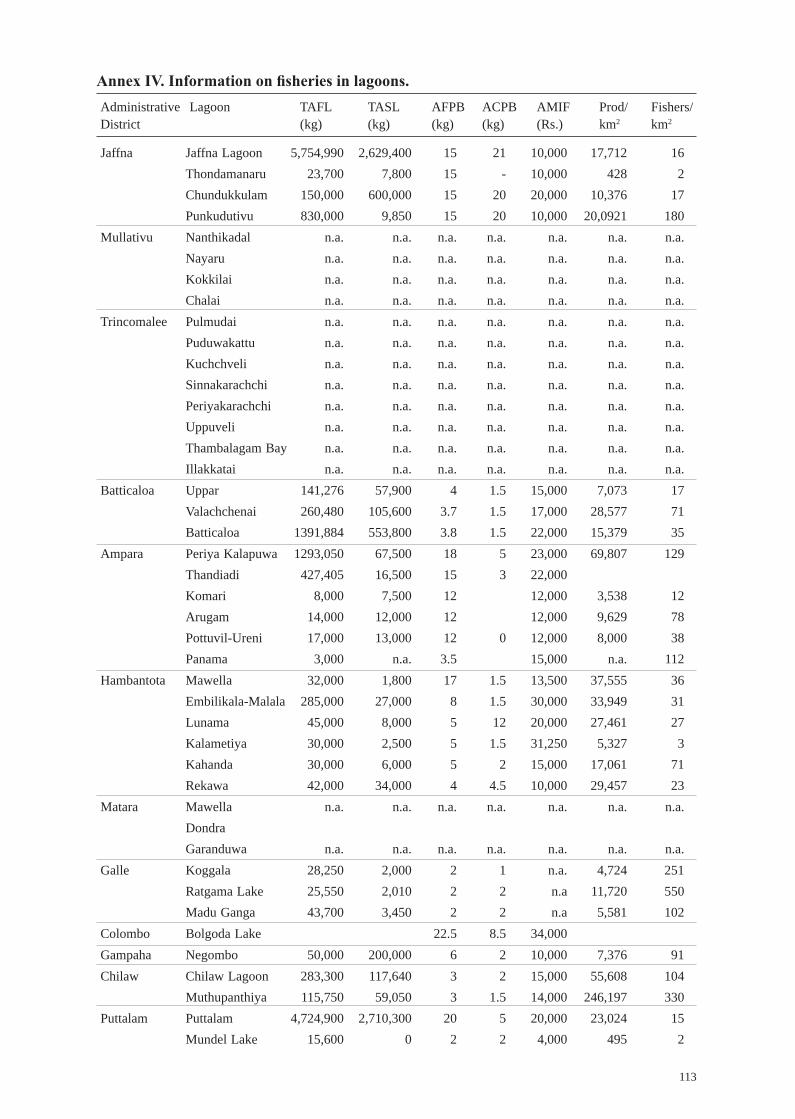
113
Administrative Lagoon TAFL TASL AFPB ACPB AMIF Prod/ Fishers/ District (kg) (kg) (kg) (kg) (Rs.) km2 km2
Jaffna Jaffna Lagoon 5,754,990 2,629,400 15 21 10,000 17,712 16Thondamanaru 23,700 7,800 15 - 10,000 428 2Chundukkulam 150,000 600,000 15 20 20,000 10,376 17Punkudutivu 830,000 9,850 15 20 10,000 20,0921 180
Mullativu Nanthikadal n.a. n.a. n.a. n.a. n.a. n.a. n.a.Nayaru n.a. n.a. n.a. n.a. n.a. n.a. n.a.Kokkilai n.a. n.a. n.a. n.a. n.a. n.a. n.a.Chalai n.a. n.a. n.a. n.a. n.a. n.a. n.a.
Trincomalee Pulmudai n.a. n.a. n.a. n.a. n.a. n.a. n.a.Puduwakattu n.a. n.a. n.a. n.a. n.a. n.a. n.a.Kuchchveli n.a. n.a. n.a. n.a. n.a. n.a. n.a.Sinnakarachchi n.a. n.a. n.a. n.a. n.a. n.a. n.a.Periyakarachchi n.a. n.a. n.a. n.a. n.a. n.a. n.a.Uppuveli n.a. n.a. n.a. n.a. n.a. n.a. n.a.Thambalagam Bay n.a. n.a. n.a. n.a. n.a. n.a. n.a.Illakkatai n.a. n.a. n.a. n.a. n.a. n.a. n.a.
Batticaloa Uppar 141,276 57,900 4 1.5 15,000 7,073 17Valachchenai 260,480 105,600 3.7 1.5 17,000 28,577 71Batticaloa 1391,884 553,800 3.8 1.5 22,000 15,379 35
Ampara Periya Kalapuwa 1293,050 67,500 18 5 23,000 69,807 129Thandiadi 427,405 16,500 15 3 22,000 Komari 8,000 7,500 12 12,000 3,538 12Arugam 14,000 12,000 12 12,000 9,629 78Pottuvil-Ureni 17,000 13,000 12 0 12,000 8,000 38Panama 3,000 n.a. 3.5 15,000 n.a. 112
Hambantota Mawella 32,000 1,800 17 1.5 13,500 37,555 36Embilikala-Malala 285,000 27,000 8 1.5 30,000 33,949 31Lunama 45,000 8,000 5 12 20,000 27,461 27Kalametiya 30,000 2,500 5 1.5 31,250 5,327 3Kahanda 30,000 6,000 5 2 15,000 17,061 71Rekawa 42,000 34,000 4 4.5 10,000 29,457 23
Matara Mawella n.a. n.a. n.a. n.a. n.a. n.a. n.a.Dondra Garanduwa n.a. n.a. n.a. n.a. n.a. n.a. n.a.
Galle Koggala 28,250 2,000 2 1 n.a. 4,724 251Ratgama Lake 25,550 2,010 2 2 n.a 11,720 550Madu Ganga 43,700 3,450 2 2 n.a 5,581 102
Colombo Bolgoda Lake 22.5 8.5 34,000Gampaha Negombo 50,000 200,000 6 2 10,000 7,376 91Chilaw Chilaw Lagoon 283,300 117,640 3 2 15,000 55,608 104
Muthupanthiya 115,750 59,050 3 1.5 14,000 246,197 330Puttalam Puttalam 4,724,900 2,710,300 20 5 20,000 23,024 15
Mundel Lake 15,600 0 2 2 4,000 495 2

114
Mannar Periya Kalapuwa 437,750 - 50 - 25,000 134,983 46Vankalai 870,816 - 50 - 15,000 296,801 47
Note 1:
Note 2:

115
Annex V. M isuse of lagoons and threats.Intervention Activity Description Threats Some examples
Vulnerability Intensive use Poor and vulnerable Intensive use of Rekawa andand poverty of resources people fishing more resources; use of Nanthikadal lagoons,
intensively to attain destructive gear and some areas oflivelihood goals (e.g., monofilament Jaffna and Batticaloa
nets) lagoonsPopulation and Intensive Too many fishers and Overcapacity Negombo andfishing pressure fishing too many crafts Chilaw lagoonsDevelopment Land-based Chemicals in Loss of fish and Many lagoons in the
activities: agricultural runoff shrimp Southern ProvinceAgriculture (e.g., Rekawa);
Batticaloa LagoonLand-based Unplanned shrimp Loss of lagoon Chilaw, activities: farms in the area productivity Muthupanthia andUnplanned and Puttalam lagoonsillegal and Mundel LakeaquacultureIndustries Industries releasing Decline in lagoon Valachchenai
effluent causing productivity Lagoon water pollution Bolgoda Lake
Tourism industry Movement of sea Decline in lagoon Negombo, Arugamplanes productivity and Mawellal
lagoonsUrbanization and Dumping garbage into Destruction of Chilaw, Valachchenaidisposal of waste lagoons (lagoons acting mangroves and and Lunawa lagoons,
as sinks) declining lagoon and Bolgoda Lakeproductivity; decline in nonuse values
Pollution Fecal and oil pollution Decline in lagoon Negombo, Puttalamproductivity and Lunawa lagoons
Road building Separation of lagoons Decline in lagoon Jaffna, Nanthikadalby roads and productivity and in Thondamanaru, andcauseways, disturbing shrimp catches Rekawa lagoonswater exchange
Development Converting lagoons Decline in lagoon Jaffna, of saltern into salterns productivity and Periyakarachchi,
in fish and shrimp Bundala, catches; loss of Koholankala, Maharecreational values Lewaya,
Kunukalliya, Puttalam, Mundel
Meeting the Construction of Loss of productivity Uppu Aru Lagoon,demand for barrages across (fish and shrimp) (Ariyal Barragefreshwater lagoons present at Navanth
Kuli Bridge) Destruction of Illegal felling Felling of mangroves Loss of mangroves Negombo, Rekawamangroves for agriculture, brush- and fish-breeding Batticaloa, and
pile fisheries and sites; Puttalam lagoons, construction decline in fish and etc.
shrimp catches

116
Artificial Artificially Artificially dredged Decline in lagoon Rekawa Lagoonopenings to dredging and pathways into the sea; productivity and in Gembaradiya the sea breaching artificial breaching shrimp catches Kalapuwa,
lagoon-mouth of sand bar Talkawila Odai,area Kanda kuliya,
Embilikala-Malala lagoons, etc.
Multi-stakeholder Diverse Each stakeholder group Conflicts among Negombo, Chilaw,issues stakeholder generating negative stakeholder groups Periya Kalapuwa
groups exploiting externalities on the (Ampara), etc.coastal resources other
Invasive species Spreading of Extensive growth of Decline in lagoon Uppar Panichankerniinvasive fish and Tilapia and Sea Bass; productivity and in Lagoon plant species spreading of japan fish and shrimp Batticaloa Lagoon
jabara (water hyacinth), catches Lunama Lagoonsalvinia (Salvinia Kalametiya Lagoonmolesta) and Hambu Embilikala-Malala
LagoonMawella Lagoon
Loss of lagoon Filling of Siltation/sedimentation Decline in Batticalo, area lagoons and filling of lagoons productivity Valachchenai
Lunama, Kalametiya, Chilaw, Muthpanthiya lagoons
Land-filling Land-filling by people Loss of lagoon area Negombo Lagoonfor construction of houses and other structures
Security zones Demarcating Inability to exploit Loss of income- Nanthikadal areas as high- resources earning opportunities (including Chalai),security zones for people and Nayaru lagoons


Contact Information
Dr. Herath ManthrithilakeHead, Sri Lanka Development Initiative
International Water Management Institute127 Sunil Mawatha
Pelawatta, BattaramullaSri Lanka
Telephone: +94-11 2880000E-mail: [email protected]
Website: www.iwmi.orgISBN 978-92-9090-778-7